Article

Research on Cognition and Adaptation to Climate Risks among Inland Northwest Chinese Residents

by
Rui Yang
,
Wei Liang
*,
Peiyu Qin
,
Buerlan Anikejiang
,
Jingwen Ma
and
Sabahat Baratjan
School of Public Administration, Northwest University, Xi’an 710127, China
*
Author to whom correspondence should be addressed.
Sustainability 2024, 16(13), 5775; https://doi.org/10.3390/su16135775
Submission received: 25 May 2024 / Revised: 26 June 2024 / Accepted: 3 July 2024 / Published: 6 July 2024
(This article belongs to the Special Issue Human Behavior, Psychology and Sustainable Well-Being)

Abstract

:
Global climate change poses a significant threat to the sustainable development of human society, highlighting the critical importance of developing effective adaptation strategies in response to climate-related disasters. Public awareness and adaptive behaviors towards climate risks serve as crucial indicators of community concerns regarding climate change, laying the foundation for effective adaptation strategy design. For this study, we selected inland northwest Chinese residents, represented by Xi’an City, as the research subjects, to investigate their climate risk cognition and adaptation levels. Based on randomly sampled survey data, descriptive statistical analysis and multiple logistic regression models were used to study the public’s climate change awareness, climate risk sensitivity, and climate risk adaptability, as well as evaluation of climate risk adaptation measures in the public sector, and we also analyzed the impact mechanisms of factors such as gender, age, income, and education level on the related indicators. The study found that with the increasing urban heat island effect, residents of Xi’an are more likely to reach a higher level of belief in climate change regarding long-lasting weather events. However, there is still no collective consensus on the reasons for climate change. Residents are overly optimistic about the future impact of climate disasters, and there is high uncertainty in their ability to adapt to climate change risks. Additionally, specific demands were obtained from different groups of urban residents regarding measures in the public sector for climate risk adaptation.

1. Introduction

The world is currently undergoing climate change, predominantly characterized by warming. According to the World Meteorological Organization (WMO) report on The State of the Global Climate 2021 in Geneva, key climate change indicators, such as greenhouse gas concentrations, rising sea levels, ocean heating, and ocean acidification, made new records in 2021. This was further compounded by the combined impacts of conflicts, extreme weather events, economic shocks, and the ongoing COVID-19 pandemic [1]. In 2021, the global average temperature exceeded pre-industrial levels by 1.11 °C (based on the average from 1850 to 1900), marking it as one of the seven warmest years on record [2]. The IPCC warns about the exponential growth in direct economic losses caused by extreme weather and climate events. These impacts on human societies, economies, and ecosystems have become increasingly severe [3]. Within the context of global warming, China has been experiencing a noticeable increase in extreme weather phenomena. From 1951 to 2021, China’s regional average surface temperature has risen by 0.26 °C per decade [2], surpassing the global average increase of 0.15 °C per decade. This highlights China’s vulnerability to climate change within the global warming context. Climate-related disasters have significantly challenged the sustainable development of human society, emphasizing the critical need for swift actions in response to climate risks.
The United Nations Framework Convention on Climate Change (UNFCCC) underscores two fundamental strategies for addressing climate change: mitigation and adaptation. Given the challenge of reversing climate change caused by carbon emissions in the short term, there exists a significant time lag in the effects of mitigation policies. Additionally, the ongoing debate surrounding emission reduction obligations among countries and the lack of a fully established global mitigation mechanism further complicates the situation. In light of these complexities, the global climate change discourse is increasingly emphasizing the importance of adaptation. Building resilience has emerged as a crucial priority, shifting the focus towards proactive adaptive measures to tackle the challenges posed by climate change. Effective adaptation efforts require the active involvement of various stakeholders, such as central and local governments, businesses, communities, and the general public. Public participation plays a crucial role in regional adaptation efforts.
The concept of adaptation, rooted in ecology, refers to the capacity to adjust to various environmental conditions by making suitable modifications to ensure the survival and sustainability of a population [4]. In the realm of environmental psychology, the interaction between individual behavior and the surrounding environment is viewed as an exchange of information [5]. In situations characterized by incomplete information and uncertainty, people take action regarding hazards based on their personal cognition and perception of risk rather than based on some objectively and scientifically derived measure of threat [6,7]. Cognition, shaped by perception, involves the recognition and comprehension of one’s environment [8]. Risk cognition is individualized and influenced by factors such as exposure to risk, information gathering, personal experiences, knowledge, education, and socio-economic variables, including socio-cultural aspects [9]. The public cognition of climate change risks forms the foundation for engagement in climate change adaptation efforts [10]. In communities with heightened risk perception, residents are more inclined to respond to climate information and engage in proactive adaptive actions [11]. Enhancing the scientific precision and accuracy of public cognition regarding climate change risks is crucial for mobilizing the adaptation capacities of individuals and fostering collective resilience to climate change impacts, which has gradually become a hot topic in sociology, politics, management, and other fields, in internationally. One research direction is to carry out empirical investigation and analysis on the local public’s climate risk perception/cognition and adaptation, which forms the basis for designing effective adaptation strategies. Currently, public studies on climate change adaptation have been conducted in the following areas: China (Peng et al., 2012; Cui et al., 2014; Xie et al., 2014; Du et al., 2015; Yu, 2016) [12,13,14,15,16], Bangladesh (Brouwer et al., 2007; Alam et al., 2017) [17,18], Pakistan (Abid et al., 2016; Ali and Erenstein, 2017) [19,20], Nepal (Gentle and Maraseni, 2012) [21], Viet Nam (Dang et al., 2014) [22], and Sri Lanka (Esham and Garforth, 2013) [23] in Asia; the United States (Arbuckle et al., 2013) [24] and Canada (Philippenko et al., 2021) [25] in North America; Mexico (Frank et al., 2011) [26], Brazil (Soito and Freitas, 2011; Wamsler et al., 2012; Lemos et al., 2016) [27,28,29], Argentina (Barros et al., 2015) [30], and Bolivia (McDowell and Hess, 2012) [31] in South America; Ethiopia (Bryan et al., 2009; Deressa et al., 2009, 2011) [32,33,34], South Africa (Thomas et al., 2007) [35], Tanzania (Paavola, 2008) [36], Mozambique (Patt and Schröter, 2008) [37], and Ghana (Fosu-Mensah et al., 2012) [38] in Africa; Europe (Reidsma et al., 2010; Reckien et al., 2013; Massey et al., 2014; Persson et al., 2020; Grafakos et al., 2020) [39,40,41,42,43]; and Australia (Wheeler et al., 2013) [44] and Tuvalu (Mortreux and Barnett, 2009) [45] in Oceania. The findings of the research indicate the following conclusions. Firstly, variables such as age, wealth, education level, credit history, land ownership, social identity, and other factors play significant roles in shaping public perceptions, cognitions, and adaptations to climate risk. The impact coefficients of these variables on adaptation exhibit regional variations. Secondly, individuals who attribute climate change to human activities tend to engage in more proactive adaptation measures. Thirdly, governmental initiatives are crucial in prioritizing urban climate change adaptation through the formulation of adaptation policies, establishment of resilient cities, and effective urban planning. In summary, the studies offer empirical insights into the assessment of public perception and cognition of climate risk and its relationship with susceptibility to risks. However, further research is needed, particularly in expanding geographical coverage and diversifying research samples. Studies in economically disadvantaged regions predominantly focus on analyzing farmers’ perceptions and adaptation behaviors towards climate change, lacking empirical research on urban residents, and research in economically developed regions primarily centers on policy investigations concerning urban adaptation construction, neglecting the involvement of the public in urban adaptation initiatives. Major cities in middle-income regions, due to limited municipal budgets and large population sizes, may face greater adaptive risks. Therefore, further expansion is urgently needed in terms of regional scope and research groups in related studies.
We consider the inclusion of inland northwest Chinese residents, represented by Xi’an City, as research subjects to investigate their climate risk cognition and adaptation levels to be a matter of significant importance. Firstly, in the context of global climate change, northwest China has shown an obvious and rapidly developing warming–wetting trend [46], but there is still a lack of empirical research on public climate adaptation levels in this area. Xi’an, chosen as the survey sample location, stands out as one of the most densely populated cities in northwest China, lending high representativeness to the study. Secondly, Xi’an, situated in a river valley basin, experiences relatively high concentrations of atmospheric aerosols. These aerosol particles have the ability to absorb and scatter solar short-wave and atmospheric long-wave radiation, leading to the formation of a thicker inversion layer over the city under unique topographical and meteorological conditions, hindering the dissipation of urban heat. As a result of rapid urbanization, the heat island effect in Xi’an has been escalating annually. This heightened urban heat island effect has exacerbated the meteorological disasters stemming from climate warming, posing complex challenges in climate risk management in the inland regions. Thirdly, influenced by economic development, infrastructure expansion, financial resources, and other factors, the public cognition and adaptation strategies in northwest China may differ from those in highly developed eastern coastal cities. Drawing from random sampling survey data collected from 719 urban residents in Xi’an, this research initially employed descriptive statistical analysis to characterize the climate risk cognition and adaptation levels of Xi’an residents. Subsequently, logistics regression models were used to investigate the factors and mechanisms impacting the residents’ risk cognition and adaptation levels. These findings aim to assist the government in effectively formulating climate change policies and adaptation strategies.

2. Data Sources and Technical Methods

2.1. Data Sources

The research was conducted between July and October 2023, involving a street-based random face-to-face survey of residents across 13 administrative districts (counties) in Xi’an. A total of 756 questionnaires were collected, with 719 deemed valid after statistical analysis. The questionnaire’s reliability was assessed using Cronbach’s alpha coefficient, yielding a value of 0.898, indicating strong internal consistency. Construct validity was evaluated through exploratory factor analysis (EFA), resulting in a Kaiser–Meyer–Olkin (KMO) value of 0.894 and a significant Bartlett’s test of sphericity with a p-value less than 0.05, confirming the questionnaire’s suitability for EFA. The cumulative variance explanation rate of the questionnaire exceeded 60%, demonstrating good consistency between items and factors, with all factor loading coefficients surpassing 0.5. These outcomes suggest that the questionnaire’s questions and dimensional structure exhibited high reliability. The demographic characteristics of the respondents are detailed in Table 1.

2.2. Variable Selection

This research aimed to investigate the correlation between group characteristics and the climate change risk cognition and adaptation of residents in Xi’an, focusing on four aspects, climate change perception, climate risk sensitivity, adaptation, and the evaluation of adaptation measures in the public sector, as shown in Table 2. The dependent variables focus on the public’s level of climate risk cognition and adaptation, which are defined and described in detail in Table 2. The independent variables encompass group characteristics that are defined and described in detail in Table 3.

2.3. Research Methodology

This research combined descriptive statistical analysis with logistic regression models. Initially, descriptive statistical analysis was employed to examine the factual characteristics. Subsequently, logistic regression models were developed to investigate how group characteristics influence climate risk cognition and adaptation.
Given the nature of the dependent variables, the binomial logistic model is structured as follows:
log   i t P = l n P 1 P = β 0 + β 1 x 1 + + β m x m = β 0 + β T X
If y is the ordered k categorical dependent variable, an ordinal logistic model is built in the form:
log   i t P y j X = l n P y j X 1 P y j X = α j + β T X ( j = 1,2 , , k )
If y is the unordered k categorical dependent variable, and y = 0 is the reference group, a multinomial logistics regression model is built in the form:
l o g   i t P y = j X = l n P y = j X P y = 0 X = α j + β T X ( j = 1,2 , , k 1 )

3. Results and Analysis

3.1. Characterization of Facts

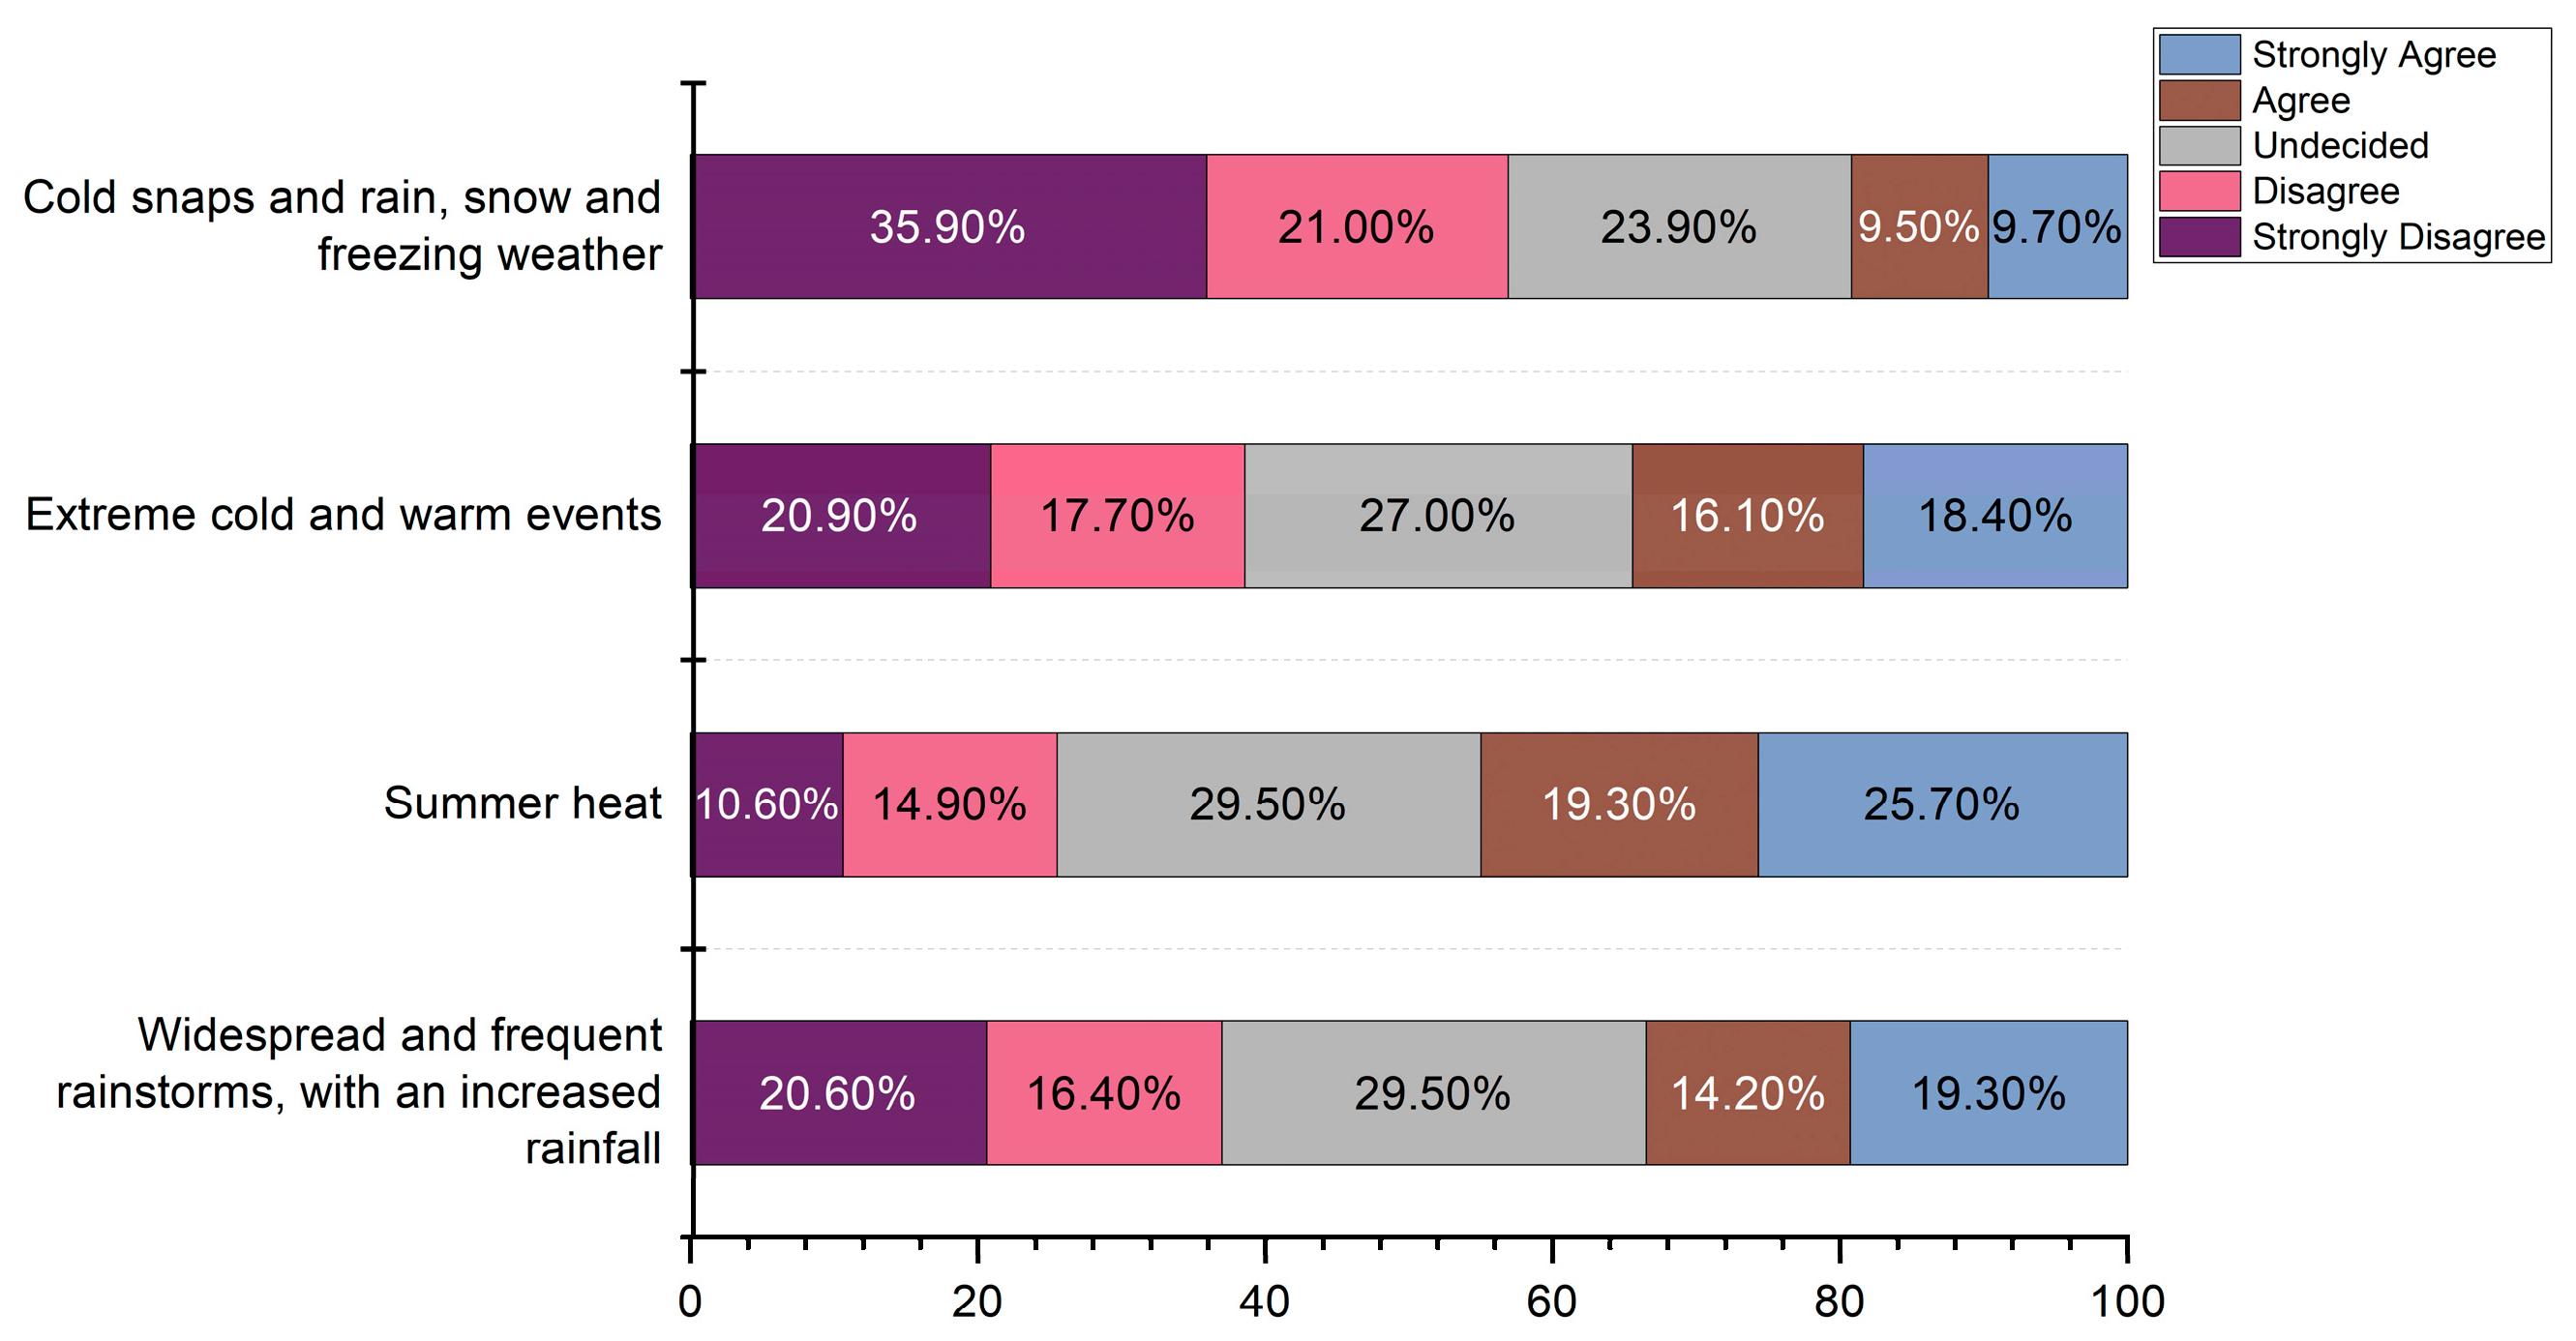
3.1.1. Climate Change Perception Analysis

Climate change perception encompasses an individual’s objective perceptions and assessments of climate change, which include beliefs about climate change and attributions related to it. On the other hand, climate change risk perception not only acknowledges the objective presence of climate change risks but also places significance on the subjective perceptions of individuals or groups in the process of perceiving these risks.
A strong belief in the local impacts of climate change is a prerequisite to decisions in favor of climate change adaptation (Blennow et al., 2020) [47]. As shown in Figure 1, the survey shows that respondents exhibited the strongest awareness regarding the “summer heat”, with 25.7% acknowledging the vividness of these feelings, a significantly higher percentage than for other major weather and climate events. Perceptions of “cold snaps and rain, snow and freezing weather” were the opposite. The climate change beliefs of Xi’an residents show distinctive characteristics. Firstly, there is a heightened recognition of weather events with prolonged durations, supported by meteorological data indicating that Xi’an experienced a 19-day continuous high-temperature spell in 2022, contrasting with regional cold waves lasting 2–3 days, emphasizing the perceived existential threat of prolonged climate-change-related events [48]. Secondly, residents show a greater awareness of weather events exhibiting heightened extremity, exemplified by Xi’an’s summer heat indices surpassing historical norms, resulting in residents perceiving the highest intensity of extreme summer heat events compared to other weather occurrences. Lastly, residents’ perceptions are influenced by media and social media coverage.
The survey results reveal that 48.7% of the population attribute climate change primarily to natural causes, whereas 40.1% attribute it to human activities, with 11.2% unsure of the causes. While it is unequivocal that human influence has warmed the atmosphere, ocean, and land [3], a significant portion of residents do not perceive human activities as the main driver of climate change. Approximately 10% of residents display apathy towards climate change, suggesting a cognitive bias towards attributing climate change extremes to natural causes. This cognitive stance impedes proactive resident engagement in climate change mitigation efforts.

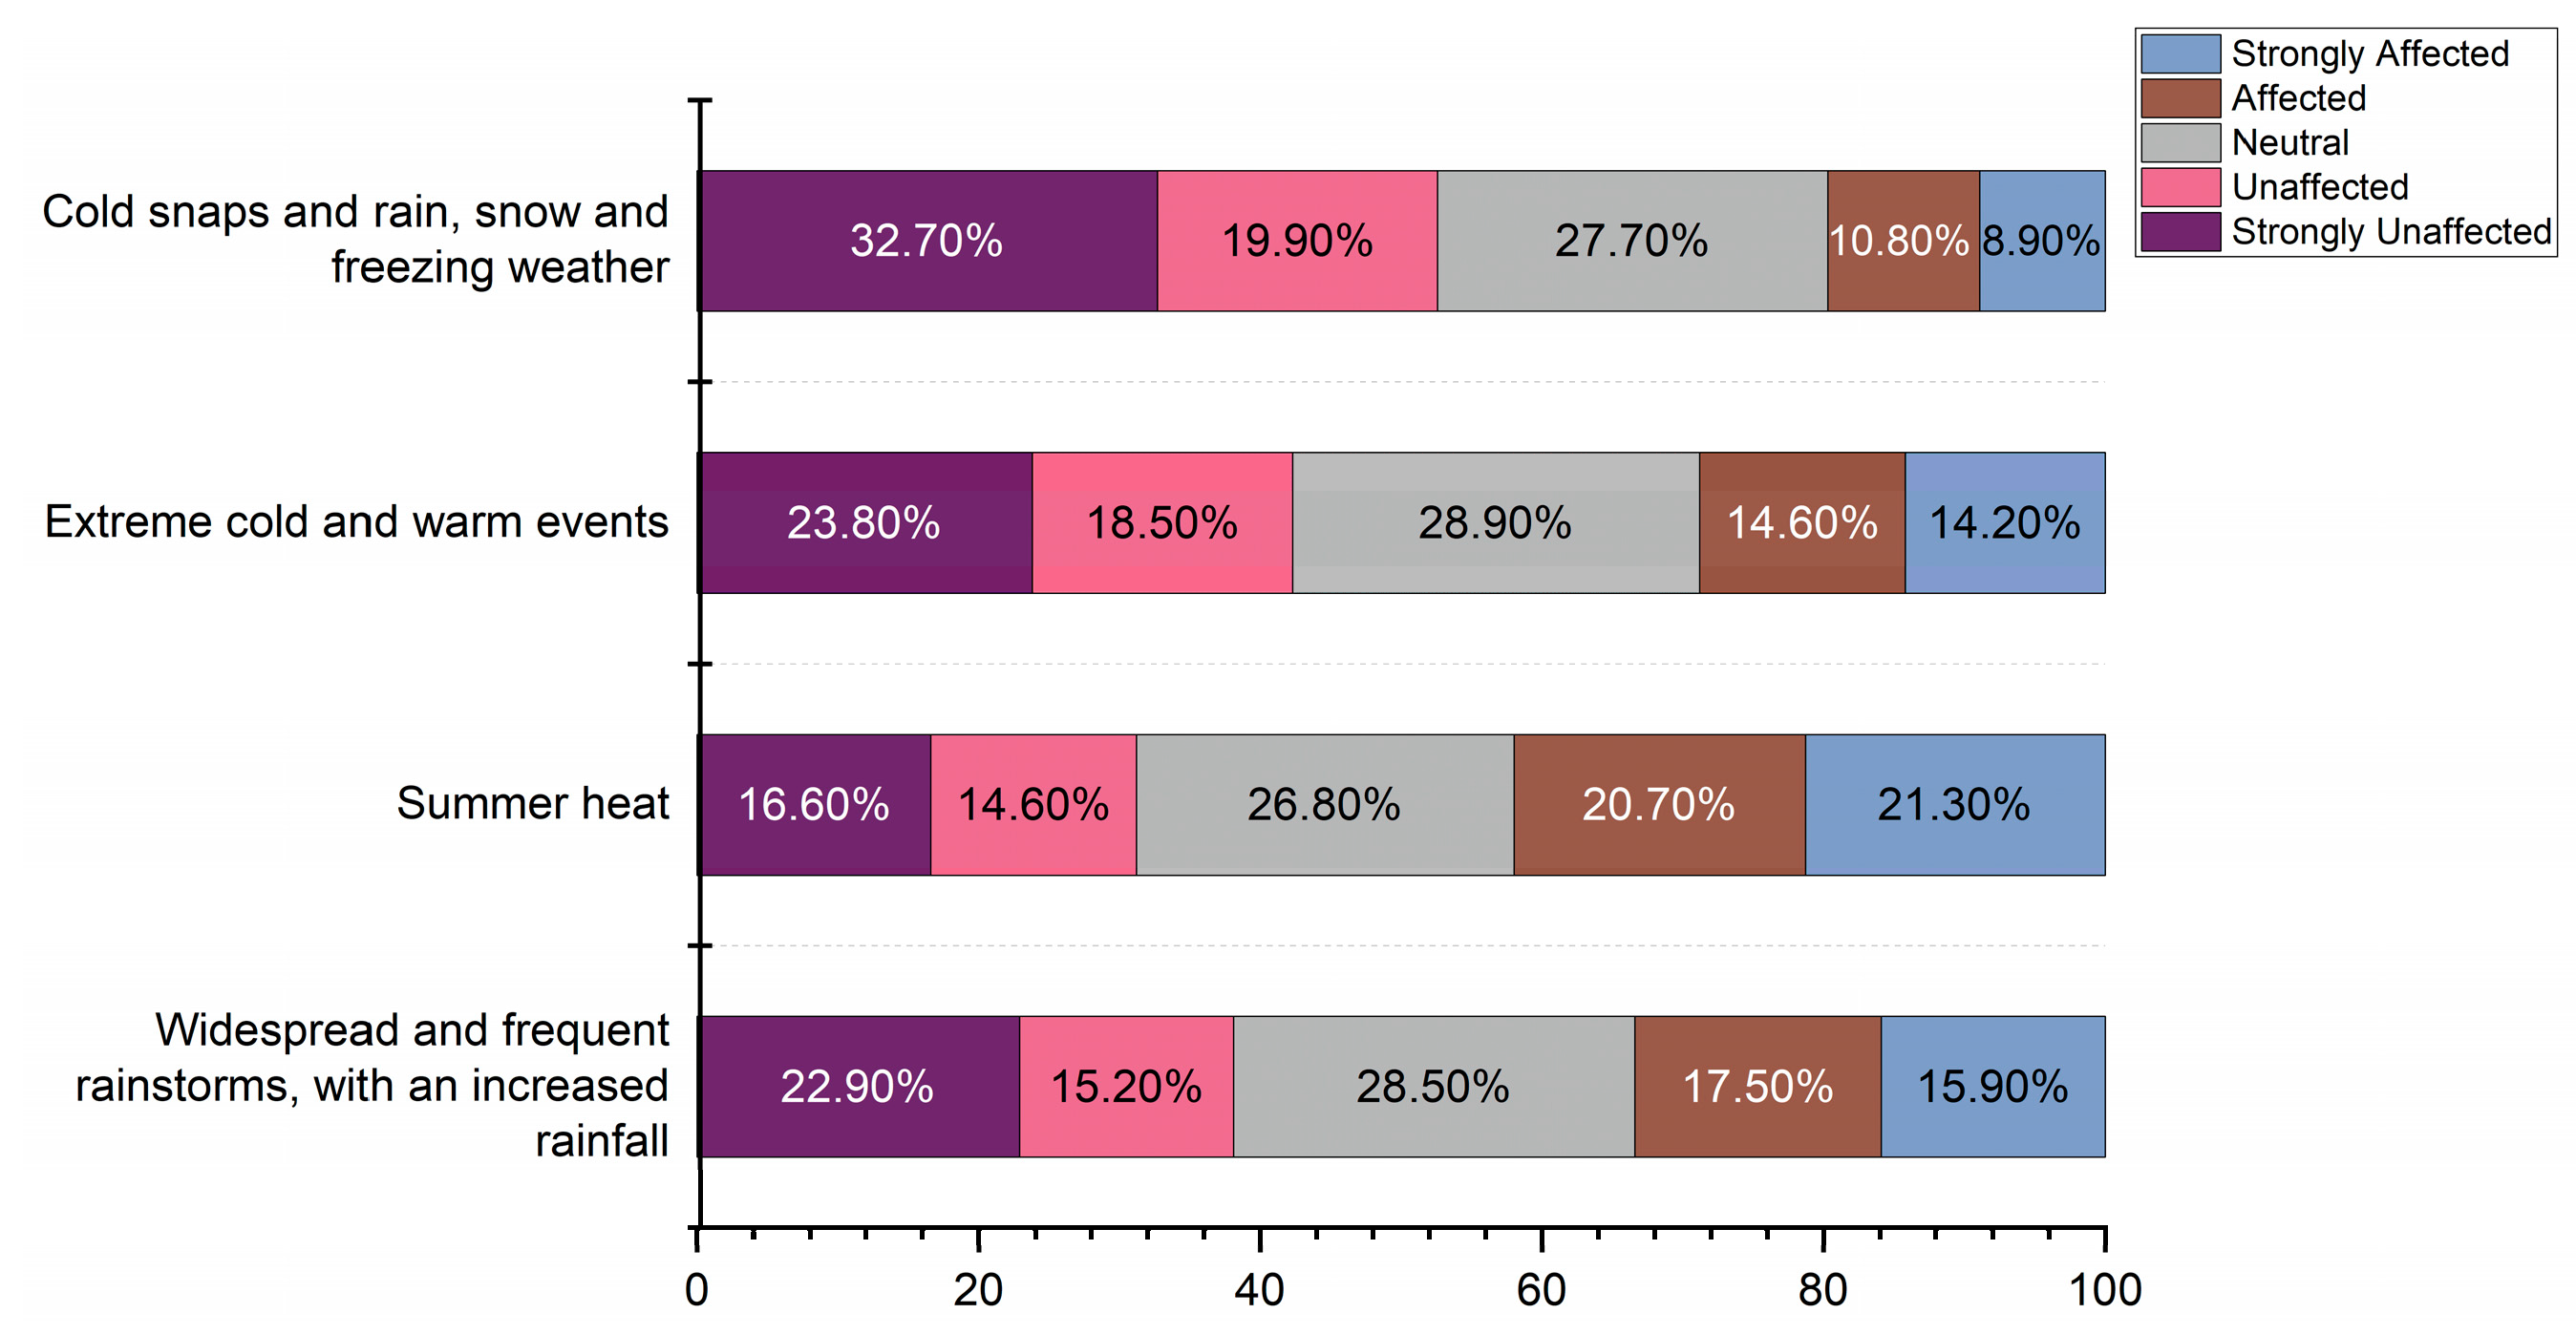
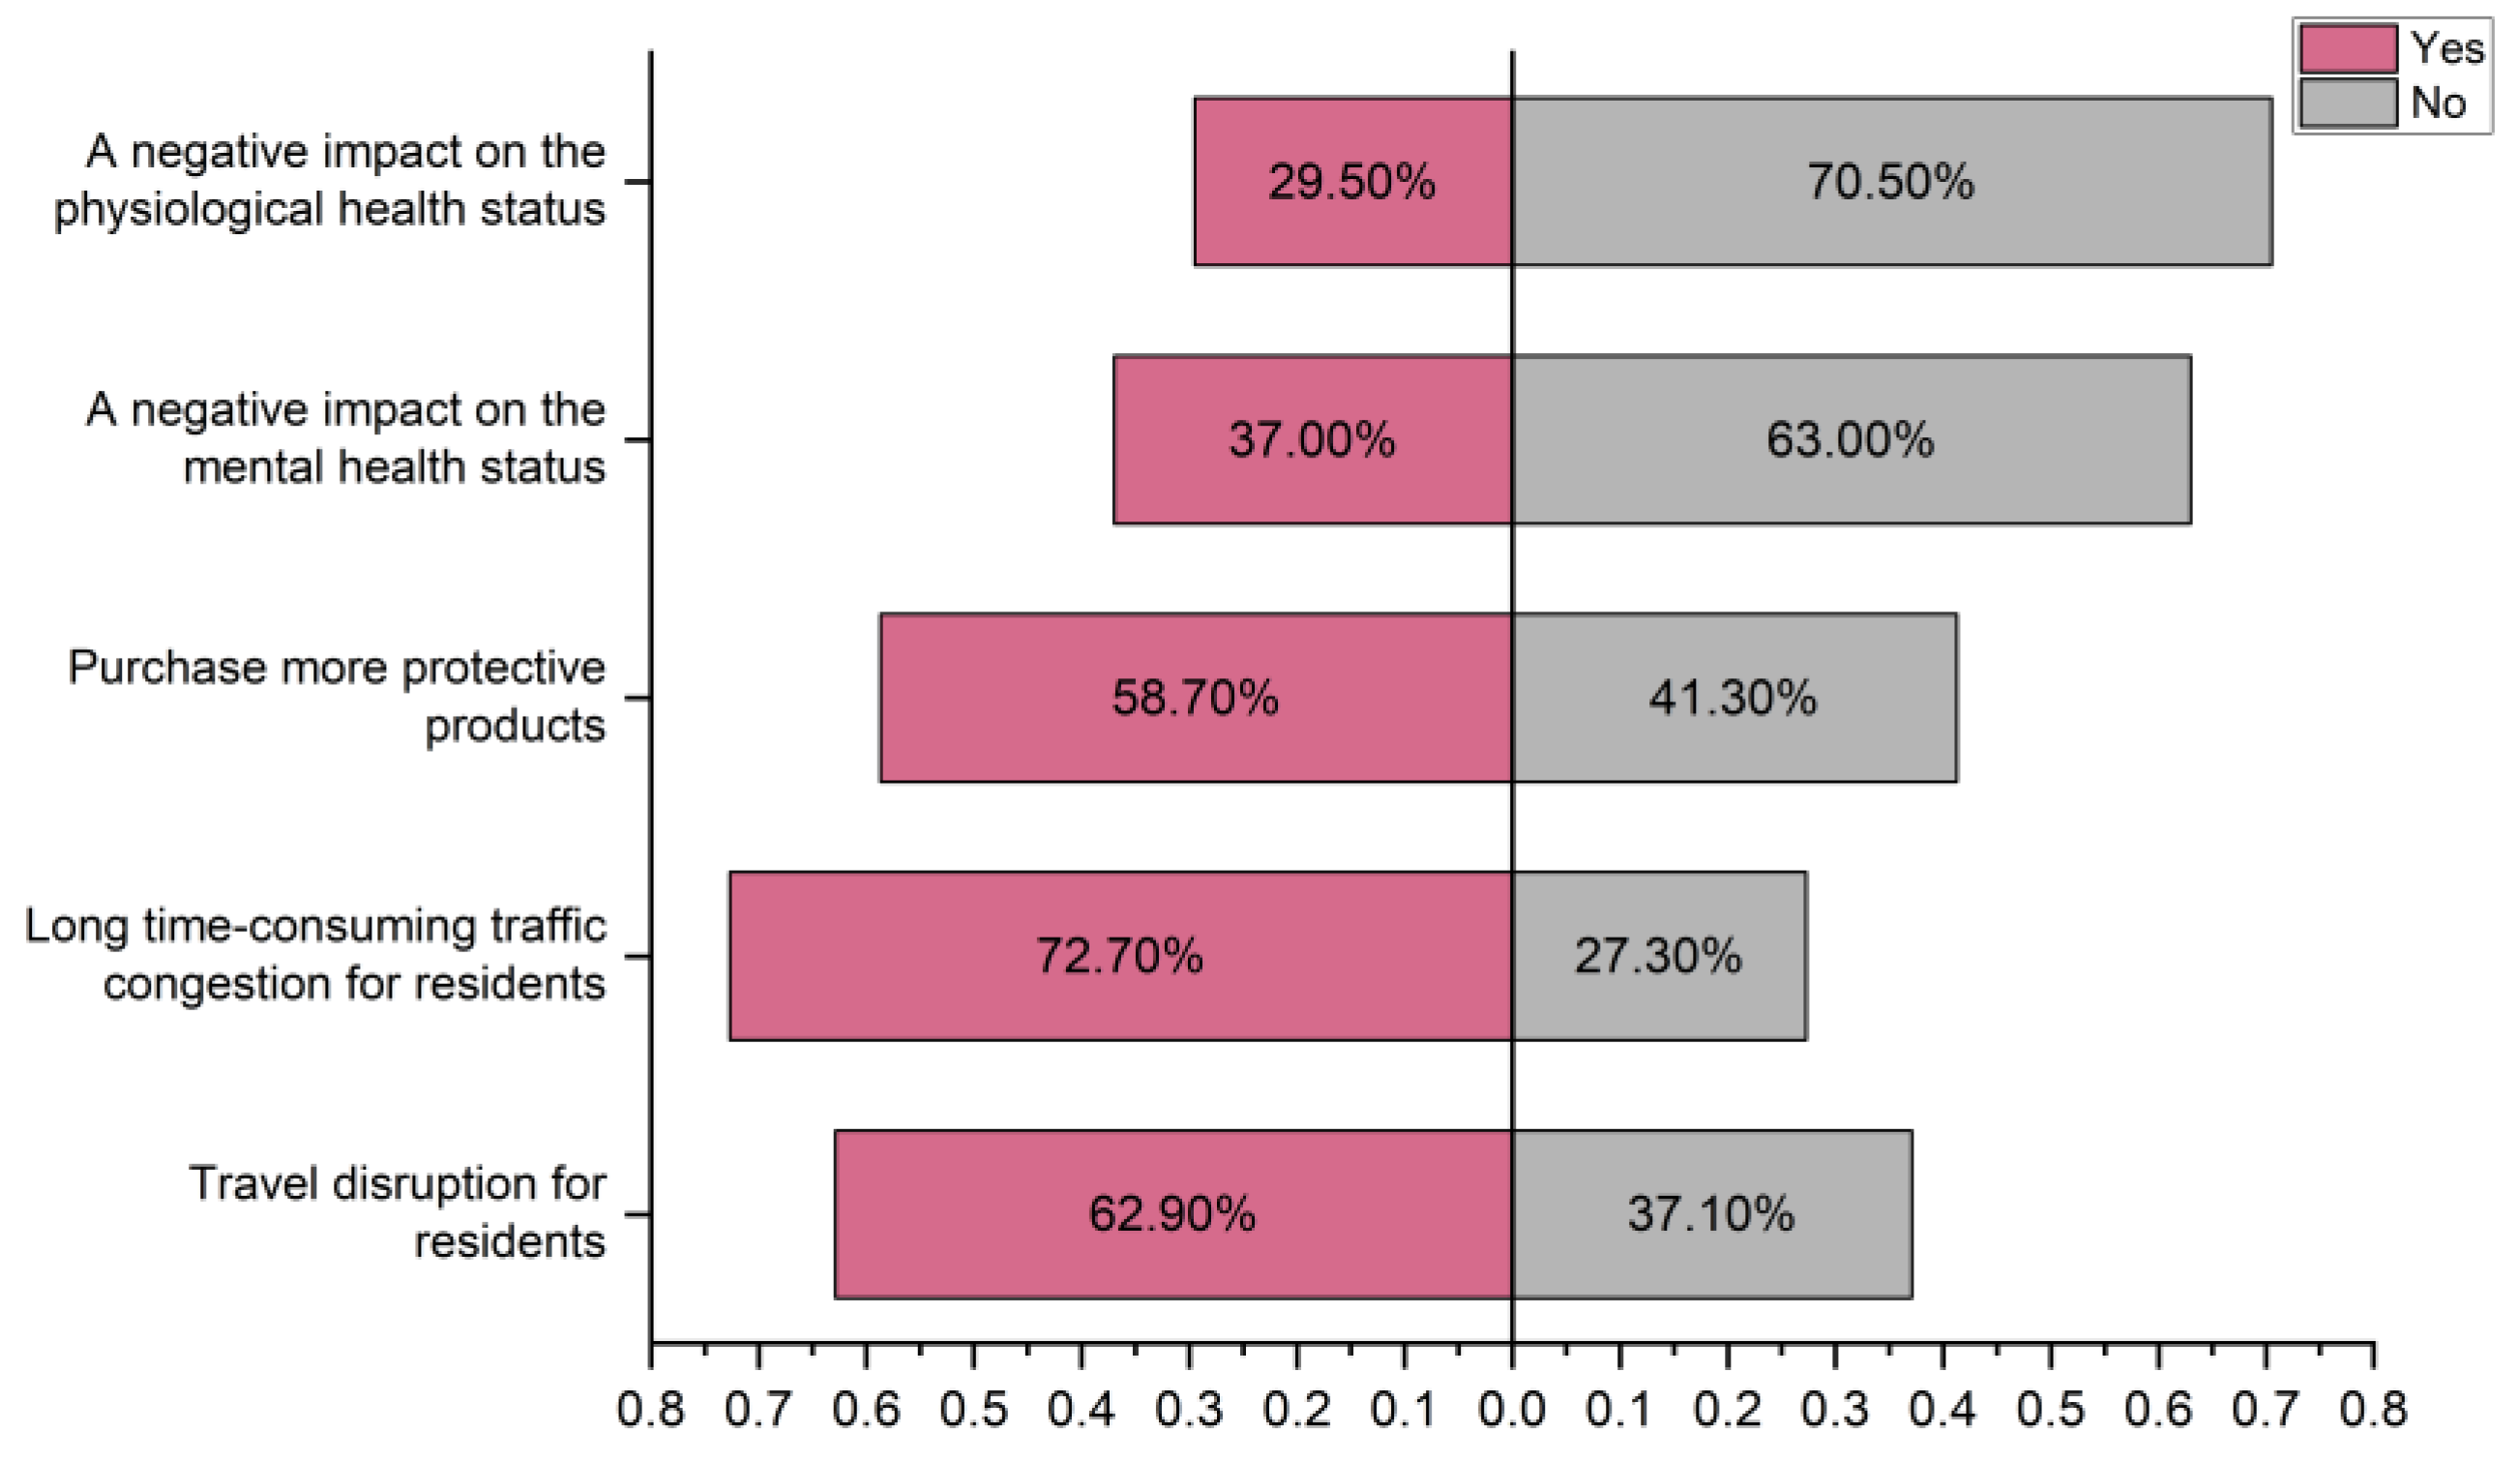
3.1.2. Climate Risk Sensitivity Analysis

Climate risk sensitivity pertains to the degree to which individuals or groups perceive and assess the impacts of climate-induced disasters, playing a crucial role in influencing their level of adaptation and corresponding needs.
As shown in Figure 2, respondents prioritize “summer heat” as the most significant climate-related disaster affecting their daily and occupational lives, while attributing lower significance to “cold snaps and rain, snow and freezing weather”. Street interviews further underscore residents’ belief that they can mitigate short-term acute weather risks by remaining indoors, resulting in minimal impact. Conversely, prolonged high-temperature events heighten residents’ risk exposure frequency and duration, reinforcing their susceptibility to longer-term climate-change-related events.
Regarding attitudes toward future climate change predictions, only 10.4% of respondents believe that climate change events might significantly impact their lives and work. The street interviews reflect an overall sense of excessive optimism among residents regarding the potential effects of future weather disasters, with the majority viewing such events as less detrimental. In the context of short-term extreme weather occurrences, individuals often opt to seek shelter at home, demonstrating reduced climate change concerns and anxiety.
An examination of the consequences of climate change on individuals’ daily lives and work, illustrated in Figure 3, reveals that 72.7% of respondents identify “long time-consuming traffic congestion for residents” as a result of extreme weather events, while 62.9% note disruptions in travel due to these events. Rainfall and flooding stemming from extreme weather in northwest China’s inland regions pose challenges to the normal operations of transportation hubs. Mental health emerges as more vulnerable than physical health, as highlighted in the IPCC AR6 reports. The reports emphasize the substantial impact of various climatic events on mental well-being, leading to a spectrum of potential mental health issues, including anxiety, depression, acute traumatic stress, PTSD, suicide risk, substance abuse, and sleep disturbances. Consequently, there is a pressing need to advance psychological theoretical research on climate change and explore strategies for psychological trauma recovery in the aftermath of climate-related disasters.

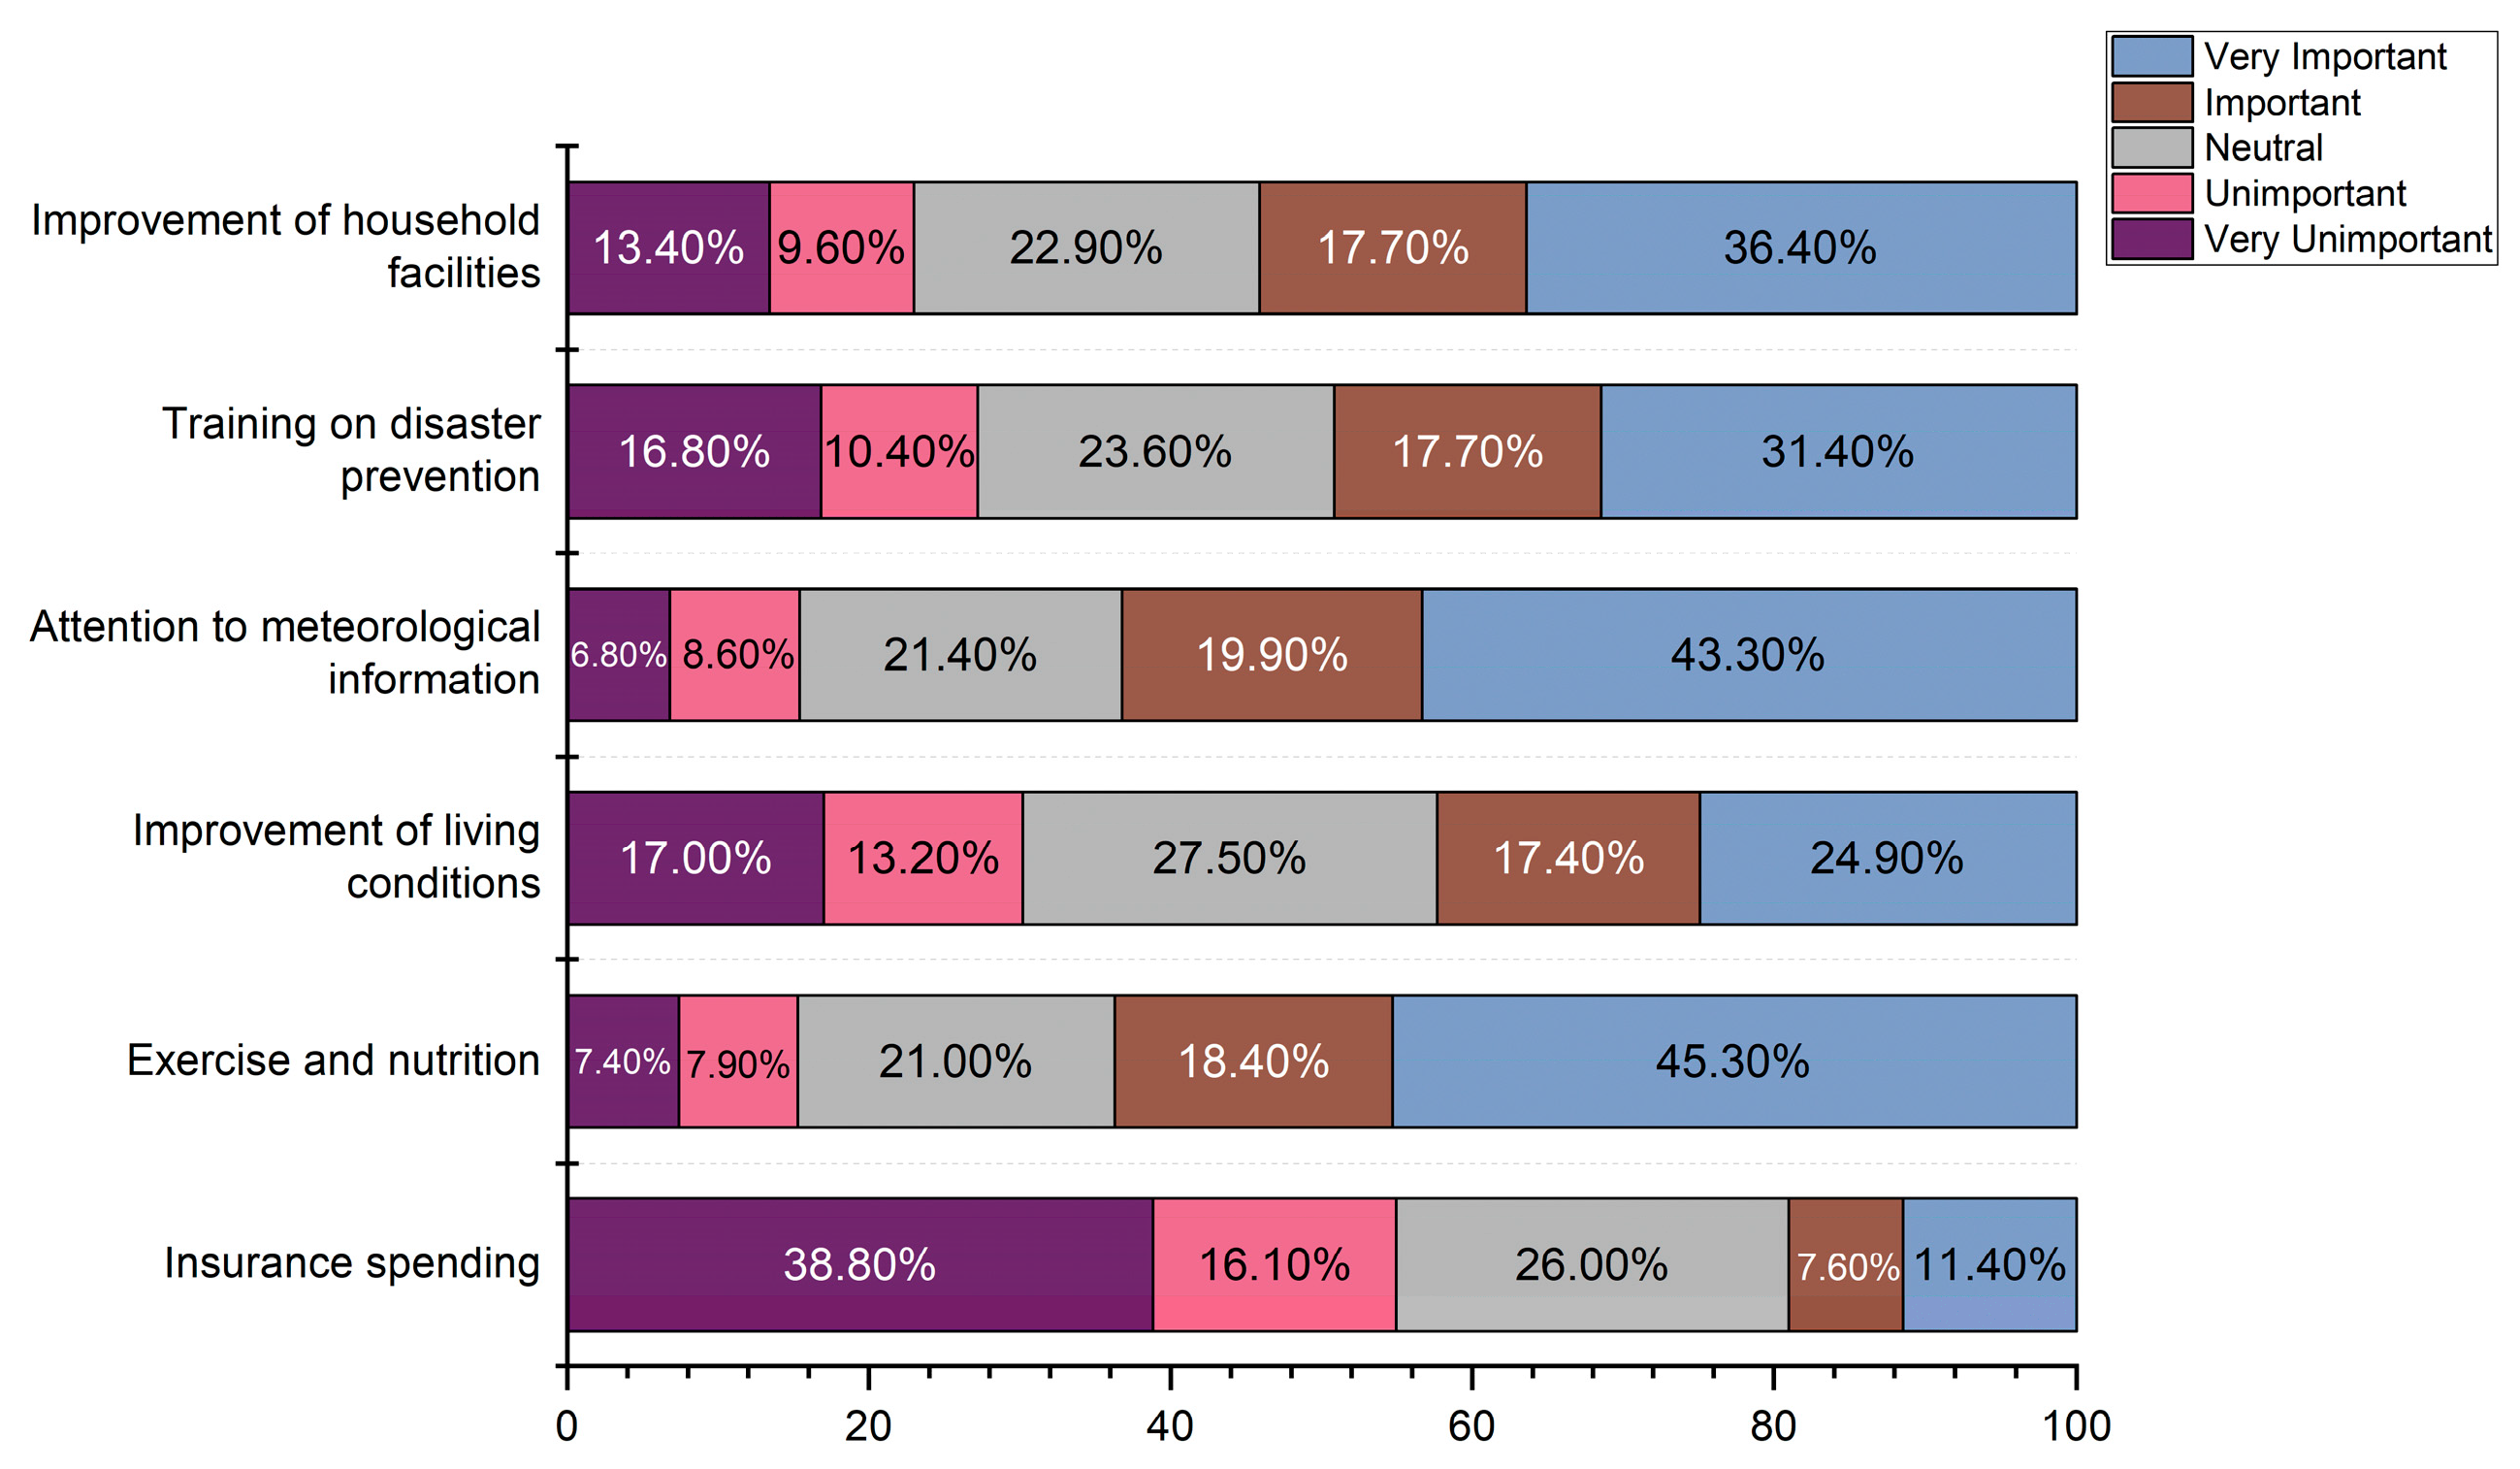
3.1.3. Climate Risk Adaptation Analysis

Climate change adaptation entails mitigating climate risks and vulnerabilities through the adjustment of current systems. The survey encompasses participants’ attitudes towards managing climate change risks, channels of knowledge acquisition, and evaluations of the significance of proactive adaptation measures.
Survey data with the aim of gauging the attitudes of individuals or groups towards climate change risks reveal that 40.2% of respondents believed that they could cope with increased risks, 21.0% expressed doubts about their coping abilities, and 38.8% reported uncertainty. The findings indicate a lack of confidence among nearly half of the respondents in their capacity to address climate change risks.
The individual adaptability to meteorological information media is intricately linked to the scientific understanding of climate change risks. Significantly differing perspectives exist between residents and experts regarding the cognition of climate change risk, posing challenges in effectively communicating scientific climate change information. Regarding the sources of meteorological information, the survey reveals that the internet has become the predominant medium for residents to access meteorological information and related knowledge, accounting for 90.7%, whereas television broadcasting has seen a decrease to 40.8%, highlighting a substantial variance. Although online information, particularly via self-media platforms, offers diverse sources and timely dissemination, it also presents challenges, such as verifying authenticity and potential exaggeration. To address this, the government should reinforce the promotion of authoritative meteorological information, leveraging the widespread reach of online networks to enhance the public awareness of extreme weather risks and climate disasters.
The cognitive importance of individual adaptation measures is fundamental to the adoption of adaptation behaviors. In Figure 4, survey respondents rated “attention to meteorological information” and “exercise and nutrition” as more vital, while deeming “insurance spending” less critical. This prioritization may stem from residents’ cognition that climate change poses less risk, leading them to prioritize adaptation measures that are less time- and cost-intensive. The reluctance towards “insurance spending” may be linked to a skepticism or lack of awareness about weather insurance. Hence, enhancing public awareness and understanding of weather insurance is crucial to improving societal cognitions in this area.

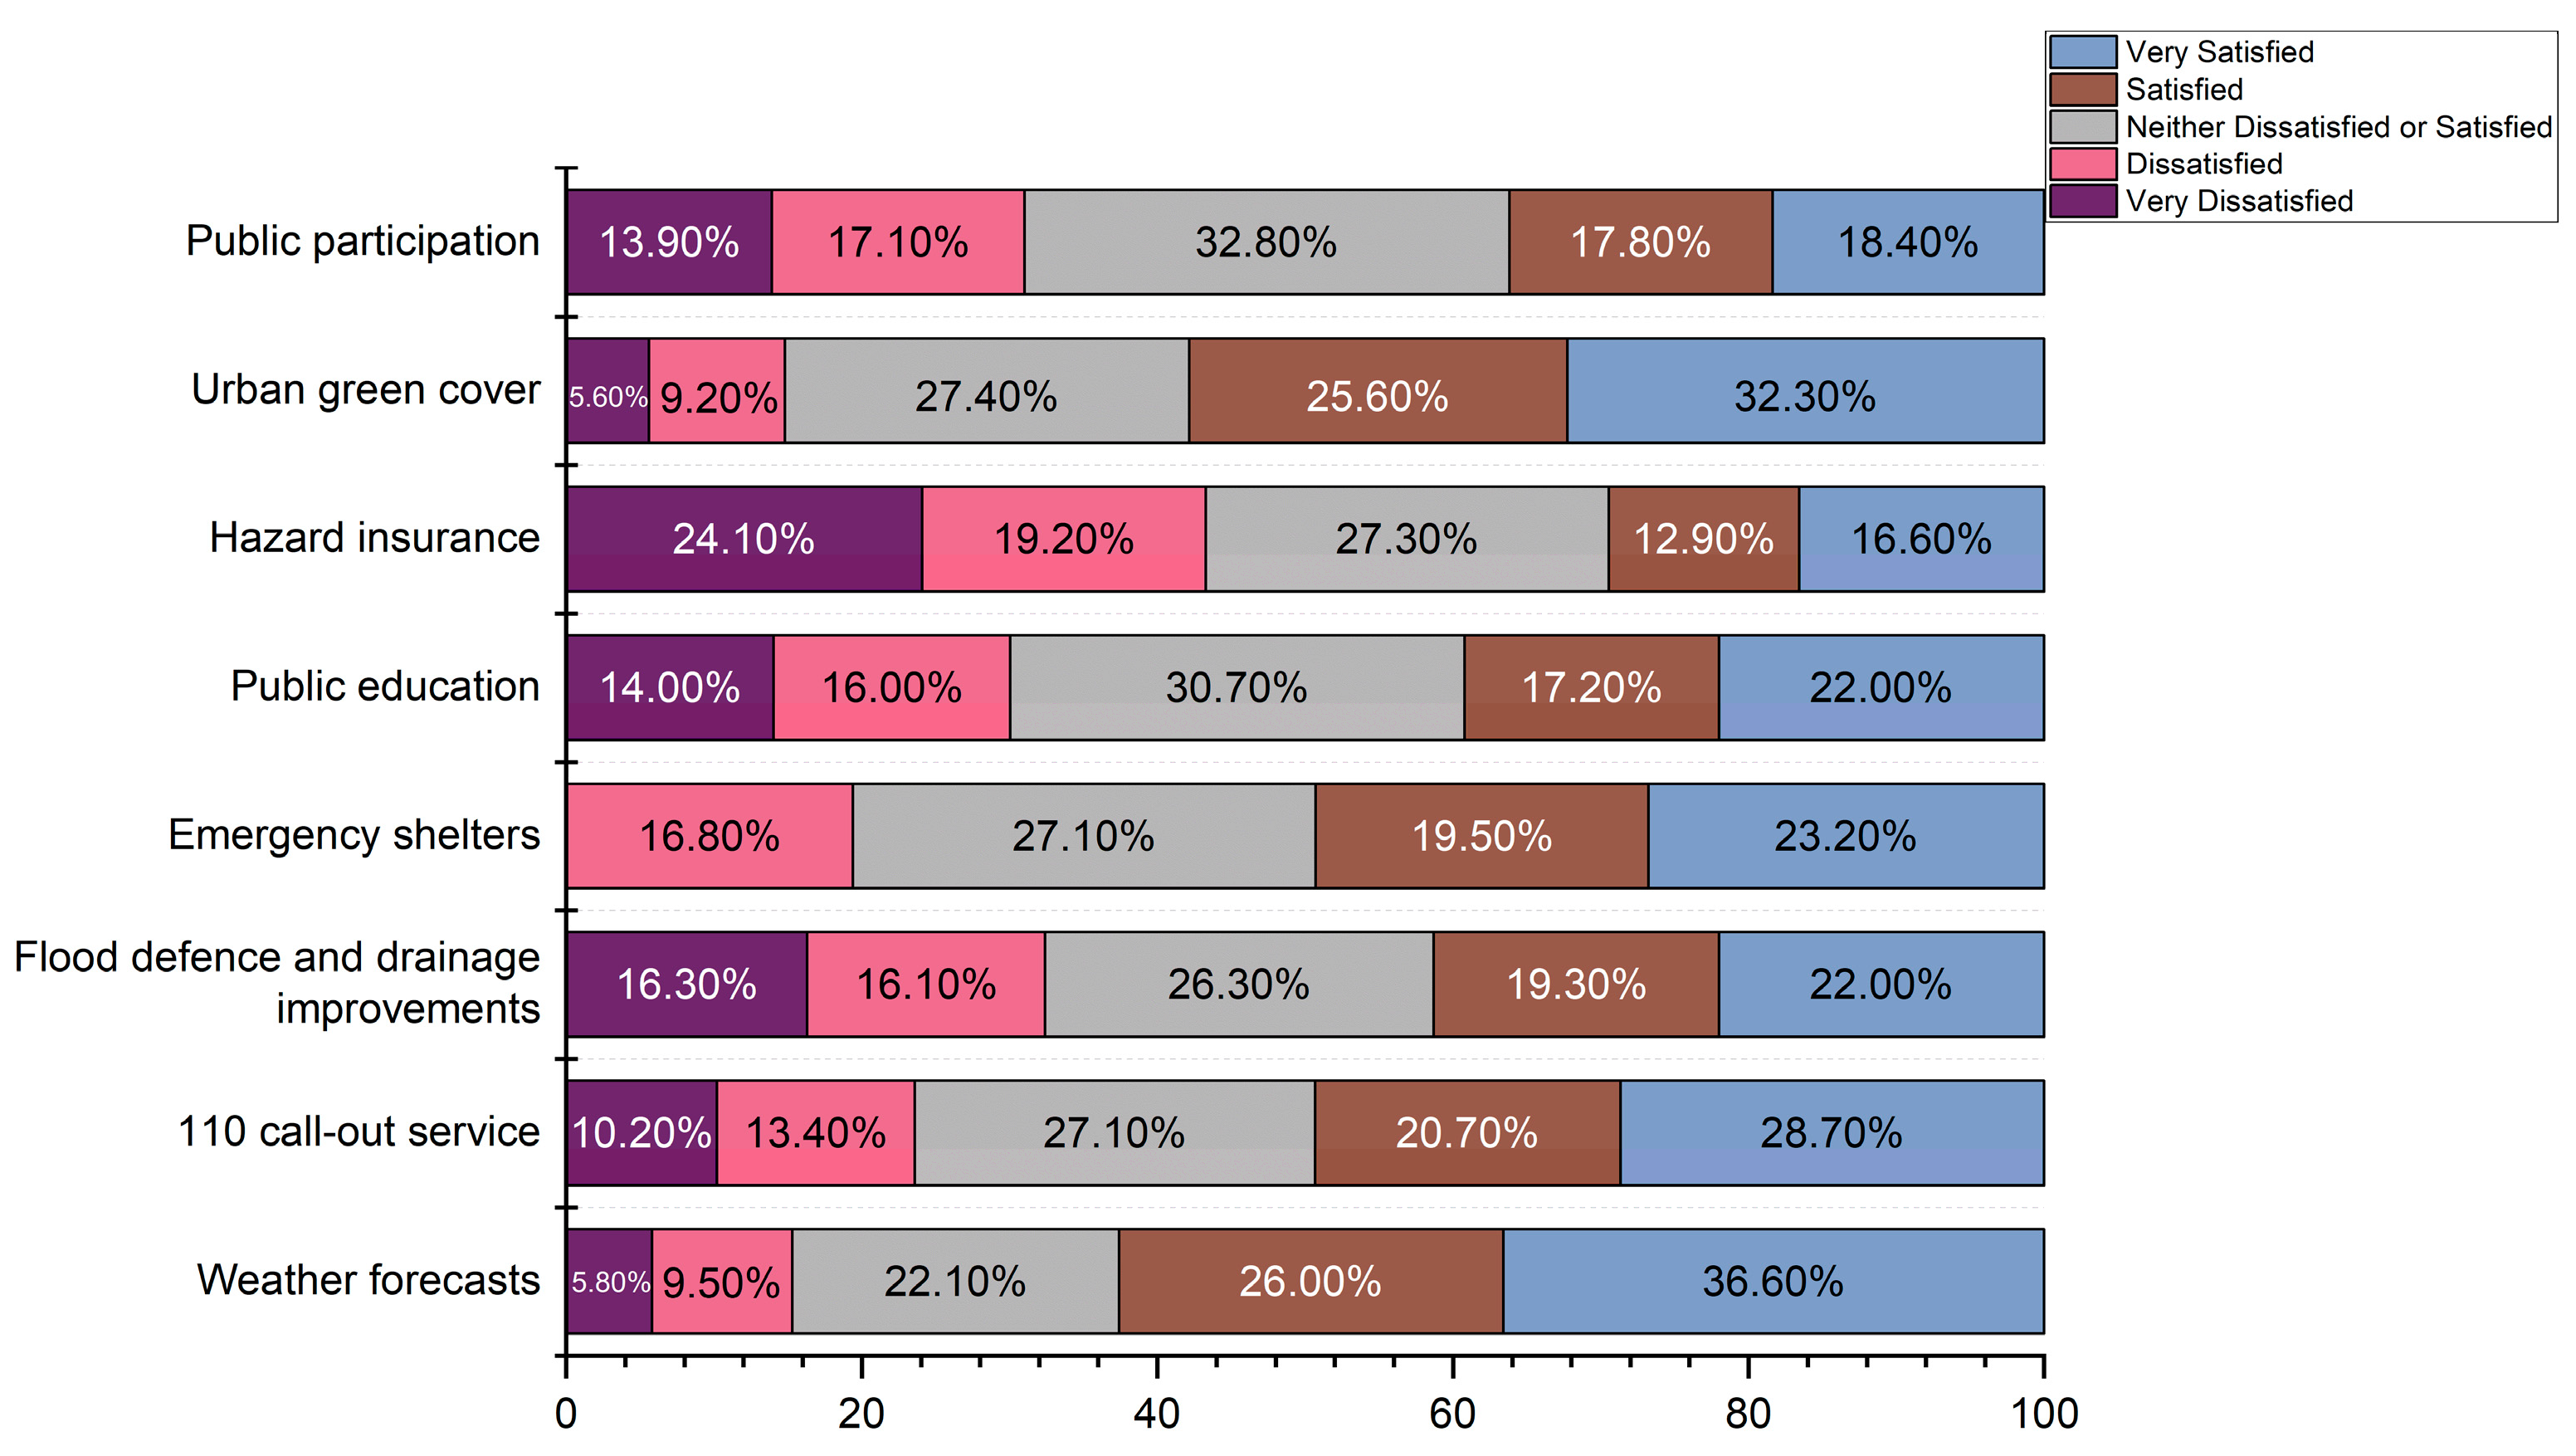
3.1.4. Evaluation of Adaptation Measures in the Public Sector

In addition to macro-level mitigation strategies, the public sector should implement measures to enhance residents’ individual and collective adaptability. Relevant public goods and policies provided by the local public sector regarding the addressing of climate risk include weather forecasts, 110 call-out services, flood defenses and drainage improvements, emergency shelters, public education, hazard insurance, urban green cover, and public participation. As depicted in Figure 5, respondents exhibited the lowest satisfaction levels with “hazard insurance”, followed by “flood defense and drainage improvements” and “public education”. The dissatisfaction with hazard insurance may be attributed to incomplete product offerings, the need for enhancement in insurance support systems, and flaws in the insurance business model, including limited coverage and stringent claim settlement procedures that diminish public trust. Urban flooding, a significant challenge amid global warming and urbanization, has prompted an increased demand among residents for both engineering solutions, like urban flood defenses and drainage projects, and non-engineering approaches, such as public education.

3.2. Analysis of Impact Mechanisms

This research employs Binomial Logistic, Ordinal Logistic, and Multinomial Logistic regression models to investigate the inherent connections and variances in residents’ cognition of climate risks and adaptation strategies.

3.2.1. Climate Change Perception

1.
Climate Change Beliefs
An Ordinal Logistic regression model was developed to delve deeper into the connection between group characteristics and climate change beliefs. The parallelism test results suggest that the model aligns well with “cold snaps and rain, snow and freezing weather”. Initially, without the introduction of independent variables, the −2 log likelihood stood at 1882.358, which decreased to 1847.527 upon the inclusion of independent variables. The p-value being less than 0.001 signifies the overall significance of the model, with detailed outcomes presented in Table 4. Additionally, the following models have passed the test and are no longer listed in detail.
In terms of age, the 18–24, 25–34, 35–44, and 45–54 age groups exhibit a heightened sense of “cold snaps and rain, snow and freezing weather” compared to the group aged over 55. The odds ratios for these four age brackets experiencing a one-grade increase in perception are notably higher, at 2.286 times (p < 0.01), 1.818 times (p < 0.05), 2.234 times (p < 0.01), and 2.199 times (p < 0.01), respectively, in comparison with the older group. This suggests that middle-aged and elderly individuals perceive these weather phenomena more mildly, likely due to their reduced exposure and shorter duration of exposure. Street interviews confirmed that this demographic tends to limit outdoor activities during extreme weather conditions, leading to lower sensitivity. Regarding educational background, the odds ratio for the group without formal education feeling “cold snaps and rain, snow and freezing weather” is 4.080 times that of the postgraduate cohort (p < 0.01). This indicates higher weather event sensitivity among less educated individuals, possibly influenced by the prevalence of indoor work and standardized heating systems in northern China that mitigate outdoor cold wave impacts. Conversely, gender, duration of residence, and income do not exhibit significant correlations with climate change beliefs based on the regression analysis.
Residents’ climate change beliefs are intricately linked to their level of risk exposure and outdoor activity duration. The time spent outdoors and the extent of risk exposure emerge as crucial factors shaping residents’ perceptions. A shorter duration of outdoor engagement corresponds to reduced risk exposure, increasing the likelihood of having a lower level of belief in climate change.
2.
Climate Change Attribution
A multinomial logistic regression model was constructed to investigate the association between group characteristics and the impact of climate change attribution scenarios. The regression findings are outlined in Table 5.
Regarding age, the regression model revealed that the odds ratios of attributing climate change to natural causes compared to anthropogenic causes were 0.292 times (p < 0.01) for the group under 18 years old and 0.593 times (p < 0.05) for the 18–24 age group, both higher than those of the group over 55 years old. Additionally, the odds ratio of attributing climate change unawareness to human causes for the under 18 group was 0.241 times higher than the older age group (p < 0.05), indicating greater tendencies to attribute climate change to natural causes or lack of understanding among middle-aged and older individuals. In the educational context, the odds ratios of attributing ignorance to anthropogenic causes were substantially elevated for those with no formal education and those with less than a bachelor’s degree, at 111.536 (p < 0.01) and 10.457 (p < 0.05) times higher than the postgraduate group. This suggests a more ambiguous cognition of climate change causes among individuals with lower educational attainments. Conversely, factors such as gender, length of residence, and income did not demonstrate significant variations in climate change attribution beliefs among residents of Xi’an.

3.2.2. Climate Risk Sensitivity

1.
Climate Change Impact Cognition
An ordinal logistic regression model was employed to further investigate the association between group characteristics and “the extent to which future climate risks will affect daily activities”. The regression findings are outlined in Table 6.
In the context of age, the likelihood of the 18–24, 25–34, 35–44, and 45–54 age groups recognizing a one-level increase in the impact of future climate risks on their lives was, respectively, 2.286 (p < 0.01), 1.818 (p < 0.05), 2.234 (p < 0.01), and 2.199 times (p < 0.01) higher than individuals aged 55 years and above. This indicates that middle-aged and elderly individuals are more optimistic in evaluating the potential impact of future climate risks. This optimism can be attributed to their lower risk exposure levels, which subsequently shape their cognitions of climate risks, leading to a more positive outlook compared to the younger group. Concerning educational levels, the probability of recognizing a higher future impact from frequent extreme weather events was 4.080 times greater in the group with no formal education than in the postgraduate cohort (p < 0.01). In other words, individuals with no formal education were more likely to anticipate a greater impact on their future compared to those with postgraduate education. It is important to note that attitudes act as a mediator between cognitions and adaptation behaviors, and excessively optimistic assessments of future impacts could hinder the proactive adoption of adaptation measures by the group.
2.
Climate Change Affects Demand
In this research, five binomial logistic regression models were developed to investigate whether Xi’an residents experience obstacles while traveling, prolonged traffic congestion, increased purchase of protective products, negative impacts on mental health, and negative effects on physical health. The results are presented in Table 7.
From a gender perspective, men are often more susceptible to the impacts of climate risks, facing increased travel disruptions and prolonged traffic congestion, while women demonstrate a higher inclination to purchase protective products in response to climate change. Considering the influence of residency duration, the correlation between extended residency and increased tendencies towards purchasing protective items and experiencing deteriorated mental well-being indicates that individuals who have resided longer are more inclined to acquire protective products and are at a heightened risk of mental health challenges.
The impact of age on the varied aspects of individuals’ lives remains significant. Regarding travel disruptions, the likelihood of experiencing such disruptions is significantly higher in the age groups under 18, 18–24, 25–34, 35–44, and 45–54, with odds ratios of 2.114 (p < 0.1), 3.007 (p < 0.01), 3.168 (p < 0.01), 3.047 (p < 0.01), and 3.222 (p < 0.01) when compared to individuals aged 55 and above. This indicates a greater susceptibility to travel disruptions among younger age brackets in comparison to older individuals, consistent with the concept of risk exposure. Furthermore, for traffic congestion, individuals under 55 were more prone to prolonged congestion than those aged 55 and above at rates of 3.736 times (p < 0.01), 3.224 times (p < 0.01), and 4.707 times (p < 0.01) higher in the age groups under 18, 18–24, 25–34, 35–44, and 45–54, respectively, indicating a higher risk for the younger age categories. In terms of purchasing protective products, individuals aged 18–24, 25–34, 35–44, and 45–54 exhibited probabilities of 3.767 times (p < 0.01), 2.922 times (p < 0.01), 2.287 times (p < 0.01), and 1.913 times (p < 0.05) higher than those aged 55 and above. The analysis of various daily activities among different age groups suggests that individuals with greater travel requirements are more likely to face travel disruptions, prolonged traffic congestion, and a heightened tendency to purchase protective products. The increased purchasing of protective products by young individuals may correlate with the surge in the “sunscreen economy” driven by high temperatures in Xi’an during the summer. Notably, concerning mental health, the probability of mental health issues occurring in the 18–24 age group is 1.749 times higher (p < 0.1) than in the 55 and above age group, indicating a higher vulnerability to mental health challenges in the younger age bracket compared to middle-aged and elderly individuals.
From an educational standpoint, individuals with postgraduate qualifications are more likely to encounter traffic congestion compared to those with lower educational levels. This difference leads to longer journey times for postgraduate-educated residents. The choice of travel mode is intricately linked to traffic congestion, especially under harsh weather conditions. In adverse weather, residents often opt for private car transportation to minimize exposure to risks, even though this may result in increased congestion compared to public transit. Additionally, individuals with postgraduate degrees are more likely to own private vehicles. This higher ownership correlates with a greater likelihood of experiencing traffic congestion. Regarding the purchase of protective products, individuals with lower educational levels, including those with a bachelor’s degree or below, exhibit a substantially higher probability of buying protective items compared to postgraduate students. This disparity suggests that those with higher education levels are less inclined to purchase protective products in response to climate risks. The motivation behind these purchases is closely tied to residents’ risk exposure levels, with individuals in lower education brackets showing stronger motivations to acquire protective products. In terms of physical health impacts, individuals with postgraduate education are less likely to experience adverse physical health effects due to climate risks compared to those with lower education levels. This difference is closely linked to varying levels of risk exposure among different educational groups.

3.2.3. Climate Risk Adaptation

A multinomial logistic regression model was developed to investigate the association between group characteristics and the impact of attitudes toward climate change adaptation. The regression outcomes are summarized in Table 8.
The results of the regression model showed that the ratio of the probability of women saying that they do not know whether they are able to cope was 1.962 times higher than that of men (p < 0.01), suggesting that women’s uncertainty in their perceptions of climate change resilience is higher than men’s. The ratio of the probability of not knowing to being able to cope increased by 1.4% (p < 0.05) for each additional year of residence. The increase in uncertainty about residents’ own climate change resilience with increasing residence time may be explained by the fact that the longer residents live in the city, the more passionately they feel about the extreme weather events in Xi’an, which increases the uncertainty of their assessment of adaptation ability. There are significant differences in the assessment of the adaptability to climate change among residents of different age levels. The ratio of the probability of indicating that they cannot cope to that of being able to cope in the 25–34, 35–44, and 45–54 age groups is 2.453 (p < 0.05), 2.139 (p < 0.05), and 3.963 (p < 0.01) times higher than that of the 55 years and older group, respectively. The ratio of the probability of saying they do not know to being able to cope in the under 18, 18–24, 25–34, 35–44, and 45–54 groups is 5.534 (p < 0.01), 3.277 (p < 0.01), 5.698 (p < 0.01), 2.831 (p < 0.01), and 2.575 (p < 0.01) times higher than that of the 55 years and over group. Compared to middle-aged and older people, the younger group judged their climate change adaptabilities more negatively. Combined with the data from the street interviews, most of the middle-aged and elderly people indicated that they had low travel needs and that they could choose to stay at home to avoid the risk of extreme weather disasters, which made their assessment of their adaptabilities to climate change more positive.

3.2.4. Evaluation of Adaptation Measures in the Public Sector

An ordinal logistic regression model was constructed to delve deeper into the assessment of the public sector’s adaptation measures across various demographic groups. The model fitting outcomes indicated statistical significance for the variables encompassing satisfaction with “weather forecasts”, “flood defense and drainage improvements”, “emergency shelters”, “hazard insurance”, and the importance of “weather forecasts”. The regression results for these models are presented in Table 9.
From a gender perspective, women are 1.376 times more likely than men to express higher satisfaction with the enhancement of flood defense and drainage improvements (p < 0.05). In general, women exhibit greater contentment with the improvements in government flood pipeline infrastructure.
From the standpoint of residency duration, the likelihood of enhanced satisfaction with the weather forecasts heightens by 0.8% for each additional year of residence. This indicates that residents with longer tenure express higher contentment with weather forecasts, implying a superior long-term accuracy of weather prediction in Xi’an.
Regarding age, the likelihood of achieving a higher satisfaction level with weather forecasts in the 18–24, 25–34, and 45–54 age brackets is 0.502 times (p < 0.05), 0.532 times (p < 0.05), and 0.523 times (p < 0.05) greater than that of the 55 and above group. This suggests that middle-aged and older individuals express greater satisfaction with weather forecasts, possibly due to their lower demand for forecast accuracy compared to younger cohorts. The predictive constraints of the atmospheric system may contribute to this satisfaction disparity. Moreover, the 45–54 age group’s probability of escalating satisfaction with emergency shelter construction by one level is 0.609 times higher than the 55 years and above group (p < 0.1), which aligns with the previously discussed risk exposure analysis. In contrast, the probability of younger age groups, specifically those under 18, 18–24, and 25–34, attaining a higher level of satisfaction with hazard insurance surpasses that of the 55 and above group by 3.171 times (p < 0.01), 2.524 times (p < 0.01), and 1.904 times (p < 0.01), highlighting an age-dependent satisfaction level. Furthermore, the likelihood of enhancing the evaluation of the significance of weather forecasting by one level in the under 18 group is 0.322 (p < 0.01) compared to the 55 years and above group, emphasizing the need for refreshing minors’ awareness of the importance of weather forecasting.
Concerning educational attainment, the probability of the undergraduate cohort achieving a higher rating in satisfaction with flood defense and drainage improvements is 1.784 times greater (p < 0.1) than that of the postgraduate education group. Likewise, the likelihood of the group with no formal education expressing increased satisfaction with emergency shelter construction exceeds that of the postgraduate education group by 2.726 times (p < 0.1). Additionally, the probability of the undergraduate group elevating satisfaction levels with hazard insurance by one grade is 1.723 times that of the postgraduate group. In essence, individuals with postgraduate education exhibit lower satisfaction levels with flood defense and drainage improvements, emergency shelter construction, and hazard insurance.
Income disparity plays a significant role in shaping the evaluation of public sector adaptation measures. The likelihood of urban flood prevention and drainage retrofitting satisfaction improving by one rank is 0.478 times higher (p < 0.1) in the income group of CNY 3000-CNY 7000 and 0.296 times higher (p < 0.01) in the CNY 7000–CNY 20,000 group compared to the group earning more than CNY 20,000. Essentially, residents in the CNY 3000–CNY 20,000 income brackets express lower satisfaction with flood defense and drainage improvements initiatives. Similarly, the probability of the CNY 7000–CNY 20,000 income group’s satisfaction with emergency shelter construction improving by one rank is 0.497 times (p < 0.1) lower than that of the group earning over CNY 20,000, indicating lower satisfaction levels within the CNY 7000–CNY 20,000 income bracket regarding emergency shelter construction. Furthermore, the less than CNY 3000 income group is 2.512 times (p < 0.1) more likely than the group earning above CNY 20,000 to elevate the assessment of the significance of weather forecasting by one level, revealing that individuals with incomes below CNY 3000 are more inclined to perceive weather forecasting as crucial. The analysis also indicates a correlation between income levels and exposure to occupational risks, with regression findings highlighting that lower-income groups exhibit reduced satisfaction with public sector adaptation measures coupled with heightened cognition of the importance of weather forecasting.

4. Conclusions and Recommendations

Through statistical analysis, the key findings are as follows:
  • With the increasing urban heat island effect, residents of Xi’an are more likely to reach a higher level of belief in climate change regarding prolonged weather events. Notably, the middle-aged and elderly groups exhibit lower levels of belief in climate change, while the group with no formal education shows higher levels of belief. Residents’ perceptions of climate change correlate closely with their risk exposure levels. Individuals who spend more time outdoors due to their lifestyles or occupations tend to have higher risk exposure and stronger beliefs in climate change. To enhance resident preparedness for potential climate disasters, the government could effectively disseminate scientific meteorological knowledge and depict the consequences of climate change through realistic visualizations, thereby enhancing public climate risk perception.
  • Xi’an residents lack a general consensus on the attribution of climate change, with only 40.1% attributing it primarily to human activities. The middle-aged and elderly groups are more inclined to attribute climate change to natural causes or remain oblivious to it, with those with less education showing a more ambiguous understanding. The substantial disparity between the scientific consensus on the anthropogenic origins of climate change and the high level of skepticism among citizens underscores the critical need for education as a paramount concern moving forward. Therefore, the government should prioritize climate change education for these demographics by creating and sharing short science films on user-friendly platforms like Weibo, TikTok, and Xiaohongshu.
  • Xi’an residents’ attitudes toward future climate risks are overly optimistic, with 89.6% dismissing the likelihood of serious negative impacts, particularly among the elderly and postgraduates, who exhibit minimal concern and anxiety. A potential challenge arises when optimistic and highly educated individuals, who wield significant influence over policymaking, fail to proactively address climate risks in the face of incomplete information. A potential challenge arises when optimistic and highly educated individuals, who wield significant influence over policymaking, fail to proactively address climate risks in the face of incomplete information. Residents acknowledge that “summer heat” will have the most substantial impact on their daily lives and well-being. Women, individuals aged 25–54, and postgraduates demonstrate higher susceptibility to climate risks impacts, contrasting the overall subdued level of climate change concern. Leveraging big data on group activities could aid the government in identifying traffic congestion hotspots during peak hours and optimizing road management for improved traffic efficiency.
  • There exists a notable uncertainty regarding residents’ adaptability to climate change risks, especially among females and younger individuals displaying more negative cognitions. The internet remains a primary source for residents to obtain weather information, with limited cognition and trust in weather insurance policies.
  • Residents express the lowest satisfaction with public sector efforts related to “hazard insurance”, followed by “flood defense and drainage improvements” and “public education” initiatives. Enhancements are urgently needed in weather disaster insurance products, support systems, and operational models. Gender, tenure, age, education, and income levels exhibit varying degrees of public sector responses to climate risks.
The study outcomes serve as valuable insights for the government when developing targeted and informed adaptation policies and could prompt similar investigations in high-risk regions globally to advance climate change adaptation strategies. Consequently, it is recommended that the government proactively bolster climate risk adaptation infrastructure, enhance meteorological knowledge dissemination, improve forecast accuracy, and amplify public awareness of climate risk mitigation strategies. Moreover, a concerted effort to fortify various city systems, like disaster insurance, medical coverage, power supply infrastructure, and road transport, is crucial and should form the core of comprehensive adaptation endeavors.
A primary limitation of this study lies in its cross-sectional design, which overlooks the dynamic aspects of respondents’ cognition and adaptation, thus constraining causal interpretations of intertemporal cognition, adaptation, and their related factors. Considering longitudinal research would offer greater value in future studies.

Author Contributions

W.L. conceived the study and assisted in the original draft and editing; R.Y. assisted in methodology and the original draft; P.Q. assisted in the editing and investigation; B.A., J.M. and S.B. assisted in data collection and investigation. All authors have read and agreed to the published version of the manuscript.

Funding

This work was jointly supported by Science and Technology Department of Shaanxi Province(2022KRM087) and Education Department of Shaanxi Province (S202310697271).

Institutional Review Board Statement

The study was conducted by adhering to the guidelines of the Declaration of Helsinki and approved by the Medical Ethics Committee of the Northwest University (No. 240401062 and 20 June 2023).

Informed Consent Statement

Informed consent was obtained from all subjects involved in the study.

Data Availability Statement

Data and material will be made available on request.

Acknowledgments

The authors would like to express their gratitude to Liu Xichang, Lv Wenjing, Chen Xiaomin, and Chen Boyu for their participation in the investigations in this study, which significantly enhanced the speed of the study. The authors are grateful to reviewers and the Editor for their helpful and constructive comments, which have greatly improved this paper.

Conflicts of Interest

The authors declare no conflicts of interest.

References

  1. WMO State Global Climate 2021 (WMO-No.1290). Available online: https://library.wmo.int/idurl/4/56300 (accessed on 14 December 2023).
  2. CMA Climate Change Centre. Blue Book on Climate Change in China (2022); Science Press: Beijing, China, 2022. [Google Scholar]
  3. IPCC Climate Change 2022: Impacts, Adaptation and Vulnerability. Available online: https://www.ipcc.ch/report/sixth-assessment-report-working-group-ii/ (accessed on 12 December 2023).
  4. Fang, X.Q.; Yin, P.H. Review on the three key concepts of resilience, vulnerability and adaptation in the research of global environmental change. Prog. Geogr. 2007, 26, 11–22. [Google Scholar] [CrossRef]
  5. Yu, G.L.; Wang, Q.L.; Yang, Z.L. Environmental Psychology; People’s Education Press: Beijing, China, 2000. [Google Scholar]
  6. Smith, K. Environmental Hazards: Assessing Risk and Reducing Disaster; Routledge: London, UK; New York, NY, USA, 1996. [Google Scholar]
  7. Löfstedt, R.; Frewer, L. Risk & Modern Society; Earthscan Publications: London, UK, 1998. [Google Scholar]
  8. Yun, Y.R.; Fang, X.Q.; Tian, Q.; Zhang, X.Z. Peasants′ perception and cognition to climate change in Mohe county, Heilongjiang Province. Sci. Geogr. Sin. 2009, 29, 745–749. [Google Scholar]
  9. Figner, B.; Weber, E.U. Who takes risks when and why? Determinants of risk taking. Curr. Dir. Psychol. Sci. 2011, 20, 211–216. [Google Scholar] [CrossRef]
  10. Song, L. Climate risks recognizing and adaptation ability of Shanghai residents. Urban Probl. 2014, 2, 62–69. [Google Scholar] [CrossRef]
  11. Jones, N.; Clark, J.; Tripidaki, G. Social risk assessment and social capital: A significant parameter for the formation of climate change policies. Soc. Sci. J. 2012, 49, 33–41. [Google Scholar] [CrossRef]
  12. Peng, L.M.; Peng, Y.H. Analysis of survey on urban residents’ cognition of climate change risk in Guangzhou. Yuejiang Acad. J. 2012, 4, 40–47. [Google Scholar] [CrossRef]
  13. Cui, W.J.; Luo, Y. Effects of urban residents climate change risk perception on travel mode choice: Based on 620 urban residents investigation. Ecol. Econ. 2014, 30, 119–123+155. [Google Scholar]
  14. Xie, X.L.; Zheng, Y. Perception of climate disaster risks and adaptation of urban residents: Analysis based on the social survey of Shanghai. Urban Environ. Stud. 2014, 1, 80–91. [Google Scholar]
  15. Du, F.L.; Li, L.I.; Du, Y.R. Empirical study on the herders’ perception and adaptive strategies to the extreme weather risks in Inner Mongolia. J. Arid. Land Resour. Environ. 2015, 29, 132–137. [Google Scholar] [CrossRef]
  16. Yu, Y. Farmers’ attitudes towards low-probability climate change risks: Hurricane insurance will pay. Jiangsu Agric. Sci. 2016, 44, 153. [Google Scholar] [CrossRef]
  17. Brouwer, R.; Akter, S.; Brander, L.; Haque, E. Socioeconomic vulnerability and adaptation to environmental risk: A case study of climate change and flooding in Bangladesh. Risk Anal. Int. J. 2007, 27, 313–326. [Google Scholar] [CrossRef] [PubMed]
  18. Alam, G.M.; Alam, K.; Mushtaq, S. Climate change perceptions and local adaptation strategies of hazard-prone rural households in Bangladesh. Clim. Risk Manag. 2017, 17, 52–63. [Google Scholar] [CrossRef]
  19. Abid, M.; Schilling, J.; Scheffran, J.; Zulfiqar, F. Climate change vulnerability, adaptation and risk perceptions at farm level in Punjab, Pakistan. Sci. Total Environ. 2016, 547, 447–460. [Google Scholar] [CrossRef] [PubMed]
  20. Ali, A.; Erenstein, O. Assessing farmer use of climate change adaptation practices and impacts on food security and poverty in Pakistan. Clim. Risk Manag. 2017, 16, 183–194. [Google Scholar] [CrossRef]
  21. Gentle, P.; Maraseni, T.N. Climate change, poverty and livelihoods: Adaptation practices by rural mountain communities in Nepal. Environ. Sci. Policy 2012, 21, 24–34. [Google Scholar] [CrossRef]
  22. Dang, H.L.; Li, E.; Nuberg, I.; Bruwer, J. Understanding farmers’ adaptation intention to climate change: A structural equation modelling study in the Mekong Delta, Vietnam. Environ. Sci. Policy 2014, 41, 11–22. [Google Scholar] [CrossRef]
  23. Esham, M.; Garforth, C. Agricultural adaptation to climate change: Insights from a farming community in Sri Lanka. Mitig. Adapt. Strateg. Glob. Change 2013, 18, 535–549. [Google Scholar] [CrossRef]
  24. Arbuckle, J.G.; Prokopy, L.S.; Haigh, T.; Hobbs, J.; Knoot, T.; Knutson, C.; Loy, A.; Mase, A.S.; McGuire, J.; Morton, L.W.; et al. Climate change beliefs, concerns, and attitudes toward adaptation and mitigation among farmers in the Midwestern United States. Clim. Change 2013, 117, 943–950. [Google Scholar] [CrossRef]
  25. Philippenko, X.; Goeldner-Gianella, L.; Cozannet, G.L.; Grancher, D.; Torre, Y.D. Perceptions of climate change and adaptation: A subarctic archipelago perspective (Saint-Pierre-and-Miquelon, North America). Ocean. Coast. Manag. 2021, 215, 105924. [Google Scholar] [CrossRef]
  26. Frank, E.; Eakin, H.; López-Carr, D. Social identity, perception and motivation in adaptation to climate risk in the coffee sector of Chiapas, Mexico. Glob. Environ. Change 2011, 21, 66–76. [Google Scholar] [CrossRef]
  27. Soito, J.L.; Freitas, M.A.V. Amazon and the expansion of hydropower in Brazil: Vulnerability, impacts and possibilities for adaptation to global climate change. Renew. Sustain. Energy Rev. 2011, 15, 3165–3177. [Google Scholar] [CrossRef]
  28. Wamsler, C.; Brink, E.; Rentala, O. Climate change, adaptation, and formal education: The role of schooling for increasing societies’ adaptive capacities in El Salvador and Brazil. Ecol. Soc. 2012, 17, 2. [Google Scholar] [CrossRef]
  29. Lemos, M.C.; Lo, Y.J.; Nelson, D.R.; Eakin, H.; Bedran-Martins, A.M. Linking development to climate adaptation: Leveraging generic and specific capacities to reduce vulnerability to drought in NE Brazil. Glob. Environ. Change 2016, 39, 170–179. [Google Scholar] [CrossRef]
  30. Barros, V.R.; Boninsegna, J.A.; Camilloni, I.A.; Chidiak, M.; Magrín, G.O.; Rusticucci, M. Climate change in Argentina: Trends, projections, impacts and adaptation. Wiley Interdiscip. Rev. Clim. Change 2015, 6, 151–169. [Google Scholar] [CrossRef]
  31. McDowell, J.Z.; Hess, J.J. Accessing adaptation: Multiple stressors on livelihoods in the Bolivian highlands under a changing climate. Glob. Environ. Change 2012, 22, 342–352. [Google Scholar] [CrossRef]
  32. Bryan, E.; Deressa, T.T.; Gbetibouo, G.A.; Ringler, C. Adaptation to climate change in Ethiopia and South Africa: Options and constraints. Environ. Sci. Policy 2009, 12, 413–426. [Google Scholar] [CrossRef]
  33. Deressa, T.T.; Hassan, R.M.; Ringler, C.; Alemu, T.; Yesuf, M. Determinants of farmers’ choice of adaptation methods to climate change in the Nile Basin of Ethiopia. Glob. Environ. Change 2009, 19, 248–255. [Google Scholar] [CrossRef]
  34. Deressa, T.T.; Hassan, R.M.; Ringler, C. Perception of and adaptation to climate change by farmers in the Nile basin of Ethiopia. J. Agric. Sci. 2011, 149, 23–31. [Google Scholar] [CrossRef]
  35. Thomas, D.S.; Twyman, C.; Osbahr, H.; Hewitson, B. Adaptation to climate change and variability: Farmer responses to intra-seasonal precipitation trends in South Africa. Clim. Change 2007, 83, 301–322. [Google Scholar] [CrossRef]
  36. Paavola, J. Livelihoods, vulnerability and adaptation to climate change in Morogoro, Tanzania. Environ. Sci. Policy 2008, 11, 642–654. [Google Scholar] [CrossRef]
  37. Patt, A.G.; Schröter, D. Perceptions of climate risk in Mozambique: Implications for the success of adaptation strategies. Glob. Environ. Change 2008, 18, 458–467. [Google Scholar] [CrossRef]
  38. Fosu-Mensah, B.Y.; Vlek, P.L.G.; MacCarthy, D.S. Farmers’ perception and adaptation to climate change: A case study of Sekyedumase district in Ghana. Environ. Dev. Sustain. 2012, 14, 495–505. [Google Scholar] [CrossRef]
  39. Reidsma, P.; Ewert, F.; Lansink, A.O.; Leemans, R. Adaptation to climate change and climate variability in European agriculture: The importance of farm level responses. Eur. J. Agron. 2010, 32, 91–102. [Google Scholar] [CrossRef]
  40. Reckien, D.; Flacke, J.; Dawson, R.J.; Heidrich, O.; Olazabal, M.; Foley, A.M.; Hamann, J.J.; Orru, H.; Salvia, M.; Gregorio Hurtado, S.; et al. Climate change response in Europe: What’s the reality? Analysis of adaptation and mitigation plans from 200 urban areas in 11 countries. Clim. Change 2013, 122, 331–340. [Google Scholar] [CrossRef]
  41. Massey, E.; Biesbroek, R.; Huitema, D.; Jordan, A. Climate policy innovation: The adoption and diffusion of adaptation policies across Europe. Glob. Environ. Change 2014, 29, 434–443. [Google Scholar] [CrossRef]
  42. Persson, J.; Blennow, K.; Gonçalves, L.; Borys, A.; Dutcă, I.; Hynynen, J.; Janeczko, E.; Lyubenova, M.; Martel, S.; Merganic, J.; et al. No polarization–Expected Values of Climate Change Impacts among European Forest Professionals and Scientists. Sustainability 2020, 12, 2659. [Google Scholar] [CrossRef]
  43. Grafakos, S.; Viero, G.; Reckien, D.; Trigg, K.; Viguie, V.; Sudmant, A.; Graves, C.; Foley, A.; Heidrich, O.; Mirailles, J.M.; et al. Integration of mitigation and adaptation in urban climate change action plans in Europe: A systematic assessment. Renew. Sustain. Energy Rev. 2020, 121, 109623. [Google Scholar] [CrossRef]
  44. Wheeler, S.; Zuo, A.; Bjornlund, H. Farmers’ climate change beliefs and adaptation strategies for a water scarce future in Australia. Glob. Environ. Change 2013, 23, 537–547. [Google Scholar] [CrossRef]
  45. Mortreux, C.; Barnett, J. Climate change, migration and adaptation in Funafuti, Tuvalu. Glob. Environ. Change 2009, 19, 105–112. [Google Scholar] [CrossRef]
  46. Ding, Y.H.; Liu, Y.J.; Xu, Y.; Wu, P.; Xue, T.; Wang, J.; Shi, Y.; Zhang, Y.X.; Song, Y.F.; Wang, P.L. Regional responses to global climate change: Progress and prospects for trend, causes, and projection of climatic warming-wetting in Northwest China. Adv. Earth Sci. 2023, 38, 551–562. [Google Scholar] [CrossRef]
  47. Blennow, K.; Persson, J.; Gonçalves, L.M.S.; Borys, A.; Dutcă, I.; Hynynen, J.; Janeczko, E.; Lyubenova, M.; Merganič, J.; Merganičová, K.; et al. The role of beliefs, expectations and values in decision-making favoring climate change adaptation—implications for communications with European forest professionals. Environ. Res. Lett. 2020, 11, 114061. [Google Scholar] [CrossRef]
  48. Sun, Y.; Chen, X.F.; Gong, Y.C.; Tian, J.C.; Ji, Z.Y.; Li, Y.; Guo, H.Y.; Han, J.; Zhang, L.X. Progress and development suggestions for psychological research on climate change. Bull. Chin. Acad. Sci. 2023, 38, 1197–1211. [Google Scholar] [CrossRef]
Figure 1. Climate change beliefs of Xi’an residents.
Sustainability 16 05775 g001
Figure 2. Perceived climate change impacts among Xi’an residents.
Sustainability 16 05775 g002
Figure 3. Status of how daily activities of Xi’an residents are affected by climate risks.
Sustainability 16 05775 g003
Figure 4. Cognitive importance of individual climate change adaptation measures among Xi’an residents.
Sustainability 16 05775 g004
Figure 5. Evaluation of Xi’an residents’ satisfaction with public sector climate risk adaptation measures.
Sustainability 16 05775 g005
Table 1. Demographic characteristics of the public respondents in Xi’an.
VariableClassificationsQuorum
(Number)
Percentage
(%)
VariableClassificationQuorum
(Number)
Percentage (%)
GenderMan36150.2Individual incomeLess than CNY 300026036.2
Woman35849.8CNY 3000–700030141.9
Age (years)Under 18496.8CNY 7000–20,00013618.9
18–24 years10915.2More than CNY 20,000223.0
25–34 years19326.8Academic qualificationsNo Formal Education182.5
35–44 years15421.4Below Bachelor’s Degree29240.6
45–54 years8411.7Bachelor’s Degree36250.3
55 years and over13018.1Postgraduate Qualification476.5
Table 2. Definition and description of dependent variables.
Implicit VariableObservational VariablesDefinition of Variables
Climate   change   perception   ( Y 1 ) The   frequency   of   widespread   and   frequent   rainstorms ,   with   an   increased   rainfall   ( Y 11 ) ,   summer   heat   ( Y 12 ) ,   extreme   cold   and   warm   events   ( Y 13 ) ,   cold   snaps   and   rain ,   snow   and   freezing   weather   ( Y 14 )1 = Strongly Disagree; 2 = Disagree; 3 = Undecided; 4 = Agree; 5 = Strongly Agree
Causes   of   climate   change   ( Y 15 )1 = Mainly due to Human Activities; 2 = Mainly Natural Variations; 3 = Unaware
Climate   risk   sensitivity   ( Y 2 ) Impact   of   widespread   and   frequent   rainstorms ,   with   an   increased   rainfall   ( Y 11 ) ,   summer   heat   ( Y 12 ) ,   extreme   cold   and   warm   events   ( Y 13 ) ,   cold   snaps   and   rain ,   snow   and   freezing   weather   ( Y 14 )1 = Strongly Unaffected; 2 = Unaffected; 3 = Neutral; 4 = Affected; 5 = Strongly Affected
The   extent   to   which   future   climate   risks   will   affect   daily   activities   ( Y 25 )
Whether   the   climate   change   has   resulted   in   travel   disruption   for   residents   ( Y 26 ) ,   long   time - consuming   traffic   congestion   for   residents   ( Y 27 ) ,   purchase   more   protective   products   ( Y 28 ) ,   a   negative   impact   on   the   mental   health   status   ( Y 29 ) ,   a   negative   impact   on   the   physiological   health   status   ( Y 210 )0 = No; 1 = Yes
Climate   risk   adaptation   ( Y 3 ) Can   individuals   cope   with   climate   change   risks ?   ( Y 31 )1 = Can; 2 = Cannot; 3 = Unaware
Accesses   to   meteorological   information   by   television   and   radio   ( Y 32 ) ,   online   media   ( Y 33 ) ,   newspapers   and   magazines   ( Y 34 ) ,   popularization   of   science   and   technology   ( Y 35 ) ,   chatting   with   friends   ( Y 36 ) ,   other   means   ( Y 37 )0 = No; 1 = Yes
Importance   of   insurance   spending   ( Y 38 ) ,   exercise   and   nutrition   ( Y 39 ) ,   improvement   of   living   conditions   ( Y 310 ) ,   attention   to   meteorological   information   ( Y 311 ) ,   training   on   disaster   prevention   ( Y 312 ) ,   improvement   of   household   facilities   ( Y 313 )1 = Very Unimportant; 2 = Unimportant; 3 = Neutral; 4 = Important; 5 = Very Important
Evaluation   of   adaptation   measures   in   the   public   sector   ( Y 4 ) Satisfaction   with   weather   forecasts   ( Y 41 ) ,   110   call - out   service   ( Y 42 ) ,   flood   defense   and   drainage   improvements   ( Y 43 ) ,   emergency   shelters   ( Y 44 ) ,   public   education   ( Y 45 ) ,   hazard   insurance   ( Y 46 ) ,   urban   green   cover   ( Y 47 ) ,   public   participation   ( Y 48 )1 = Very Dissatisfied; 2 = Dissatisfied; 3 = Neither Dissatisfied or Satisfied; 4 = Satisfied; 5 = Very Satisfied
Importance   of   weather   forecasts   ( Y 49 ) ,   110   call - out   service   ( Y 410 ) ,   flood   defense   and   drainage   improvements   ( Y 411 ) ,   emergency   shelters   ( Y 412 ) ,   public   education   ( Y 413 ) ,   hazard   insurance   ( Y 414 ) ,   urban   green   cover   ( Y 415 ) ,   public   participation   ( Y 416 )1 = Very Unimportant; 2 = Unimportant; 3 = Neutral; 4 = Important; 5 = Very Important
Table 3. Definition and description of independent variables.
Independent VariableDefinition of Variable (Number/Ratio)
Gender   ( X 1 )0 = female; 1 = male
Duration   of   residence   ( X 2 )Xi’an residency
Age   ( X 3 )1 = Under 18; 2 = 18–24; 3 = 25–34; 4 = 35–44; 5 = 45–54; 6 = 55 and over
Academic   qualifications   ( X 4 )1 = No Formal Education; 2 = Below Bachelor’s Degree; 3 = Bachelor’s Degree; 4 = Postgraduate Qualification
Income   ( X 5 )1 = less than 3000; 2 = 3000–7000; 3 = 7000–20,000; 4 = more than 20,000
Table 4. Ordinal logistic regression model of factors influencing residents’ climate change beliefs in Xi’an City.
Independent VariableCold Snaps and Rain, Snow and Freezing Weather
Regression CoefficientOR
Gender
Woman−0.130.878
ManReferent-
Length of residence−0.0030.997
Age
Under 18−0.2910.748
18–24 years0.827 ***2.286
25–34 years0.598 **1.818
35–44 years0.804 ***2.234
45–54 years0.788 ***2.199
55 years and overReferent-
Academic qualifications
No formal education1.406 ***4.080
Below bachelor’s degree0.2861.331
Bachelor’s degree0.2591.296
Postgraduate qualificationReferent-
Incomes
Less than CNY 3000−0.0460.955
CNY 3000–70000.1691.184
CNY 7000–20,0000.0241.024
More than CNY 20,000Referent-
OR is the dominance ratio; ** indicates p-value < 0.05 *** indicates p-value < 0.01.
Table 5. Multinomial logistic regression model of factors affecting climate change attribution of Xi’an residents.
Independent VariableNatural Causes vs. Anthropogenic CausesUnaware vs. Anthropogenic Causes
Regression
Coefficient
ORRegression
Coefficient
OR
Gender
Woman−0.070.9330.0951.1
ManReferent-Referent-
Length of residence−0.0050.99501
Age
Under 18−1.23 ***0.292−1.422 **0.241
18–24 years−0.619 **0.539−0.4560.634
25–34 years−0.4170.6590.1771.193
35–44 years−0.2680.7650.5241.689
45–54 years0.2621.2990.7462.108
55 years and overReferent-Referent-
Academic qualifications
No formal education1.6825.3754.714 ***111.536
Below bachelor’s degree0.1291.1372.347 **10.457
Bachelor’s degree−0.5060.6031.163.191
Postgraduate qualificationReferent-Referent-
Income
Less than CNY 3000−0.0750.9280.4041.497
CNY 3000–7000−0.0970.907−0.420.657
CNY 7000–20,0000.0581.060.0831.087
More than CNY 20,000Referent-Referent-
OR is the dominance ratio; ** indicates p-value < 0.05 *** indicates p-value < 0.01.
Table 6. Ordinal logistic regression model of influential factors influencing cognitions of Xi’an City residents.
Independent VariableThe Extent to Which Future Climate Risks
Will Affect Daily Activities
Regression CoefficientOR
Gender
Woman−0.130.878
ManReferent-
Length of residence−0.0030.997
Age
Under 18−0.2910.748
18–24 years0.827 ***2.286
25–34 years0.598 **1.818
35–44 years0.804 ***2.234
45–54 years0.788 ***2.199
55 years and overReferent-
Academic qualifications
No formal education1.406 ***4.080
Below bachelor’s degree0.2861.331
Bachelor’s degree0.2591.296
Postgraduate qualificationReferent-
Income
Less than CNY 3000−0.0460.955
CNY 3000–70000.1691.184
CNY 7000–20,0000.0241.024
More than CNY 20,000Referent-
OR is the dominance ratio; ** indicates p-value < 0.05 *** indicates p-value < 0.01.
Table 7. Binomial logistic regression model for whether Xi’an residents’ lives are affected.
Independent VariableTravel DisruptionLong Time-Consuming Traffic CongestionPurchase More
Protective Products
Mental Health
Affected
Physical Health
Affected
Regression CoefficientORRegression CoefficientORRegression CoefficientORRegression CoefficientORRegression CoefficientOR
Gender
Woman−0.31 *0.733−0.315 *0.730.316 *1.372−0.1640.849−0.180.835
ManReferent-Referent-Referent-Referent-Referent-
Length of residence0.0061.0070.0051.0050.009 *1.0090.009 *1.0090.0071.007
Age
Under 180.748 *2.1141.318 ***3.7360.4731.605−0.4840.617−0.5440.58
18–24 years1.101 ***3.0071.171 ***3.2241.326 ***3.7670.559 *1.7490.2541.289
25–34 years1.153 ***3.1681.549 ***4.7071.072 ***2.9220.1841.2020.4071.503
35–44 years1.114 ***3.0471.195 ***3.3020.827 ***2.2870.3211.3780.2451.278
45–54 years1.17 ***3.2221.033 ***2.8080.649 **1.9130.4061.5010.291.337
55 years and overReferent-Referent-Referent-Referent-Referent-
Academic qualifications
No formal education0.6521.919−1.421 *0.2420.992 *2.6980.4241.5281.519 **4.565
Below bachelor’s degree−0.3110.733−1.755 ***0.1730.89 **2.4350.3971.4870.841 *2.318
Bachelor’s degree−0.0360.965−1.246 **0.2880.962 ***2.6170.3431.4090.846 *2.33
Postgraduate qualificationReferent-Referent-Referent-Referent-Referent-
Incomes
Less than CNY 30000.4381.55−0.1230.8840.4411.5540.271.31−0.0650.937
CNY 3000–70000.5821.790.1241.1320.5961.8150.2741.315−0.0140.986
CNY 7000–20,0000.2021.224−0.0730.9290.2351.265−0.1130.894−0.5370.585
More than CNY 20,000Referent-Referent-Referent-Referent-Referent-
Constant−0.6460.5241.473 *4.362−2.0620.127−1.413 **0.243−1.829 ***0.161
OR is the dominance ratio; * indicates p-value < 0.1 ** indicates p-value < 0.05 *** indicates p-value < 0.01.
Table 8. Multinomial logistics regression model of factors influencing residents’ evaluation of abilities to coping with climate change in Xi’an City.
Independent Variable“Cannot” vs. “Can”“Unaware” vs. “Can”
Regression CoefficientORRegression CoefficientOR
Genders
Woman0.1261.1340.674 ***1.962
ManReferent-Referent-
Length of residence−0.0070.9930.014 **1.014
Age
Under 180.0281.0291.711 ***5.534
18–24 years0.1291.1381.187 ***3.277
25–34 years0.897 **2.4531.74 ***5.698
35–44 years0.76 **2.1391.041 ***2.831
45–54 years1.377 ***3.9630.946 ***2.575
55 years and overReferent-Referent-
Academic qualifications
No formal education0.261.2960.1781.195
Below bachelor’s degree0.031.03−0.2840.752
Bachelor’s degree0.3391.4030.0491.051
Postgraduate qualificationReferent-Referent-
Incomes
Less than CNY 3000−0.2260.7970.4771.611
CNY 3000–7000−0.0520.950.5091.664
CNY 7000–20,000−0.6610.5160.3681.445
More than CNY 20,000Referent-Referent-
OR is the dominance ratio; ** indicates p-value < 0.05 *** indicates p-value < 0.01.
Table 9. Ordinal logistic regression model of influencing factors on the evaluation of the satisfaction and importance of public participation among Xi’an residents.
Independent
Variable
Satisfaction with Weather ForecastsSatisfaction with Flood Defense and Drainage
Improvements
Satisfaction with Emergency
Shelters
Satisfaction with Hazard InsurancePerceived Importance of Weather Forecasts
Regression CoefficientORRegression CoefficientORRegression CoefficientORRegression CoefficientORRegression CoefficientOR
Gender
Woman0.0051.0050.319 **1.3760.081.0830.0441.0450.0621.064
ManReferent-Referent-Referent-Referent-Referent-
Length of residence0.008 *1.008−0.0020.998−0.0020.998−0.0050.995−0.0020.998
Age
Under 18−0.4350.6470.1581.1710.1181.1251.154 ***3.171−1.134 ***0.322
18–24 years−0.69 **0.5020.1731.1890.2661.3050.926 ***2.524−0.9250.397
25–34 years−0.631 **0.532−0.0250.975−0.0820.9210.644 ***1.904−0.8770.416
35–44 years−0.1590.8530.0611.063−0.1670.8460.3341.397−0.620.538
45–54 years−0.648 **0.523−0.453 *0.636−0.496 *0.6090.0371.038−0.5680.567
55 years and overReferent-Referent-Referent-Referent-Referent-
Academic qualifications
No formal education0.1471.1580.7122.0381.003 *2.7260.681.974−0.240.787
Below bachelor’s degree0.0611.0630.579 *1.7840.4061.5010.544 *1.723−0.2950.745
Bachelor’s degree0.1481.160−0.130.8780.1331.1420.3291.390−0.070.932
Postgraduate qualificationReferent-Referent-Referent-Referent-Referent-
Income
Less than CNY 30000.5931.809−0.6050.546−0.3280.720−0.2850.7520.921 *2.512
CNY 3000–70000.2851.330−0.739 *0.478−0.5410.582−0.3920.6760.5251.690
CNY 7000–20,0000.131.139−1.216 ***0.296−0.7 *0.497−0.6270.5340.381.462
More than CNY 20,000Referent-Referent-Referent-Referent-Referent-
OR is the dominance ratio; * indicates p-value < 0.1 ** indicates p-value < 0.05 *** indicates p-value < 0.01.
Disclaimer/Publisher’s Note: The statements, opinions and data contained in all publications are solely those of the individual author(s) and contributor(s) and not of MDPI and/or the editor(s). MDPI and/or the editor(s) disclaim responsibility for any injury to people or property resulting from any ideas, methods, instructions or products referred to in the content.

