Article

A Performance and Data-Driven Method for Optimization of Traditional Courtyards

1
School of Architecture, Southeast University, Nanjing 210096, China
2
School of Art and Design, Wanjiang University of Technology, Ma’anshan 243031, China
3
School of Architecture and Urban Planning, Guangdong University of Technology, Guangzhou 510080, China
*
Author to whom correspondence should be addressed.
Sustainability 2024, 16(13), 5779; https://doi.org/10.3390/su16135779
Submission received: 31 May 2024 / Revised: 28 June 2024 / Accepted: 4 July 2024 / Published: 6 July 2024

Abstract

:
As urbanization and rapid industrialization accelerate, rural areas face increasing pressure on resources and the environment, leading to challenges such as energy waste and reduced comfort. Traditional village planning and design methods are based on economic benefits and often lack consideration of climate adaptability. To address these issues, a comprehensive assessment of building and courtyard performance should be introduced early in the planning of traditional villages. This approach can better adapt the buildings to their climatic conditions. Introducing relevant performance indicators, such as outdoor comfort, indoor lighting, and building energy consumption, at the initial design stage is crucial. This article employs performance-based multi-objective optimization algorithms and machine learning techniques to investigate the design workflow of courtyards and their combinations. The goal is to enhance planners’ design efficiency in village planning by integrating data-driven and performance-driven methods. The research results show that during the performance-driven phase, by adjusting the spatial morphology and architectural parameters, the performance of the courtyard significantly improved compared to the baseline model. Energy efficiency increased by 32.3%, the physiological equivalent temperature (PET) comfort time ratio in winter was enhanced by 8.3%, and the ratio in summer increased by 3.8%. During the data-driven phase, the classification prediction accuracy of courtyard performance can reach 83%, and the F1 score is 0.81. In the project validation phase, it has also been proven that the performance of different plans can be quickly verified. Compared to the base’s original status, the design solutions’ performance score can be improved from 59.12 to 85.62. In summary, this workflow improves the efficiency of the interaction between design decisions and performance evaluation in the conceptual stage of village planning, providing a solid foundation for promoting subsequent solutions.

1. Introduction

With the advancement of globalization, the world is confronting many challenges, including the energy crisis, ecological degradation, and climate change [1]. These issues are particularly pressing within the building industry, which consumes approximately 40% of the total primary energy in the United States and the European Union [2]. China is similarly affected, grappling with rapid urbanization since the reform and opening-up period [3,4,5], which has dramatically transformed the nation quickly. This rapid development has brought significant challenges to the construction and sustainability of traditional village communities. Urbanization should not be confused with transforming rural areas into urban centers. Planning and designing villages from the perspective of climate adaptability provides a new perspective for addressing these challenges. Related research primarily focuses on subtropical and temperate regions, emphasizing improvements in building energy consumption and courtyard comfort [6,7,8]. However, studies in cold areas are limited. Moreover, in practical planning, many designs prioritize short-term economic benefits, often neglecting traditional courtyard structures, local climate conditions, and energy-saving considerations. Specialized professionals typically address passive design and energy-saving strategies only after the planning and design stages are completed. Consequently, performance evaluation and optimization are disconnected from the design process and often become superficial.
This article addresses these research gaps by studying traditional villages in Shandong Province, a cold region in China. It explores the potential of integrating performance evaluation methods into the initial design stages. This design workflow is more efficient and cost-effective than adjusting later to meet energy-saving regulations. Additionally, leveraging machine learning enables designers to receive rapid feedback on performance assessments, allowing timely adjustments during the early design phases.

1.1. Previous Studies on Energy Consumption and Comfort in Traditional Villages of Cold Regions

In terms of building energy efficiency, the comfort of traditional villages is influenced by climate conditions, infrastructure development, and residents’ living standards. Most rural housing lacks insulation, with over half of the structures made from fired clay bricks or concrete hollow blocks [9]. A study in northern China’s cold regions found that 34.6% of rural households had no insulation measures, and only 16.5% insulated all their rooms [10]. The absence of insulation materials leads to higher energy consumption costs. Scholars have proposed measures to enhance energy efficiency, focusing on planning spatial structures, insulating exterior structures, and utilizing new energy sources. Jin and Ling proposed an external wall structure for rural houses in extremely cold regions designed for lifelong climate adaptability [11]. Zhu et al. introduced a multi-objective optimization system for rural dwellings, emphasizing indoor comfort, natural sunlight utilization, and energy efficiency [12]. Liu et al. explored passive solar energy utilization in Qinghai’s rural residential areas [13]. Wang et al. investigated the concept of thermal buffer spaces for houses in extremely cold regions [14], developing a window incorporating phase change material to improve heat storage performance [15]. These approaches have significantly advanced rural housing in cold regions.
Regarding courtyard comfort, current research often analyzes the relationship between comfort and factors such as the height-to-width ratio, sky view factor (SVF), and orientation from a spatial geometry perspective. Evaluation indicators include thermal comfort indices such as PET, SET, and PMV, as well as common meteorological indicators like mean radiant temperature (MRT), black globe temperature, and operative temperature. In cold climate regions, the academic consensus generally holds that lower height-to-width ratios allow winter solar radiation to reach the interior wall surfaces of courtyard spaces at a lower elevation angle [16]. In addition to the height-to-width ratio, the horizontal aspect ratio can also influence heat gain in courtyards during the summer and winter. Research indicates that north-south courtyards meet the comfort requirements of most climate zones [17,18]. The optimal orientation depends on the amount of solar radiation the building can receive and the extent to which it needs to be blocked. Deng Q.T. believes that a north-south orientation with a deviation within 15 degrees can meet the needs of sunlight and building heating energy consumption [19]. As for SVF, its value represents the degree of enclosure of outdoor space; a lower value means less radiation received during the day and correspondingly lower temperatures. Chatzipoulka demonstrated a linear relationship between sky visibility factors and solar radiation [20].
In summary, the research on courtyard energy consumption and comfort shows that energy consumption studies often focus on the thermal performance of indoor materials and structures, with a more microscopic analysis scale, primarily related to structural and HVAC (Heating, Ventilation, and Air Conditioning) fields. On the other hand, comfort studies mainly focus on outdoor environments, analyzing the relationship between spatial geometry and comfort indicators and rarely linking energy consumption with indoor and outdoor comfort. Based on this, this paper starts with the scale of courtyards, combining indoor and outdoor comfort with building energy consumption. Indoors, it focuses on illuminance, while outdoors, it emphasizes thermal comfort in both summer and winter. The study explores the relationship between the spatial form of courtyard houses and these performance indicators. From the perspective of enabling planners to assess the performance of designs quickly, it researches the climate adaptability of village courtyards.

1.2. Introduction to Performance and Data-Driven Design

Building performance optimization and prediction studies are critical in the early design stages. The core of these studies is based on two essential design methods: performance-driven design and data-driven design [21]. They emphasize different design focuses and methods:
Performance-driven Design: The term “performance” refers to the ability of something to complete a specific task. David Leatherbarrow interprets architecture as events and behaviors, proposing the concept of performance in architecture, believing that such events constantly change in space and time [22]. The origins of performance-driven design can be traced back to the functionalist and rationalist design trends of the 1960s. These trends developed functional or symbolic culture-oriented architectural design methods, forming the early performance-based design paradigm. In the early 1970s, under the influence of functionalism and rationalism, Negroponte proposed in “Architecture Machine” that performance is the core of architectural design, advocating improvement through performance simulation and optimization [23]. The environmental performance of buildings promotes the research and development of performance-based design methods and tools. Although some technological advancements have caused ecological concerns, they also offer solutions to these problems. In this context, Europe and the United States have gradually recognized the performance-driven design paradigm. The core concept of this method is to integrate advanced tools and thinking into the traditional design process, promoting high collaboration and cross-disciplinary cooperation in the early design stages. In recent years, many studies have started using simulation tools such as Envi-met 5.5.1 [24], Phoenics 2019 [25], and Fluent 2022 [26], along with the rapid development of computer simulation technology, to conduct quantitative analyses of the wind-thermal environment. However, this software has certain limitations. From the perspective of performance target integration, these tools generally analyze a single performance target and lack convenient real-time interaction and debugging capabilities with modeling software. They are unable to dynamically generate solutions in real-time. To address these shortcomings, parametric platforms and plugins, notably Grasshopper (GH) and the Wallacei_X plugin [27,28], have been gradually introduced into microclimate simulation. This method combines computer modeling, parametric design, performance simulation, and optimization algorithms to perform automatic optimization and program iteration. It effectively mitigates the drawbacks of traditional simulation optimization methods, such as excessive adjustments and low efficiency.
Data-driven Design: This method relies on big data and information technology to guide architectural design decisions by analyzing and utilizing data. In the early 21st century, research on data-driven technology in architecture first surfaced. In architectural practice, relevant application results have begun to take shape. In 2004, Reynolds used remote system monitoring combined with audience behavior data to optimize the stadium’s structural performance, marking the beginning of data-oriented architectural design [29]. In 2007, the Bouyer Julien team used an interactive outdoor environment testing platform and combined experimental data with wind tunnel experiments to establish a thermal comfort evaluation and prediction model for the semi-outdoor space of the stadium [30]. As the architectural community pays increasing attention to performance-driven design, the continuous advancement of data-based methods and structural systems has gradually triggered changes in architectural space. The optimal form can be derived through simulation calculations to maximize the building’s performance requirements. For example, the R&D headquarters of the Korean company Kolon, designed by Thom Mayne and Morphosis Architects in 2013, used a parametrically designed shading system to balance shading and viewing angles through data calculations. Existing data-driven designs rely heavily on machine learning models. In terms of specific algorithm selection, taking the Kaggle data modeling and analysis competition platform as an example, the current mainstream machine learning algorithms are divided into Tree-based models and Neural Networks. In addition to Scikit-learn as a comprehensive application platform, TensorFlow 2.0 and Keras 2 are popular for Neural Networks, especially when combined with deep learning [31]. XGBoost 2.0, based on Tree-based models, ranks fourth, with usage roughly the same as in 2020 and 2019. Tree-based models are used to solve problems where structured data is available, while Neural Networks and deep learning are often used for perceptual problems such as image classification [32]. In recent years, research on data-driven approaches has primarily focused on predicting energy consumption and enhancing comfort in various buildings and open spaces. Notable studies include optimizing HVAC system energy consumption using artificial neural networks and multi-objective genetic algorithms [33], analyzing thermal comfort [34,35], and employing soft computing methods to predict thermal sensation [36].
Performance-driven and data-driven designs are generally not mutually exclusive but can be used together [37]. By combining performance goals with data analytics, design teams can more fully understand building system performance and implement effective design strategies. Combining these two methods helps create more efficient, comfortable, and sustainable buildings.

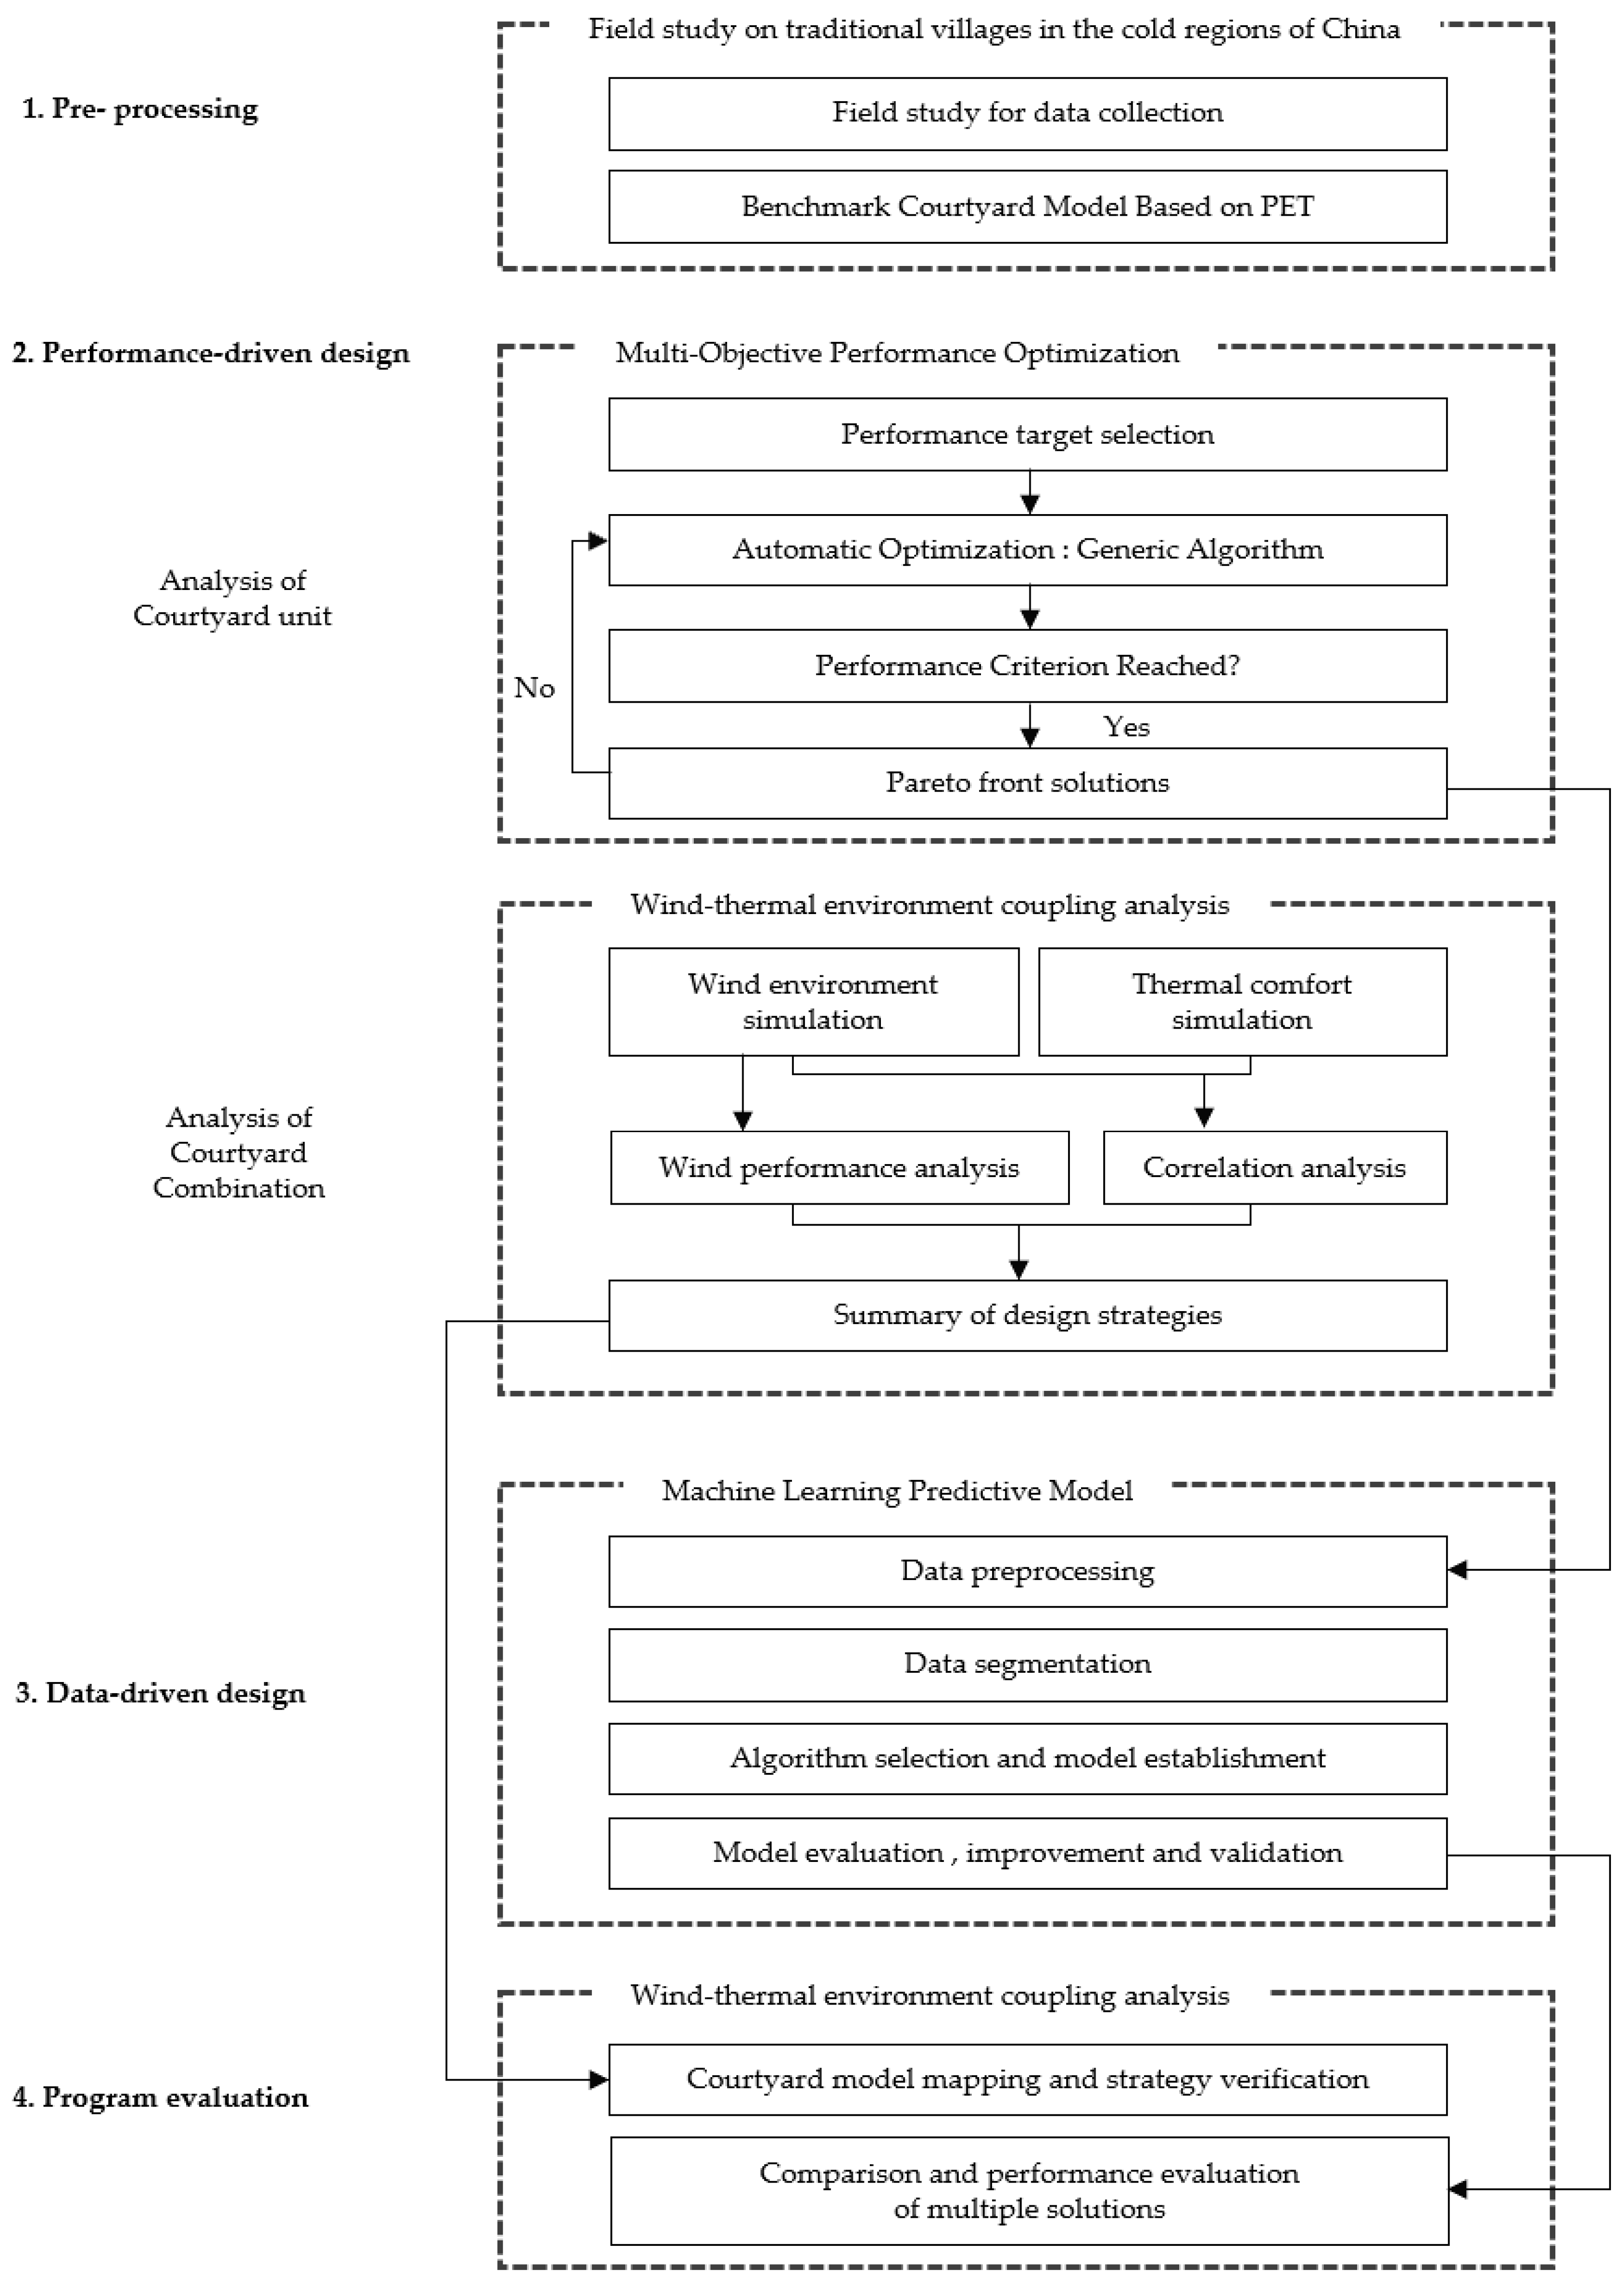
1.3. Overview Workflow

Academic research on the layout of traditional village courtyards mostly adopts a performance-driven perspective, making timely adjustments to courtyard layouts by judging outdoor multi-objective performance. However, this method is highly subjective and limited by high time costs. To address the shortcomings above, this paper constructs a data- and performance-driven workflow (Figure 1) for evaluating courtyard performance in the early design stages. The workflow is divided into three phases:
(1)
Pre-processing: A baseline courtyard model is selected based on the simulation and ranking of PET values for various courtyard types.
(2)
Performance-driven design: This stage consists of two parts: analysis of courtyard units and courtyard combinations. The former involves detailed adjustments to the baseline courtyard model through performance-based multi-objective optimization, generating a dataset for the next stage’s machine learning. The latter extracts design strategies for courtyard combinations from the perspective of wind efficiency based on a correlation analysis of wind and thermal environments. Together, these form the courtyard design strategies.
(3)
Data-driven design: The dataset from the courtyard unit analysis is input into the Sci-kit learn 1.3 software and trained using the XGBoost algorithm to develop a predictive model for courtyard performance.
(4)
Program evaluation: The baseline model and design strategies from the previous steps are applied to the project design, generating multiple plans based on design requirements. The parameter information of each scheme is then input into the algorithm model obtained in the third step for performance evaluation, allowing the selection of the optimal scheme in terms of performance.
The innovations of this research include: (1) Research scope: Unlike traditional analyses focusing only on courtyard or building units, this study encompasses both courtyard units and courtyard combinations, offering a broader scope; (2) Selection of performance indicators: This study combines indoor and outdoor considerations and incorporates building energy consumption; (3) Development of a performance-based multi-objective optimization workflow: By integrating machine learning algorithms, this workflow can be applied in the early design stages, providing a more comprehensive analysis with relatively lower time costs compared to traditional performance optimization designs.

2. Pre-Processing: Study Areas and Data Sources

2.1. Field Study of Traditional Villages in Cold Regions of China
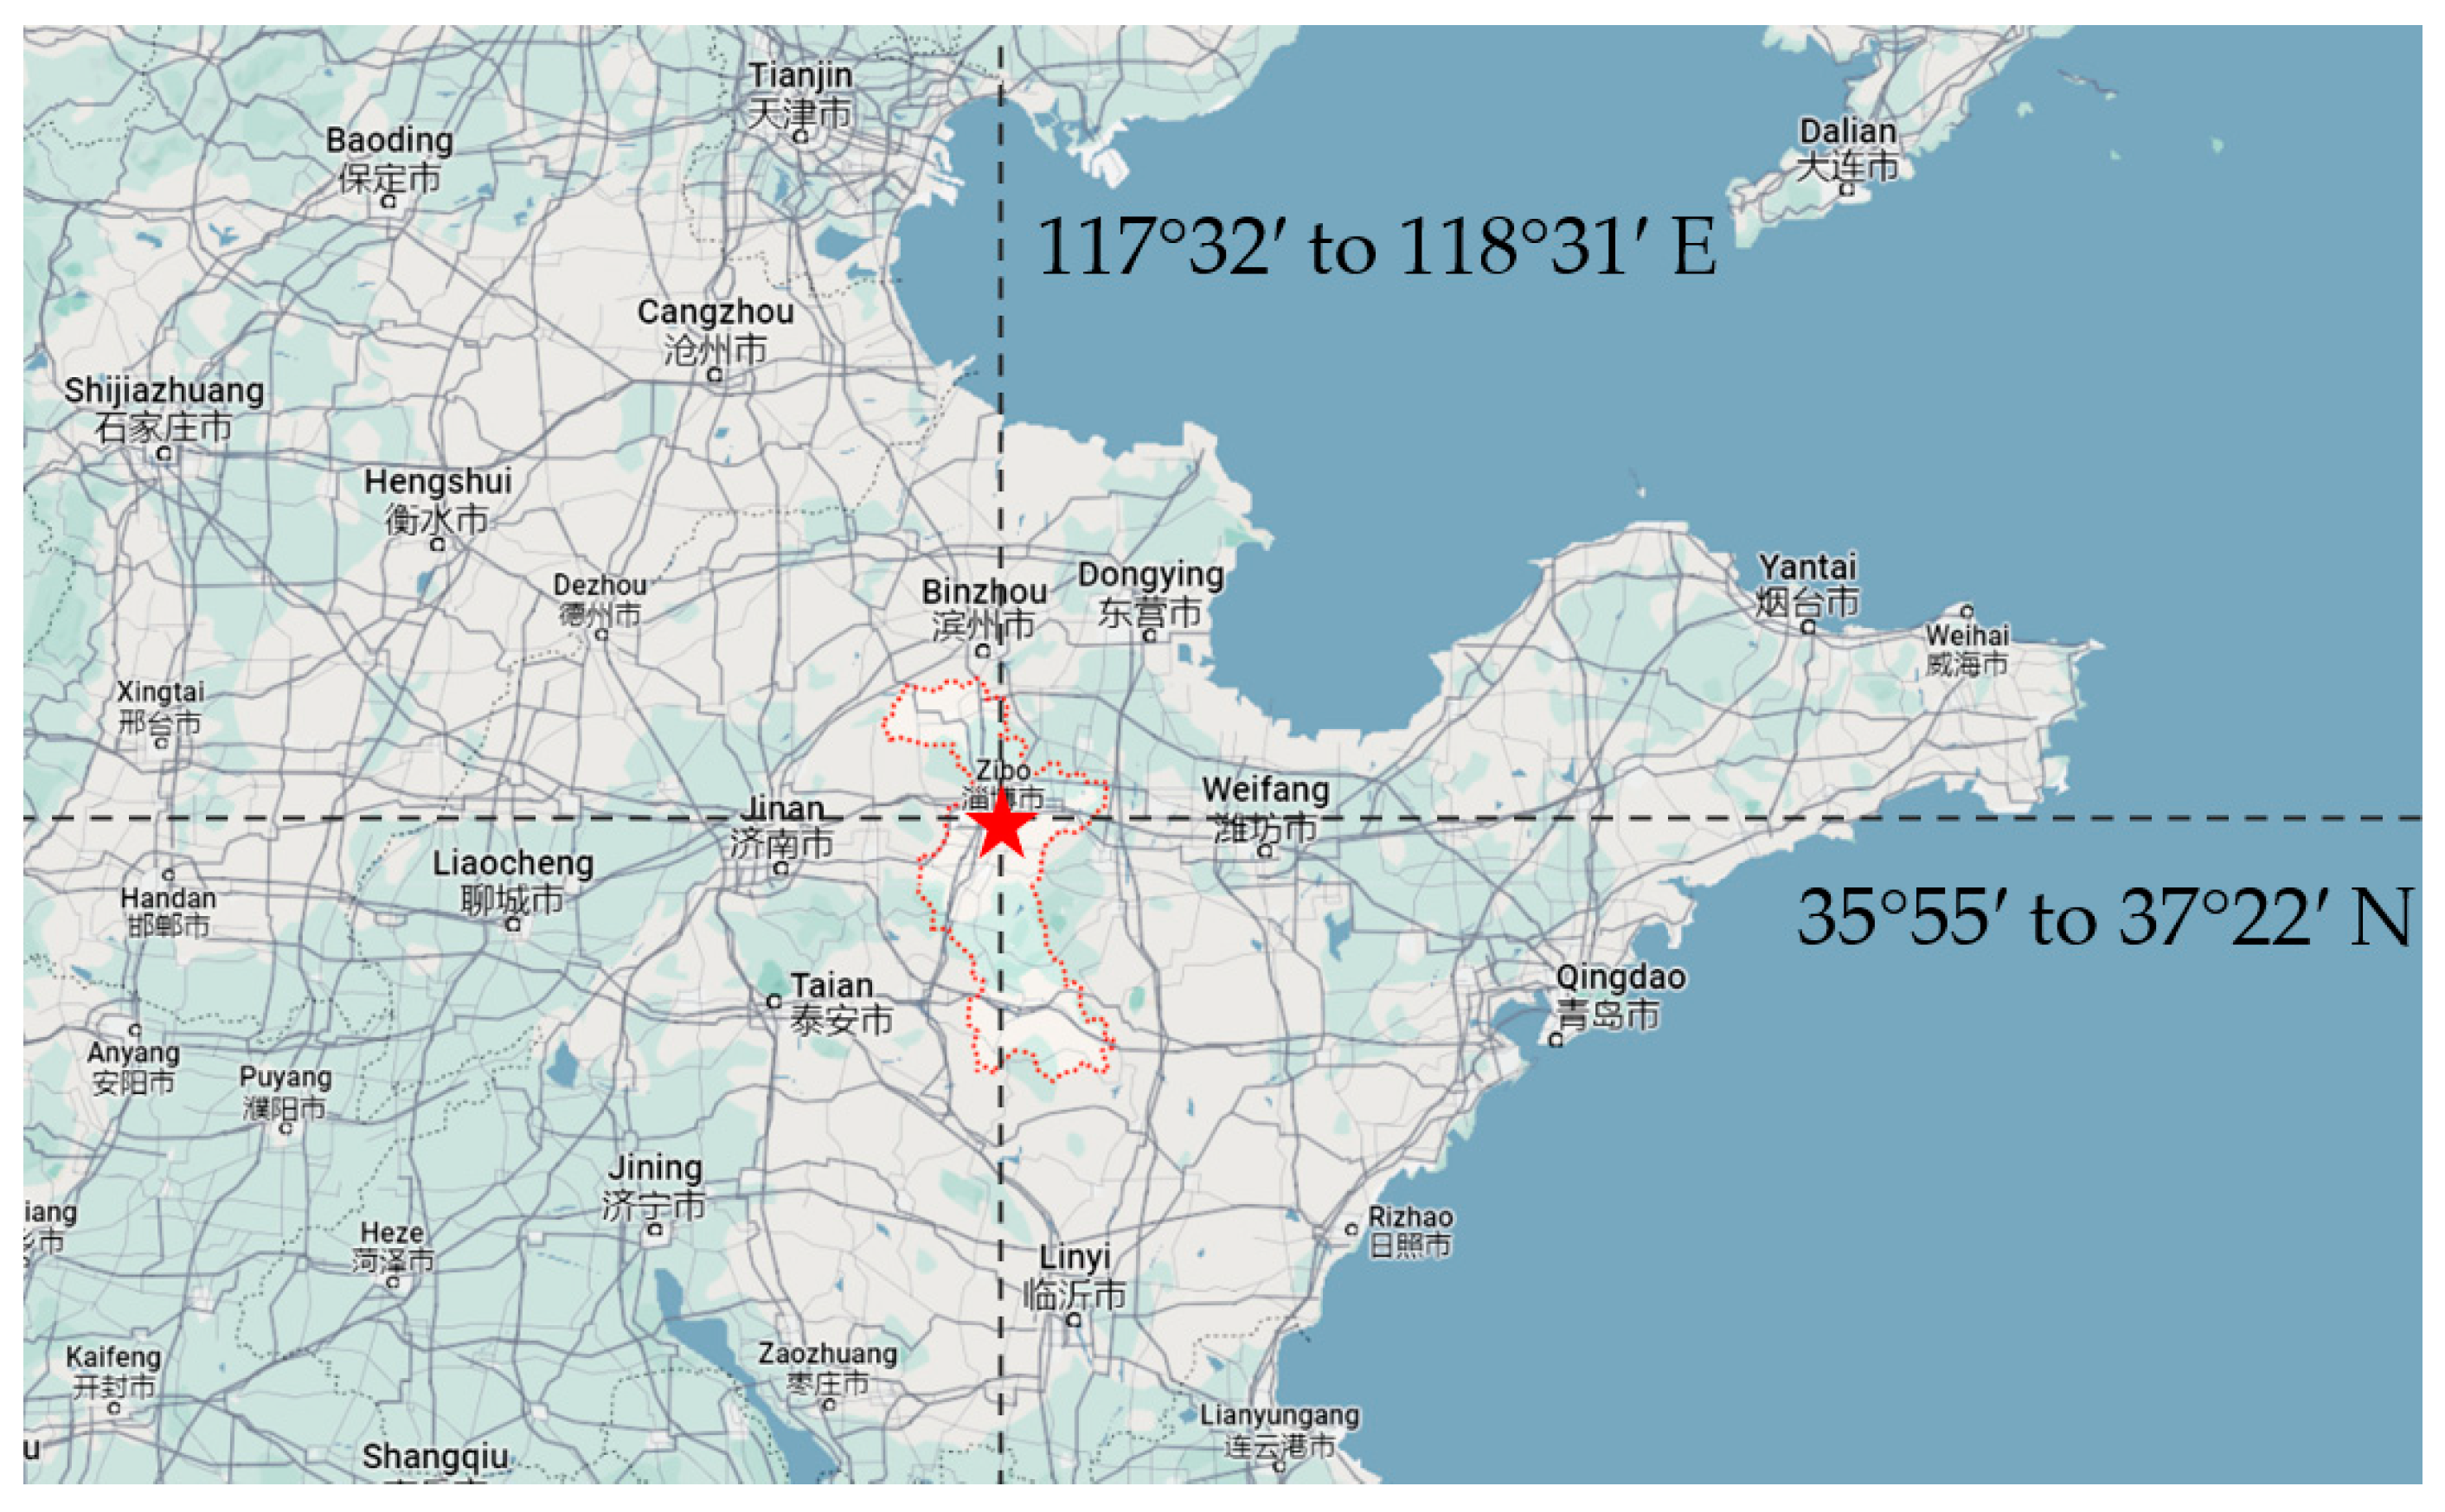
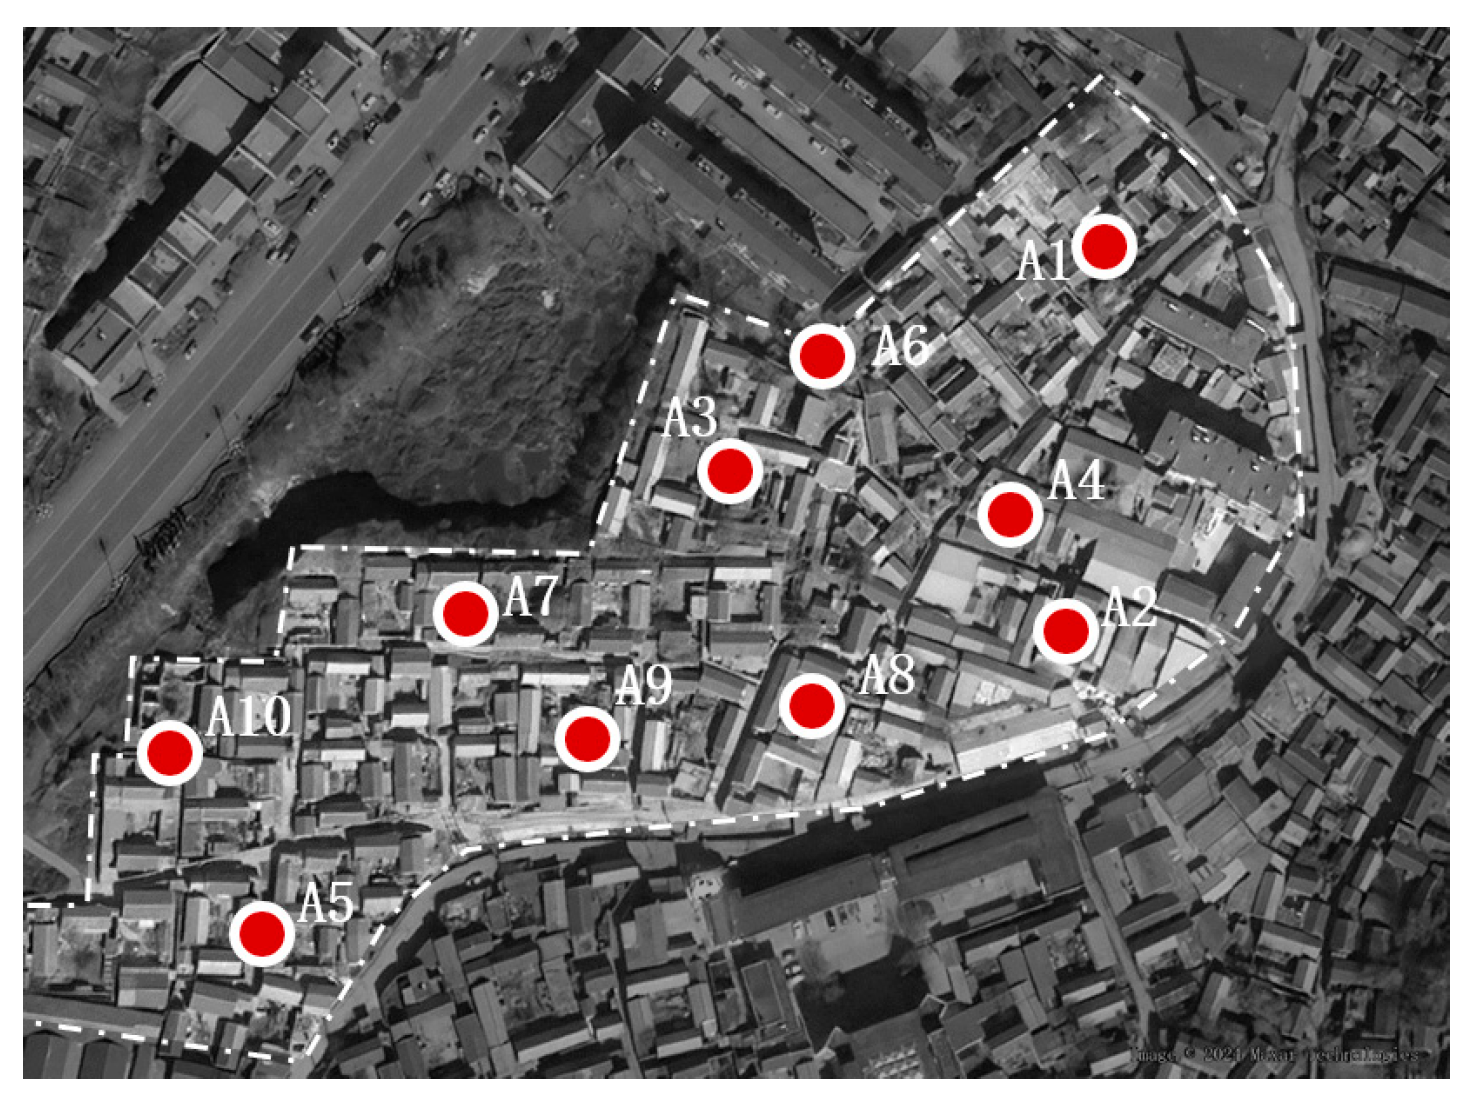
2.1.1. Study Areas

The study area is located in Zibo City, Shandong Province, a representative of cold-climate cities in northern China. Situated between 35°55′ to 37°22′ N latitude and 117°32′ to 118°31′ E longitude (Figure 2), Zibo City falls within the temperate monsoon climate zone, characterized by distinct seasons and significant monsoon influences. This study selects a traditional village in Zibo city as the research object. It is located near the city outskirts, with urban residential areas to the west and east and traditional villages to the south. This situation reflects the current state of many villages adjacent to urban edges against the backdrop of urbanization. These villages face two development possibilities: being assimilated by the city, risking the demolition of houses within the site, or undergoing protective development while preserving the existing village structure. This can be achieved through functional replacement, street renovation, and partial development to transform the original village. Due to space limitations, this article will simplify the preliminary design strategies related to the village’s historical context and relationship with the city. Instead, the focus will be on how the design workflow integrates performance optimization and machine learning into the design process.

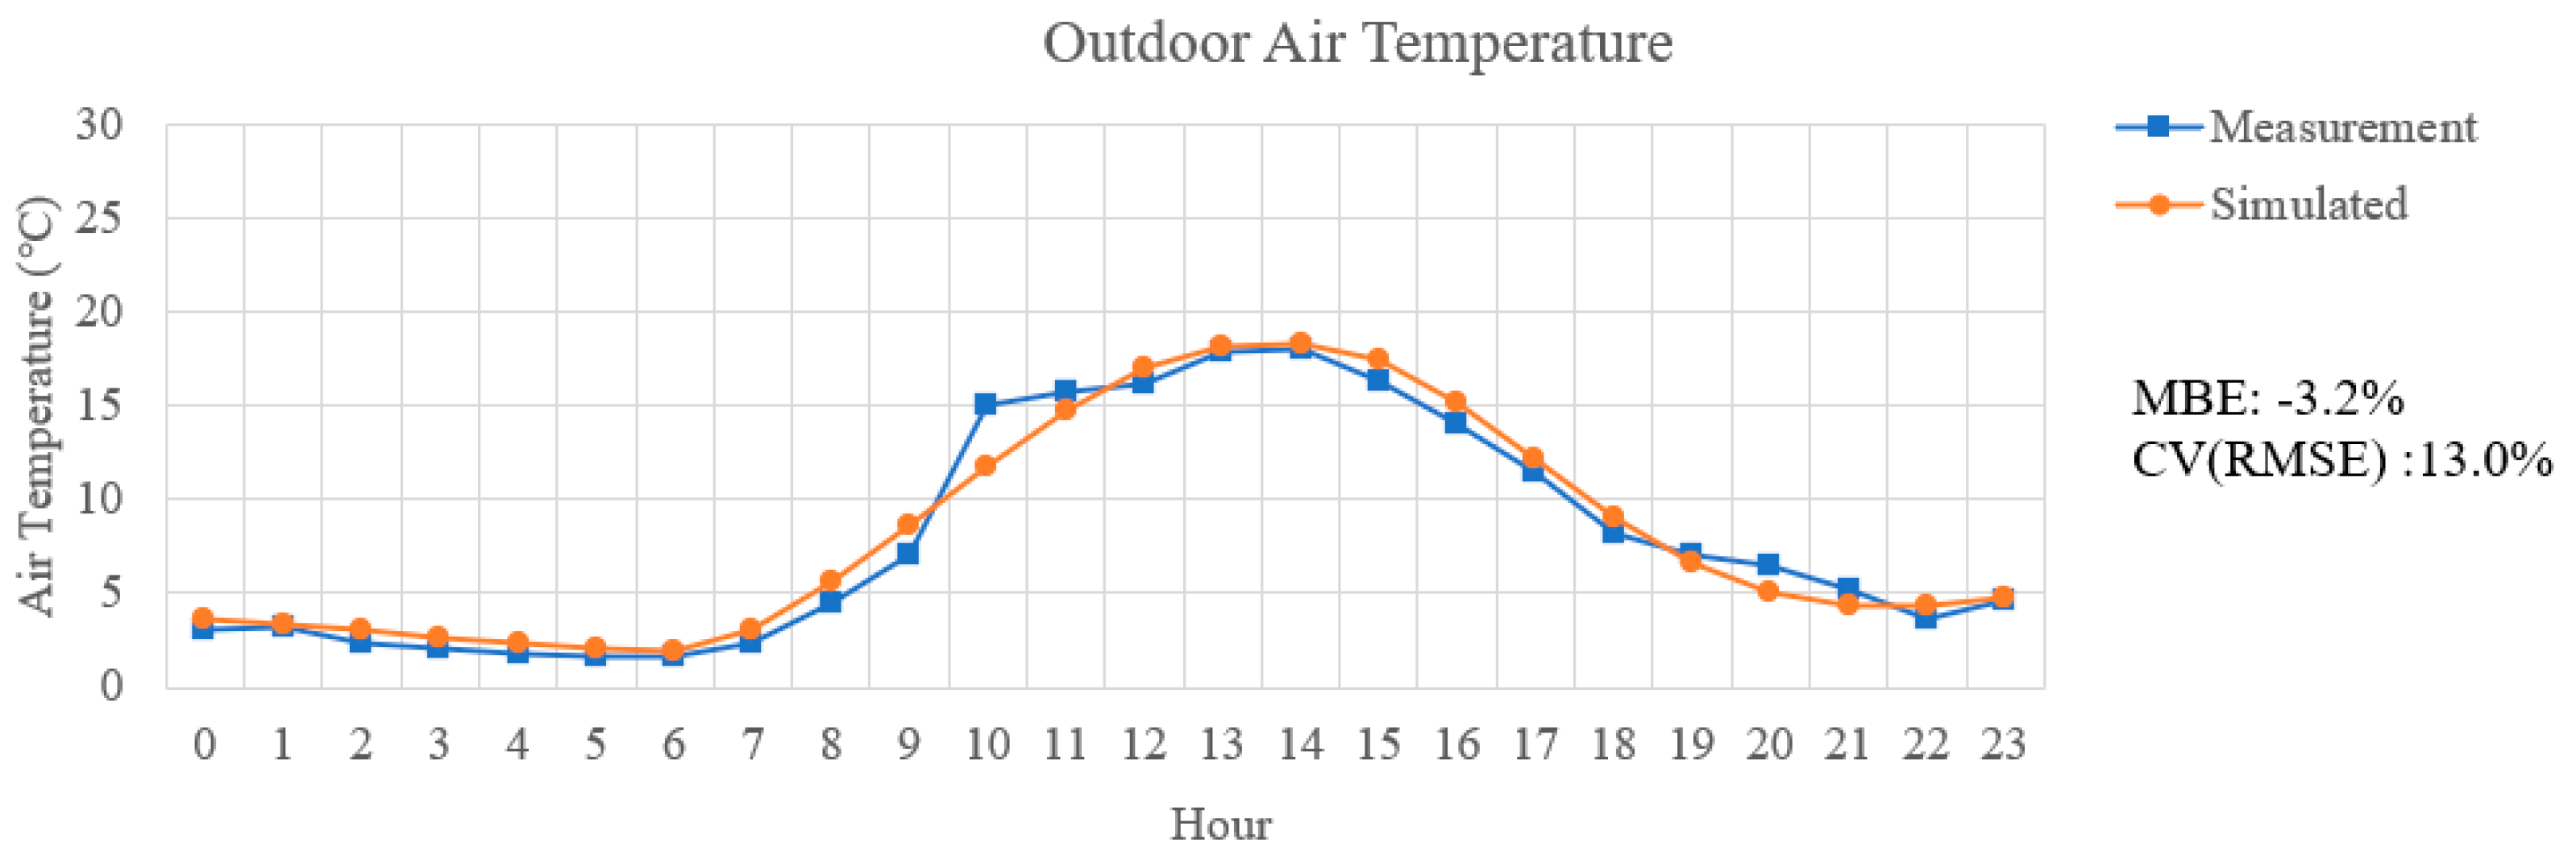
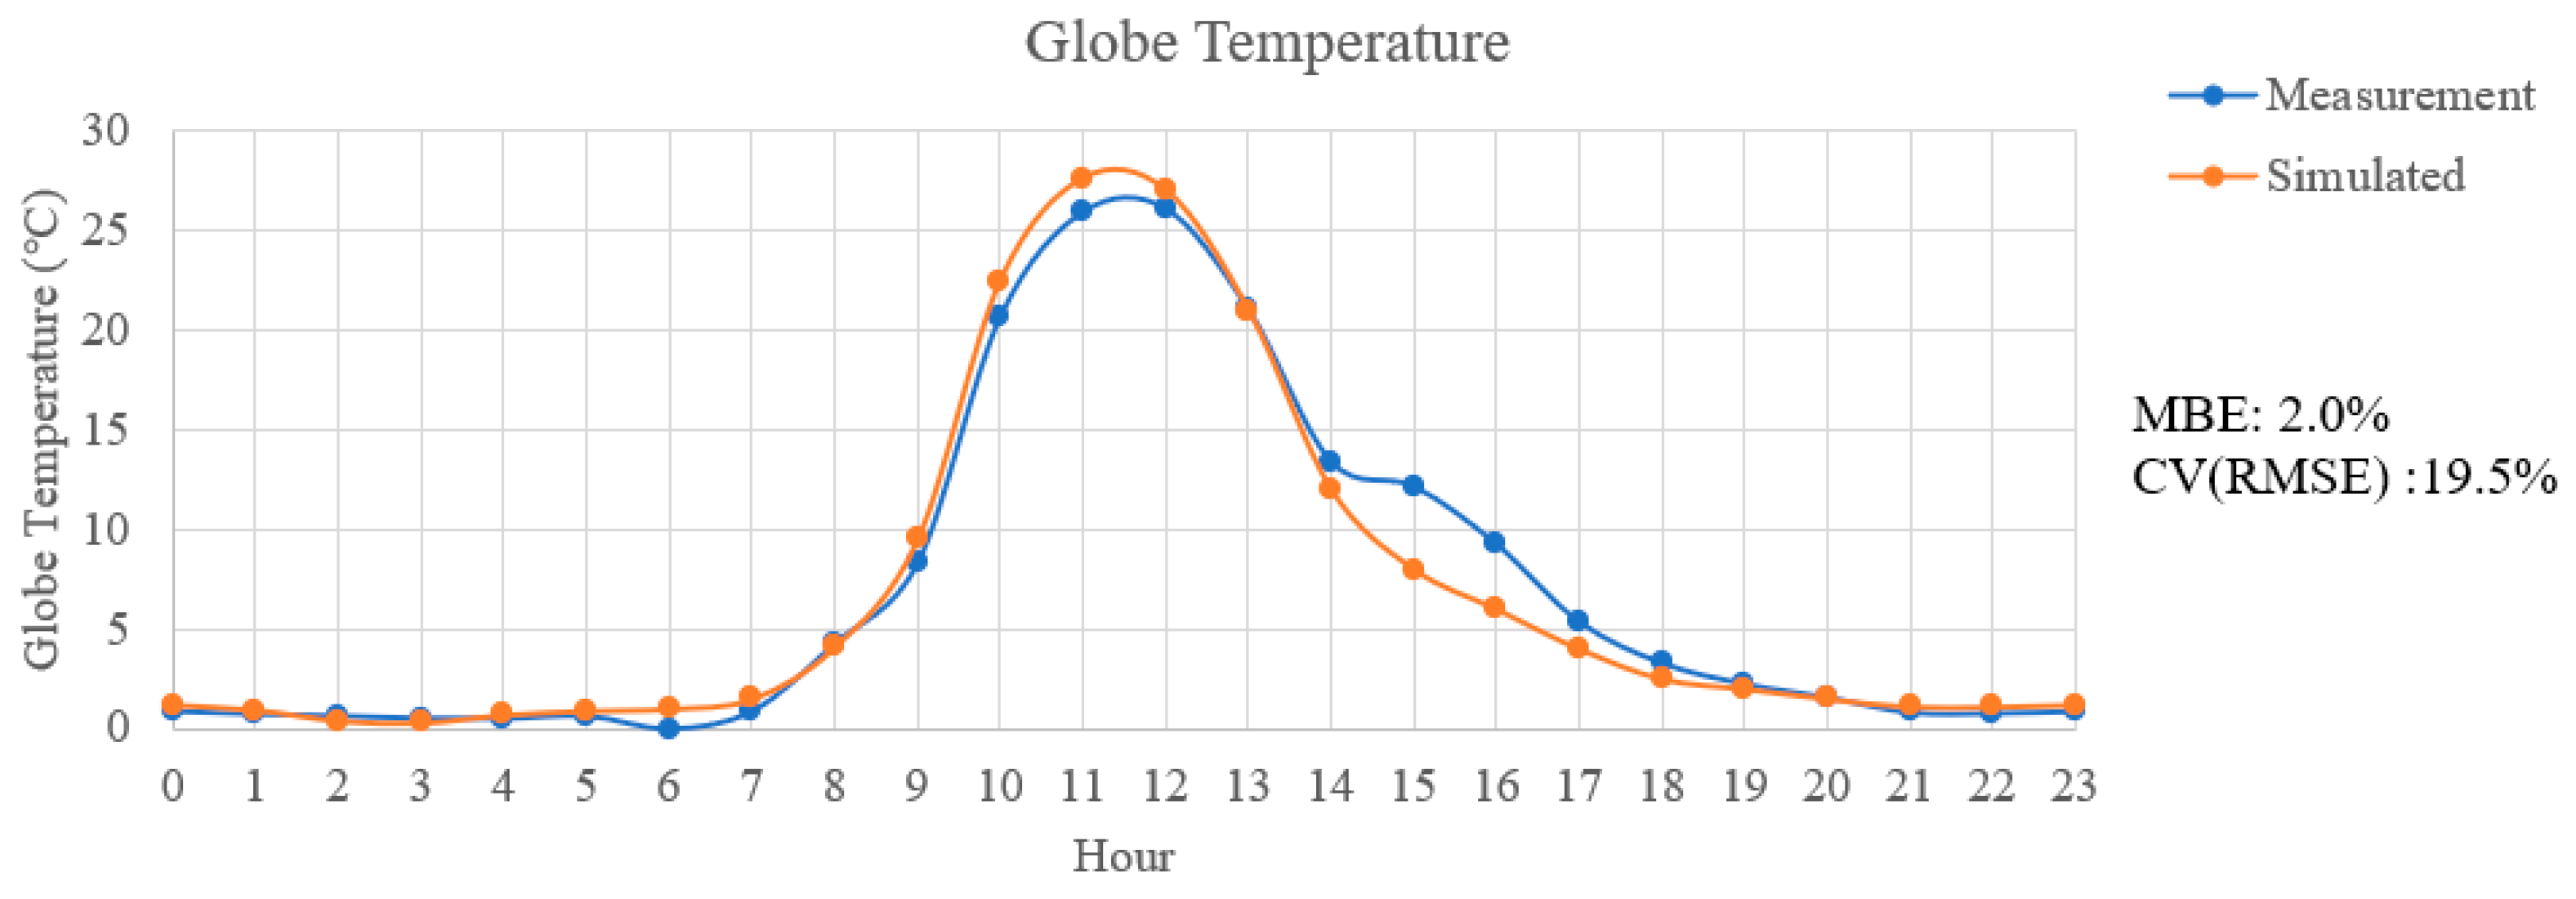
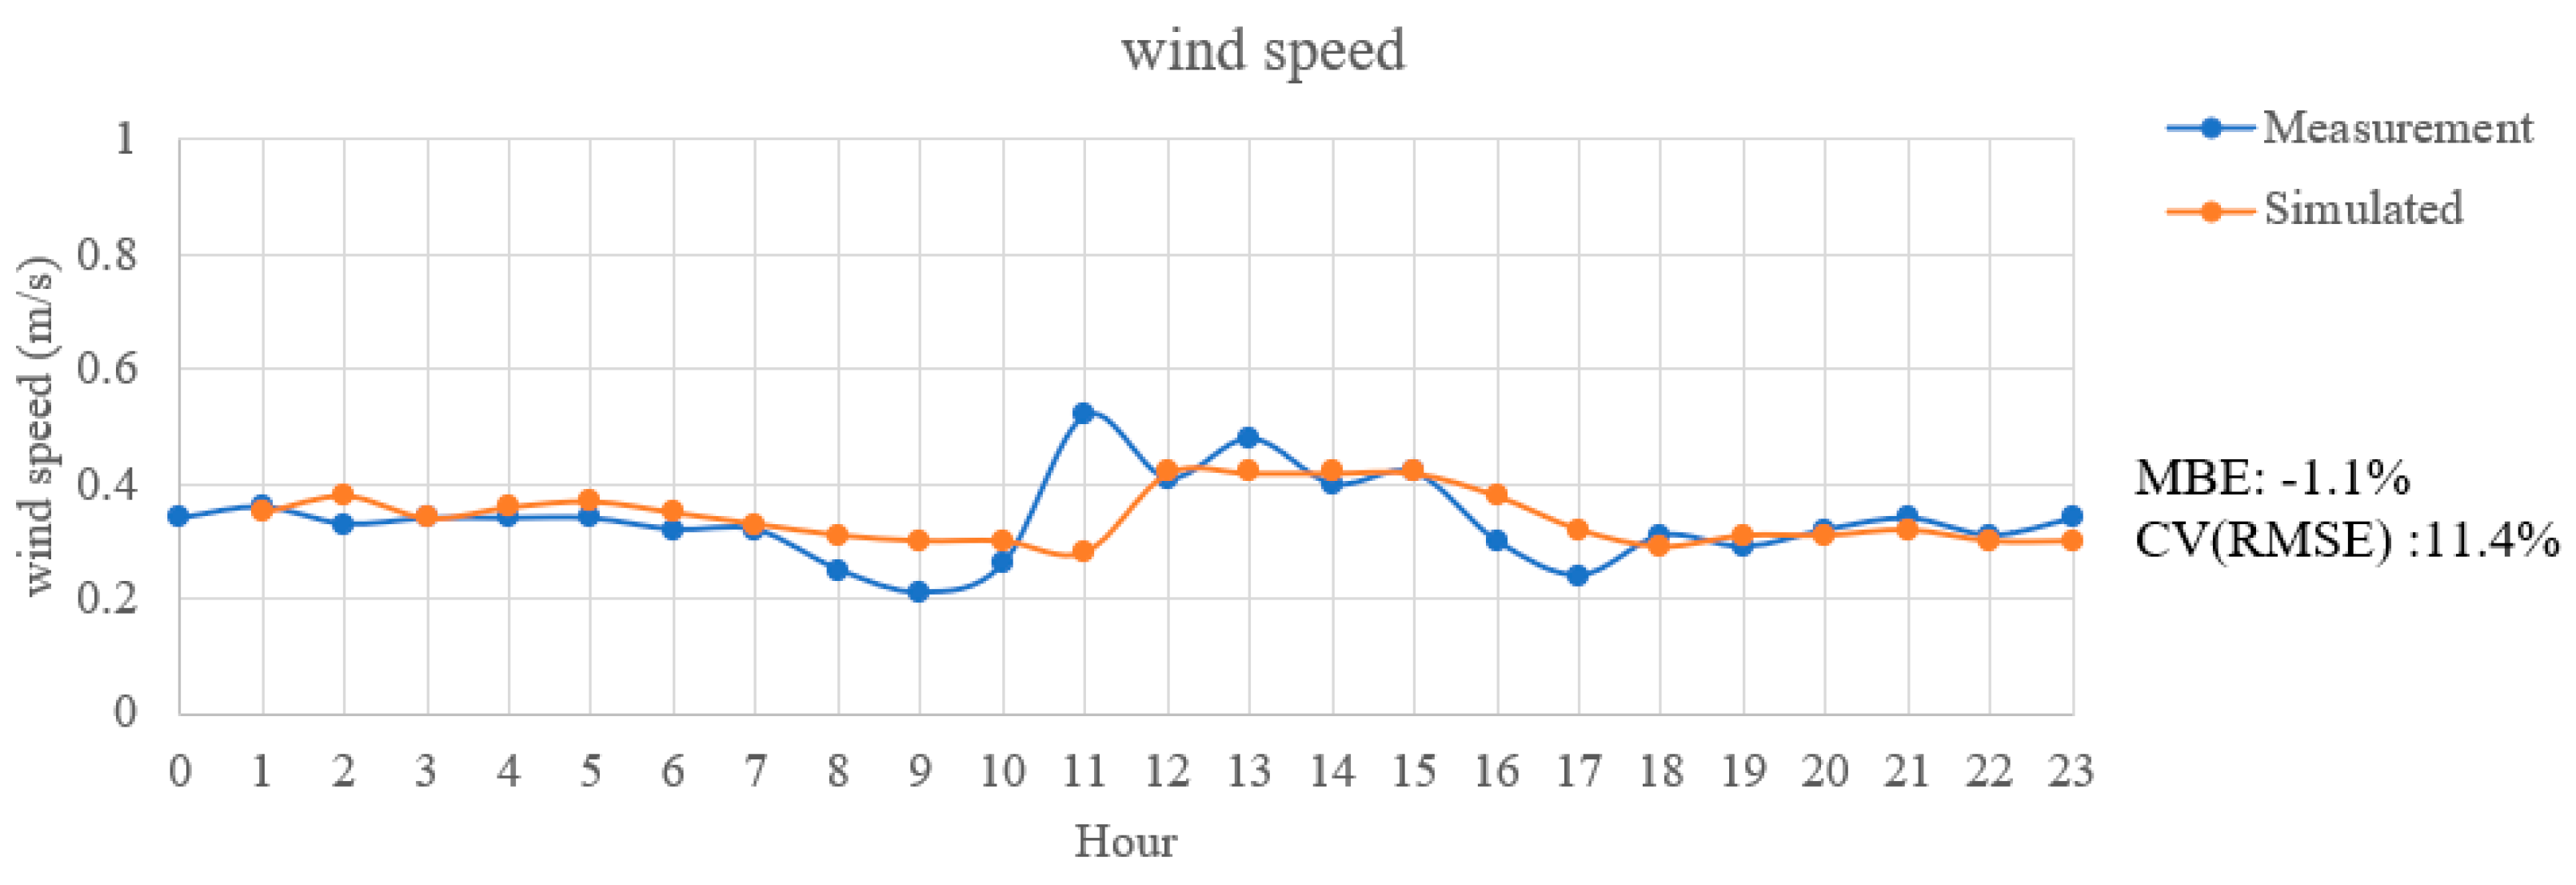
2.1.2. Microclimate Measurement and Validation

Considering that the subsequent simulation of comfort involves the outdoor environment, it is necessary to verify the accuracy of meteorological elements. For the indoor environment simulation, only indoor illuminance is considered, which is more closely related to the window-to-wall ratio. Therefore, indoor meteorological elements are not verified. Additionally, in the verification of the accuracy of building energy consumption, since this study focuses on comparing the performance of different schemes in the initial stage of the project rather than obtaining a specific value and the analysis environment is based on ideal loads, the simulated energy consumption is not compared with actual energy consumption. The analysis process is as follows.
The selected points for microclimate measurement are shown in Figure 3 and are evenly distributed throughout the site to ensure the representativeness of the test results. To ensure the validity of subsequent climate simulation data, this paper collected local meteorological data and compared and verified them with the simulation data. The data were collected using Kestrel NK-5400 instruments (Kestrel Instruments, Delaware, PA, USA) (Figure 4). The NK-5400 was used to collect microclimate data inside the village, including air temperature, relative humidity, wind speed, wind direction, and black globe temperature. The recording interval was 20 s, with measurements taken at a height of 1.5 m from the ground. Simulation data was obtained from nearby weather stations. Considering the impact of mountainous meteorological factors, the Dragonfly plug-in in Ladybug Tools 1.7.0 was used to correct the EPW file before utilizing the data. Due to the impact of the COVID-19 pandemic, after communication with the local residential committee, all measurements were taken over three consecutive days from 23 to 25 October 2022, with an accuracy of ±1 °C. The measured data is averaged by hour. To evaluate the accuracy of the simulation results, mean bias error (MBE) and the cumulative change in the root mean square error (CV(RMSE)) were used. The calculations of MBE and CV(RMSE) are specifically demonstrated in Equations (1) and (2). In Equation (1), Mi represents the i-th measured value, and Si represents the i-th simulated value. The numerator is the sum of the differences between the measured and simulated values, while the denominator is the sum of the measured values. MBE is obtained by dividing the total error by the total measured value. In Equation (2), the numerator first calculates the sum of the squared errors and then divides it by the number of data points (24 h) to obtain the mean squared error (MSE). The denominator is the average of the measured values. Finally, the square root of the mean squared error is divided by the average of the actual values to obtain CV(RMSE). As shown in Figure 5, Figure 6, Figure 7 and Figure 8, the accuracy of the simulations for outdoor air temperature, globe temperature, relative humidity, and wind speed has been validated. The results indicate that the MBE and CV(RMSE) values for each prediction are within the 5% and 20% range, meeting the standards of ASHRAE Guideline 14, IPMVP (International Performance Measurement and Verification Protocol), and FEMP (U.S. Federal Energy Management Program). This demonstrates that the energy model is reliable for subsequent indoor and outdoor environmental simulations. Regarding wind direction, due to the numerous real-time influencing factors and the difficulty of adjusting wind direction data in meteorological files, subsequent simulation analyses will directly use the measured direction data as input for the software simulation (Table 1).
M B E = i = 1 24 M i S i i = 1 24 M i
C V R M S E = i = 1 24 M i S i 2 / 24 i = 1 24 M i / 24

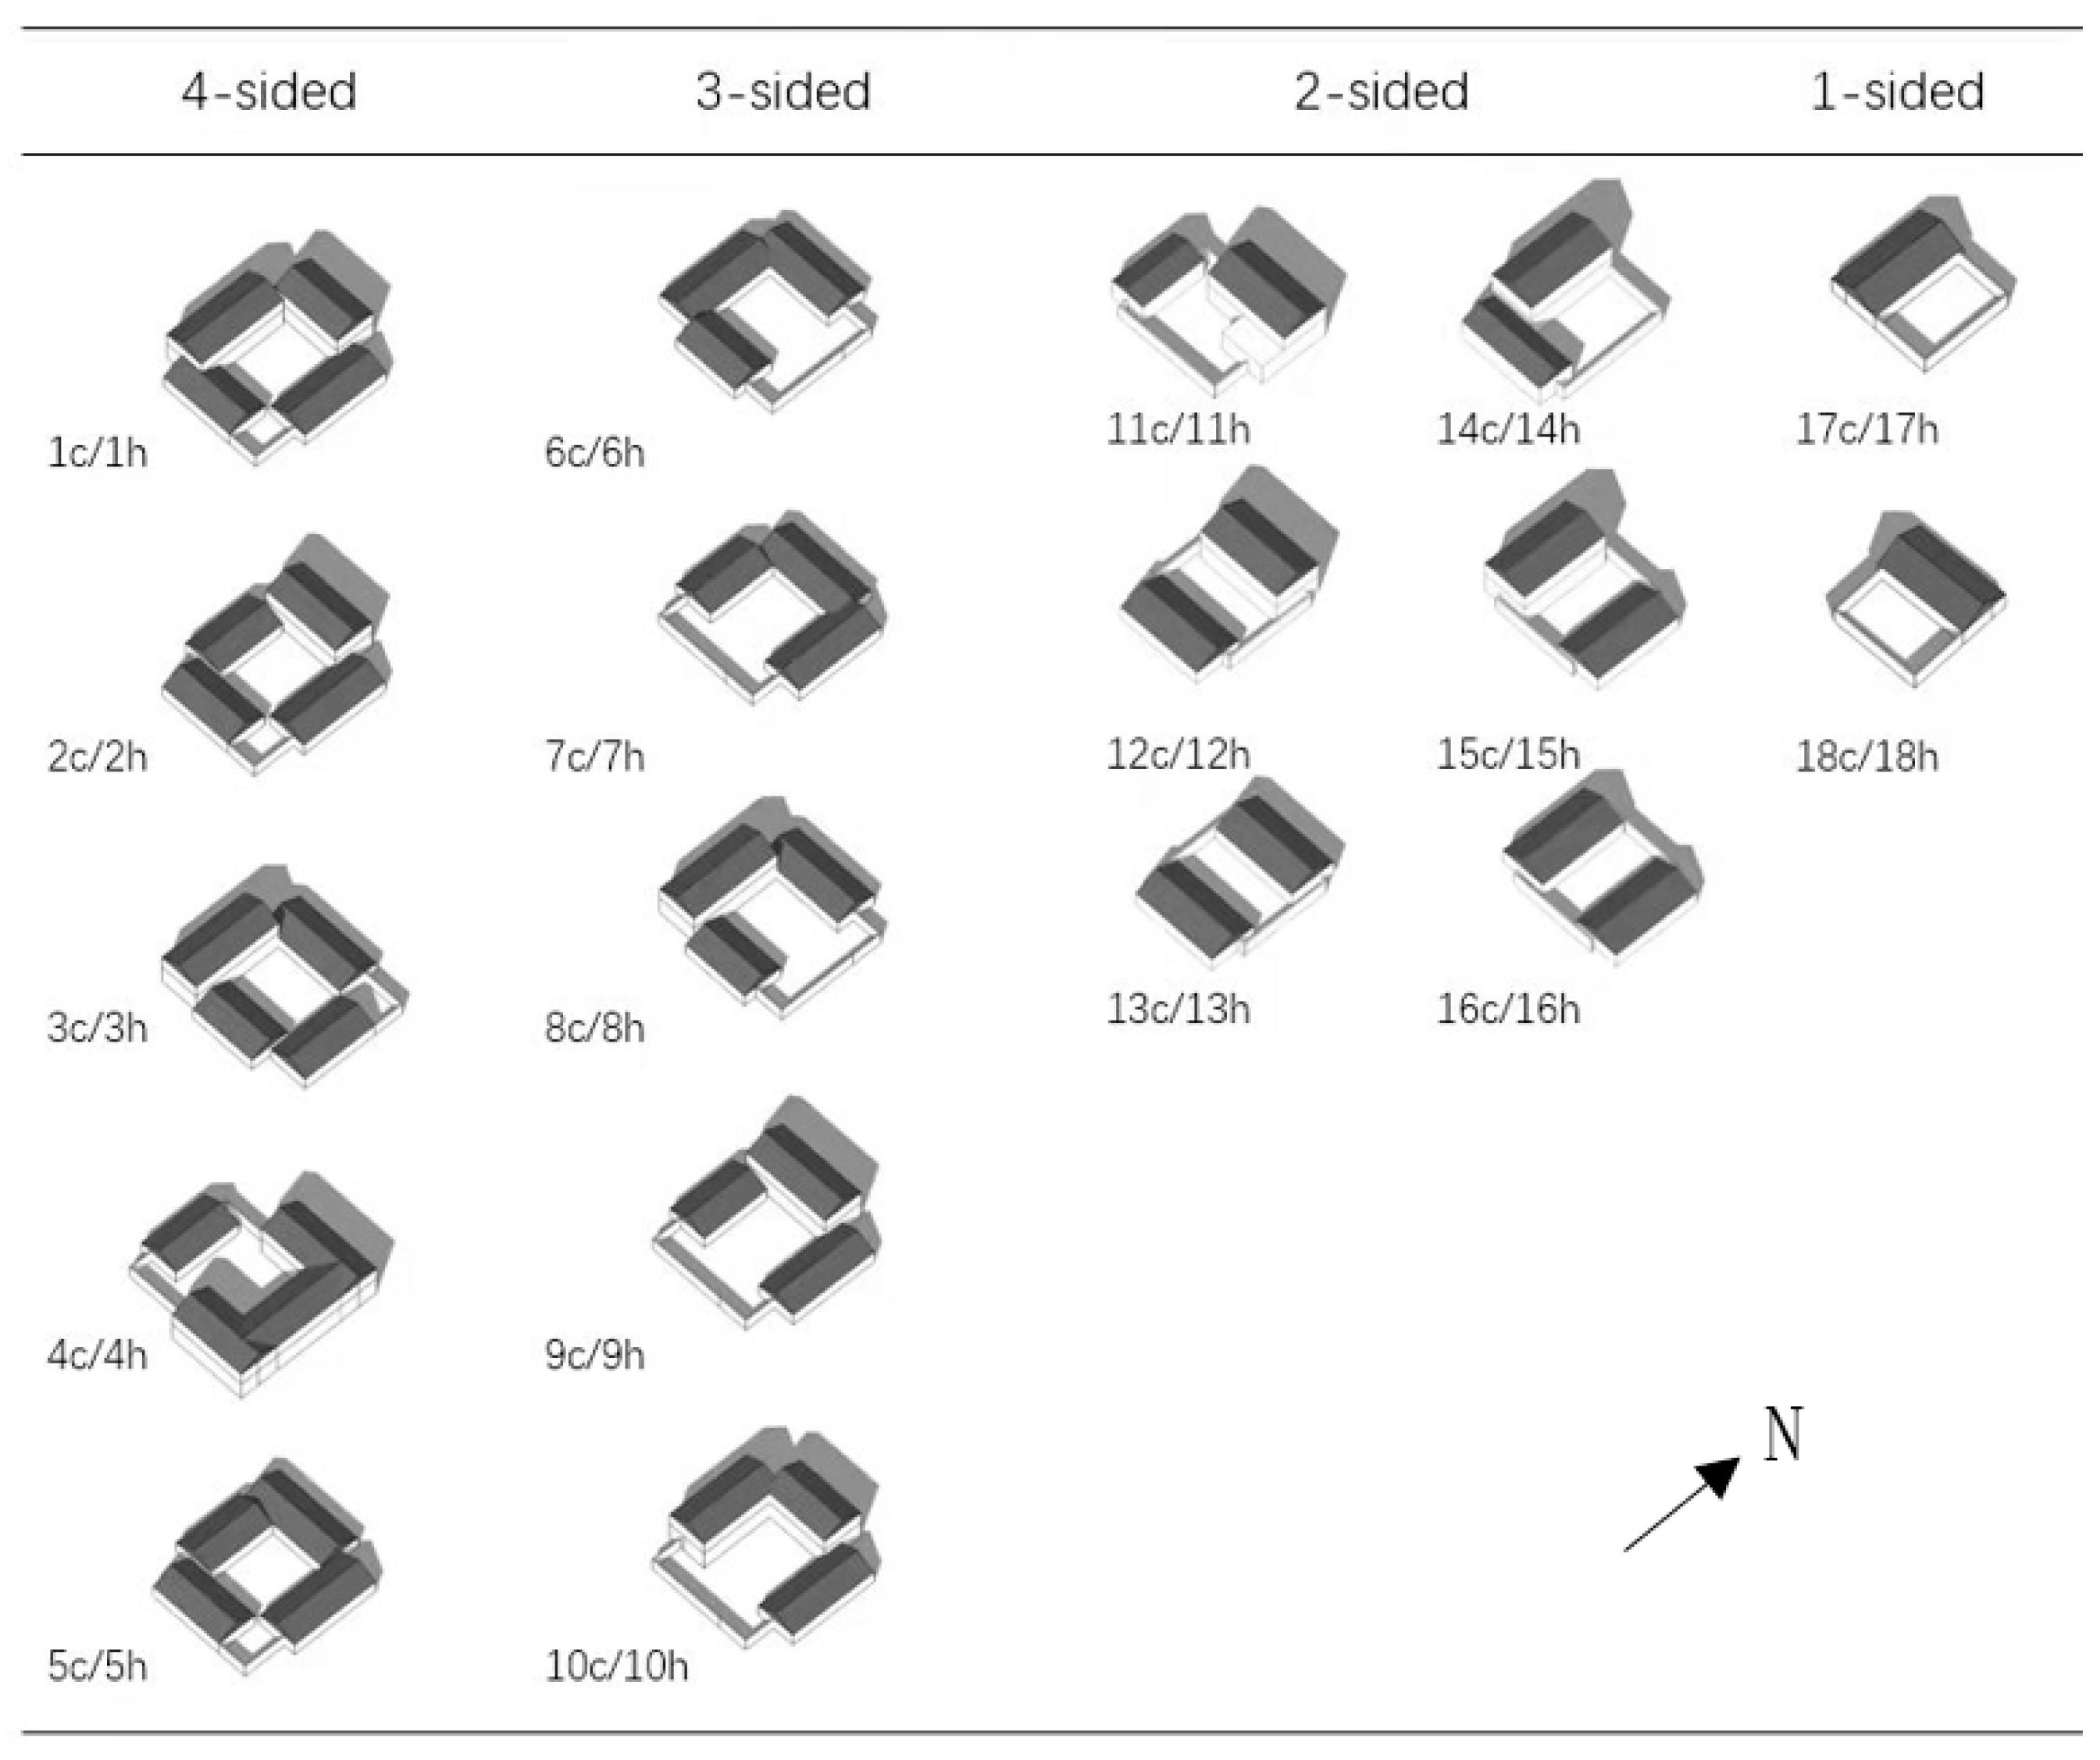
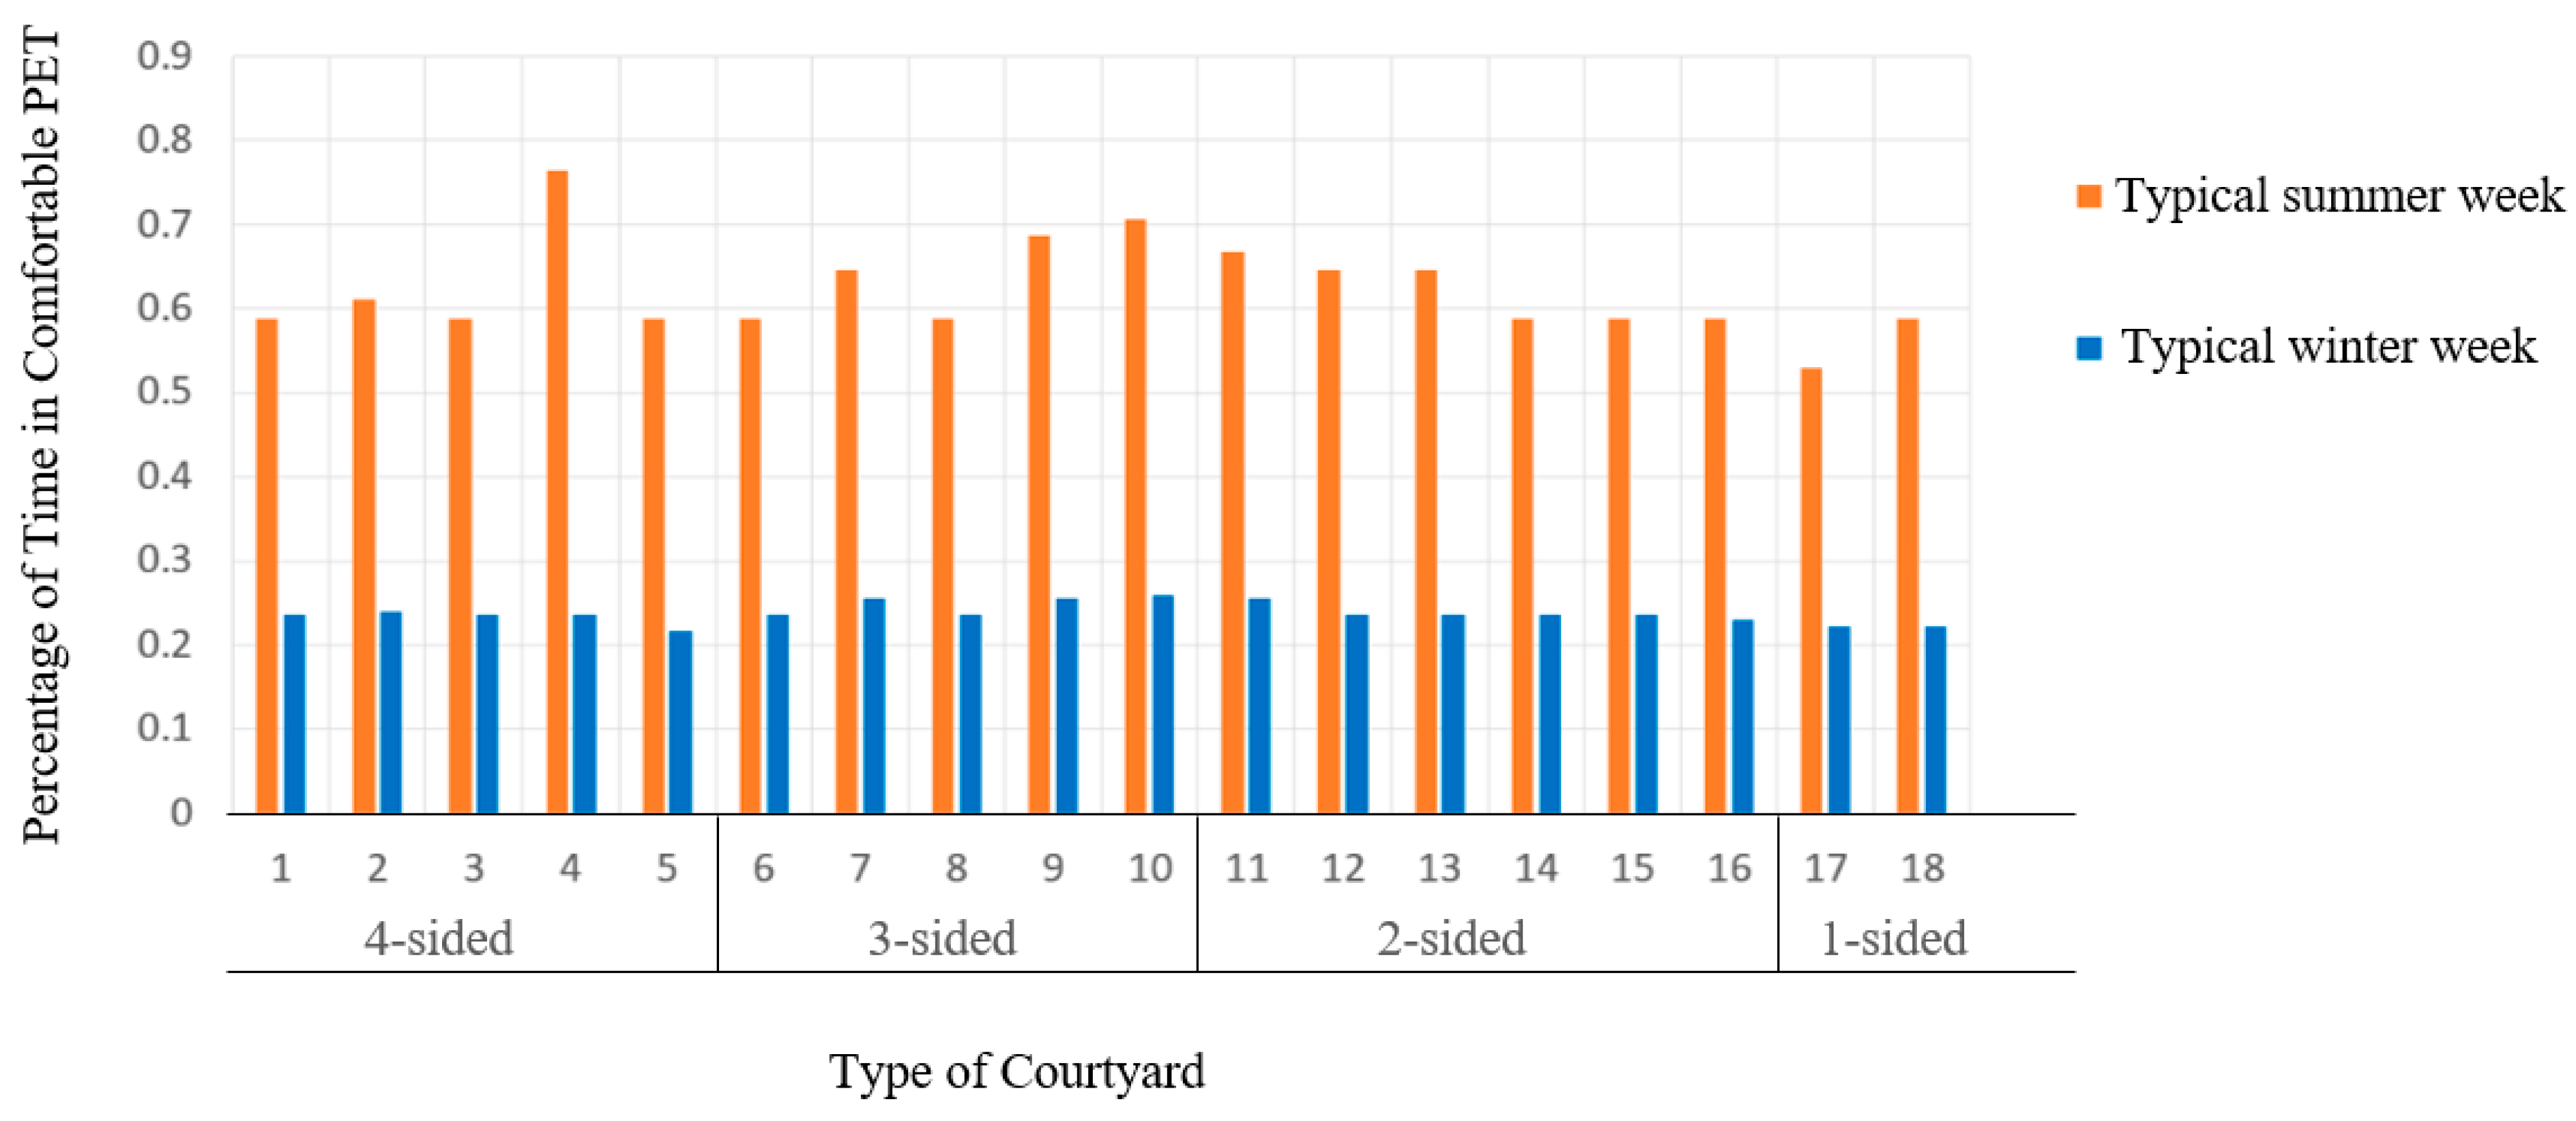
2.2. Baseline Courtyard Model Based on PET

The courtyard types in the cold regions of China can be classified into four categories based on the degree of enclosure: 1-sided, 2-sided, 3-sided, and 4-sided. The number in front of each category indicates the number of buildings in the courtyard. Figure 9 is an aerial photograph of the various types of courtyards surveyed in this study. This article has conducted a preliminary screening of 415 residential buildings within the scope of the base. After sorting and analysis, 34 courtyards with regional characteristics were extracted. These courtyards are mainly north-south-oriented, with deviations within 35 degrees from east to west. Also, due to terrain constraints, some are east-west-oriented, accounting for 20%. The relevant data is obtained from the local Planning and Natural Resources Bureau. 18 models have been developed, considering the enclosure degree, size, orientation, height of surrounding buildings, and other factors. In all kinds, the dimensions and materials of the relevant building units, the courtyard’s underlying surface material, and the openings are similar. Table 2 and Figure 10 show the classification process based on the development model of 34 traditional courtyards, respectively.
This paper selects physiological equivalent temperature (PET) as the judgment criterion for selecting the Baseline model. During the actual simulation process, it was found that due to a few abnormal temperature measurement values at individual time points in the EPW data, the calculated PET values fluctuated. This paper sets the temperature control range in summer and winter, that is, by counting the proportion of test time in the total test time when the perceived temperature is less than or equal to 32 °C in summer and higher than 5 °C in winter, to reduce data fluctuation risk caused by abnormal values. The relevant literature indicates that the acceptable range of PET differs slightly between urban and rural areas in cold regions. For urban areas, the lower limit is 9.8 °C, and for rural areas, it is −2.48 °C. The upper limits are 30.7 °C and 36.33 °C, respectively [38,39]. Considering that this study focuses on the traditional village located in suburban areas, the thresholds are set to the average of the aforementioned values. Thus, the lower limit is set at 5 °C and the upper limit at 32 °C. As shown in Figure 11, the results of the PET comfort time ratio numerical analysis show that in the quadrangle courtyard classification, type 4 has the highest comprehensive score in summer and winter, whose design considers the need for wind protection in winter and heat insulation in summer. In the 3-sided courtyards, the overall score of types 9 and 10, similar to each other, is higher than in other courtyards. Since fewer categories of 1-sided courtyards exist compared with 2-sided courtyards, the results show that type 11 has the best overall score.
The selection of the baseline model in this paper is primarily based on the following considerations: (1) PET comfort time ratio. Figure 10 shows the proportion of comfortable time for different types of courtyards. According to traditional experience in cold regions, the demand for cold protection is higher than for summer heat insulation. Combining this with the PET comfortable time proportion results, it can be seen that courtyard types 9 and 10 have relatively high proportions during a typical winter week and rank just below type 4 during a typical summer week. Considering these factors, the 3-sided courtyard, represented by types 9 and 10, can be selected for the next phase of analysis. (2) Land use efficiency. These traditional village courtyards located in suburban areas face limitations in land use in future planning and renovations. In other words, 3-sided courtyards can maximally meet the indoor and outdoor functional needs of residents under limited land use conditions. In contrast, 2-sided courtyards have too few indoor functional areas, while 4-sided courtyards have too few outdoor areas.

3. Research Process

3.1. Multi-Objective Performance Optimization

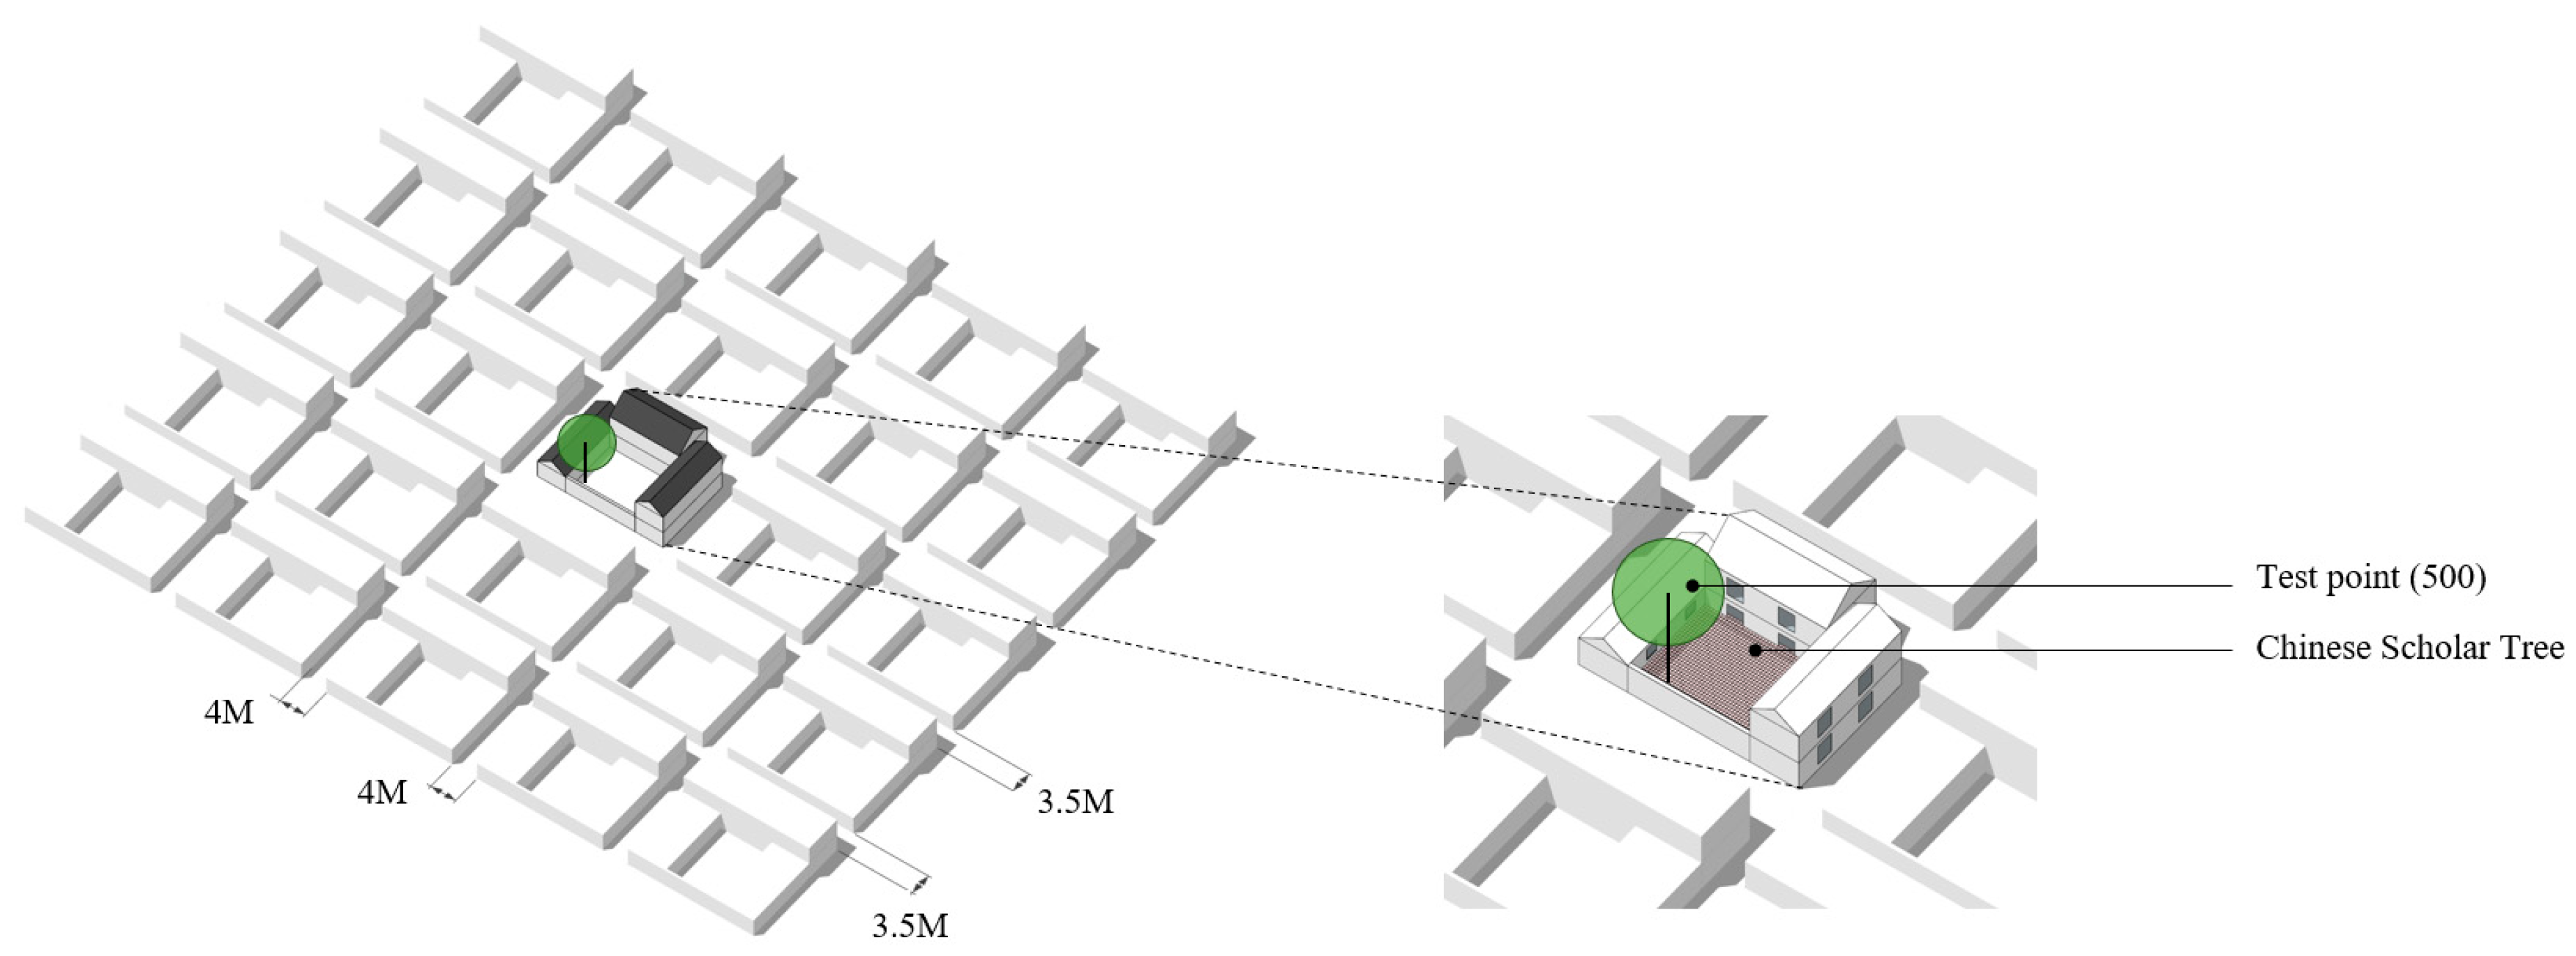
3.1.1. Baseline Model and Site Environment Settings

Based on the previous analysis, this section selects types 9 and 10 as the baseline models for the study. Both are 3-sided courtyards, differing in the number of floors in the secondary building of the courtyard. The baseline model and site modeling are shown in Figure 12. The surrounding courtyard dimensions are set to 20 m by 18 m, and the model is simplified to improve computational efficiency. Street widths are set based on survey experience: 4 m for north-south and 3.5 m for east-west. The parameters for the central baseline model are the average values of all courtyard sizes in the surveyed area. Other building performance parameters are set according to local planning regulations and empirical values. HVAC parameters use ideal values, referencing the best local rural self-built houses (Table 3). In addition, there is a Chinese scholar tree in the courtyard, and there is a corresponding schedule setting in the Honeybee 0.0.66 software to reflect the changes in porosity in summer and winter. The baseline courtyard’s design parameters and performance goals will be explained in the next section and will not be repeated here.

3.1.2. Performance Objective Selection

The comprehensive performance objectives analyzed in this study encompass both courtyard thermal comfort and building energy consumption. Due to the widespread use of HVAC systems, air conditioning is activated when the indoor PET reaches a critical threshold during summer and winter; thus, indoor thermal comfort is not considered in this study. Regarding design variables, the courtyard layout design variables include parameters such as courtyard width, standard floor height, window-to-wall ratio, orientation, and secondary-house floor control (as shown in the Table 4). The window-to-wall ratio is included because it directly affects the heat transfer between the interior and exterior, impacting building energy consumption. The specific parameters are described as follows:
(1)
Courtyard width refers to the length of the courtyard in the east-west direction. Based on the surveyed courtyard areas in the village, the courtyard area is set at 120 m2, with the base area of each of the three buildings within the courtyard set at 60 m2. This way, once the courtyard width is determined, all the planar parameters of the courtyard are set.
(2)
Standard floor height refers to the floor height of each building within the courtyard, with a range of [2.7, 4.0] m. To simplify calculations, Height_N, Height_E, and Height_W represent the heights of the main building to the north, the secondary building to the east, and the secondary building to the west, respectively. This metric is related to secondary-house floor control.
(3)
Orientation refers to the courtyard’s angle based on the orientation of the main building to the north. From preliminary research and experience, aside from significant deviations due to terrain, the courtyard angle in cold regions typically does not exceed ±45°.
(4)
Secondary-house floor control refers to the number of floors of the secondary buildings within the courtyard. An input value of “−1” indicates both secondary houses have one floor; “0” indicates the left secondary house has one floor and the right one has two floors; “1” indicates the left secondary house has two floors and the right one has one floor. In cold regions, the main building to the north generally has the highest number of floors to shield against winter winds. Given the small space needs of a courtyard typically housing 3 to 5 people, usually only one secondary house has two floors, so the secondary-house floor control only considers these three scenarios.
(5)
Window-to-wall ratio (WWR) refers to the ratio of window area to wall area. To simplify calculations and improve efficiency, the same WWR is set for the upper and lower sides of a building. Additionally, since the indoor energy consumption simulation is conducted under steady-state air conditioning conditions, door openings are not considered. The WWR settings for the three buildings in the courtyard are as follows: W_N and W_S refer to the WWR for the north and south sides of the main building; W_W1 and W_E1 refer to the WWR for the west and east sides of the left secondary house; and W_W2 and W_E2 refer to the right secondary house. Considering the characteristics of local traditional dwellings, courtyard buildings typically have fewer windows on the sides, so no side windows are included in this study.
In terms of Performance Objective Selection, this study includes building energy consumption, outdoor thermal comfort, and adds Light Comfort. This addition is significant as it is one of the indoor comfort indicators closely related to the window-to-wall ratio and has a balancing relationship with building energy consumption. The specific parameters and software settings are as follows:
Outdoor Thermal Comfort: Using Physiological Equivalent Temperature (PET) as the evaluation index, Honeybee quantifies this as the proportion of comfortable time. This represents the percentage of time that PET values fall within the 5–32 °C threshold range, simulating typical summer and winter weeks. Since the Wallacei_X platform’s default optimization direction seeks the minimum value, the proportion of comfortable time, which should be maximized, is assigned a negative value. In the subsequent simulations, FO1 and FO2 represent the proportion of comfortable time for winter and summer, respectively.
Light Comfort: Spatial Daylight Autonomy (sDA) is used, as the Illuminating Engineering Society of North America proposes. It is defined as the percentage of time when natural illumination exceeds the minimum value of 300 lx for residential living rooms and bedrooms (referencing the “Standard for lighting design of buildings” [40] for residential lighting). The simulation result is the proportion of time meeting this standard, evaluated over one year. Similar to FO1, this target value is also assigned a negative value. In the simulations, FO3 represents this metric.
Building Energy Consumption: Energy Use Intensity (EUI) is selected as the evaluation index for building energy consumption, referring to energy consumption per unit building area (kWh/m2). Total building energy consumption includes heating, cooling, lighting, and equipment energy consumption. Since its value is usually over 200, it is normalized here to facilitate comparison with other indicators. In the simulations, FO4 represents this metric.
All the values for Performance Objectives are controlled between 0 and 1. Based on preliminary research and interviews, local residents are more sensitive to outdoor comfort in the winter than in the summer. Therefore, the weight distribution for FO1:FO2:FO3 is set to 1.2:1:1:1. To facilitate comparison of the performance improvements of subsequent models, the performance objectives of the selected baseline model were calculated. The results of the design variables and performance objectives are shown in Table 5 and Table 6 below:

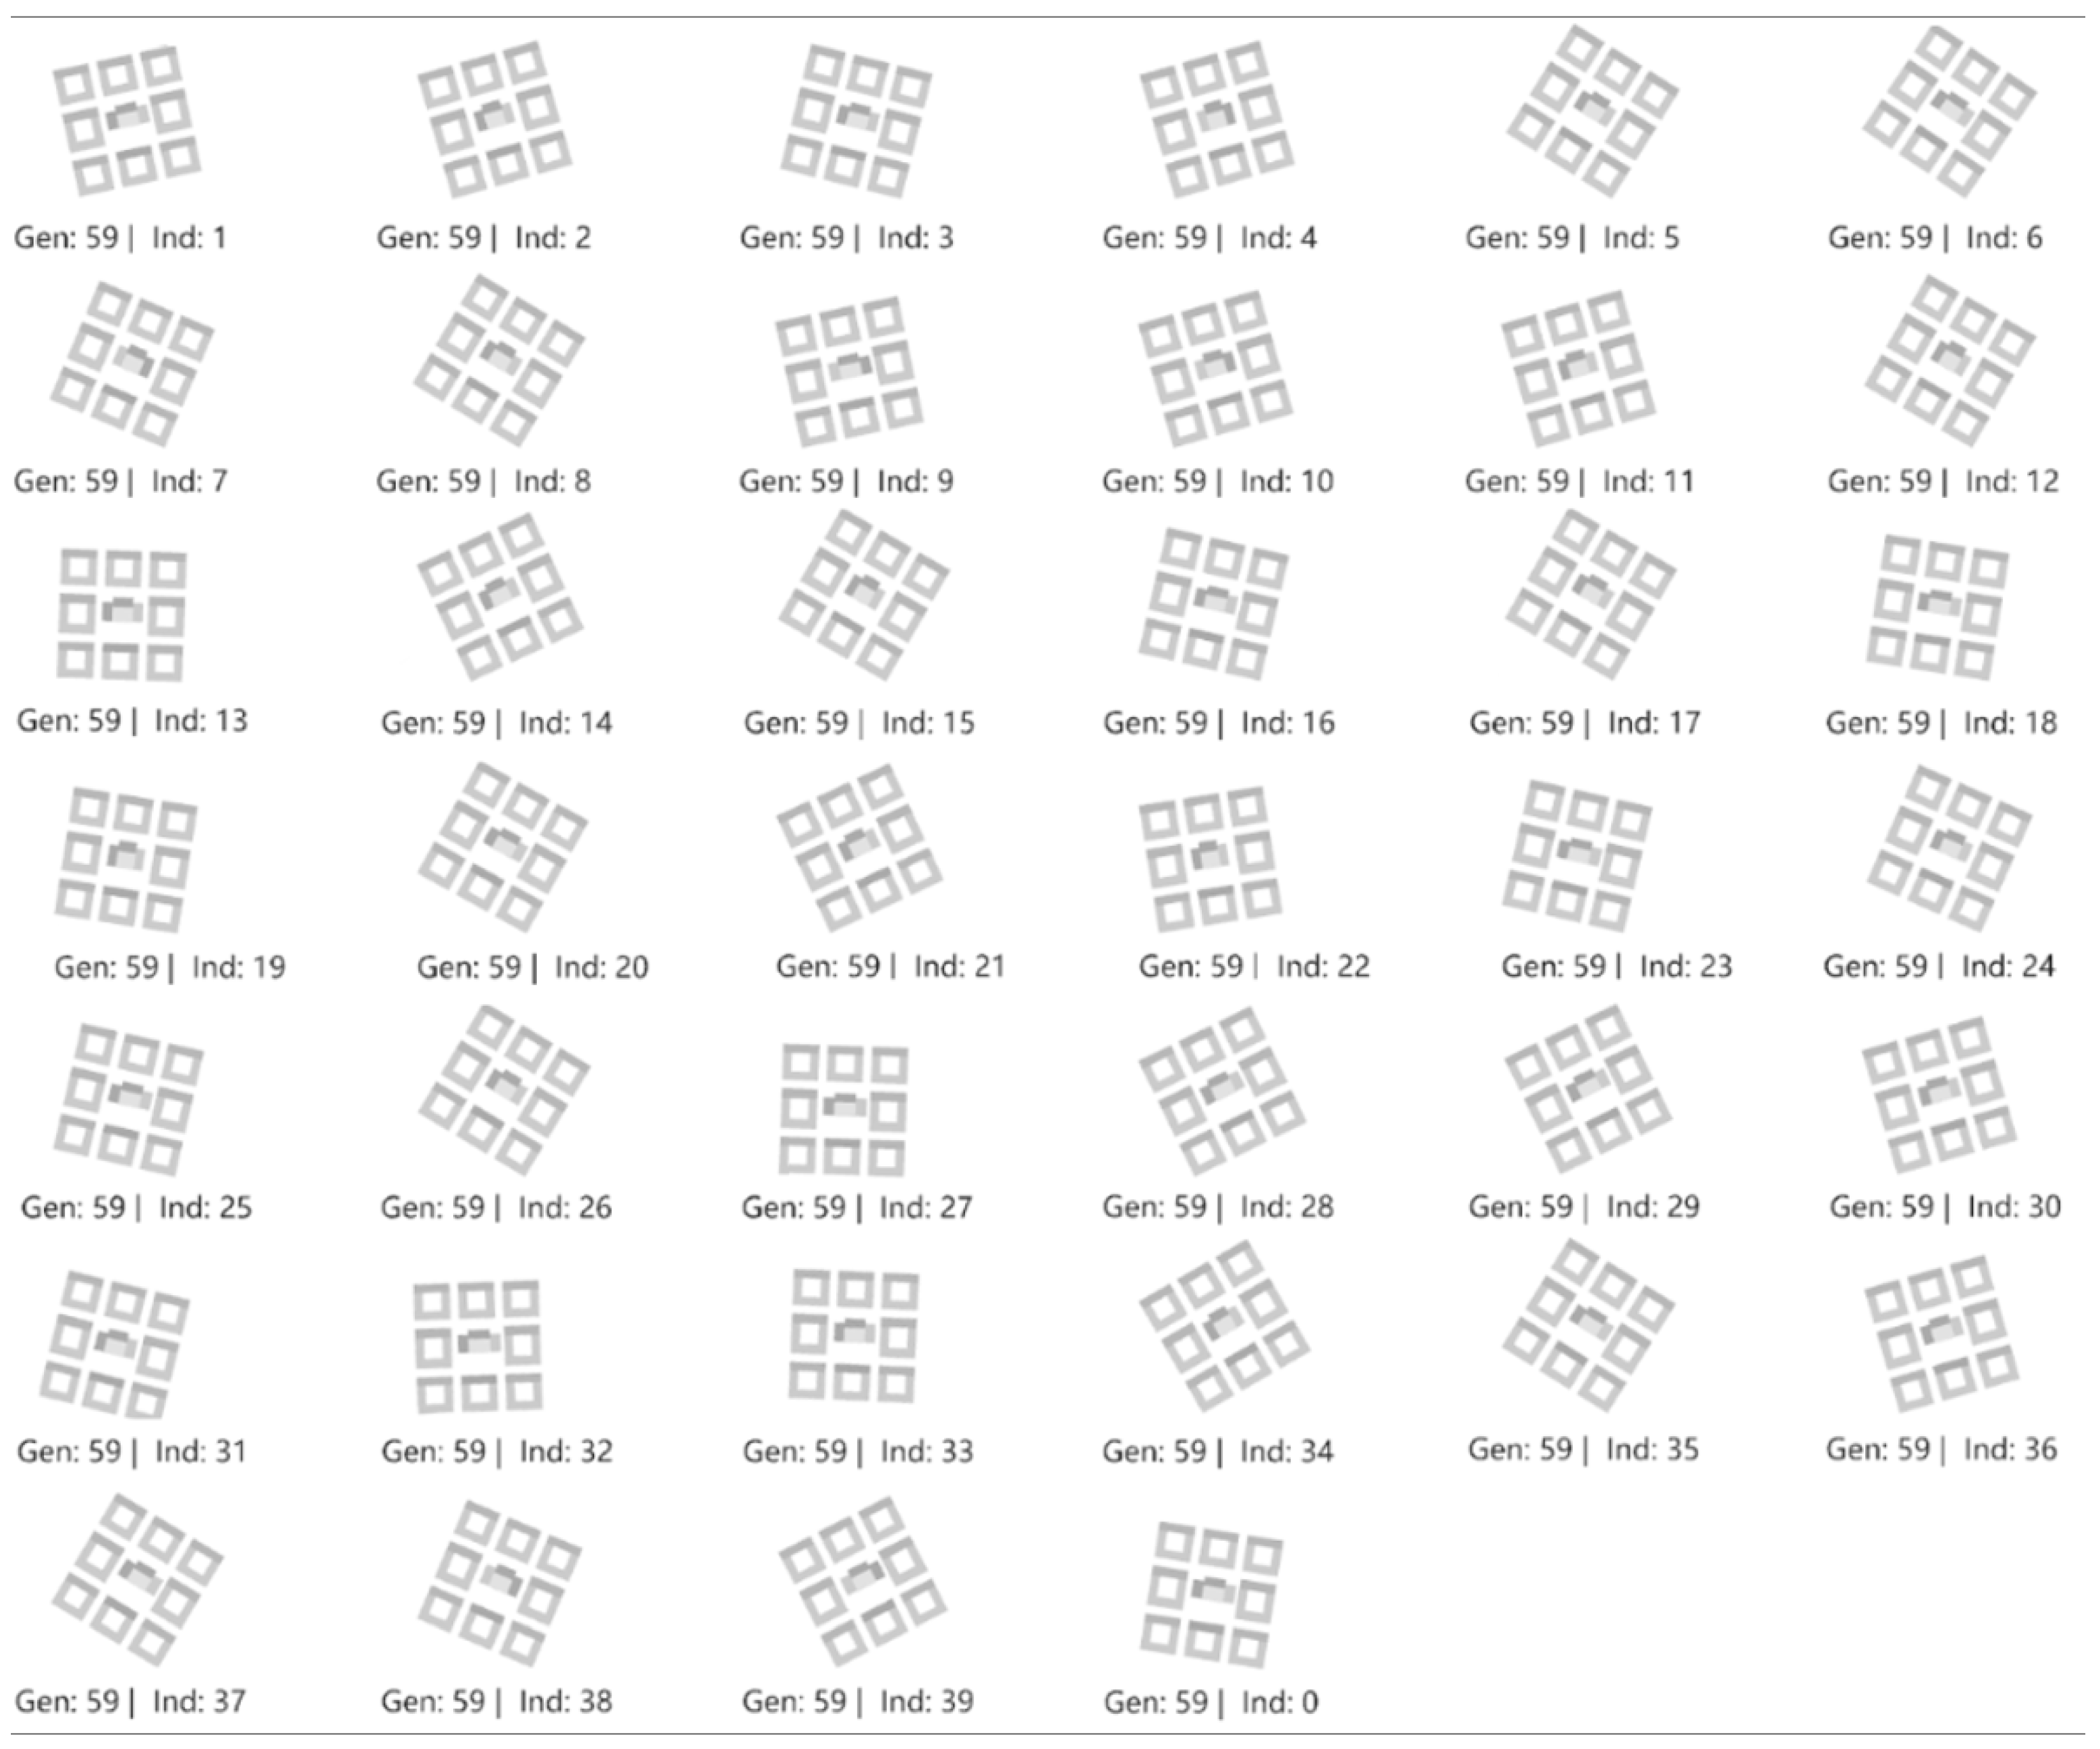
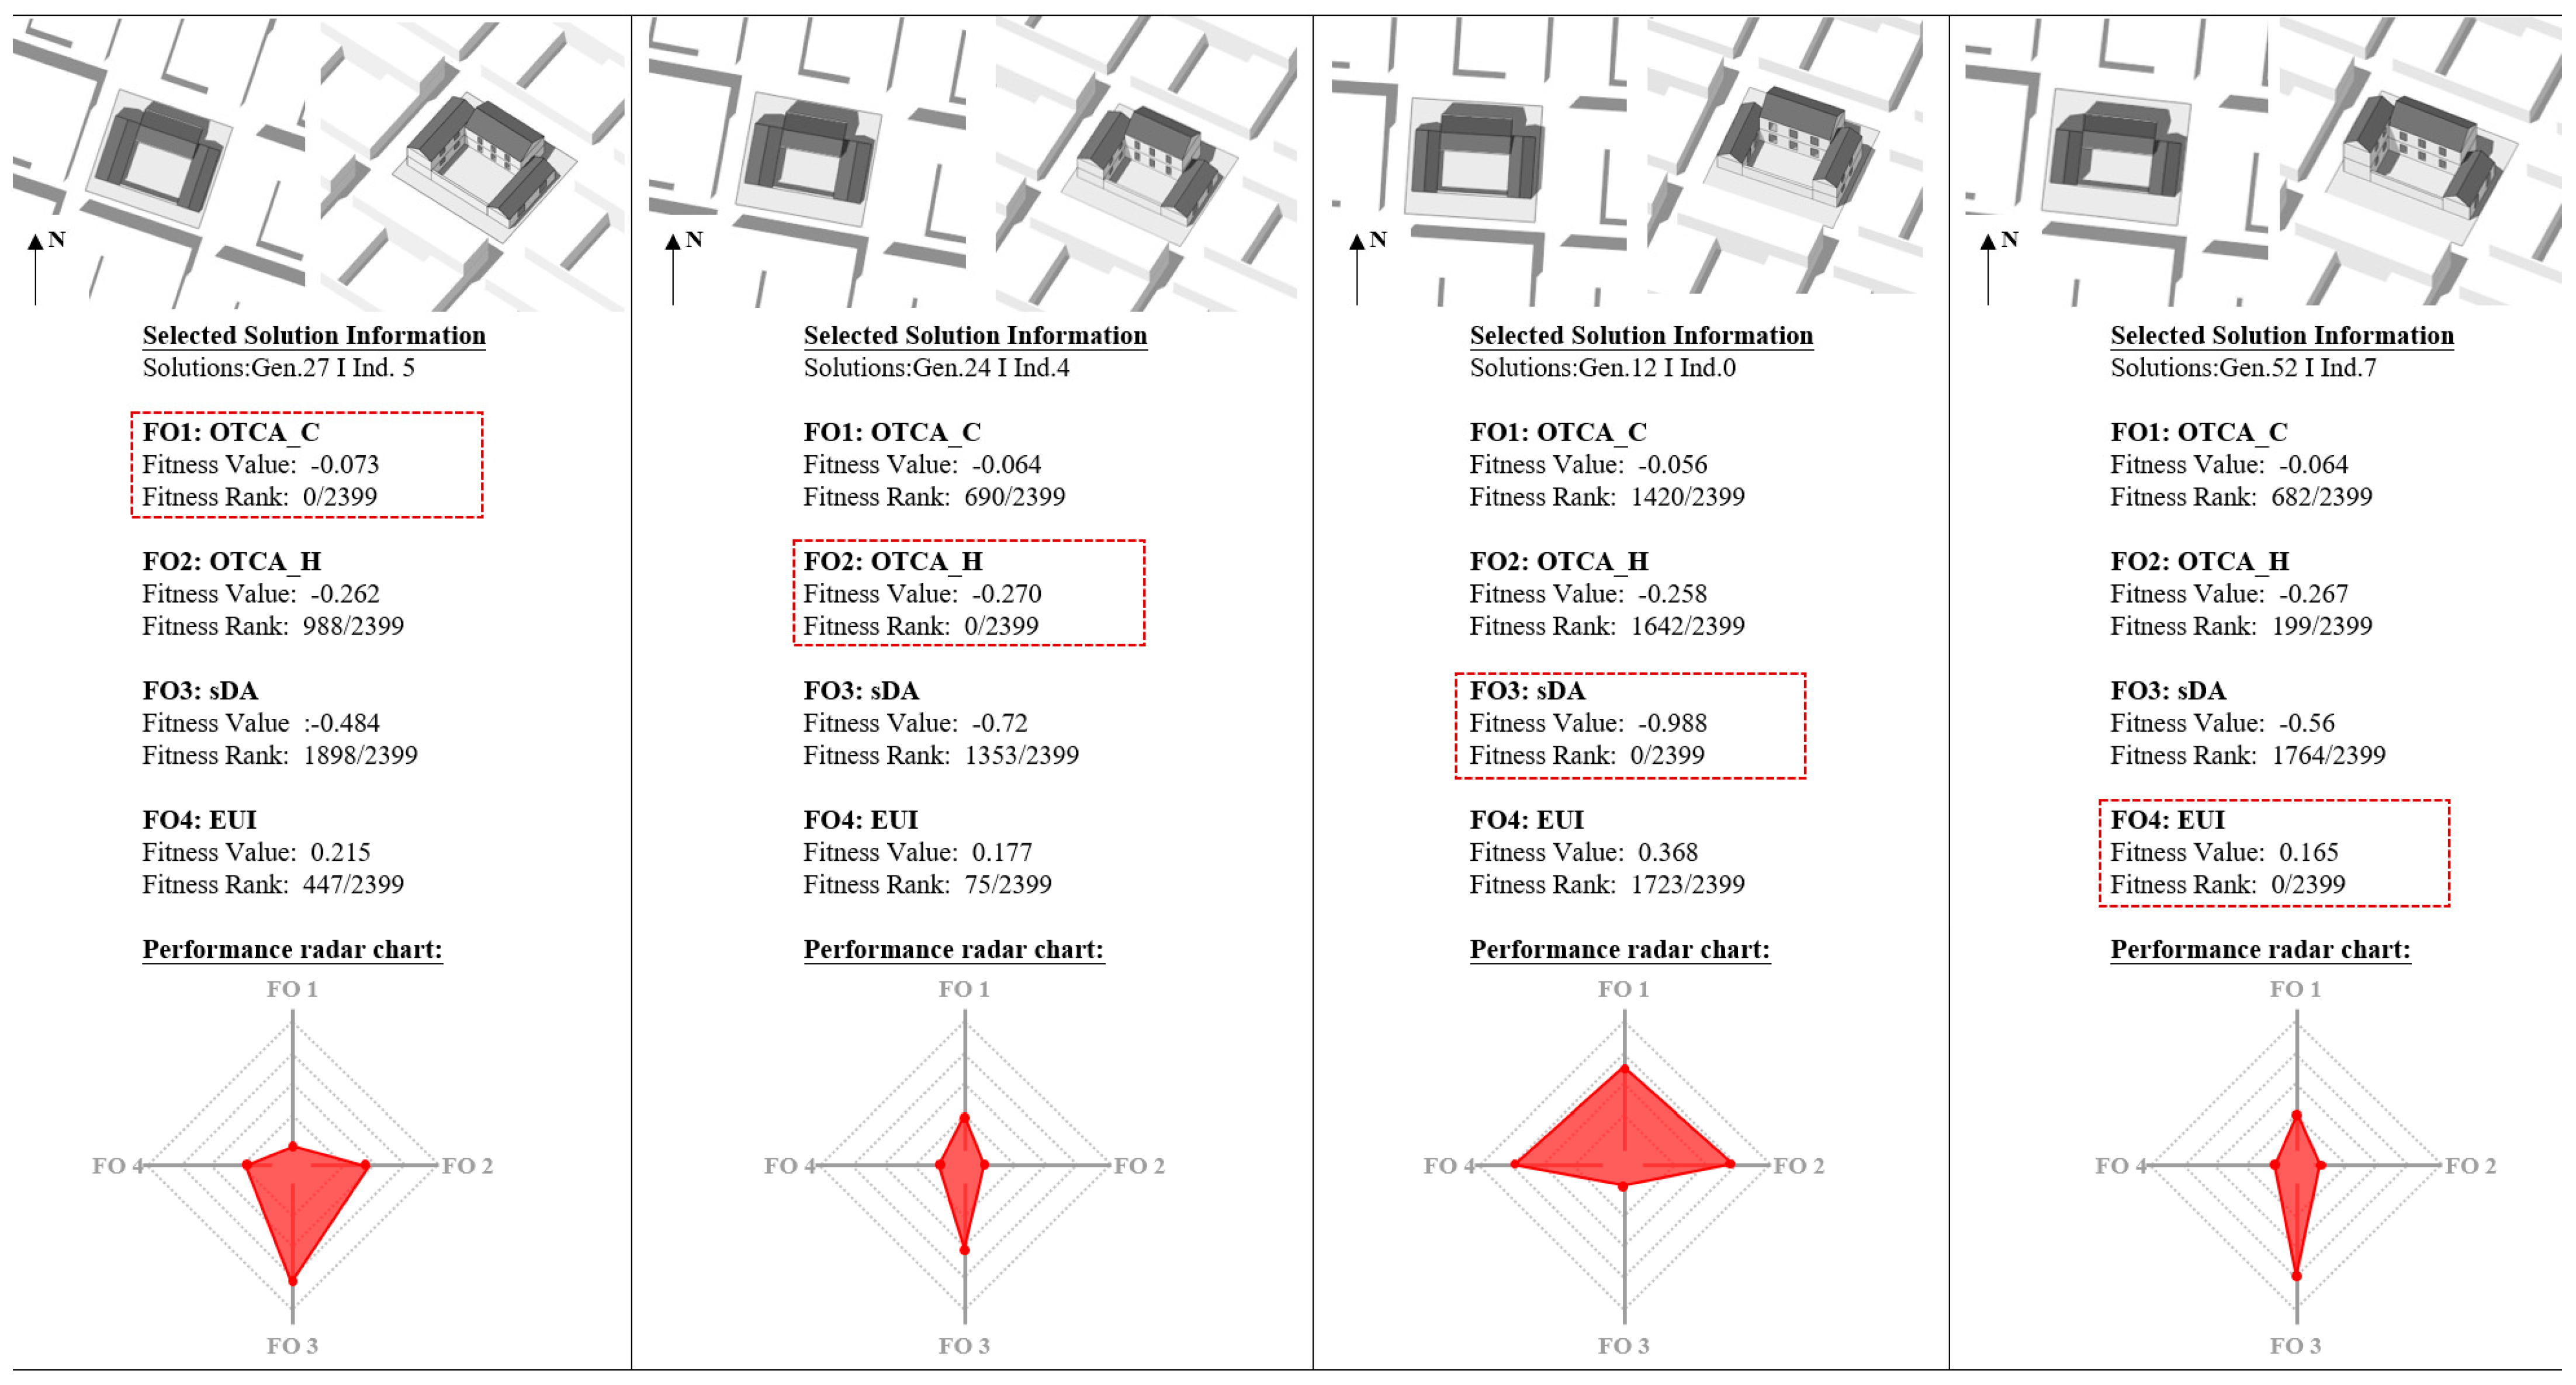
3.1.3. Generate Design Parameter Settings and Simulation

This study employs a genetic algorithm within the Wallacei_X platform to conduct performance-based, multi-objective optimization for design generation. Genetic algorithms (GAs) are rooted in Darwin’s theory of natural selection [41]. Among them, the Multi-Objective Genetic Algorithm (MOGA) has proven particularly effective in optimizing building energy usage, having been widely applied to enhance building designs, optimize HVAC systems, and integrate renewable energy sources [42,43]. The genetic algorithm settings are as follows: a population of 40 individuals evolving over 60 generations, with a crossover probability of 0.9, a mutation probability at a default value, a crossover distribution index of 20, a mutation distribution index of 20, and a random seed of 9. The simulation generated 2400 solution sets. Figure 13 depicts the morphological distribution of all 40 solution sets in the 59th generation of the Pareto front.
Figure 14 illustrates the courtyard forms under different performance objective tendencies. From left to right, the courtyards correspond to the optimal results for FO1 through FO4 performance objectives. The bottom row displays radar charts of the performance tendencies, where the four points of the enclosed colored area represent the four performance objectives. Since the default algorithm setting seeks the minimum value, points closer to the center indicate better optimization results. According to the analysis method set by the Parallel Coordinate Plot, the solution Generation 59, Individual 12 (abbreviated as: Gen.59 Ind.12) ranked first in Average Fitness Ranks. The courtyard parameters and performance simulation results are shown in Figure 15. Further calculations determined the differences between this courtyard and the baseline model for each performance objective. Dividing these differences by the baseline model’s performance objective values yielded the Optimization Percentage (OP). The performance optimization results indicate a significant improvement in winter comfort by up to 8.3%, while the summer comfort improvement is limited to 3.8%. These two indicators are mutually exclusive regarding indoor lighting and energy consumption: energy savings amount to 32.2%, while illumination decreases by 8.8%. It is important to note that this section’s weight for performance optimization prioritizes winter outdoor comfort. Different weights will yield significantly different optimization results. Therefore, actual evaluations should be based on specific real-world requirements.

3.2. Wind-Thermal Environment Coupling Analysis

3.2.1. Parametric Settings

The study focuses on three-sided courtyards, which have demonstrated superior performance in previous research. Given Shandong’s dominant north-south wind direction, the research prioritizes north-south expansions. Using the Butterfly and Honeybee plug-ins from the Ladybug Tools platform, this study evaluates the performance of grouped courtyards and identifies optimal design strategies. The local tradition of arranging multi-entry courtyards informs this research, with two entrance courtyards at the north and south ends representing the front and back yards. The main house, centrally located, is typically arranged over two floors. Reflecting local customs, the depth and grade of rooms increase towards the north, ensuring no structures are positioned low in the north and high in the south. Additionally, east-west side houses serve secondary functions and are rarely built above one floor if space permits. In Shandong, residential communities generally consist of three to four courtyards, with five-courtyard configurations being rare. This paper simulates and analyzes the wind and thermal environments of three to five courtyard houses during a typical summer and winter week. In addition, when Honeybee calculates comfort, the wind speed results obtained by Butterfly simulation are entered into the Honeybee settings to ensure the rigor of the analysis. Beyond basic model settings, the study examines the impact of dominant wind direction on wind and thermal comfort. Previous generative design analysis identified the most frequent angles of −30°, 0°, and 30° relative to the dominant wind direction. These angles are, therefore, selected for further research. Consistent with the performance goals mentioned earlier, the PET comfort-time ratio is still used here to evaluate outdoor thermal comfort. The simulation of wind environment comfort is evaluated by the proportion of the area with low wind speeds (0–0.2 m/s) within the courtyard. Figure 16, Figure 17 and Figure 18 show the simulation results of the wind and thermal environments for three, four, and five courtyard houses with different orientations. Taking the code “c31” as an example, “c” represents the test results for a typical winter week, corresponding to “h” for summer. “3” stands for three-sided courtyard houses, and “1” represents the courtyard combination method.

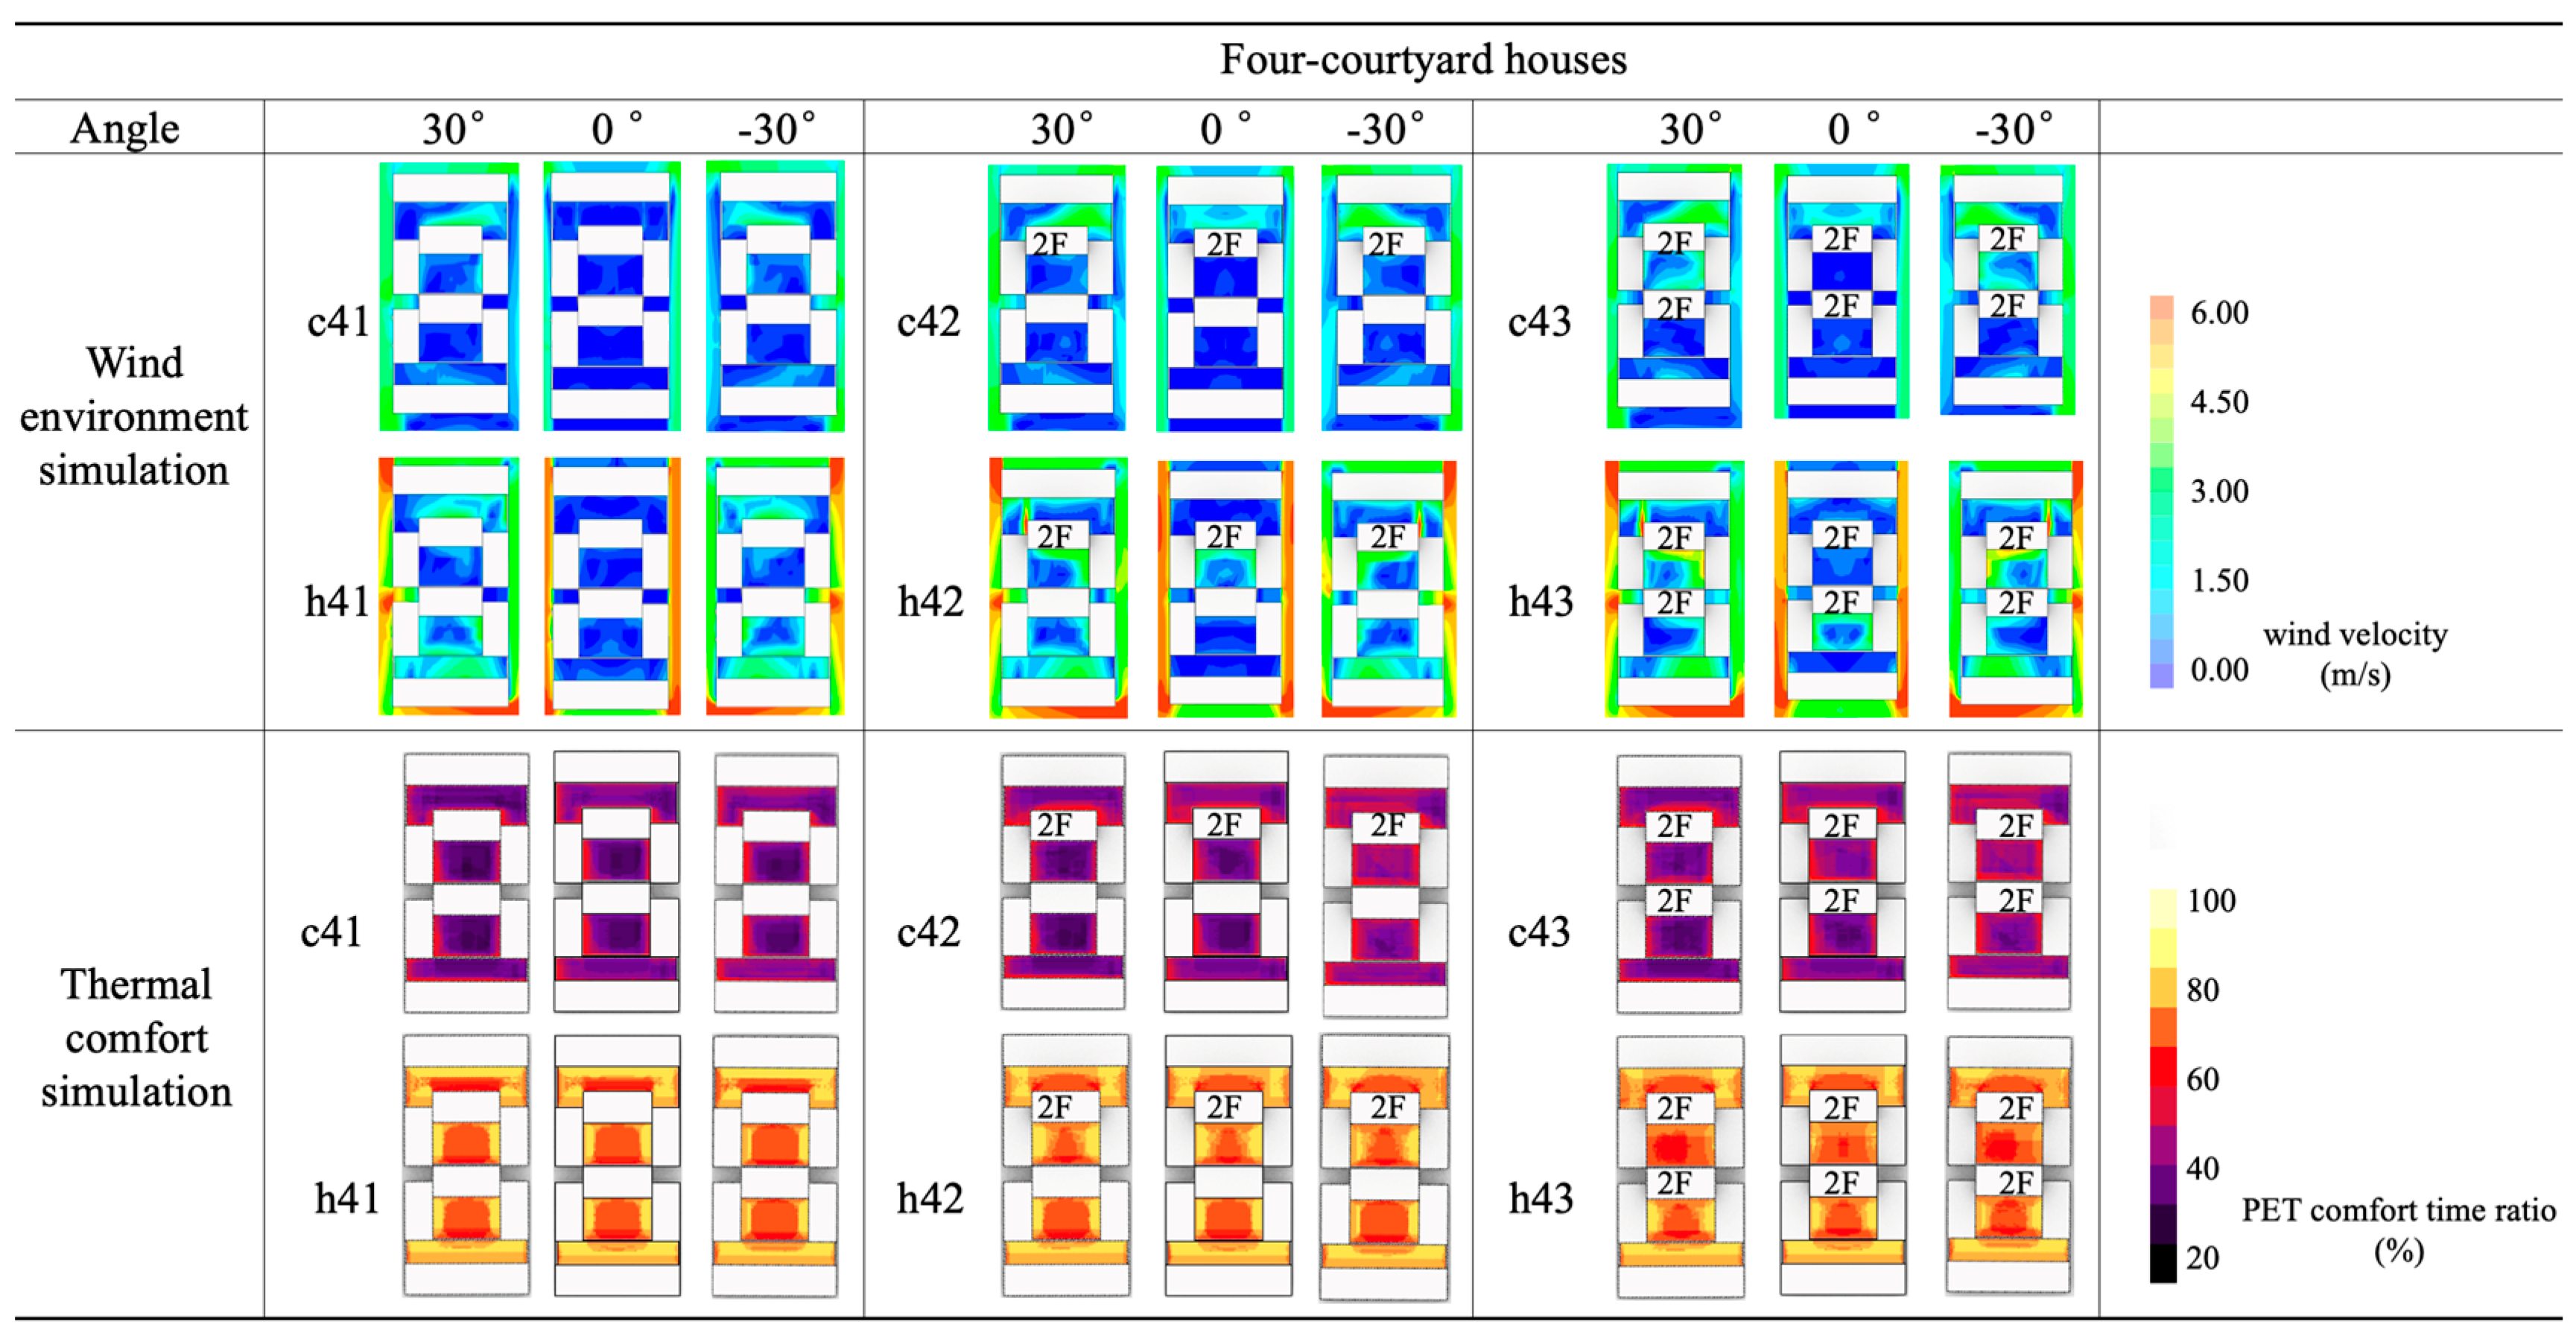
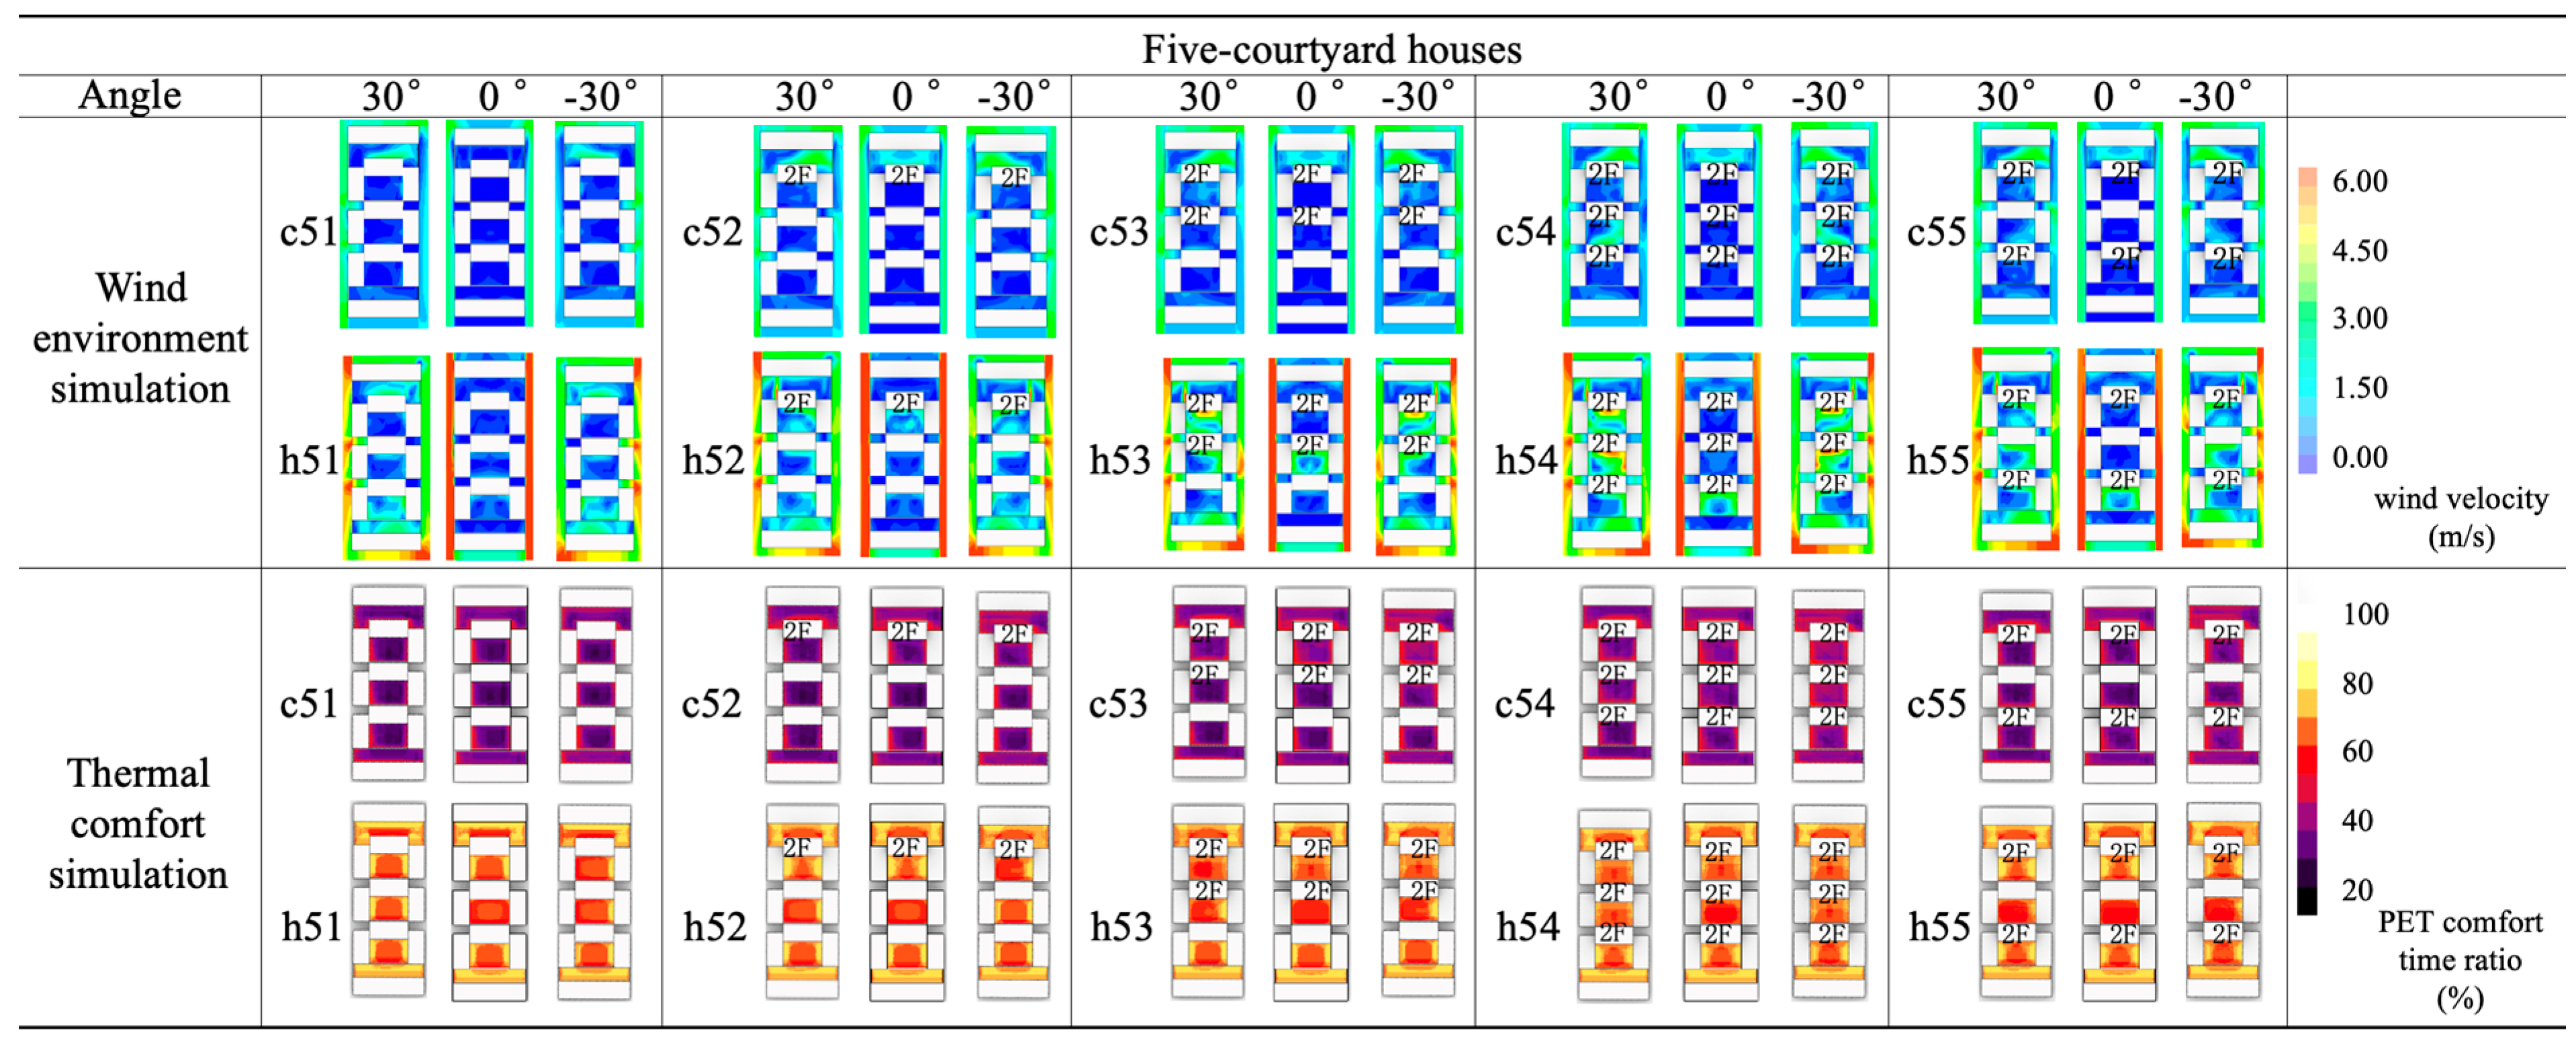
3.2.2. Wind-Thermal Environment Simulation

The simulation results of the wind environment show that in winter, an angle of 0° provides better wind protection compared to 30° and −30°, applicable to all types of courtyard combinations. In terms of height control, locally increasing the number of floors enhances the wind speed within the courtyard by approximately 1–2 m/s. For different types of courtyard combinations, increasing the number of floors in different positions will increase the wind speed in the rear courtyard. For instance, in five-courtyard houses, the more buildings that have increased floors, the greater the wind speed increase, as seen in c54 (30°) and c52 (30°). In summer, an angle of 0° results in the poorest wind environment. Angles of 30° and −30° show improvement, applicable to all types of courtyard combinations. In terms of height control, at an angle of 0°, increasing the number of floors in specific buildings can significantly improve the wind environment, with an increase of about 1–3 m/s, such as in h31 (0°) and h32 (0°), h41 (0°) and h42 (0°), h51 (0°) and h52 (0°). At angles of −30° and 30°, the effect of increasing the number of floors on wind speed varies. For example, in three-courtyard houses, increasing the number of floors locally may even reduce wind speed, as seen in h31 (−30°) and h32 (−30°). In four- and five-courtyard houses, increasing the number of floors in specific areas increases wind speed in the central courtyard but decreases it in the northernmost courtyard, as shown in h41 (−30°) and h42 (−30°), h51 (−30°) and h52 (−30°). Specifically, for different types of courtyard combinations, the results for four-courtyard houses show that increasing the number of floors of two buildings in the central courtyard improves the wind environment slightly more than increasing only one building, as seen in h42 (−30°) and h43 (−30°). For five-courtyard houses, increasing the number of floors in two to three buildings provides a noticeable improvement compared to increasing only one building, such as in h55 (−30°) and h51 (−30°), with an increase of about 1–2 m/s. The dispersed (h55) layout provides greater benefits compared to the centralized (h53) layout. It is important to note that the wind speed range in the winter simulation is mostly within 0–3 m/s. Within this range, changes in wind speed are not necessarily aimed at wind protection first; increasing air circulation can also enhance outdoor comfort. Therefore, specific combination strategies should be determined based on actual conditions.
The thermal comfort simulation results show that in both winter and summer, the impact of angle changes on thermal comfort becomes more significant with an increasing number of courtyards. For example, in summer, h54 (0°), h54 (30°), and h54 (−30°) show relatively large changes in the PET comfort time ratio. Overall, the influence of angle factors on the wind environment is greater than on thermal comfort. In terms of height control, the more buildings with increased floors, the greater the overall improvement in the PET comfort time ratio. This indicates that the comfort improvement brought by building self-shading is greater than the impact of other factors. For instance, the PET comfort time ratio of h54 in summer is higher than that of other combinations of five courtyard houses.
Figure 19 shows the statistics of the PET comfort time ratio. The various combinations of courtyards and their orientations significantly impact thermal comfort. As highlighted in the red square in the figure, the highest PET comfort can be achieved by optimizing angles relative to the dominant wind direction and the second floor’s layout. Different angles yield varying results. Generally, in winter, a 0° angle between the wind direction and the dominant wind direction results in the highest PET comfort time ratio. In summer, a −30° dominant wind direction maximizes PET comfort time in the courtyard, with values for 0° and 30° angles being similar. Comparing winter and summer PET comfort time ratios, summer values are higher, ranging from 62% to 64%, while winter values are lower, concentrated between 38.5% and 40%. Figure 20 presents statistics on the proportion of low wind speed areas. In winter and summer, a 0° angle with the dominant wind direction results in the highest proportion of low wind speed areas. In winter, the configuration “c51” performs best, having the highest proportion of low-wind speed areas. In summer, “h55”, “h43”, and “h55” configurations perform best, with the lowest proportions of low wind speed areas. Overall, four and five courtyard houses outperform three courtyard houses in wind environments.

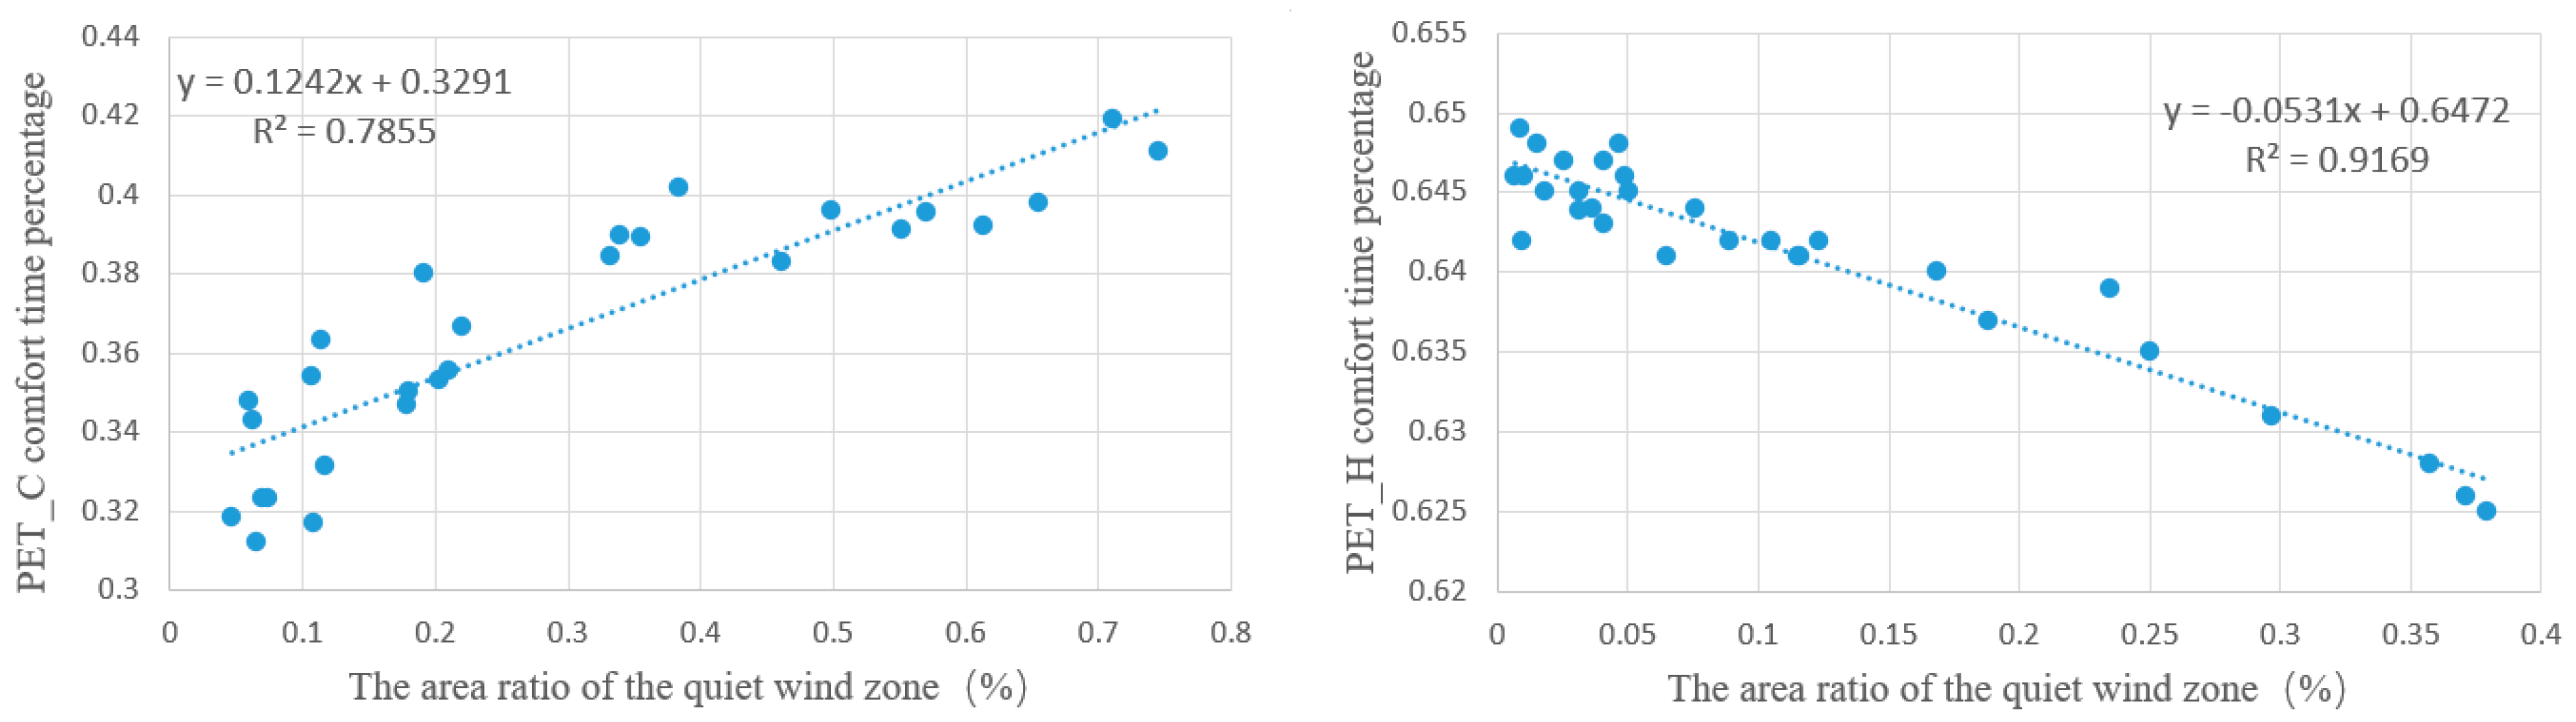
3.2.3. Correlation Analysis

Figure 21 illustrates the coupling analysis between the PET comfort time ratio and the proportion of low wind speed areas. In winter, the PET comfort time ratio positively correlates with the proportion of low wind speed areas—more significant low wind speed areas result in a higher PET comfort time ratio. Conversely, in summer, the PET comfort time ratio negatively correlates with the proportion of low wind speed areas—more significant low wind speed areas result in a lower PET comfort time ratio. Comparing winter and summer, wind speed impacts comfort more significantly in winter. This is likely because reduced solar radiation due to building self-shading in the summer is more critical than wind speed changes. Wind speed has a higher influence in winter, and people are more sensitive to wind speed in winter than in summer. These conclusions are drawn from a comprehensive comparison of many courtyards. In actual courtyard combinations, altering the angle to the dominant wind direction and increasing the number of floors can directly affect the PET distribution. Based on the coupling of thermal comfort and wind environment, this analysis examines the impact of changes in various elements on comfort and wind speed from a macro perspective.

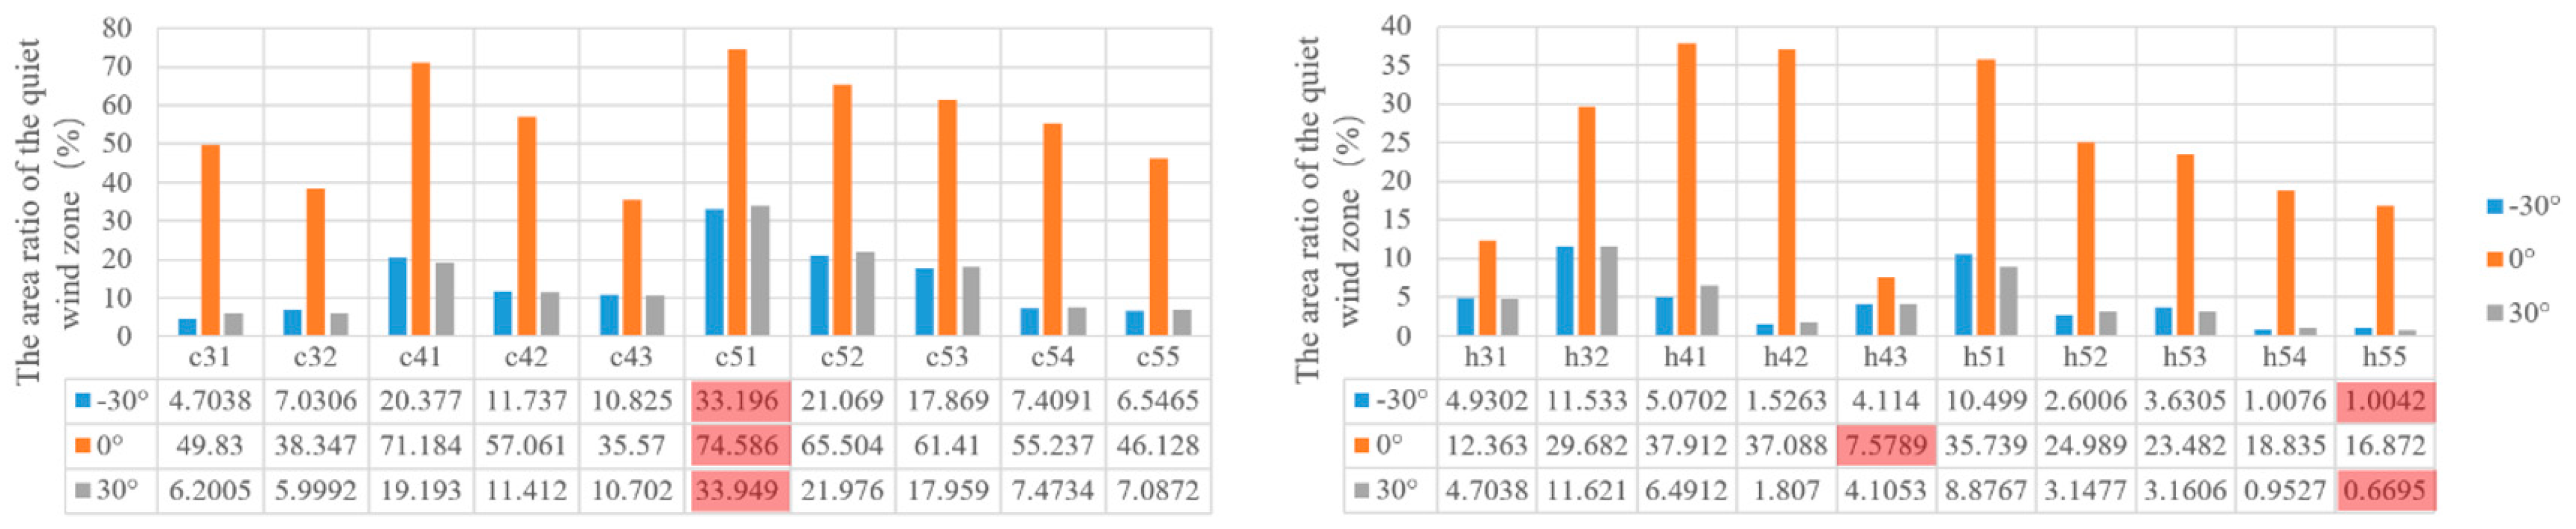
3.2.4. Wind Performance Analysis

Given the many factors influencing thermal comfort and the relatively minor differences in PET values among various courtyard combinations compared to the differences in wind speed, this section focuses on the impact of the spatial relationships of courtyard buildings on wind speed. Table 7 presents average wind speed data for the courtyard for different combination types. The analysis yields the following conclusions:
(1)
Vertical Layout: In winter, local building heightening has a limited impact on improving the regional climate. However, a staggered arrangement of taller buildings from south to north (h55) in summer enhances overall climate conditions and promotes air circulation.
(2)
Horizontal Layout: Increasing spatial depth weakens the correlation with overall microclimate conditions. Stacking the same courtyard type generally reduces wind speed, but increasing building height vertically can offset this effect.
(3)
Courtyard Combination: From the perspective of overall wind environment comfort, the three-courtyard house is optimal for summer heat insulation and winter wind protection. This aligns with previous research indicating that traditional villages predominantly feature single-courtyard houses with few multi-courtyard layouts, especially in mountainous areas.
Notably, the reduction in wind speed due to increasing the number of courtyards does not conflict with the improved wind field circulation from building height adjustments. This phenomenon is primarily evident in four- and five-courtyard houses, where the designer’s choice of specific spatial modifications ultimately determines climate improvement.

3.3. Machine Learning Predictive Model

The machine learning model discriminates the courtyard parameter information generated in Section 3.1.2, with target labels determined based on the Pareto front solution set. This prediction model compares the performance of the generated solutions, completing the research loop. The process includes data preprocessing, data label setting, data segmentation, algorithm selection and model establishment, model evaluation and improvement, and prediction result analysis.

3.3.1. Data Preprocessing

From 2400 samples, 135 with a courtyard side window opening ratio of 0 were screened out and marked as noise data to be deleted. Logarithmic transformation improves model performance for continuous data with weak significance. Using Wallacei_X Selection, data labels were set, exploring multi-classification discrimination based on performance prediction.

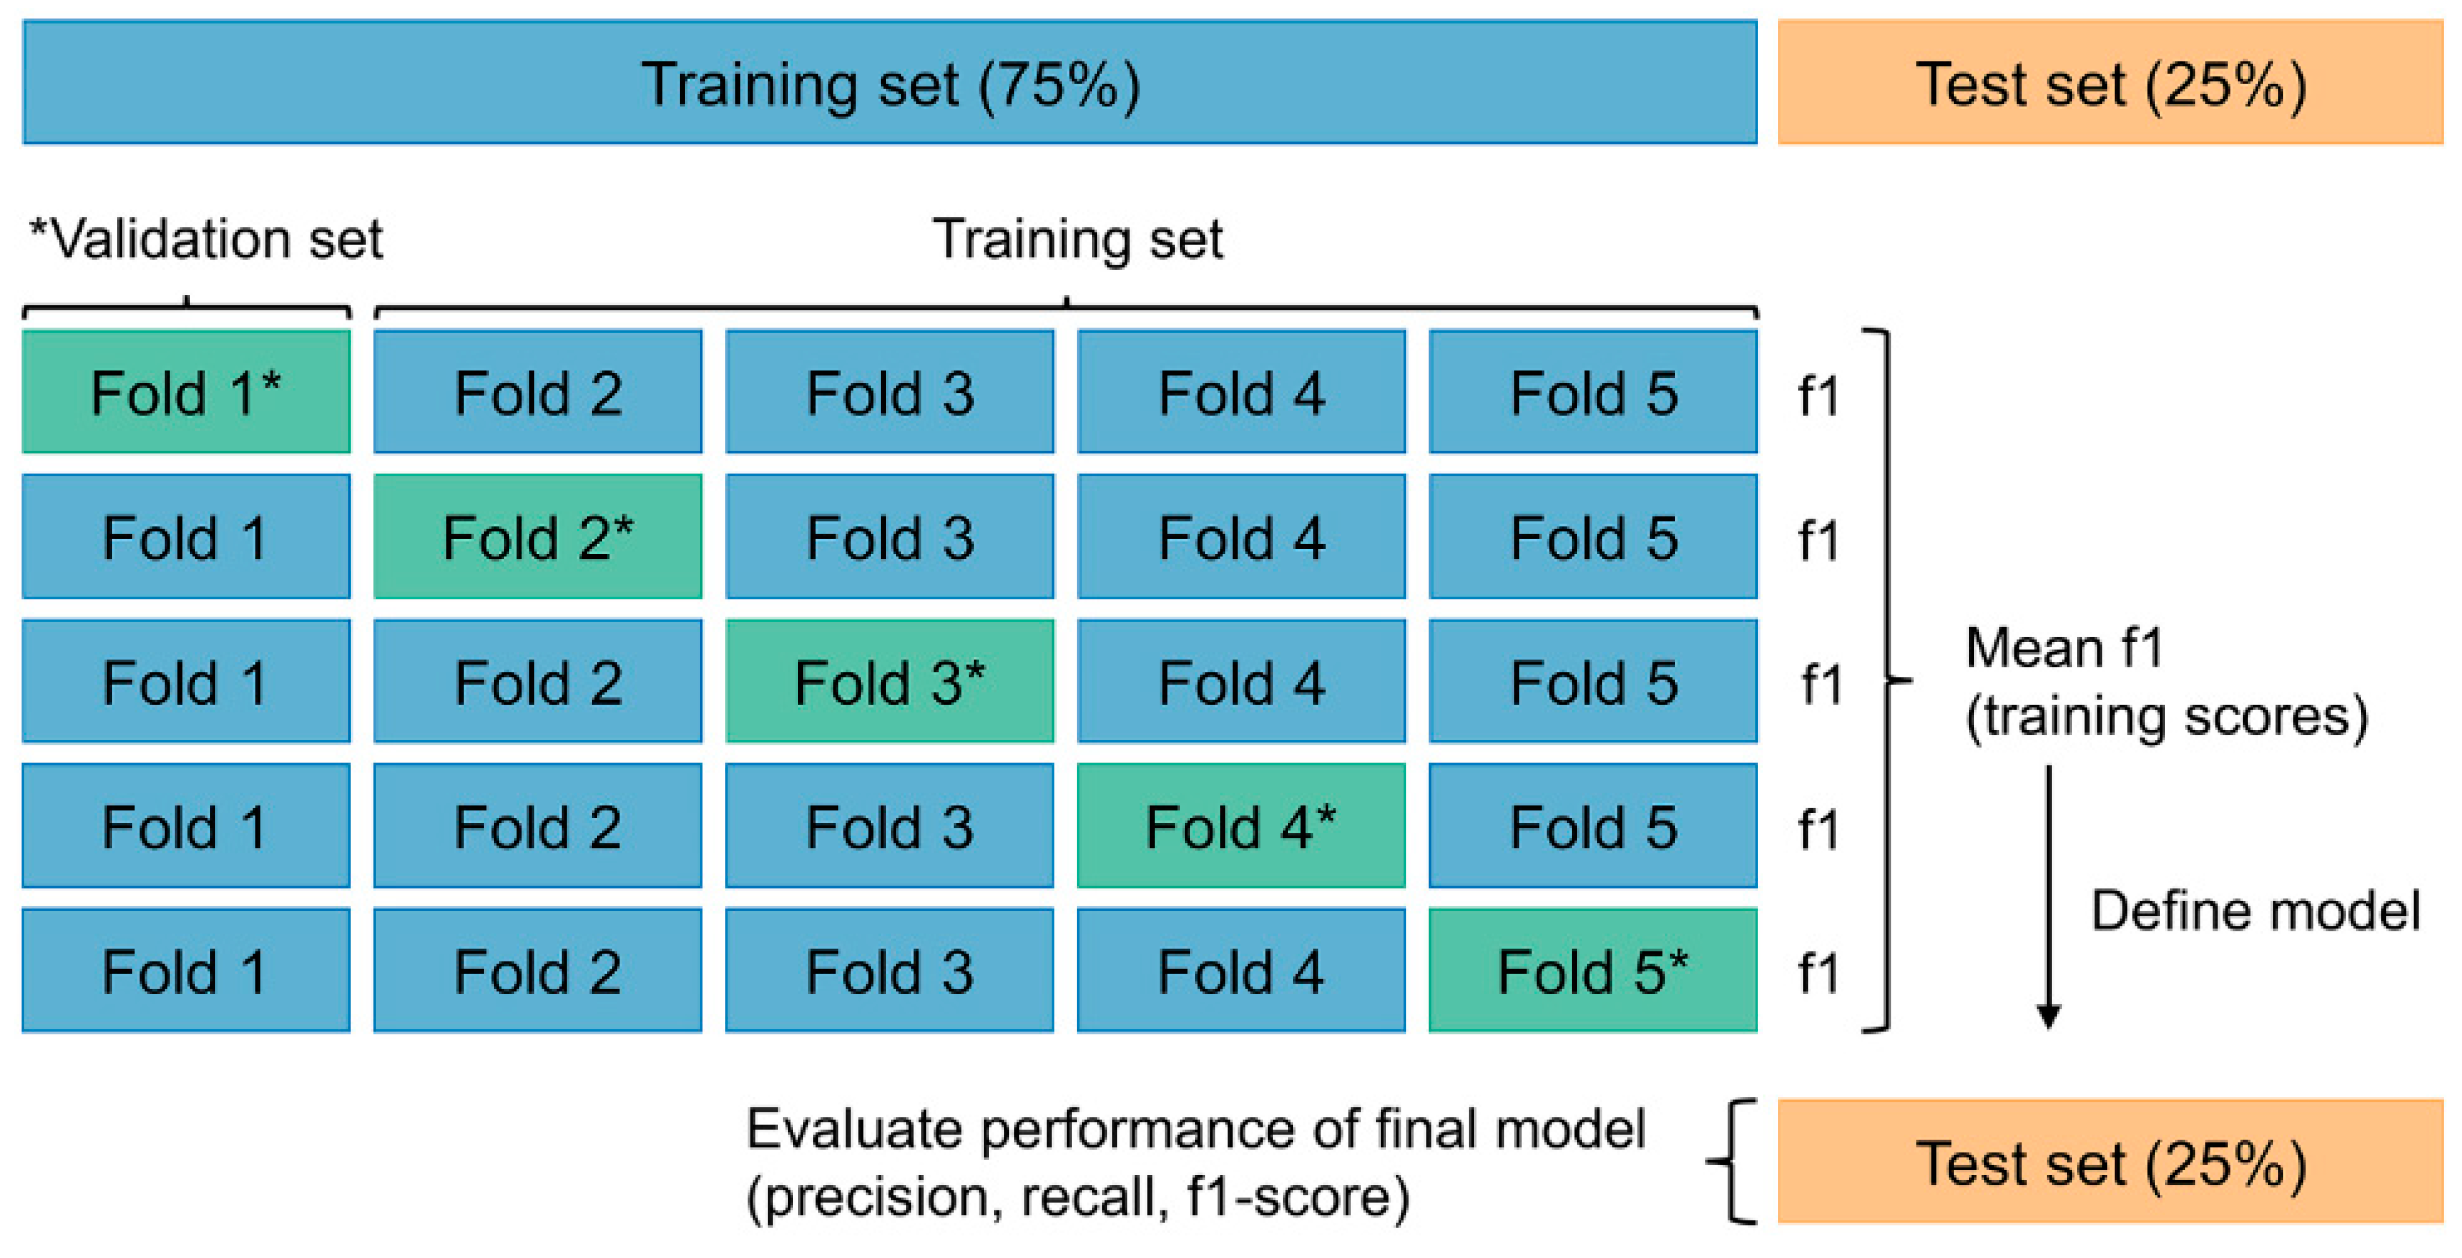
3.3.2. Data Segmentation

To test prediction performance, the dataset was split into a training set (80%) and a test set (20%). To avoid bias and improve model generalization, the training set was further divided into cross-cutting datasets. Using 5-fold cross-validation, the average accuracy rate under the corresponding algorithm model was obtained (Figure 22) [44]. The model’s generalization ability was optimized using a grid search method, focusing on parameters such as “learning rate”, “max_depth”, and “number of decision trees (n_estimators)”. The specific settings are: n_estimators = 150, Max_depth = 6, Gamma = 0.01, Subsample = 0.6, and Learning rate = 0.2.

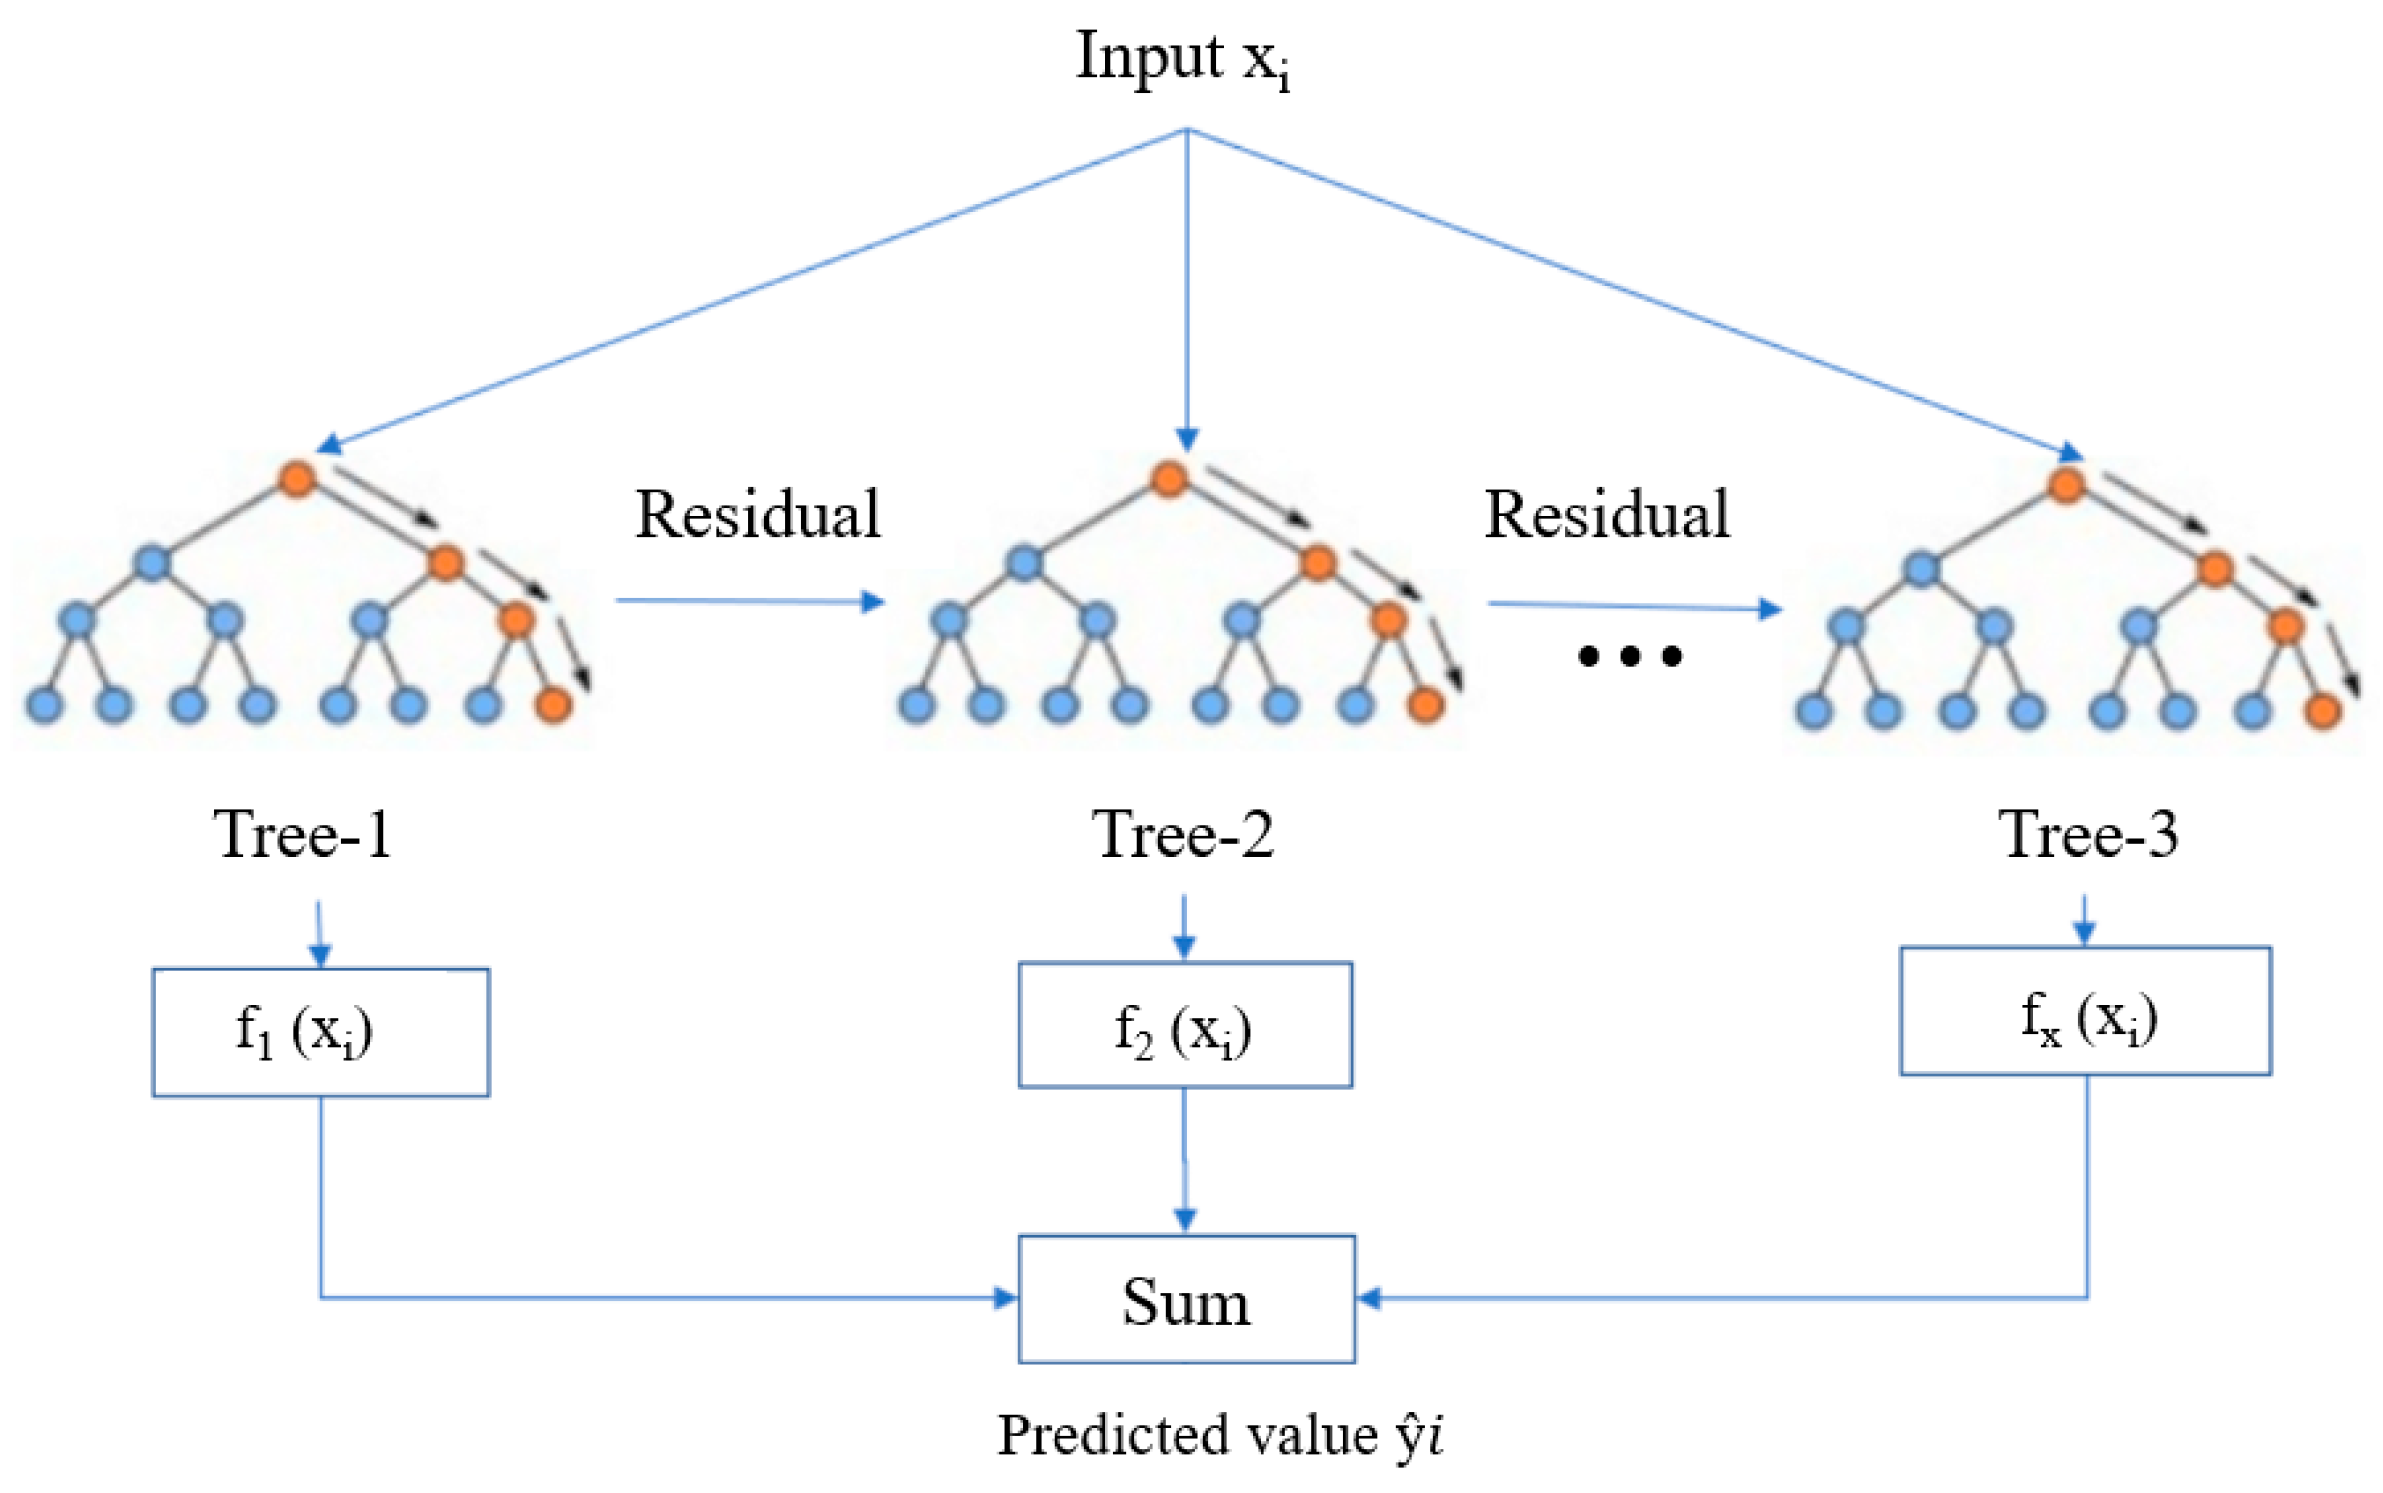
3.3.3. Algorithm Selection and Model Establishment

For most problems where structured data is available, Random Forest and XGBoost accuracy based on Tree-based models is significantly higher than MLP based on Neural Networks and Deep learning. This article uses training data x to predict the value of the classification label y. To ensure that the entire training process can adapt to the sample data more quickly, this article selects the XGBoost algorithm for specific algorithm selection. The XGBoost algorithm, introduced in 2016 [45], has found extensive applications across diverse domains. It has been utilized to predict window behavior in residential buildings [46]. Research indicates that XGBoost outperforms traditional machine-learning methods in terms of accuracy, stability, and efficiency [47]. XGBoost uses gradient boosting technology, which performs well when processing large-scale data and high-dimensional features, but parameter adjustment is highly complex and takes a long time to train.
As shown in Figure 23 [48], the structure of XGBoost consists of multiple root nodes, internal nodes, leaf nodes, and branches. In this structure, the i-th parameter xi is input and passed to the root nodes of all CARTs to make the initial decisions. Subsequently, the internal nodes make further decisions, the branches lead directly to the decisions to be made, and the leaf nodes represent the prediction results of individual classification and regression trees (CARTs). Finally, the results from all leaf nodes are combined to obtain the overall prediction results of the XGBoost model.
The composition of the XGBoost function is as follows, including both training loss and regularization terms [49]:
L t = i = 1 n l y i , y ^ i t + Ω f t
In the equation, n represents the number of samples, yi represents the actual value of sample i, and ŷi represents the predicted value of sample i by the first t decision trees. l y i , y ^ i t represents the loss function, which is used to measure the accuracy of the model’s predictions. Ω f t represents the complexity of the t-th decision tree, which is the regularization term used to mitigate overfitting. The regularization formula is as follows:
Ω ( f ) = γ T + 1 2 λ ω 2
T represents the depth of the current subtree, ω represents the values of the leaf nodes, and λ and γ are unit coefficients. Using Taylor expansion, Equation (1) is transformed into:
L t = i = 1 n l y i , y ^ i t 1 + g i f t x i + 1 2 h i f t 2 x i + Ω f t
Here, g i = l y i , y ^ i t 1 y ^ i t 1 represents the first-order derivative, which is a known value that can be calculated; h i = 2 l y i , y ^ i t 1 y ^ i t 1 2 represents the second-order derivative, which is a known value that can be calculated.

3.3.4. Model Evaluation, Improvement, and Validation

The performance judgment of classification indicators generally includes Accuracy, Precision, Recall and F1 score values, etc. The F1 score indicator combines precision and recall to balance and improve precision and recall, keeping the difference between the two as small as possible (see Equation (6)) [50]. The F1 score is suitable for two-classification problems, and extending it to multi-classification issues can lead to two indicators, Micro-F1 and Macro-F1. This article plans to use Macro-F1 to determine the merits of performance targets. The XGBoost evaluation results are as follows: Precision: 0.863; Recall: 0.619; F1 score: 0.81. The overall performance is excellent and can be used for subsequent predictive analysis.
F 1 = 2 1 p r e c i s i o n + 1 r e c a l l = 2 × p r e c i s i o n × r e c a l l p r e c i s i o n + r e c a l l = T P T P + F N + F P 2
Input the design variable parameter values into the machine learning algorithm and compare the generated results with the prediction results in machine learning. As can be seen from Table 8, the overall prediction level is high, with an accuracy rate of 83%, which can be used for subsequent evaluation and judgment of the overall solution.

4. Results: Program Evaluation

During the program evaluation phase, this paper selected a site within the study area for design research. The first image on the left in Figure 24 is labelled “Status of the Base”. It shows that the original site has a high building density. The self-shading caused by the buildings themselves is not conducive to improving winter outdoor comfort. The fragmented building volumes also result in a high overall shape coefficient, which is inefficient from an energy-saving perspective. Therefore, it is necessary to consolidate and increase the building volumes. Using a machine learning algorithm, the parameters of the original courtyards on the site were input into the algorithm model to obtain the Overall Performance Score. For ease of comparing performance improvements across multiple design schemes, the existing buildings were pre-zoned according to their intended functions: Master Workshop, Business Community, Guesthouse, and Cultural Exhibitions. The parameters of the courtyards in each area were input into the machine learning model for scoring, resulting in scores of D4, E5, E5, and D4, respectively. Design schemes will also assess the performance of these four areas to observe the results of performance improvements.
In the specific design phase, the design strategies derived from the previous performance analysis were used to map typical courtyard prototypes and clusters onto the site, followed by adjustments based on project requirements. Depending on the expected outcomes of the schemes, three plans were proposed: preservation-focused, new construction-focused, and phased development-focused, corresponding to plan 1, plan 2, and plan 3 in Figure 24. A machine learning prediction model was used to rapidly evaluate these solutions’ performance in terms of comfort, energy efficiency, etc. Except for the master workshop and business community, the other functional areas were divided into several unit courtyards. Relevant data for these courtyards was input into the algorithm model for evaluation. Due to the unique layout of the master workshop and business community, which includes large spaces and some gray spaces that are difficult to divide into unit courtyards, indoor and outdoor comfort and energy consumption for these areas were calculated directly using the Honeybee plug-in. The results were compared with the performance of unit courtyards in the same area, and a performance rating was estimated.
Table 9 shows the performance ratings of each functional area for all plans. It can be seen from the table that each plan has improved performance ratings in each area. By weighting the area of each functional zone with its corresponding performance rating and normalizing the result to a 0–100 scale, the Overall Performance Score is obtained. The results show that plan 3 has the best performance, with a score of 85.82, significantly higher than other solutions’ scores. Among them, the improvement of the Guesthouse and Master Workshop areas is the most obvious compared with other options, reaching the A1 rating. Compared with the original status of the base, plan 3 has improved the Overall Performance Score by 44.8%. This comprehensive approach, considering boundary optimization, functional zoning, and performance evaluation, provides scientific and efficient guidance for renovating traditional neighborhoods.

5. Discussion

In the realm of spatial environment optimization methodologies within traditional village contexts, existing literature predominantly revolves around idealized algorithmic frameworks [51,52], with limited translation into practical building design endeavors. The emphasis often centers on mitigating building energy consumption [53,54], overlooking crucial facets like the wind environment, natural illumination, thermal comfort, and courtyard combination. Prevailing approaches in performance-centric built environment design directly apply optimization techniques to specific issues, focusing on physical parameters such as envelope properties (e.g., wall K-values, window shading coefficients) [55,56]. However, scant attention is given to morphological characteristics like building dimensions and window placement, resulting in a dearth of systematic and actionable optimization methodologies. The spatial environment optimization discussed in this study pertains to schematic design refinement, requiring continual alignment with predefined objectives and iterative decision-making. This endeavor inherently grapples with multi-objective optimization, particularly as contemporary architectural imperatives demand multifaceted functionalities, interdisciplinary integration, and heightened efficiency standards. Performance-driven spatial environment optimization, rooted in a streamlined design process, emerges as a compelling alternative to traditional architectural paradigms, poised for wider applicability and efficacy.
Compared to traditional building performance simulation or optimization algorithms, the workflow proposed in this study utilizes the XGBoost algorithm to predict planning scheme performance quickly by evaluating the training dataset. This approach significantly reduces both time and economic costs. Nevertheless, the practical applicability of this workflow still needs improvement. First, collecting the training dataset requires considerable time. The analysis timeframe for comfort indicators is currently limited to typical weeks in summer and winter due to the high time cost of nearly a thousand iterations. The future data collection will include various periods. Second, the article primarily focuses on the performance of light and thermal environments in village courtyards. However, in actual village construction, factors such as indoor and outdoor air quality, acoustic environment, and others are equally crucial. These factors significantly impact the overall environment of the village and the residents’ daily experiences. Future research will aim to calculate performance indicators such as acoustics and air quality and explore coupling methods between them to further enhance the multi-objective optimization design software platform for villages.

6. Conclusions

To predict and optimize the overall performance of traditional village courtyards quickly in the early planning stages, this paper combines performance-driven design based on multi-objective optimization with a data-driven design using machine learning algorithms, proposing a corresponding workflow. Specifically, in the pre-processing stage, comparing different courtyard types revealed that with similar courtyard areas, Type 9 and Type 10 three-sided courtyards had approximately 5% higher summer PET comfort time ratios and 2% higher winter PET comfort time ratios than other types. In the performance analysis stage, the study of courtyard units showed that, compared to the baseline model, the optimized three-sided courtyards improved energy efficiency by 32.3%, Outdoor_C by 8.3%, and Outdoor_H by 3.8%, though indoor illuminance (sDA) decreased by 8.8%. Different optimization schemes can be derived by setting different weights for performance objectives. The analysis of courtyard combinations indicated that changing the building floors and the number of courtyards oriented north-south can influence wind performance. For example, in summer, three-courtyard houses with an average height of one story achieved the highest average wind speed of 2.5 m/s. Wind performance diminishes with an increasing number of courtyard combinations. Still, dispersed layouts in multi-courtyard houses can increase wind speed to 2.0 m/s, with specific combination strategies adjusted according to design needs. In the data prediction stage, model parameters were optimized using grid search and cross-validation. After comparing several machine learning models, the XGBoost algorithm, which showed high prediction accuracy, was selected, improving the F1 score to 0.81. The accuracy of predictions under different performance labels reached 83%. Three schemes were proposed in the validation stage based on the earlier design strategies. Scheme 3 improved the performance score of existing buildings from 59.12 to 85.62. The study demonstrates that an early design method for the energy efficiency of traditional village courtyards, based on data and performance, can effectively help architects generate comprehensive designs with excellent performance.
However, this study has certain limitations. First, it focuses on the initial stages of village planning, and the resulting design schemes are intended only for use in the conceptual layout phase. Second, the weights for outdoor thermal comfort, building energy consumption, and indoor illuminance were set based on survey experience. In actual projects, these should be adjusted according to the specific needs of the users. Finally, the algorithm models generated in the data-driven stage are specific to particular regions, limiting their general applicability. Future research should integrate more design variables from traditional village courtyards, enhancing the speed of interaction between performance-driven and data-driven methods while maintaining analysis accuracy and providing more rigorous strategy services for design. Future work will also seek more efficient algorithms in machine learning to address more complex and practical issues encountered in traditional village layout design.

Author Contributions

Conceptualization, Z.X.; Methodology, Z.X., X.H. and X.Z.; Software, Z.X., X.H. and B.S.; Validation, Z.X., J.-Y.D. and B.S.; Formal analysis, Z.X. and J.-Y.D.; Investigation, Z.X., X.H. and J.-Y.D.; Resources, X.Z.; Data curation, Z.X.; Writing–original draft, Z.X.; Writing–review & editing, Z.X.; Project administration, X.H. All authors have read and agreed to the published version of the manuscript.

Funding

This study has been funded by the Postgraduate Research & Practice Innovation Program of Jiangsu Province (Grant No. KYCX19_0090).

Institutional Review Board Statement

Not applicable.

Informed Consent Statement

Not applicable.

Data Availability Statement

The data presented in this study are available on request from the corresponding author.

Conflicts of Interest

The authors declare no conflict of interest.

References

  1. Pata, U.K. Linking renewable energy, globalization, agriculture, CO2 emissions and ecological footprint in BRIC countries: A sustainability perspective. Renew. Energy 2021, 173, 197–208. [Google Scholar] [CrossRef]
  2. Cao, X.; Dai, X.; Liu, J. Building energy-consumption status worldwide and the state-of-the-art technologies for zero-energy buildings during the past decade. Energy Build. 2016, 128, 198–213. [Google Scholar] [CrossRef]
  3. Chen, M.; Liu, W.; Tao, X. Evolution and assessment on China’s urbanization 1960–2010: Under-urbanization or over-urbanization? Habitat. Int. 2013, 38, 25–33. [Google Scholar] [CrossRef]
  4. Long, H.; Zou, J.; Pykett, J.; Li, Y. Analysis of rural transformation development in China since the turn of the new millennium. Appl. Geogr. 2011, 31, 1094–1105. [Google Scholar] [CrossRef]
  5. Wang, X.R.; Hui, E.C.M.; Choguill, C.; Jia, S.H. The new urbanization policy in China: Which way forward? Habitat. Int. 2015, 47, 279–284. [Google Scholar] [CrossRef]
  6. Xiong, Y.; Zhang, J.; Yan, Y.; Sun, S.; Xu, X.; Higueras, E. Effect of the spatial form of Jiangnan traditional villages on microclimate and human comfort. Sustain. Cities Soc. 2022, 87, 104136. [Google Scholar] [CrossRef]
  7. Lyu, Y.; Zhang, L.; Liu, X.; Ma, X. Microclimate-Adaptive Morphological Parametric Design of Streets and Alleys in Traditional Villages. Buildings 2024, 14, 152. [Google Scholar] [CrossRef]
  8. Zang, H.Y.; Hsieh, C.M.; Cang, Y.; Gu, M. Microclimate adaptability analysis of waterfront traditional villages: A case study of Mingyuewan Village in Suzhou. J. Water Clim. Chang. 2023, 14, 3329–3344. [Google Scholar] [CrossRef]
  9. Sun, M.; Xue, Y.; Wang, L. Research on Optimized Design of Rural Housing in Cold Regions Based on Parametrization and Machine Learning. Sustainability 2024, 16, 667. [Google Scholar] [CrossRef]
  10. Zhu, L.; Liao, H.; Hou, B.; Cheng, L.; Li, H. The status of household heating in northern China: A field survey in towns and villages. Environ. Sci. Pollut. Res. 2020, 27, 16145–16158. [Google Scholar] [CrossRef]
  11. Jin, H.; Ling, W. External wall structure of green rural houses in Daqing, China, based on life cycle and ecological footprint theories. Front. Arch. Res. 2015, 4, 212–219. [Google Scholar] [CrossRef]
  12. Zhu, L.; Wang, B.; Sun, Y. Multi-objective optimization for energy consumption, daylighting and thermal comfort performance of rural tourism buildings in north China. Build. Environ. 2020, 176, 106841. [Google Scholar] [CrossRef]
  13. Liu, Z.; Wu, D.; He, B.J.; Wang, Q.; Yu, H.; Ma, W.; Jin, G. Evaluating potentials of passive solar heating renovation for the energy poverty alleviation of plateau areas in developing countries: A case study in rural Qinghai-Tibet Plateau, China. Sol. Energy 2019, 187, 95–107. [Google Scholar] [CrossRef]
  14. Wang, W.; Yuan, M.; Li, Y.Z.; Li, C. Numerical investigation on the impact of an on-top sunspace passive heating approach for typical rural buildings in northern China. Sol. Energy 2019, 186, 300–310. [Google Scholar] [CrossRef]
  15. Li, D.; Zhang, C.; Li, Q.; Liu, C.; Arıcı, M.; Wu, Y. Thermal performance evaluation of glass window combining silica aerogels and phase change materials for cold climate of China. Appl. Therm. Eng. 2020, 165, 114547. [Google Scholar] [CrossRef]
  16. Martinelli, L.; Matzarakis, A. Influence of height/width proportions on the thermal comfort of courtyard typology for Italian climate zones. Sustain. Cities Soc. 2017, 29, 97–106. [Google Scholar] [CrossRef]
  17. Andreou, E. The effect of urban layout, street geometry and orientation on shading conditions in urban canyons in the Mediterranean. Renew. Energy 2014, 63, 587–596. [Google Scholar] [CrossRef]
  18. Taleghani, M.; Tenpierik, M.; van den Dobbelsteen, A. Indoor thermal comfort in urban courtyard block dwellings in the Netherlands. Build. Environ. 2014, 82, 566–579. [Google Scholar] [CrossRef]
  19. Deng, Q.; Wang, G.; Wang, Y.; Zhou, H.; Ma, L. A quantitative analysis of the impact of residential cluster layout on building heating energy consumption in cold IIB regions of China. Energy Build. 2021, 253, 111515. [Google Scholar] [CrossRef]
  20. Chatzipoulka, C.; Compagnon, R.; Kaempf, J.; Nikolopoulou, M. Sky view factor as predictor of solar availability on building façades. Sol. Energy 2018, 170, 1026–1038. [Google Scholar] [CrossRef]
  21. Röck, M.; Hollberg, A.; Habert, G.; Passer, A. LCA and BIM: Visualization of environmental potentials in building construction at early design stages. Build. Environ. 2018, 140, 153–161. [Google Scholar] [CrossRef]
  22. Leatherbarrow, D. Architecture Oriented Otherwise, 1st ed.; Princeton Architectural Press: New York, NY, USA, 2009. [Google Scholar]
  23. Negroponte, N. The architecture machine. Comput. Aided Des. 1975, 7, 190–195. [Google Scholar] [CrossRef]
  24. Xiao, T.; Sheng, L.; Zhang, S.; Zheng, L.; Shui, T. Thermal Comfort Improvement Strategies for Outdoor Spaces in Traditional Villages Based on ENVI-Met: Shimengao Village in Chizhou City. Sustainability 2023, 15, 11785. [Google Scholar] [CrossRef]
  25. Zeng, Z.; Li, L.; Pang, Y. Analysis on climate adaptability of traditional villages in Lingnan, China–World Cultural Heritage Site of Majianglong Villages as example. Procedia Eng. 2017, 205, 2011–2018. [Google Scholar] [CrossRef]
  26. Yao, X.; Han, S.; Dewancker, B. Wind environment simulation accuracy in traditional villages with complex layouts based on CFD. Int. J. Environ. Res. Public Health 2021, 18, 8644. [Google Scholar] [CrossRef]
  27. Molake, A.; Zhang, R.; Zhou, Y. Multi-Objective Optimization of Daylight Performance and Thermal Comfort of Enclosed-Courtyard Rural Residence in a Cold Climate Zone, China. Sustainability 2023, 15, 7953. [Google Scholar] [CrossRef]
  28. Xi, H.; Gao, H.; Hou, W.; Yin, B.; Zuo, J.; Zhao, H. Multi-Objective Optimization for Winter Heating Retrofit in Rural Houses of Cold Regions: A Case Study in the Wusu Area. Appl. Sci. 2024, 14, 3760. [Google Scholar] [CrossRef]
  29. Reynolds, P.; Pavic, A.; Ibrahim, Z. A remote monitoring system for stadia dynamics. Proc. Inst. Civ. Eng.-Struct. Build. 2004, 157, 385–393. [Google Scholar] [CrossRef]
  30. Bouyer, J.; Vinet, J.; Delpech, P.; Carré, S. Thermal comfort assessment in semi-outdoor environments: Application to comfort study in stadia. J. Wind Eng. Ind. Aerod. 2007, 95, 963–976. [Google Scholar] [CrossRef]
  31. Haghighat, E.; Juanes, R. SciANN: A Keras/TensorFlow wrapper for scientific computations and physics-informed deep learning using artificial neural networks. Comput. Methods Appl. Mech. Eng. 2021, 373, 113552. [Google Scholar] [CrossRef]
  32. Li, Q.; Yang, Y.; Guo, Y.; Li, W.; Liu, Y.; Liu, H.; Kang, Y. Performance evaluation of deep learning classification network for image features. IEEE Access 2021, 9, 9318–9333. [Google Scholar] [CrossRef]
  33. Satrio, P.; Mahlia, T.M.I.; Giannetti, N.; Saito, K. Optimization of HVAC system energy consumption in a building using artificial neural network and multi-objective genetic algorithm. Sustain. Energy Technol. Assess. 2019, 35, 48–57. [Google Scholar]
  34. Cannistraro, G.; Cannistraro, M.; Restivo, R. The local media radiant temperature for the calculation of comfort in areas characterized by radiant surfaces. Int. J. Heat Technol. 2015, 33, 115–122. [Google Scholar] [CrossRef]
  35. Cannistraro, M.; Trancossi, M. Enhancement of indoor comfort in the presence of large glazed radiant surfaces by a local heat pump system based on Peltier cells. Therm. Sci. Eng. Prog. 2019, 14, 100388. [Google Scholar] [CrossRef]
  36. Jović, S.; Arsić, N.; Vilimonović, J.; Petković, D. Thermal sensation prediction by soft computing methodology. J. Therm. Biol. 2016, 62, 106–108. [Google Scholar] [CrossRef]
  37. Yan, H.; Yan, K.; Ji, G. Optimization and prediction in the early design stage of office buildings using genetic and XGBoost algorithms. Build. Environ. 2022, 218, 109081. [Google Scholar] [CrossRef]
  38. Mi, J.; Hong, B.; Zhang, T.; Huang, B.; Niu, J. Outdoor thermal benchmarks and their application to climate–responsive designs of residential open spaces in a cold region of China. Build. Environ. 2020, 169, 106592. [Google Scholar] [CrossRef]
  39. Yuan, T.; Hong, B.; Qu, H.; Liu, A.; Zheng, Y. Outdoor thermal comfort in urban and rural open spaces: A comparative study in China’s cold region. Urban Clim. 2023, 49, 101501. [Google Scholar] [CrossRef]
  40. GB/T50034-2024; Standard for Lighting Design of Buildings. China Architecture & Building Press: Beijing, China, 2024.
  41. Albadr, M.A.; Tiun, S.; Ayob, M.; Al-Dhief, F. Genetic algorithm based on natural selection theory for optimization problems. Symmetry 2020, 12, 1758. [Google Scholar] [CrossRef]
  42. Hashempour, N.; Taherkhani, R.; Mahdikhani, M. Energy performance optimization of existing buildings: A literature review. Sustain. Cities Soc. 2020, 54, 101967. [Google Scholar] [CrossRef]
  43. Kiss, B.; Szalay, Z. Modular approach to multi-objective environmental optimization of buildings. Automat. Constr. 2020, 111, 103044. [Google Scholar] [CrossRef]
  44. Sijgers, L.; Sorensen, T.; Soulby, A.; Boyle, P.; Dalbert, A.; Röösli, C.; Jablonski, G.E.; Hamacher, V.; Greisiger, R.; Jiang, D.; et al. Classification of Acoustic Hearing Preservation After Cochlear Implantation Using Electrocochleography. Trends Hear. 2023, 27, 23312165231220997. [Google Scholar] [CrossRef]
  45. Chen, T.; Guestrin, C. Xgboost: A scalable tree boosting system. In Proceedings of the 22nd Acm Sigkdd International Conference on Knowledge Discovery and Data Mining, San Francisco, CA, USA, 13–17 August 2016; pp. 785–794. [Google Scholar]
  46. Mo, H.; Sun, H.; Liu, J.; Wei, S. Developing window behavior models for residential buildings using XGBoost algorithm. Energy Build. 2019, 205, 109564. [Google Scholar] [CrossRef]
  47. Fan, J.; Wang, X.; Wu, L.; Zhou, H.; Zhang, F.; Yu, X.; Lu, X.; Xiang, Y. Comparison of Support Vector Machine and Extreme Gradient Boosting for predicting daily global solar radiation using temperature and precipitation in humid subtropical climates: A case study in China. Energy Convers. Manag. 2018, 164, 102–111. [Google Scholar] [CrossRef]
  48. Wang, W.; Chakraborty, G.; Chakraborty, B. Predicting the risk of chronic kidney disease (ckd) using machine learning algorithm. Appl. Sci. 2020, 11, 202. [Google Scholar] [CrossRef]
  49. Pan, S.; Zheng, Z.; Guo, Z.; Luo, H. An optimized XGBoost method for predicting reservoir porosity using petrophysical logs. J. Pet. Sci. Eng. 2022, 208, 109520. [Google Scholar] [CrossRef]
  50. Chicco, D.; Jurman, G. The advantages of the Matthews correlation coefficient (MCC) over F1 score and accuracy in binary classification evaluation. BMC Genom. 2020, 21, 6. [Google Scholar] [CrossRef]
  51. Teshnehdel, S.; Mirnezami, S.; Saber, A.; Pourzangbar, A.; Olabi, A.G. Data-driven and numerical approaches to predict thermal comfort in traditional courtyards. Sustain. Energy Technol. Assess. 2020, 37, 100569. [Google Scholar] [CrossRef]
  52. Wang, W.; Liu, K.; Zhang, M.; Shen, Y.; Jing, R.; Xu, X. From simulation to data-driven approach: A framework of integrating urban morphology to low-energy urban design. Renew. Energy 2021, 179, 2016–2035. [Google Scholar] [CrossRef]
  53. Cheng, F.; Cui, C.; Cai, W.; Zhang, X.; Ge, Y.; Li, B. A novel data-driven air balancing method with energy-saving constraint strategy to minimize the energy consumption of ventilation system. Energy 2022, 239, 122146. [Google Scholar] [CrossRef]
  54. Yang, S.; Yu, J.; Gao, Z.; Zhao, A. Energy-saving optimization of air-conditioning water system based on data-driven and improved parallel artificial immune system algorithm. Energy Convers. Manag. 2023, 283, 116902. [Google Scholar] [CrossRef]
  55. Tahmasebi, F.; Mahdavi, A. An inquiry into the reliability of window operation models in building performance simulation. Build. Environ. 2016, 105, 343–357. [Google Scholar] [CrossRef]
  56. Jannat, N.; Hussien, A.; Abdullah, B.; Cotgrave, A. A comparative simulation study of the thermal performances of the building envelope wall materials in the tropics. Sustainability 2022, 12, 4892. [Google Scholar] [CrossRef]
Figure 1. Overall workflow.
Sustainability 16 05779 g001
Figure 2. Research object location (As shown in the position marked by the five-pointed star in the figure).
Sustainability 16 05779 g002
Figure 3. Distribution of Testing Points (The numbers next to the circles indicate the order of the measurement points).
Sustainability 16 05779 g003
Figure 4. On-site photo of the testing instruments.
Sustainability 16 05779 g004
Figure 5. Comparison of simulated and measured outdoor air temperatures.
Sustainability 16 05779 g005
Figure 6. Comparison of simulated and measured globe temperatures.
Sustainability 16 05779 g006
Figure 7. Comparison of simulated and measured relative humidity.
Sustainability 16 05779 g007
Figure 8. Comparison of simulated and measured wind speeds.
Sustainability 16 05779 g008
Figure 9. Aerial View of the Measured Courtyard.
Sustainability 16 05779 g009
Figure 10. Courtyard Classification Diagram.
Sustainability 16 05779 g010
Figure 11. PET comfort time ratio_Typical summer and winter weeks.
Sustainability 16 05779 g011
Figure 12. Baseline Model and Site Environment settings.
Sustainability 16 05779 g012
Figure 13. Layout corresponding to the 59th generation Pareto front solution set.
Sustainability 16 05779 g013
Figure 14. Courtyard layout optimization based on different optimization goals.
Sustainability 16 05779 g014
Figure 15. Performance simulation results of the optimal courtyard unit selected by Average of Fitness Ranks. Red refers to: Floor Normalized Electric Equipment Energy for Building(Monthly); Orange refers to: Floor Normalized Electric Lighting Energy for Building(Monthly); Light blue refers to: Floor Normalized Heating Load for Building(Monthly); Dark blue refers to: Floor Normalized Cooling Load for Building(Monthly).
Sustainability 16 05779 g015
Figure 16. PET comfort time and wind speed distribution during typical summer and winter weeks. (three-courtyard houses).
Sustainability 16 05779 g016
Figure 17. PET comfort time and wind speed distribution during typical summer and winter weeks. (four-courtyard houses).
Sustainability 16 05779 g017
Figure 18. PET comfort time and wind speed distribution during typical summer and winter weeks. (five-courtyard houses).
Sustainability 16 05779 g018
Figure 19. Statistical results of the PET comfort time ratio for courtyard combinations. (the left is for the typical week in winter, and the right is for the typical week in summer; see below). The red on the graph indicates the maximum value of this row.
Sustainability 16 05779 g019
Figure 20. Statistical results of the area ratio of the quiet wind zone for courtyard combinations. The red on the left represents the maximum value of this row, and the red on the right represents the minimum value of this row.
Sustainability 16 05779 g020
Figure 21. Correlation analysis between the PET comfort time ratio and the area ratio of the quiet wind zone.
Sustainability 16 05779 g021
Figure 22. Schematic diagram of 5-fold cross-validation.
Sustainability 16 05779 g022
Figure 23. Schematic diagram of the XGBoost regression tree model.
Sustainability 16 05779 g023
Figure 24. The general plan of different schemes.
Sustainability 16 05779 g024
Table 1. Error Test Standards.
Standard/GuidelineHourly Criteria
MBE (%)CV(RMSE) (%)
ASHARE Guideline 141030
IPMVP 520
FEMP 1030
Table 2. Classification table of courtyards.
ClassificationNo.OrientationCourtyard LocationNo. Floors of the Main HouseCategory Code **Total Categories
Traditional Courtyards (34)4-sided3North-southCentral2 *1c/1h18
22c/2h
15c/5h
East-westCentral2 *4c/4h
23c/3h
3-sided7North-southSouth2 *10c/10h
29c/9h
17c/7h
East-westEast28c/8h
16c/6h
2-sided11North-southCentral212c/12h
113c/13h
Southeast211c/11h
East-westCentral215c/15h
116c/16h
Northeast214c/14h
1-sided13North-southSouth118c/18h
East-westEast117c/17h
* The main house and the secondary house are both two-story buildings. ** “c” stands for cold days, and “h” stands for hot days.
Table 3. Energy model settings.
IndexEnergy Model Parameters
Wall5 mm Cement mortar + 370 mm Fired claybrick
U-value = 1.72 W·m−2·K−1
Floor10 mm Ceramic tile + 100 mm Concrete + 1500 mm Plain soil compaction
U-value = 0.47 W·m−2·K−1
RoofColor steel plate + 10 mm Asphalt felt + 10 mm Grass clay + 200 mm Cement mortar
U-value = 1.94 W·m−2·K−1
GlazingWooden Glass
U-value = 5.03 W·m−2·K−1 SHGC = 0.6
ShadingNot applied
Equipment loads per area3.8 W·m−2
Infiltration rate per area0.4 cfm/sf facade @ 75 Pa
Lighting density per area11.8 W·m−2
Num. of people per area0.03 people·m−2
SchedulesDefault Honeybee residential schedules
HVACIdeal mechanical system
Heating setpoint16 °C
Cooling setpoint26 °C
Table 4. Design variable parameter range.
Design VariablesUnitScopeDistribution Type
Courtyard widthm[9, 12]Continuous
Standard floor heightm[2.7, 4.0]Continuous
Orientation°[−45, 45]Continuous
Secondary-house Floor Control-[−1, 1]Discrete
WWR-[0, 0.35]Continuous
Table 5. Baseline model design variables.
Design Variables
Courtyard widthHeight_NHeight_EHeight_WOrientationSecondary-house Floor ControlW_N/W_S/W_W1/W_E1/W_W2/W_E2
10.8 m6.3 m2.9 m6 m−19°00.1/0.3/0.1/0.3/0.4/0.1
Table 6. Baseline model performance objectives.
Performance Objectives
FO1: OTCA_CFO2: OTCA_HFO3: sDAFO4: EUI
−0.06−0.26−0.790.31
Table 7. Average wind speed conditions for different courtyard combinations.
No. of
Courtyards
IndexAverage
No. of Floors
Height
Distribution
Vc
(m/s)
Vh
(m/s)
3c31/h311-0.12.5
c32/h321.3-0.31.9
4c41/h411-0.12.3
c42/h421.25-0.32.1
c43/h431.5-0.42.2
5c51/h511-0.11.9
c52/h521.2-0.11.8
c53/h531.4Centralized0.21.7
c55/h551.4Dispersed0.32.0
c54/h541.6-0.31.9
Table 8. Design variables * and labels for six random cases.
IndexWH_NH_WH_EDW_N/W_S/W_W1/W_E1/W_W2/W_E2True LabelPredicted Label
1117.47.13.930.1/0.2/0.1/0.1/0.1/0.1AA
211.16.45.93.1−210.1/0.2/0.1/0.3/0.3/0.1BB
310.56.12.96−190.1/0.2/0.1/0.3/0.4/0.1CC
411.35.85.63.9−210.2/0.2/0.1/0.2/0.1/0.3DC
511.87.36.83.190.2/0.3/0.1/0.1/0.2/0.3EE
69.75.83.47.4110.3/0.3/0.1/0.3/0.1/0.1FF
* The following are the full names of the abbreviations for different design variables: W: Courtyard width; H_N: Height of the northern building of the courtyard; H_W: Height of the western building of the courtyard; H_E: Height of the eastern building of the courtyard; D: Degree (orientation); W_N/W_S/W_W1/W_E1/W_W2/W_E2: These represent the WWR for different facades, respectively.
Table 9. Performance evaluation scores of each scheme.
IndexFunctional
Division
Total Floor Area
(m2)
Performance
Rating
Overall Performance Score
Status of the BaseMaster workshop720D459.12
Business community1840E5
Guesthouse1620E5
Cultural exhibitions1510D4
Plan 1Master workshop550C361.75
Business community1770B2
Guesthouse1460A1
Cultural exhibitions1410C3
Plan 2Master workshop720B271.12
Business community1840B2
Guesthouse1620B2
Cultural exhibitions1510B2
Plan 3Master workshop720A185.62
Business community1790B2
Guesthouse1620A1
Cultural exhibitions1550B2
Disclaimer/Publisher’s Note: The statements, opinions and data contained in all publications are solely those of the individual author(s) and contributor(s) and not of MDPI and/or the editor(s). MDPI and/or the editor(s) disclaim responsibility for any injury to people or property resulting from any ideas, methods, instructions or products referred to in the content.

