Article

New Changes in Chinese Urban Tourism Pattern under the Impact of COVID-19 Pandemic: Based on Internet Attention

Business College, Shandong Normal University, Jinan 250358, China
*
Author to whom correspondence should be addressed.
Sustainability 2024, 16(14), 5853; https://doi.org/10.3390/su16145853
Submission received: 30 May 2024 / Revised: 27 June 2024 / Accepted: 2 July 2024 / Published: 9 July 2024

Abstract

:
Internet attention, as a reflection of the actual focus of the public, not only responds to potential tourism demand but also represents the overall perception and preference characteristics of tourists for a tourist destination. The study selected eight representative tourist cities in China as research objects. The impact of the COVID-19 pandemic on the tourism patterns of Chinese cities was analysed using various analytical methods, including the seasonal characteristic index, the entropy value method, the coefficient of variation, and the tourism background trend line model. The study revealed the following conclusions: (1) following the conclusion of the epidemic, potential tourism demand demonstrated a notable recovery in comparison to the epidemic period, yet remained below the level observed in the same period before the epidemic. (2) The seasonal variations in internet attention after the end of the epidemic demonstrated an increased degree of differentiation, with the tourism market tending to be more prosperous during the high season and less so during the low season. (3) The epidemic had a relatively minor impact on the internet attention of famous tourist attractions and natural ecological attractions. In contrast, it had a more significant influence on historical and cultural sites and modern amusement spots. The findings of this study offer insights that can inform the recovery and sustainable development of tourist cities in the post-pandemic era.

1. Introduction

In the early months of 2020, the COVID-19 pandemic rapidly spread throughout China, resulting in significant disruptions to the tourism industry, which relies on people’s transportation and spatial mobility. The pandemic led to the closure of numerous tourist attractions and the restructuring of numerous travel and hospitality businesses [1]. By 2023, the tourism market had comprehensively recovered following the conclusion of the three-year pandemic in China. Niewiadomski and Dominic suggest that the COVID-19 pandemic significantly impacted the tourism industry, but it also led to the industry’s transformation and presented an unprecedented opportunity to reboot tourism worldwide [2,3]. In this context, the examination of the impact of the pandemic on destination tourism patterns has become a significant research project, with implications for the recovery of destination tourism, crisis management, and the sustainable development of tourism destinations.
In the contemporary era, the internet has become an indispensable tool for tourists [4], serving as the primary conduit for obtaining tourism information and assisting in the decision-making process of trips [5], which is the embodiment of tourists’ subjective will and potential needs. Tourism internet attention, as a mapping of the public’s genuine concern and potential demand [6], has a precursor effect on the actual passenger flow, which can reflect the potential consumption tendency of tourists [7]. Baidu is currently the world’s largest and China’s most popular Chinese search engine. Internet attention is an essential functional module of the Baidu Index. Its research value and the accuracy of data are constantly confirmed. Several studies have demonstrated a significant positive correlation between the Baidu Index and the actual flow of tourists [8,9]. Additionally, the Baidu Index has been used in predicting tourism demand [10,11,12] and characterizing tourism flow [13]. In addition to the Baidu Index, public search data from other online platforms, such as Sina Weibo and short video platforms, have also been used to study tourism source markets [14,15,16]. Nevertheless, the Baidu Index has a broader time horizon and a more comprehensive dataset. Therefore, utilising the Baidu Index to investigate the alteration in tourist demand in destinations before and after the pandemic offers a novel avenue for researching the impact of the pandemic on the tourism sector.
Considering the considerations above, this study focuses on China’s representative tourist destinations as the research subject. The Baidu Index platform is used to comprehensively select the daily internet attention of the six elements of urban tourism and tourist attractions from 2017 to 2023 as raw data. The quantitative assessment of the loss, change, and recovery process of the city’s tourism internet attention under the impact of the COVID-19 pandemic was conducted from a multi-temporal and spatial scale. Based on the results of the analyses, recommendations for the development of tourism cities were proposed. To provide scientific references for the recovery of the tourism industry, the marketing of tourism, the accurate matching of supply and demand, and the sustainability of destinations in the post-epidemic era.

2. Literature Review

Research on the impact of pandemics on tourism began at the turn of the century, particularly in the wake of the SARS pandemic. This research has focused on the following areas: (1) quantitative assessment of the impact of the pandemic on destination tourism. Scholars use various methods to conduct quantitative assessments of the impact of SARS on tourist flows and the tourism economy of the destination. These include ARIMA (used for describing and analysing sudden and large-scale changes in a continuously changing system) [17], the cusp mutation model (a frequently employed time series forecasting model that can identify and represent trends and seasonality in data) [18], and the tourism background trend line (used for analysing the dynamic impact of events on tourism development by comparing actual values with natural trend lines that are not affected by emergencies) [19]. Furthermore, Fazlur Rahman et al. used a questionnaire to assess the impact of the COVID-19 pandemic on urban tourism-related services [20]. Duro et al. developed a tourism vulnerability index based on tourism dependency, the structure of the tourism market, the availability of rural accommodation, the incidence of the pandemic, and other factors particularly susceptible to the effects of the COVID-19 pandemic [21]. Since then, these indicators have also been frequently used in studies that assess the impact of pandemics on various tourist destinations. (2) The impact of the pandemic on tourist preferences is the second area of research. Huang et al. demonstrated that tourists preferred tourism destinations with lower population densities following the outbreak of the COVID-19 pandemic [22]. Kristýna et al. investigated the impact of the COVID-19 pandemic on tourism at cultural and natural heritage sites. The number of visitors to these sites was found to be relatively unaffected by the outbreak compared to other tourist attraction sites [23]. Ivanova posits that tourists are more inclined to choose proximity in terms of destination and private transportation in terms of means of transport following the advent of the COVID-19 pandemic [24]. (3) Most studies on the impact of pandemic tourists’ behavioural intentions are based on risk perception. The influence of the severity of the epidemic on the desire to travel was investigated by Jeong et al., who found that the risk perception of tourists had a significant impact on their tourism intentions [25]. Zhang et al. demonstrated that tourists’ risk perception can influence their willingness to engage in tourism and consumption, negatively correlating with tourism recovery in the new normal of the COVID-19 pandemic [26]. Zawadka’s study revealed that women exhibit a more robust perception of risk compared to men and tend to prefer safe methods of tourism, accommodation, and recreation [27]. (4) A significant proportion of current research on response and recovery from the impact of the epidemic has focused on the analytical framework of “resilience”. Using monthly panel data from 50 provinces, Boto-García et al. investigated the recovery of star-rated hotels in the context of the impact of the COVID-19 pandemic. Their findings indicate that provinces with greater pre-epidemic demand are more resilient to pandemic shocks [28]. Li et al. suggest that the resilience of destinations during a pandemic is determined by the structure of the regional economy, policies, and recovery measures [29]. Duro et al. propose a streamlined methodology for detecting urban tourism resilience indicators, which has important implications for regional responses to the epidemic and post-epidemic recovery [30].
Internet attention, including Google Trends and Baidu Index, refers to statistical data from well-known internet media on the extent to which internet users are engaged with specific content. The use of internet attention allows for the measurement of opinions and public cognitive preferences, and the comprehension of the public’s attitudes and cognitions towards a specific event [31,32,33,34]. Furthermore, it enables the comprehensive measurement of discrepancies in public attention and content preferences for the same phenomenon in disparate regions [35,36]. It provides a new way of thinking for exploring the impact of the pandemic on the city’s tourism patterns. A substantial body of research has been conducted on tourism internet attention, which has primarily focused on the analysis of spatial and temporal characteristics and influencing factors of the internet attention of tourist attractions [37,38] or regions [39,40], the prediction of tourism demand [41,42], the characterization of potential tourists [43], the correlation between internet attention and actual tourism flows [44], the impact of an event on internet attention [45,46], and other related studies.
The study above yielded a plethora of insights into the impact of the epidemic on tourism and the tourism internet attention. Nevertheless, there are a few areas that require further research and improvement. Firstly, regarding research on the impact of the epidemic on tourism, most existing studies focus on the overall evaluation of the impact of the epidemic on destinations. However, research on the internal variability of destination impacts and changes in source markets remains scarce. Secondly, in terms of research scales, most past studies used a single spatial scale as the boundary to analyse in a single period. There is a lack of research on analysing multiple spatial and temporal scales. Once again, regarding research data, the majority of which are statistical and survey data, the timeliness and accuracy of the data are relatively low. Limited by the limitations of data sources, scholars have difficulty in portraying the impact of the COVID-19 pandemic on the development of tourist destinations [47]. Therefore, there is an urgent need to employ big data for correlation studies. Finally, research on tourism internet attention has primarily concentrated on a single province or city, with little attention paid to studying a specific type of destination sharing common characteristics. Concerning temporal nodes, most studies have focused on the temporal and spatial evolution of internet attention and the factors affecting it before the COVID-19 pandemic. There is a lack of comparative studies on the changes in internet attention before and after the pandemic, as well as the extent of losses.
In summary, the impact of the COVID-19 pandemic on the internal variability of tourist destinations has been evaluated from a multi-temporal and spatial perspective through the utilization of big data, which is a crucial area of future research and the main focus of this study. This study enriches the research on the impact of the COVID-19 pandemic on destination tourism in terms of research data and research scales and fills a research gap.

3. Materials and Methods

3.1. Research Area

The study selected Beijing, Shanghai, Hangzhou, Shenzhen, Guangzhou, Chengdu, Wuhan, and Xi’an as research subjects for eight tourist cities. The selection process is as follows: firstly, the internet attention of 337 tourist cities recognized by the National Tourism Administration from 2017 to 2023 was retrieved using the search keywords “city + tourism” and “city + attractions”. The cities were then ranked according to the size of internet attention, and the top ten cities were Beijing, Shanghai, Hangzhou, Guangzhou, Shenzhen, Sanya, Xi’an, Chengdu, and Chongqing. The “Top 100 Most Online Influential Tourist Cities in China” is a joint initiative of the 21st Century Innovation Capital Research Institute and other organisations. It aims to rank China’s tourist cities based on 39 tertiary variables and 13 secondary variables in the following five dimensions: online popularity, urban vitality, fashionable life, industrial development, and impression evaluation. The ten most online influential tourist cities were Shanghai, Beijing, Hangzhou, Shenzhen, Guangzhou, Chengdu, Nanjing, Wuhan, Changsha, and Xi’an. Ultimately, eight tourist cities that ranked in the top ten for both internet attention and online influence were selected for this study.
Due to the country’s diverse cultural practices and regional characteristics, China is divided into the following six administrative regions: Northeast China, North China, East China, Central and South China, Northwest China, and Southwest China. The eight tourist cities selected represent five administrative regions, except for the Northeast (Figure 1), ensuring a broad and relatively representative scope.

3.2. Data Source

From the perspective of tourists, the tourism industry sector encompasses catering, accommodation, transportation, sightseeing, shopping, and entertainment. These tourism elements collectively serve to meet tourists’ needs. By analysing the data related to the indicators of these six tourism elements, the relationship between the structure of the city’s tourism industry and the overall level of development can be understood [29,48]. As valuable tourism resources, tourist attractions represent a significant component of the tourism industry and reflect the city’s tourism supply capacity [49,50]. Consequently, the selected search terms for the paper are “tourist attractions” and “elements of tourism”.
With the Baidu Index platform, keywords related to the internet attention of “tourism elements” and “tourist attractions” were comprehensively selected for searching. The procedures are as follows: ① first, based on the project module about the aspects of “catering, accommodation, transportation, sightseeing, shopping and entertainment” on the professional tourism website, we obtain the content of tourists’ concerns for each element and convert it into search keywords. The acquired keywords are then screened using the Baidu Index, and the search terms are expanded using automatic recommendation technology to determine the final search terms for each element (Table 1). The search terms for city tourism elements are the city plus the search terms. ② According to the number of tourist attractions in each of the eight representative tourist cities and the differences in popularity of those spots, we determine the number of samples of tourist attractions chosen in each city (Table 2). The popularity ranking of city attractions and the number of comments from tourists on tourism websites exceeding 1000 are used as screening conditions to determine the popular tourist attractions in eight cities. According to the search habits of tourists for each tourist attraction and keyword auto-recommendation technology, 1–3 keywords are identified as tourist attraction search terms (e.g., The Palace Museum, Beijing Forbidden City; The Forbidden City).
Ultimately, 446 keywords related to tourism in tourist cities were screened out. These include 288 keywords related to “tourism elements” and 158 keywords related to “tourist attractions”. Python crawled the daily search volume of 446 keywords corresponding to Beijing, Shanghai, Hangzhou, and other representative tourist cities between 1 January 2017, and 31 December 2023. These data were used to study the evolution of internet attention towards tourism in each representative tourist city.
In order to circumvent the issue of data outliers, the outliers are initially subjected to a series of tests and then removed. It is assumed that the data in question follow a normal distribution. “Outliers” are defined as data points in a set of data that deviate from the mean by more than three times the standard deviation. Subsequently, interpolation is used to replace the outliers. The corresponding domestic tourism reception trips of eight cities in the period 2017–2022 were obtained through the statistical yearbooks of each city. The Pearson correlation test was performed on the data of Baidu Index search volume for tourism-related search terms in each city to demonstrate the validity and scientific accuracy of the data. The test results indicate a significant and positive correlation between the Baidu Index search volume and the actual domestic tourism trips of the eight cities (r = 0.882, p < 0.05). This suggests that the search volume of the Baidu Index is responsive to the tourism demand of tourists to a significant extent.
The COVID-19 epidemic began in December 2019 and spread worldwide in January 2020. On 26 December 2022, China changed its epidemic prevention and control policy, moving the COVID-19 pandemic infection outbreak from “Infectious Disease Category A Prevention and Control” to “Infectious Disease Category B Control”. In light of this, the “pre-epidemic” period is defined in this study as the period from January 2017 to December 2019. The “epidemic period” is defined as the period from January 2020 to December 2022, and the “post-epidemic” period is defined as the period after January 2023.

3.3. Research Methodology

(1) Seasonal Characteristic Indicators
The Seasonal Concentration Index (S) is used to reflect the concentration of the distribution of the city’s tourism internet attention. It is calculated as follows:
S = i = 1 12 ( M i   8.33 ) 2 / 12
The Seasonal Concentration Index (S) is used to reflect the concentration of the distribution of city tourism internet attention. It is calculated by the formula mentioned above, where M i   is the percentage of each month’s attention in the whole year. The constant in the formula, 8.33 = 100/12, means that in the case of an average distribution of internet attention over the 12 months of the year, the weight of attention for each month would be 8.33. The larger the value of S is, the greater the difference in attention between the months of the year.
The Seasonal Variation Index ( S i ) is used to reflect fluctuations from month to month of city tourism internet attention. It is calculated using the following formula:
S i = 1 n j = 1 n x j i 1 12 i = 1 12 1 n j = 1 n x j i × 100 %
In this equation, x represents the internet attention in i th month of j th year and n is the number of years. The closer the value of S i is to the benchmark value of 1, the more uniform the distribution of internet attention is in that month.
(2) Entropy Weight Method
In this study, the entropy value method is used to compare and analyse the changes in the weights of the elements of tourism internet attention. The calculation process is as follows: first, the original data of the internet attention of tourism elements are mapped to the range of [0,1] through “standardization of extreme deviation”. Then, the entropy of information ( e j ) and the value of the information’s effect ( d j ) are calculated in sequence.
e j = K i = 1 8 X i j l n X i j
d j = 1 e j
where the constant K = 1 / n m , m is the number of samples, n is the number of indicators, and X i j is the internet attention of each tourism element in the city after standardization. Information effect value ( d j ) =1 − e j ; the larger the d j , the more important the indicator.
(3) Variation of Coefficient
The coefficient of variation (CV) is used to calculate the difference in internet attention between cities for each tourism element. It is calculated as follows:
C V j = 1 X ¯ i j i = 8 , j = 6 X i j X ¯ 2
where X i j is the jth element internet attention of i th city; X   ¯ is the average value of X i j ; C V j is the inter-city difference in the internet attention of tourism jth element. The larger C V j is, the larger the city difference in the internet attention of jth element is, and vice versa, the smaller it is.
(4) Geographical concentration index
The geographic concentration index ( G ) is an index used to measure the degree of concentration of a particular variable in a geographic area. This index is used in this study to calculate the concentration of internet attention at tourist attractions using the following formula:
G = 100 × i = 1 n X i / T 2
where X i is the internet attention of the ith tourist attractions; T is the total internet attention. The closer the value of G is to 100, the more centralized the internet attention is. Conversely, the more decentralized it is, the further the value of G is from 100.
(5) Tourism Background Line
The background trend line is the inherent trend line without the influence of emergencies, which can quantitatively assess the impact of emergencies on destination tourism [51]. It is calculated by selecting the starting year n a and the ending year n b , and then applying the interpolation equation to the virtual internet attention.
d = Y a Y a / n b n a
Y n = Y a + n n a × d
where n is the year of the processed data, Y a denotes the value of the interpolation starting point statistics, Y n denotes the corrected data in the nth year, and d is the value of the tolerance for carrying out linear interpolation.
(6) Standard Deviation Ellipse
The standard deviation ellipse is mainly used to reflect the overall contour and dominant distribution direction of the spatial nodes, and its centre point is the centre of gravity of the node distribution. The standard deviation ellipse consists of the following three metrics: the long-axis standard deviation, the short-axis standard deviation, and the angle of rotation. The long axis reflects the direction of maximum diffusion, the short axis reflects the direction of minimum expansion, and the angle of rotation reflects the angle that the long axis makes for the vertically upward direction, clockwise. The formulas for calculating the main parameters are as follows:
t a n θ = A + B C σ X = i = 1 n ( W i X ˜ i c o s θ W i Y ˜ i s i n θ ) 2 i = 1 n W i 2 A = ( i = 1 n W i 2 X ˜ i 2 i = 1 n W i 2 Y ˜ i 2 ) σ Y = i = 1 n ( W i X ˜ i s i n θ W i Y ˜ i c o s θ ) 2 i = 1 n W i 2 B = ( i = 1 n W i 2 X ˜ i 2 i = 1 n W i 2 Y ˜ i 2 ) 2 + 4 i = 1 n W i 2 X ˜ Y ˜ 2
In the above equation, X ˜ i and Y ˜ i represent the mean value of the spatial locality ( X i , Y i ) of the denoted research object, respectively; W i denotes the weight; θ is the ellipse azimuth angle, which denotes the angle formed by rotating clockwise from the north direction to the ellipse’s long axis; and σ X ,     σ Y denote the standard deviation along the X-axis and Y-axis, respectively. Changes in the size of the elliptical area characterize the aggregated discrete trend of the spatial distribution of nodes. This study utilizes these indicators to reflect the spatial distribution of tourism elements.

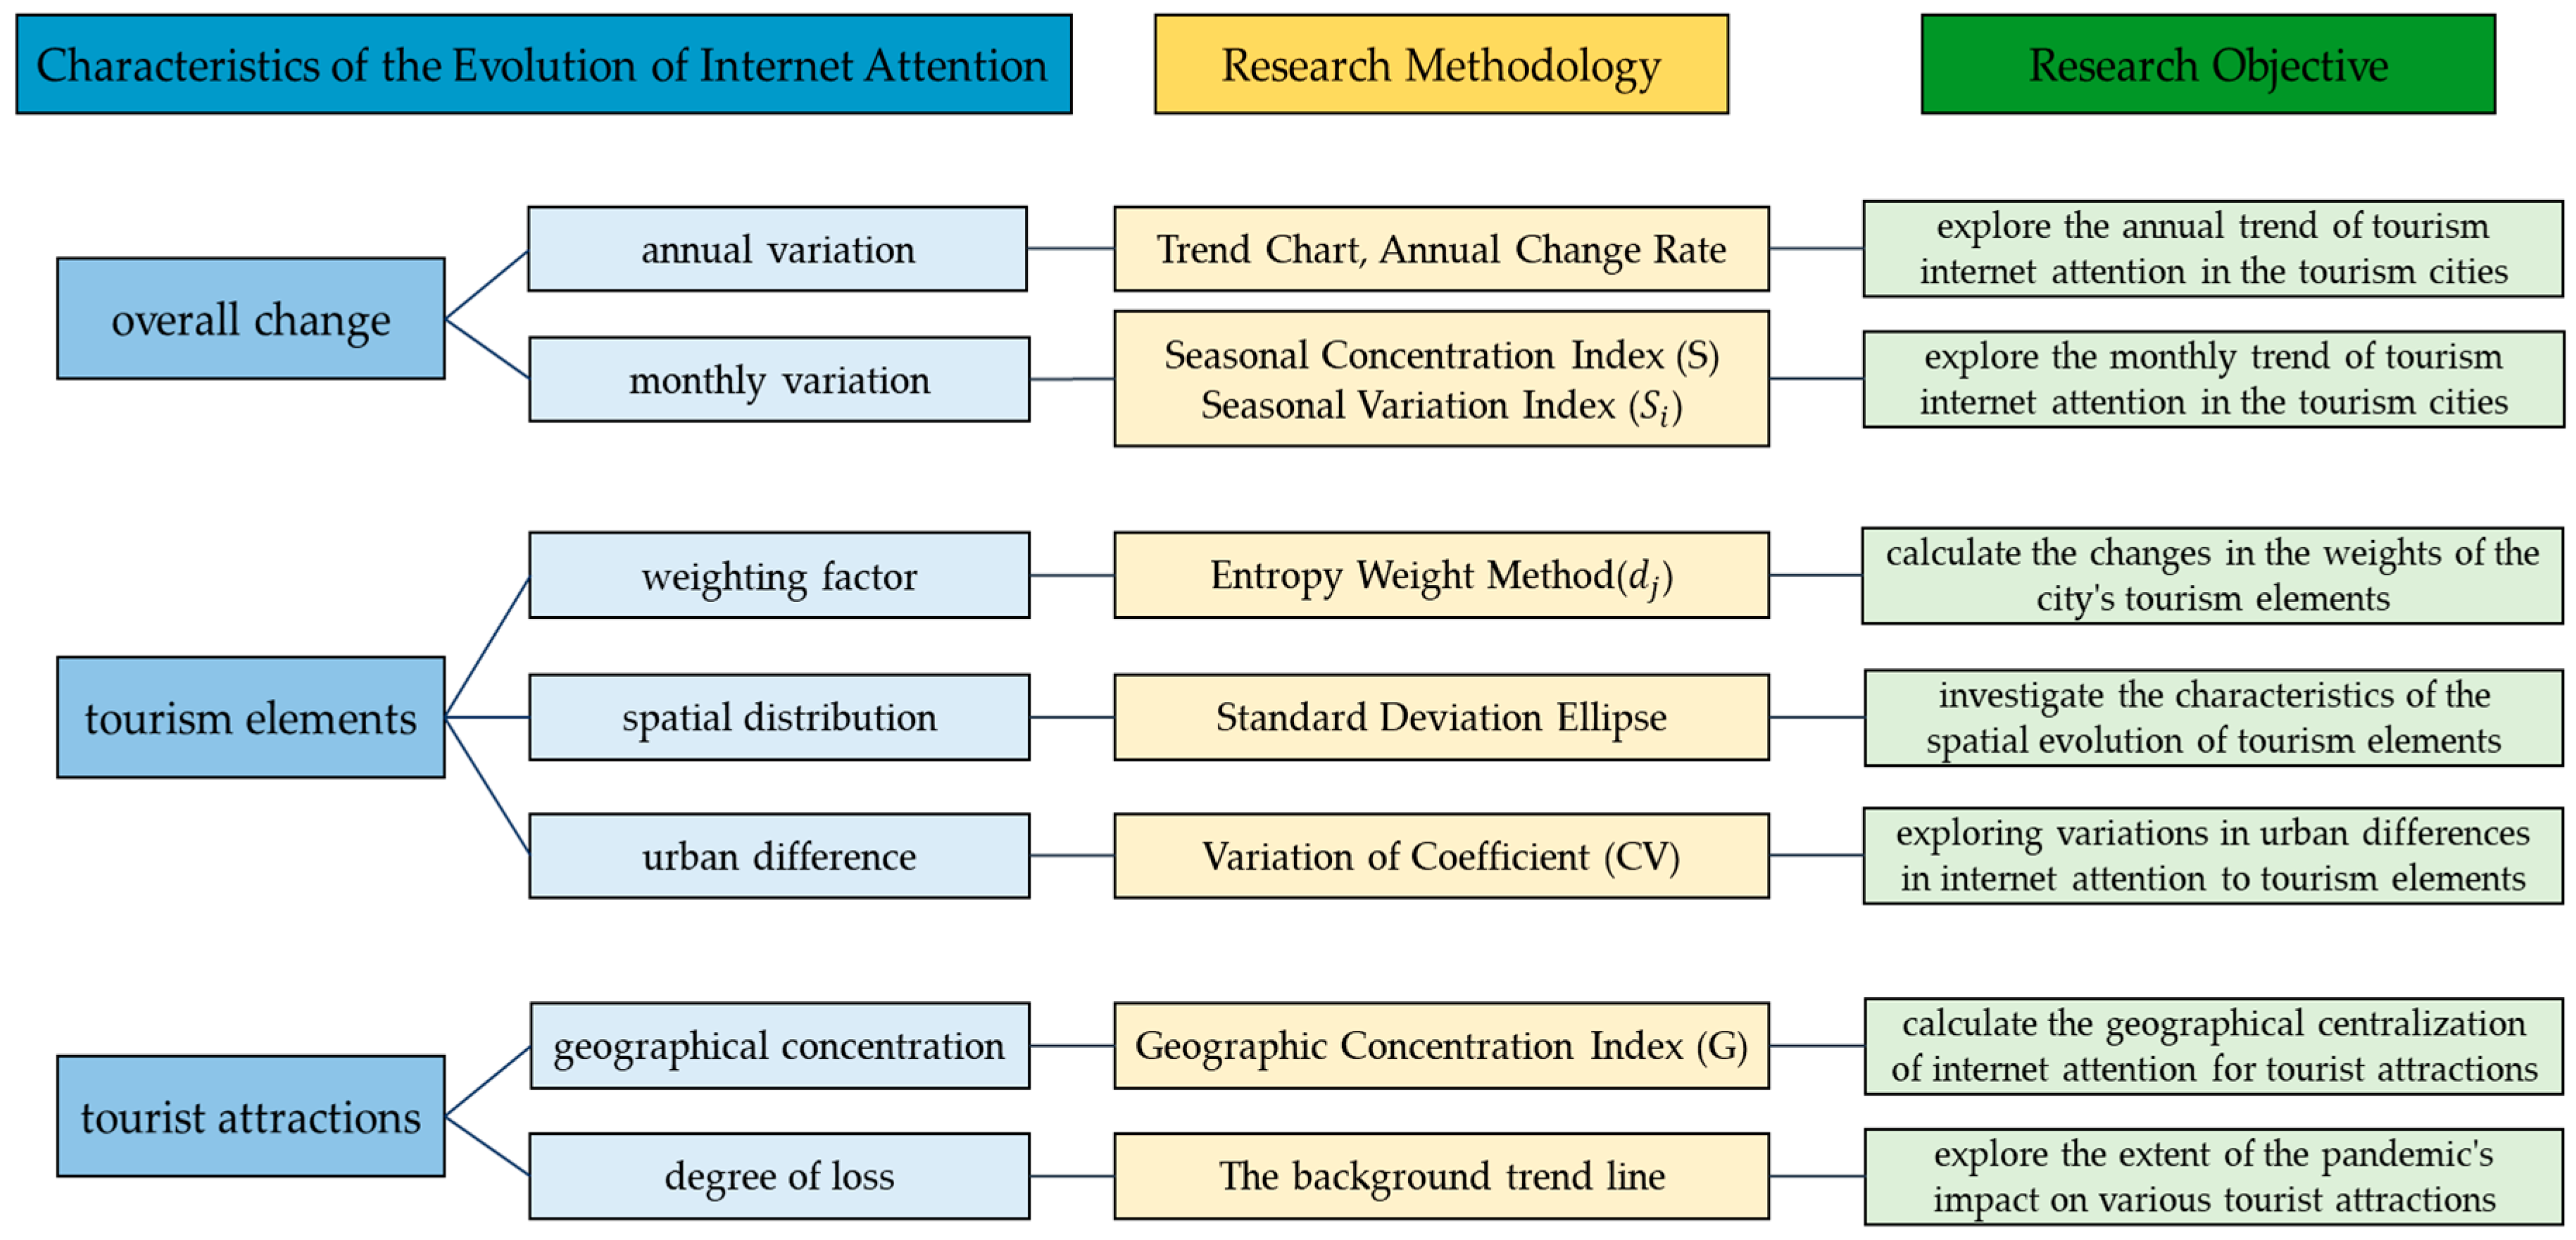
3.4. Research Framework

In order to quantify the loss, change, and recovery process of urban tourism internet attention under the influence of the COVID-19 pandemic from multi-temporal and spatial scales, the research content of this study mainly includes the following three parts: “Overall Change Characteristics of Changes in Internet Attention”, “Tourism Elements Characteristics of Changes in Internet Attention”, and “Tourist Attractions Characteristics of Changes in Internet Attention”. The specific research methodology and research objectives are illustrated in Figure 2.

4. Results

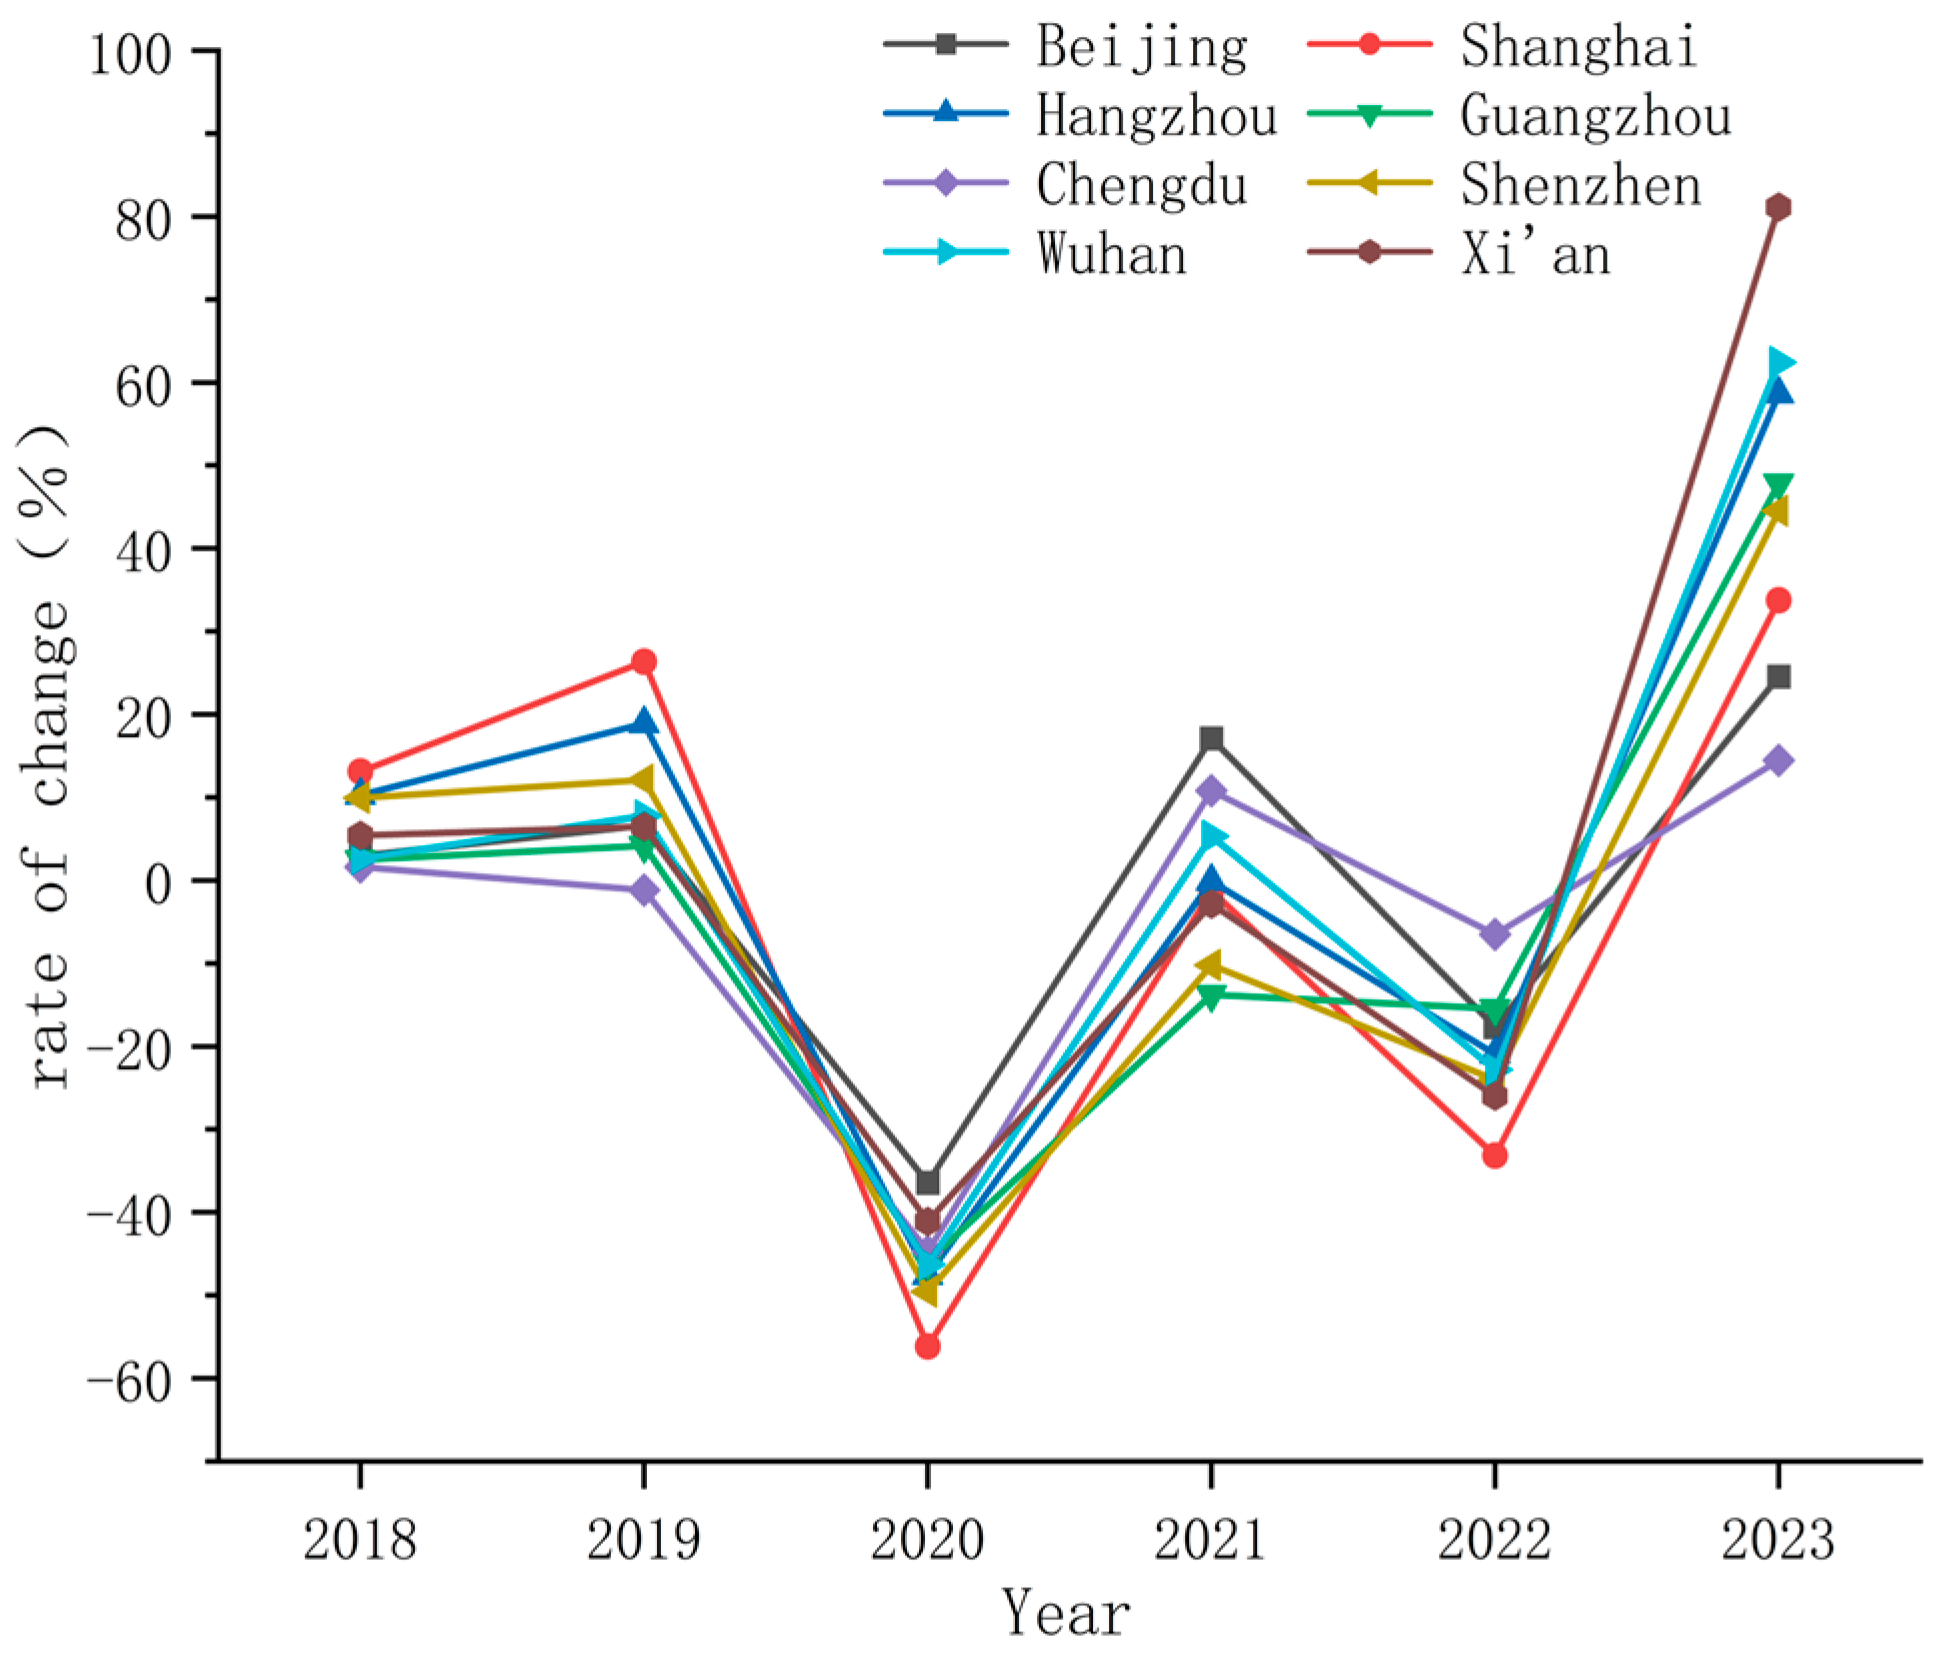
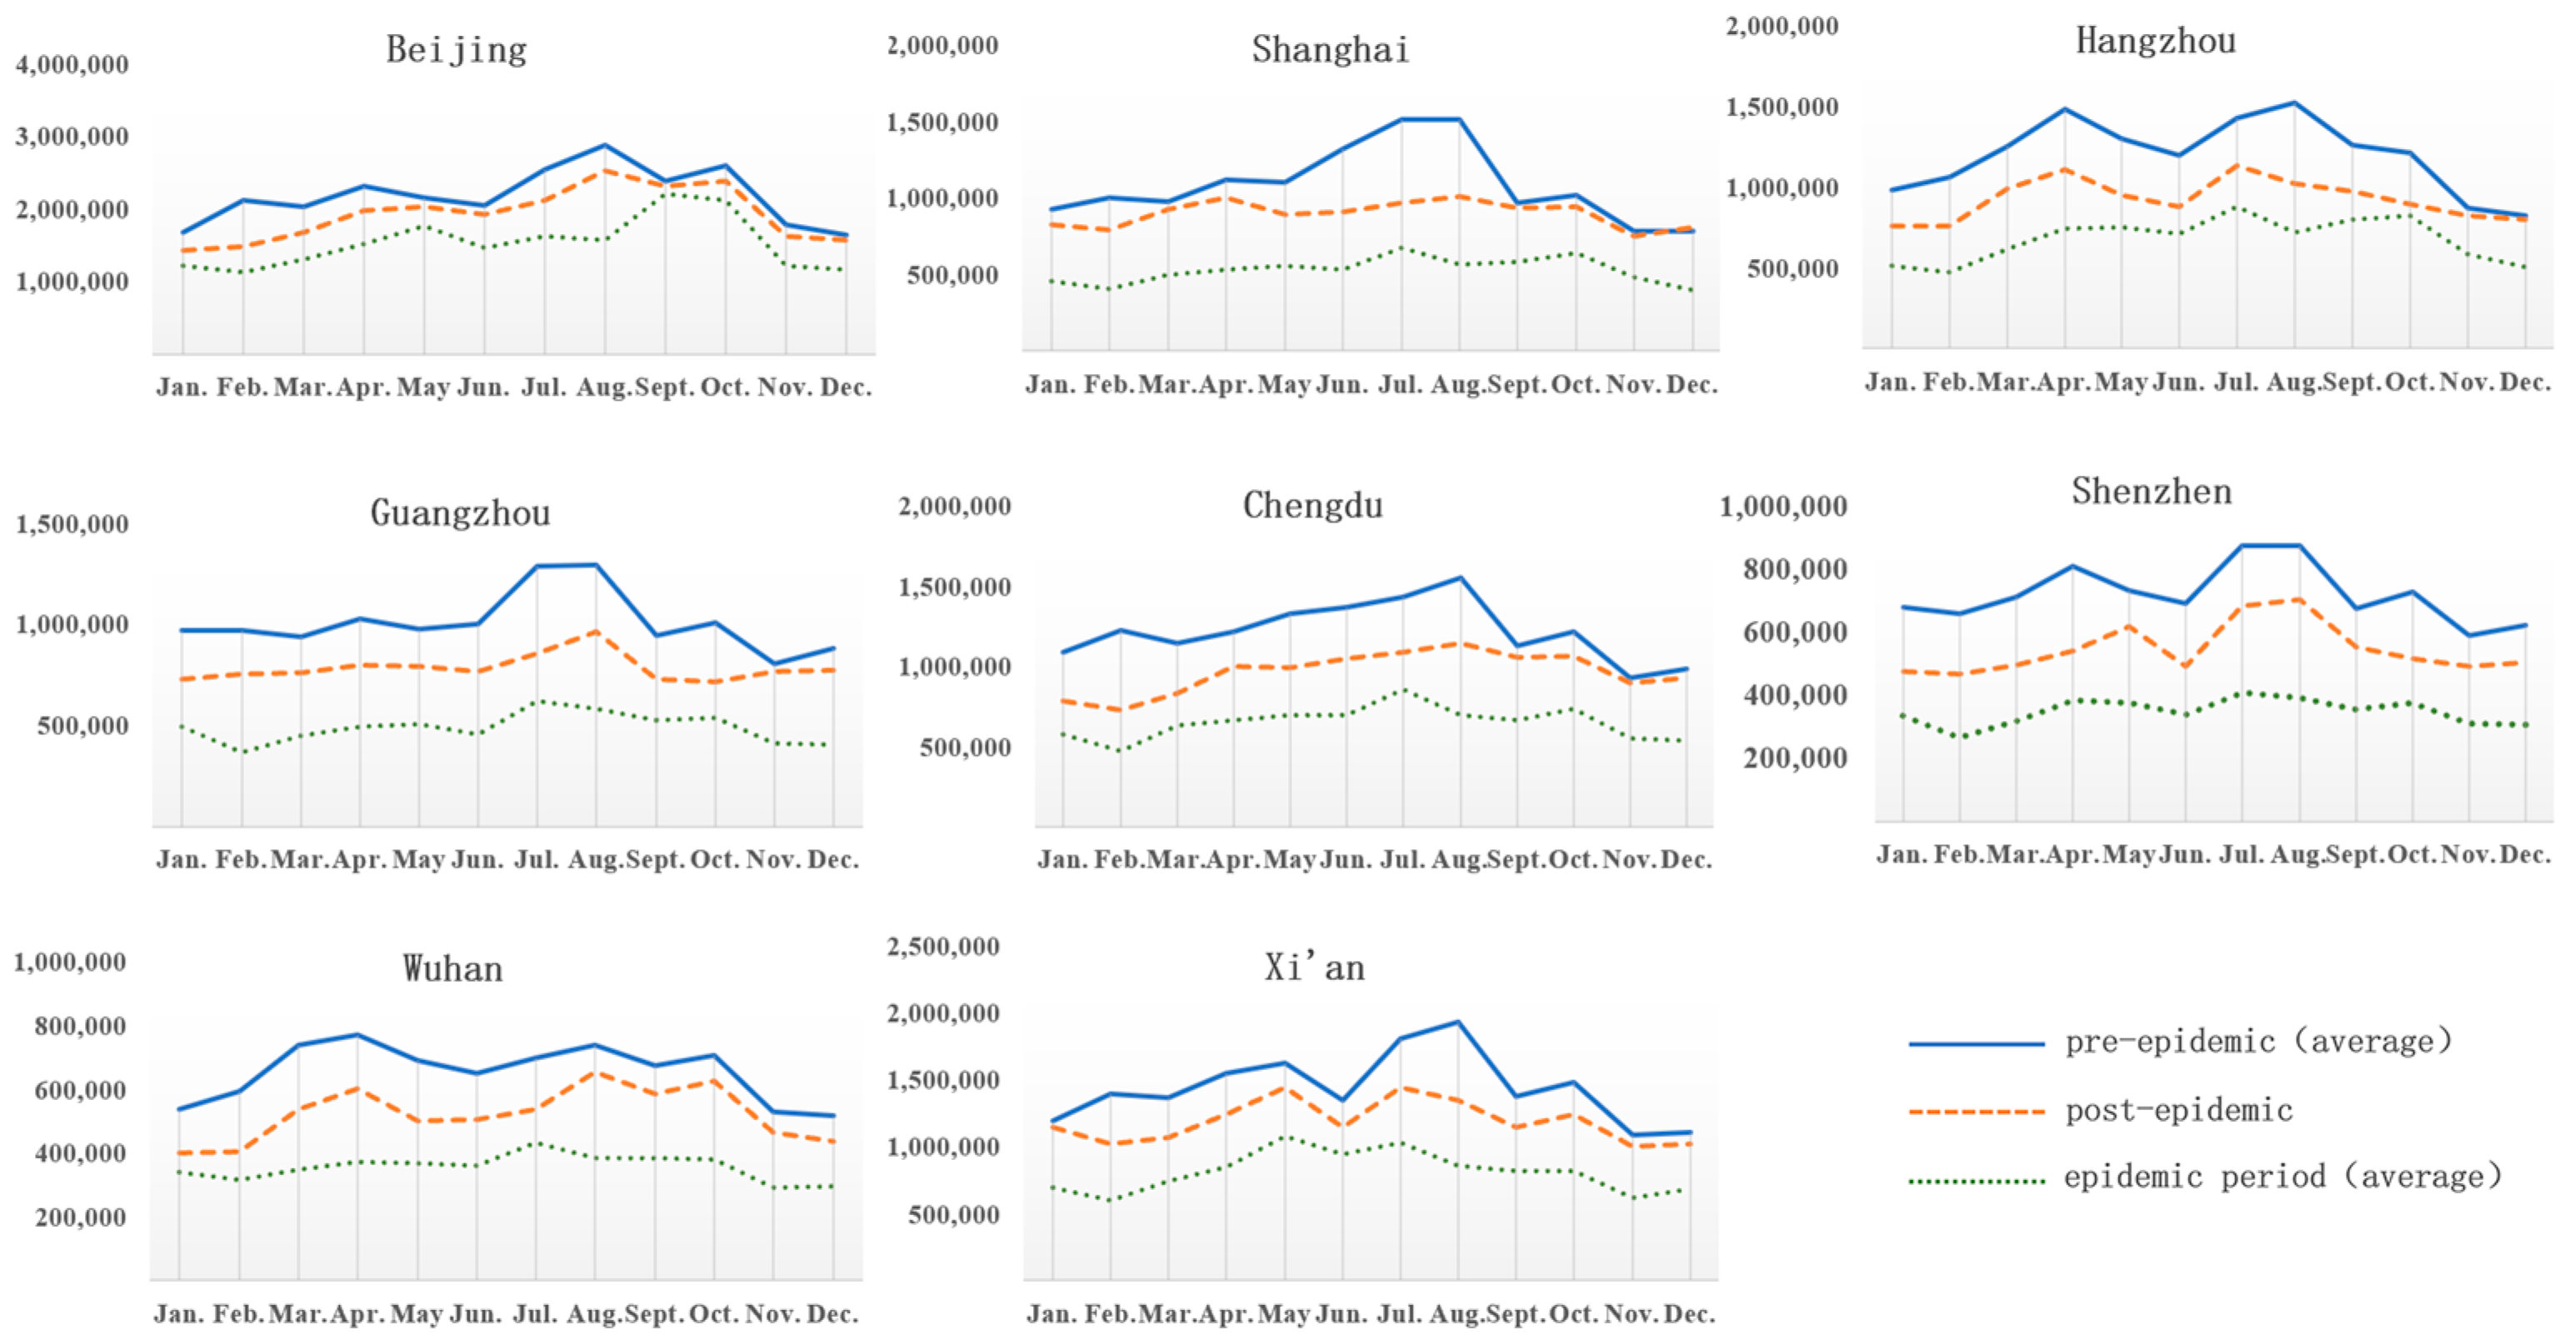
4.1. Overall Change Characteristics of Changes in Internet Attention

The annual trends in web attention for the eight cities from 2017 to 2023 are shown in Figure 3. It can be seen that the eight cities, at different stages of the epidemic, show comparable changes in their tourist web attention. Before the outbreak of the epidemic, internet attention in the eight cities showed an increasing trend from 2017 to 2019, except for Chengdu, which showed a slight decrease in 2019. In the first year of the outbreak, 2020, the city’s tourism internet attention showed a sharp downward trend, with annual rates of change of −35% or less (Figure 4). By the beginning of 2023, the three-year outbreak had ended, and the tourism internet attention had increased significantly compared to the previous three years. However, there was still a gap compared to the pre-epidemic period.
To further explore the temporal trend of tourism internet attention in the tourism cities, the mean value of tourism internet attention was calculated for each month in the following three different periods: before the epidemic (2017–2019), during the epidemic (2020–2022), and after the epidemic (2023). The trend of the monthly period distribution of tourism internet attention was plotted separately for each of the eight cities (Figure 5).
The distribution trend of tourism internet attention in the monthly period shown in Figure 5 shows that the average value of tourism internet attention in each month for the eight cities before the epidemic was significantly higher than the corresponding value during the epidemic. After the end of the epidemic, the internet attention of the eight cities significantly recovered compared to the time of the epidemic. The internet attention of the two megacities, Beijing and Shanghai, has recovered to a greater extent than that of the other cities. However, there is still a significant gap between the levels of the same period before the epidemic.
By calculating the city’s seasonal change index and combining the inter-month change characteristics in Figure 5, we can determine the peak month of internet attention for each city. According to the number of times the peak occurs, the city is divided into the following three types: “single peak type”, “double peak type” and “triple peak type”. By introducing the seasonal intensity index “S” to compare the seasonal differences in the internet attention of tourist cities (Table 3), it can be seen that the peaks of the eight cities have similar characteristics. The peaks in the pre-epidemic, epidemic, and post-epidemic periods are primarily of the “double peak” type, and they are mainly concentrated in April in spring and in July and August in summer. Regarding the seasonal intensity index, Shanghai and Wuhan were the areas most affected by the epidemic at one time. The epidemic seriously affected the development of tourism in these two cities for an extended period, resulting in a significant downward trend in the S value compared to the pre-epidemic period. As a result, the monthly difference in internet attention was weakened. After the epidemic, the seasonal variation in tourism internet attention to became more apparent and the monthly difference significantly increased in eight cities.

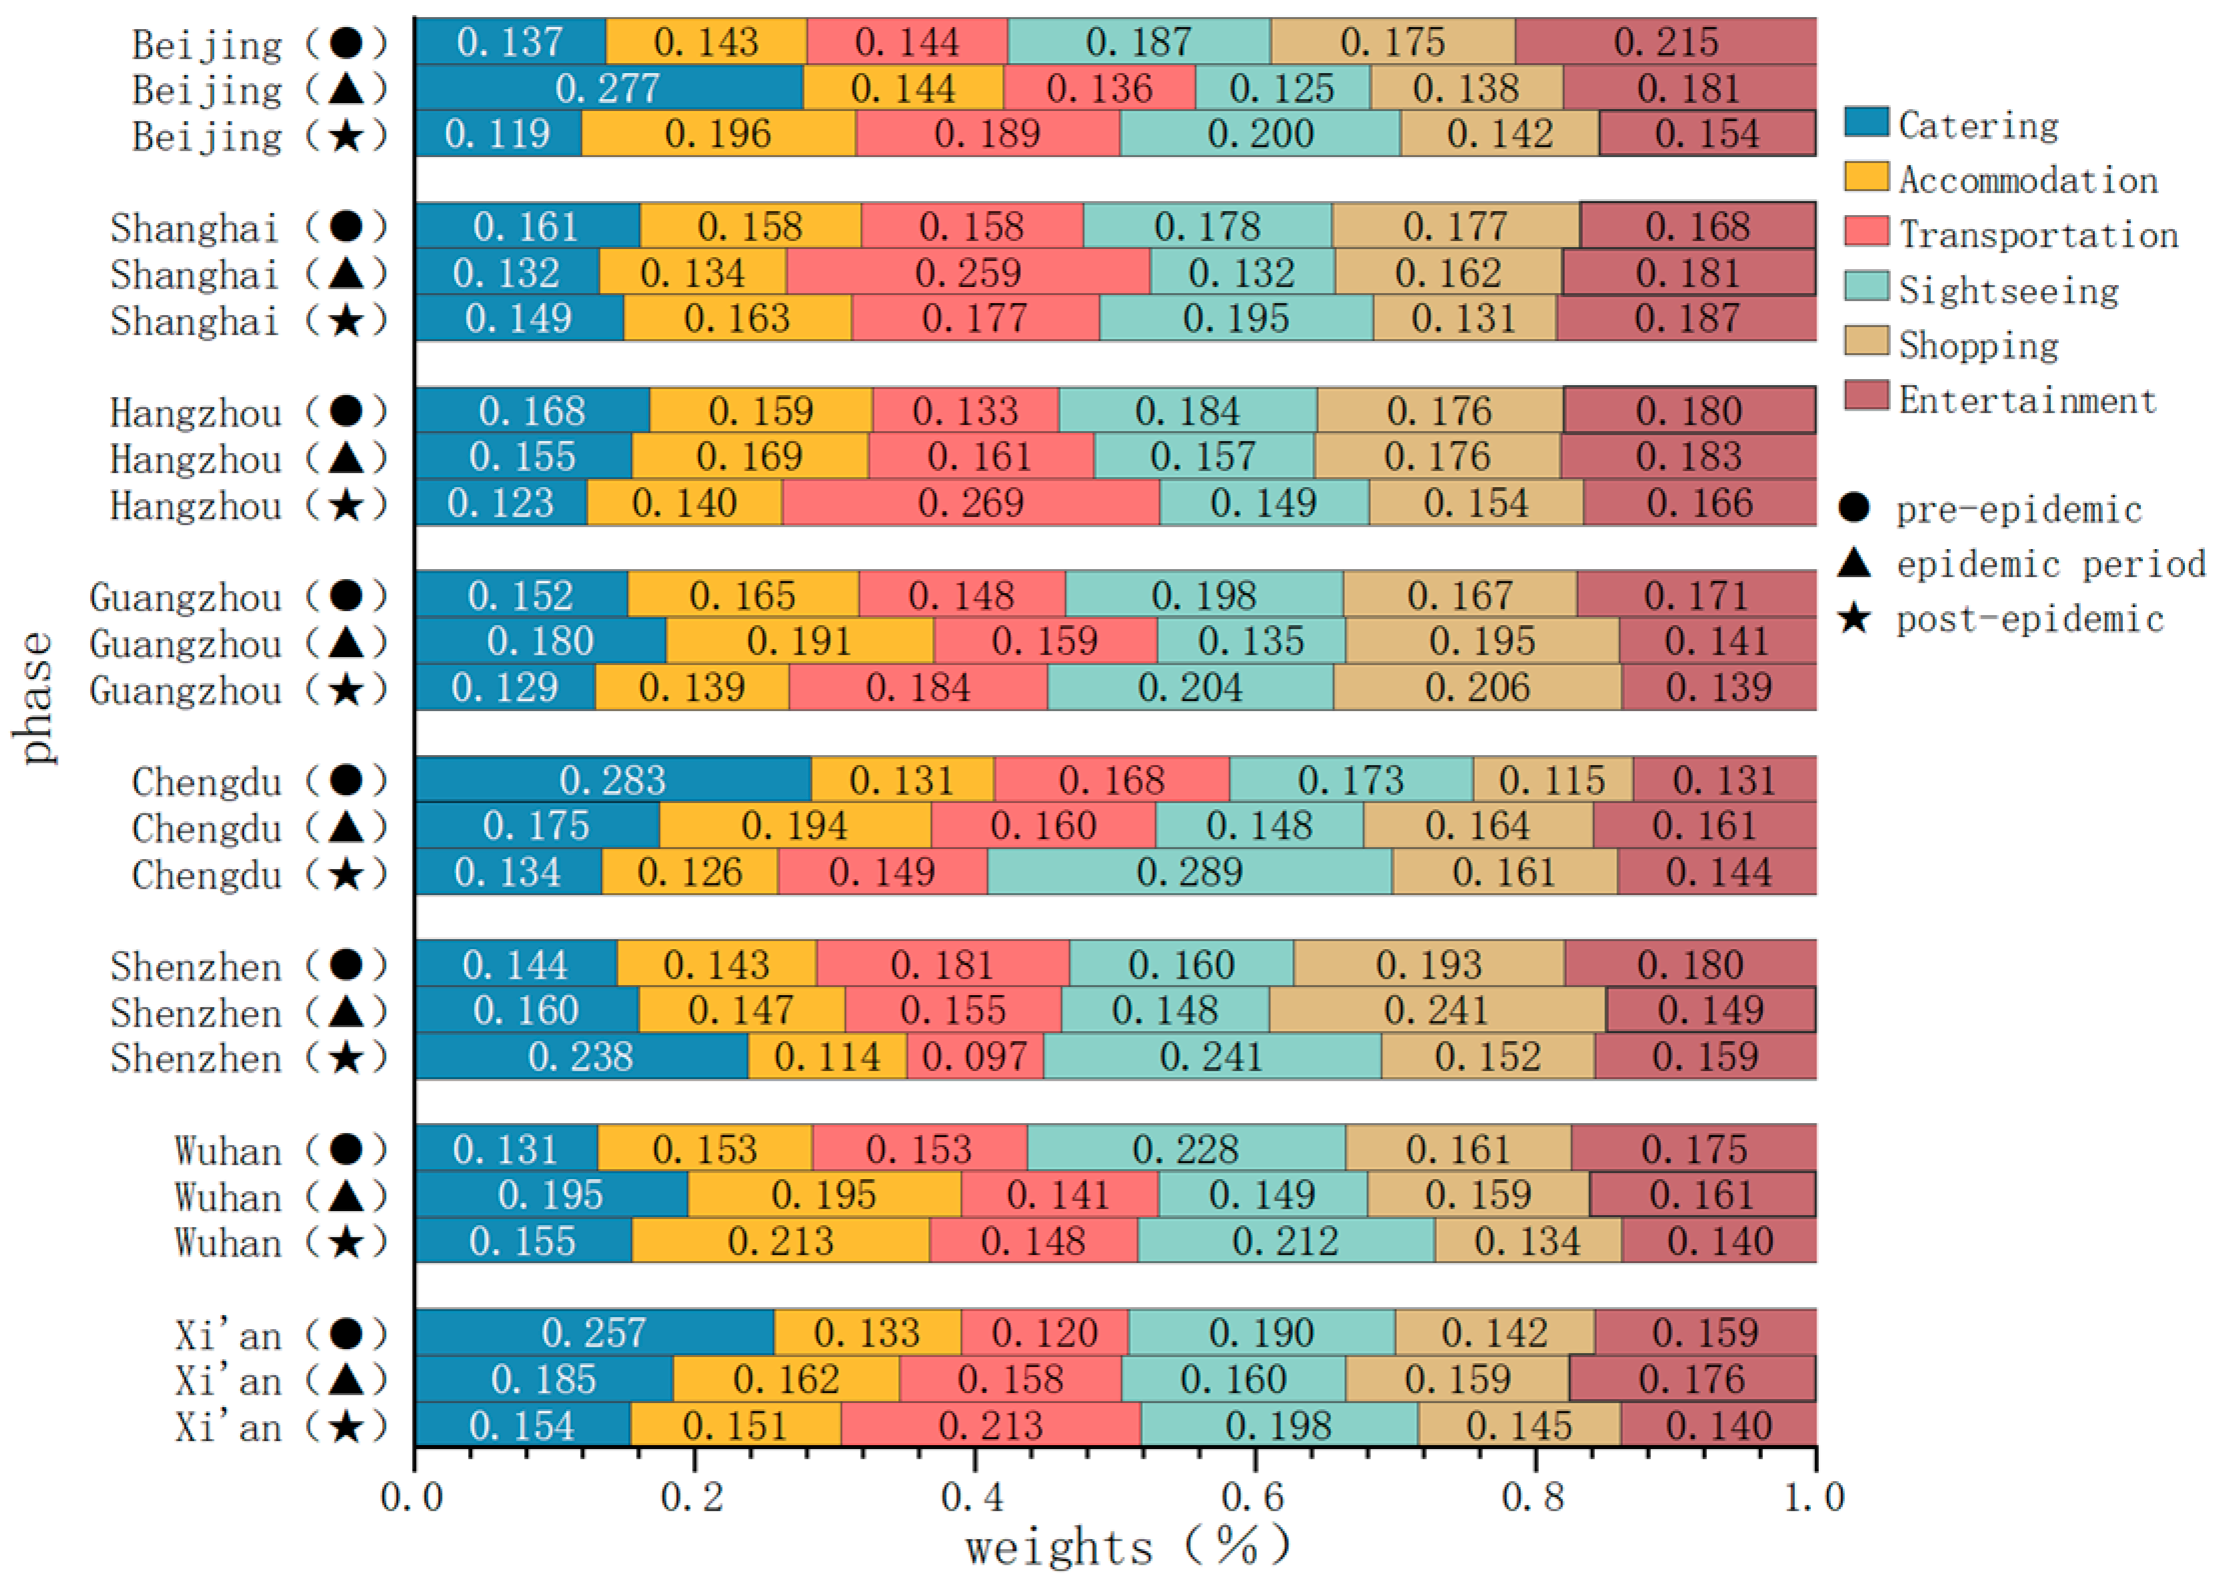
4.2. Tourism Element Characteristics of Changes in Internet Attention

The entropy method was used to calculate the changes in the weights of the city’s tourism elements during the three periods before, during, and after the epidemic. The tourism elements were then ranked according to the magnitude of the weights they accounted for (Figure 6). Before the outbreak was detected, except for Chengdu and Xi’an, in two well-known food cities, the element of “catering” was ranked at the top, while other cities ranked the elements of “sightseeing, shopping, and entertainment” at the top. The rankings for “catering, accommodation, and transportation” were all at the bottom of the list. During the epidemic, the ranking of “sightseeing, shopping, and entertainment”, which has a higher elasticity of demand, started to move back to its original position. After the epidemic ended, the proportion of “sightseeing” and “transportation” in the essential elements of tourism increased significantly compared to the epidemic period.
In order to investigate the changes in the spatial distribution of tourism elements in the city before, during, and after the epidemic, standard deviation ellipse plots were created for the following six tourism elements: “catering, accommodation, transportation, sightseeing, shopping, and entertainment” using ArcGIS 10.8 software (Figure 7). These plots illustrate the spatial distribution of these elements in the three time periods. The relevant data were processed to obtain the centre point coordinates, rotation angle, ellipse size, and ellipticity of the spatial distribution of tourism elements in the three periods (Table 4).
In general, the centre coordinates of the spatial distribution of the six tourism elements are all located near Wuhan and show a distribution pattern of “northeast-southwest”. Based on the size of the ellipticity, it is possible to understand the characteristics of the distribution of the data in different directions, as well as the dispersion of the distribution. With the development of the tourism industry and the improvement of tourism infrastructure, the flat rate of the three elements of “catering, accommodation, and transportation” as the basis of the tourism industry has shown a shrinking trend. This indicates that the differences between regions are becoming smaller and smaller, and the direction of spatial distribution is becoming less and less noticeable. The ellipticity of the three elements of “sightseeing, shopping, and entertainment” significantly shrunk during the epidemic but almost returned to the level before the epidemic after it ended. This indicates that the epidemic had a more significant impact on the directionality of the spatial distribution of tourism elements. Based on the generated spatial distribution, the size of the ellipse can provide insight into the spatial distribution range of various tourism elements. The size of the ellipses for the six categories of tourism factors, namely “catering, accommodation, transportation, sightseeing, shopping, and entertainment,” increased to varying degrees during the epidemic period compared to the pre-epidemic and post-epidemic periods. This indicates that the concentration of urban spatial distribution of tourism factors weakened during the epidemic.
Specifically, the centre point of the standard deviation ellipse of the spatial distribution of the “catering” element has shifted to the northwest. The direction of the shift is more apparent, and the coverage area has increased to include Xi’an and Chengdu. The centre point of the standard deviation ellipse of the spatial distribution of the “accommodation” element has shifted to the west to a lesser extent, and the aggregation of the spatial distribution has not changed much compared to before the epidemic. The centre point of the standard deviation ellipse of the spatial distribution of the “transportation” element has shifted to the southeast. The aggregation of the spatial distribution is weaker than before the epidemic, and the distribution of internet attention among cities is more even. The centre point of the standard deviation ellipse for the spatial distribution of the “sightseeing” element has shifted to the southeast, with a small ellipticity of below 0.1. This indicates that the spatial distribution of the “sightseeing” element is weakly directional. The centre point of the standard deviation ellipse of the spatial distribution of the “entertainment” element has shifted to the southwest, and Guangzhou and Xi’an have been added to the coverage.
The coefficients of variation were used to calculate the urban differences in the internet attention of tourism elements in cities from 2017 to 2023 (Table 5). On the one hand, the coefficients of variation for the three aspects of “catering, accommodation, and transportation” fluctuated between 0.4 and 0.5 before the epidemic, and the differences between cities were minor. On the other hand, the coefficients of variation for the three elements “sightseeing, shopping, and entertainment” were more significant before the epidemic, fluctuating between 0.8 and 1.3. These three elements showed significant differences among cities but with a decreasing trend from year to year. During the epidemic, the degree of change in the intercity differences in the three elements of “catering, accommodation, and transportation” was relatively small. However, the degree of reduction in the intercity differences in the three aspects of “sightseeing, shopping, and entertainment” was more pronounced. Since the end of the epidemic, the consumption patterns of tourists have changed, and various new types of tourism have emerged. The differences between the “catering and sightseeing” elements of the city have increased significantly compared to the pre-epidemic period.
Further analysis of the characteristics of the industrial structure composed of tourism elements shows that the three aspects of “catering, accommodation, and transportation” have relatively small differences between cities and are affected by the epidemic. However, the demand elasticity of the three elements, “sightseeing, shopping, and entertainment” is more extensive, making them more susceptible to economic situations and factors such as price and quality. Therefore, it can be seen that the share of “sightseeing, shopping, and entertainment” was at the top before the epidemic, while the share of “catering, accommodation, and transportation” was at the bottom during the epidemic.

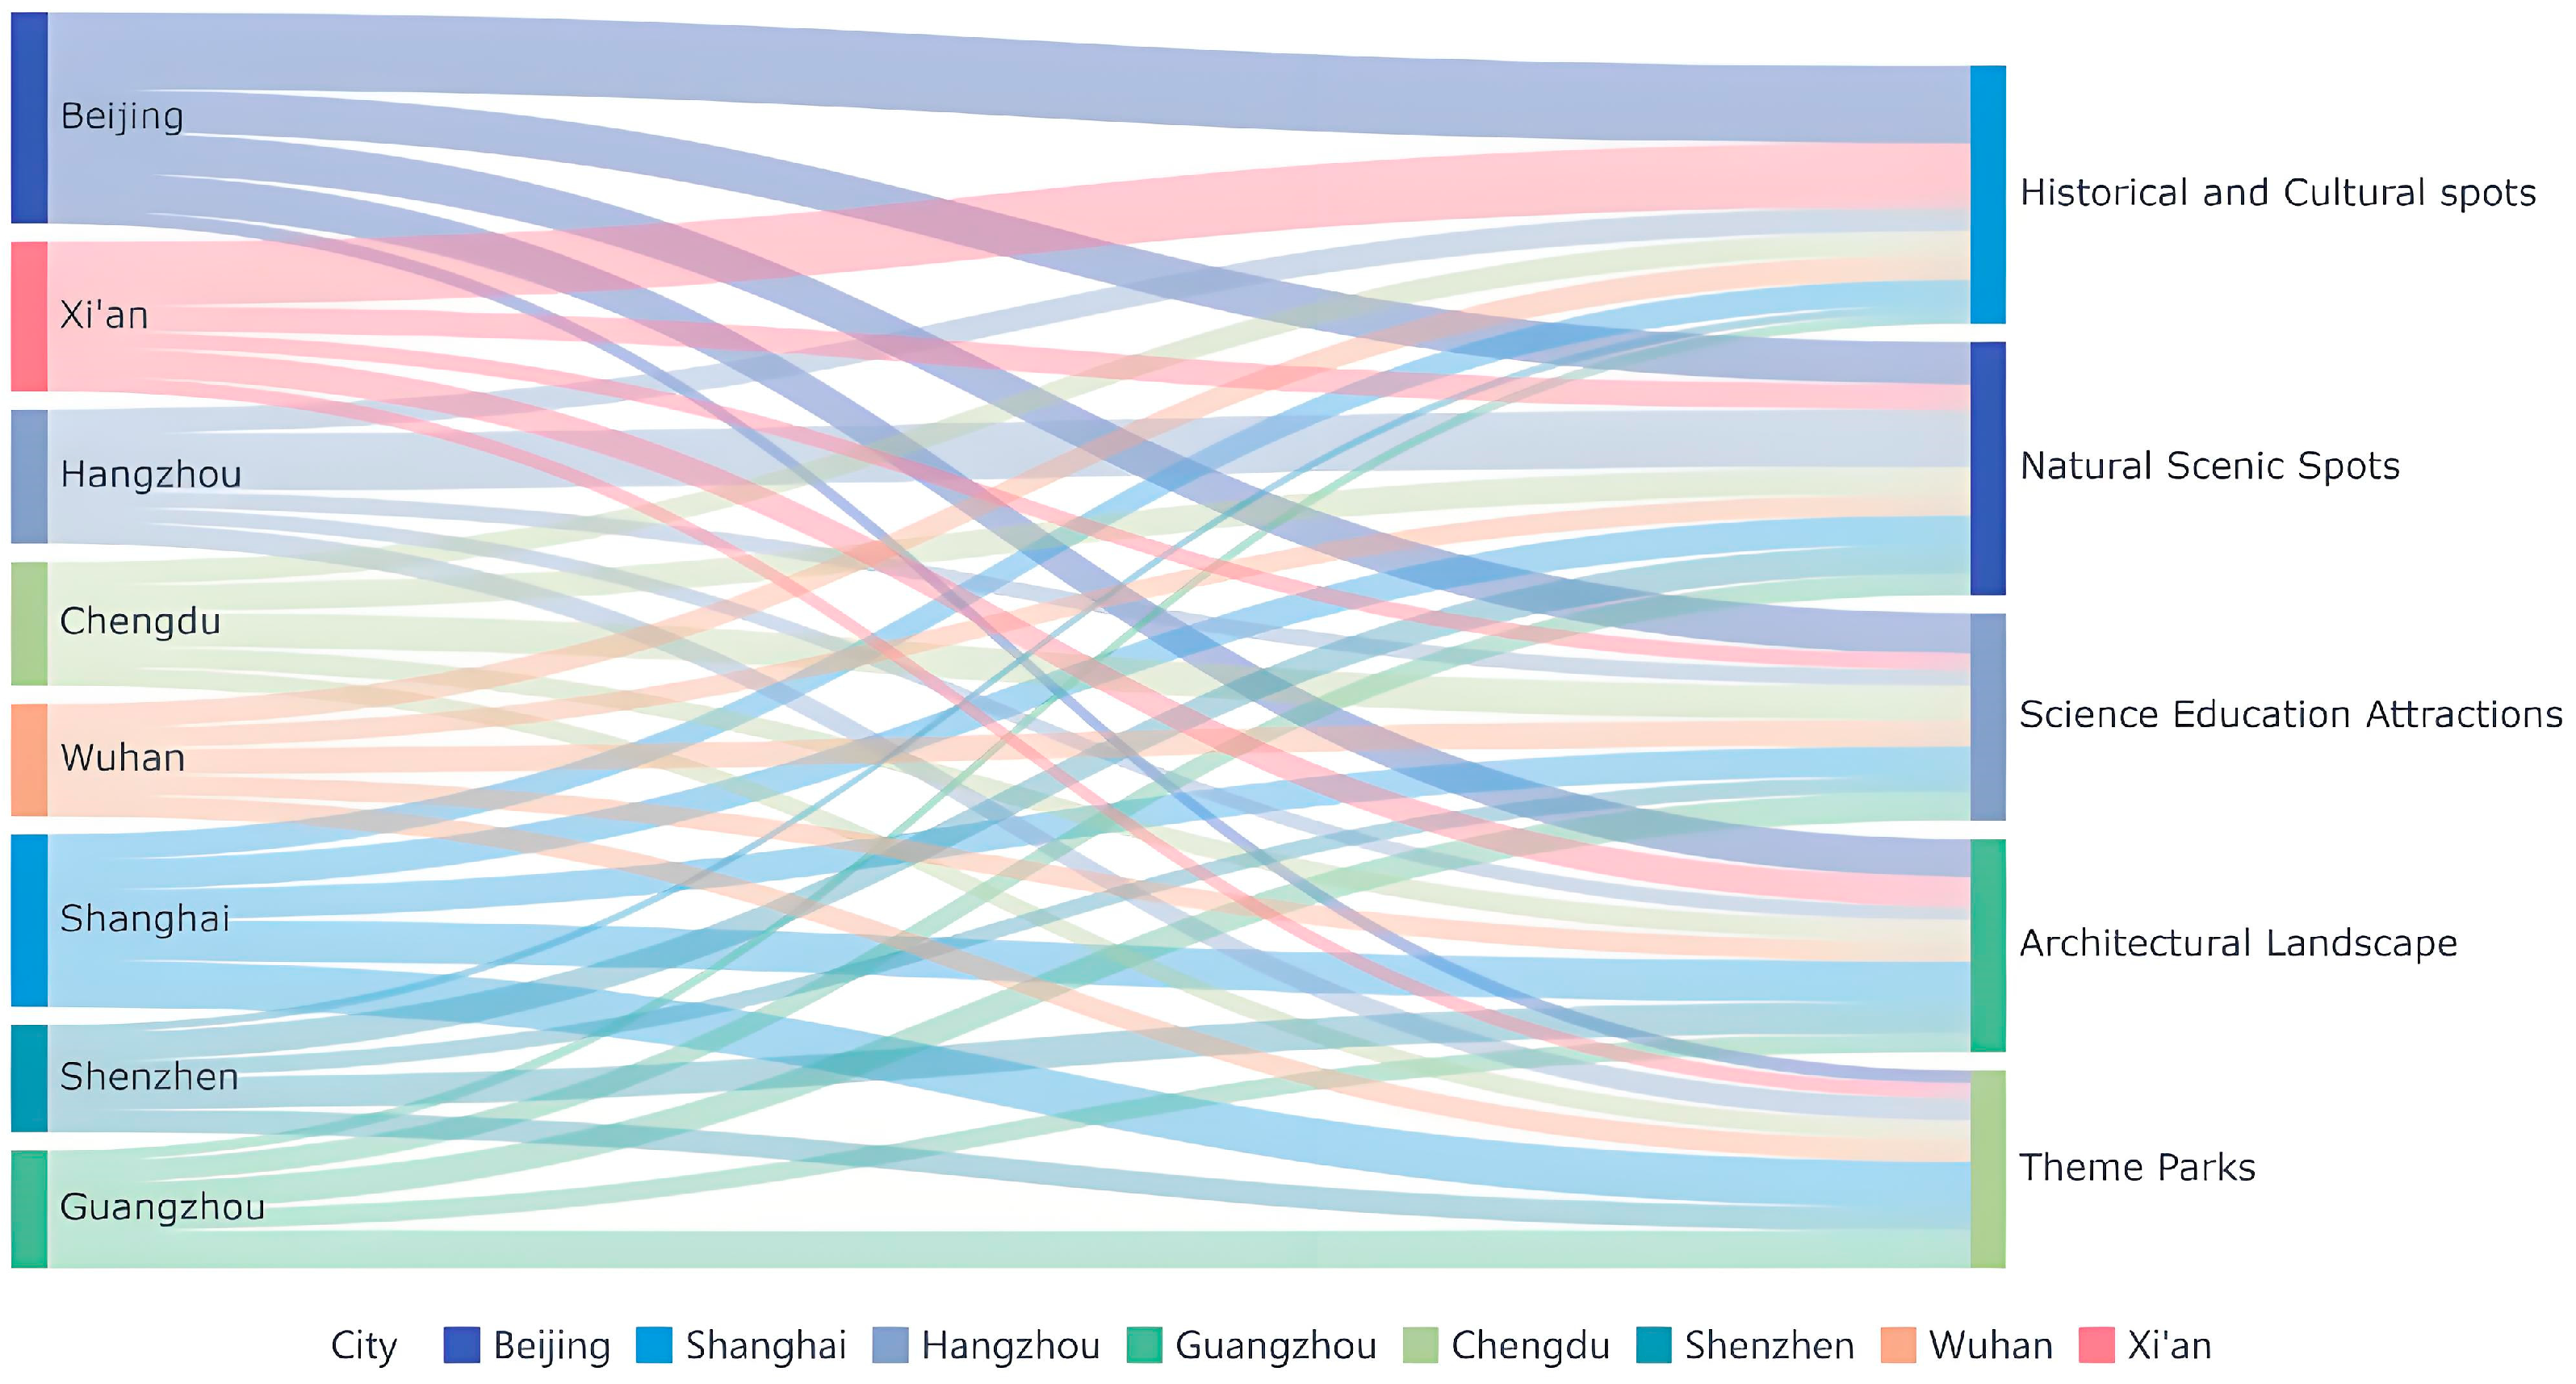
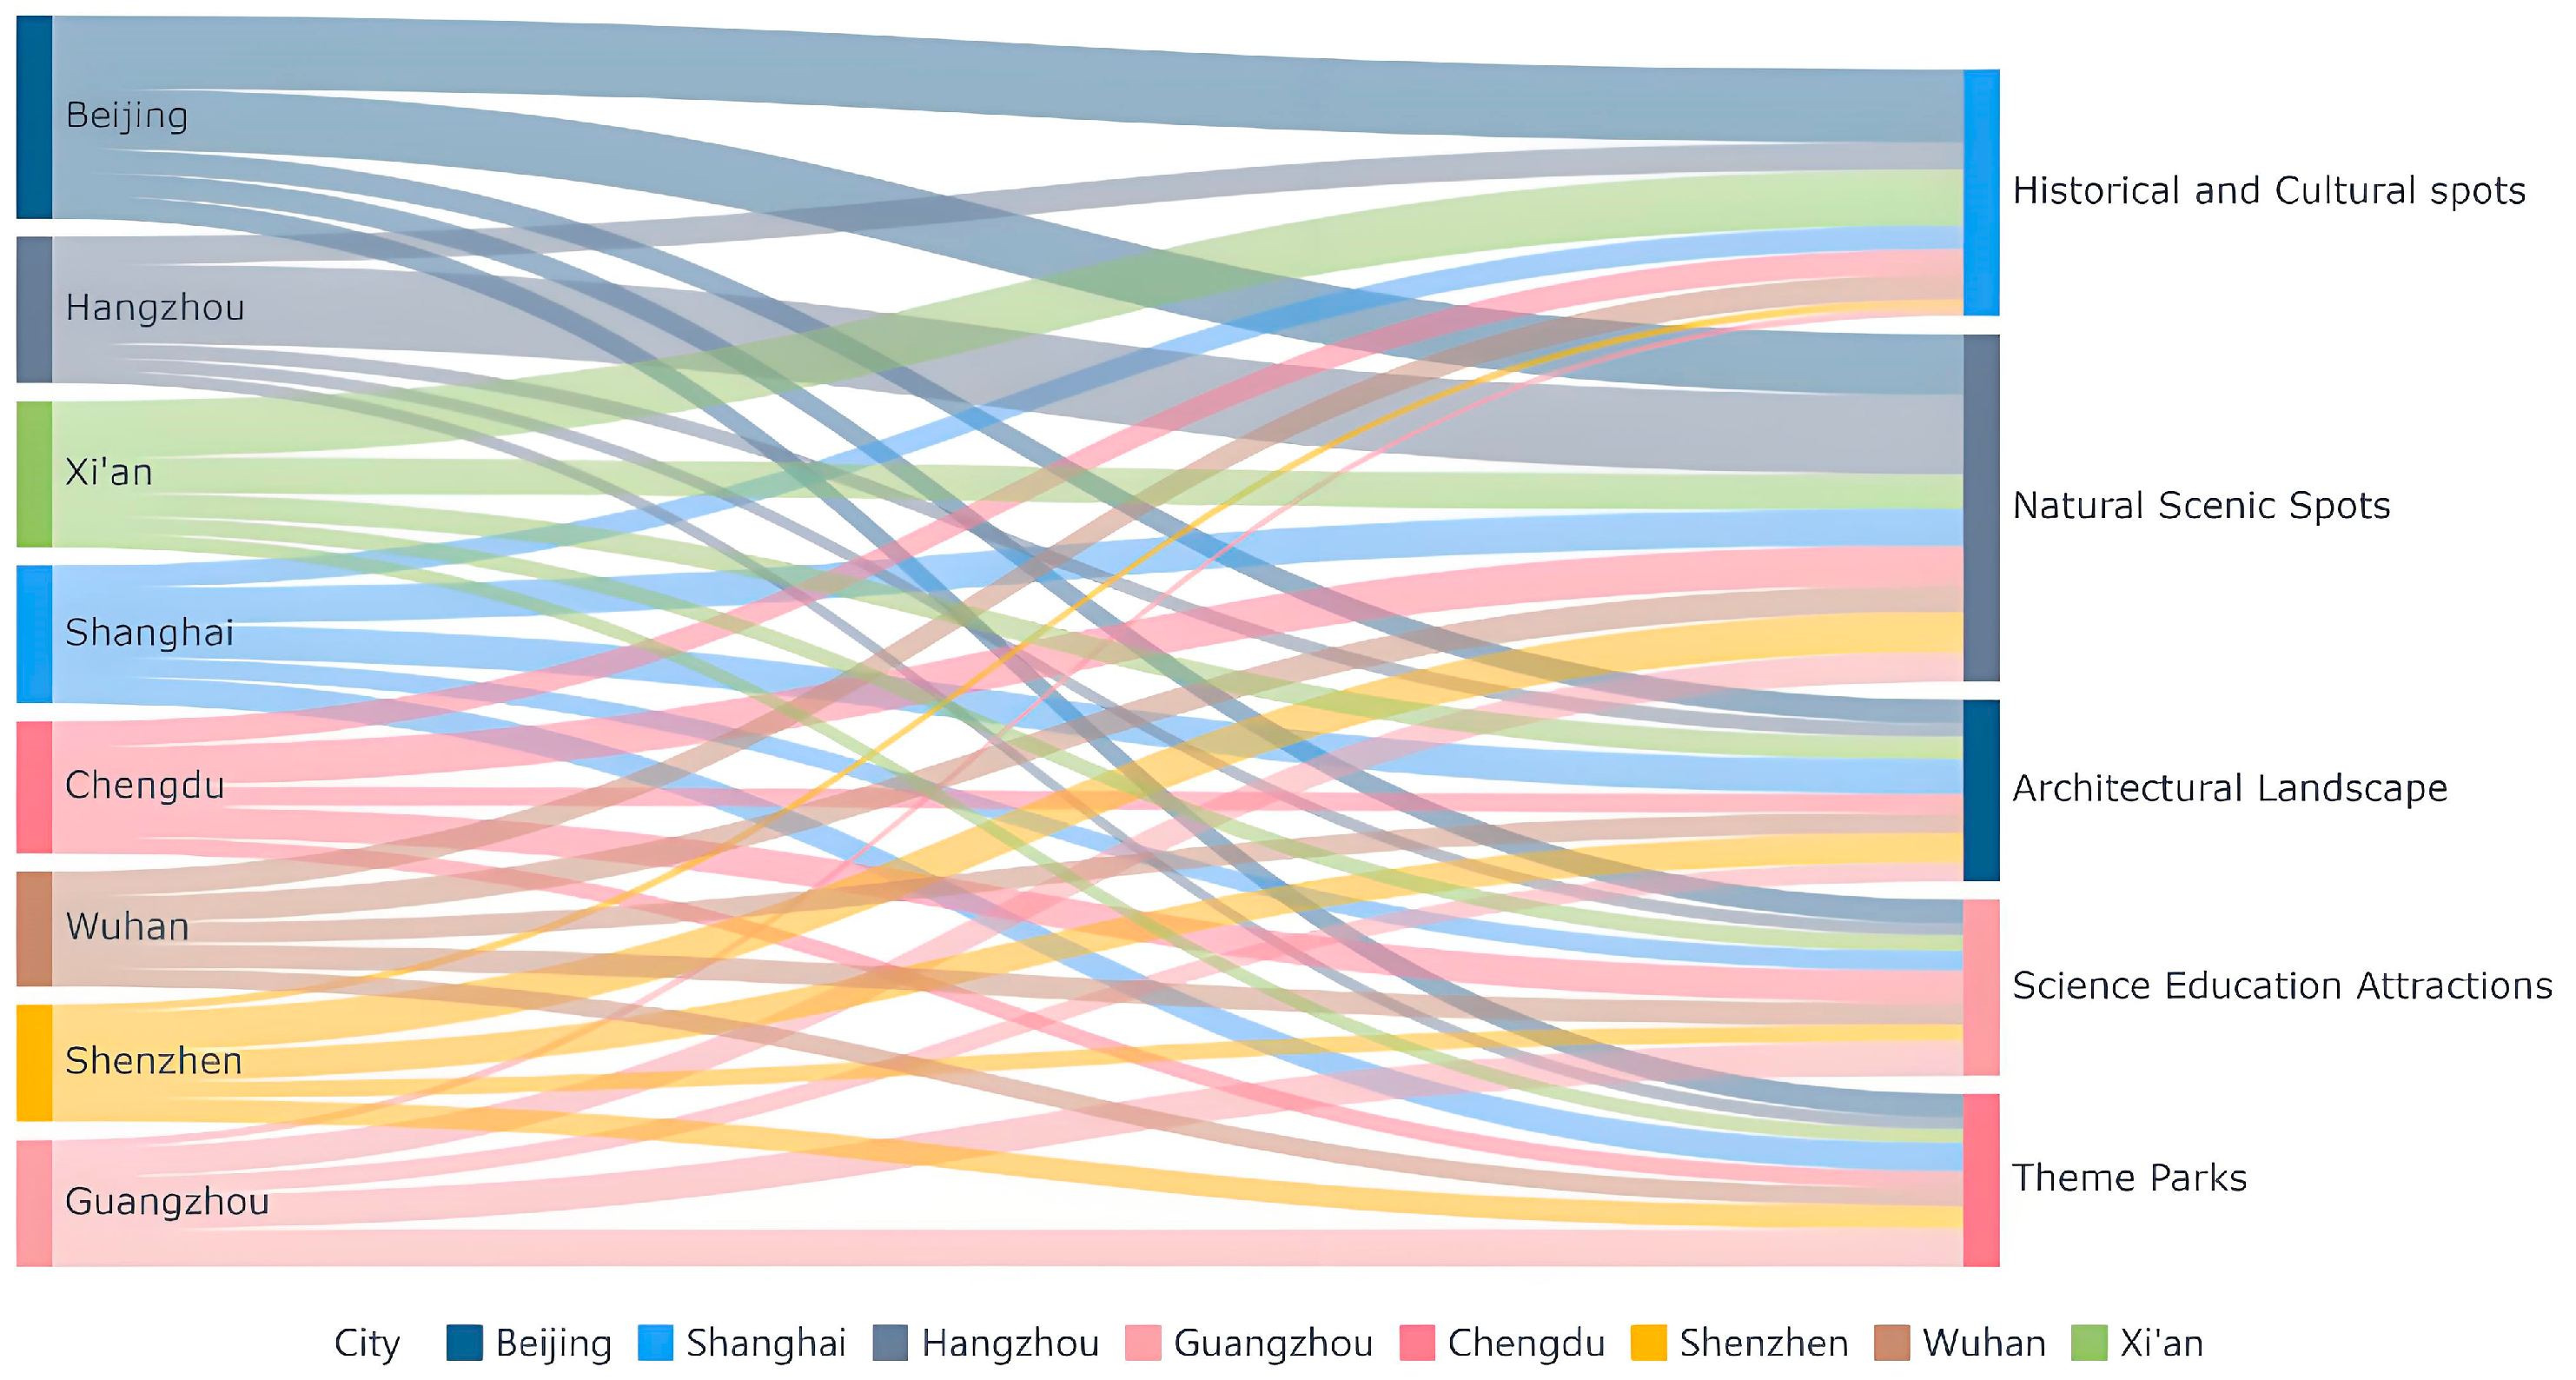
4.3. Tourist Attraction Characteristics of Changes in Internet Attention

The geographic centralization index was used to calculate the centralization of internet attention for tourist attractions in tourist destinations (Table 6). It was found that during the epidemic, the geographic centralization index of each city increased to a greater extent due to the epidemic, and the internet attention of urban tourist attractions began to centralize. After the end of the epidemic, the geographic centralization index of each city’s tourist attractions showed a decreasing trend compared to the epidemic period, and the internet attention of tourist attractions began to decentralize again.
To further explore the extent of the epidemic’s impact on various tourist attractions in the tourist city, this study uses the internet attention data of each tourist attraction from 2017 to 2023 to build a tourism background trend line model. It calculates the average loss rate (L) of tourism internet attention for each tourist attraction in the city, respectively. The division includes significant loss (L > 75), higher loss (50 < L ≤ 75), medium loss (25 < L ≤ 50), lower loss (0 < L ≤ 25), and no loss (L ≤ 0), with a total of five levels [52]. It can be seen that the degree of impact of the epidemic on the internet attention of each tourist attraction is different. However, most of them experienced high and moderate losses. Specifically, the percentages of significant loss, higher loss, moderate loss, lower loss, and no loss were 2.38%, 41.67%, 41.67%, 11.90%, and 2.38%, respectively (Figure 8).
As shown in Figure 8, the tourist attractions with a loss rating of “no loss” are Universal Studios Beijing and Datang Everbright City. Universal Studios Beijing began trial operation on 1 September 2021, and officially opened on 20 September 2021. The outdoor open-air tourist attractions and outdoor park of the Datang Everbright City were fully opened in February 2020, and the “Twelve Hours of Chang’an”-themed block was officially opened in April 2022. Universal Studios Beijing was the only tourist attraction to start operating during the outbreak, while Datang Everbright City underwent a large-scale remodelling and upgrading. As a result, the internet attention of the two tourist attractions increased significantly compared to before the epidemic, by 350.52% and 228.65%, respectively.
Low- and medium-loss tourist attractions are mostly famous tourist attractions in the city where they are located, such as the Terracotta Army, the Yangtze River Bridge, the Palace Museum, or tourist attractions in the natural landscape category, such as the Qi-Antang River, East Lake, and Baiyun Mountain. Those with higher and high loss levels are mostly amusement parks and cultural sites, such as Shanghai Disneyland, Changlong Water Park, Hubei Provincial Museum, and Huaqing Palace. This indicates that the epidemic had a relatively small impact on famous tourist attractions and natural landscape-type tourist attractions in tourist cities and an enormous impact on amusement parks and cultural venue-type tourist attractions.
In order to further analyse the differences in internet attention among various types of tourist attractions in typical tourist cities during different periods, this study divides the aforementioned 84 tourist attractions into the following five categories: “Natural Scenic Spots”, “Historical and Cultural Spots”, “Architectural Landscapes”, “Science Education Attractions”, and “Theme Parks” (Table 7).
Based on the flow of internet attention of tourist attractions in the eight cities, the distribution of internet attention during the pre- epidemic, epidemic, and post-epidemic periods was plotted (Figure 9, Figure 10 and Figure 11). According to the distribution chart of the internet attention flow of tourist attractions, it can be seen that before the pandemic period, nearly half of the internet attention to tourist attractions flowed to “Historical and Cultural Spots” and “Natural Scenic Spots”, which accounted for about 22% each. During the pandemic, various tourist attractions were affected by the epidemic to different degrees. The proportion of “Natural Scenic Spots” increased significantly to 33.6%, while the percentages of “Historical and Cultural Spots”, “Architectural Landscapes”, “Science Education Attractions”, and “Theme Parks” all declined. The categories of “Historical and Cultural Spots” and “Theme Parks” saw the most significant declines. After the end of the epidemic, tourists are no longer influenced by security considerations and epidemic regulations in their choice of destinations. The flow of internet attention to tourist attractions has become decentralized and even, but the proportion of internet attention to “Natural Scenic Spots” is still higher than that of the pre-epidemic period. This phenomenon suggests that tourists preferred sparsely populated natural landscape types of tourist attractions during the epidemic and for a short period after the epidemic ended.

5. Discussion

5.1. Analysis of Driving Mechanism

As one of the economic pillars of many cities, tourism can bring direct economic benefits to destinations, including catering, accommodation, transportation, sightseeing, shopping and entertainment, etc. [53]. As an essential means of measuring changes in demand and preferences of potential tourists for a destination, analysing the characteristics of internet attention can predict market trends, thus facilitating destinations to make more targeted marketing strategies and resource allocation [54,55].
First, the preceding analysis indicates that the COVID-19 pandemic considerably impacted on the potential demand for tourists. Although tourism internet attention has recovered significantly after the end of the epidemic, it has yet to reach the same level as in the same period before the pandemic. The global economic and social impact of the pandemic has been unprecedented, prompting tourists to adopt a more rational and cautious approach to their spending decisions. The results of the seasonal intensity indicator indicated that the seasonal discrepancy in internet attention was more pronounced following the epidemic. The tourism market tended to demonstrate greater prosperity during peak seasons and diminished prosperity during off-seasons, influenced by tourists’ risk perceptions. This finding is consistent with the study conducted by Chen and Aziz [56,57]. On this basis, we further analysed the frequency and temporal distribution of peaks in internet attention in urban tourism destinations, utilising the seasonal variation index. The findings indicate that these peaks are predominantly concentrated in April and the summer months of July and August. The findings of this analysis can assist urban tourism destinations in more accurately predicting peak and off-peak periods, optimising the allocation of resources and marketing strategies, and achieving the sustainable development of the tourism industry.
Secondly, from the point of view of changes in tourism factors, the three factors of “sightseeing, shopping, and entertainment” are more affected by the epidemic. Wang also pointed out in his study that these three factors are more susceptible to the influence of the economy and the macro-environment due to the more excellent elasticity of demand [46]. The urban differences and spatial distribution are further analysed based on understanding the changes in the weights of tourism factors. The results of the analysis demonstrate that the differences between cities in the six factors of “catering, accommodation, transportation, sightseeing, shopping, and entertainment” are becoming increasingly insignificant. This is also a consequence of China’s rapid development, which gradually reduces the differences between the tourism industries of cities [58,59]. The findings of this analysis will assist cities in comprehending changes in tourism demand, adjusting the supply of services and products in related industries, achieving an accurate match between supply and demand, and improving the efficiency of resource allocation.
Thirdly, the research findings indicate that the extent of damage to the internet attention of urban tourist attractions due to the epidemic is more significant. However, the epidemic’s influence on the natural landscape of attractions is relatively tiny, but the degree of influence on the cultural activities of attractions is more considerable, which is similar to previous research results [22,23,60].
In conclusion, this study employs an internet attention perspective to quantitatively assess the loss, change, and recovery process of tourism internet attention under the impact of the COVID-19 epidemic across multiple temporal and spatial scales. This paper enriches the dynamic study of the overall spatial–temporal construction of tourist cities from a macro perspective. The findings of this paper have the potential to assist destinations in conducting tourism marketing and achieving the precise matching of supply and demand in the tourism industry. This could address the address the issue of uncoordinated and insufficient regional development, which aligns with the Sustainable Development Goals of the United Nations. Although this study focuses on China, the findings and suggested countermeasures are relevant and significant for the sustainable development of other tourist cities worldwide.

5.2. Limitations

Due to the relatively short period since the end of the epidemic in China, only the time node of 2023 was chosen to analyse the level of internet concern data after the end of the epidemic. Therefore, future research on recovering tourists’ internet attention in tourist cities after the epidemic needs to be explored over a longer period. As an indicator of the potential needs of tourists, internet attention is only a partially accurate representation of tourism demand and the willingness of the tourism source market. This can be explored and supplemented in the future using multi-source data.

6. Conclusions and Recommendations

6.1. Conclusions

(1) The pandemic significantly impacted the development of tourism, and the potential demand for tourism in tourist destinations fell sharply. The prospective demand did not return to the level of the same period before the pandemic, although after the end of the epidemic, there was a significant improvement compared to the level during the epidemic. As a result of the epidemic, the overall trend of various industries is weak, and the consumption capacity of tourists shows a reduced trend compared to the pre-epidemic period. They are more rational and cautious in their consumption choices.
(2) After the end of the epidemic, tourism demand recovered and increased. Seasonal differences in internet attention became more pronounced, with peaks in the spring months of April and the summer months of July or August. The tourism market tends to be more prosperous during the high season and less prosperous during the low season.
(3) According to data from Baidu Index’s “Search Channels” and “Crowd Portrait” modules, the search index for city tourism is higher on PC than on mobile. Regarding age and gender characteristics, women and young people are the critical search groups. Regarding geographical distribution, the search groups for each city’s tourism keyword follow the “law of decreasing distance”, meaning that the number of internet attention gradually decreases with increasing distance.
(4) During the epidemic, the concentration of the city’s spatial distribution of the six types of tourism elements, namely “catering, accommodation, transportation, sightseeing, shopping, and entertainment”, became weaker. After the end of the epidemic, the two elements, “sightseeing” and “transportation”, recovered the fastest compared to the epidemic period. In addition, the two aspects, “catering” and “sightseeing”, showed a more significant increase in differences between cities.
(5) There are differences in the impact of the epidemic on the internet attention of different tourist attractions in the tourist city. The impact of the epidemic on famous tourist attractions and natural tourist attractions in the city is relatively small. However, the degree of impact on entertainment, leisure, and cultural activities in place-type tourist attractions is more significant.

6.2. Recommendations

(1) After the epidemic, tourists are more cautious and logical in their consumption, and cost-effective tourism product combinations are becoming popular in the tourism industry. Therefore, tourist cities should focus on increasing the cost-effectiveness of their tourism products in marketing. They should also introduce a series of preferential combinations of tourism products, such as discounts on air tickets and tourist attractions, preferential ticket policies for multiple attractions in the city, and preferential policies for the combination of tourist attractions and hotels. These measures will respond to the new changes in demand in the tourism market after the epidemic and attract more potential tourists.
(2) Tourist cities need to pay more attention to seasonal differences and the impact of holidays on the tourism marketing process. From the demand point of view, tourism cities should allocate marketing resources according to the seasonal characteristics of the city’s tourism internet attention. This includes increasing marketing investment during the peak period of internet attention and providing better information support to potential tourists. In this way, cities can attract potential tourists and effectively promote tourism. From a supply perspective, tourism cities also need to combine climatic factors, seasonal characteristics of natural resources, scenic attractions, and other resources unique to their location. They should differentiate their marketing and promotion strategies based on the specific characteristics of these resources to achieve higher marketing performance.
(3) In tourism marketing, tourism cities should use new media as a marketing channel to ensure real-time, comprehensive, and rich marketing information. Women and young people, as the primary marketing targets of tourism in tourism cities, pay more attention to the quality and experience of tourism products when gathering tourism information. They are also more likely to be influenced by the impact of advertising and other people’s experiences after their trip. Therefore, tourism marketing needs to pay more attention to the tourism needs and information-gathering preferences of these two groups of people. Marketing can also be divided into different market levels according to distance, and targeted marketing can be carried out.
(4) As a necessary element of the tourism industry, optimising the industrial structure is not only the optimisation of each aspect but also the adjustment, balance, and coordination among the elements to meet the tourism needs of different groups. Compared to the epidemic period, the two aspects of “sightseeing” and “transportation” have recovered the fastest. Therefore, tourist cities should pay more attention to recovering and upgrading of industries related to these two elements. Tourist cities are advised to take advantage of changes in consumption trends by developing and promoting local cuisines through speciality voting, local food branding, and documentary filming. They can also increase the competitiveness of urban tourism by innovating tourism products and itineraries, developing experiential and interactive tourism projects, and organizing large-scale thematic events.
(5) In the construction and management of tourist attractions, it is necessary to grasp the transformation of tourists’ needs. The management and construction of famous tourist attractions and natural landscape-type tourist attractions should improve the supporting facilities for tourism, enhance the quality of services in the tourist attractions, improve the satisfaction of tourists, and ensure the loyalty of tourists. Amusement parks and cultural sites should enhance the attractiveness of tourist attractions by innovating unique tourism products, organizing large-scale thematic activities, and integrating bundled sales of related resources in the surrounding area.

Author Contributions

Conceptualization, F.S. and Z.L.; methodology, Z.L.; software, M.X.; validation, F.S., Z.L. and M.H.; formal analysis, M.X.; data curation, M.H.; writing—original draft preparation, Z.L. and F.S.; writing—review and editing, M.X. and M.H.; funding acquisition, F.S. All authors have read and agreed to the published version of the manuscript.

Funding

This research was supported by the General Project of the National Social Science Foundation of China (No. 23BGL173), the General Project of the Social Science Foundation of Shandong Province (22CJJ37), the Project of Culture and Tourism Research Fund of Shandong Province (23WLY304), and the Project of Jinan City Municipal and Local Integration (JNSX2023030).

Institutional Review Board Statement

Not applicable.

Informed Consent Statement

Not applicable.

Data Availability Statement

The data presented in this study are available on request from the corresponding author.

Conflicts of Interest

The authors declare no conflicts of interest.

References

  1. Wang, C.; Meng, X.; Siriwardana, M.; Pham, T. The impact of COVID-19 on the Chinese tourism industry. Tour. Econ. 2022, 28, 131–152. [Google Scholar] [CrossRef]
  2. Niewiadomski, P. COVID-19: From temporary de-globalisation to a re-discovery of tourism? Tour. Geogr. 2020, 22, 651–656. [Google Scholar] [CrossRef]
  3. Lapointe, D. Reconnecting tourism after COVID-19: The paradox of alterity in tourism areas. Tour. Geogr. 2020, 22, 633–638. [Google Scholar] [CrossRef]
  4. Pan, B. The power of search engine ranking for tourist destinations. Tour. Manag. 2015, 47, 79–87. [Google Scholar] [CrossRef]
  5. Ruan, W.; Li, Y. The Impact and Spatial Difference of Natural Disaster Crisis on Tourist Demand. Econ. Geogr. 2018, 38, 214–223. [Google Scholar] [CrossRef]
  6. Bangwayo-Skeete, F.P.; Skeete, W.R. Can Google data improve the forecasting performance of tourist arrivals? Mixed-data sampling approach. Tour. Manag. 2015, 46, 454–464. [Google Scholar] [CrossRef]
  7. Xin, L.; Law, R. Forecasting tourism demand with decomposed search cycles. J. Travel. Res. 2020, 59, 52–68. [Google Scholar] [CrossRef]
  8. Huang, X.; Zhang, L.; Ding, Y. The Baidu Index: Uses in predicting tourism flows–A case study of the Forbidden City. Tour. Manag. 2017, 58, 301–306. [Google Scholar] [CrossRef]
  9. Li, S.; Chen, T.; Wang, L.; Ming, C. Effective tourist volume forecasting supported by PCA and improved BPNN using Baidu index. Tour. Manag. 2018, 68, 116–126. [Google Scholar] [CrossRef]
  10. Yang, X.; Pan, B.; Evans, J.A.; Lv, B. Forecasting Chinese tourist volume with search engine data. Tour. Manag. 2015, 46, 386–397. [Google Scholar] [CrossRef]
  11. Li, H.; Hu, M.; Li, G. Forecasting tourism demand with multisource big data. Ann. Tour. Res. 2020, 83, 102912. [Google Scholar] [CrossRef]
  12. Li, X.; Pan, B.; Law, R.; Huang, X. Forecasting tourism demand with composite search index. Tour. Manag. 2017, 59, 57–66. [Google Scholar] [CrossRef]
  13. Wang, Y.; Xi, M.; Chen, H.; Lu, C. Evolution and driving mechanism of tourism flow networks in the Yangtze River Delta urban agglomeration based on social network analysis and geographic information system: A double-network perspective. Sustainability 2022, 14, 7656. [Google Scholar] [CrossRef]
  14. Li, Y.; Gong, G.; Zhang, F. Network Structure Features and Influencing Factors of Tourism Flow in Rural Areas: Evidence from China. Sustainability 2022, 14, 9623. [Google Scholar] [CrossRef]
  15. Wang, K.; Guo, F.; Li, R.; Fu, X. International attention and spatial pattern of Chinese tourist destinations based on Tripadvisor. Prog. Geogr. 2014, 33, 1462–1473. [Google Scholar] [CrossRef]
  16. Jing, E.; Guo, F.; Li, R.; Zhang, J.; Fu, X. Research on the network attention of Hebei A-level scenic spots based on Sina Travel Blog. Geogr. Geo-Inf. Sci. 2015, 31, 118–122. [Google Scholar]
  17. Lim, C.; Min, J.C.; McAleer, M. Modelling income effects on long and short haul international travel from Japan. Tour. Manag. 2008, 29, 1099–1109. [Google Scholar] [CrossRef]
  18. Mao, C.K.; Ding, C.G.; Lee, H.Y. Post-SARS tourist arrival recovery patterns: An analysis based on a catastrophe theory. Tour. Manag. 2010, 31, 855–861. [Google Scholar] [CrossRef] [PubMed]
  19. Gang, X.; Gennian, S. Post-Evaluation of SARS in 2003 on Domestic Tourism in China: Loss Estimation in 31 Provinces Based on Background Trend Line. Econ. Geogr. 2008, 28, 1059–1063. [Google Scholar]
  20. Rahman, F.; Halim, N.A.; Ahad, A.; Alam, A.; Noor, K. Local Economic Impact of COVID-19 on the Urban Tourism-Related Services: A Perspective of Kochi Heritage City, Kerala. Sustainability 2023, 15, 16585. [Google Scholar] [CrossRef]
  21. Duro, J.A.; Perez-Laborda, A.; Turrion-Prats, J.; Fernández-Fernández, M. COVID-19 and tourism vulnerability. Tour. Manag. Perspect. 2021, 38, 100819. [Google Scholar] [CrossRef] [PubMed]
  22. Tuzová, K.; Vaishar, A.; Šťastná, M.; Urbanová, M. The Impacts of COVID-19 on the Visitor Attendance of Cultural and Natural Heritage: A Case Study of the South Moravian Region. Sustainability 2023, 15, 14081. [Google Scholar] [CrossRef]
  23. Huang, S.S.; Shao, Y.; Zeng, Y.; Liu, X.; Li, Z. Impacts of COVID-19 on Chinese nationals’ tourism preferences. Tour. Manag. Perspect. 2021, 40, 100895. [Google Scholar] [CrossRef] [PubMed]
  24. Ivanova, M.; Ivanov, I.K.; Ivanov, S. Travel behaviour after the pandemic: The case of Bulgaria. Anatolia 2021, 32, 1–11. [Google Scholar] [CrossRef]
  25. Jeong, J.Y.; Crompton, J.L.; Lee, K.Y. Applying the TRIRISK model to COVID-19 in tourism: A comparison between 2020 and 2021. Tour. Manag. Perspect. 2022, 41, 100936. [Google Scholar] [CrossRef]
  26. Zhang, S.; Sun, T.; Lu, Y. The COVID-19 pandemic and tourists’ risk perceptions: Tourism policies’ mediating role in sustainable and resilient recovery in the New Normal. Sustainability 2023, 15, 1323. [Google Scholar] [CrossRef]
  27. Zawadka, J.; Uglis, J.; Kozera-Kowalska, M.; Jęczmyk, A.; Pietrzak-Zawadka, J.; Wojcieszak-Zbierska, M.M. An Empirical Assessment of Students’ Tourist Preferences during the COVID-19 Pandemic from a Gender Perspective: Evidence from Poland. Sustainability 2023, 15, 14346. [Google Scholar] [CrossRef]
  28. Boto-García, D.; Mayor, M. Domestic tourism and the resilience of hotel demand. Ann. Tour. Res. 2022, 93, 103352. [Google Scholar] [CrossRef]
  29. Li, L.; Liu, S.; Li, C.; Zhang, P.; Lo, K. What matters for regional economic resilience amid multi shock situations: Structural or agency? Evidence from resource-based cities in China. Sustainability 2022, 14, 5701. [Google Scholar] [CrossRef]
  30. Duro, J.A.; Osorio, A.; Perez-Laborda, A.; Fernández-Fernández, M. Measuring tourism markets vulnerability across destinations using composite indexes. J. Destin. Mark. Manag. 2022, 25, 100731. [Google Scholar] [CrossRef]
  31. Zhao, C.; Yang, Y.; Wu, S.; Wu, W.; Xue, H.; An, K.; Zhen, Q. Search trends and prediction of human brucellosis using Baidu index data from 2011 to 2018 in China. Sci. Rep. 2020, 10, 5896. [Google Scholar] [CrossRef] [PubMed]
  32. Wang, Z.; He, J.; Ji, B.; Zhang, L.; Han, C.; Wang, M.; Wang, H.; An, S.; Zhao, M.; Zhen, Q. Using Baidu Index Data to Improve Chickenpox Surveillance in Yunnan, China: Infodemiology Study. J. Med. Internet Res. 2023, 25, 44186. [Google Scholar] [CrossRef] [PubMed]
  33. Liu, K.; Wang, T.; Yang, Z.; Huang, X.; Milinovich, G.J.; Lu, Y.; Jing, Q.; Xia, Y.; Zhao, Z.; Yang, Y.; et al. Using Baidu search index to predict dengue outbreak in China. Sci. Rep. 2016, 6, 38040. [Google Scholar] [CrossRef] [PubMed]
  34. Aaronson, D.; Brave, S.A.; Butters, R.A.; Fogarty, M.; Sacks, D.W.; Seo, B. Forecasting unemployment insurance claims in realtime with Google Trends. Int. J. Forecast. 2022, 38, 567–581. [Google Scholar] [CrossRef]
  35. Flanagan, R.; Kuo, B.; Staller, K. Utilizing Google Trends to assess worldwide interest in irritable bowel syndrome and commonly associated treatments. Dig. Dis. Sci. 2021, 66, 814–822. [Google Scholar] [CrossRef] [PubMed]
  36. Bansal, A.; Gupta, S.; Jain, V.; Kumar, A.; Klein, A. Utilizing Google trends to assess worldwide interest in COVID-19 and myocarditis. J. Med. Syst. 2021, 45, 1–2. [Google Scholar] [CrossRef] [PubMed]
  37. Jiao, S.; Li, M.; Tian, F. Distribution Pattern and Driving Mechanism of Network Attention of Chinese Red Tourism Classic Scenic Spots. Econ. Geogr. 2022, 42, 211–220. [Google Scholar] [CrossRef]
  38. Fang, Y.; Cheng, X.; Huang, Z. The Dislocation Characteristics and Mechanism of Network Attention and Tourists about Chinese National Scenic Spots. Econ. Geogr. 2020, 40, 204–213. [Google Scholar] [CrossRef]
  39. Xue, C.H.; Bai, Y. Spatiotemporal Characteristics and Factors Influencing Urban Tourism Market Network in Western China: Taking Chengdu as an Example. Sustainability 2023, 15, 8135. [Google Scholar] [CrossRef]
  40. Zhang, G.; Yuan, H. Spatio-temporal evolution characteristics and spatial differences in urban tourism network attention in China: Based on the Baidu index. Sustainability 2022, 14, 13252. [Google Scholar] [CrossRef]
  41. Pan, B.; Chenguang Wu, D.; Song, H. Forecasting hotel room demand using search engine data. J. Hosp. Tour. Technol. 2012, 3, 196–210. [Google Scholar] [CrossRef]
  42. Wen, L.; Liu, C.; Song, H.; Liu, H. Forecasting tourism demand with an improved mixed data sampling model. J. Travel. Res. 2021, 60, 336–353. [Google Scholar] [CrossRef]
  43. Park, S.; Lee, J.; Song, W. Short-term forecasting of Japanese tourist inflow to South Korea using Google trends data. J. Travel. Tour. Mark. 2017, 34, 357–368. [Google Scholar] [CrossRef]
  44. Dergiades, T.; Mavragani, E.; Pan, B. Google Trends and tourists’ arrivals: Emerging biases and proposed corrections. Tour. Manag. 2018, 66, 108–120. [Google Scholar] [CrossRef]
  45. Hou, X. Tourism Network Attention Variation of Chinese Cities under the COVID-19 Pandemic. Sustainability 2022, 14, 5131. [Google Scholar] [CrossRef]
  46. Wang, Q.; Liu, Y.; Li, X. Evolution characteristics of 24 major cities’ network attention degree of six elements of tourism in China. World Reg. Stud. 2017, 26, 45–55. [Google Scholar] [CrossRef]
  47. Shi, J.; Gao, X.; Xue, S.; Li, F.; Nie, Q.; Lv, Y.; Wang, J.; Xu, T.; Du, G.; Li, G. Spatio-temporal evolution and influencing mechanism of the COVID-19 epidemic in Shandong province, China. Sci. Rep. 2021, 11, 7811. [Google Scholar] [CrossRef] [PubMed]
  48. Zhang, L.; Liu, Y. Generalization of Tourisms Sciences; Beijing Normal University Publishing Group: Beijing, China, 2013. [Google Scholar]
  49. Bao, J.; Yang, M.; Weng, H. Development of Tourism Geography as a Discipline in China. Econ. Geogr. 2021, 41, 79–86. [Google Scholar] [CrossRef]
  50. Xu, H.; Zhu, D.; Bao, J. Sustainability and nature-based mass tourism: Lessons from China’s approach to the Huangshan Scenic Park. J. Sustain. Tour. 2016, 24, 182–202. [Google Scholar] [CrossRef]
  51. Sun, G. Foundation and Significance of Background Trend Line of Tourists from Abroad in China. Econ. Geogr. 1998, 5, 51–57. [Google Scholar]
  52. Wang, Q.; Mei, L.; Jiang, H. Spatio-temporal Differentiation and Influencing Factors of Star-rated Hotels’ Resilience of China’s Tourism Cities. Sci. Geogr. Sin. 2022, 42, 1483–1491. [Google Scholar] [CrossRef]
  53. Prayag, G.; Ryan, C. The relationship between the ‘push’ and ‘pull’ factors of a tourist destination: The role of nationality–an analytical qualitative research approach. Curr. Issues Tour. 2011, 14, 121–143. [Google Scholar] [CrossRef]
  54. Volchek, K.; Liu, A.; Song, H.; Buhalis, D. Forecasting tourist arrivals at attractions: Search engine empowered methodologies. Tour. Econ. 2019, 25, 425–447. [Google Scholar] [CrossRef]
  55. Höpken, W.; Eberle, T.; Fuchs, M.; Lexhagen, M. Improving tourist arrival prediction: A big data and artificial neural network approach. J. Travel. Res. 2021, 60, 998–1017. [Google Scholar] [CrossRef]
  56. Chen, X.; Xia, E.; He, T. Influence of traveller risk perception on the willingness to travel in a major epidemic. Int. J. Sustain. Dev. Plan. 2020, 15, 901–909. [Google Scholar] [CrossRef]
  57. Aziz, N.A.; Long, F. To travel, or not to travel? The impacts of travel constraints and perceived travel risk on travel intention among Malaysian tourists amid the COVID-19. J. Consum. Behav. 2022, 21, 352–362. [Google Scholar] [CrossRef] [PubMed]
  58. Wang, X.; Wang, M.; Lu, X.; Guo, L.; Zhao, R.; Ji, R. Spatio-temporal evolution and driving factors of the high-quality development of provincial tourism in China. Chin. Geogr. Sci. 2022, 32, 896–914. [Google Scholar] [CrossRef]
  59. Liu, Y.; Han, Y. Factor structure, institutional environment and high-quality development of the tourism economy in China. Tour. Trib. 2020, 35, 28–38. [Google Scholar] [CrossRef]
  60. Gao, Y.; Sun, D.; Zhang, J. Study on the impact of the COVID-19 pandemic on the spatial behavior of urban tourists based on commentary big data: A case study of Nanjing, China. ISPRS Int. J. Geo-Inf. 2021, 10, 678. [Google Scholar] [CrossRef]
Figure 1. Geographic distribution of selected tourist cities.
Sustainability 16 05853 g001
Figure 2. Research framework for this study.
Sustainability 16 05853 g002
Figure 3. The inter-annual variation in the internet attention of the city from 2017 to 2023.
Sustainability 16 05853 g003
Figure 4. The annual rate of change in the average monthly attention from 2018 to 2023.
Sustainability 16 05853 g004
Figure 5. Characteristics of monthly changes in the three time periods of tourism cities.
Sustainability 16 05853 g005
Figure 6. The proportion of the tourism elements of the city in the three periods is ranked.
Sustainability 16 05853 g006
Figure 7. Characteristics of the spatial distribution of tourism elements.
Sustainability 16 05853 g007
Figure 8. The degree of loss of internet attention in each tourist attraction in the tourist city.
Sustainability 16 05853 g008
Figure 9. Distribution of attraction attention in tourist cities before the epidemic.
Sustainability 16 05853 g009
Figure 10. Distribution of attractions of interest in tourist cities during the epidemic period.
Sustainability 16 05853 g010
Figure 11. Distribution of attraction attention in tourist cities after the epidemic.
Sustainability 16 05853 g011
Table 1. Search keywords for elements of urban tourism.
Tourism ElementsSearch Keywords
CateringFood; Food Tips; Snacks; Specialty Snacks; Specialties; Restaurants
AccommodationLodging; Hotel; Hotel Reservation; Guest House; Resort; Agriturismo
TransportationAirfare; Train Tickets; Airport; Train Station; Bus; Bus Schedule
SightseeingTravel; Travel Tips; Tourist Attractions; Fun Places; Driving Tours; Tour Groups
ShoppingSpecialties; Shopping; Malls; Souvenirs; Tourist Souvenirs; Specialty Gifts
EntertainmentEntertainment; Leisure; Entertainment Venues; Shows; Nightlife; Bars
Table 2. The number of tourist attractions selected for each city.
Number of Tourist Attractions with 4A and above and over 1000 Online ReviewsNumber of Tourist Attractions SelectedCities
More than 10015Beijing, Shanghai
70–10010Hangzhou, Guangzhou, Chengdu
40–708Shenzhen, Wuhan, Xi’an
Less than 40--
Table 3. Monthly distribution characteristics of internet attention in tourism cities in three periods.
CityPre-EpidemicEpidemic PeriodPost-Epidemic
PeakMonthSPeakMonthSPeakMonthS
BeijingtripleApr. Aug. Oct.1.401twiceMay Sept.1.883tripleMay Aug. Oct.2.283
ShanghaitwiceApr. Aug.1.769twiceJul. Oct.1.092doubleApr. Aug.1.970
HangzhoudoubleApr. Aug.1.516doubleJul. Oct.1.619doubleApr. Jul.2.308
GuangzhousingleAug.1.137doubleApr. Jul.1.216doubleApr. Aug.1.284
ChengdusingleAug.1.009singleJul.1.075singleAug.1.803
ShenzhendoubleApr. Jul.1.183doubleApr. Jul.1.281doubleApr. Aug.2.562
WuhantripleApr. Aug. Oct.1.080singleJul.0.896tripleApr. Aug. Oct.2.426
Xi’andoubleMay Aug.1.437doubleApr. Jul.1.518singleMay Jul.1.954
Table 4. Spatial statistics for tourist cities.
TypeCentre PointShort Axis
(km)
Long Axis
(km)
Rotation
(°)
Ellipse Size
(km2)
Ellipticity
CateringPre-epidemic115°93′ E, 30°86′ N787.6901.685.012,229,7580.126
Epidemic period113°83′ E, 31°56′ N857.2972.530.472,617,5630.119
Post-epidemic114°05′ E, 31°77′ N849.1940.327.942,506,9940.097
AccommodationPre-epidemic114°84′ E, 31°03′ N840.41016.442.012,682,1690.173
Epidemic period114°80′ E, 30°98′ N875.31022.348.832,809,6440.161
Post-epidemic114°34′ E, 31°00′ N854.21017.955.942,730,2660.144
TransportationPre-epidemic114°52′ E, 30°38′ N827.3977.59.432,539,2210.223
Epidemic period114°93′ E, 30°18′ N812.1940.414.052,397,9930.154
Post-epidemic114°75′ E, 30°18′ N798.81027.615.202,577,4980.136
SightseeingPre-epidemic113°60′ E, 31°57′ N865.9935.926.872,544,7060.075
Epidemic period113°48′ E, 31°53′ N887.3947.524.622,640,0390.064
Post-epidemic113°86′ E, 31°15′ N874.5951.021.352,611,4520.080
ShoppingPre-epidemic113°94′ E, 30°04′ N818.31005.911.642,584,4220.187
Epidemic period114°15′ E, 30°36′ N849.4983.020.082,621,7750.136
Post-epidemic115°04′ E, 30°06′ N774.9947.216.552,304,8220.182
EntertainmentPre-epidemic114°23′ E, 30°29′ N761.5946.514.772,263,0870.195
Epidemic period114°20′ E, 30°45′ N854.1913.017.822,448,5350.064
Post-epidemic114°18′ E, 29°92′ N761.5946.510.012,263,0870.195
Table 5. The variation coefficient of the elements of city tourism in three periods.
PeriodsCateringAccommodationTransportationSightseeingShoppingEntertainment
Pre-epidemic20170.4790.4960.4211.0951.7681.289
20180.4740.4810.4781.0591.6171.091
20190.4510.4690.4671.0021.4350.896
Epidemic period20200.4490.5010.4370.8670.8460.659
20210.4730.5210.4590.9950.7760.753
20220.4760.4960.4230.7320.6890.709
Post-epidemic20230.5150.5070.4981.4730.9180.825
Table 6. Geographic agglomeration index of city tourist attractions from 2017 to 2023.
PeriodsBeijingShanghaiHangzhouGuangzhouChengduShenzhenWuhanXi’an
Pre-epidemic201750.16348.74649.13048.52047.74850.39647.35765.788
201852.65755.73254.67349.57447.56156.67248.72063.473
201950.64758.52857.70948.85049.32060.07147.50262.777
Epidemic period202061.91474.42367.93766.14460.36182.63361.53574.458
202154.65776.24069.23870.39760.64790.88665.12274.102
202260.91694.71375.36278.56967.130118.90678.13587.622
Post-epidemic202354.71661.28159.33862.70155.41870.40257.80462.893
Table 7. Type of tourist attractions in eight tourist cities.
TypeAttractions
Natural Scenic SpotsXiling Snow Mountain, West Lake, Xixi Wetland Park, Baiyun Mountain, East Lake, Huangpu River Cruise, Qiantang River, Yangtze River Bridge, Mount Qingcheng, Shenzhen Bay Park, Dameisha, Shenzhen, Mutianyu Great Wall, Badaling Great Wall, Dujiangyan Irrigation System, Pearl River Night Cruise, Hankou Riverside, Qiandao Lake; Rose Coast
Historical and Cultural SpotsYuanmingyuan Park, Lingyin Temple, Temple of Heaven, The Palace Museum, Wuhou Shrine, Hubu Alley, Huaqing Palace, Big Wild Goose Pagoda, Leifeng Pagoda, Daming Palace, Terracotta Army, Da Tang Furong Garden, Prince Gong’s Mansion, Datang Everbright City, Shamian Island, Qinghefang, Yellow Crane Tower, Nanluoguxiang, Du Fu Thatched Cottage; Summer Palace
Architectural LandscapeBeijing National Stadium, Tiananmen Square, Shanghai City God Temple, Yu Garden, Shanghai, The Bund, Shanghai, Nanjing Road Walking Street, Jinli Ancient Street, Hangzhou Paradise, Xi’an City Wall, Wide and Narrow Alleys, Guangzhou Canton Tower, People’s Square, Window of the World, Tianzifang, Shanghai, Gubei Water Town; Oriental Pearl Tower
Science Education AttractionsMadame Tussauds Shanghai, Shaanxi History Museum, Shanghai Science Museum, Shanghai Museum, National Museum of China, Guangdong Museum, Shanghai Wild Animal Park, Beijing Wildlife Park, Chengdu Polar Ocean World, Haichang Polar Ocean World, Guangzhou Science Center, Jinsha Site Museum; Hubei Provincial Museum
Theme ParksShanghai Happy Valley, Chimelong Paradise, Shanghai Disney Resort, Chimelong International Circus, Wuhan Happy Valley, The Giant Panda Base, Chimelong Safari Park, Chimelong Water Park, Eastern Overseas Chinese Town, Shenzhen Happy Valley, Shenzhen Safari Park, Universal Studios BeijingSong Dynasty Town, Splendid China Folk Village, Beijing Happy Valley, Hangzhou Safari Park; Shanghai Aquarium
Disclaimer/Publisher’s Note: The statements, opinions and data contained in all publications are solely those of the individual author(s) and contributor(s) and not of MDPI and/or the editor(s). MDPI and/or the editor(s) disclaim responsibility for any injury to people or property resulting from any ideas, methods, instructions or products referred to in the content.

