


Digital Twin Technology in the Gas Industry: A Comparative Simulation Study


Abstract
:1. Introduction
- How can digital twin technology be implemented in the gas industry to improve operational efficiency and stability?
- How effective is the performance when simulation data are applied to a prediction model?
- Which model provides the most accurate prediction results?
- How can gas pressure equipment be managed using a predictive maintenance model and how does it contribute to improving the industrial stability and efficiency?
2. Literature Review
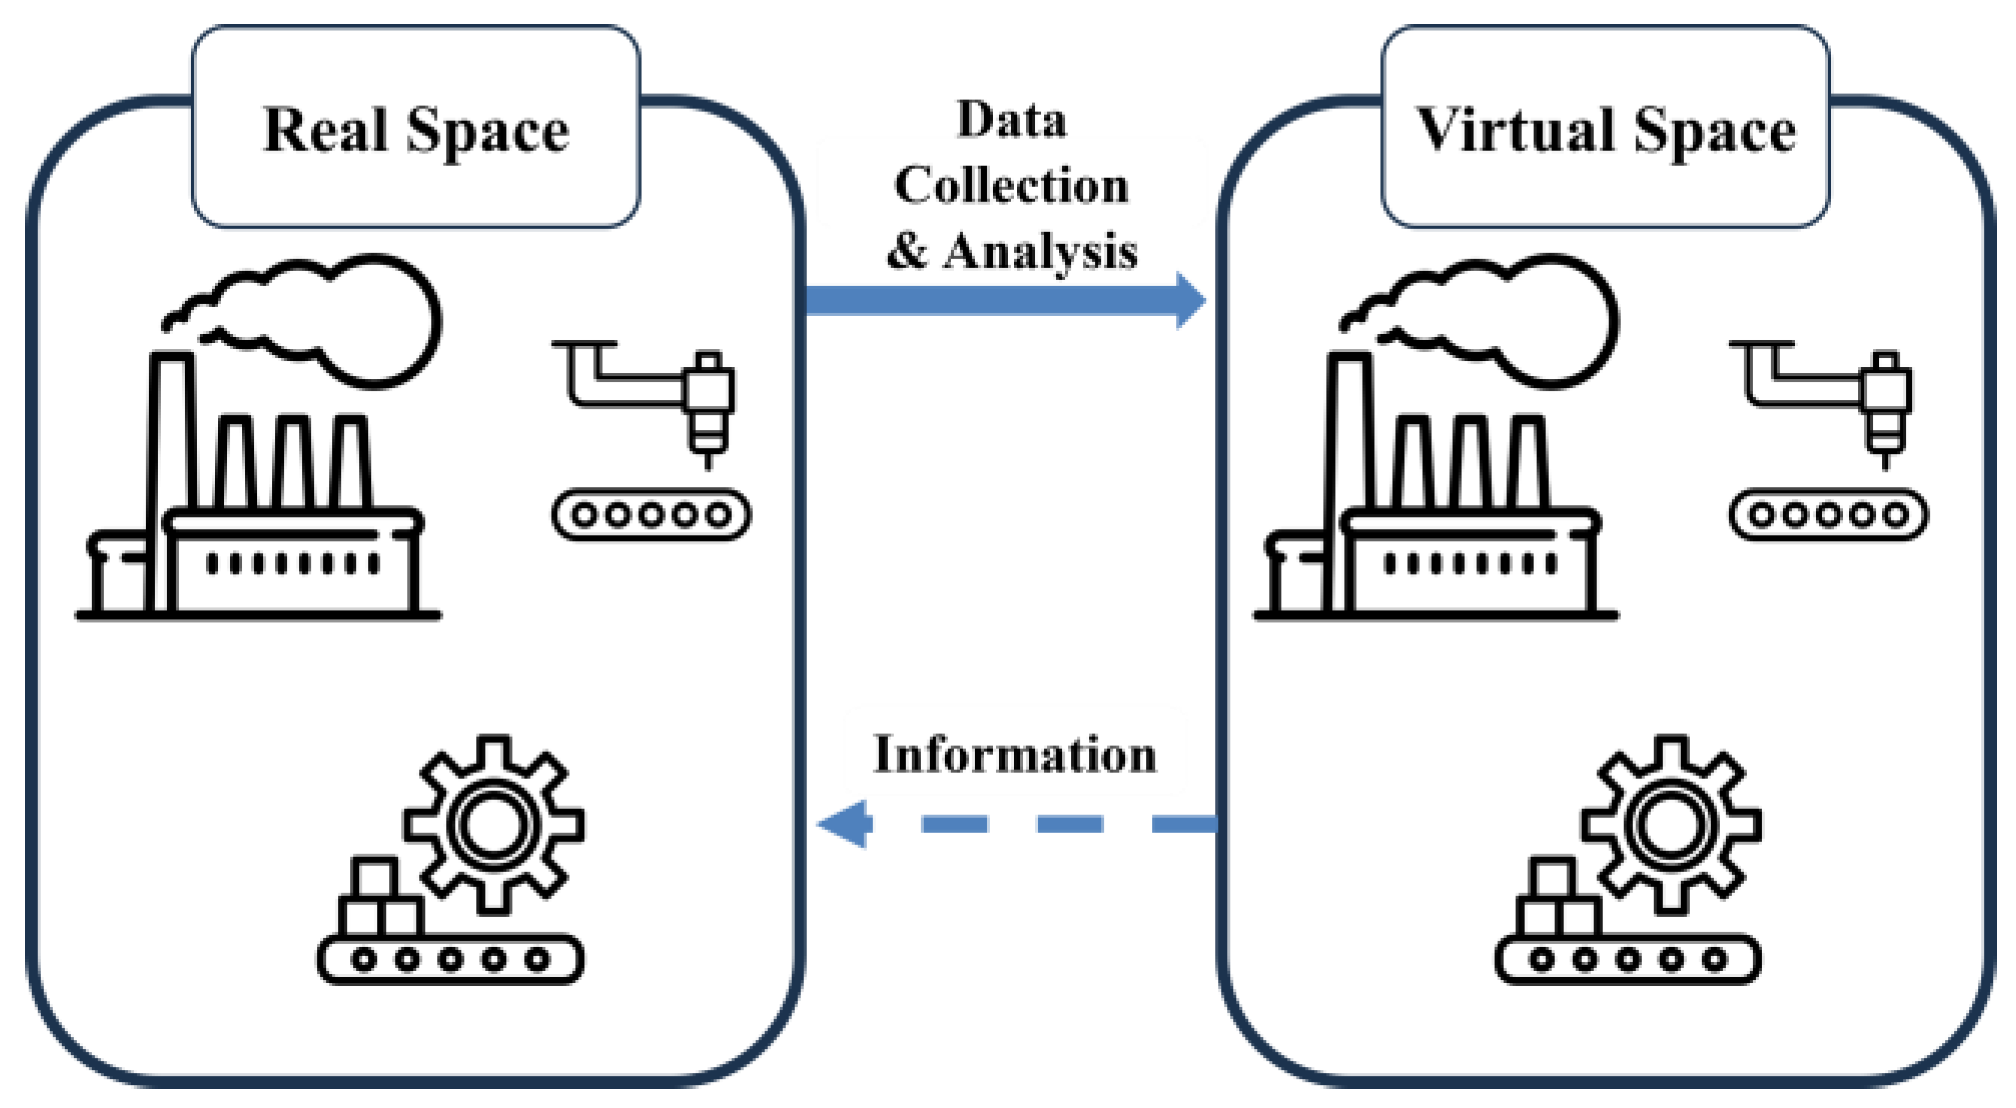
2.1. Digital Twin Technology
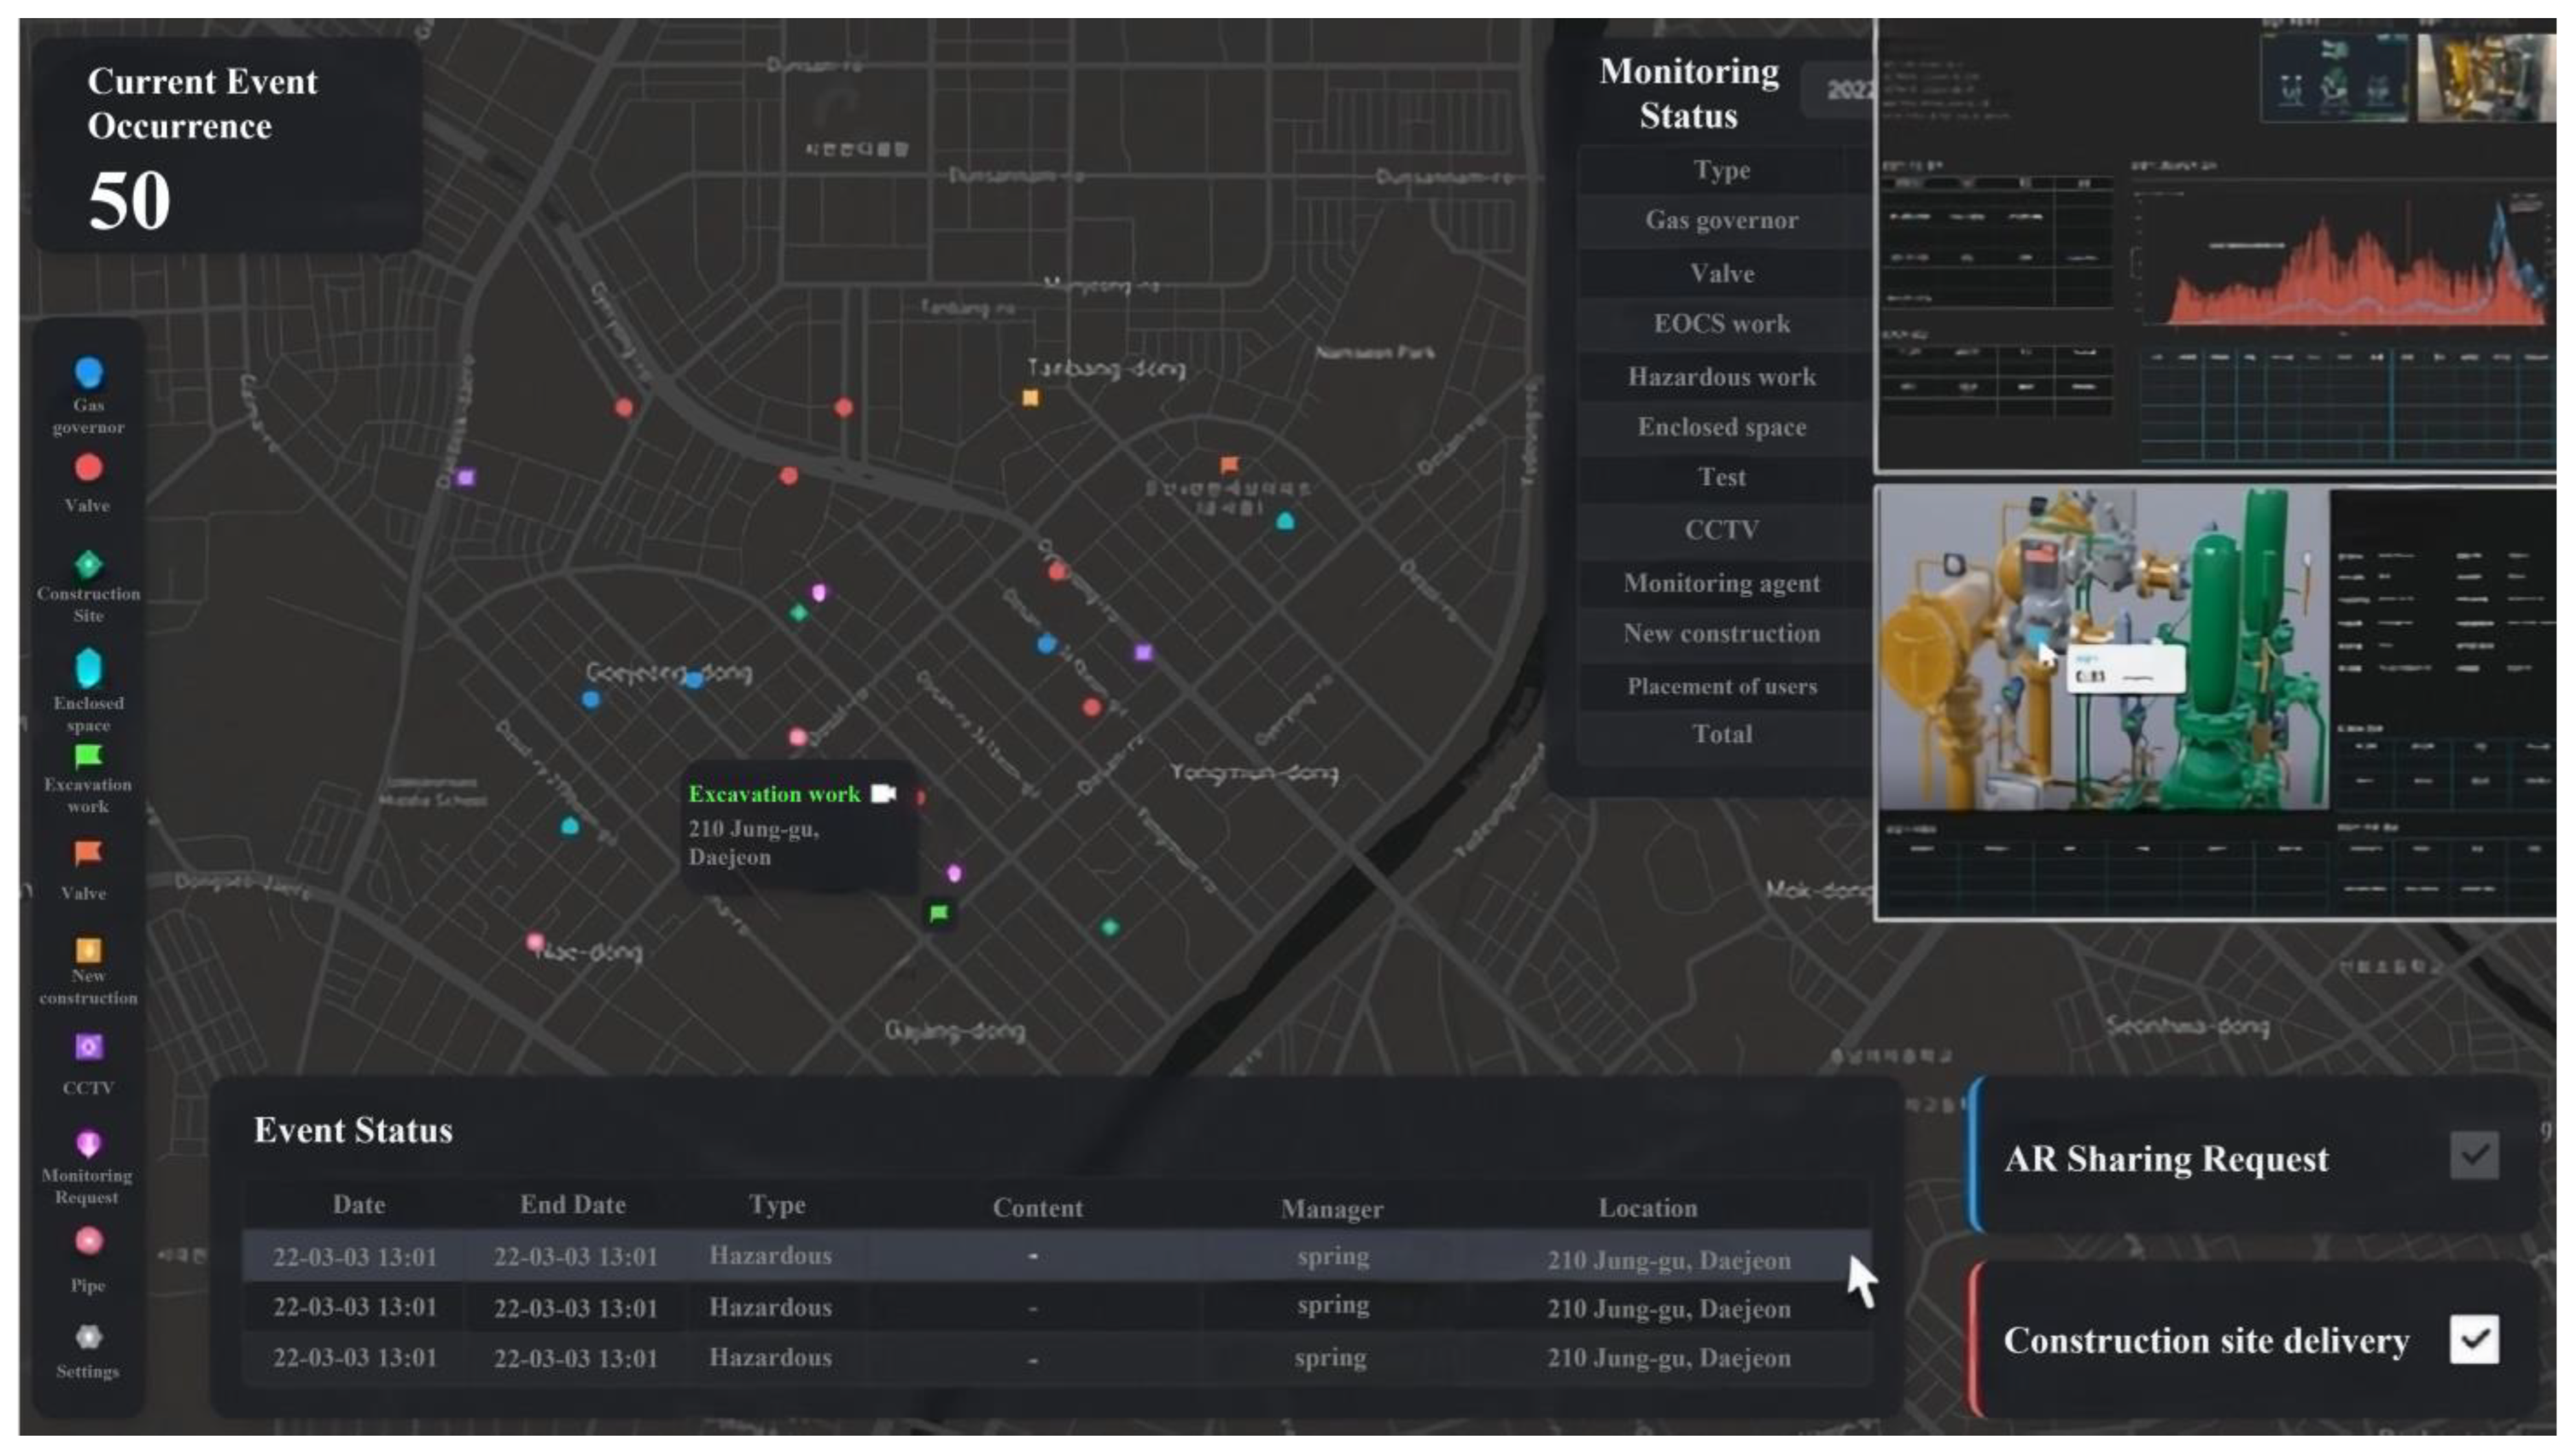
2.2. Digital Twin Technology in the Gas Industry
2.3. Simulation and Prediction Models
3. Methodology
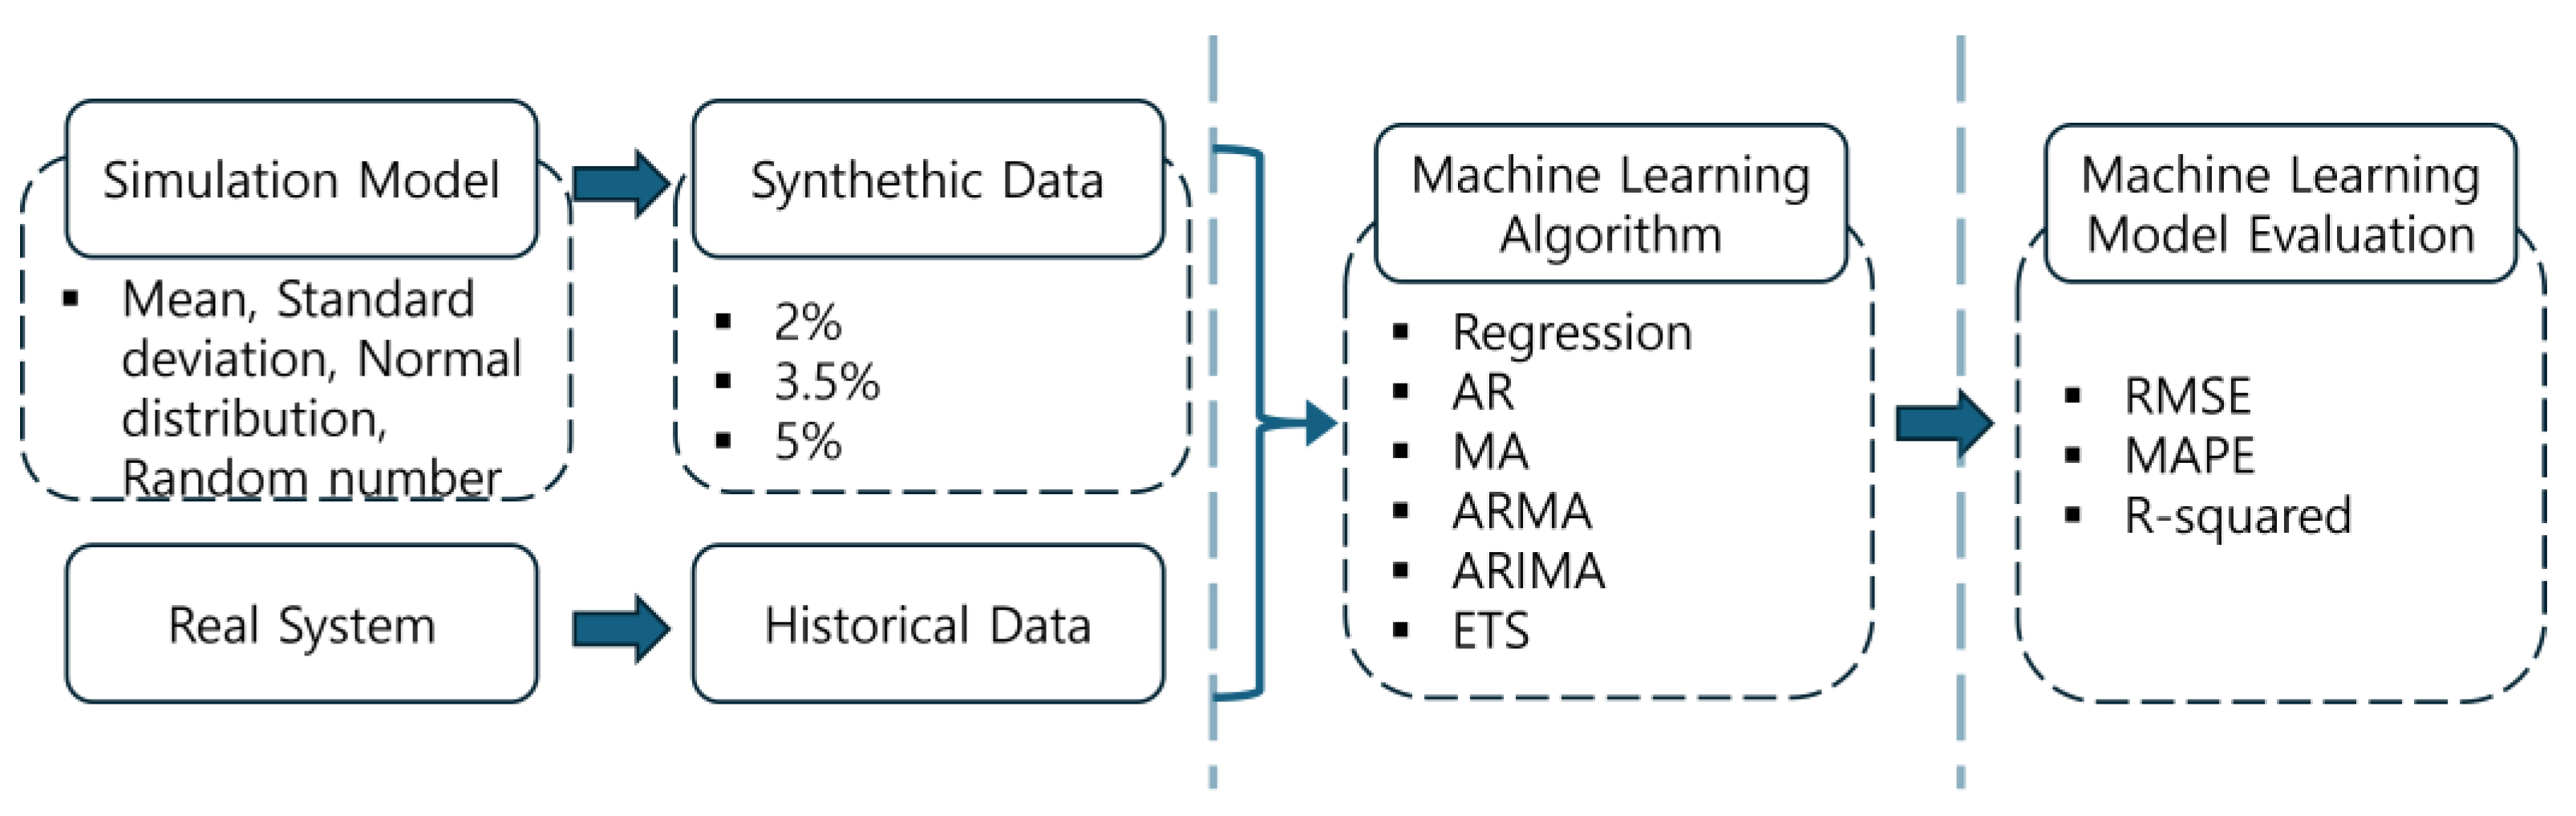
3.1. Research Process
3.2. Data
3.3. Algorithm for the Gas Pressure Prediction Model
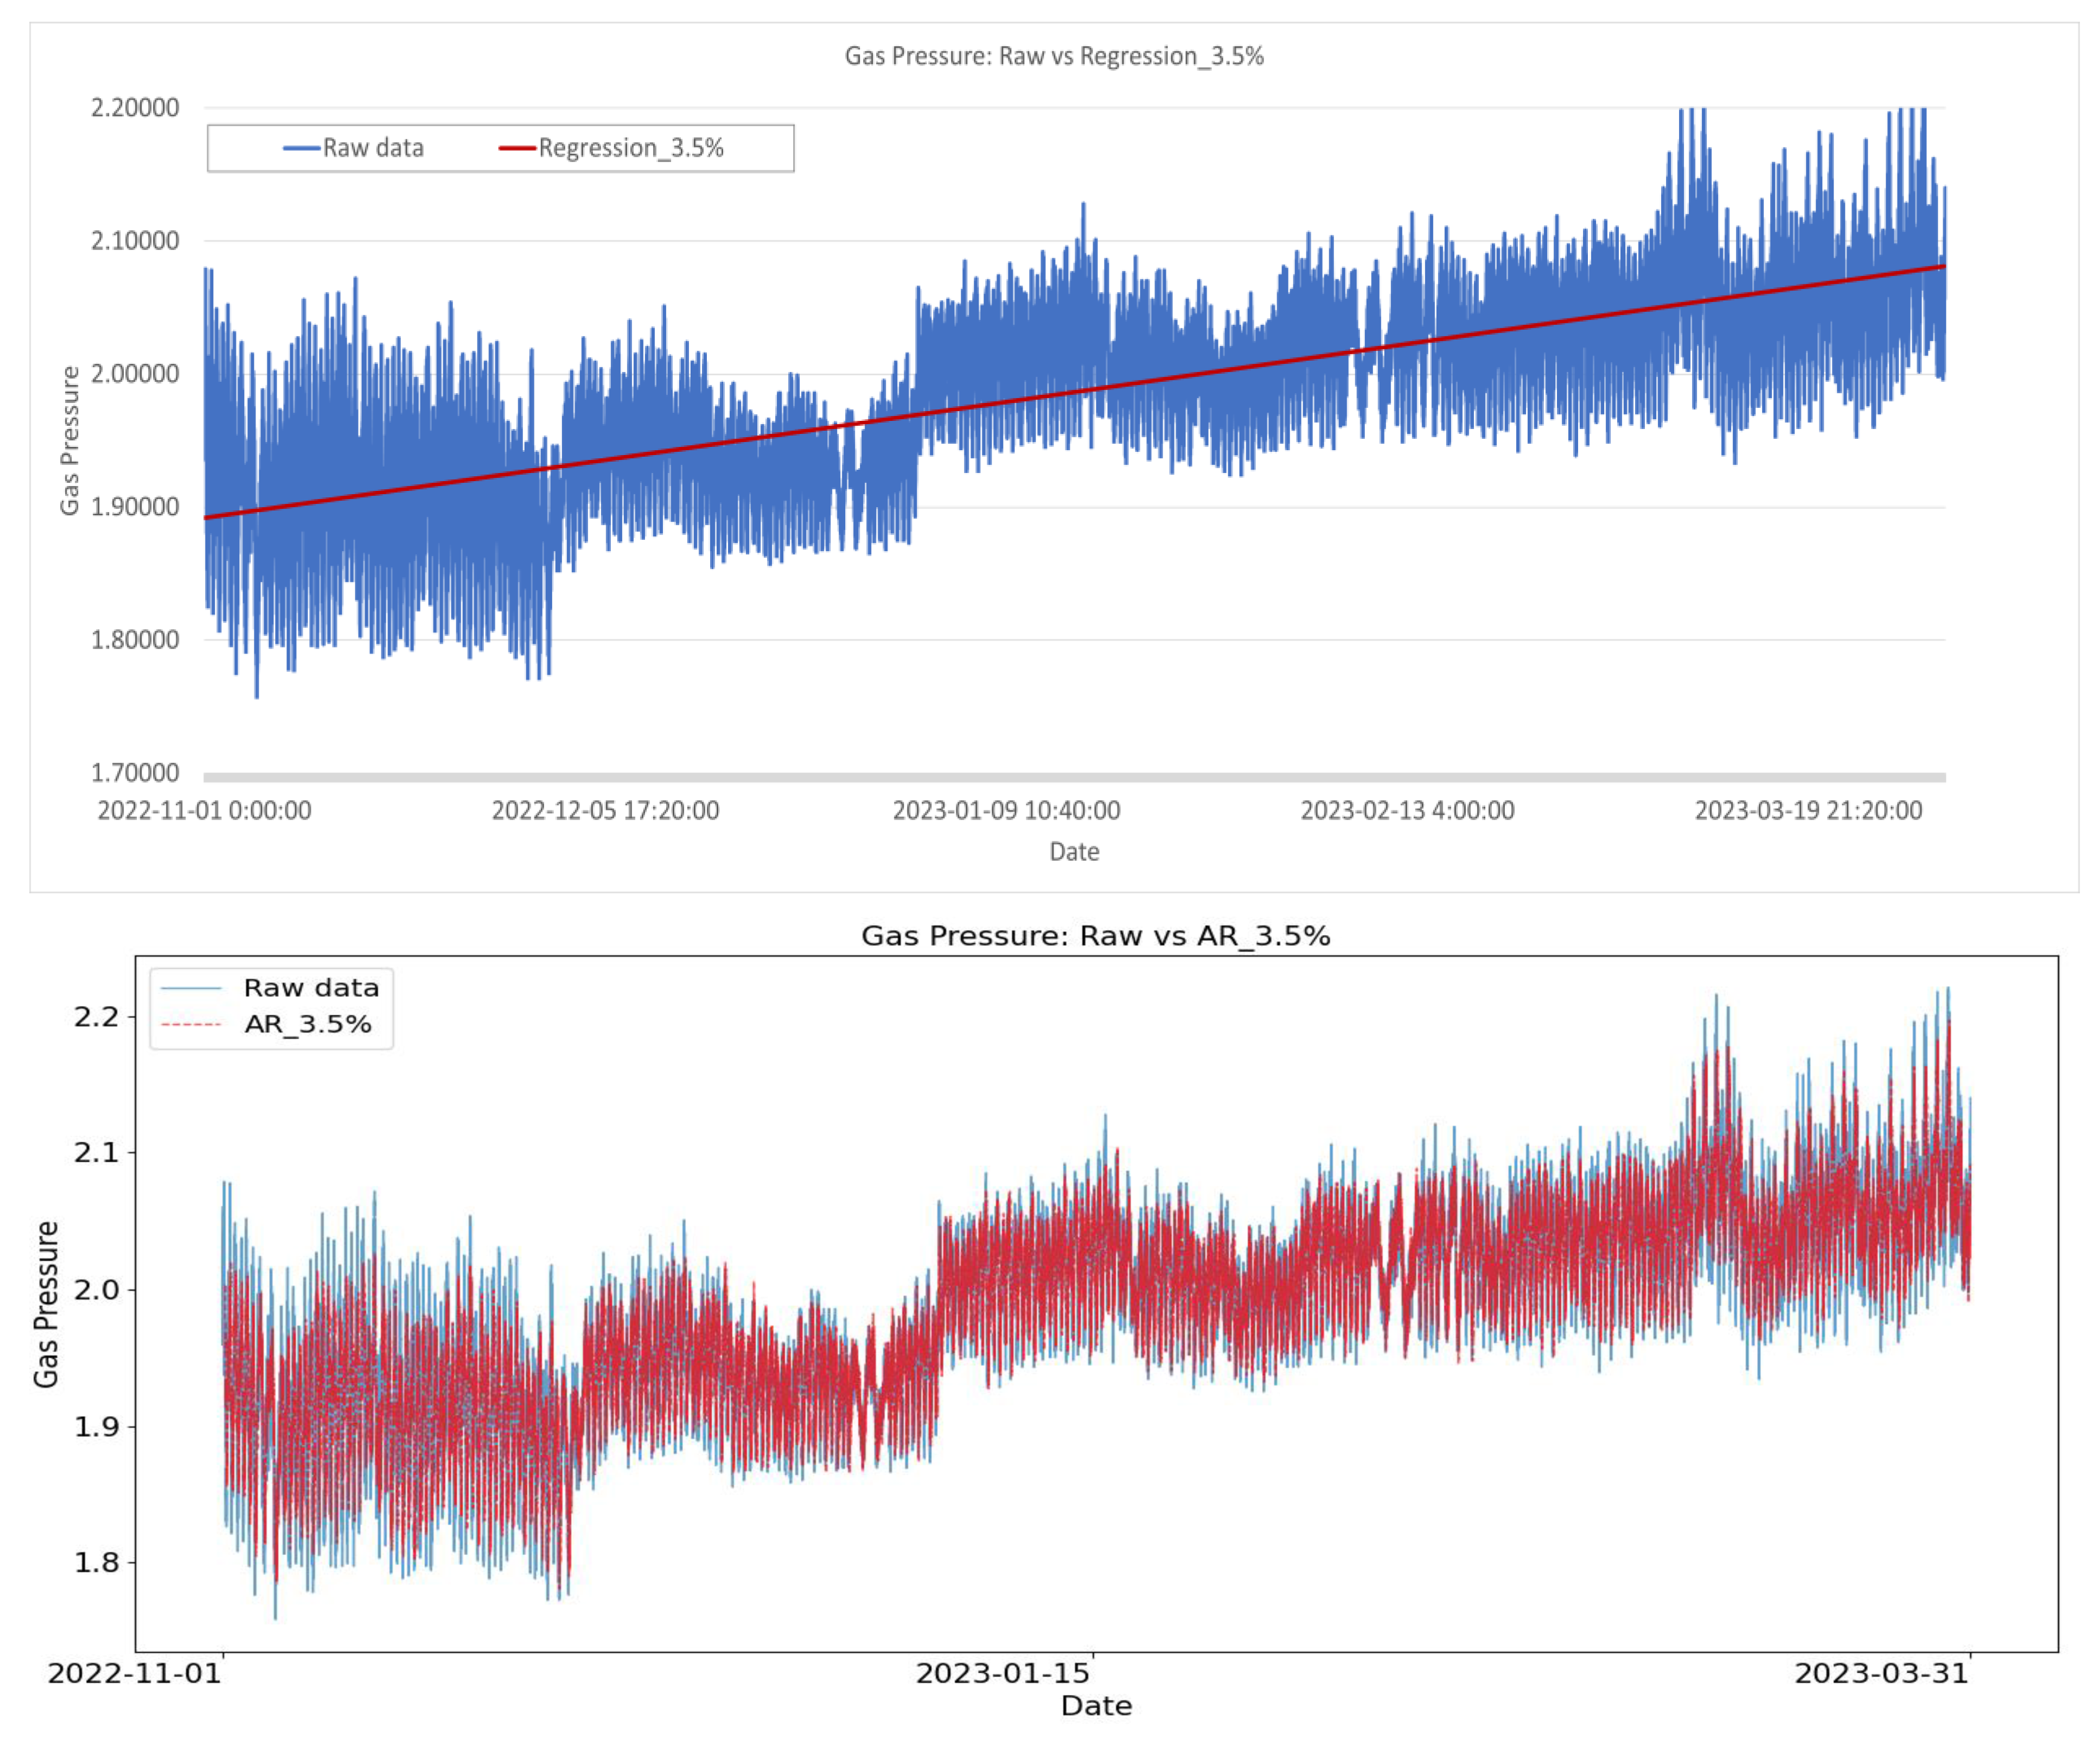
3.3.1. Linear Regression
3.3.2. AR (Autoregressive)
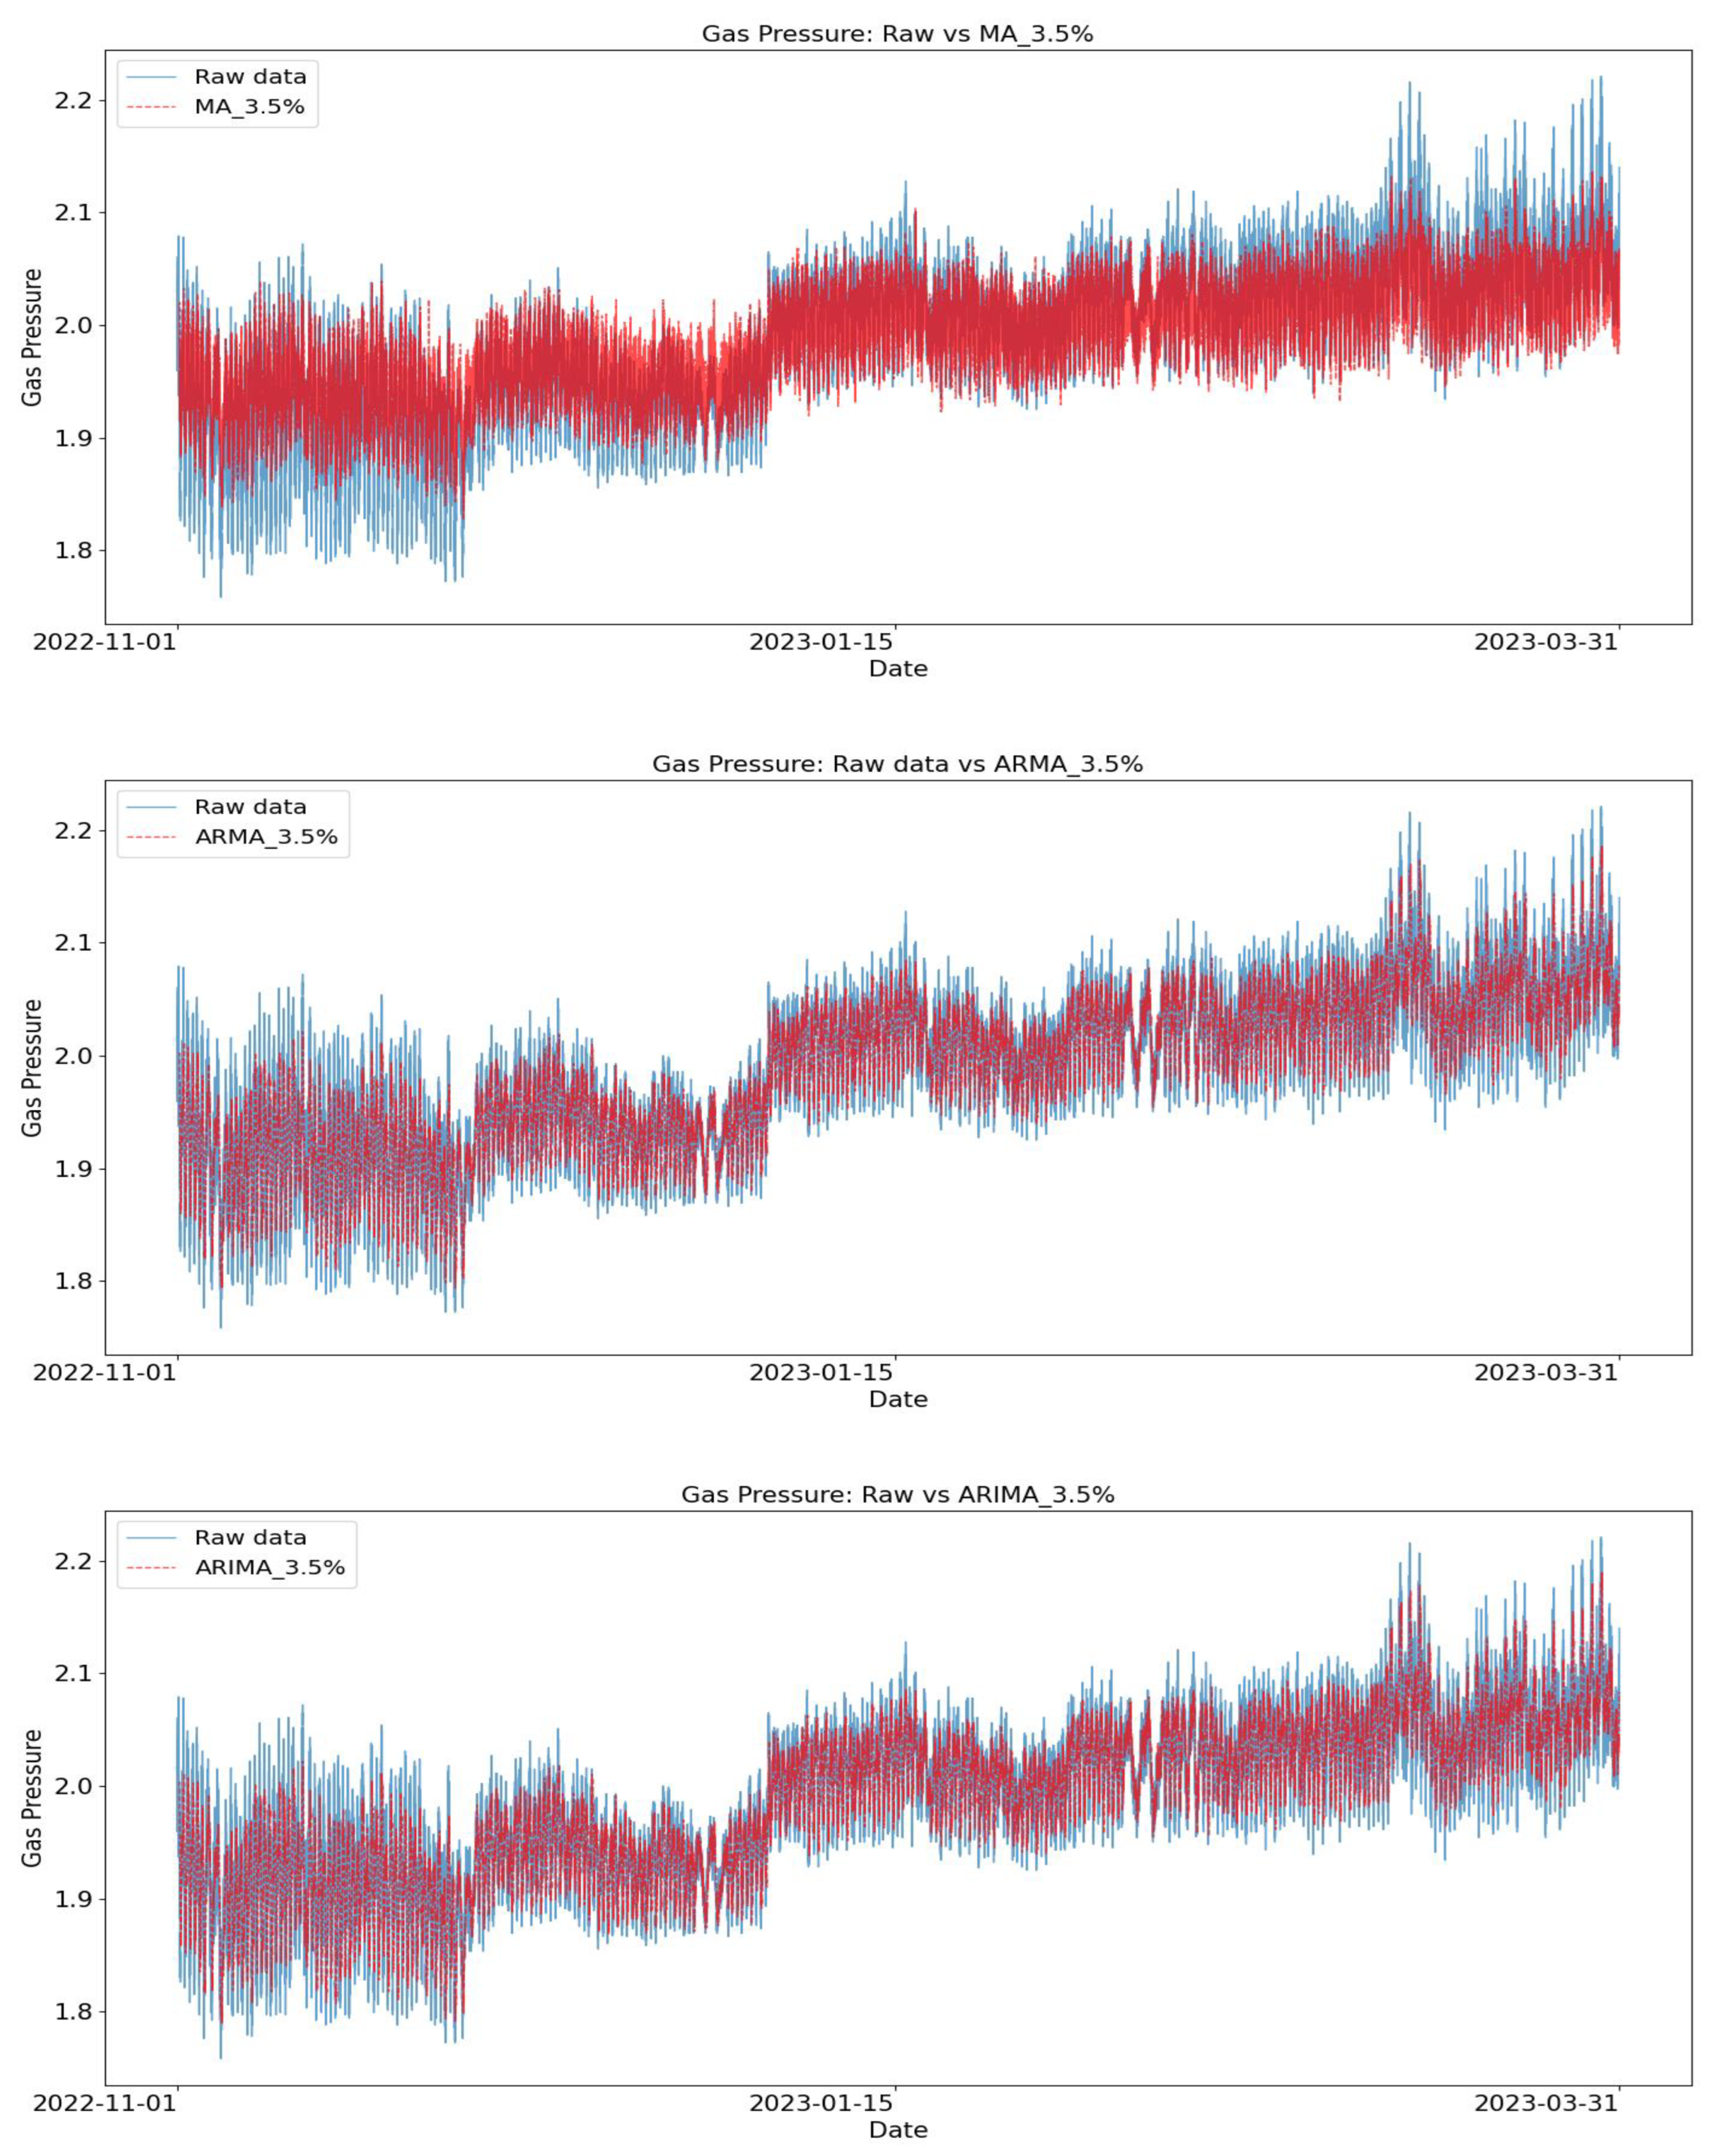
3.3.3. MA (Moving Average)
3.3.4. ARMA (Autoregressive and Moving Average)
3.3.5. ARIMA (Autoregressive Integrated Moving Average)
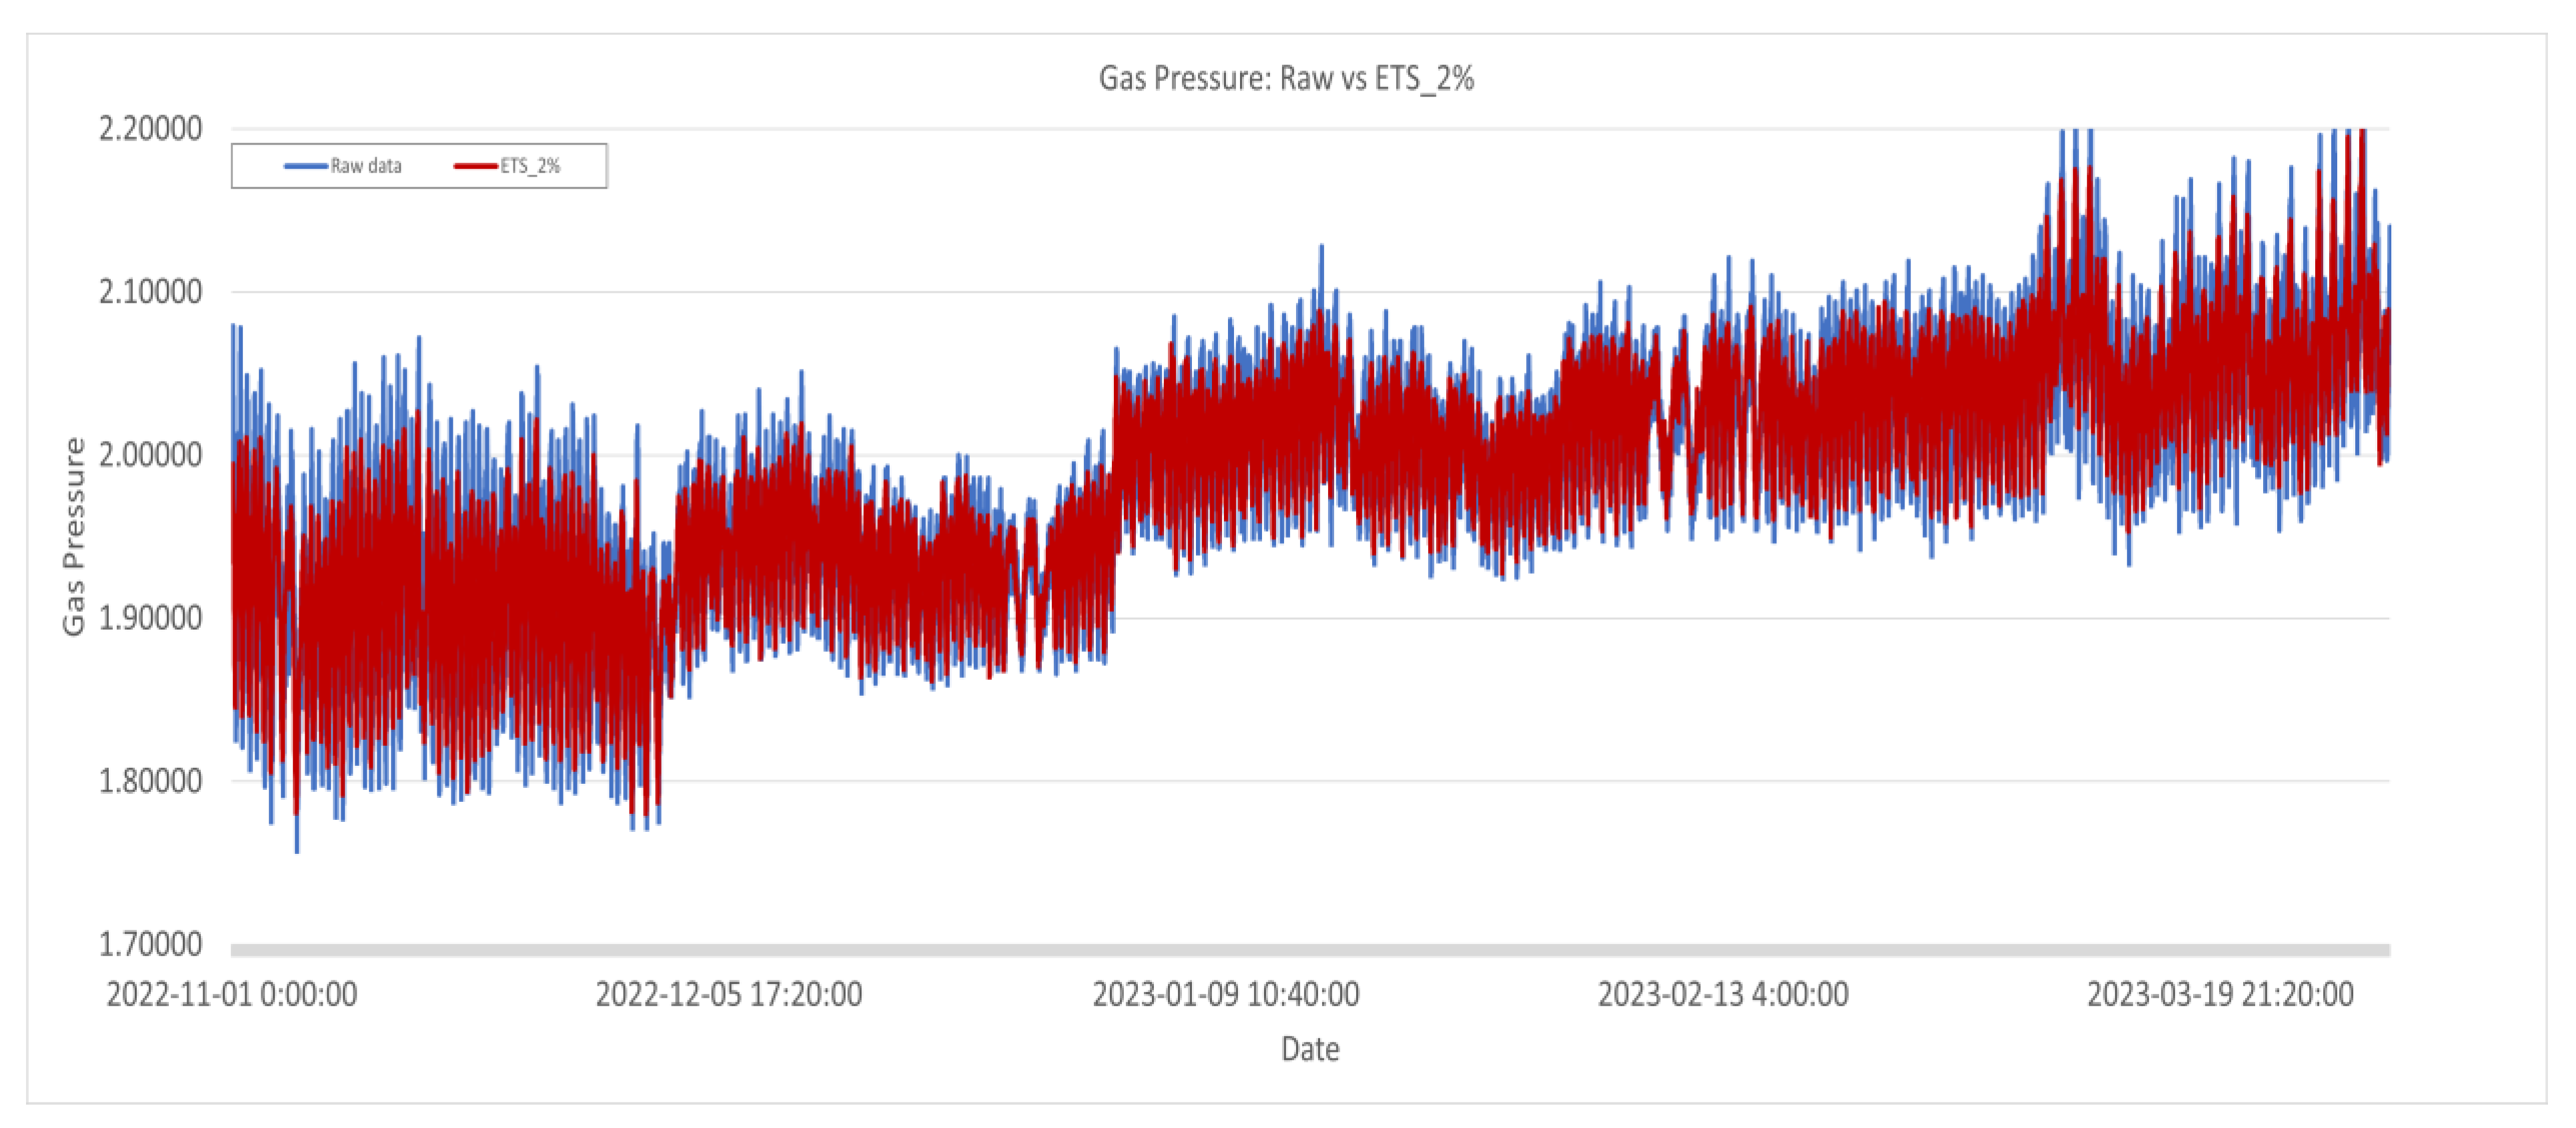
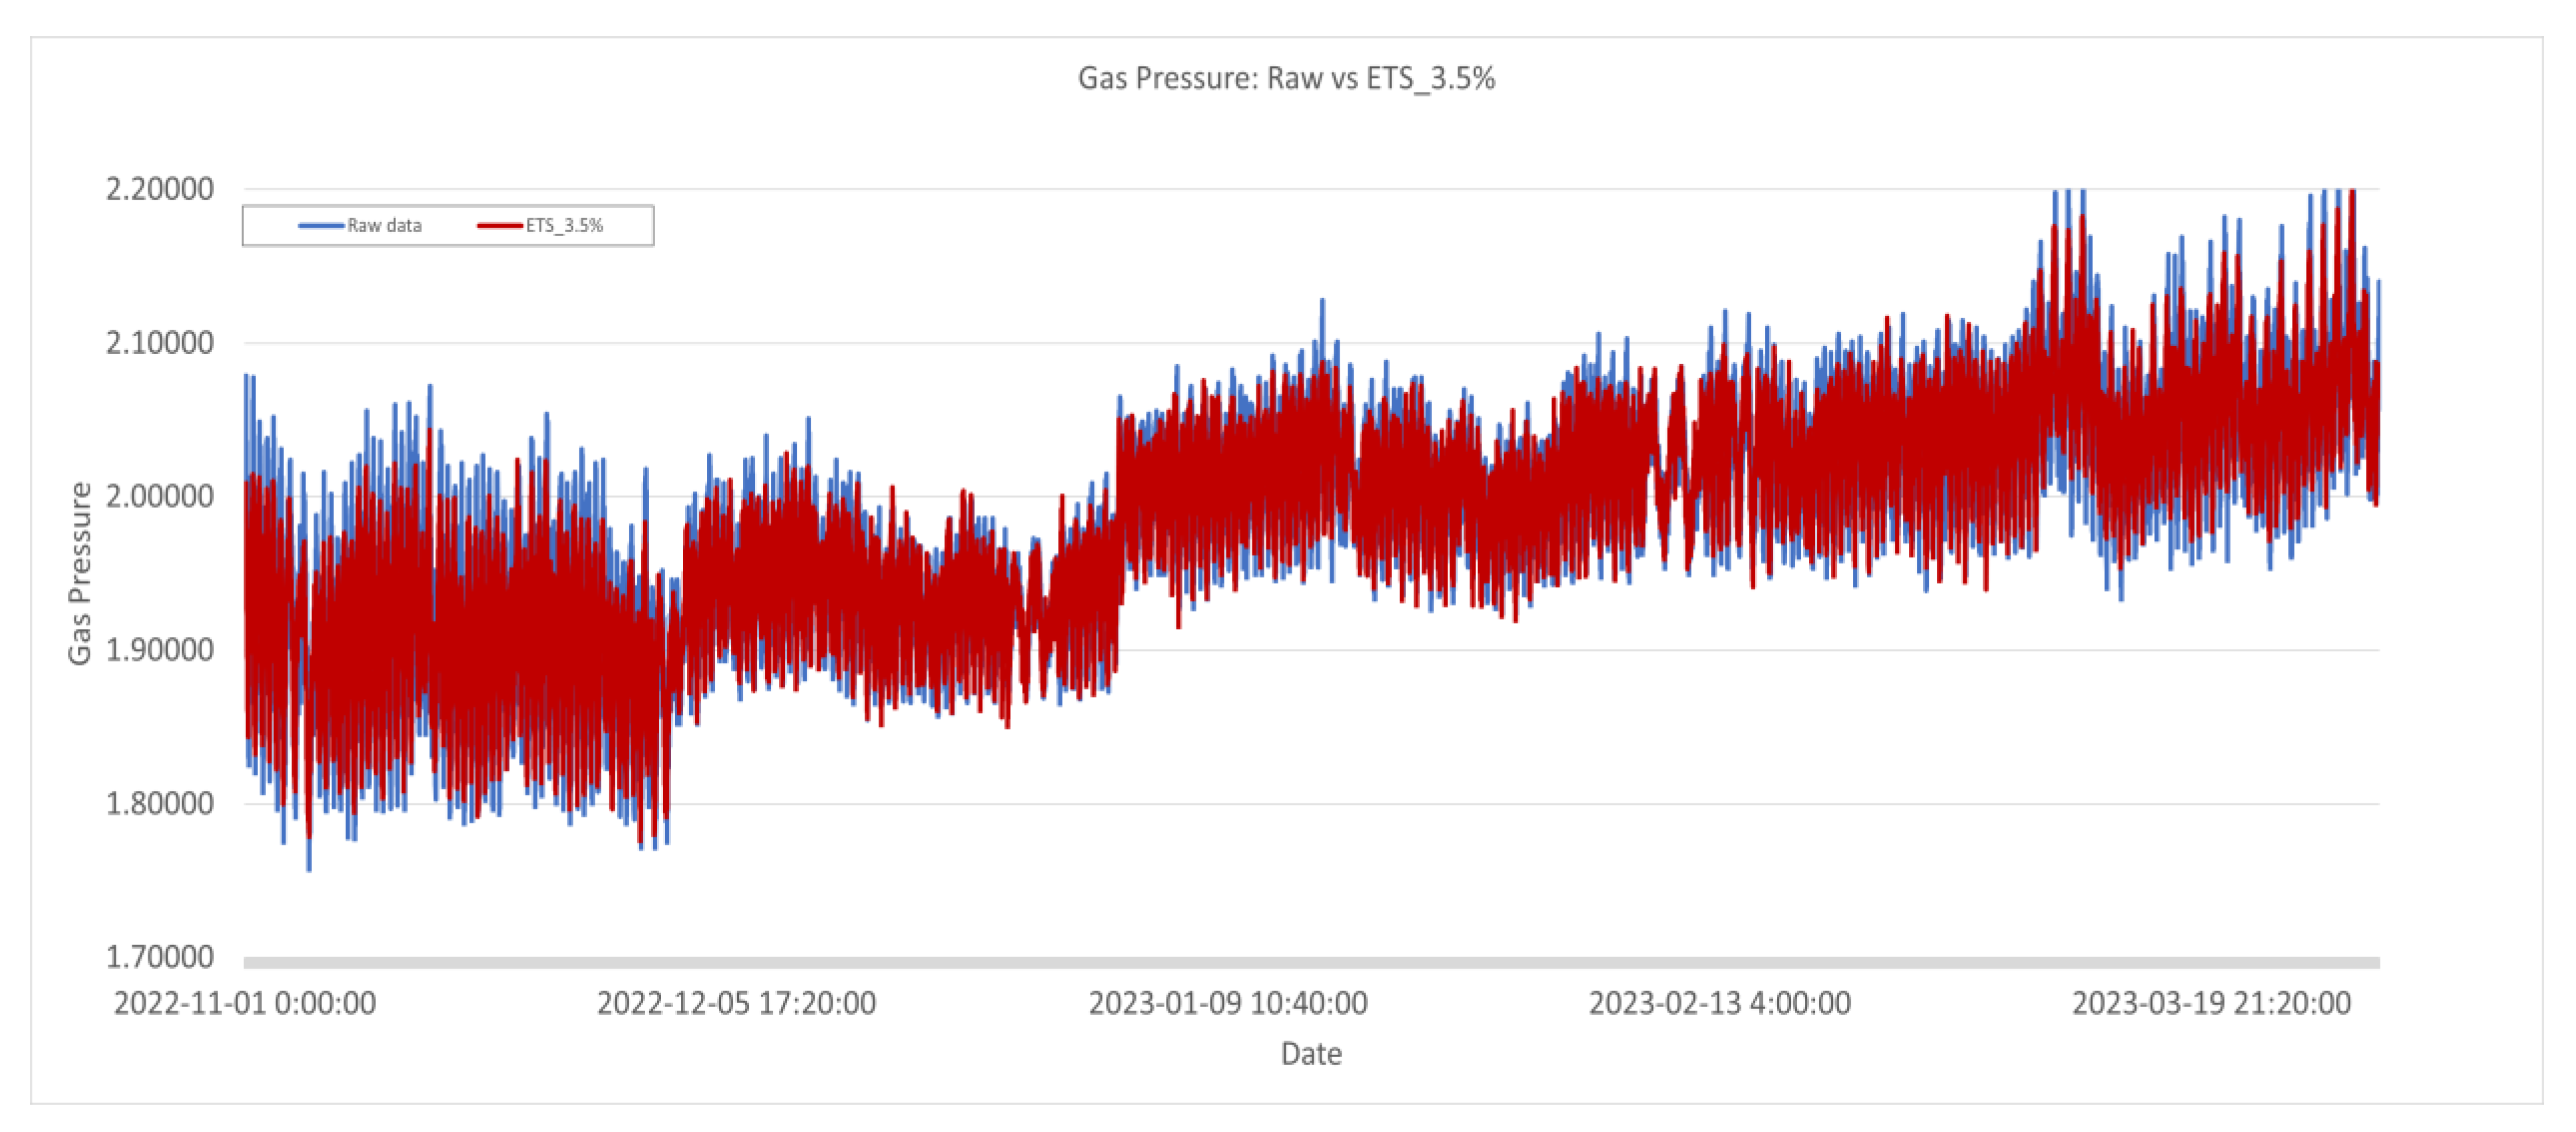
3.3.6. ETS
3.4. Performance Evaluation Method
3.4.1. RMSE
3.4.2. MAPE
3.4.3. R2
3.5. Synthetic Data through Simulation
4. Results
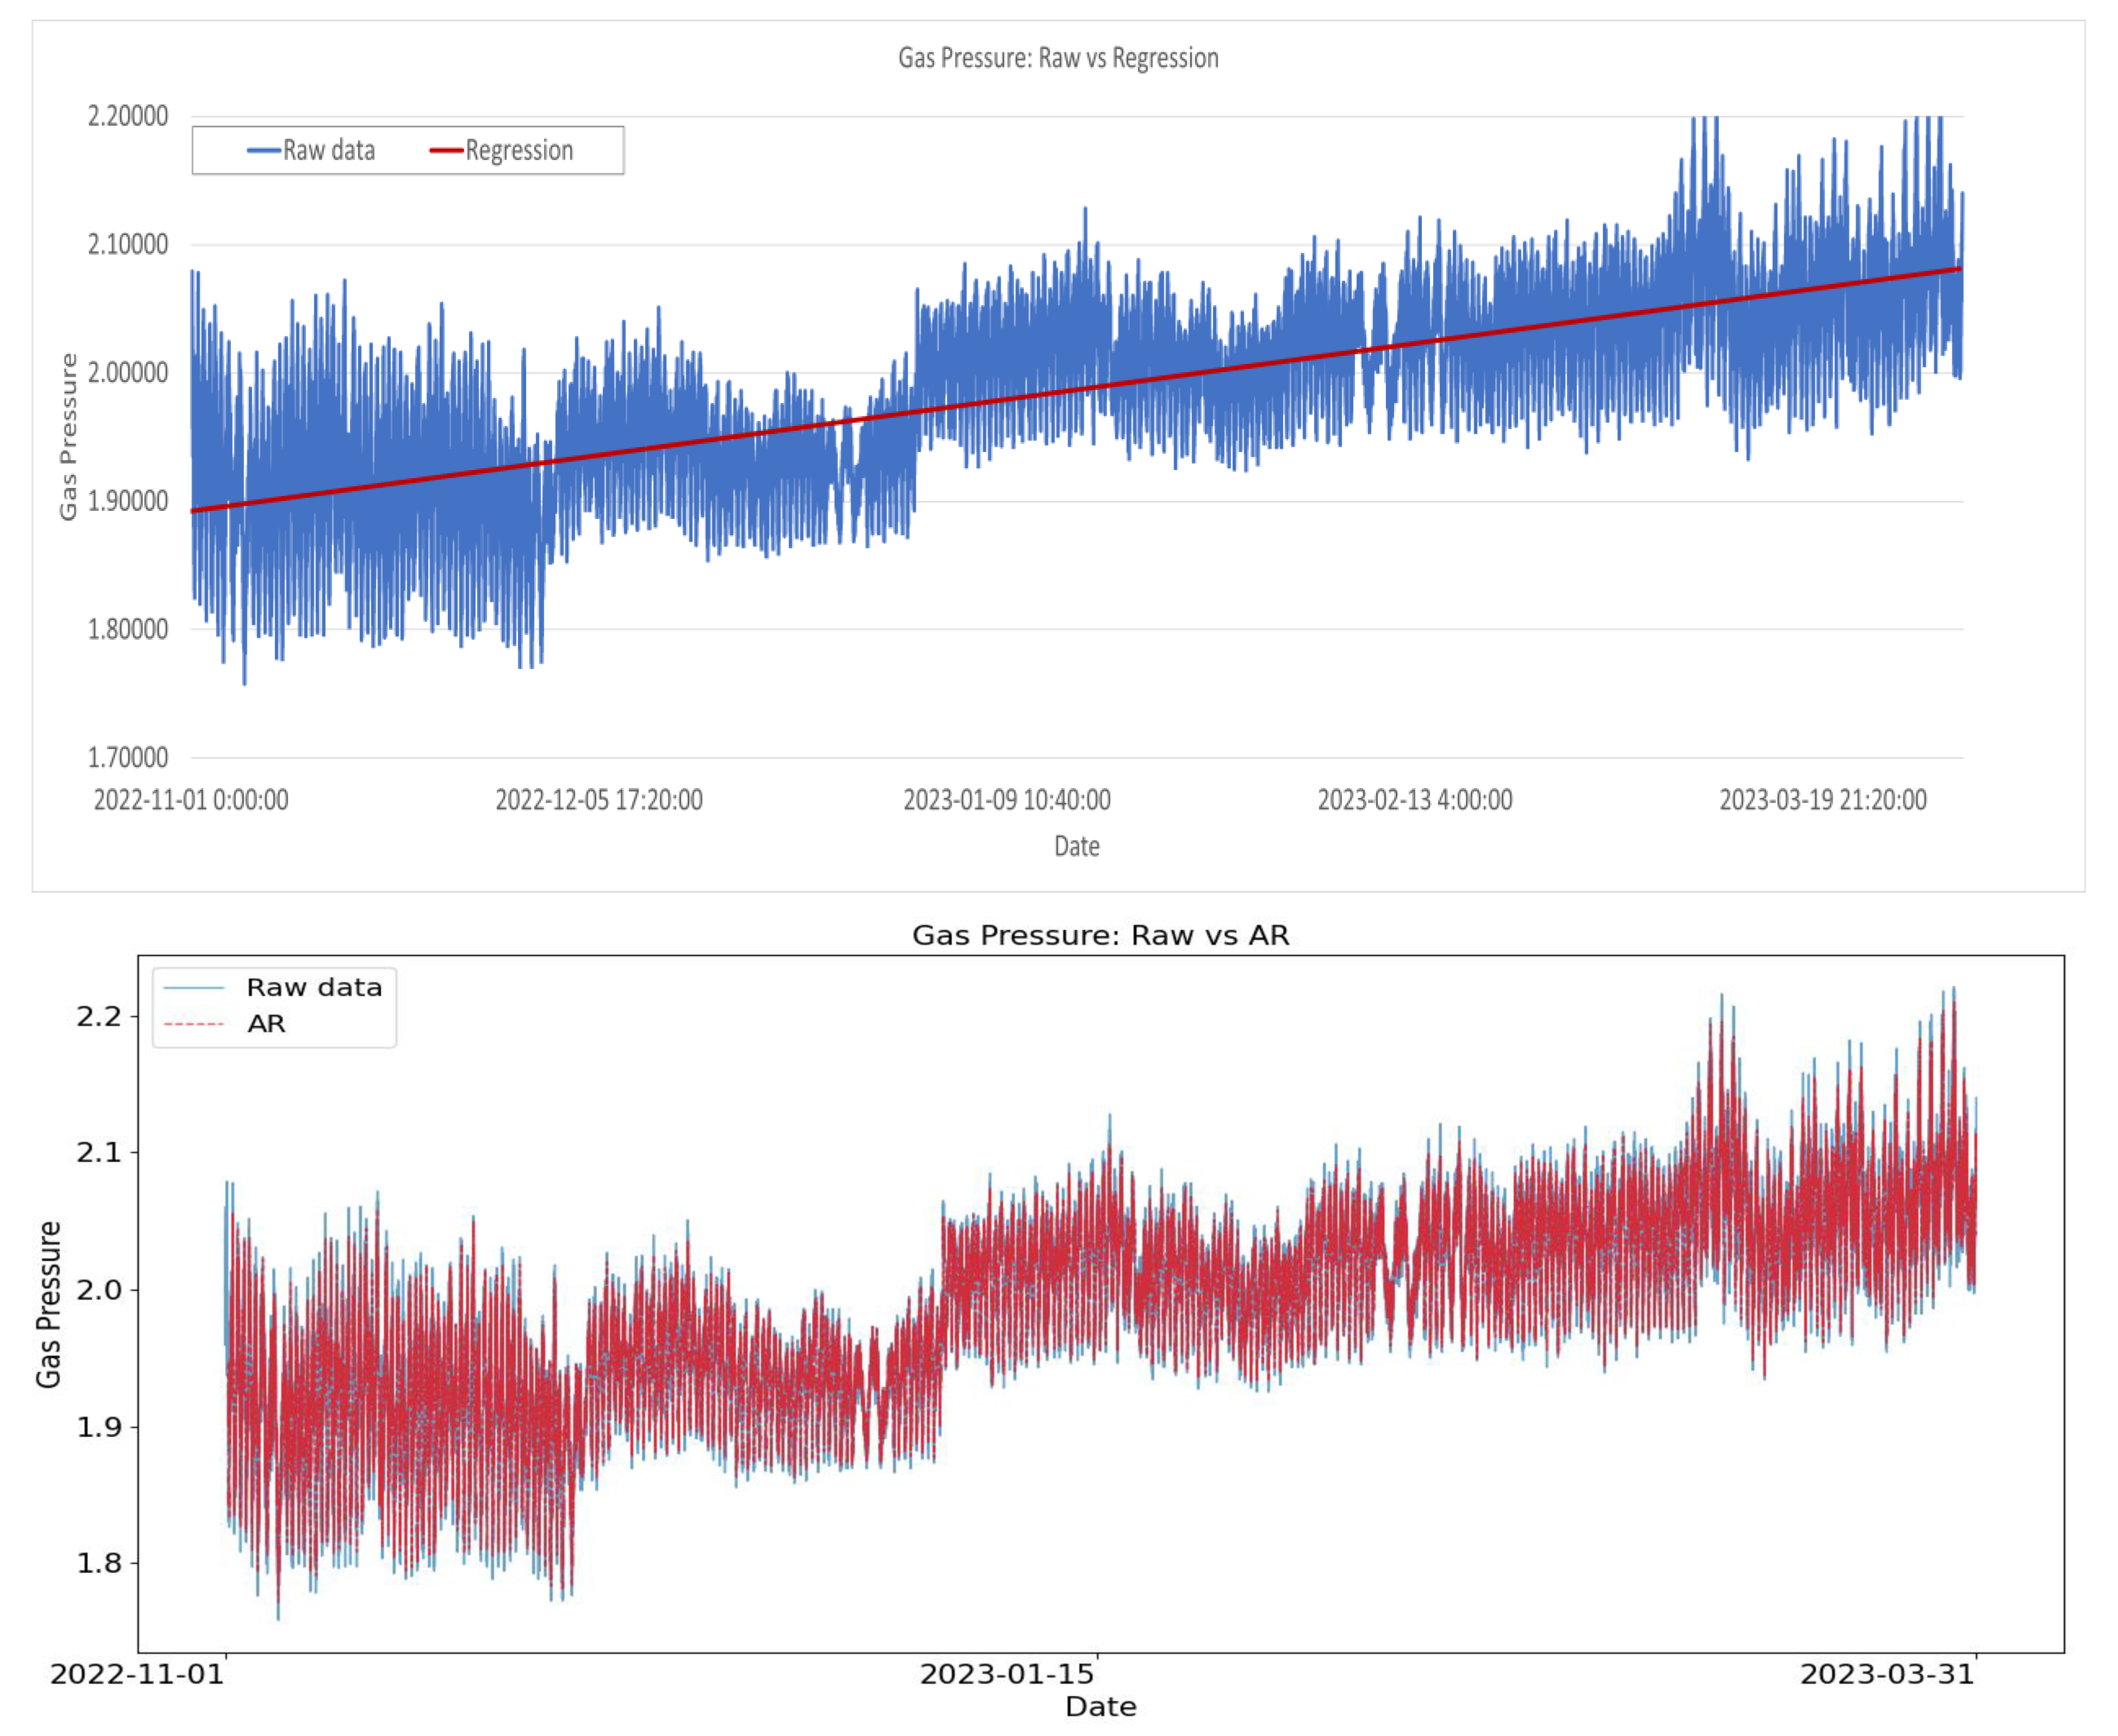
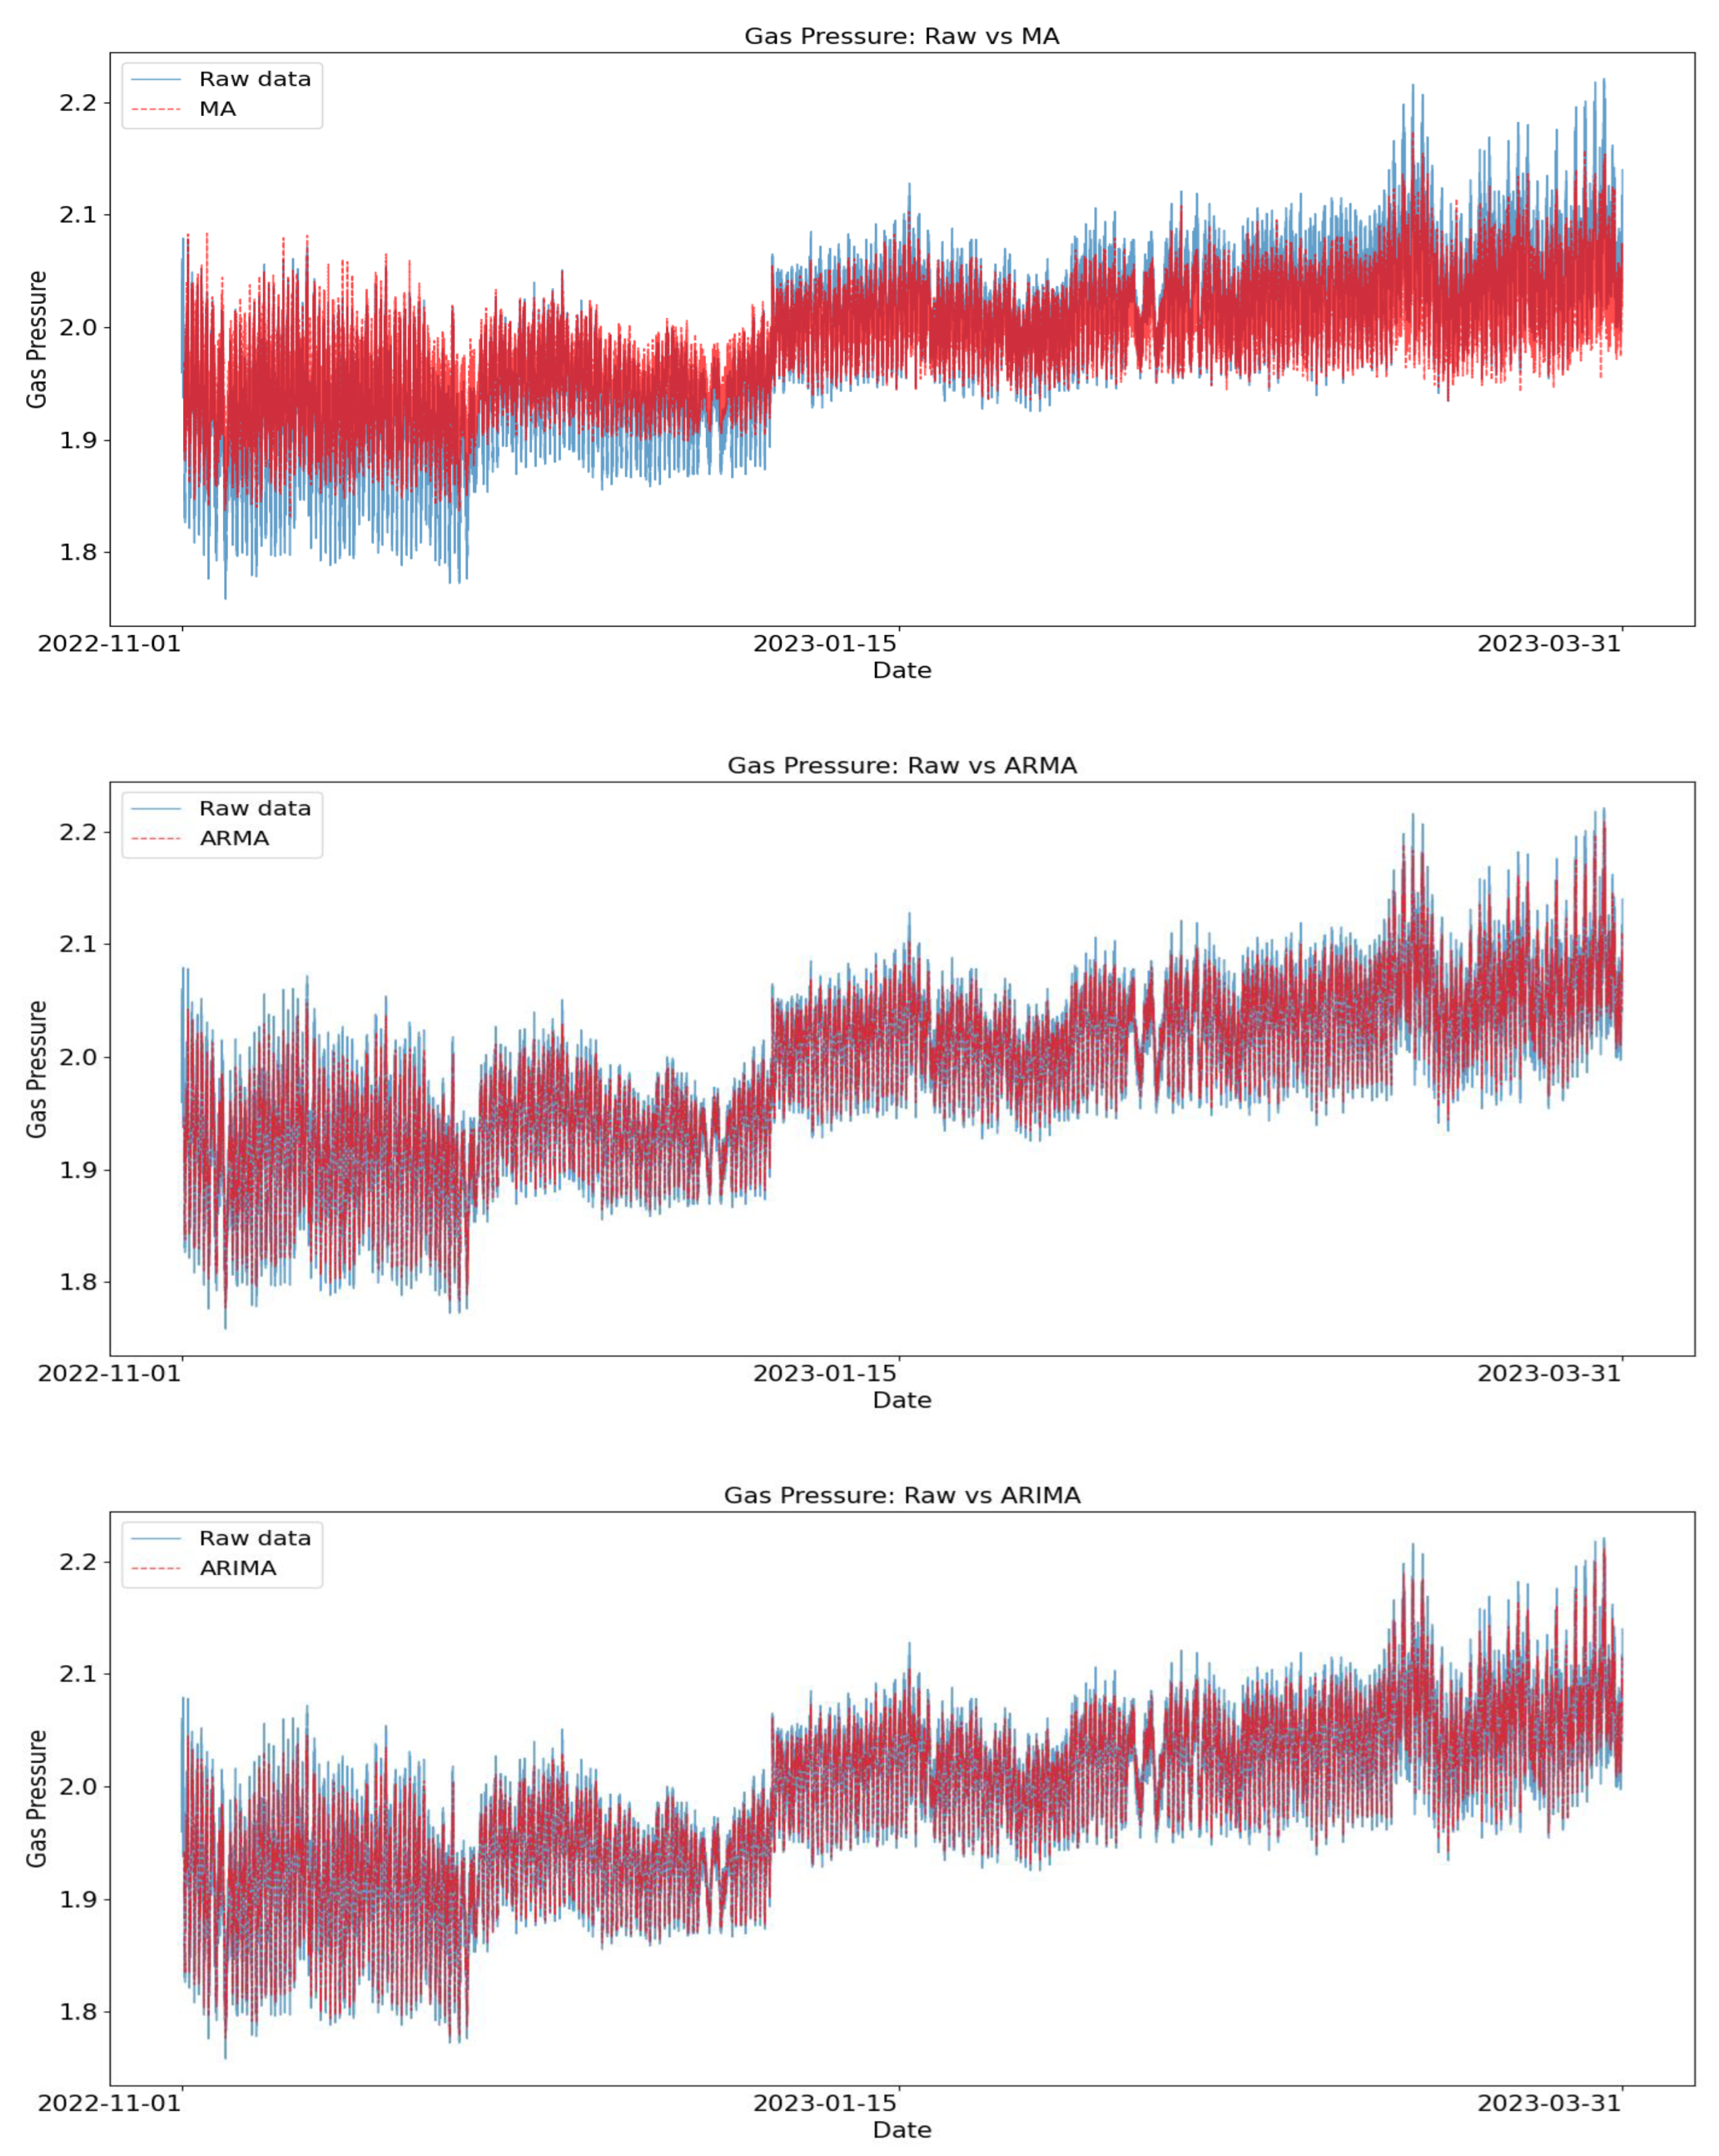
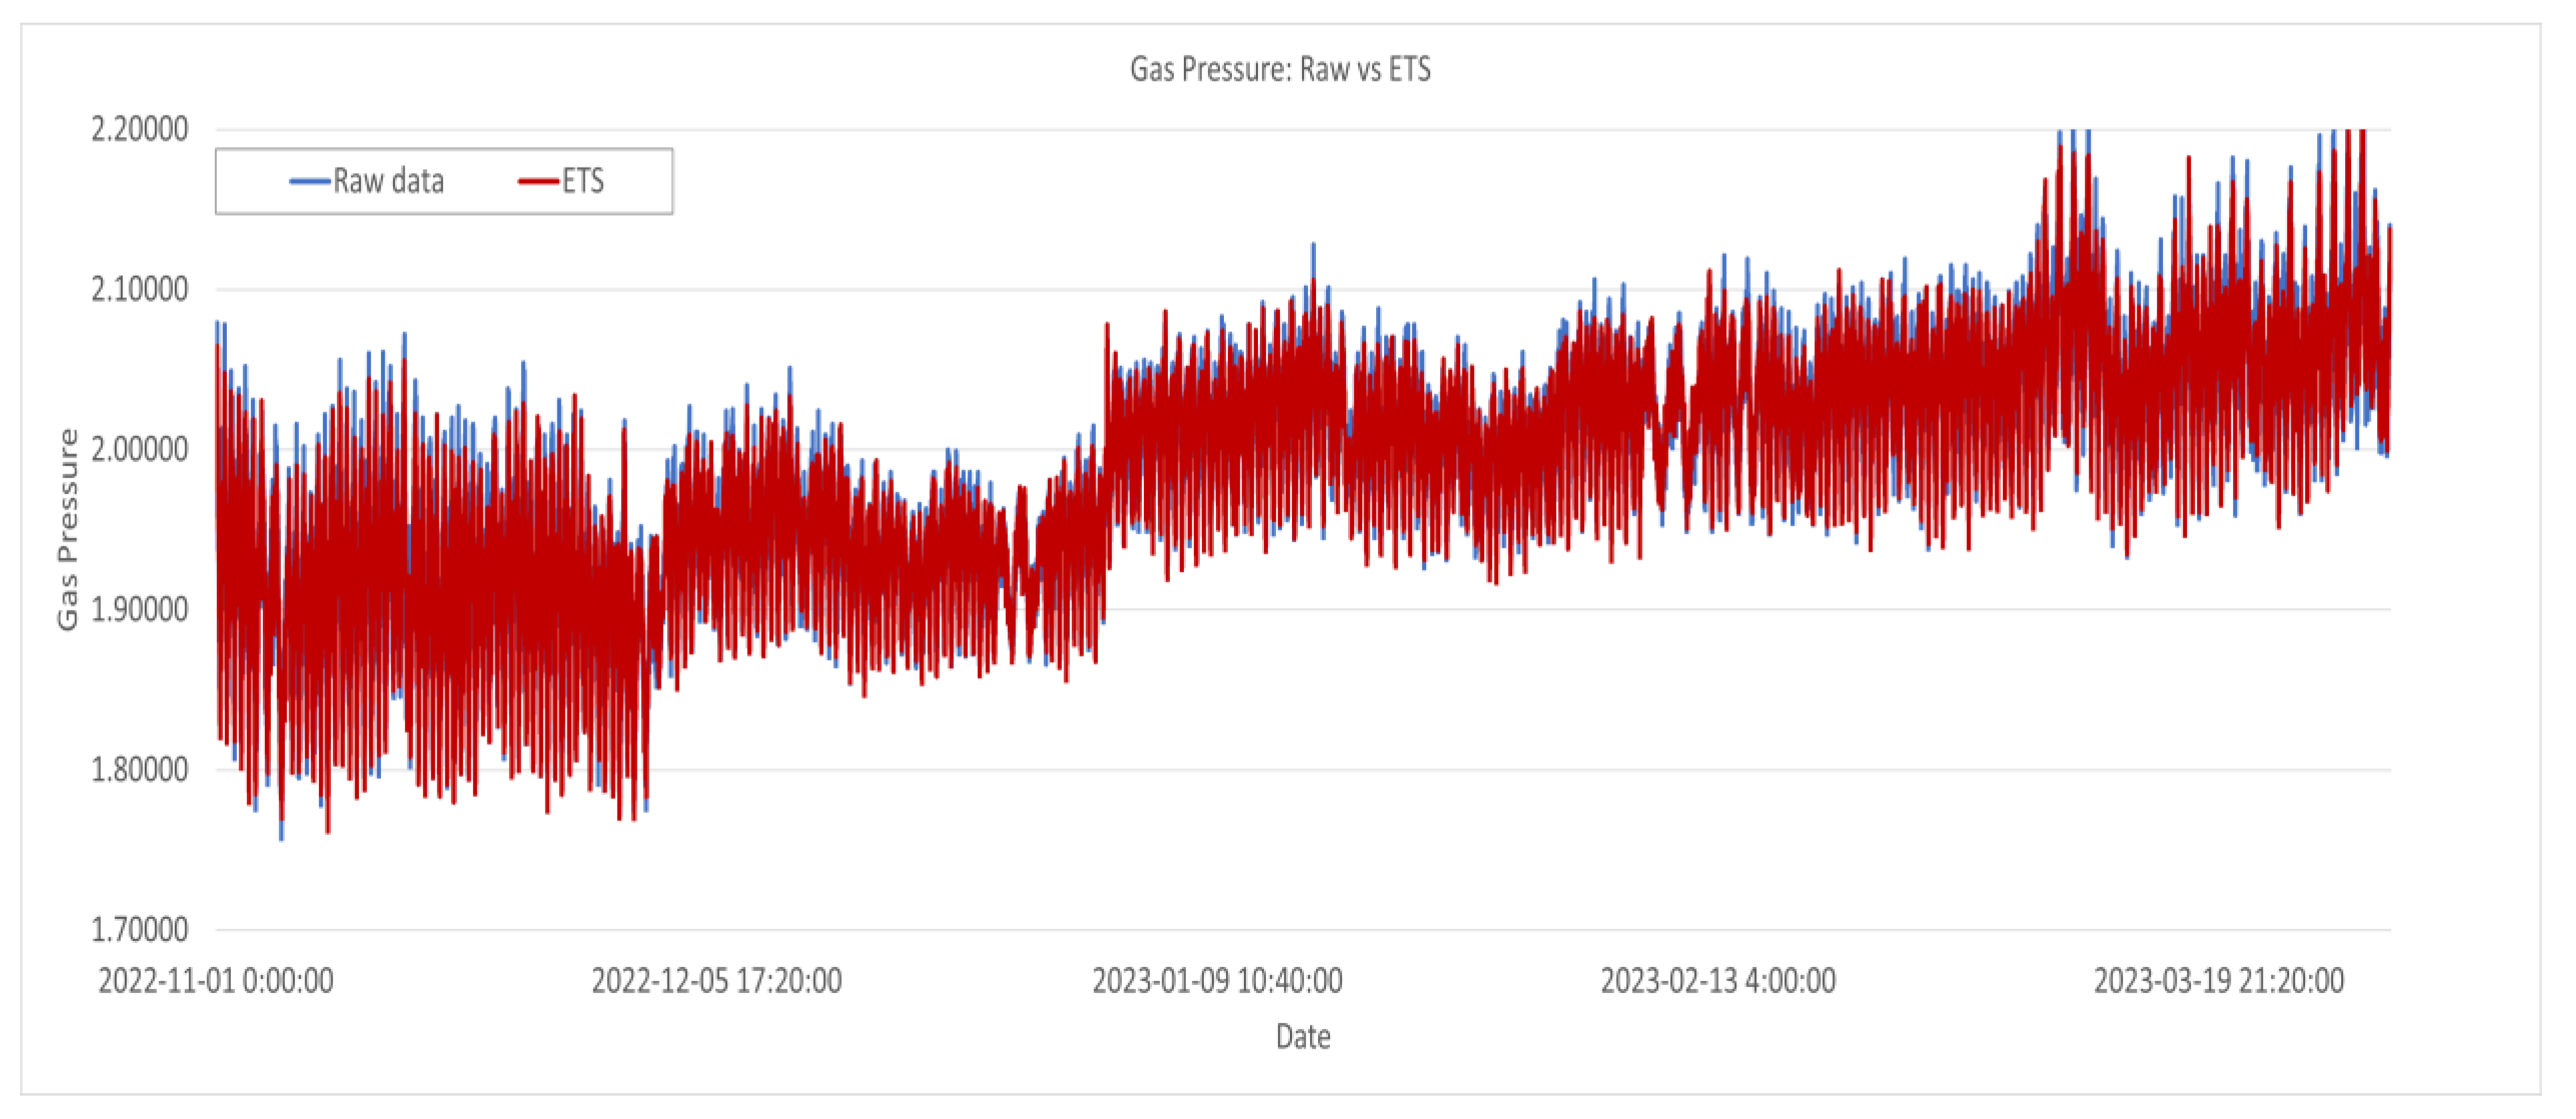
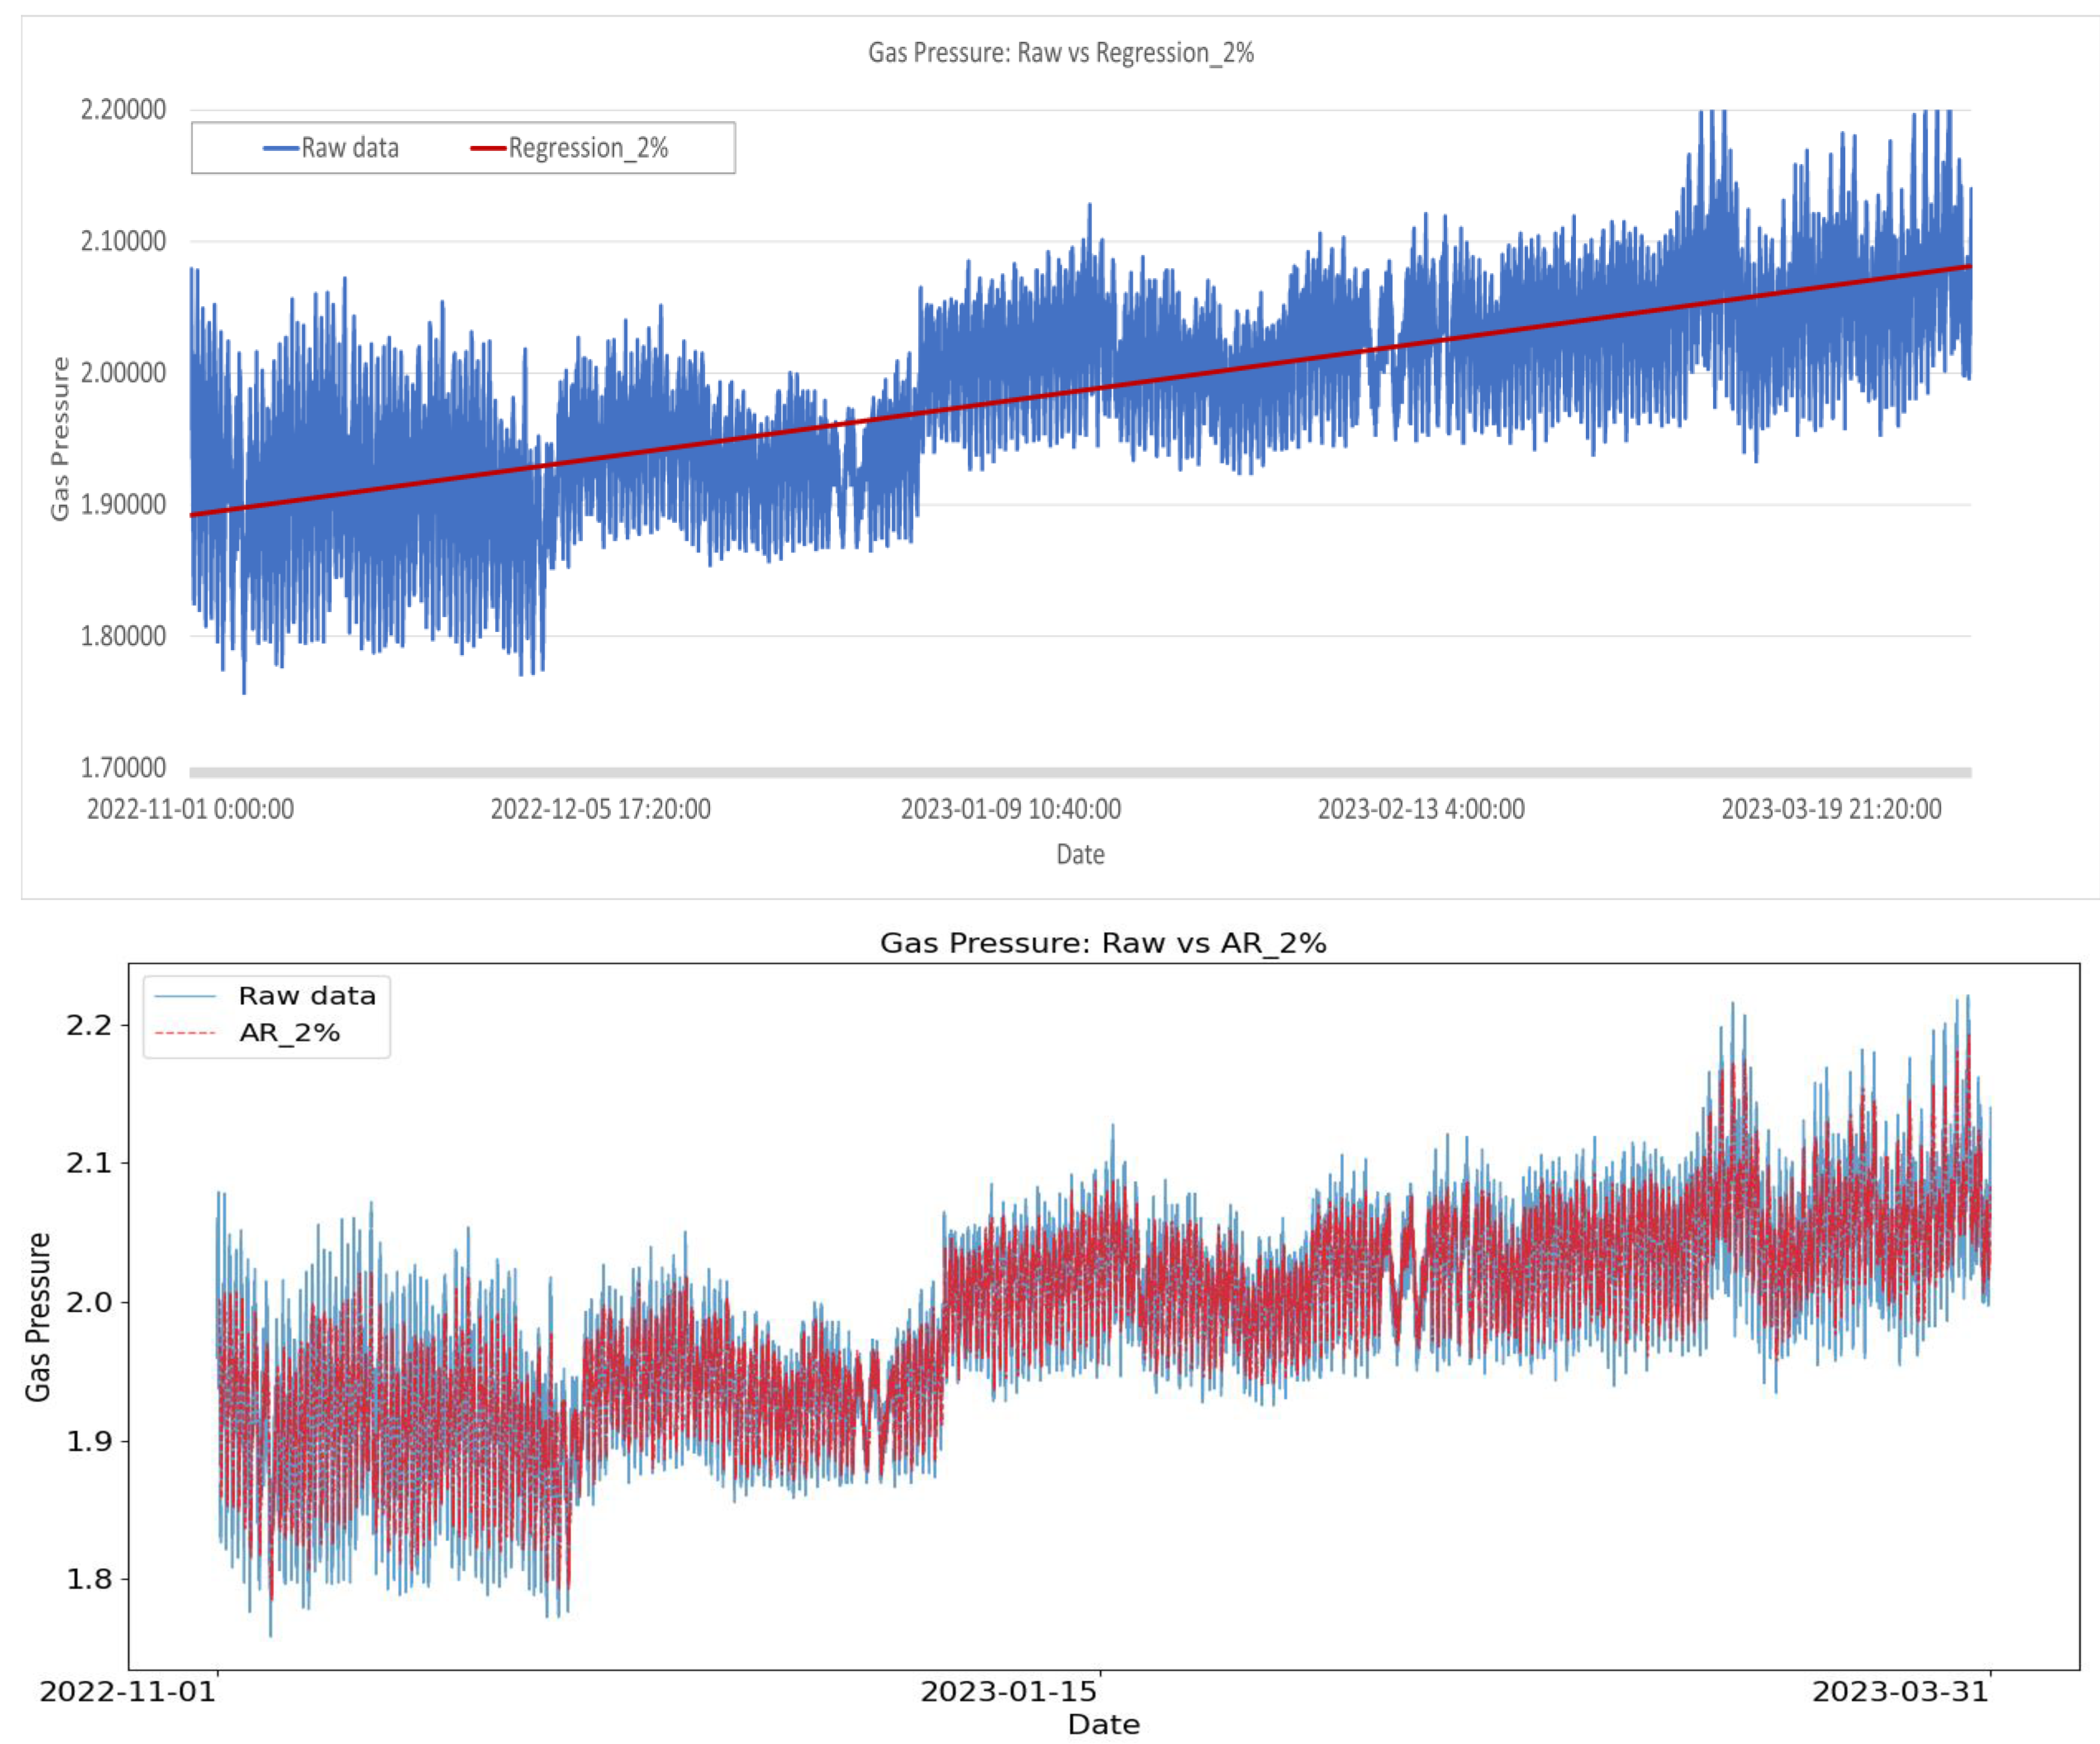
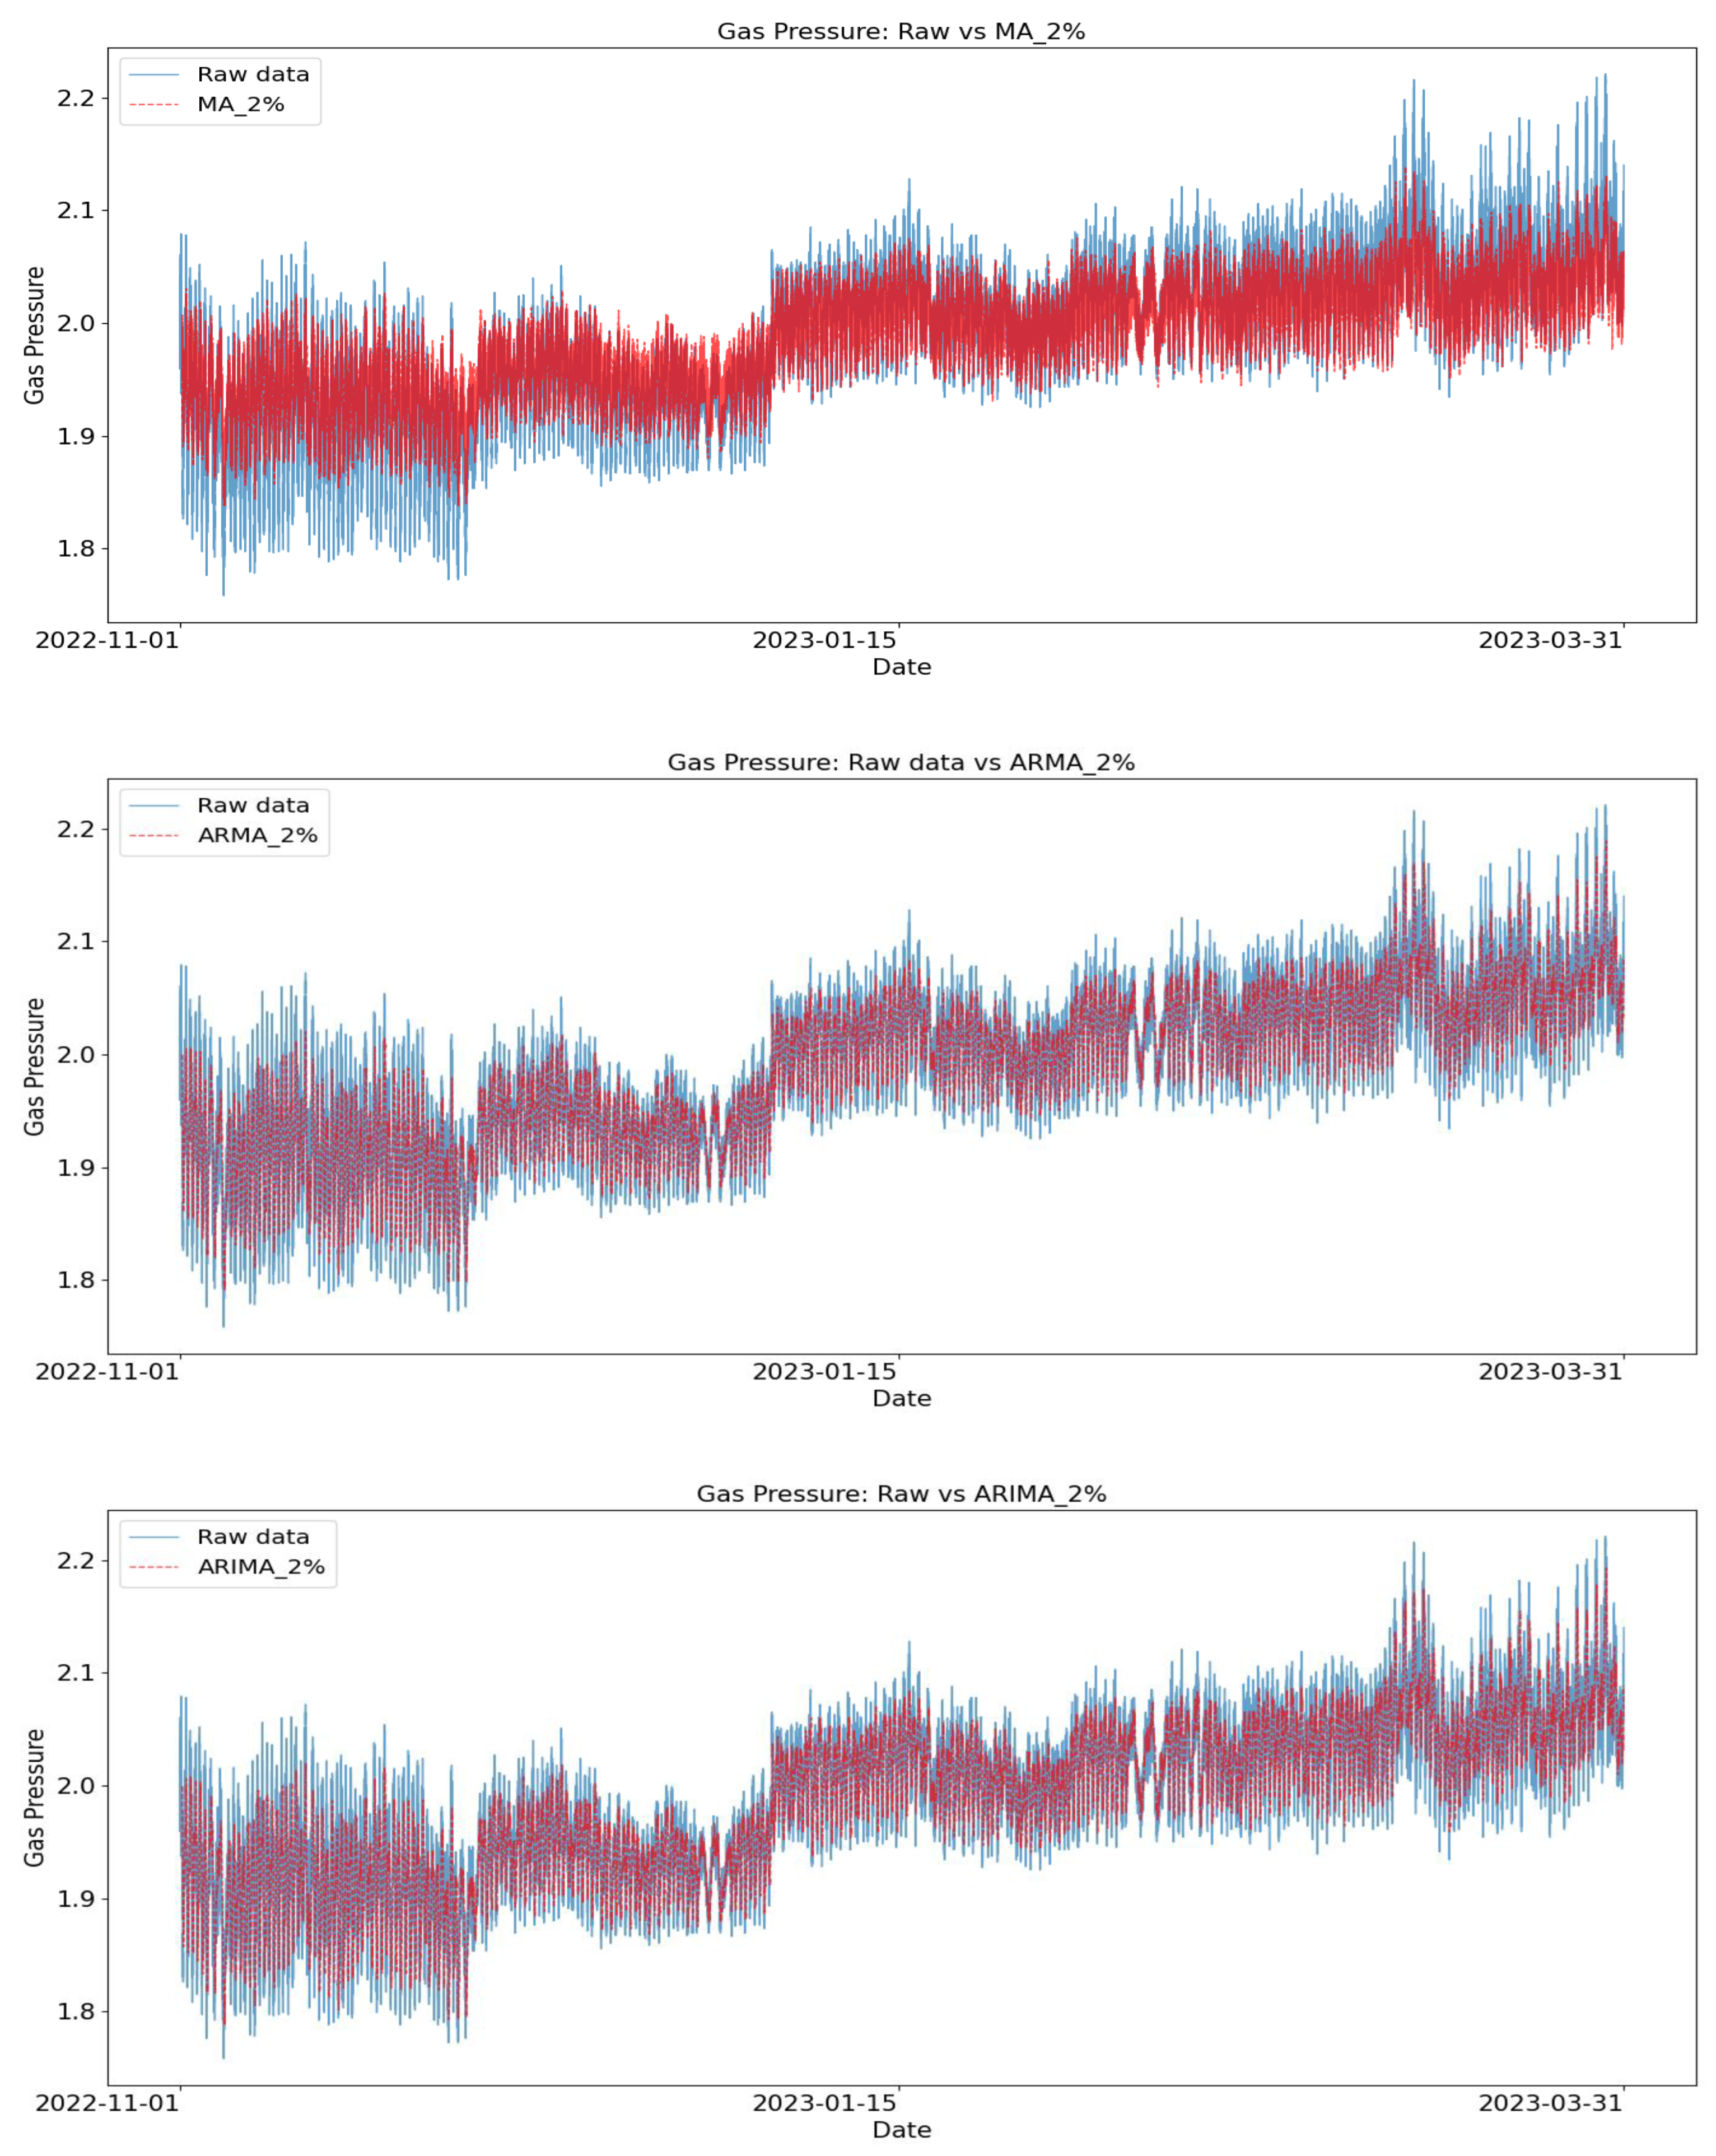
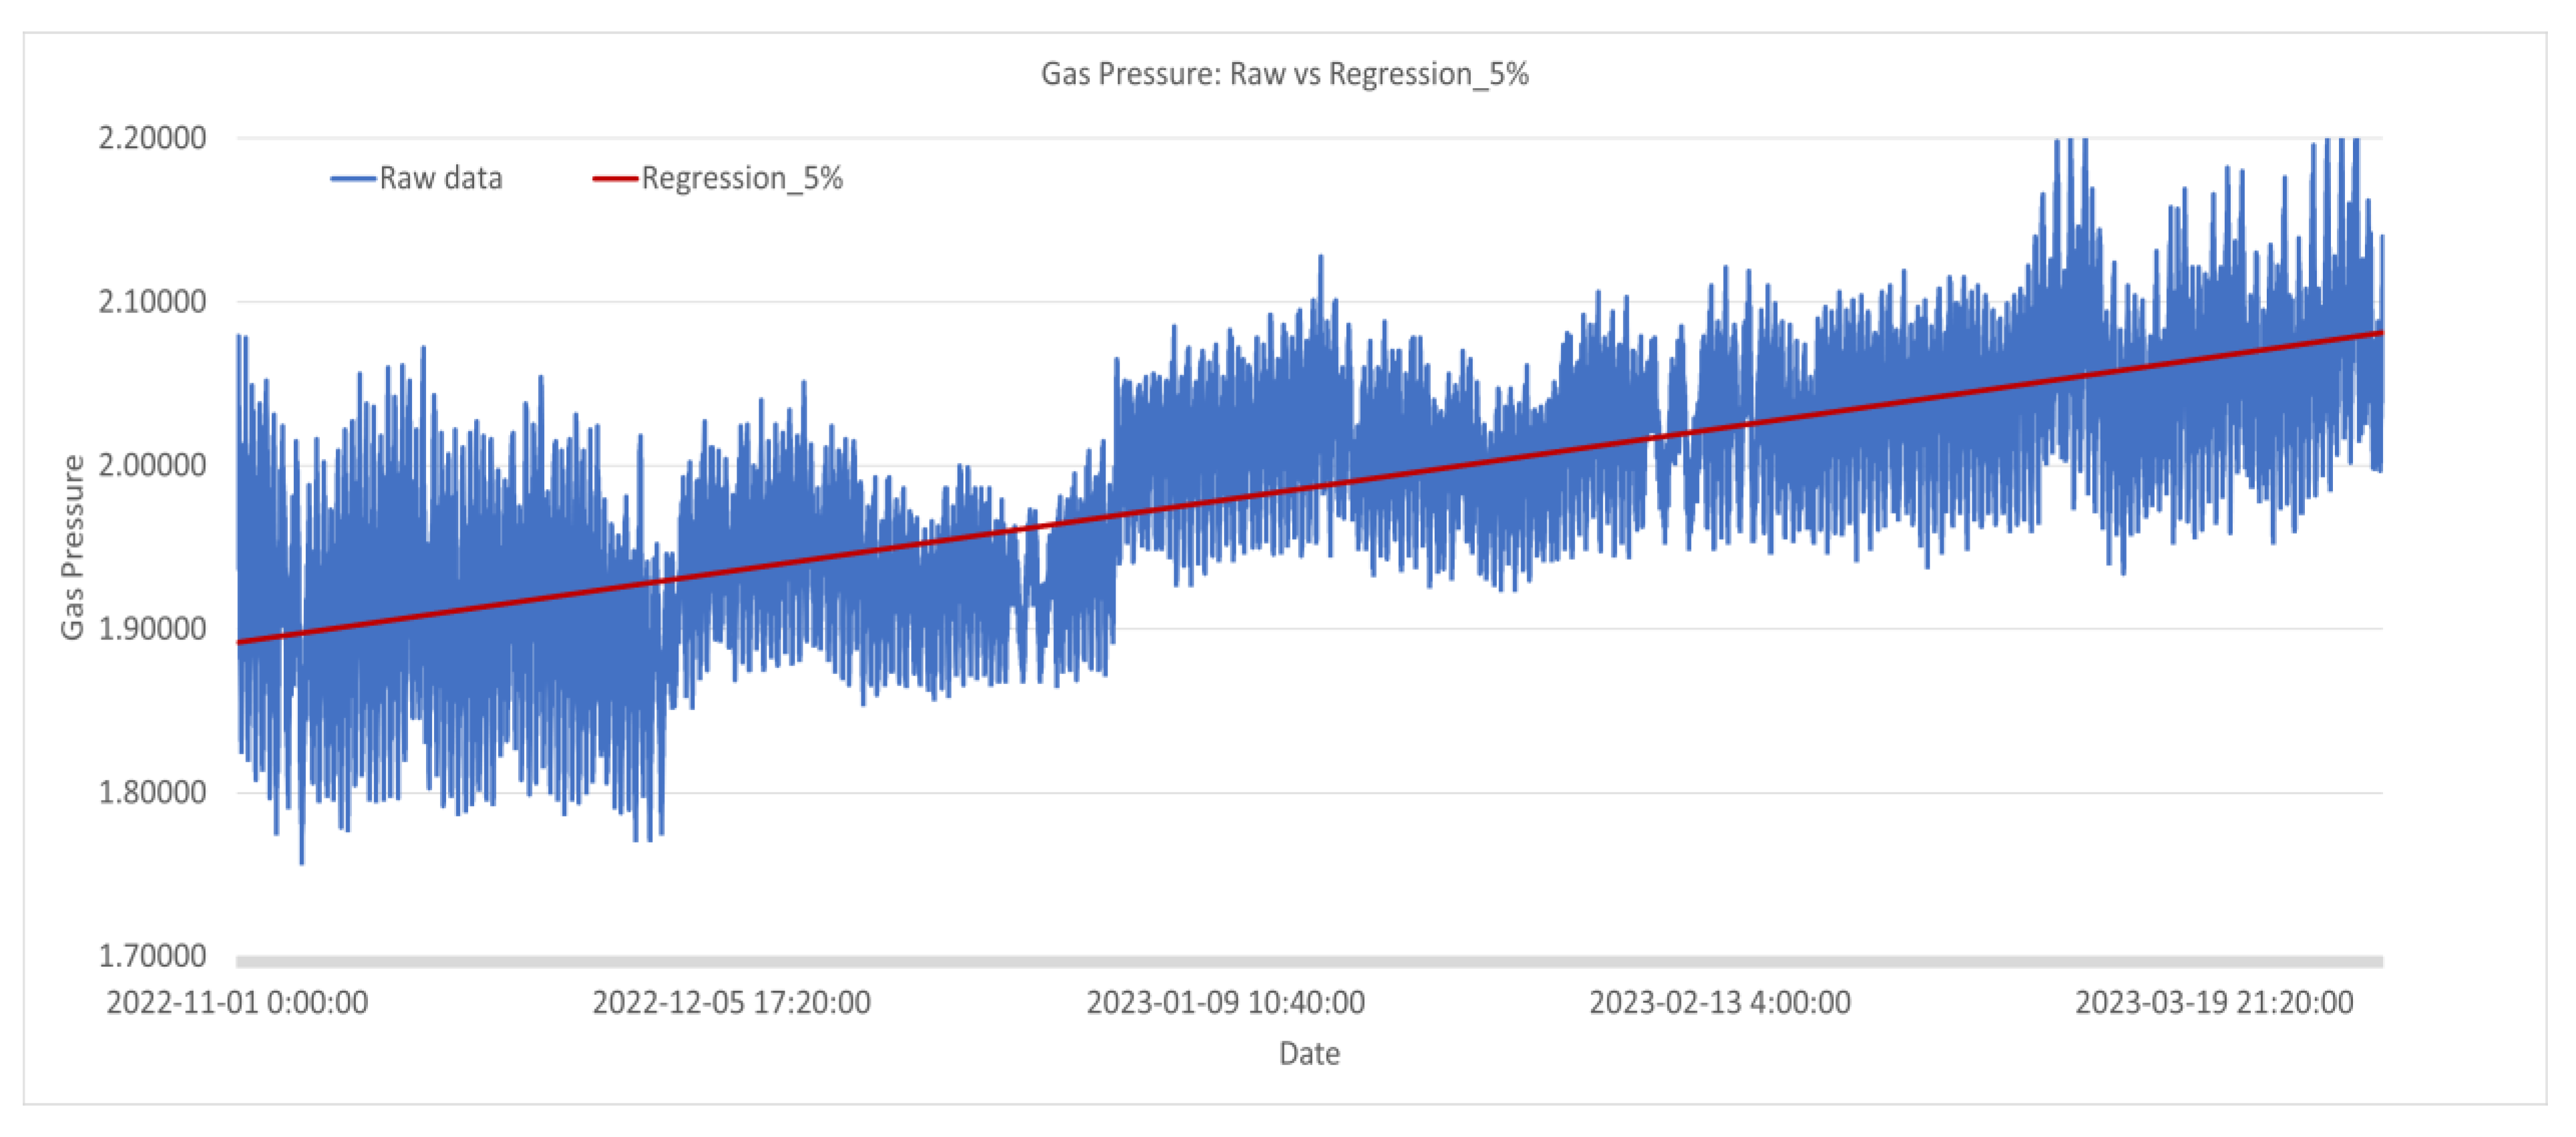
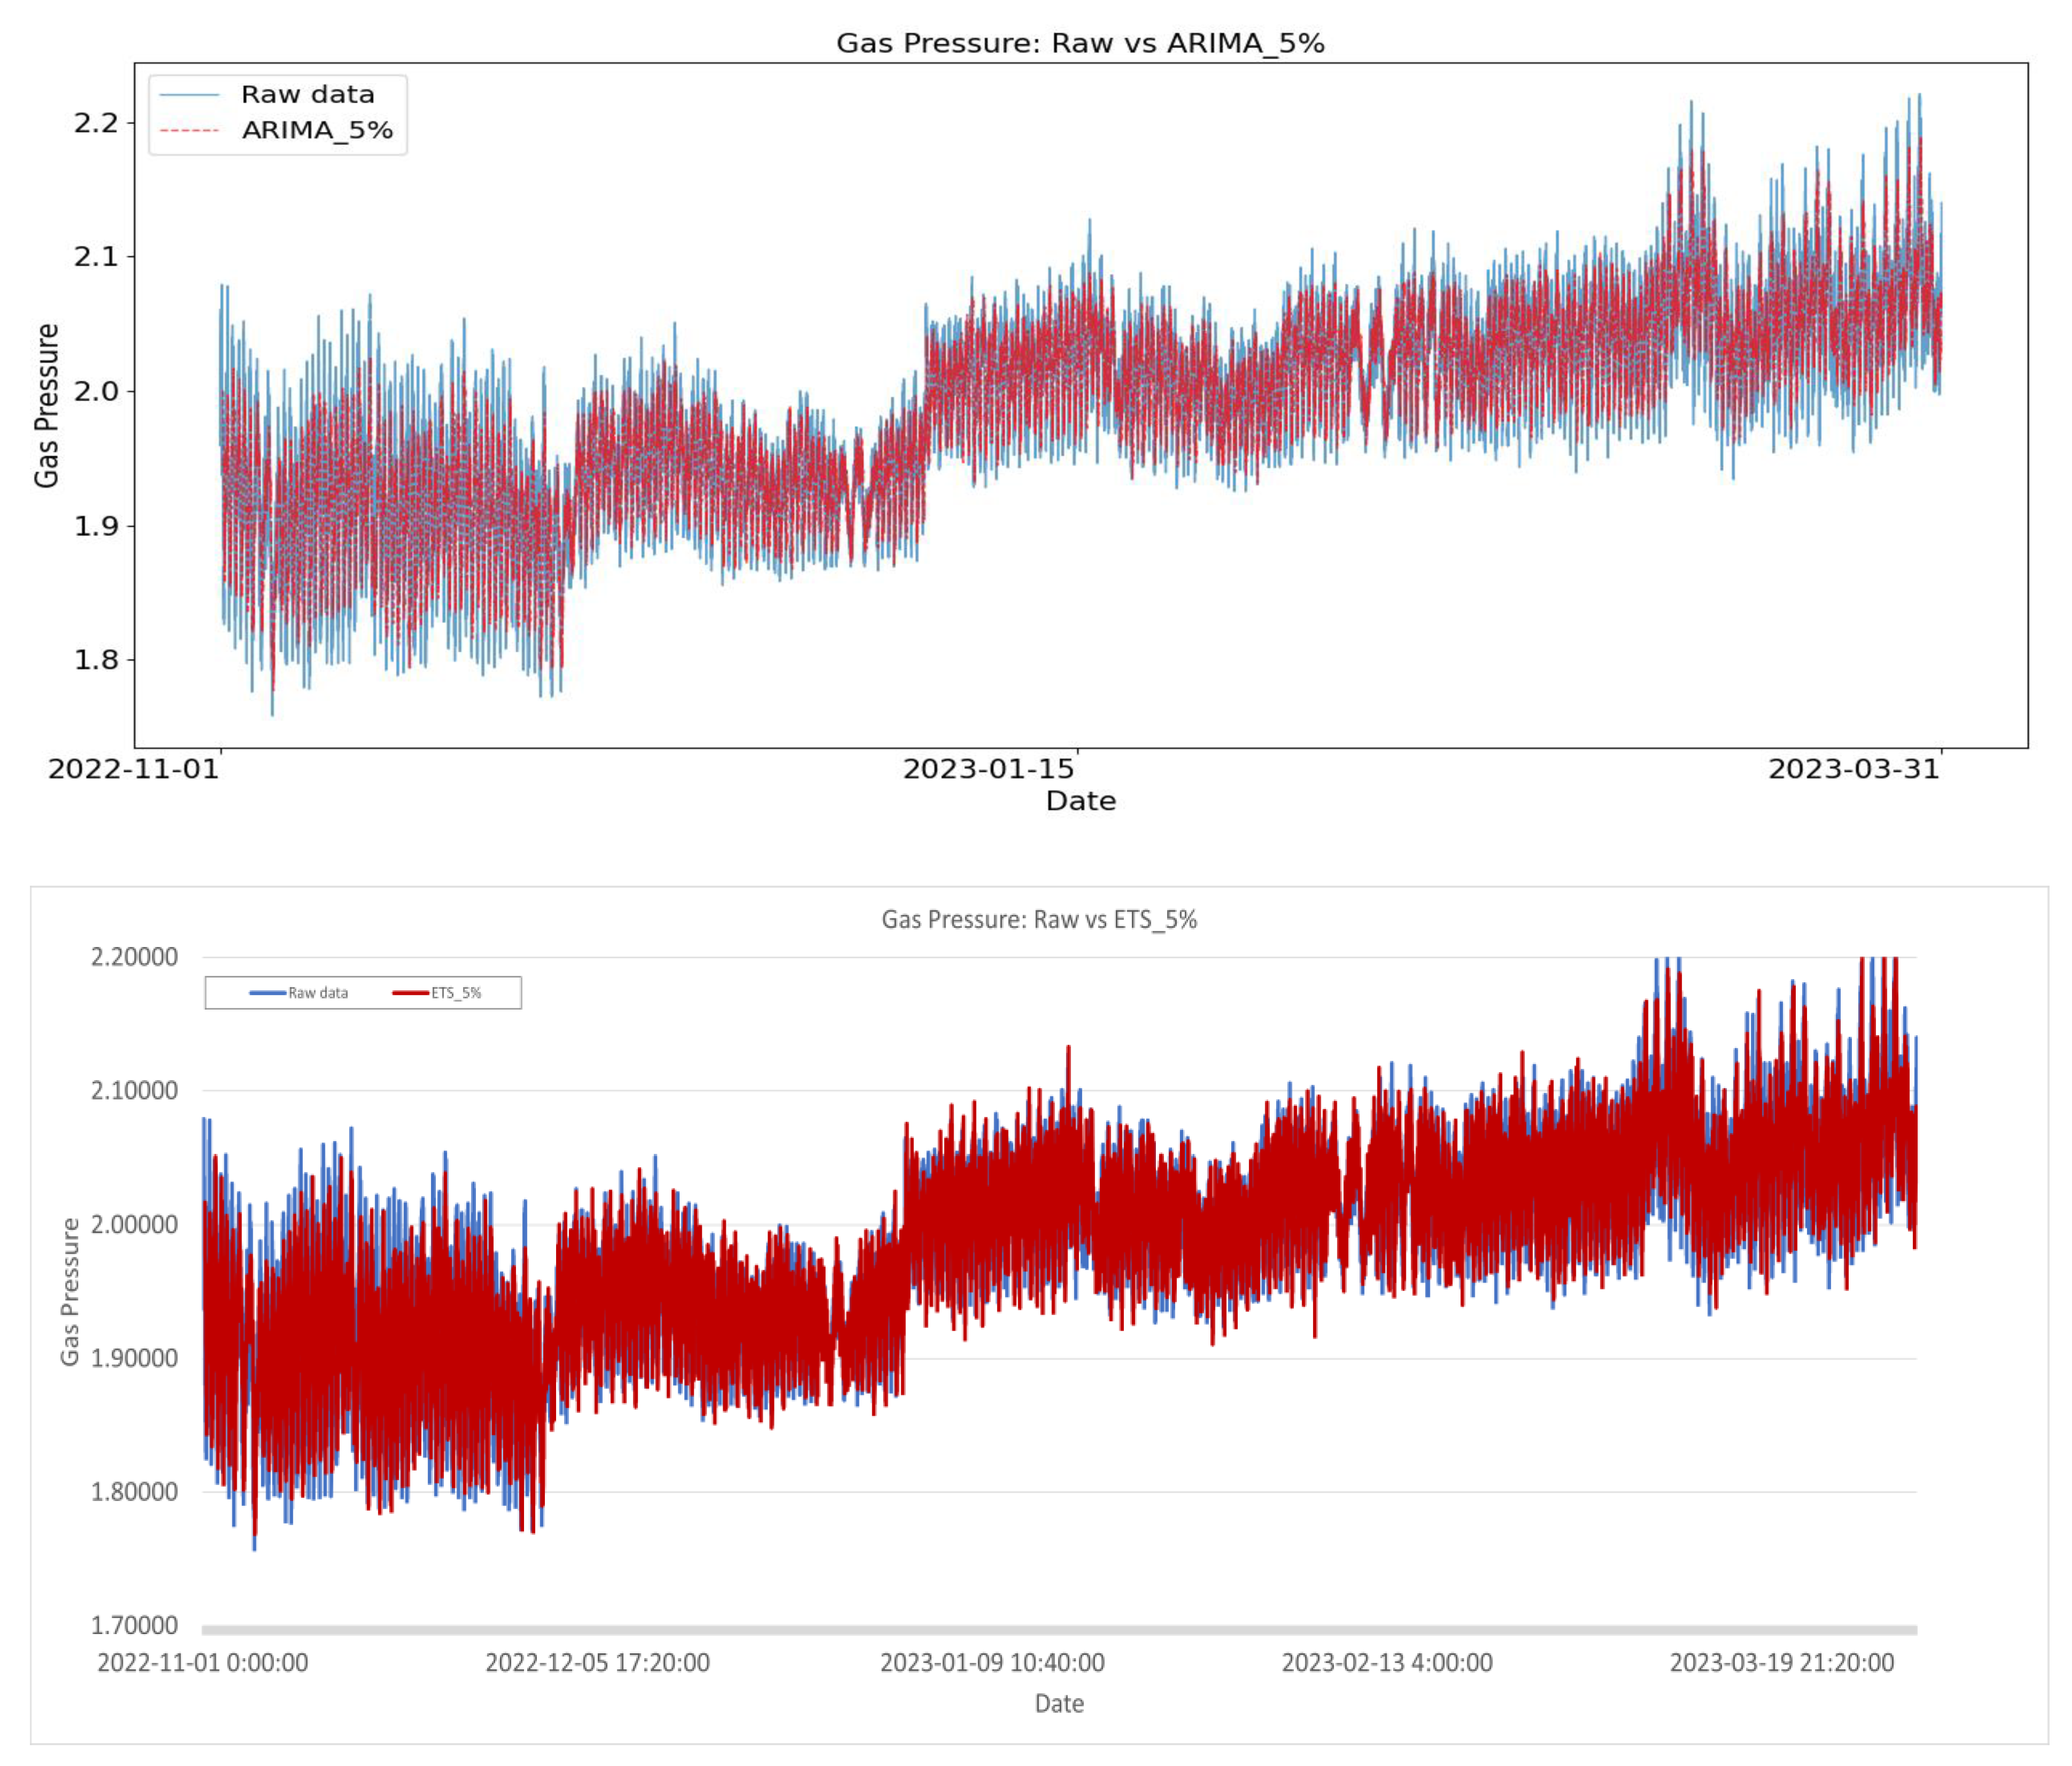
Prediction Results
5. Discussion and Conclusions
6. Limitations and Future Works
Author Contributions
Funding
Institutional Review Board Statement
Informed Consent Statement
Data Availability Statement
Conflicts of Interest
References
- Gillessen, B.; Heinrichs, H.; Hake, J.-F.; Allelein, H.-J. Natural gas as a bridge to sustainability: Infrastructure expansion regarding energy security and system transition. Appl. Energy 2019, 251, 113377. [Google Scholar] [CrossRef]
- Ajayi, T.A. Natural gas rents and institutions as co-growth drivers: Evidence from Gas Exporting Countries Forum with a panel 2SLS approach. Int. J. Energy Sect. Manag. 2024, 18, 474–499. [Google Scholar] [CrossRef]
- Safari, A.; Das, N.; Langhelle, O.; Roy, J.; Assadi, M. Natural gas: A transition fuel for sustainable energy system transformation? Energy Sci. Eng. 2019, 7, 1075–1094. [Google Scholar] [CrossRef]
- Kotagodahetti, R.; Hewage, K.; Perera, P.; Sadiq, R. Technology and policy options for decarbonizing the natural gas industry: A critical review. Gas Sci. Eng. 2023, 114, 204981. [Google Scholar] [CrossRef]
- Li, J.; She, Y.; Gao, Y.; Li, M.; Yang, G.; Shi, Y. Natural gas industry in China: Development situation and prospect. Nat. Gas Ind. B 2020, 7, 604–613. [Google Scholar] [CrossRef]
- El Golli, R.; Bézian, J.-J.; Delenne, B.; Menu, F. Modelling of a pressure regulator. Int. J. Press. Vessel. Pip. 2007, 84, 234–243. [Google Scholar]
- Jia, J.; Wang, B.; Ma, R.; Deng, Z.; Fu, M. State monitoring of gas regulator station based on feature selection of improved grey relational analysis. IEEE Internet Things J. 2022, 9, 22765–22773. [Google Scholar] [CrossRef]
- Chao, A.C. Anomaly Detection for Natural Gas Regulator Stations; Massachusetts Institute of Technology: Cambridge, MA, USA, 2016. [Google Scholar]
- Bazyar, A.; Zarrinpoor, N.; Safavian, A. Optimal design of a sustainable natural gas supply chain network under uncertainty. Chem. Eng. Res. Des. 2021, 176, 60–88. [Google Scholar] [CrossRef]
- Chen, J.; Xiao, Z.; Bai, J.; Guo, H. Predicting volatility in natural gas under a cloud of uncertainties. Resour. Policy 2023, 82, 103436. [Google Scholar] [CrossRef] [PubMed]
- Hailemariam, A.; Smyth, R. What drives volatility in natural gas prices? Energy Econ. 2019, 80, 731–742. [Google Scholar] [CrossRef]
- Zhao, J.; Jiang, Q.; Dong, X.; Dong, K. Would environmental regulation improve the greenhouse gas benefits of natural gas use? A Chinese case study. Energy Econ. 2020, 87, 104712. [Google Scholar] [CrossRef]
- Nafey, A.S.; Zoghaib, N.; Omar, M.K. Optimization of the Egyptian Natural Gas Transmission Networks. Int. J. Eng. Res. Technol. 2020, 13, 2347–2358. [Google Scholar] [CrossRef]
- Zhang, H.; Liang, Y.; Liao, Q.; Chen, J.; Zhang, W.; Long, Y.; Qian, C. Optimal design and operation for supply chain system of multi-state natural gas under uncertainties of demand and purchase price. Comput. Ind. Eng. 2019, 131, 115–130. [Google Scholar] [CrossRef]
- Chung, W.H.; Park, G.; Gu, Y.H.; Kim, S.; Yoo, S.J. City Gas Pipeline Pressure Prediction Model. J. Soc. E-Bus. Stud. 2019, 23. [Google Scholar] [CrossRef]
- Khotanzad, A.; Elragal, H.; Lu, T.-L. Combination of artificial neural-network forecasters for prediction of natural gas consumption. IEEE Trans. Neural Netw. 2000, 11, 464–473. [Google Scholar] [CrossRef]
- Šebalj, D.; Mesarić, J.; Dujak, D. Analysis of methods and techniques for prediction of natural gas consumption: A literature review. J. Inf. Organ. Sci. 2019, 43, 99–117. [Google Scholar] [CrossRef]
- Zhu, L.; Li, M.; Wu, Q.; Jiang, L. Short-term natural gas demand prediction based on support vector regression with false neighbours filtered. Energy 2015, 80, 428–436. [Google Scholar] [CrossRef]
- Nejatian, I.; Kanani, M.; Arabloo, M.; Bahadori, A.; Zendehboudi, S. Prediction of natural gas flow through chokes using support vector machine algorithm. J. Nat. Gas Sci. Eng. 2014, 18, 155–163. [Google Scholar] [CrossRef]
- Hafezi, R.; Alipour, M.; Wood, D.A.; Moghaddam, N.B. Natural gas demand prediction: Methods, time horizons, geographical scopes, sustainability issues, and scenarios. In Sustainable Natural Gas Reservoir and Production Engineering; Elsevier: Amsterdam, The Netherlands, 2022; pp. 29–53. [Google Scholar]
- Wanasinghe, T.R.; Wroblewski, L.; Petersen, B.K.; Gosine, R.G.; James, L.A.; De Silva, O.; Mann, G.K.; Warrian, P.J. Digital twin for the oil and gas industry: Overview, research trends, opportunities, and challenges. IEEE Access 2020, 8, 104175–104197. [Google Scholar] [CrossRef]
- Wen, K.; Xu, H.; Xu, M.; Pei, Y.; Lu, Y.; Zheng, H.; Li, Z. Digital twin-driven intelligent control of natural gas flowmeter calibration station. Measurement 2023, 217, 113140. [Google Scholar] [CrossRef]
- VanDerHorn, E.; Mahadevan, S. Digital Twin: Generalization, characterization and implementation. Decis. Support Syst. 2021, 145, 113524. [Google Scholar] [CrossRef]
- Sircar, A.; Yadav, K.; Rayavarapu, K.; Bist, N.; Oza, H. Application of machine learning and artificial intelligence in oil and gas industry. Pet. Res. 2021, 6, 379–391. [Google Scholar] [CrossRef]
- Nian, J.; Wang, Y.; Wang, J. Research on Fault Diagnosis of Gas Pressure Regulator Based on Digital Twin. In Proceedings of the 2021 33rd Chinese Control and Decision Conference (CCDC), Kunming, China, 22–24 May 2021; pp. 872–875. [Google Scholar]
- Zhang, M.; Zuo, Y.; Tao, F. Equipment energy consumption management in digital twin shop-floor: A framework and potential applications. In Proceedings of the 2018 IEEE 15th International Conference on Networking, Sensing and Control (ICNSC), Zhuhai, China, 27–29 March 2018; pp. 1–5. [Google Scholar]
- Rück, T.; Müller, M.; Jobst, S.; Weigl, S.; Pangerl, J.; Bierl, R.; Matysik, F.-M. Digital Twin of a photoacoustic trace gas sensor for monitoring methane in complex gas compositions. Sens. Actuators B Chem. 2023, 378, 133119. [Google Scholar] [CrossRef]
- Yu, W.; Patros, P.; Young, B.; Klinac, E.; Walmsley, T.G. Energy digital twin technology for industrial energy management: Classification, challenges and future. Renew. Sustain. Energy Rev. 2022, 161, 112407. [Google Scholar] [CrossRef]
- Sleiti, A.K.; Kapat, J.S.; Vesely, L. Digital twin in energy industry: Proposed robust digital twin for power plant and other complex capital-intensive large engineering systems. Energy Rep. 2022, 8, 3704–3726. [Google Scholar] [CrossRef]
- Akroyd, J.; Mosbach, S.; Bhave, A.; Kraft, M. Universal digital twin-a dynamic knowledge graph. Data-Centric Eng. 2021, 2, e14. [Google Scholar] [CrossRef]
- Pregnolato, M.; Gunner, S.; Voyagaki, E.; De Risi, R.; Carhart, N.; Gavriel, G.; Tully, P.; Tryfonas, T.; Macdonald, J.; Taylor, C. Towards Civil Engineering 4.0: Concept, workflow and application of Digital Twins for existing infrastructure. Autom. Constr. 2022, 141, 104421. [Google Scholar] [CrossRef]
- Faliagka, E.; Christopoulou, E.; Ringas, D.; Politi, T.; Kostis, N.; Leonardos, D.; Tranoris, C.; Antonopoulos, C.P.; Denazis, S.; Voros, N. Trends in Digital Twin Framework Architectures for Smart Cities: A Case Study in Smart Mobility. Sensors 2024, 24, 1665. [Google Scholar] [CrossRef] [PubMed]
- Glaessgen, E.; Stargel, D. The digital twin paradigm for future NASA and US Air Force vehicles. In Proceedings of the 53rd AIAA/ASME/ASCE/AHS/ASC Structures, Structural Dynamics and Materials Conference 20th AIAA/ASME/AHS Adaptive Structures Conference 14th AIAA, Honolulu, HI, USA, 3–26 April 2012; p. 1818. [Google Scholar]
- Grieves, M. Digital twin: Manufacturing excellence through virtual factory replication. White Pap. 2014, 1, 1–7. [Google Scholar]
- Liu, M.; Fang, S.; Dong, H.; Xu, C. Review of digital twin about concepts, technologies, and industrial applications. J. Manuf. Syst. 2021, 58, 346–361. [Google Scholar] [CrossRef]
- Chen, H.; Zhang, Z.; Karamanakos, P.; Rodriguez, J. Digital twin techniques for power electronics-based energy conversion systems: A survey of concepts, application scenarios, future challenges, and trends. IEEE Ind. Electron. Mag. 2022, 17, 20–36. [Google Scholar] [CrossRef]
- Rasheed, A.; San, O.; Kvamsdal, T. Digital twin: Values, challenges and enablers from a modeling perspective. IEEE Access 2020, 8, 21980–22012. [Google Scholar] [CrossRef]
- Qi, Q.; Tao, F.; Hu, T.; Anwer, N.; Liu, A.; Wei, Y.; Wang, L.; Nee, A.Y. Enabling technologies and tools for digital twin. J. Manuf. Syst. 2021, 58, 3–21. [Google Scholar] [CrossRef]
- Bâra, A.; Oprea, S.-V. Enabling coordination in energy communities: A Digital Twin model. Energy Policy 2024, 184, 113910. [Google Scholar] [CrossRef]
- Hosamo, H.H.; Svennevig, P.R.; Svidt, K.; Han, D.; Nielsen, H.K. A Digital Twin predictive maintenance framework of air handling units based on automatic fault detection and diagnostics. Energy Build. 2022, 261, 111988. [Google Scholar] [CrossRef]
- Yi, Y.; Yan, Y.; Liu, X.; Ni, Z.; Feng, J.; Liu, J. Digital twin-based smart assembly process design and application framework for complex products and its case study. J. Manuf. Syst. 2021, 58, 94–107. [Google Scholar] [CrossRef]
- Botín-Sanabria, D.M.; Mihaita, A.-S.; Peimbert-García, R.E.; Ramírez-Moreno, M.A.; Ramírez-Mendoza, R.A.; Lozoya-Santos, J.d.J. Digital twin technology challenges and applications: A comprehensive review. Remote Sens. 2022, 14, 1335. [Google Scholar] [CrossRef]
- Singh, M.; Srivastava, R.; Fuenmayor, E.; Kuts, V.; Qiao, Y.; Murray, N.; Devine, D. Applications of digital twin across industries: A review. Appl. Sci. 2022, 12, 5727. [Google Scholar] [CrossRef]
- Pankratova, N.; Grishyn, K.; Barilko, V. Digital twins: Stages of concept development, areas of use, prospects. Syst. Res. Inf. Technol. 2023, 2, 7–21. [Google Scholar]
- Arpino, F.; Dell’Isola, M.; Ficco, G.; Vigo, P. Unaccounted for gas in natural gas transmission networks: Prediction model and analysis of the solutions. J. Nat. Gas Sci. Eng. 2014, 17, 58–70. [Google Scholar] [CrossRef]
- Yeshitila, D.; Kitaw, D.; Belayneh, M. Application of Machine Learning Modeling for the Upstream Oil and Gas Industry Injury Rate Prediction. Int. J. Occup. Saf. Health 2024, 14, 152–165. [Google Scholar] [CrossRef]
- Mohammadpoor, M.; Torabi, F. Big Data analytics in oil and gas industry: An emerging trend. Petroleum 2020, 6, 321–328. [Google Scholar] [CrossRef]
- Tariq, Z.; Aljawad, M.S.; Hasan, A.; Murtaza, M.; Mohammed, E.; El-Husseiny, A.; Alarifi, S.A.; Mahmoud, M.; Abdulraheem, A. A systematic review of data science and machine learning applications to the oil and gas industry. J. Pet. Explor. Prod. Technol. 2021, 11, 4339–4374. [Google Scholar] [CrossRef]
- Shen, F.; Ren, S.S.; Zhang, X.Y.; Luo, H.W.; Feng, C.M. A digital twin-based approach for optimization and prediction of oil and gas production. Math. Probl. Eng. 2021, 2021, 1–8. [Google Scholar] [CrossRef]
- Khalaf, A.H.; Xiao, Y.; Xu, N.; Wu, B.; Li, H.; Lin, B.; Nie, Z.; Tang, J. Emerging AI technologies for corrosion monitoring in oil and gas industry: A comprehensive review. Eng. Fail. Anal. 2023, 155, 107735. [Google Scholar] [CrossRef]
- Boschert, S.; Rosen, R. Digital twin—The simulation aspect. In Mechatronic Futures: Challenges and Solutions for Mechatronic Systems and Their Designers; Springer: Berlin/Heidelberg, Germany, 2016; pp. 59–74. [Google Scholar]
- Pylianidis, C.; Snow, V.; Overweg, H.; Osinga, S.; Kean, J.; Athanasiadis, I.N. Simulation-assisted machine learning for operational digital twins. Environ. Model. Softw. 2022, 148, 105274. [Google Scholar] [CrossRef]
- Chen, R.J.; Lu, M.Y.; Chen, T.Y.; Williamson, D.F.; Mahmood, F. Synthetic data in machine learning for medicine and healthcare. Nat. Biomed. Eng. 2021, 5, 493–497. [Google Scholar] [CrossRef]
- Ghosh, A.K.; Ullah, A.S.; Kubo, A. Hidden Markov model-based digital twin construction for futuristic manufacturing systems. Ai Edam 2019, 33, 317–331. [Google Scholar] [CrossRef]
- Qin, Y.; Wu, X.; Luo, J. Data-model combined driven digital twin of life-cycle rolling bearing. IEEE Trans. Ind. Inform. 2021, 18, 1530–1540. [Google Scholar] [CrossRef]
- Liu, X.; Jiang, D.; Tao, B.; Jiang, G.; Sun, Y.; Kong, J.; Tong, X.; Zhao, G.; Chen, B. Genetic algorithm-based trajectory optimization for digital twin robots. Front. Bioeng. Biotechnol. 2022, 9, 793782. [Google Scholar] [CrossRef]
- Liu, Y.; Yu, H.; Tang, J.; Cao, Y.; Li, J.; Deng, Z.; Wu, D.; Lun, H.; Shi, L. Digital twin of the atmospheric turbulence channel based on self-supervised deep learning algorithm. Phys. Lett. A 2023, 481, 128992. [Google Scholar] [CrossRef]
- Abbasi, T.; Lim, K.H.; Yam, K.S. Predictive maintenance of oil and gas equipment using recurrent neural network. In Proceedings of the Iop Conference Series: Materials Science and Engineering, Shijiazhuang, China, 19–20 April 2019; p. 012067. [Google Scholar]
- Orrù, P.F.; Zoccheddu, A.; Sassu, L.; Mattia, C.; Cozza, R.; Arena, S. Machine learning approach using MLP and SVM algorithms for the fault prediction of a centrifugal pump in the oil and gas industry. Sustainability 2020, 12, 4776. [Google Scholar] [CrossRef]
- Wu, Y.; Yang, G.; Sun, J.; Cui, L.; Wang, M. Digital twin modeling and leak diagnosis of temperature and stress fields in LNG storage tanks. Measurement 2024, 228, 114374. [Google Scholar] [CrossRef]
- Kim, J.; Chae, M.; Han, J.; Park, S.; Lee, Y. The development of leak detection model in subsea gas pipeline using machine learning. J. Nat. Gas Sci. Eng. 2021, 94, 104134. [Google Scholar] [CrossRef]
- Zhou, D.; Jia, X.; Ma, S.; Shao, T.; Huang, D.; Hao, J.; Li, T. Dynamic simulation of natural gas pipeline network based on interpretable machine learning model. Energy 2022, 253, 124068. [Google Scholar] [CrossRef]
- Lian, Y.; Geng, Y.; Tian, T. Anomaly detection method for multivariate time series data of oil and gas stations based on digital twin and mtad-gan. Appl. Sci. 2023, 13, 1891. [Google Scholar] [CrossRef]
- Sirisha, U.M.; Belavagi, M.C.; Attigeri, G. Profit prediction using ARIMA, SARIMA and LSTM models in time series forecasting: A comparison. IEEE Access 2022, 10, 124715–124727. [Google Scholar] [CrossRef]
- Mehdizadeh, S. Using AR, MA, and ARMA time series models to improve the performance of MARS and KNN approaches in monthly precipitation modeling under limited climatic data. Water Resour. Manag. 2020, 34, 263–282. [Google Scholar] [CrossRef]
- Panigrahi, S.; Pattanayak, R.M.; Sethy, P.K.; Behera, S.K. Forecasting of sunspot time series using a hybridization of ARIMA, ETS and SVM methods. Sol. Phys. 2021, 296, 6. [Google Scholar] [CrossRef]
- Yap, Z.N.; Musa, S. Stream Flow Forcasting on Pahang River by Time Series Models, ARMA, ARIMA and SARIMA. Recent Trends Civ. Eng. Built Environ. 2023, 4, 331–341. [Google Scholar]
- Fordyce, K. Linear Regression with a Time Series View, Part 1: Simple Linear Regression. Foresight Int. J. Appl. Forecast. 2024, 72, 35–39. [Google Scholar]
- Flores-Sosa, M.; Leon-Castro, E.; Aviles-Ochoa, E.; Merigo, J.M. Forecasting Volatility with Simple Linear Regression and Ordered Weighted Average Operators. Econ. Comput. Econ. Cybern. Stud. Res. 2022, 56, 203–218. [Google Scholar]
- Bourdeau, M.; Zhai, X.; Nefzaoui, E.; Guo, X.; Chatellier, P. Modeling and forecasting building energy consumption: A review of data-driven techniques. Sustain. Cities Soc. 2019, 48, 101533. [Google Scholar] [CrossRef]
- Charles, A.; Darné, O.; Kim, J.H. Stock return predictability: Evaluation based on interval forecasts. Bull. Econ. Res. 2022, 74, 363–385. [Google Scholar] [CrossRef]
- Gautam, S.S.; Abhishekh. A novel moving average forecasting approach using fuzzy time series data set. J. Control Autom. Electr. Syst. 2019, 30, 532–544. [Google Scholar] [CrossRef]
- Faghidian, S.F.; Khashei, M.; Khalilzadeh, M. Improving intermittent demand forecasting based on data structure. J. Eng. Res. 2021, 9, 8667. [Google Scholar] [CrossRef]
- Khan, S.; Alghulaiakh, H. ARIMA model for accurate time series stocks forecasting. Int. J. Adv. Comput. Sci. Appl. 2020, 11, 524–528. [Google Scholar] [CrossRef]
- Fan, D.; Sun, H.; Yao, J.; Zhang, K.; Yan, X.; Sun, Z. Well production forecasting based on ARIMA-LSTM model considering manual operations. Energy 2021, 220, 119708. [Google Scholar] [CrossRef]
- Naim, I.; Mahara, T. Comparative analysis of univariate forecasting techniques for industrial natural gas consumption. Int. J. Image Graph. Signal Process. 2018, 11, 33. [Google Scholar] [CrossRef]
- Ali, A.; Aliyuda, K.; Elmitwally, N.; Bello, A.M. Towards more accurate and explainable supervised learning-based prediction of deliverability for underground natural gas storage. Appl. Energy 2022, 327, 120098. [Google Scholar] [CrossRef]
- Karabiber, O.A.; Xydis, G. Forecasting day-ahead natural gas demand in Denmark. J. Nat. Gas Sci. Eng. 2020, 76, 103193. [Google Scholar] [CrossRef]
- Wu, S.; Kong, L.; Wang, A.; Lu, Q.; Feng, X. Exogenous input autoregressive model based on mixed variables for offline prediction thermal errors of CNC Swiss lathes. Int. J. Adv. Manuf. Technol. 2024, 130, 3245–3256. [Google Scholar] [CrossRef]
- Filik, U.B.; Kurban, M. A new approach for the short-term load forecasting with autoregressive and artificial neural network models. Int. J. Comput. Intell. Res. 2007, 3, 66–71. [Google Scholar]
- Tao, F.; Cheng, J.; Qi, Q.; Zhang, M.; Zhang, H.; Sui, F. Digital twin-driven product design, manufacturing and service with big data. Int. J. Adv. Manuf. Technol. 2018, 94, 3563–3576. [Google Scholar] [CrossRef]
- Ghosh, P.; Dhar, P.K. GSM based low-cost gas leakage, explosion and fire alert system with advanced security. In Proceedings of the 2019 International Conference on Electrical, Computer and Communication Engineering (ECCE), Cox’s Bazar, Bangladesh, 7–9 February 2019; pp. 1–5. [Google Scholar]
- Suma, V.; Shekar, R.R.; Akshay, K.A. Gas leakage detection based on IOT. In Proceedings of the 2019 3rd International Conference on Electronics, Communication and Aerospace Technology (ICECA), Coimbatore, India, 12–14 June 2019; pp. 1312–1315. [Google Scholar]
- Wang, J.; Zhang, R.; Yan, Y.; Dong, X.; Li, J.M. Locating hazardous gas leaks in the atmosphere via modified genetic, MCMC and particle swarm optimization algorithms. Atmos. Environ. 2017, 157, 27–37. [Google Scholar] [CrossRef]
- Li, Y.; Qian, X.; Zhang, S.; Sheng, J.; Hou, L.; Yuan, M. Assessment of gas explosion risk in underground spaces adjacent to a gas pipeline. Tunn. Undergr. Space Technol. 2023, 131, 104785. [Google Scholar] [CrossRef]


| Year | Industry | Field of Prediction | Model | Author |
|---|---|---|---|---|
| 2019 | Manufacturing | Surface Roughness Prediction | HMM (Hidden Markov Models) | Ghosh, Ullah, and Kubo |
| 2021 | Manufacturing | Product Life Prediction | Cycle GAN (Generative Adversarial Networks) | Qin, Wu, and Luo |
| 2022 | Lobots | Trajectory prediction | GA (Genetic Algorithm) | Liu, Jiang, Tao, Jiang, Sun, Kong, … and Chen |
| 2023 | Environment | Atmospheric turbulence | CNN (Convolutional Neural Networks) | Liu, Yu, Tang, Cao, Li, Deng, … and Shi |
| 2019 | Gas | Air Booster Compressor (ABC) Motor | LSTM (Long Short-Term Memory) | Abbasi, Lim, and Yam |
| 2020 | Gas | Pump | SVM (Support Vector Machines), MLP (Multi-Layer Perceptron) | Orrù, Zoccheddu, Sassu, Mattia, Cozza, and Arena |
| 2020 | Gas | Pipeline | GA | Nafey, Zoghaib, and Omar |
| 2021 | Gas | Pipeline | DNN (Deep Neural Network) | Kim, Chae, Han, Park, and Lee |
| 2022 | Gas | Pipeline | Shortcut ENN (Elman neural network), LSTM | Zhou, Jia Ma, Shao Huang, Hao, and Li |
| 2023 | Gas | Pipeline | MTAD-GAN (Multivariate Time-series Anomaly Detection via Graph Attention Network) | Lian, Geng, and Tian |
| 2024 | Gas | Storage tank | SVM (Support Vector Machines), CNN, LSTM | Wu Yang, Sun, Cui, and Wang |
| Date (Year.Month.Day. Hour:Minute:Second) | Secondary Gas Pressure |
|---|---|
| 2022.11.01. 00:00:00 | 1.98100 |
| 2022.11.01. 00:05:00 | 1.99000 |
| 2022.11.01. 00:10:00 | 1.95900 |
| 2022.11.01. 00:15:00 | 2.01800 |
| 2022.11.01. 00:20:00 | 2.04200 |
| 2022.11.01. 00:25:00 | 1.99500 |
| 2022.11.01. 00:30:00 | 1.97000 |
| 2022.11.01. 00:35:00 | 2.01800 |
| … | … |
| Variables | Description |
|---|---|
| Mean of pressure (m) | The average of the past 30 data at the time we want to predict |
| Standard deviation (s) | m × (5%/3.5%/2%) |
| Distribution | Generating a random number that follows a normal distribution |
| Model (p, D, q) | AIC |
|---|---|
| ARIMA (0, 1, 0) | −221,606.602 |
| ARIMA (3, 1, 1) | −236,114.407 |
| ARIMA (2, 1, 1) | −236,075.939 |
| ARIMA (3, 1, 0) | −235,600.263 |
| ARIMA (3, 1, 2) | −236,094.948 |
| ARIMA (2, 1, 0) | −234,407.519 |
| ARIMA (2, 1, 2) | −237,023.216 |
| ARIMA (1, 1, 2) | −235,983.543 |
| ARIMA (2, 1, 3) | −236,041.552 |
| ARIMA (1, 1, 1) | −235,995.686 |
| ARIMA (3, 1, 3) | −236,100.239 |
| RMSE | MAPE | R2 | ||
|---|---|---|---|---|
| Regression | Raw Data | 0.06770 | 0.01856 | 0.60871 |
| 2% | 0.04392 | 0.01790 | 0.65000 | |
| 3.5% | 0.04392 | 0.01790 | 0.63586 | |
| 5% | 0.04392 | 0.01790 | 0.61352 | |
| AR | Raw Data | 0.01680 | 0.00645 | 0.94276 |
| 2% | 0.03017 | 0.01223 | 0.81795 | |
| 3.5% | 0.03095 | 0.01253 | 0.80823 | |
| 5% | 0.03217 | 0.01298 | 0.79270 | |
| MA | Raw Data | 0.03377 | 0.01343 | 0.83868 |
| 2% | 0.03702 | 0.01478 | 0.77040 | |
| 3.5% | 0.03986 | 0.01595 | 0.72493 | |
| 5% | 0.04212 | 0.01688 | 0.68576 | |
| ARMA | Raw Data | 0.01593 | 0.00618 | 0.94854 |
| 2% | 0.03006 | 0.01215 | 0.81866 | |
| 3.5% | 0.03157 | 0.01280 | 0.79999 | |
| 5% | 0.03301 | 0.01340 | 0.78403 | |
| ARIMA | Raw Data | 0.01575 | 0.00609 | 0.94993 |
| 2% | 0.02989 | 0.01208 | 0.82224 | |
| 3.5% | 0.03187 | 0.01294 | 0.79851 | |
| 5% | 0.03303 | 0.01341 | 0.78466 | |
| ETS | Raw Data | 0.01751 | 0.00672 | 0.93941 |
| 2% | 0.03033 | 0.01228 | 0.81855 | |
| 3.5% | 0.03160 | 0.01275 | 0.80501 | |
| 5% | 0.03278 | 0.01321 | 0.79231 | |
Disclaimer/Publisher’s Note: The statements, opinions and data contained in all publications are solely those of the individual author(s) and contributor(s) and not of MDPI and/or the editor(s). MDPI and/or the editor(s) disclaim responsibility for any injury to people or property resulting from any ideas, methods, instructions or products referred to in the content. |
© 2024 by the authors. Licensee MDPI, Basel, Switzerland. This article is an open access article distributed under the terms and conditions of the Creative Commons Attribution (CC BY) license (https://creativecommons.org/licenses/by/4.0/).
Share and Cite
Yun, J.; Kim, S.; Kim, J. Digital Twin Technology in the Gas Industry: A Comparative Simulation Study. Sustainability 2024, 16, 5864. https://doi.org/10.3390/su16145864
Yun J, Kim S, Kim J. Digital Twin Technology in the Gas Industry: A Comparative Simulation Study. Sustainability. 2024; 16(14):5864. https://doi.org/10.3390/su16145864
Chicago/Turabian StyleYun, Jaeseok, Sungyeon Kim, and Jinmin Kim. 2024. "Digital Twin Technology in the Gas Industry: A Comparative Simulation Study" Sustainability 16, no. 14: 5864. https://doi.org/10.3390/su16145864
APA StyleYun, J., Kim, S., & Kim, J. (2024). Digital Twin Technology in the Gas Industry: A Comparative Simulation Study. Sustainability, 16(14), 5864. https://doi.org/10.3390/su16145864