Article

Digital Twin Technology in the Gas Industry: A Comparative Simulation Study

1
Program in Converging Technology Systems and Standardization, Korea University, Sejong 30019, Republic of Korea
2
Department of Standards and Intelligence, Korea University, Sejong 30019, Republic of Korea
*
Author to whom correspondence should be addressed.
Sustainability 2024, 16(14), 5864; https://doi.org/10.3390/su16145864
Submission received: 3 May 2024 / Revised: 29 June 2024 / Accepted: 2 July 2024 / Published: 10 July 2024

Abstract

:
Continuous innovation is essential in the urban gas industry to achieve the stability of energy supply and sustainability. The continuous increase in the global demand for energy indicates that the urban gas industry plays a crucial role in terms of stability, the economy, and the environmental friendliness of the energy supply. However, price volatility, supply chain complexity, and strengthened environmental regulations are certain challenges faced by this industry. In this study, we intend to overcome these challenges by elucidating the application of digital twin technology and by improving the performance of the prediction models in the gas industry. The real-time data and simulation-based predictions of pressure fluctuations were integrated in terms of pressure control equipment. We determined the contribution of this data integration to enhancing the operational efficiency, safety, and sustainable development in the gas industry. The summary of the results highlights the superior predictive performance of the autoregressive integrated moving average (ARIMA) model. It exhibited the best performance across all evaluation indices—mean absolute percentage error (MAPE), root mean square error (RMSE), and the coefficient of determination (R2)—when compared with the raw data. Specifically, the ARIMA model demonstrated the lowest RMSE value of 0.01575, the lowest MAPE value of 0.00609, and the highest R2 value of 0.94993 among the models evaluated. This indicates that the ARIMA model outperformed the other models in accurately predicting the outcomes. These findings validate that the integration of digital twin technology and prediction models can innovatively improve the maintenance strategy, operational efficiency, and risk prediction in the gas industry. Predictive maintenance models can help prevent significant industrial risks, such as gas leak accidents. Moreover, the integration of digital twin technology and predictive maintenance models can significantly enhance the safety and sustainability in the gas industry. The proposed innovative method of implementing digital twin technology and improved prediction models lays a theoretical foundation for sustainable development that can be applied to other industries with high energy consumption.

1. Introduction

The urban gas industry requires continuous innovation to achieve a stable and sustainable energy supply [1]. In 2022, the Gas Exporting Countries Forum (GECF) presented a long-term outlook for natural gas supply, demand, and trade until 2050 through the ‘Global Gas Outlook 2050 Synopsis’. According to the GECF, natural gas demand is expected to increase to 1435 Bcm (billion cubic meters) by 2050, which is a 36% increase in comparison with the demand in 2021, owing to the increased electricity demand, the efforts to improve the air quality, and the energy transition policies used for converting coal and oil to gas [2]. This growth in demand is particularly expected in the Asia–Pacific, Middle Eastern, and African countries. As urban gas is an established essential energy source in modern society, the continued increase in its demand has increased the demand for a stable and efficient energy supply [1,3].
The urban gas industry plays a crucial role in terms of energy supply stability, economic efficiency, and environmental friendliness [4,5]. With respect to environmental friendliness, the development of the urban gas industry is centered on the efficient management of gas governors and the accuracy of pressure predictions [6,7]. Positive pressure equipment can effectively manage and control the pressure of urban gas to safely supply it to consumers at a high pressure [6]. Particularly, a gas governor converts high-pressure gas into low-pressure gas that can be used by consumers. During this process, the pressure of the gas is precisely adjusted to ensure that the gas is supplied to the user at a constant and stable pressure [7]. The pressure control in the gas supply chain enables the safe and efficient use of gas [6,7].
Therefore, predicting the pressure changes in a gas governor accurately can prevent the problems caused by unexpected pressure changes in advance, improving the efficiency and reliability of the urban gas supply chain and thereby enhancing the stability and economic feasibility of the entire energy supply chain [8].
However, the urban gas industry faces various challenges such as price volatility, supply chain complexity, and strengthened environmental regulations [9,10,11,12]. Hailemariam and Smyth [13] reported issues of the volatility of natural gas prices, the increasing uncertainty throughout the energy market, and the increasing economic burden on both energy suppliers and consumers. Additionally, Bazyar et al. [9] analyzed the impact of the complexities in the natural gas supply chain on its efficiency and stability. Zhao et al. [12] investigated the effect of environmental regulations on the operations and strategies of the natural gas industry and determined the role of these regulations in promoting the sustainability of the energy supply. These studies analyzed the impact of price volatility, supply chain complexity, and rigid environmental regulations in the gas industry. The systematic data analysis, prediction, and efficient management of gas governors are essential to overcome the problems and ensure a stable and sustainable energy supply. This is because the natural gas supply chain is affected by various external factors, and the resulting pressure fluctuations can affect the stability of the entire supply chain [14]. Therefore, accurately predicting the pressure of gas pressure equipment in real time is essential to prevent the problems caused by unexpected pressure fluctuations and maximize the supply chain efficiency [15].
Accordingly, recent studies have emphasized the development and importance of implementing forecasting technologies in the natural gas industry [16,17,18]. In particular, prediction models are increasingly used for predicting the natural gas supply/demand and price changes as well as optimizing the supply chains. Prediction models are principles applied to machine learning (ML) and artificial intelligence (AI), enabling the accurate prediction of gas demand, consumption patterns according to seasonal changes, and short-term volatility. This plays a major role in maximizing the operational efficiency and stability of the gas industry [16,17,18]. Studies have explored the importance of gas pressure prediction using various techniques. Chao [8] developed a gas pressure prediction model based on a time series analysis and proposed a method to improve the operational efficiency of gas pressure facilities. Nejatian et al. [19] developed a methodology to predict the gas pressure fluctuations using an ML-based algorithm, thereby strengthening the stability of the gas supply chain. Therefore, existing studies have emphasized the development and importance of forecasting technology in the natural gas industry [16,17,18], and developing this forecasting technology can significantly contribute to maximizing the efficiency of the natural gas industry and achieving economic and environmental sustainability [20]. However, most studies have primarily focused on short-term forecasting or improving the forecast accuracy under specific conditions. Certain limitations exist in real-time data analysis, prediction accuracy, and integrated management of the entire supply chain [16,17,18,19]. To address these limitations, we propose a methodology to expand the scope of application of the prediction model and increase the accuracy and reliability of the prediction of pressure changes using digital twin technology.
The recent developments in digital twin technology can further enhance the pressure prediction and management processes of gas pressure facilities [21,22]. Digital twin digitally replicates physical objects or systems in the real world and facilitates the performance of simulations, predictions, and optimizations based on real-time data [23]. This can be applied to the gas industry, where the gas supply chain is affected by various factors, warranting precise data analysis and predictions for managing and optimizing this complexity [24]. Digital twins use real-time data to predict the changes in gas demand, adjust the gas supply volume, and predict the pressure in the gas pressure facility to prevent excessive energy consumption and maximize the energy efficiency [25].
The development of a gas pressure facility pressure prediction model using digital twin technology can effectuate the following changes in the gas industry. First, precise pressure prediction using real-time data prevents excessive energy consumption and improves the overall stability and efficiency of gas supply chains. This can aid in saving energy and reducing carbon emissions, thereby contributing to sustainability and environmental protection. Second, real-time data analysis and prediction ensure the stability of the gas supply system, thereby preventing accidents and maintaining the continuity in the energy supply. Third, efficient energy management based on prediction models strengthens the competitiveness of the gas industry and ensures long-term sustainability. Zhang et al. [26] proposed a demand forecasting and supply optimization plan for the energy industry using digital twin technology. They demonstrated that digital twins can improve the efficiency of energy supply chains and reduce the energy consumption and operating costs. Additionally, Rück [27] investigated methods to reduce carbon emissions and promote sustainable production by applying digital twins in the gas industry. However, a new approach beyond the existing management methods is required to strengthen the stability and competitiveness of the urban gas industry [28]. In this context, a gaseous gas pressure facility pressure prediction model using digital twins can be an innovative solution for satisfying these requirements. Accordingly, we intend to answer the following research questions:
  • How can digital twin technology be implemented in the gas industry to improve operational efficiency and stability?
  • How effective is the performance when simulation data are applied to a prediction model?
  • Which model provides the most accurate prediction results?
  • How can gas pressure equipment be managed using a predictive maintenance model and how does it contribute to improving the industrial stability and efficiency?
In this study, we analyzed and compared various simulation-based prediction models for predicting the pressure in gas regulators. We collected pressure data from an actual gas governor collected from the Supervisory Control and Data Acquisition (SCADA) system of CNCITY Energy, a Korean gas energy supplier. The learning and evaluation of these data were performed using data from a specific period. The performance of several forecasting models, including regression analysis, Autoregressive (AR), Moving Average (MA), Autoregressive and Moving Average (ARMA), autoregressive integrated moving average (ARIMA) and error, trend, seasonal (ETS) time series prediction models, was analyzed using the mean absolute percentage error (MAPE), root mean square error (RMSE), and the coefficient of determination (R2) to identify the model that provided the most accurate results. The MAPE, RMSE, and R2 are indicators that evaluate the accuracy of a prediction model and are used for measuring the error rate and accuracy of the prediction. The performance evaluation of prediction models using these indicators enables the identification of the model that provides the most accurate prediction results.
In this study, we implemented a prediction model essential for the application of digital twin technology in the gas industry. The existing studies have applied it to various models based on the available data to derive predictive results. However, the research on the cases where data do not exist due to recording device defects, server instability, operator errors, etc. is insufficient. Therefore, we compared the performance of these models to facilitate the development of future gas pressure prediction models. Furthermore, we examined the differences between the prediction model and raw gas pressure data based on performance evaluations and determined the benefits of applying digital twin technology in the gas industry.
The proposed digital twin-based prediction model can be an efficient tool for solving the problems faced by the gas industry [28]. In particular, the performance comparison and analysis of the gas pressure facility pressure prediction model provides a basic theoretical foundation for addressing the various problems that may occur in the gas industry; for instance, obtaining a rapid response to unexpected situations that may occur within the gas supply chain, ensuring efficient pressure management according to the volatility of gas demand, and establishing strategies to ensure a stable gas supply [29]. Moreover, the predictive maintenance models based on big data analysis, ML, and AI can monitor the status of facilities in real time, and the timing of the required maintenance can be predicted in advance. This enables a pre-emptive response, which the existing maintenance approach lacks. This can increase the efficiency and cost-effectiveness by predicting when the gas pressure equipment requires prognosis and maintenance.
We believe that implementing digital twin technology can realize the goals of energy saving, carbon emissions reduction, and sustainable production and development based on demand forecasting and energy supply optimization in the gas industry. In other words, the digital twin improves the operation of the gas industry and contributes to environmental protection and achieving the sustainable development goals [30]. In this study, demand forecasting and optimization performed using the digital twin effectively improved the energy efficiency, reduced the impact on the environment, and promoted the overall sustainability of the industry [28,30]. We intend to quantitatively demonstrate the practical benefits of applying the digital twin technology in the gas industry and suggest measures for sustainable production and development. The application of digital twin technology can serve as an important strategic tool in the sustainable management and operation of the gas industry, providing insights into promoting the efficiency and safety through real-time data analysis and predictions in other industries with significant energy consumption.

2. Literature Review

2.1. Digital Twin Technology

The term ‘digital twin’ was proposed by Michael Grieves in 2002 as a ‘concept ideal for product life cycle management’ [31], where digital models created in a virtual space can be stored during their lifetime. It emerged as a concept that enables interactions with physical objects [32]. In 2012, the National Aeronautics and Space Administration (NASA) and the U.S. Air Force published a paper, introducing digital twins as one of the core future technologies leading the development of aircraft [33]. In 2014, Dr. Michael Grieves [34] published the first white paper on the digital twin concept. It has been attracting increasing interest in industry and academia since 2015 [35]. In 2017, Gartner, a global market research company, ranked digital twin technology fifth among the top ten strategic technology trends [35]. In 2022, it appeared as part of an autonomous system in Gartner’s 12 strategic technology trends [32]. The concept of the digital twin is shown in Figure 1 below.
Digital twins can be characterized via three components: the physical reality, virtual representation, and interconnection that exchanges information between the physical reality and virtual representation [23]. The three elements of data, model, and algorithm in digital space are essential for implementing a digital twin. Among these, the model is a key element that runs throughout the life cycle of the device [36]. Big data technology and communication technologies such as 5G, hybrid analysis and modeling, multivariate data-based models, cloud computing, natural language processing technology, and augmented reality and virtual reality visualization technology can be used to implement a digital twin [37]. Digital twins are potentially applicable in mapping, convergence, and coevolution between physical and virtual spaces through the integration with cloud computing, big data analytics, and other technologies [38].
A digital twin can be used as a digital tool to permanently interact with a physical system, and perform simulations to create and test scenarios, and the physical system can be improved by extracting information [39]. Additionally, digital twins are used in predictive maintenance methods that warn about maintenance and repairs via the real-time monitoring of device performance and operation to ensure that maintenance can be executed in advance before problems worsen. This ensures the efficient use of technological and human resources [40]. Therefore, digital twin concepts, paradigms, frameworks, applications, and technologies are increasingly discussed in both academia and industry as they are applied in various stages of the product life cycle, including the design, manufacturing, and service stages [35].
The application of digital twin technology is used not only in the manufacturing industry but also in various fields. Yi et al. [41] proposed an application framework of smart assembly consisting of three layers based on digital twin technology: the design of the smart assembly process and the physical space layer, the interaction measurement, and the virtual space layer. To verify the efficiency of the proposed framework, the implementation method and application process of the digital twin were described through a satellite assembly case study. Botín-Sanabria et al. [42] suggested that the digital twin is a key element in data-based decision making, complex system monitoring, product verification and simulation, and object life cycle management, and conducted case analysis in the fields of smart cities, smart manufacturing, medical care, and logistics. The analysis suggests that although digital twin technology is still in its infancy, solutions for realizing the digital twin remain, such as cost and security, but combined with various technologies such as big data, simulation, and machine learning, the number of cases of applying the digital twin is increasing in various fields. Singh et al. [43] presents various advantages such as record keeping and problem solving in simulation and prediction functions obtained by applying digital twins through real-world applications in 13 industries, including manufacturing, agriculture, education, construction, medicine, and retail. These case studies suggest that it is important to identify, understand, and implement the potential of digital twin technologies. As in the above case, the application of digital twin technology in various fields, including not only manufacturing but also services, is increasing. The application of digital twins can show advantages such as increasing the operational efficiency, improving the product safety, increasing the energy productivity, preventing downtime, and reducing exhaust emissions, and thus its importance is increasing.

2.2. Digital Twin Technology in the Gas Industry

Digital twin technology in the gas industry enables the real-time monitoring and prediction of all processes to identify problematic equipment that could cause unplanned downtime, thereby preventing workflow degradation [44]. In particular, data are analyzed using various analysis and modeling techniques based on AI and ML to make accurate decisions within short durations [24]. Additionally, a digital twin can be used as a basic tool to ensure economical and stable network operation and reduce greenhouse gas emissions; from an environmental perspective, the balance can be maintained by monitoring the natural gas pipeline networks to accurately allocate the costs between users [45].
In the gas industry, digital twins can be used for asset performance management, asset risk assessment, and asset integrity management to provide insights into reducing the risks. Furthermore, the optimal control commands can be derived while reducing the costs and increasing the profits and production [21]. Considering the existing corporate competition and practices in the gas industry, improving the productivity, quality, and safety processes is crucial [46], and the utilization of big data generated at various operational stages of the gas industry is a major concern [47].
Recent studies have focused on the development of prediction models and performing predictive maintenance using data from the gas industry. Tariq et al. [48] compared various ML techniques used in the oil and gas industry. As prediction, classification, and clustering have significant potential for solving the problems in most fields of the oil and gas industry, ML and big data processing technologies are essential for improving the overall efficiency of the industry. Shen et al. [49] analyzed the concept of implementing digital twins in various industries and established an optimization model for oil and gas production. They constructed a digital twin system in the oil and gas industry to accurately predict the production parameters in real time and maximize the production capacity, ensure cost savings, reduce the operating costs, and extend the economic life of the equipment. Khalaf et al. [50] investigated the benefits of applying AI in data analysis, predictive modeling, and monitoring strategies based on a survey of various AI-based approaches used for monitoring corrosion; however, this required significant maintenance costs and resulted in productivity losses in the gas industry.
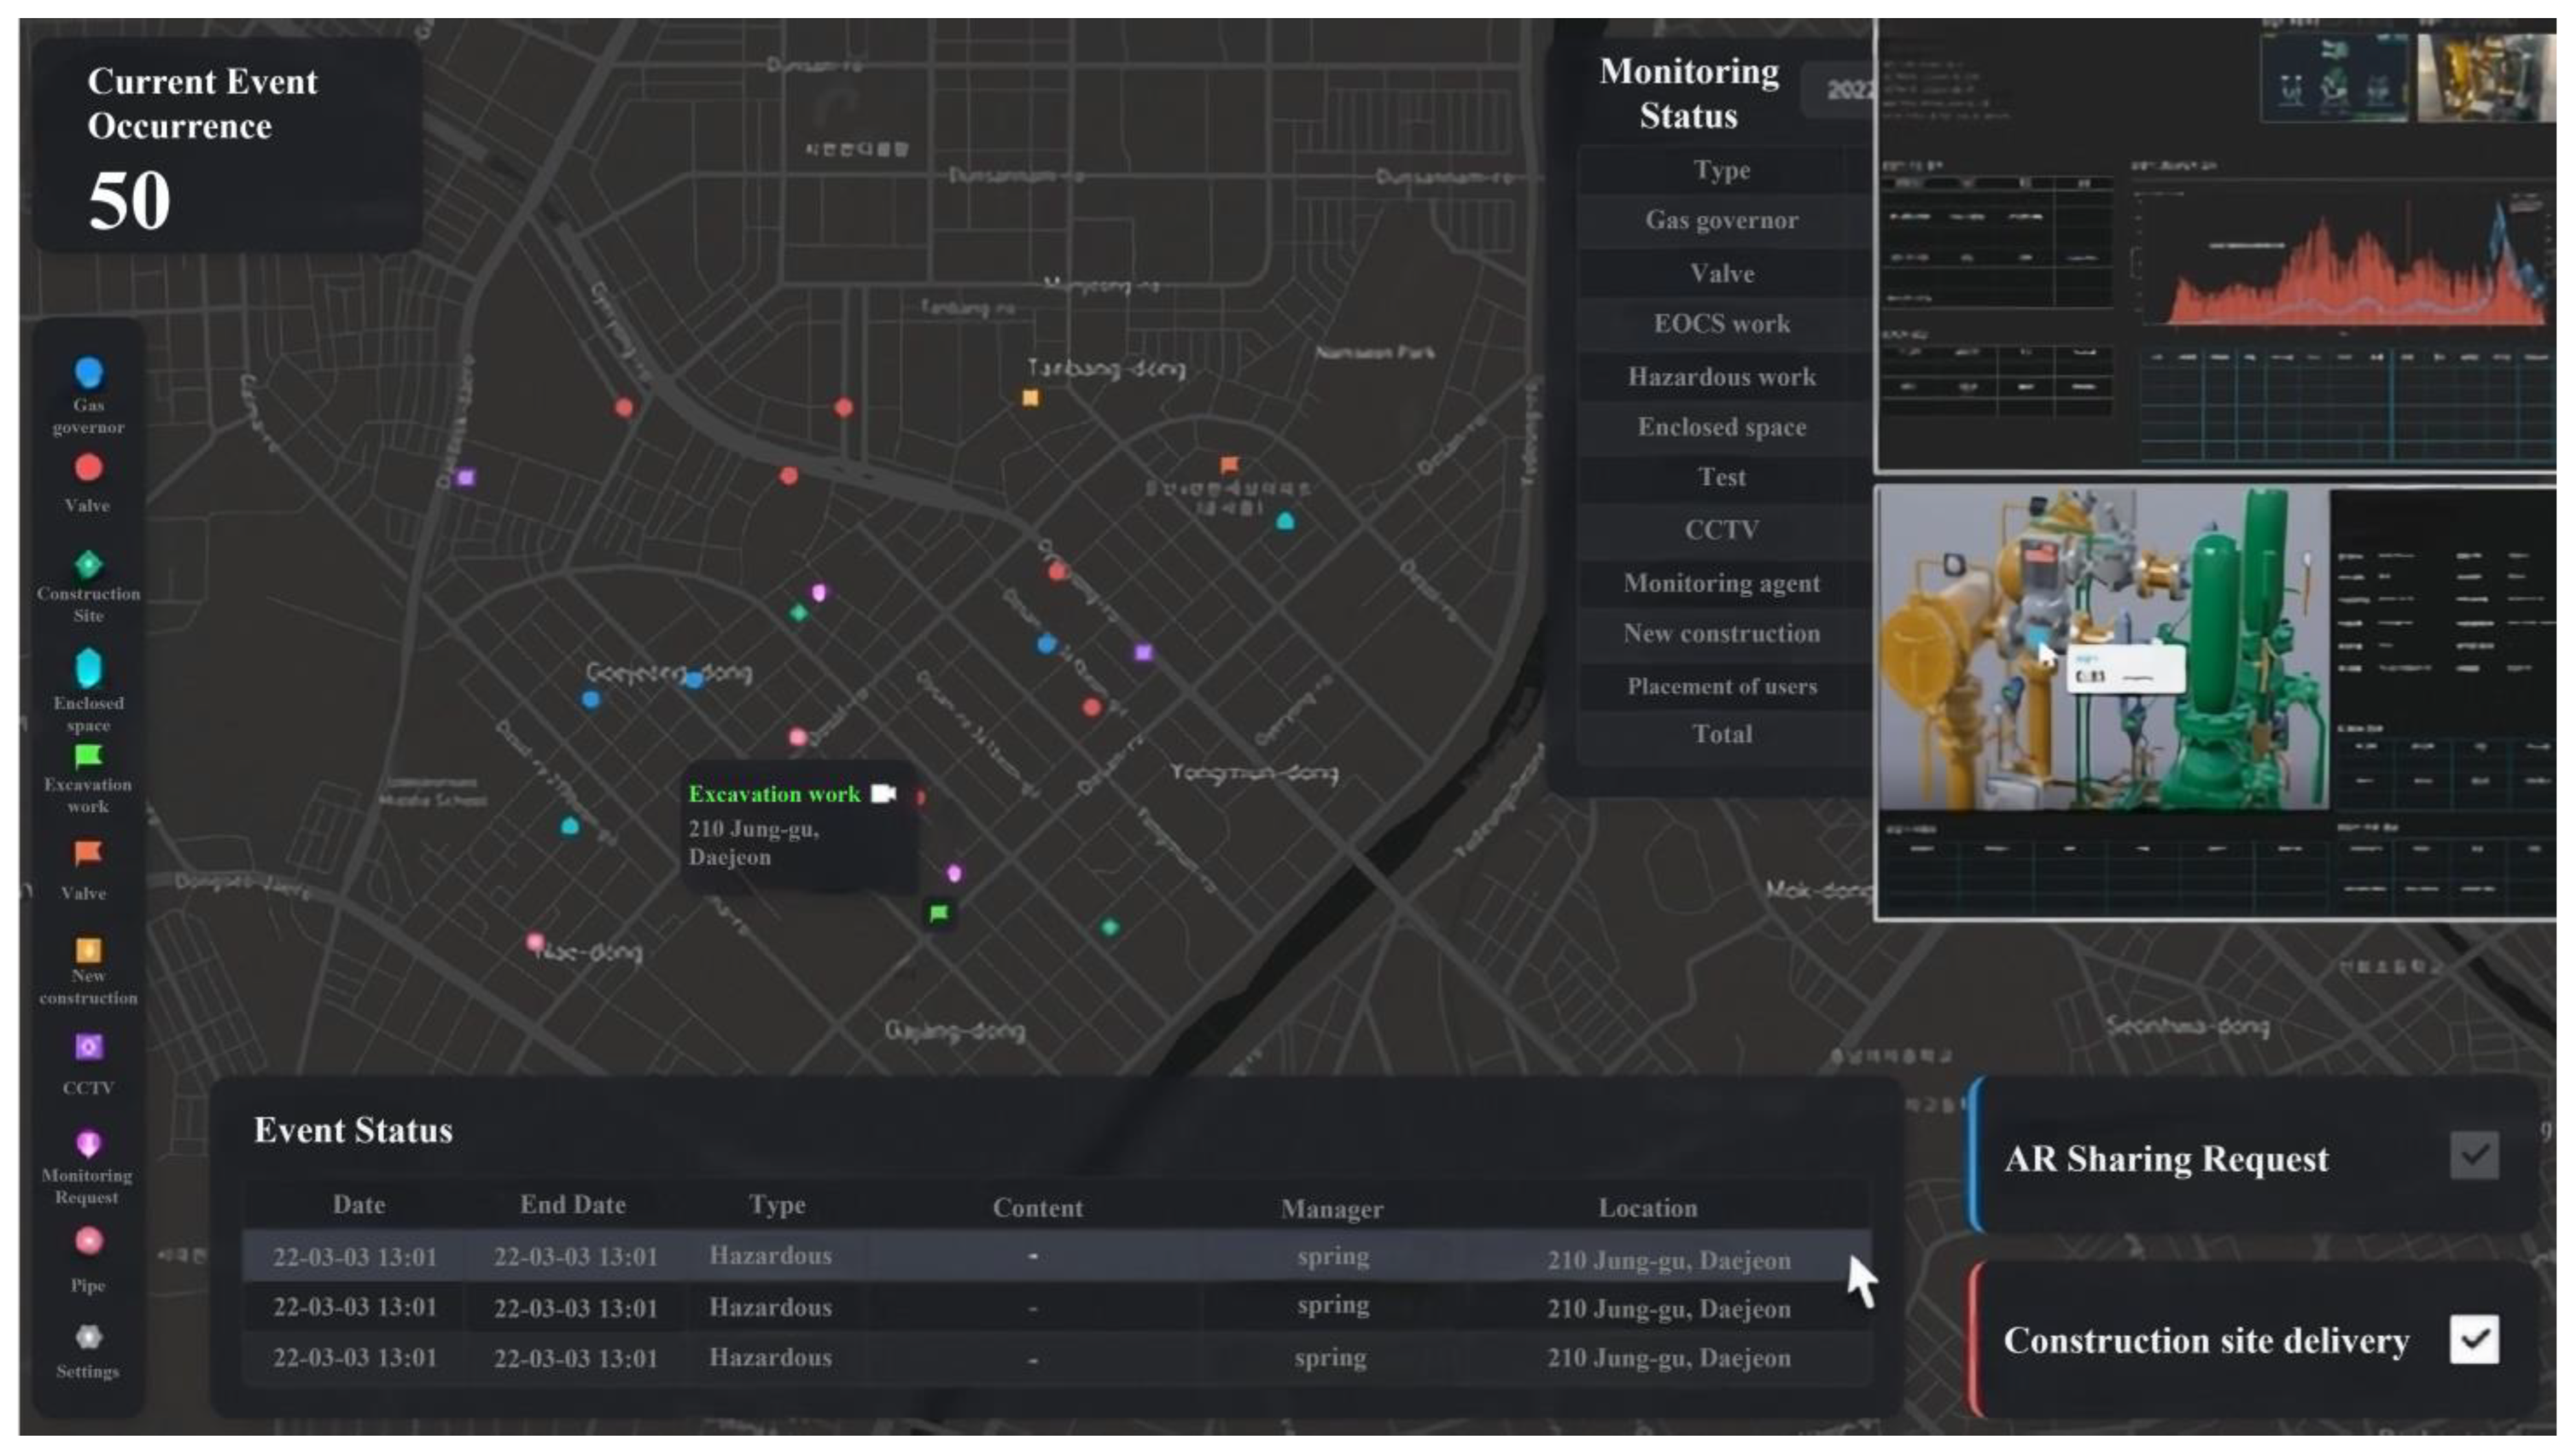
Constructing a digital twin in the gas industry involves manpower and cost, the convergence of various technologies, and the development of a complex prediction model. Most studies present theoretical concepts, whereas the cases of the actual construction of digital twins are limited [21]. In this study, we propose a pressure prediction model for gas pressure equipment to construct a digital twin, generate synthetic data using simulation techniques, and apply it to the prediction model. The results of the performance evaluation of the prediction model are compared. The proposed prediction model can improve the operational efficiency and stability by implementing an actual digital twin of CNCITY Energy, an energy service company that provides urban gas in Korea (Figure 2).

2.3. Simulation and Prediction Models

Simulations include processes that integrate the physical and virtual worlds at all stages of a life cycle to support the design tasks or verify the system properties for optimized operation and failure prediction [51]. Simulation enables the virtual model of a digital twin to interact with physical objects in real time [35]. From a simulation perspective, a digital twin typically refers to the precise mapping relationship between a virtual model built into a digital virtual space and a physical object [49]. The application of prediction models becomes challenging when the data required to implement such digital twins have not yet been collected or have been barely collected. This requires extrapolation or additional data collection, which can be time consuming and expensive [52]. In such cases, synthetic data generated using physical simulations or AI-based generative models can be used. Accurate synthetic data can be used to increase the diversity of the data set as well as the robustness and adaptability of the AI model [53]. Therefore, in this study, we implemented, compared, and analyzed a simulation-based prediction model for applying digital twin technology to the gas industry. Based on the previous research results, we examined the algorithm used in the prediction models, the target to be predicted, and the industry sectors.
Ghosh et al. [54] constructed a digital twin to predict the surface roughness using a Markov model for a future manufacturing system, referred to as Industry 4.0. Qin et al. [55] proposed a digital twin model for the life cycle prediction of bearings based on a cycle generative adversarial network (GAN) using measured signals and a bearing defect dynamic model. Based on the digital twin of a robot used for various automation tasks in the manufacturing field, Liu et al. [56] developed an optimization method for the movement trajectory of the robot using a genetic algorithm (GA) to plan the actual movement through simulation training in a virtual environment. Liu et al. [57] presented an algorithm for building digital models of atmospheric turbulence channels for the operation, management, and maintenance of quantum systems carrying signals based on orbital angular momentum, which can be easily distorted by atmospheric turbulence, and verified their excellent performance. Therefore, researchers have built digital twins based on diagnosis and predictive analysis by predicting the data through their correlations and patterns using big data and modeling technology in various fields, such as manufacturing and robotics. Various analysis models have been used depending on the characteristics of each field, the characteristics of the data reflected, and the purpose of prediction. The comparison of prediction abilities has facilitated the selection of the best model.
In the prediction studies conducted in the gas industry, Abbasi et al. [58] used long short-term memory (LSTM) to perform the predictive maintenance of air booster compressor motors to mitigate the risks and reduce the costs in the oil and gas operations in the gas industry, strengthening the importance of effective maintenance; a recurrent neural network-based ML algorithm was proposed. Orrù et al. [59] reported a simple and easy-to-implement ML model for the prediction of the early failure of centrifugal pumps in the oil and gas industry; they implemented a support vector machine (SVM) and multilayer perceptron algorithms on the KNIME platform. Wu et al. [60] presented a digital twin prediction model to address the limitations of the traditional monitoring methods. To transition to comprehensive digital monitoring, ML methods such as an SVM and linear regression were used based on temperature sensor data to perform leak diagnosis, leak volume calculation, and leak location calculation.
Nafey et al. [13] developed a computer program using the MATLAB GA approach to identify the maximum revenue through gas distribution in the existing steady-state gas grid in the Egyptian natural gas transmission network. Their analysis of the developed program and comparison with data using SYNERGI software (Python 3.12.2 version) indicated that the price of gas and the pressure value of the gas supplier directly impacted the economic profits. Kim et al. [61] performed various flow simulations based on a dynamic model related to the field, selected the most sensitive variables, used deep neural networks to learn the data, and derived an optimal learning model to create a flow diagram for the leak detection in gas pipelines. Zhou et al. [62] proposed a natural gas pipeline and its network model based on Shortcut EN to simulate natural gas and solve the problem of no flow measurement stations in the intermediate pipelines. The comparison of the LSTM model and prediction error indicated that the R2 score was greater than 0.99 and the EV was less than 0.02. Lian et al. [63] presented a multivariate time series data anomaly detection (MTAD) model of oil and gas stations based on a GAN. The performance of the MTAD-GAN-based anomaly detection was improved by approximately 2.6% in comparison with other ML and deep learning-based methods, such as LSTM-GAN.
The gas industry uses various prediction models to predict the gas pressure by implementing digital twins in all process stages, from gas stations to pipelines and pressure regulators. Table 1 summarizes the prediction models reported in the previous studies for various industries, such as manufacturing, gas, and robotics.
In this study, the pressure of a gas governor was predicted by utilizing the time series data provided by CNCITY Energy. Time series data are groups of data points arranged in chronological order [64]. Models such as AR, MA, ARMA, ARIMA, ETS, etc. are being used for prediction using time series data from various fields [65,66,67]. The models used in this study were not used in previous studies but have traditionally been used as useful tools in analyzing time series data and performing short-term predictions. In addition, the models used in this study were selected to analyze time series data to find the model with the best predictive performance that showed the least difference between the predicted results and the actual data. Applying an excellent predictive model in the implementation of the gas digital twin can more accurately reflect the situation in reality and help make decisions such as problem solving. To implement a digital twin, we selected a prediction model according to the environment in which the modeling was intended and performed a comparative analysis. We compared the performance of six prediction models, including the autoregressive integrated moving average (ARIMA) and error, trend, seasonal (ETS) time series prediction models, and used synthetic data generated from simulations to prepare for an environment without gas pressure data caused by recording device defects, server instability, and operator error.

3. Methodology

3.1. Research Process

This study consisted of data preprocessing, a predictive model, predictive model performance evaluation, and comparison. First, in the data preprocessing process, three synthetic data were derived through a simulation model based on past data. Synthetic data were produced using the mean, standard deviation, standard distribution, and random number generation of past data. The description of the produced synthetic data set is described in detail at the end of Section 3. Next, six predictive models for time series data analysis (regression analysis, AR, MA, ARMA, ARIMA, and ETS) were used to construct the predictive model. As for the hyperparameters (p, D, q) used in the ARIMA model, the model with the lowest AIC value was selected by using the auto_arima function of the Python pmdarima library. Finally, three performance evaluation indicators (RMSE, MAPE, and R2) were used for predictive model performance evaluation and comparison. This study analyzed four data sets (raw data, simulation 2%, 3.5%, and 5%) for the six analysis models (regression analysis, AR, MA, ARMA, ARIMA, and ETS), and performed performance evaluation and comparison for each predictive model. In this study, we applied digital twin technology to the gas industry and tried to implement a predictive model for prevention by generating synthetic data for the use of AI and ML through simulation. In addition, through comparative analysis between the raw data and synthetic data, we tried to secure the justification of the analysis for the use of machine learning and AI. Figure 3 shows the research model used in this study.

3.2. Data

Typically, an urban gas pressure governor is used to reduce the pressure from high to medium and then from medium to low in an area with a limited supply pressure when gas is supplied to the consumers. The gas governor functions to maintain and repair constant pressure. In addition, it absorbs some external factors for gas pressure to prevent pressure changes, so that it can quickly cope with seasonal demand changes. Accordingly, it is important to manage the gas static pressure machine, and in this study, therefore, only pressure data and time variables were used to apply to the predictive model other than gas static pressure pressure data.
CNCITY Energy is currently building a SCADA remote monitoring system to monitor the gas pressure 24 h in a situation room. Gas pressure data are provided as follows: date, point (location), and primary or secondary gas pressure. The primary gas pressure is the pressure supplied from the supplier to the pipe centered on the constant pressure machine, and the secondary gas pressure is divided into the pressure supplied from the constant pressure machine to the consumers. In this study, we used simulations to generate synthetic data and pre-processed the SCADA data of the No. 7 Seokbong Hanbat governor’s gas pressure provided by CNCITY Energy, collected from 1 November 2022 to 30 March 2023 (150 days). The gas pressure data provided by the SCADA system were recorded at 1 s intervals. As the primary pressure is supplied by the Korea Gas Corporation and cannot be artificially controlled by the urban gas company, we excluded the primary pressure data from the analysis and proceeded with the analysis using only secondary data and time variables. Additionally, as the data to be analyzed were of a single season (winter in Korea), seasonality was not considered.
As indicated in Table 2, the provided data were converted into 5 min increments to generate a data set of 43410. Since there are clearly limitations in the ability of computers to store and analyze big data, data were converted into 5 min units and used for the visibility and efficiency of analysis. This is expected to enable analysis using smaller time units if the analysis ability increases due to technological advances in the future. The gas constant pressure, which is the target variable of time series analysis prediction, exhibited an increasing or decreasing trend based on the secondary pressure determined for each constant pressure (Figure 4).

3.3. Algorithm for the Gas Pressure Prediction Model

We aimed to predict the pressure of gas pressure equipment using simple linear regression, AR, MA, ARMA, ARIMA, and ETS models.

3.3.1. Linear Regression

The linear regression model is the basis of machine learning and is a key element in data analysis that plays an initial role in optimization [68]. The purpose of linear regression analysis is to explain the variation in the dependent variable in terms of interpretation of the explanatory variable of the linear function. To perform this, a functional relationship between the variables must be assumed [69]. The simple linear regression model can be expressed as follows:
y j = α + β x j
where y j is the dependent variable and x j is the independent variable.

3.3.2. AR (Autoregressive)

The AR model is one of the classic modeling and prediction techniques based on the statistical analysis of a time series [70]. It is a model that predicts a future value after a specific point in time through a linear combination with past data of a specific variable to be predicted. In other words, the model is based on the fact that its previous data affect its own future observations afterward. The equation of AR (p) is as follows [71].
Y t = a 0 + a 1 Y t 1 + + a p Y t p + u t
where u t is an identically and independently distributed error term with zero mean and fixed variance.

3.3.3. MA (Moving Average)

The moving average is a method of analyzing data points by averaging a series of different subsets of the entire data set [72]. That is, it is a model in which the observed values are affected by the previous continuous error term. The MA (q) model predicts using q past error values.
y t = c + ϕ 1 y t 1 + + ϕ p y t p + ϵ t
where y t is the observation at time t, c is the constant, ϕ t is the weight, and ϵ t is the error value.

3.3.4. ARMA (Autoregressive and Moving Average)

ARMA models are generally considered linear models, and the linear relationship between the output and input of the model can be explained using ARMA [73]. The ARMA model is a combination of the AR and MA models. The model ARMA (p, q) can be expressed as follows.
y t = a 0 + a 1 y t 1 + + a p y t p + ε t + B 1 ε t 1 + + B q ε t q , ε t ~ i . i . d ( 0 , δ ε 2 ) 1 j = 1 p a j L j y t = a 0 + 1 + k = 1 q B k L k ε t , ε t ~ i . i . d ( 0 , δ ε 2 )
where y t is the actual value of the data, ε t is the random error value, a 0 is an intercept, L j is the jth lag operator, and a i (i = 1, 2, … p) are a finite set of parameters determined via linear regression.

3.3.5. ARIMA (Autoregressive Integrated Moving Average)

The ARIMA model describes a specific time series based on observations that can be used to predict the future [74]. An ARIMA model can be expressed as ARIMA (p, D, q), where the parameters (p, D, q) represent the structure of the prediction model; the parameters are a combination of autoregressive AR (p), moving average MA (q), and differential D [75]. The equation of ARIMA (p, D, q) can be described as follows:
1 j = 1 p φ i L i ( 1 L ) D x t = 1 + i = 1 q θ i L i ε t
where L denotes the lag operator, φ i is the parameters of the autoregressive part of the model, θ i is the parameters of the MA part, and ε i   is error terms.

3.3.6. ETS

The ETS model is an exponential smoothing algorithm and is a statistical analysis function used to predict future values in time series data. Unlike the moving average method that uses the average of data over a certain period of time, exponential smoothing calculates the average using all the time series data. The ETS model includes equations for error, trend, and seasonal factors [76], and the exponential smoothing method (ETS) performs total third-order smoothing. As presented below, if the first exponential smoothing suppresses white noise (Equation (6)), the second exponential smoothing (Equation (7)) reflects the trend, and the third exponential smoothing (Equation (8)) reflects the seasonality.
s i = α x i + ( 1 α ) s t 1
s 1 = x 1 , b 1 = x 1 x 0 , A n d f o r t > 1 b y s t = α x i + ( 1 α ) ( s t 1 + b t 1 ) b t = β s t s t 1 + 1 β b t 1
where b t is the optimal estimates of trends at time point t .
S 0 = x 0 s t = α X t c t L + 1 α s t 1 + b t 1 b t = β s t s t 1 + 1 β b t 1 c t = γ X t s t + 1 γ c t L
where c t is the sequence of seasonal correction factors and γ is the seasonal change smoothing factor.

3.4. Performance Evaluation Method

In this study, we used six models (regression, AR, MA, ARMA, ARIMA, and ETS) with four data (original and three synthetic data) and evaluated the results by considering the three performance indicators of the regression model: RMSE, MAPE, and R2. Time series prediction models were used to analyze, calculate, and predict the time series data. The performance evaluation of such a time series prediction model can investigate the error rate of the model based on various statistical criteria. The RMSE simply represents the standard deviation of the error, and the MAPE has the advantage of being intuitive. In addition, R2 provides the degree to which the observations match the predicted values of the time series model.

3.4.1. RMSE

The RMSE is commonly used when an estimate or model deals with the difference between a predicted value and a value observed in an actual environment. The smaller the value, the higher the prediction accuracy. This is because the MSE is less sensitive to outliers as the distortion of the value caused by squaring the error is reduced by covering the root [77].
R M S E = 1 n i = 1 n y i y i ~ 2

3.4.2. MAPE

The MAPE is a measure that can objectively evaluate the performance by deriving the performance of the model as a percentage. It is often used as an evaluation index to determine whether a regression model has been well learned. This is similar to the mean absolute error; however, the difference is that it is a probability value derived by dividing the accurate value. Its probability value varying between 0% and 100% renders it easy to interpret the results. Moreover, as the value is associated with the ratio rather than the size of the data value, the performances of various models and data can be easily compared. Conversely, the RMSE is affected by the size of the data figures, rendering an objective evaluation difficult. Therefore, the MAPE can be used by urban gas experts to understand the field better [78].
M A P E = 100 n i = 1 n y i y i ~ y i

3.4.3. R2

As the values differ for each prediction model, evaluating the performance by considering only the absolute value is difficult. R2 denotes the ratio of the variance of the predicted value to that of the actual value; therefore, the comparison becomes easy as it indicates relative performance. If the R2 value is close to 1, the model explains the data well; if the R2 value is close to 0, the model does not explain the data well [46].
R 2 = 1 S S RES S S TOT = 1 y i y i ^ 2 y i y ¯ 2

3.5. Synthetic Data through Simulation

This study analyzed 6 prediction models using a total of 4 data using the original data and 3 synthetic data created through simulation. Through the simulation, the data at the time of assuming that there was no data due to reasons such as a defect in the recording device, server instability, and operator error were generated based on the original data under each synthetic data generation environment. In this simulation environment, a data set that followed a normal distribution was created when the average and standard deviation of the 30 data immediately before the time to be predicted from the original data averaged×2%, 3.5%, and 5%, respectively. Each data set consisted of 43,380 gas pressure data, and 30 such data sets were created, averaged, and analyzed using them in 6 prediction models. Table 3 lists the variables used for generating the synthetic data for the simulation analysis.

4. Results

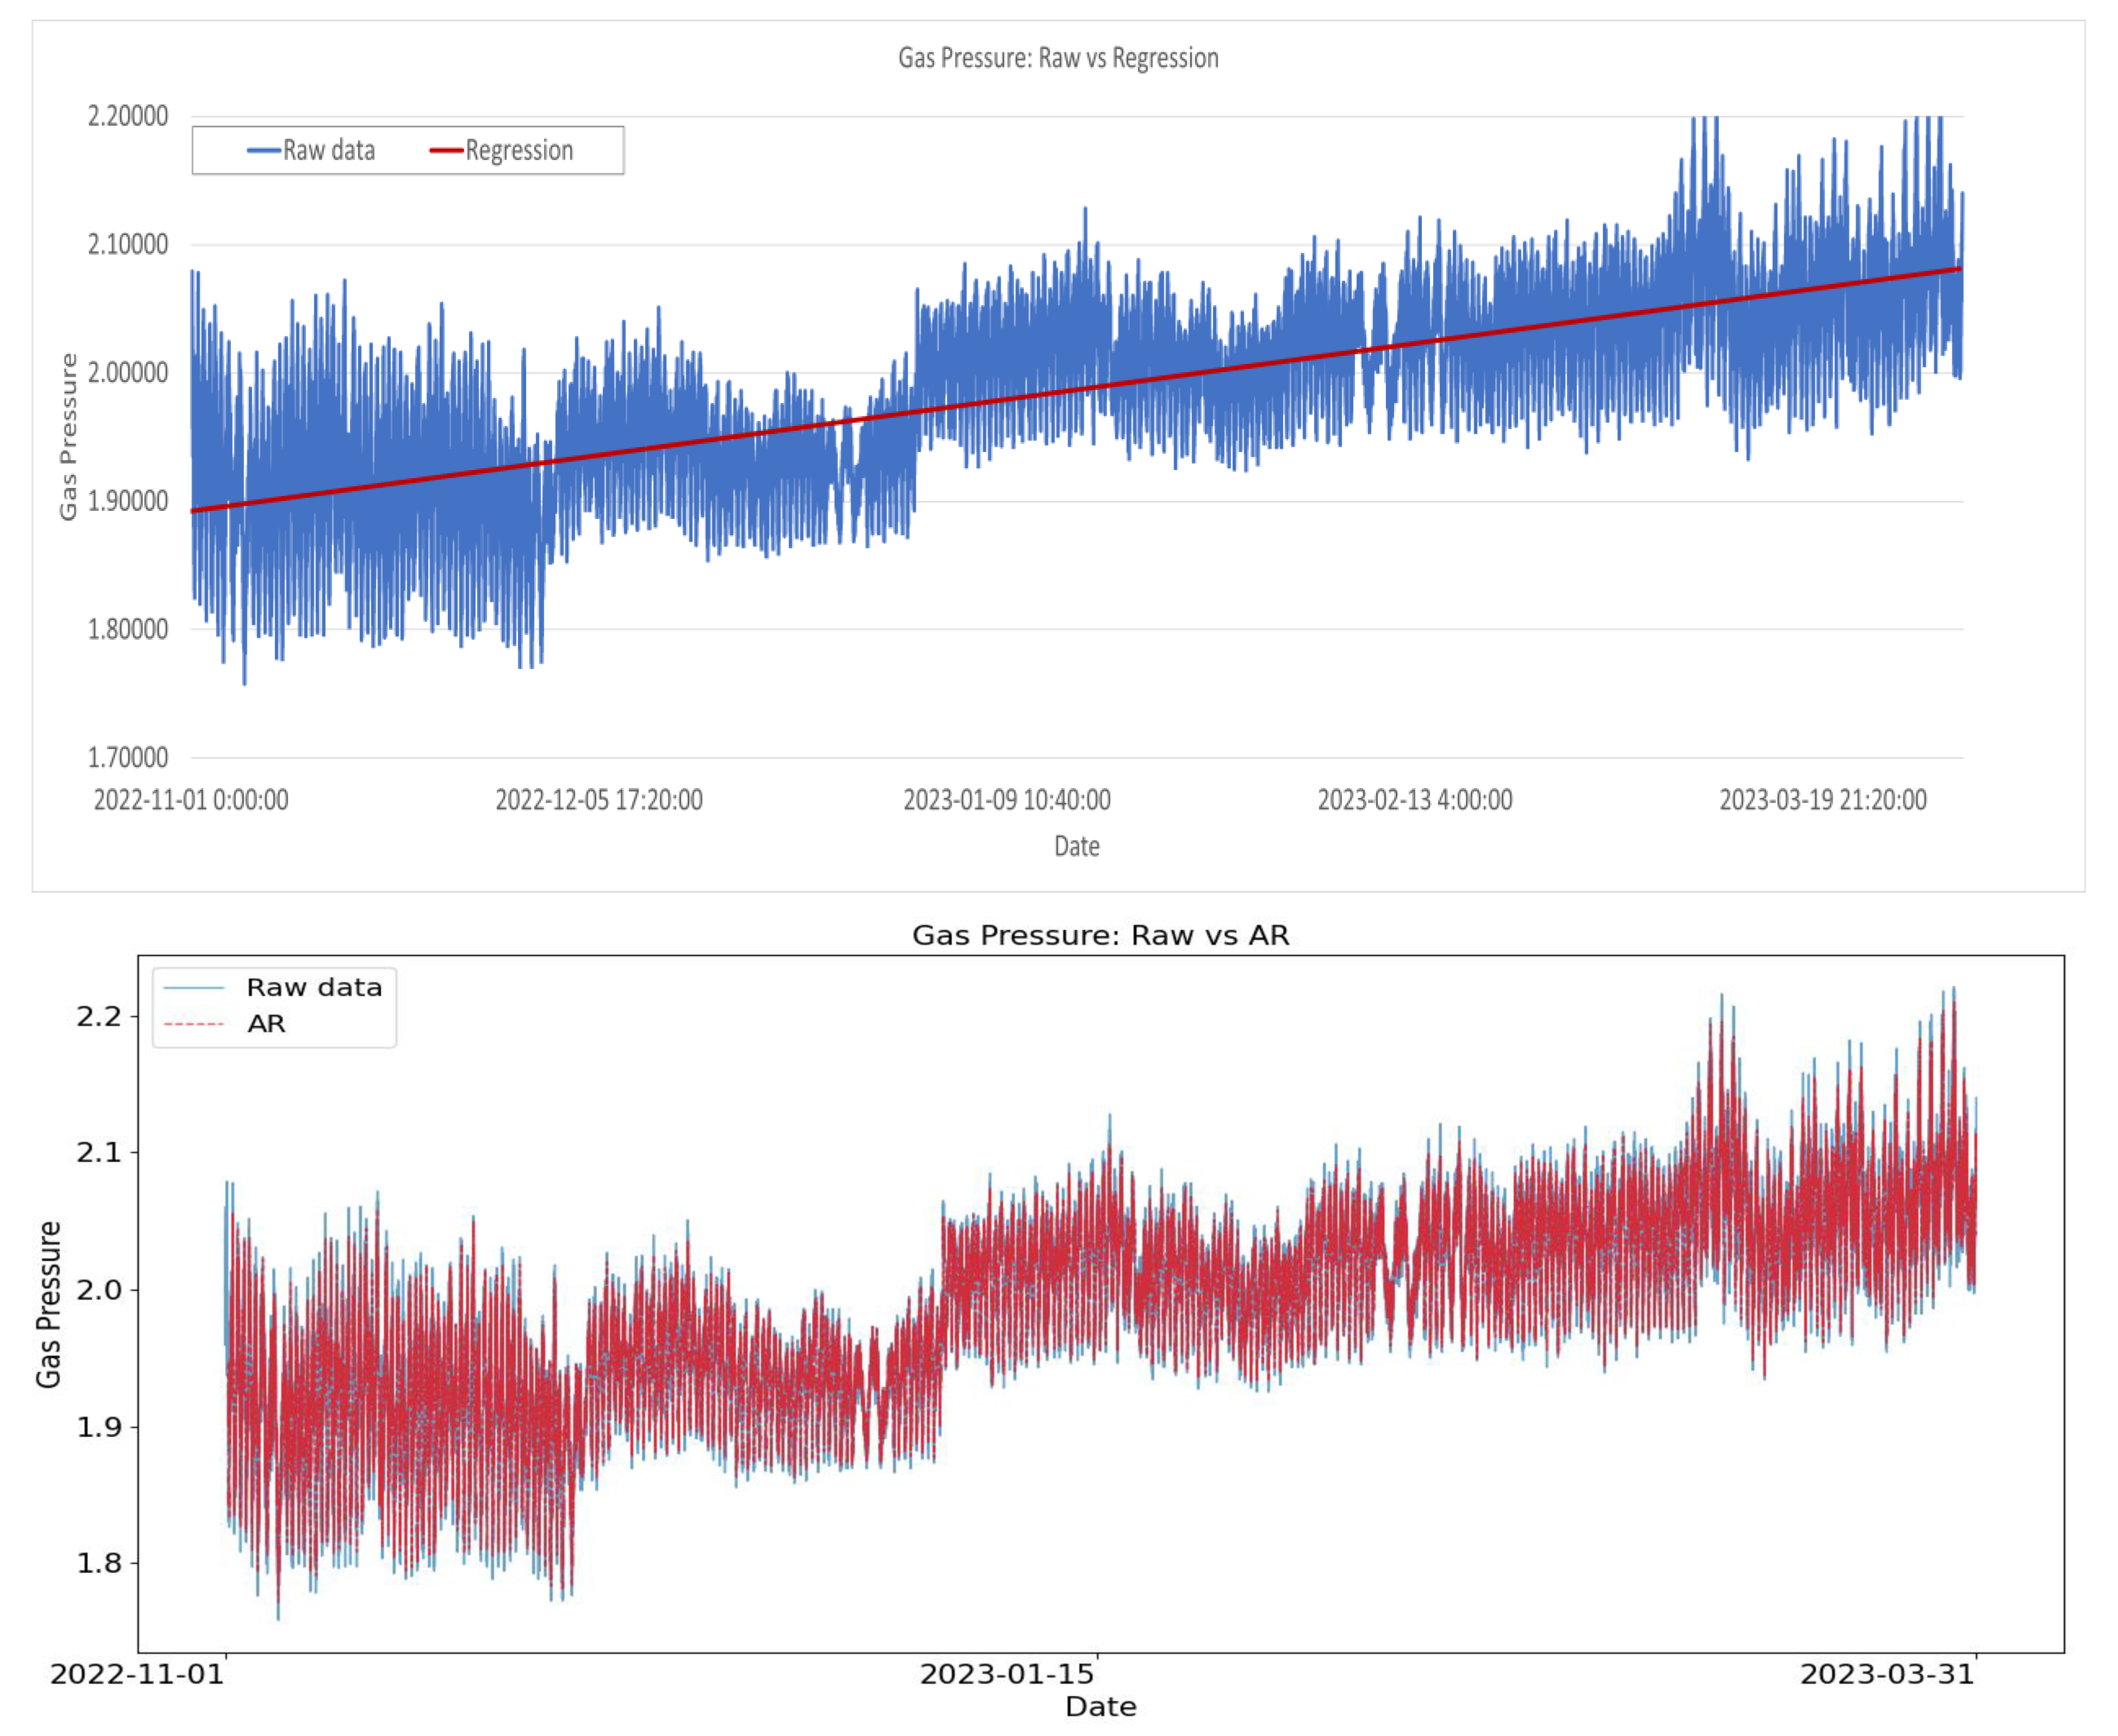
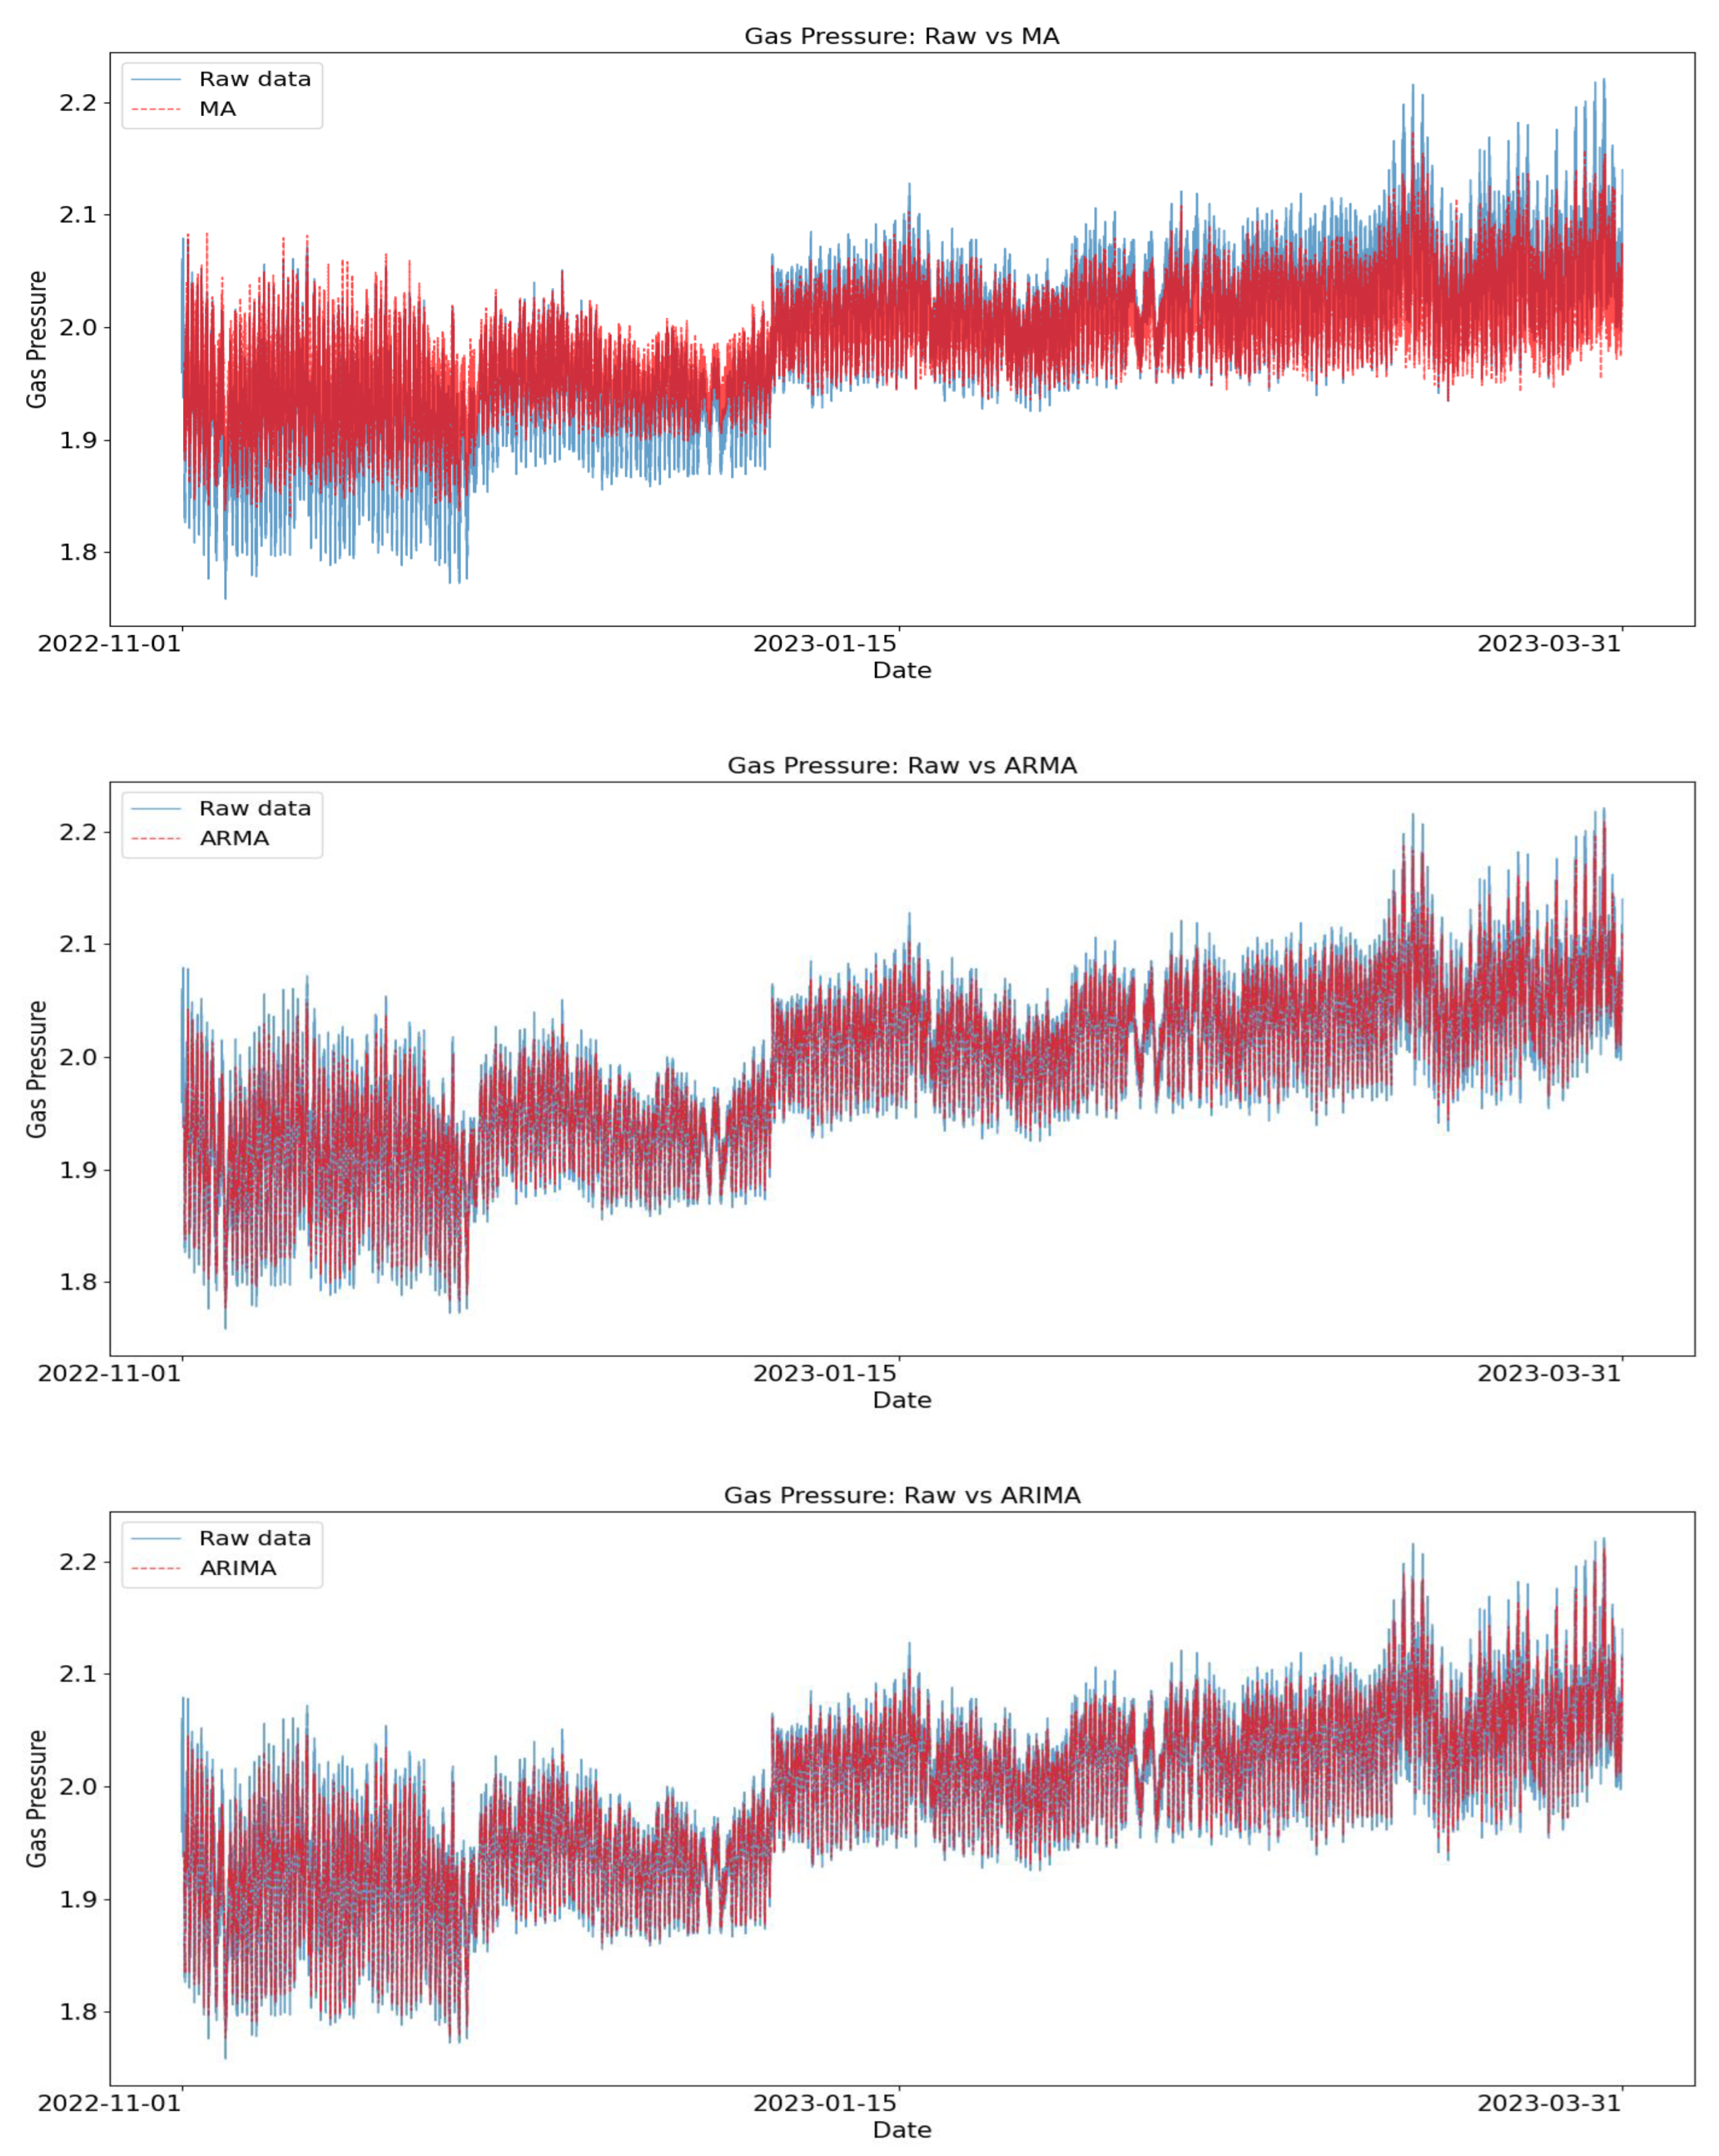
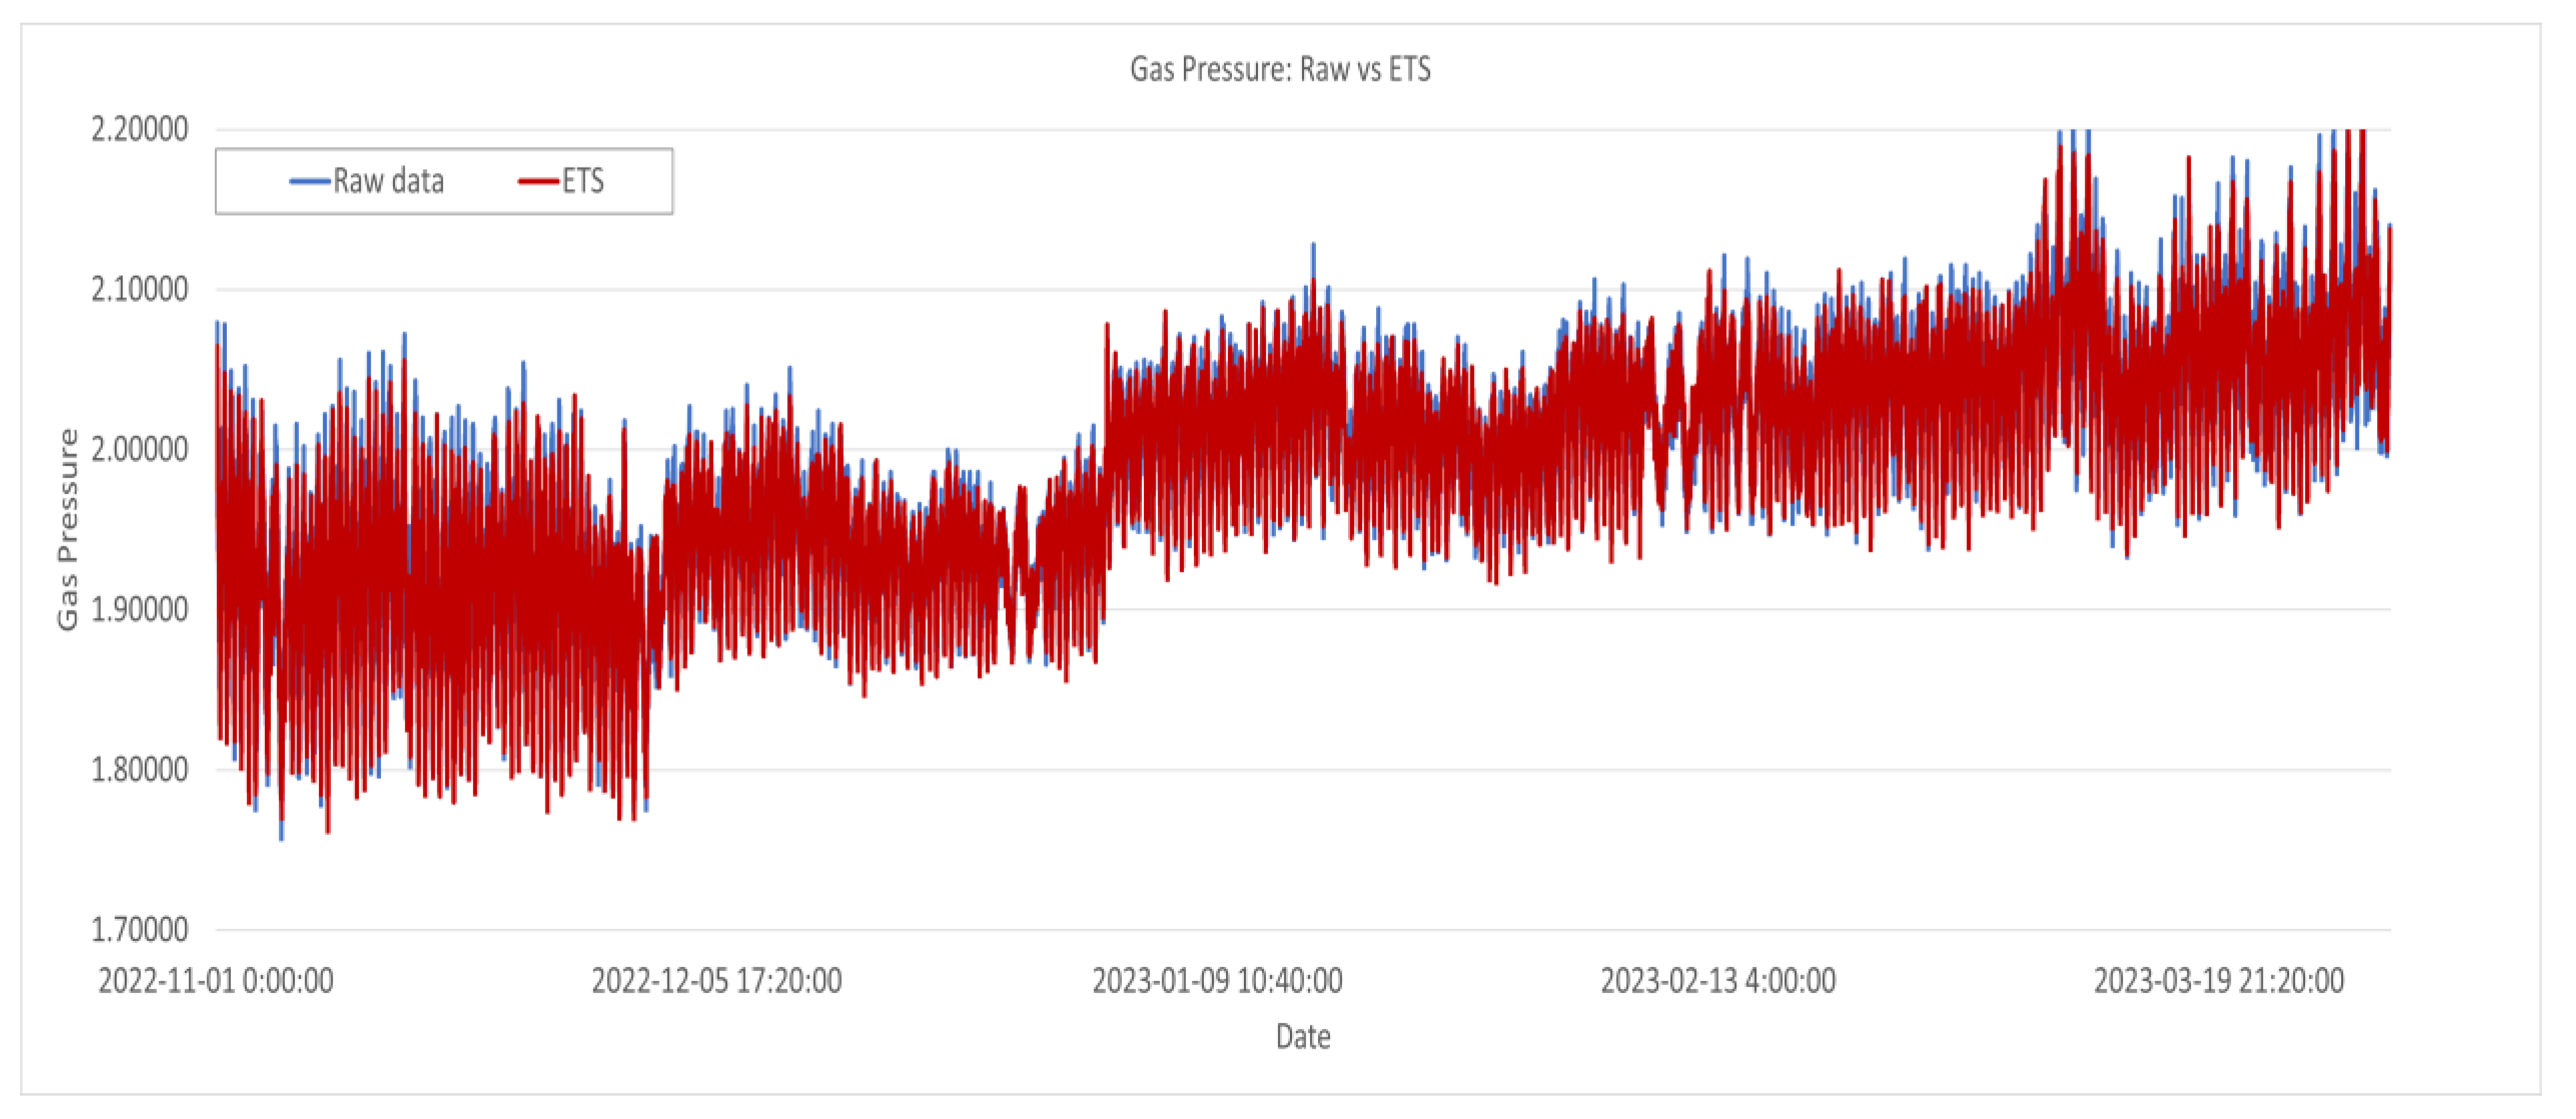
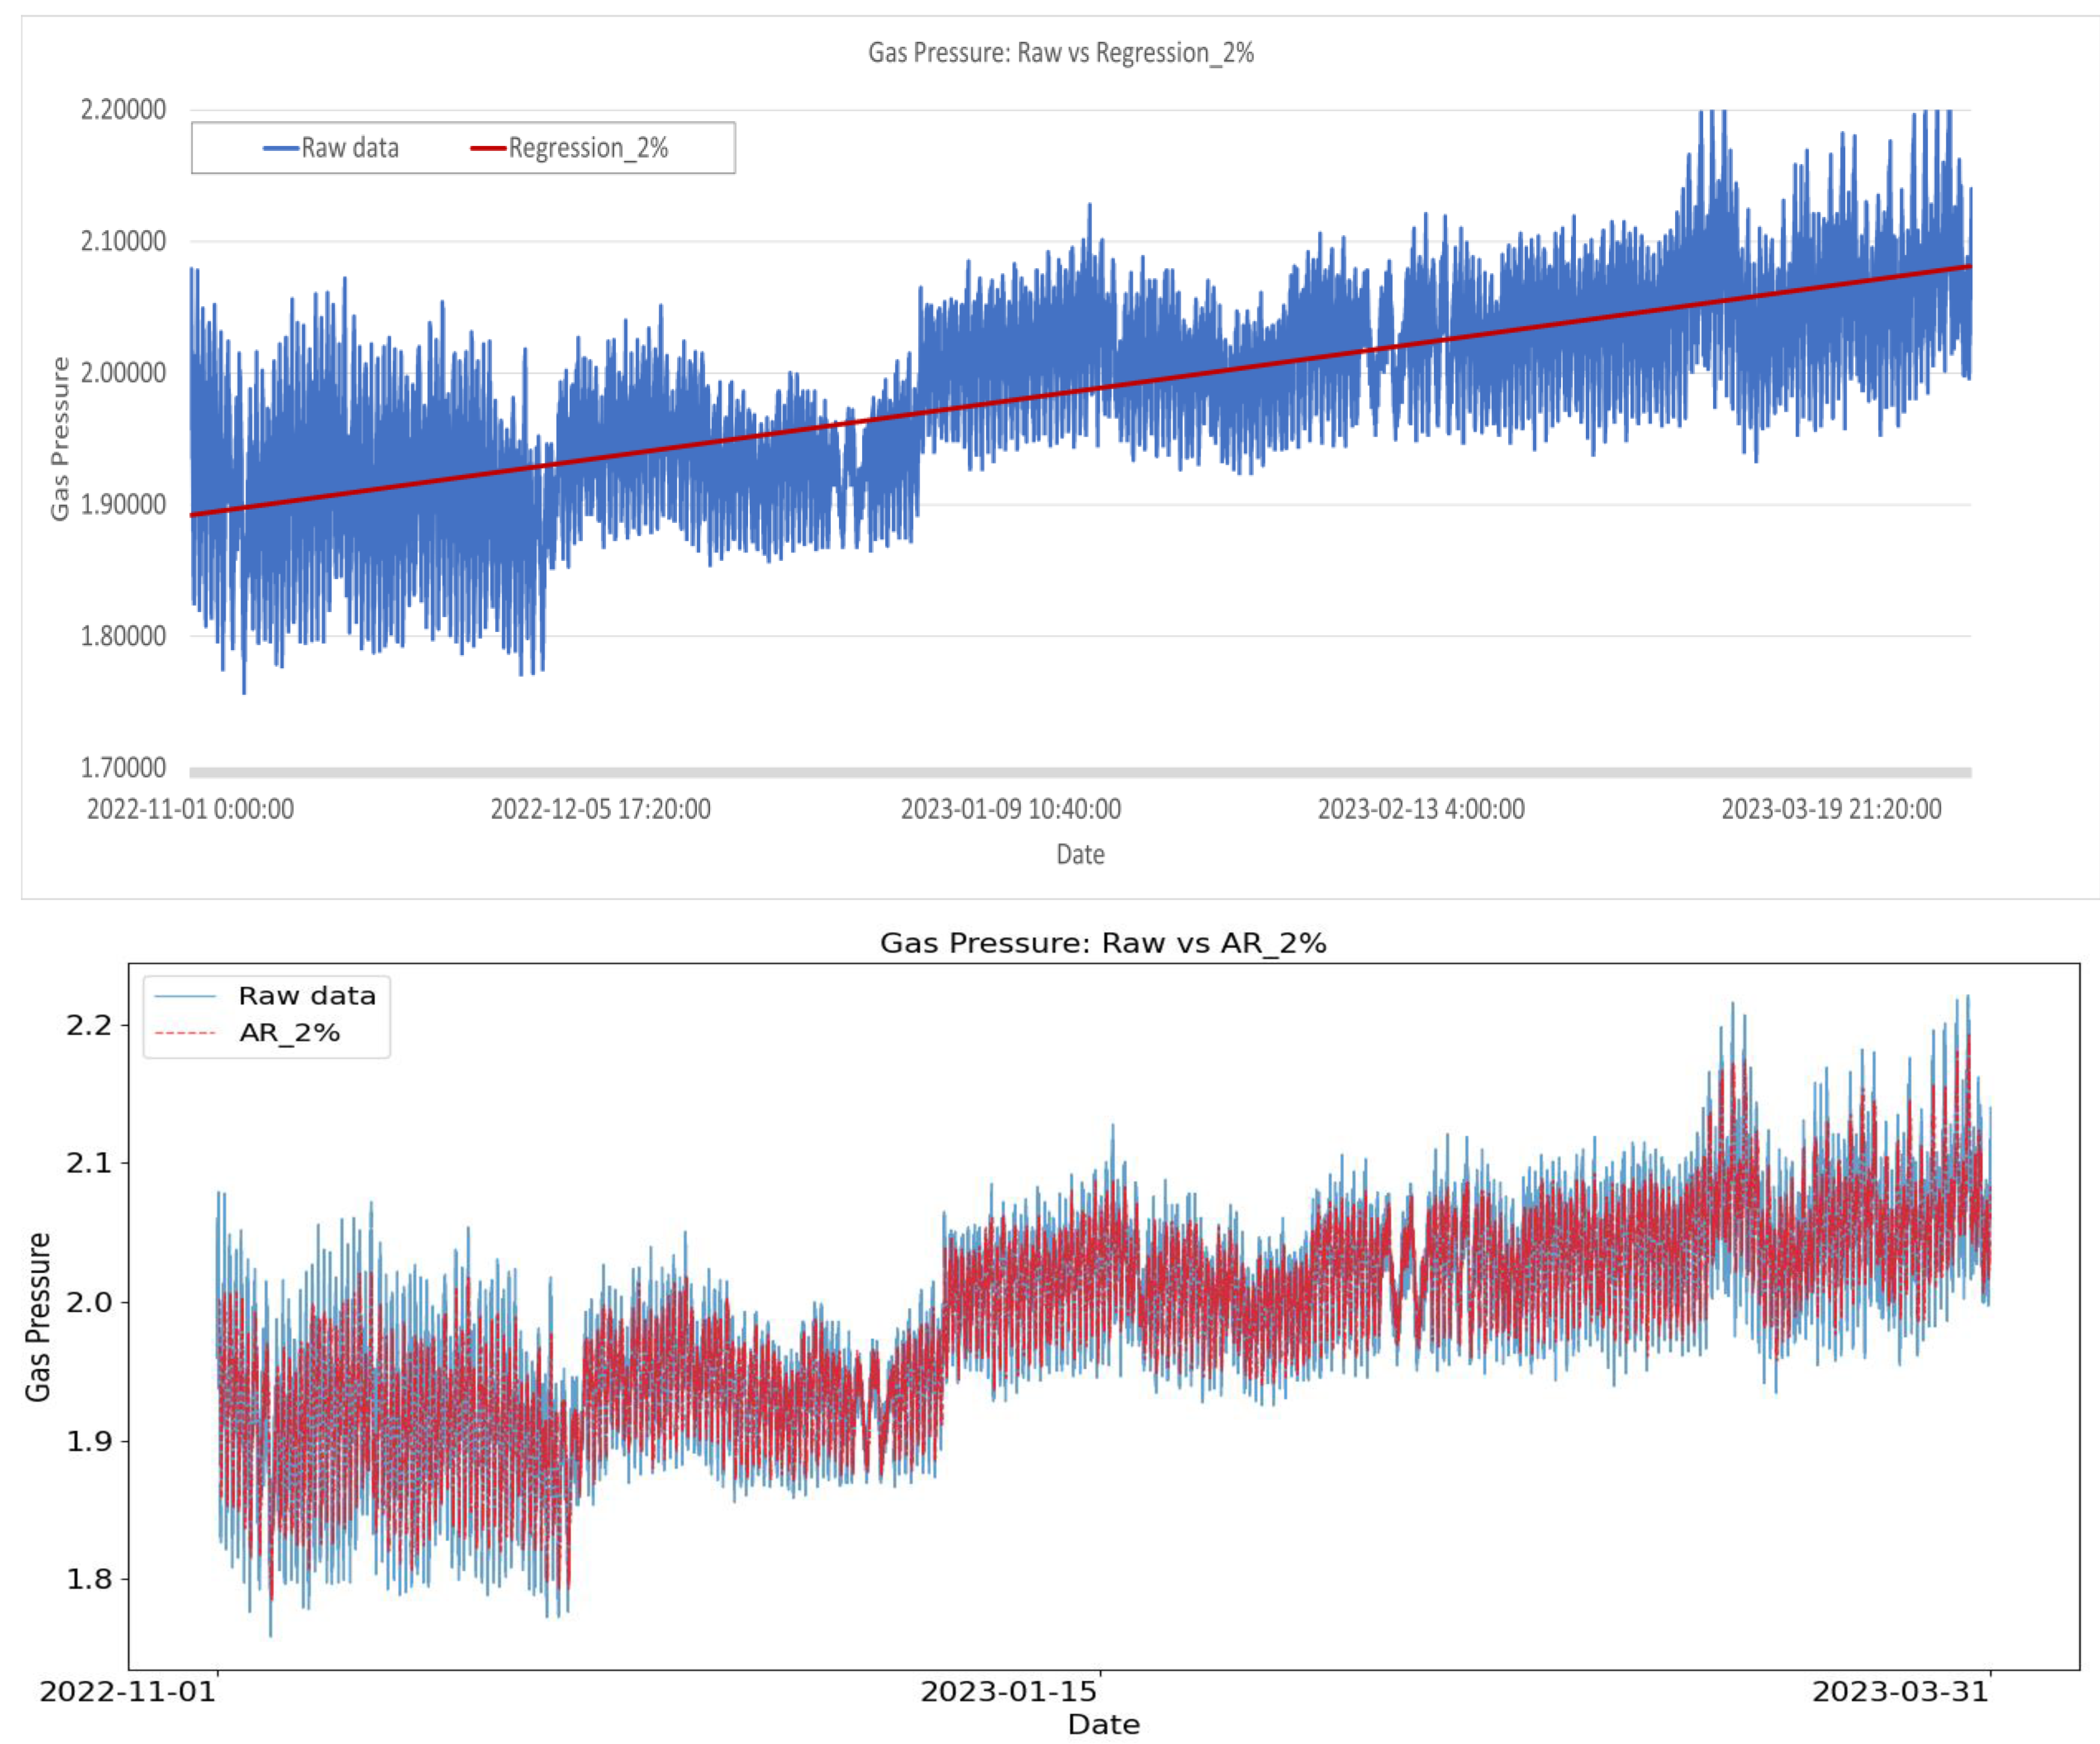
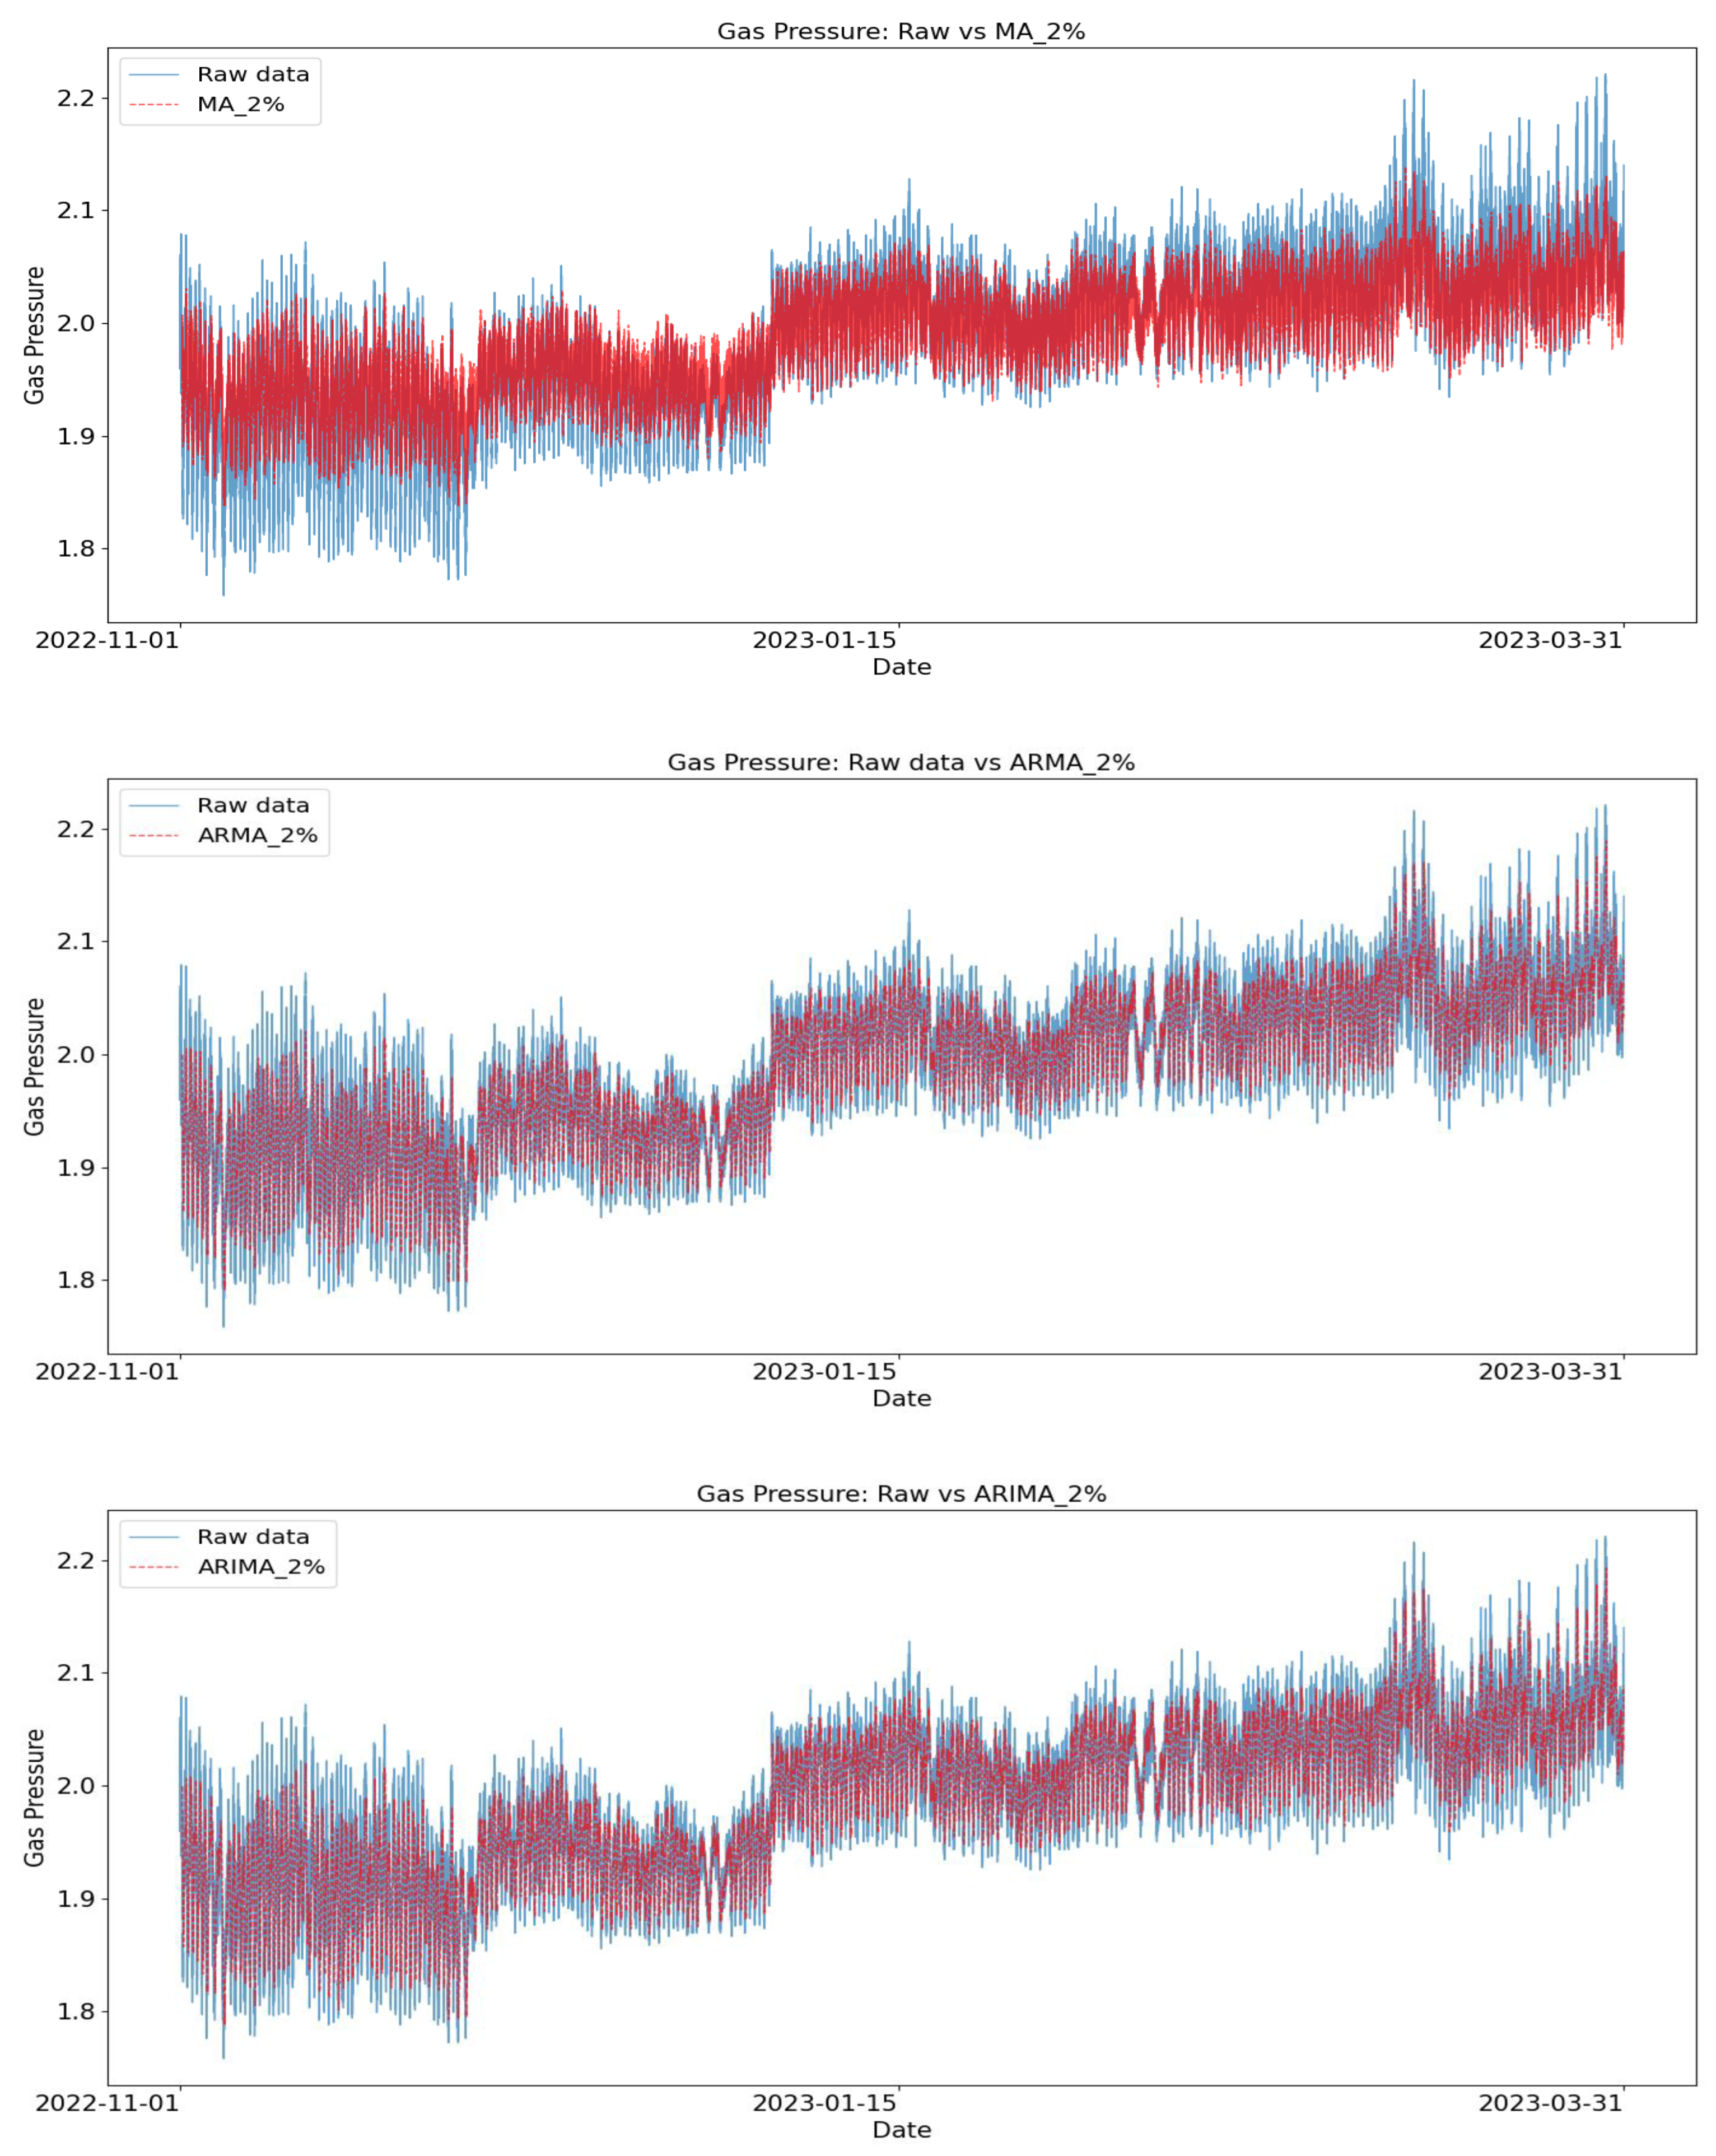
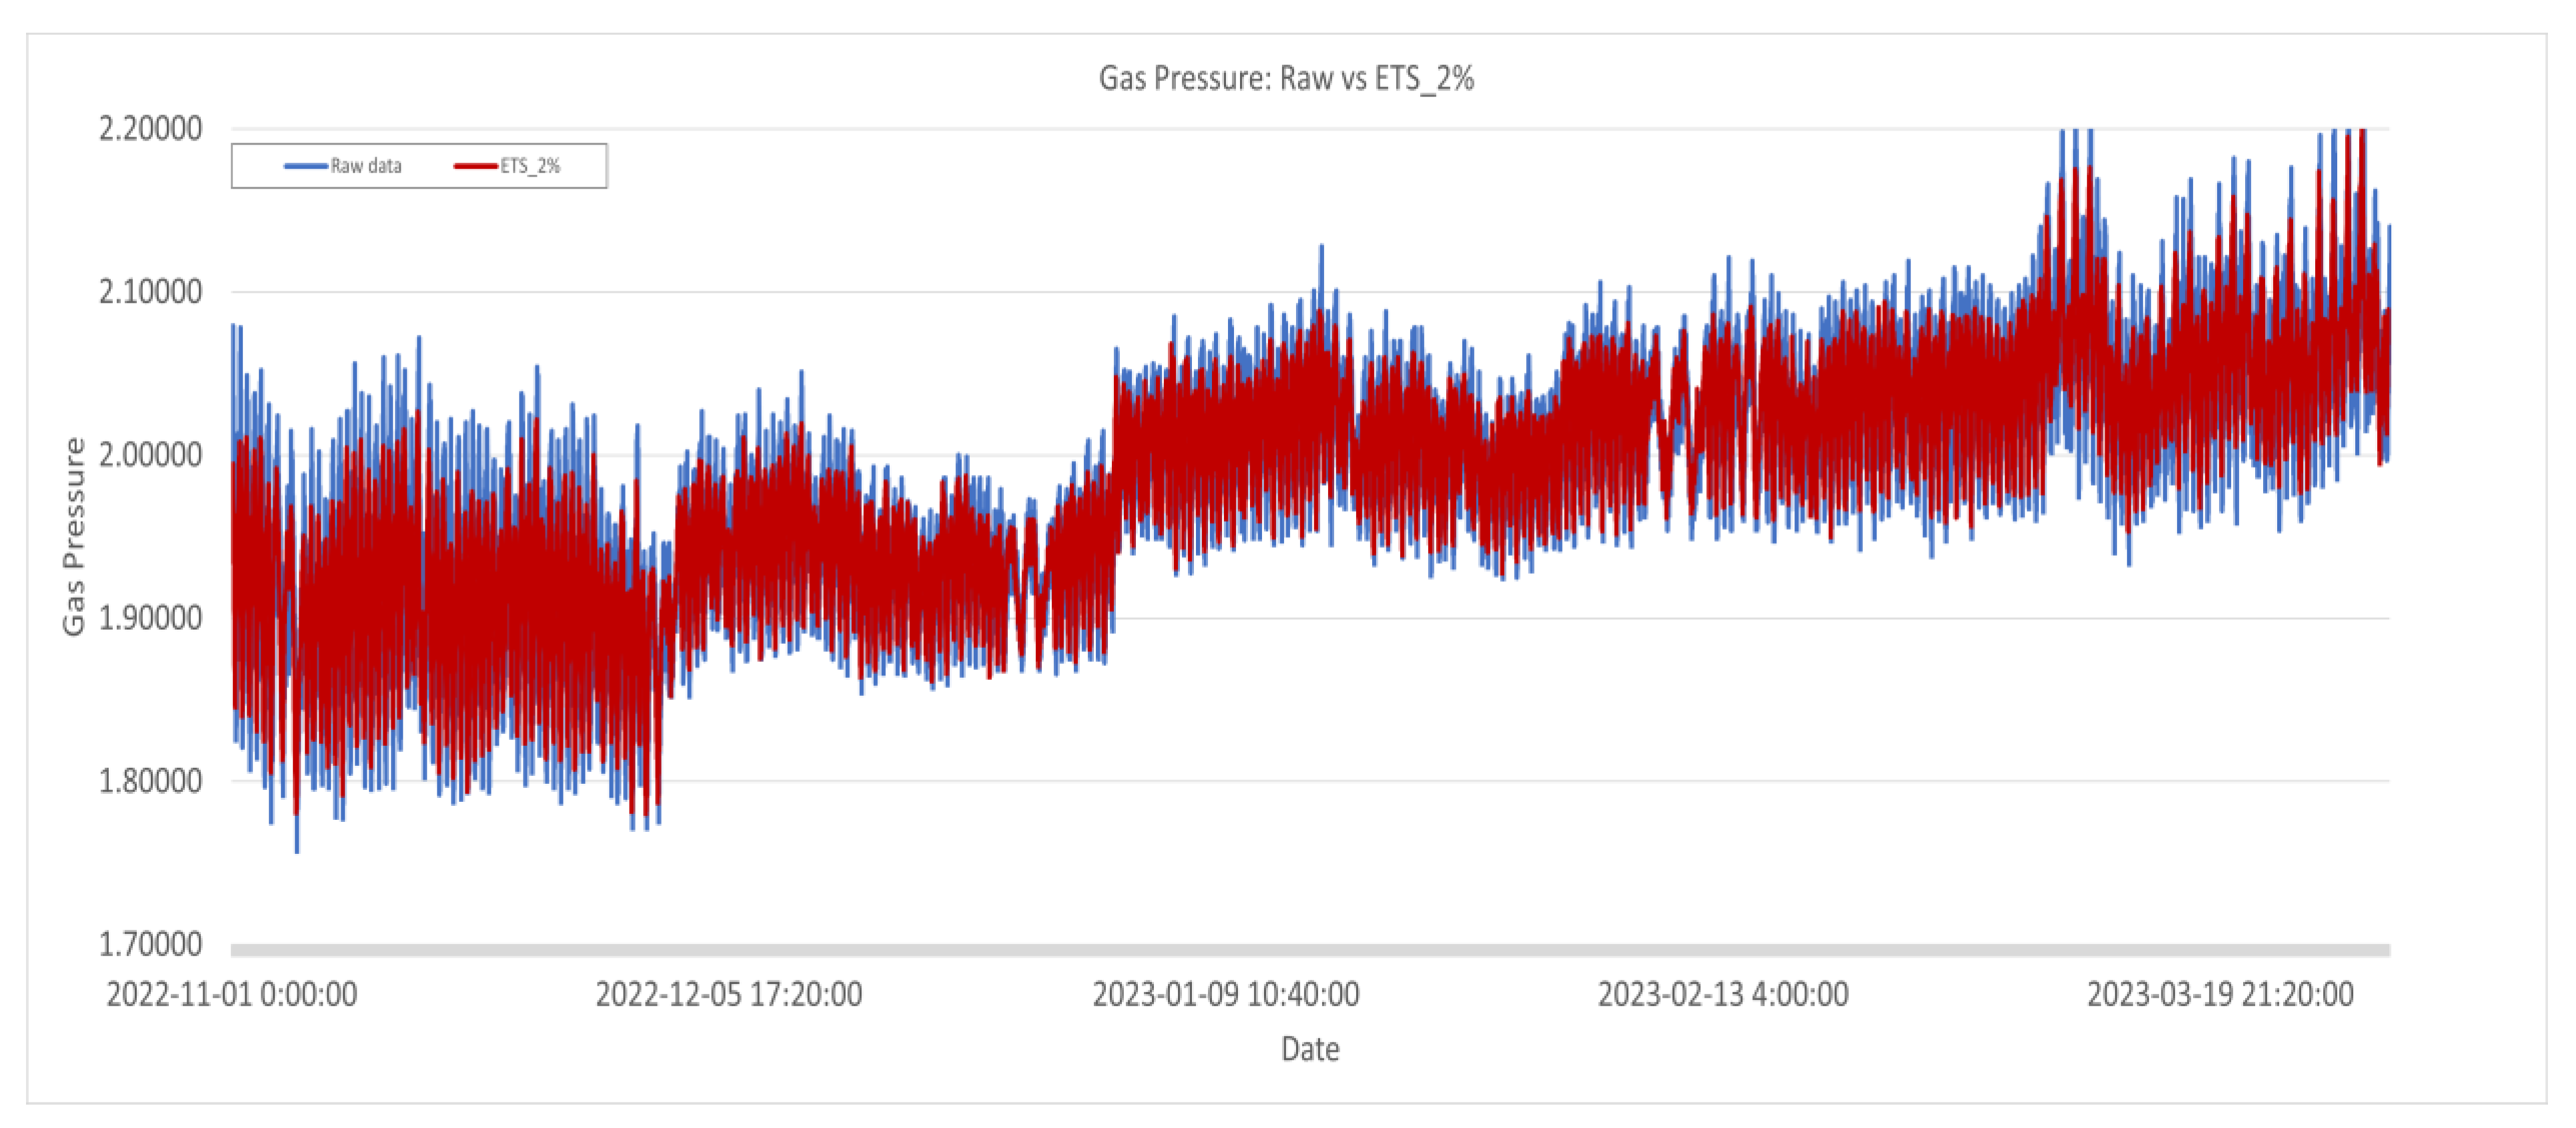
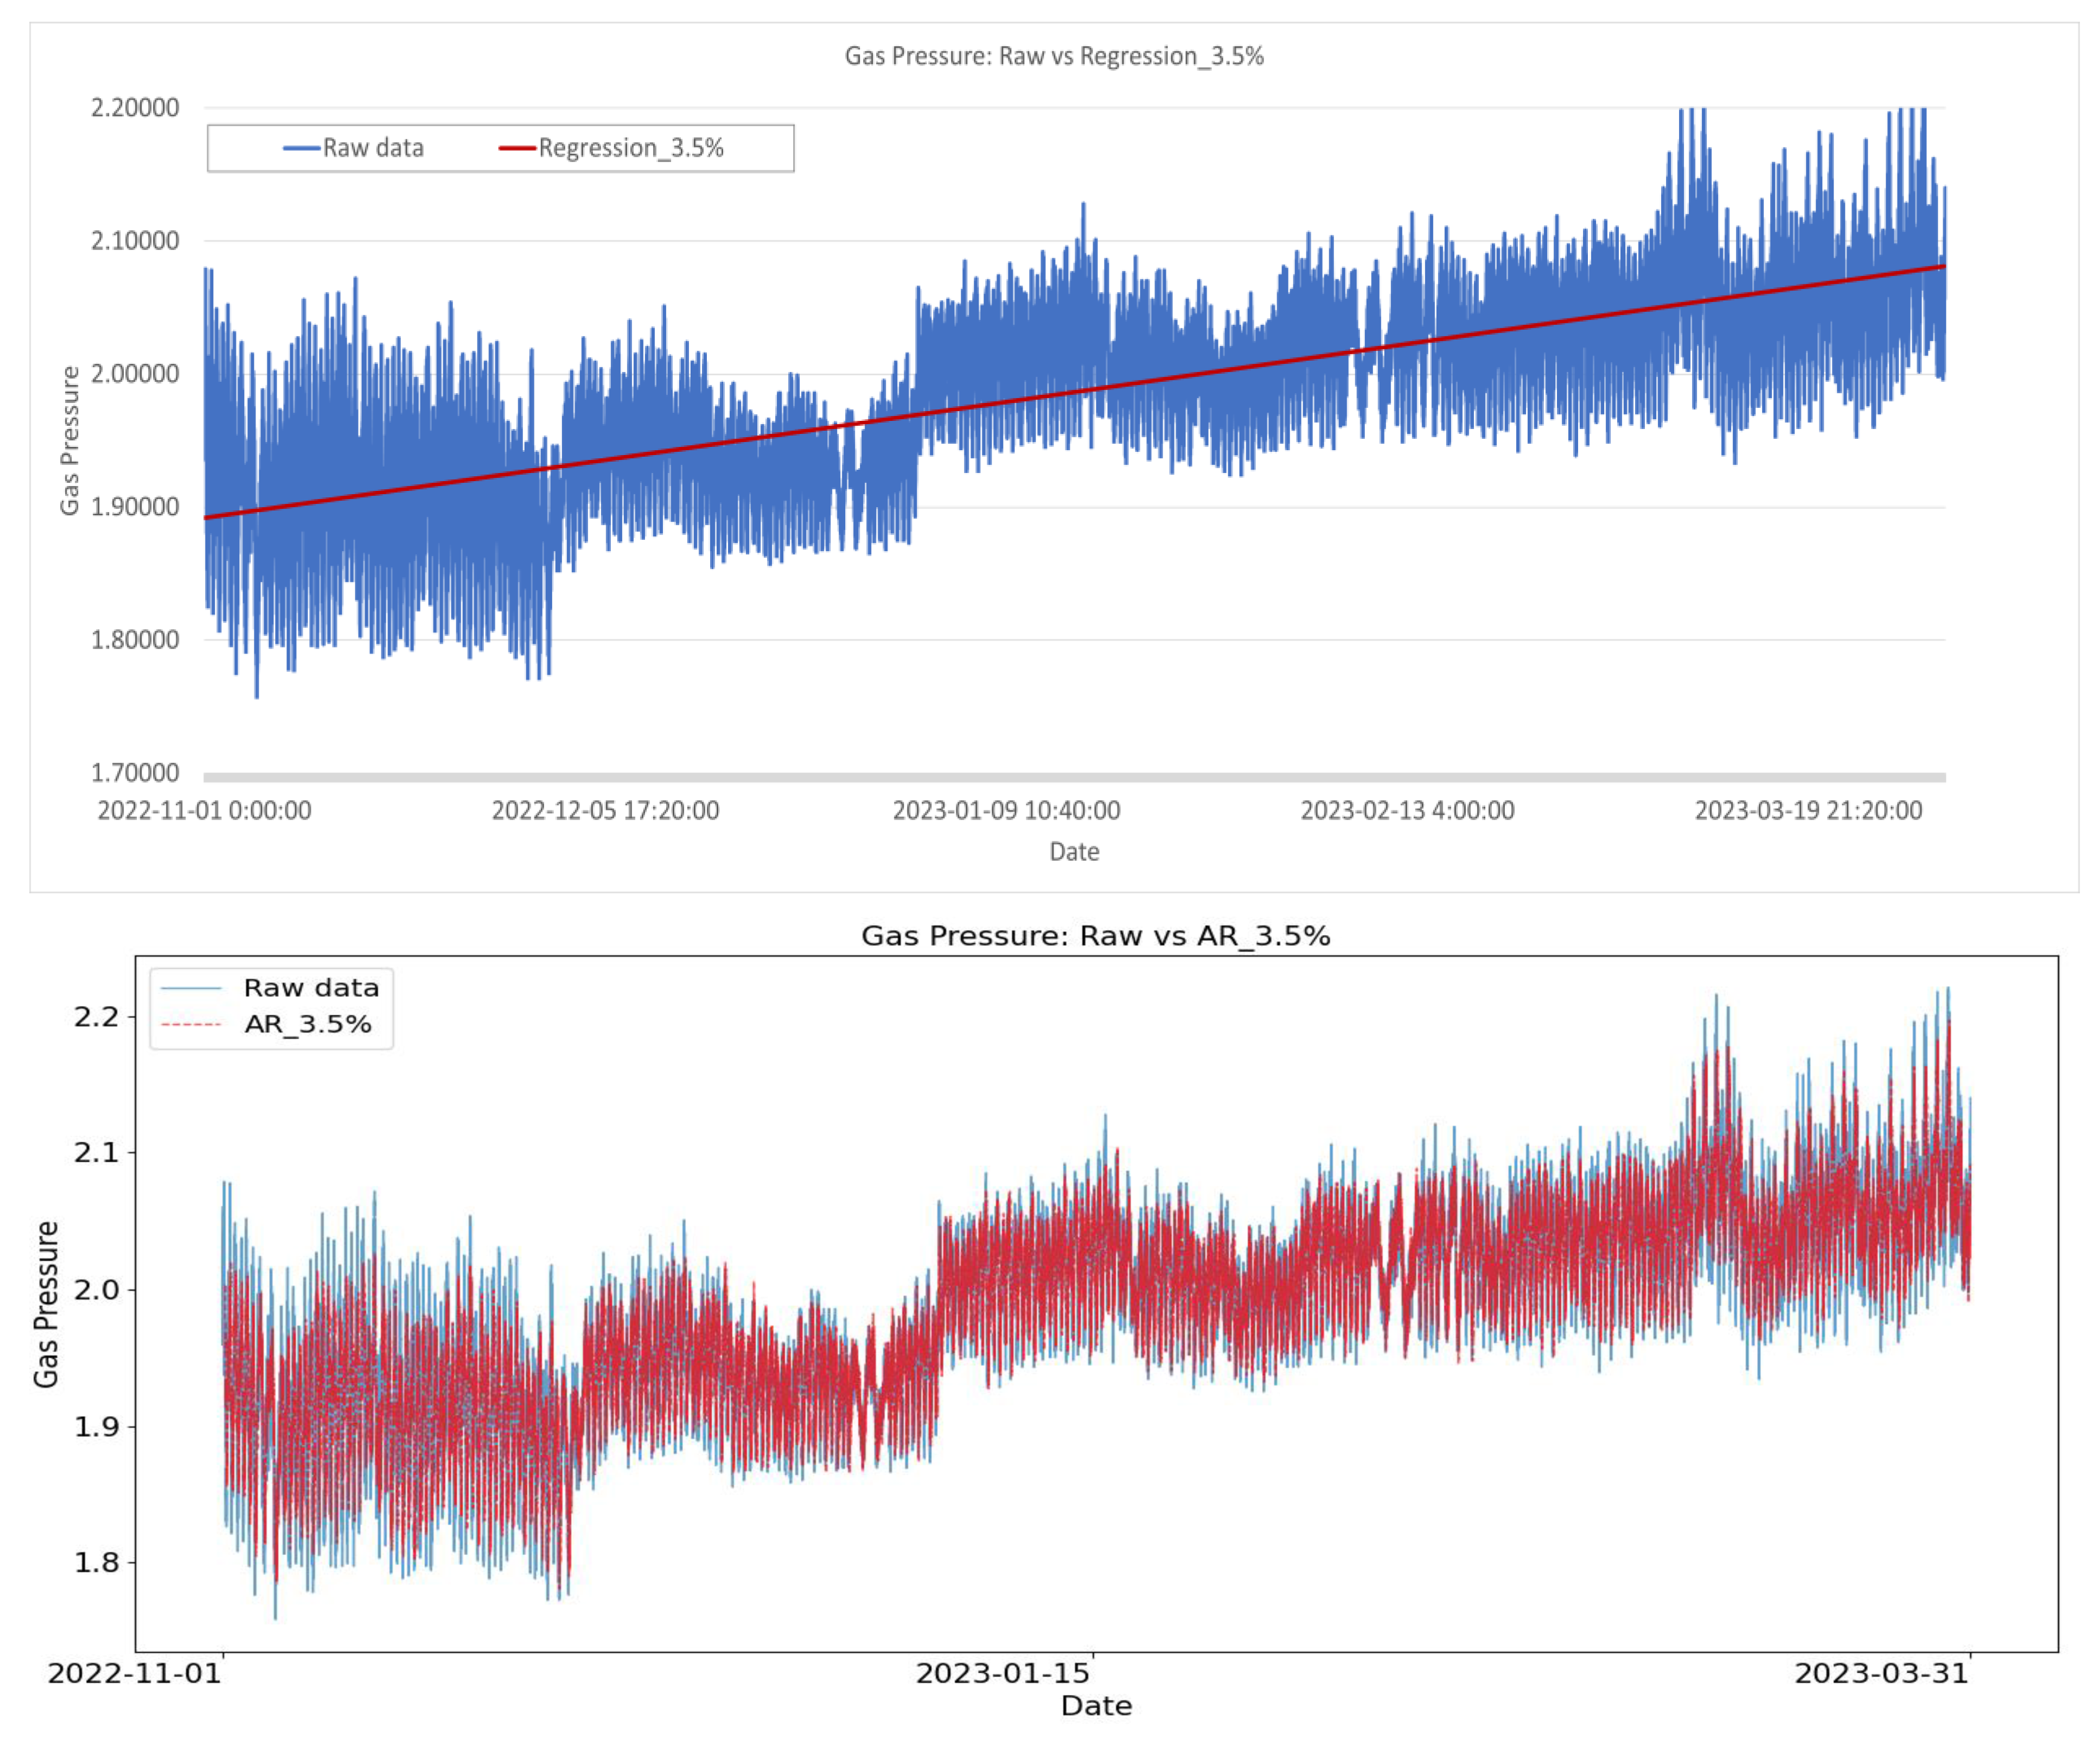
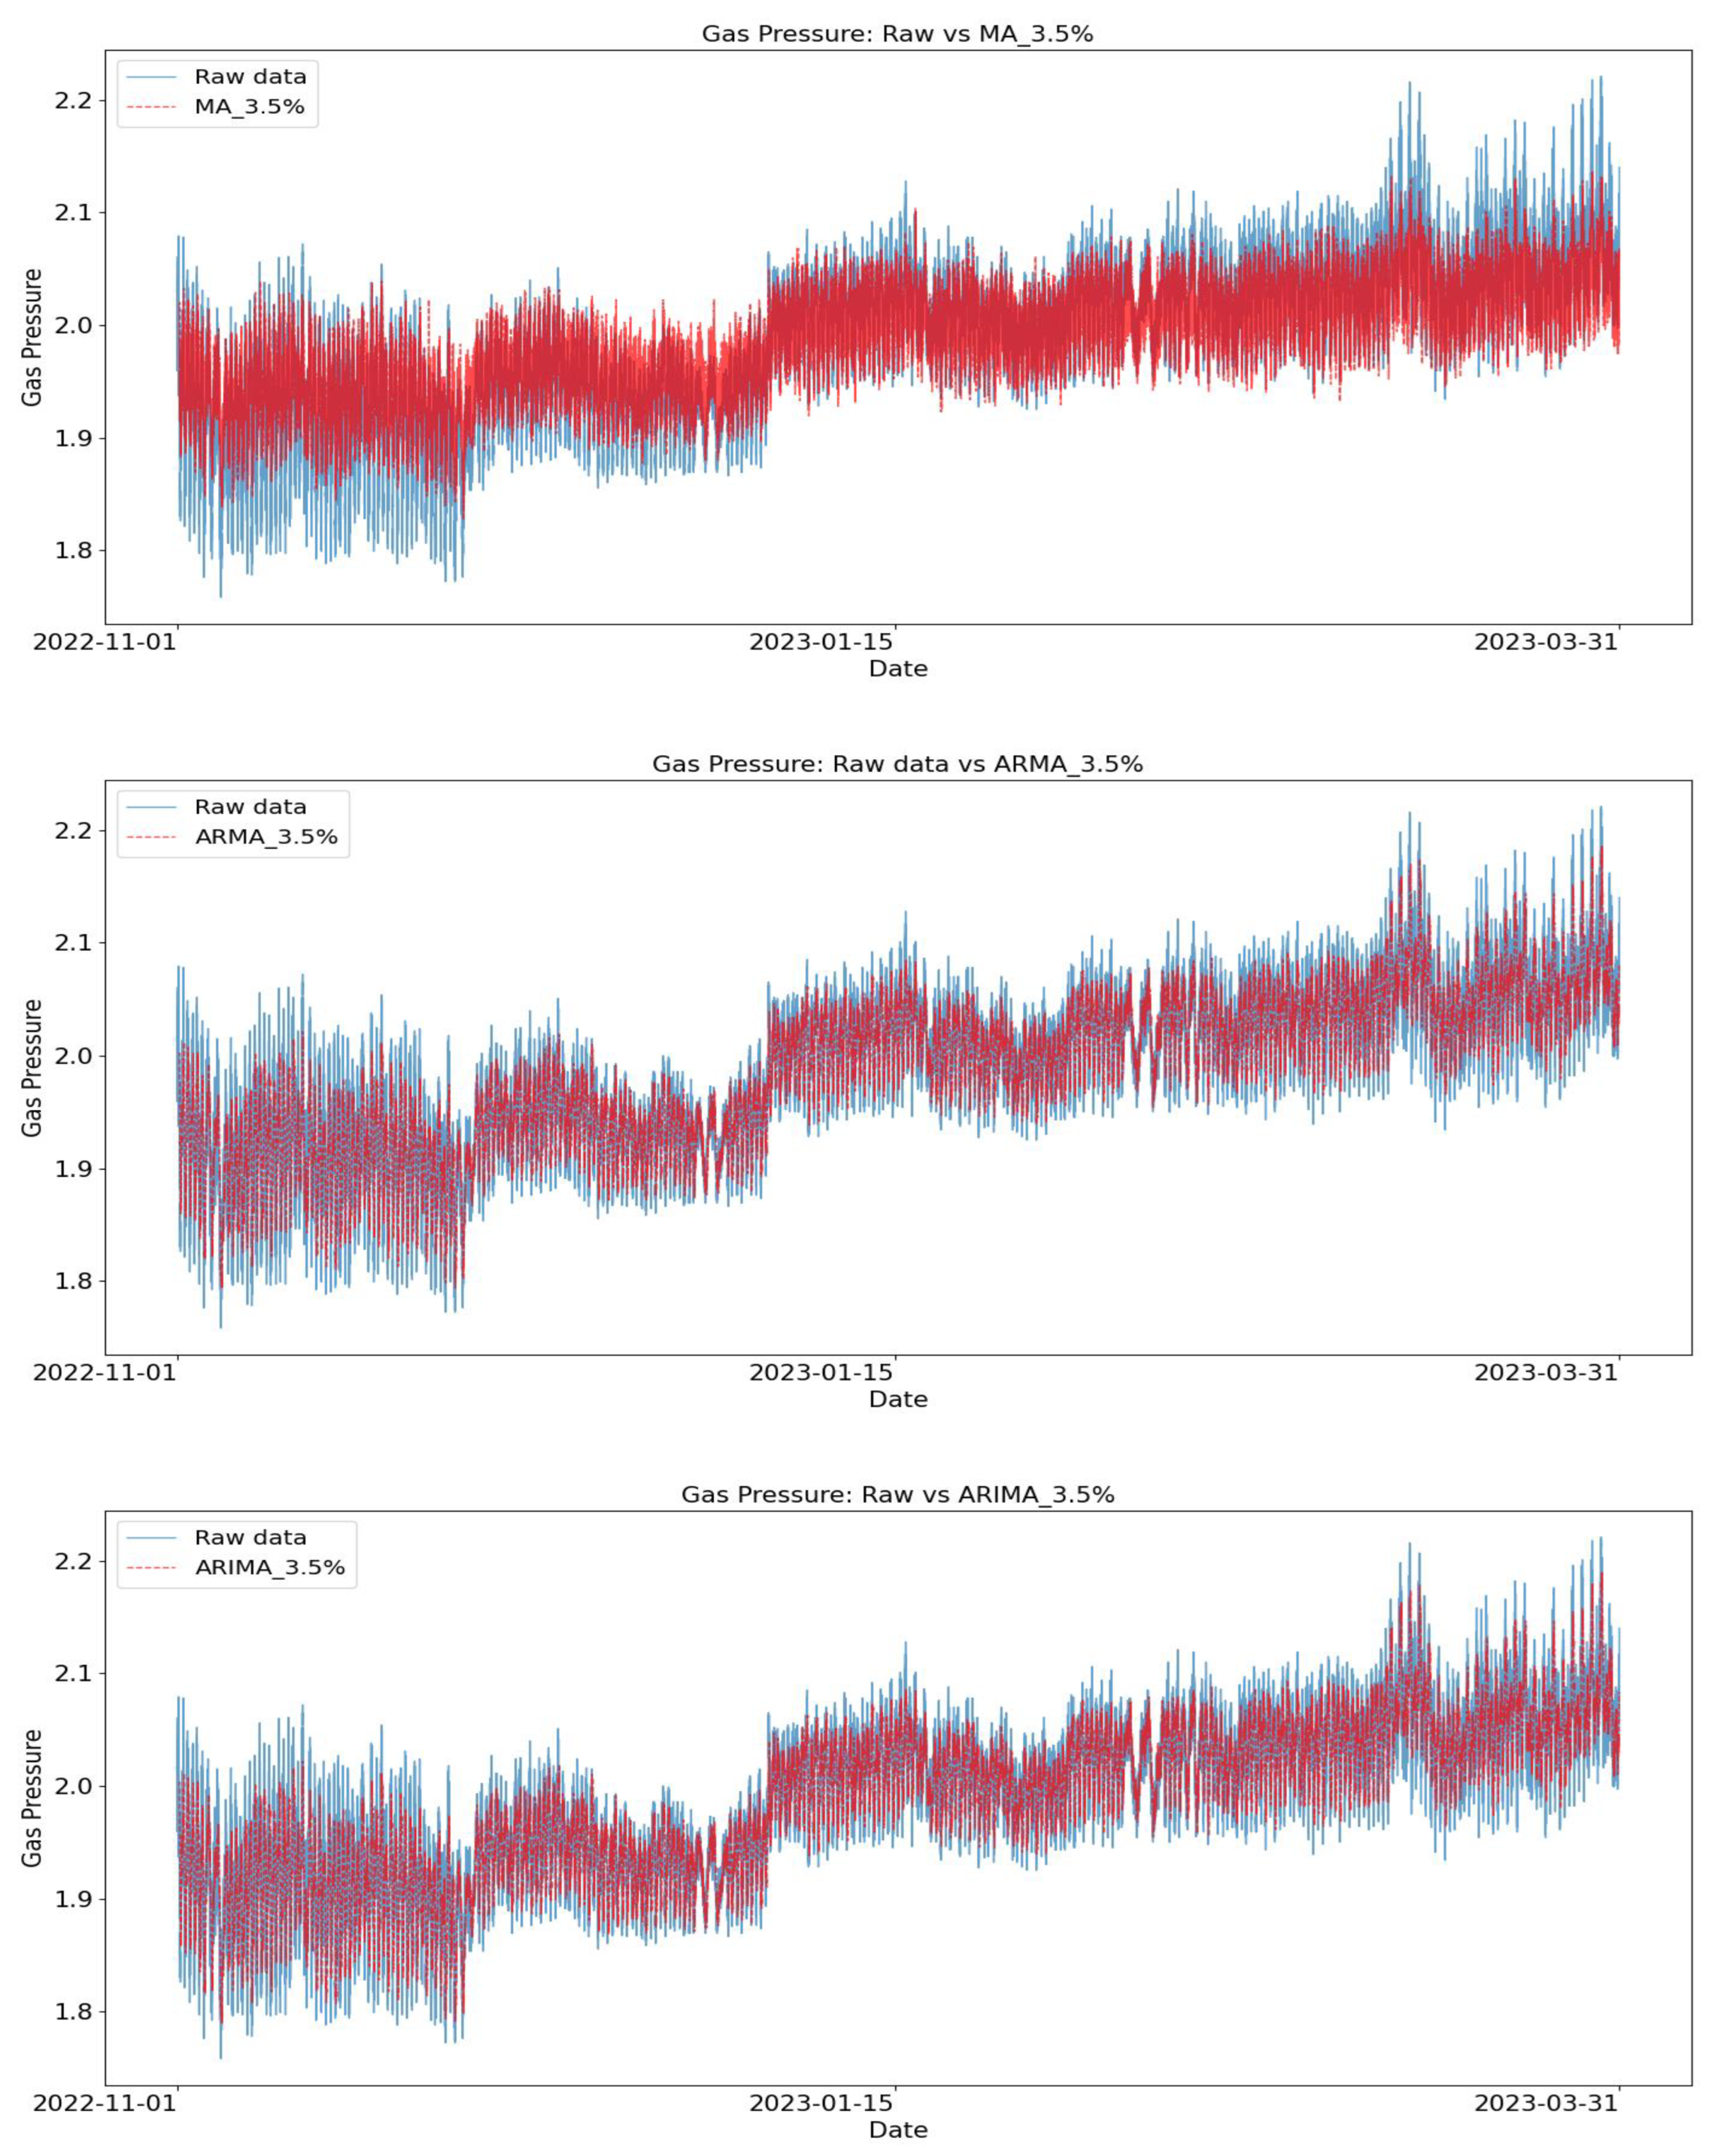
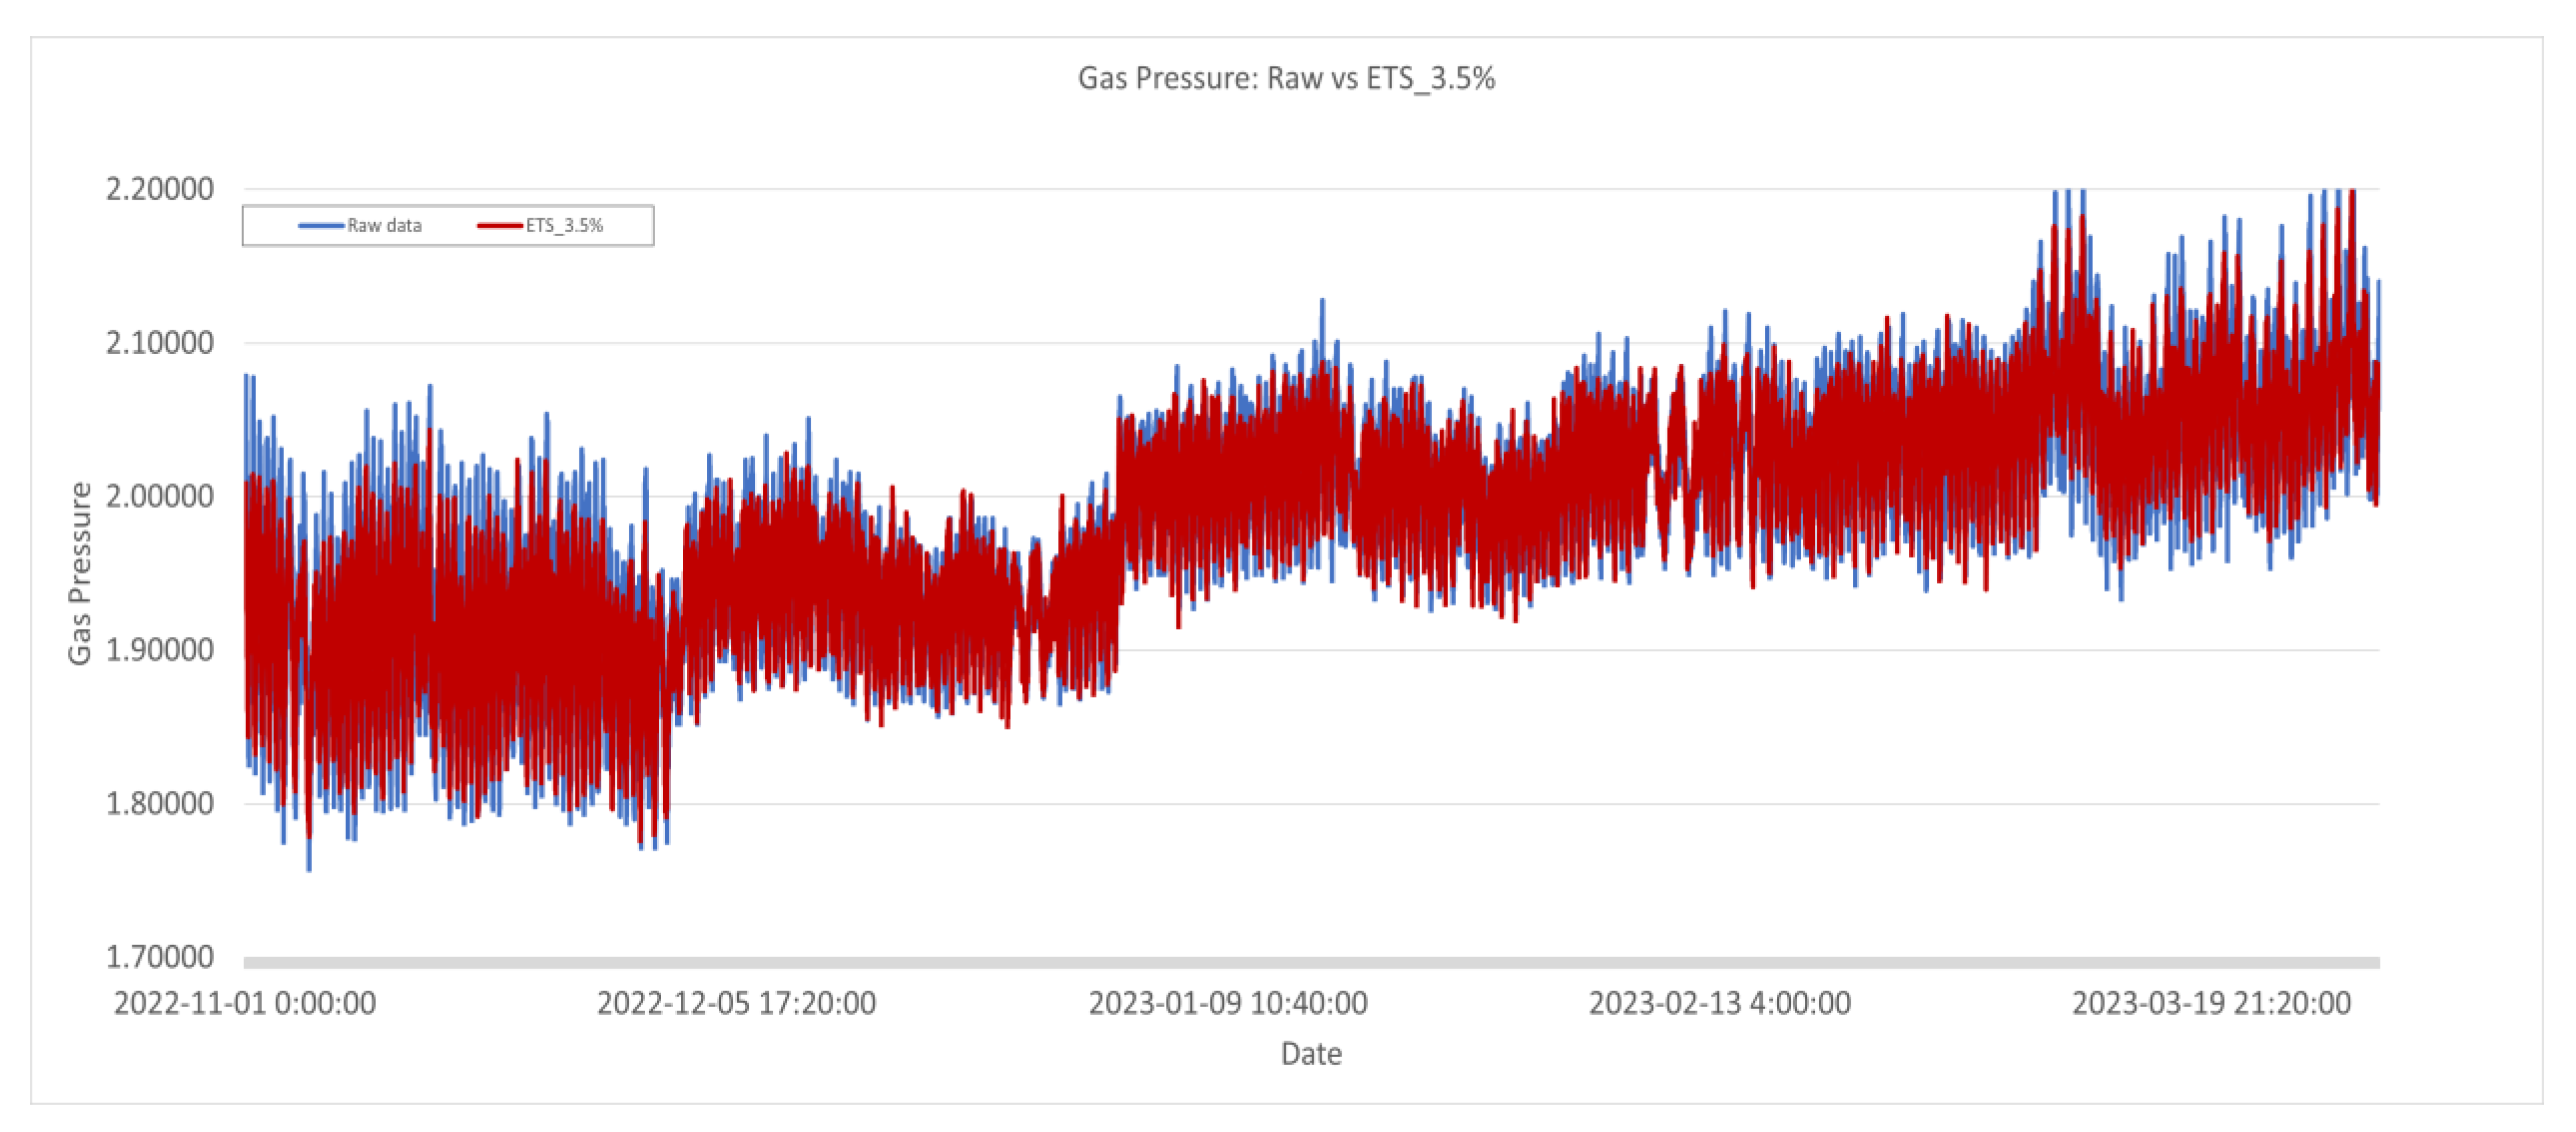
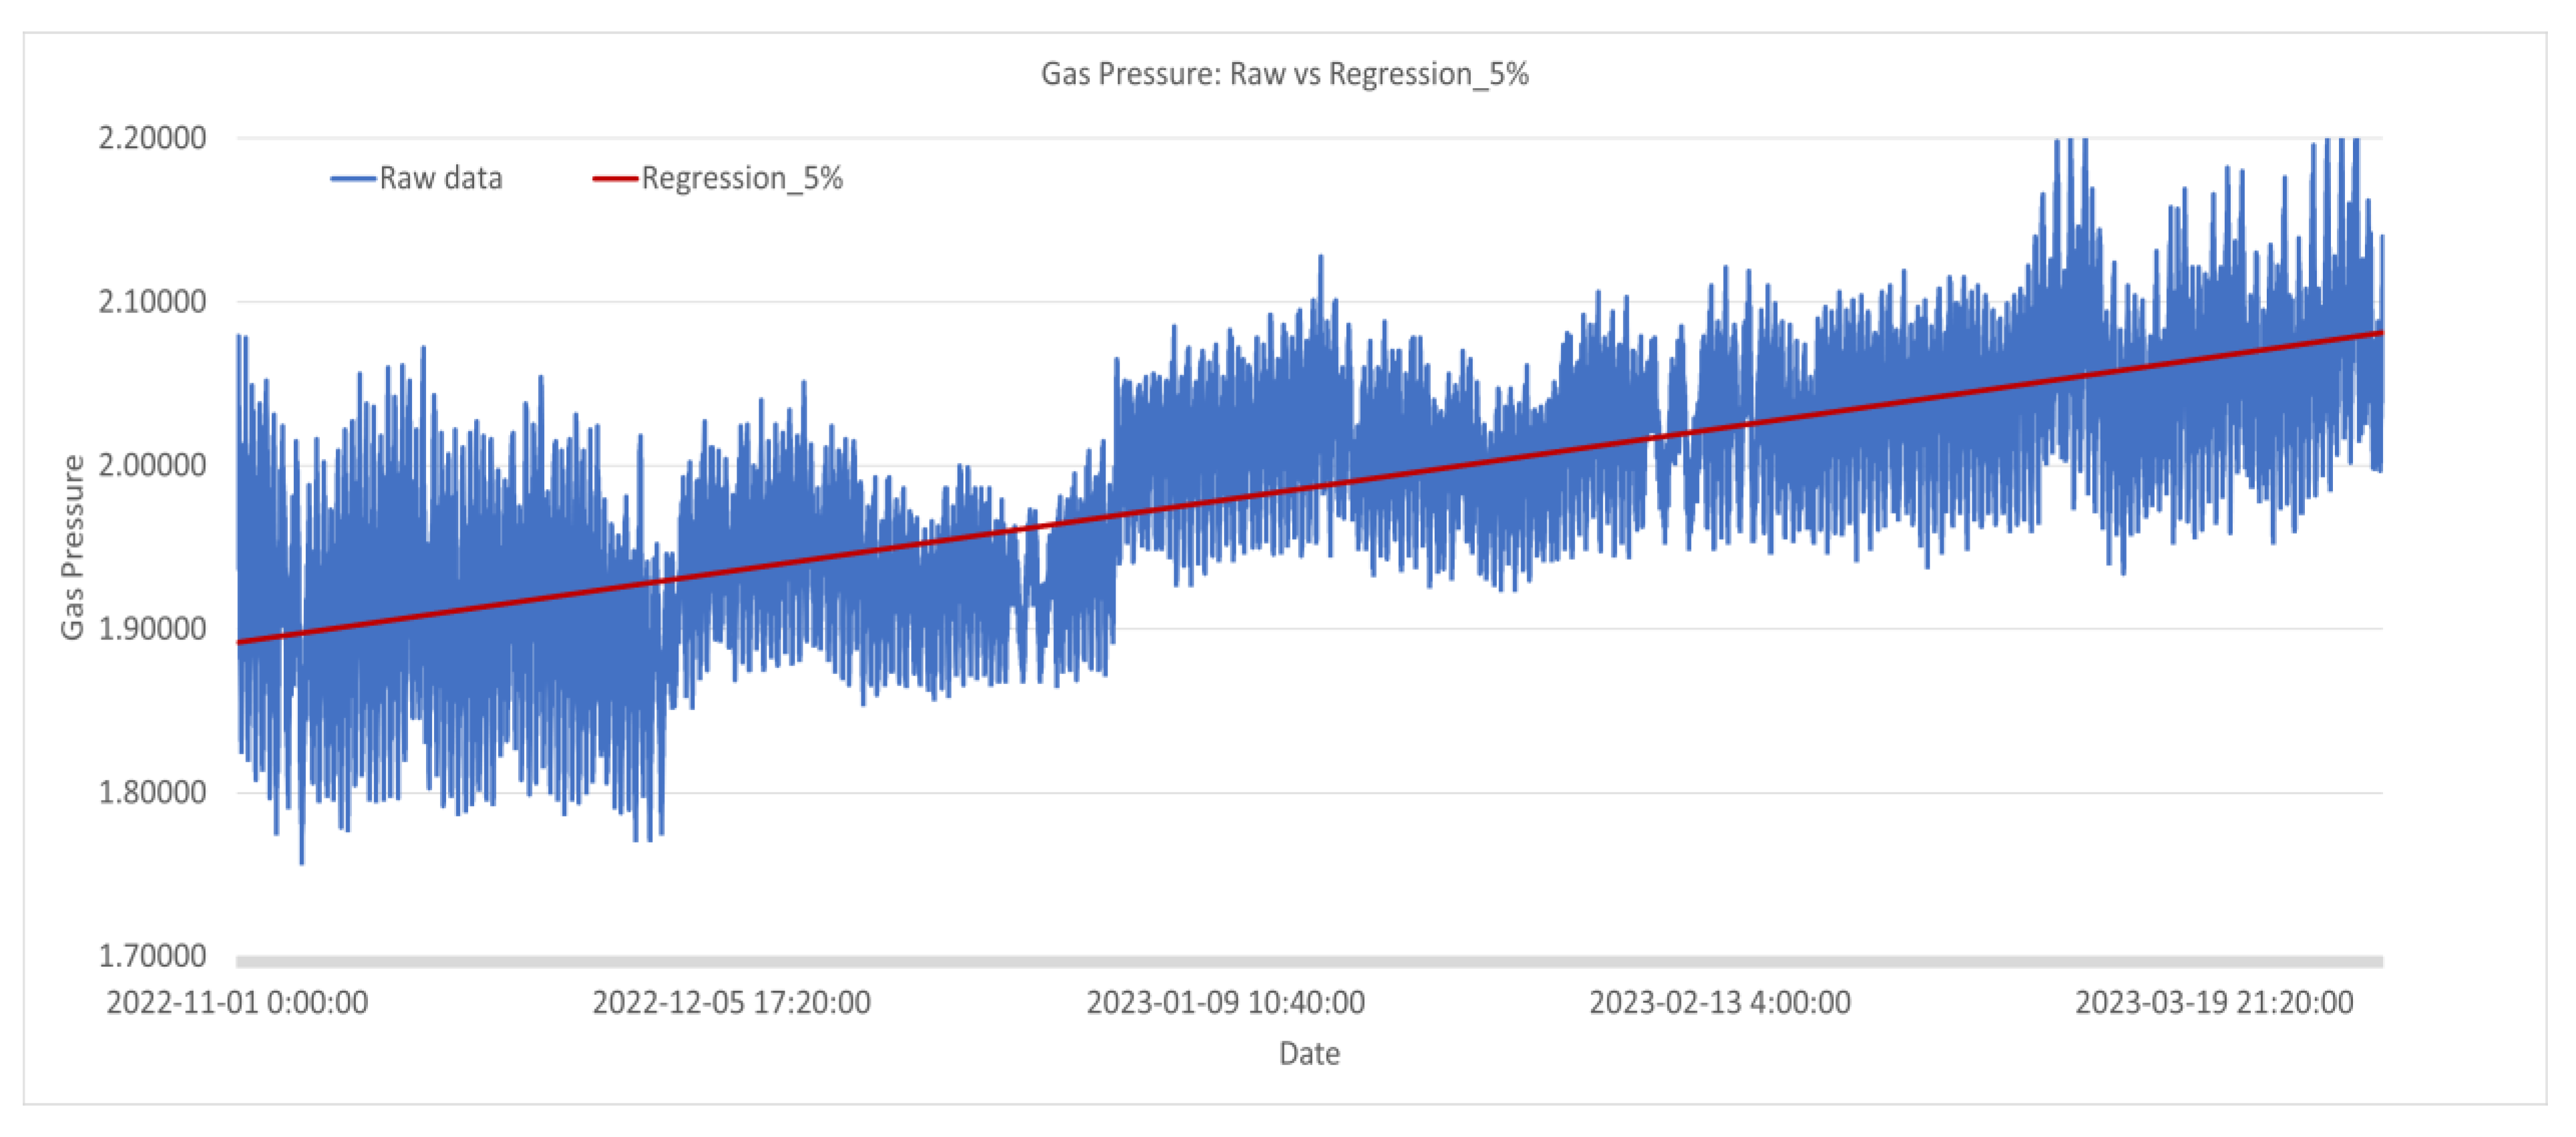
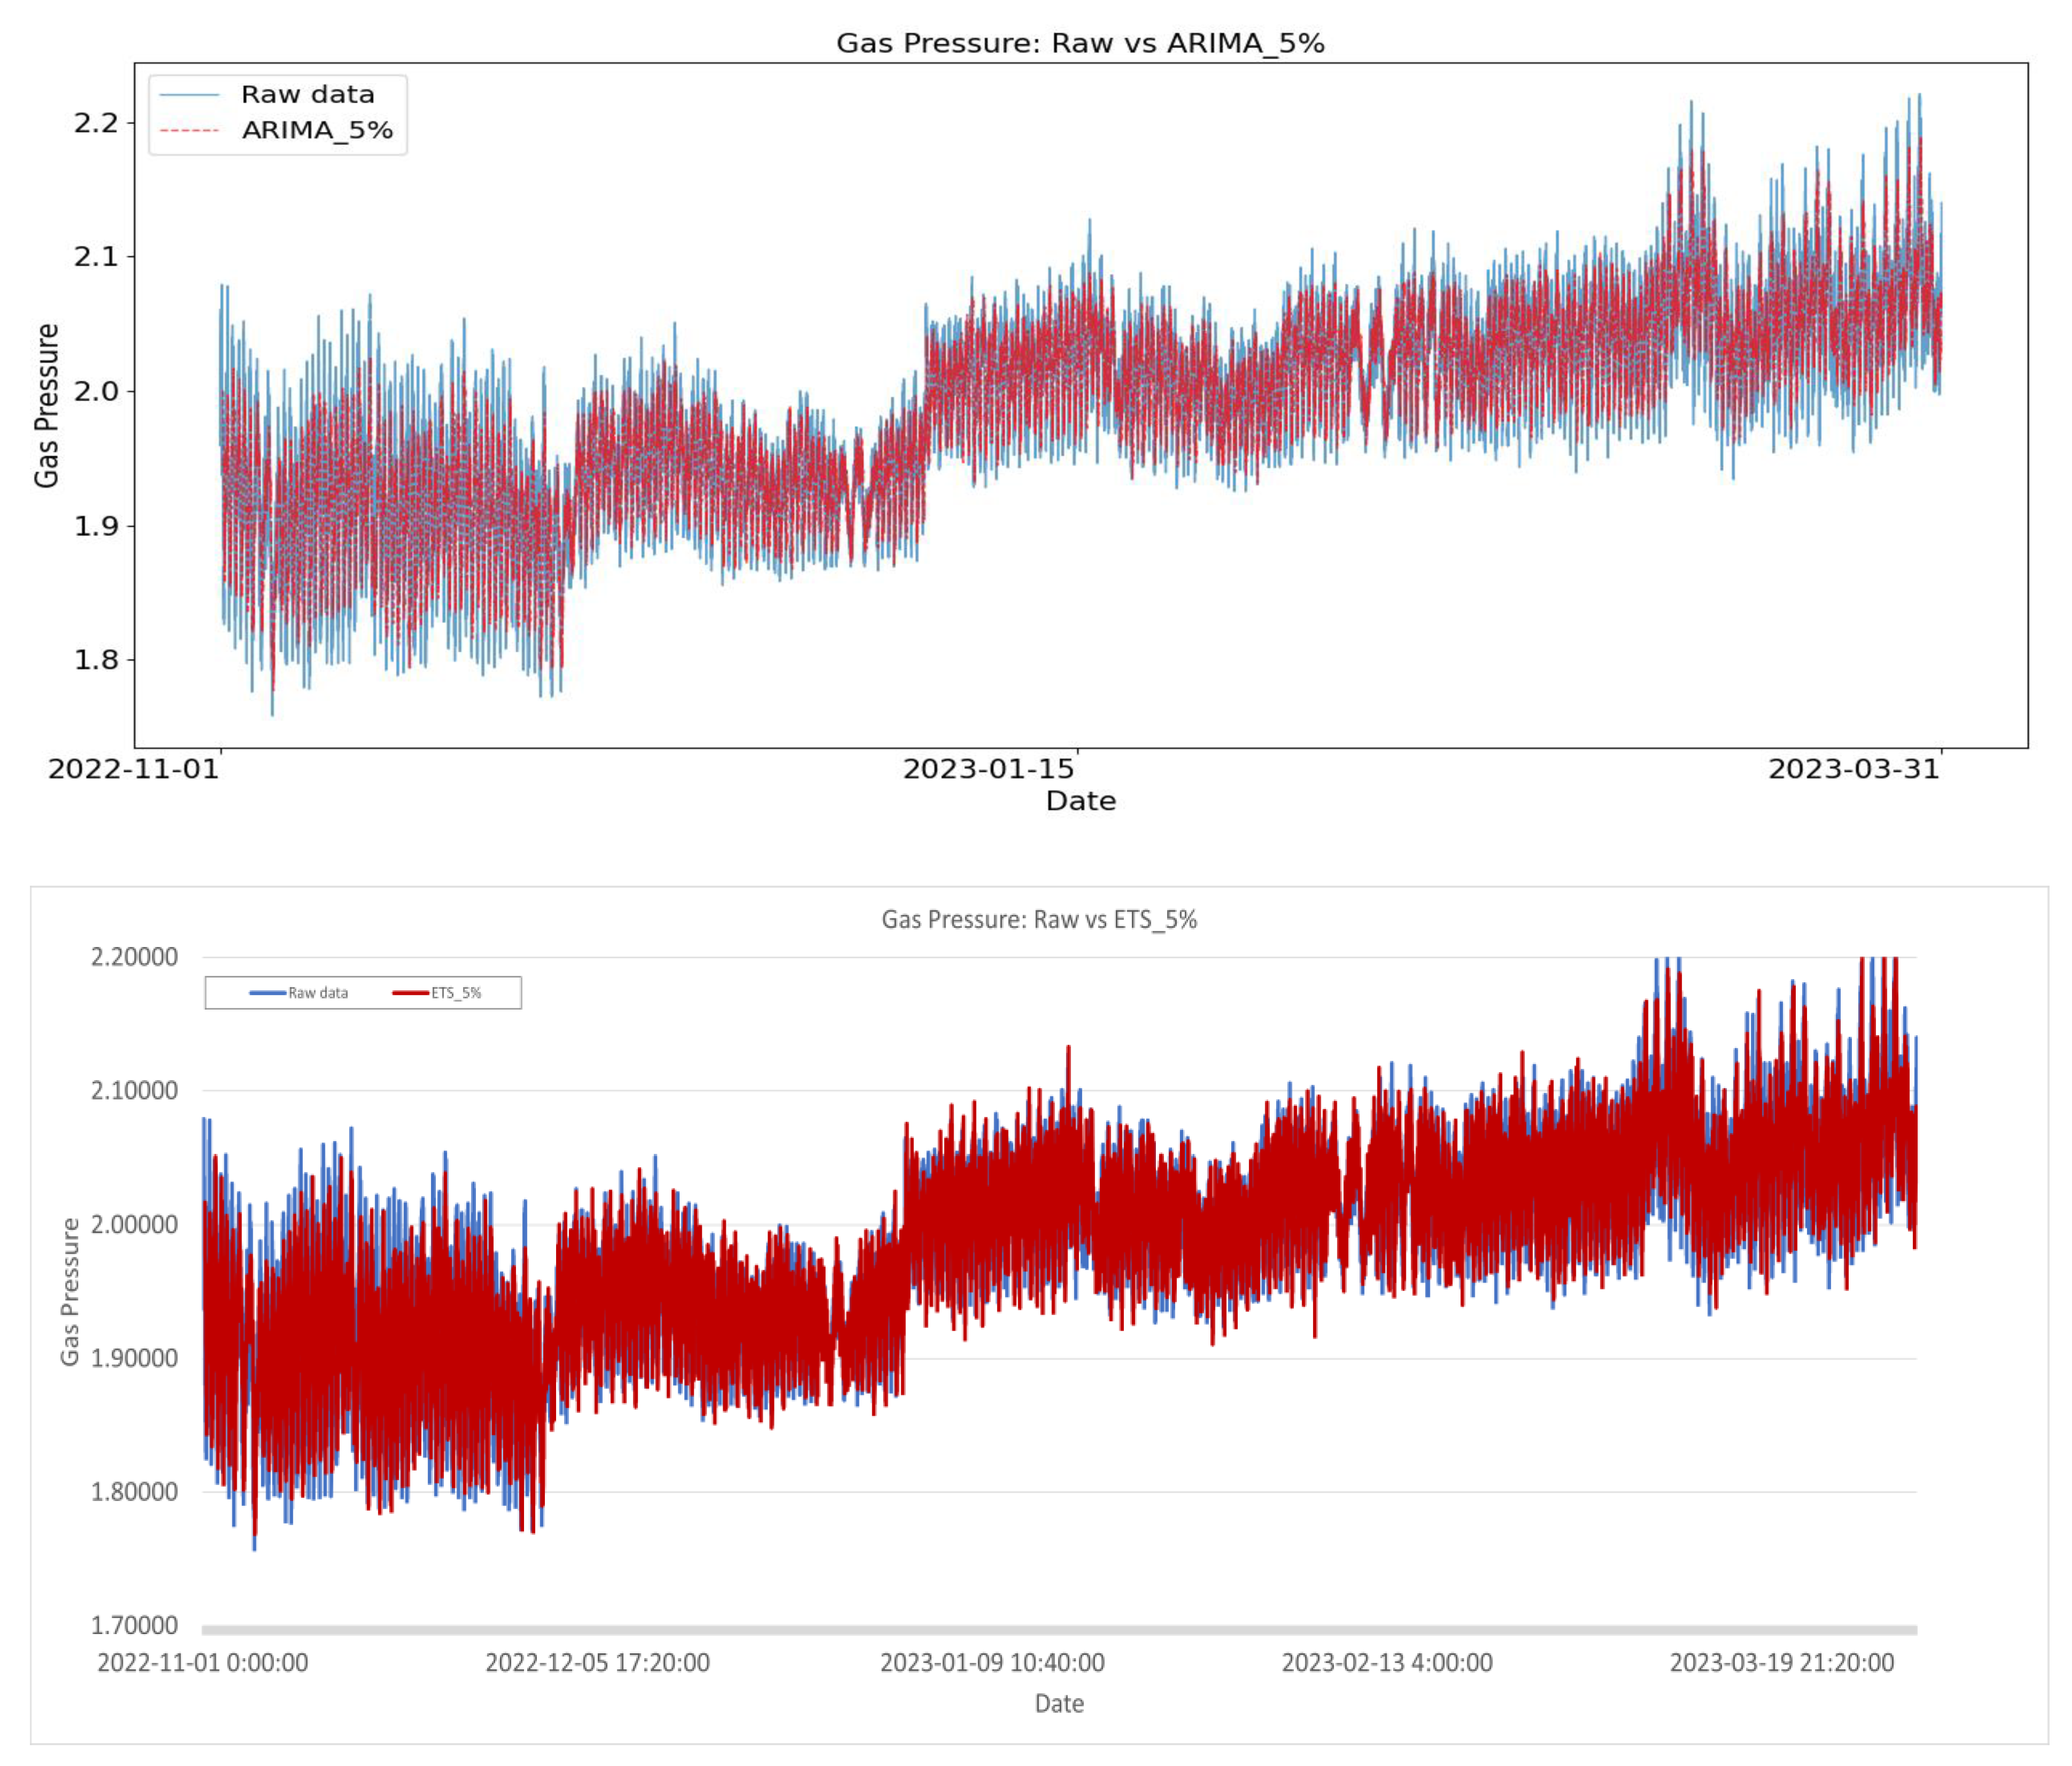
The AR, MA, ARMA, and ARIMA models that were used to predict the gas pressure learned and predicted the patterns of the time series data using the ARIMA (p, D, q) functions provided by Python’s Statsmodels package. First, before constructing the AR, MA, ARMA, and ARIMA models, the parameters of (p, D, q) had to be determined. After entering the values that could be put into the model parameters sequentially, the grid search method was used to find the parameters that showed the highest performance. To this end, the auto_arima function that automatically estimates the order (p, D, q) of the model that minimizes the value of the Akaike Information Criterion (AIC) in the Python pmdarima library was used. AIC is a widely used time series model determination criterion that best fits the data, but can find a simple model [79]. The grid search results of the ARIMA model showed that ARIMA (2, 1, 2) with an AIC value of −237023.216, as shown in Table 4, was the most optimal model. Therefore, the AR (2), MA (2), ARMA (2, 2), and ARIMA (2, 1, 2) model parameters were used for the prediction. For ETS and regression analysis, predicted values were calculated using the Excel program. The raw gas pressure is blue, and the data predicted using six models are indicated by solid orange lines.

Prediction Results

Figure 5 depicts the results predicted using the linear regression, AR, MA, ARMA, ARIMA, ETS model, and the models with raw gas pressure data. Figure 6 depicts the results predicted using the linear regression, AR, MA, ARMA, ARIMA, ETS model, and the models with simulation data (2%). Figure 7 depicts the results predicted using the linear regression, AR, MA, ARMA, ARIMA, ETS model, and the models with simulation data (3.5%). Figure 8 depicts the results predicted using the linear regression, AR, MA, ARMA, ARIMA, ETS model, and the models with simulation data (5%). In Figure 5, Figure 6, Figure 7 and Figure 8, the blue part is a visualization of the raw gas pressure data, and the red part is a visualization of the prediction data.
Table 5 summarizes the comparison results of the three performance evaluation indices (RMSE, MAPE, and R2) to determine the prediction performance more accurately. The performance evaluation based on the RMSE indicated that the ARIMA model with raw data exhibited the best prediction performance of 0.01575, followed by ARMA with raw data (0.01593), AR with raw data (0.01680), and ETS with raw data (0.01751). In the case of the MAPE, the prediction result obtained using the ARIMA model exhibited the best prediction performance of 0.00609, followed by the ARMA, AR, and ETS models with raw data at 0.00618, 0.00645, and 0.00672, respectively. The results of R2 indicated that the predictions made using the ARIMA model exhibited the best prediction performance of 0.94993, followed by the ARMA, AR, ETS, and MA models with raw data at 0.94854, 0.94276, 0.93941, and 0.83868, respectively.
When comparing the models using synthetic data, the models (AR, ARMA, ARIMA, ETS) excluding MA and regression using synthetic data with a standard deviation of 2% of the mean showed the best prediction performance based on the three performance evaluation indicators. In this case, the prediction performance was relatively lower than that predicted using raw data, but all the values of R2 were 0.8 or higher. This suggests that in the absence of raw data, synthetic data created by reflecting past data have some explanatory power. The synthetic data created using simulation models could obtain more data cost-effectively and secure the diversity in the data reflecting the various scenarios and realities, making the data analysis easier.
As a result of the performance evaluation of the predictive model, it was found that the predictive performance of the ARIMA model using real data was the best amongst all the three indicators (RMSE, MAPE, and R2). These analysis results reflect the fact that the gas pressure data used in this study have the characteristics of AR and MR, autoregressive, and moving average, and show the least error.
Next, when comparing the predictive performance based on the two indicators, the RMSE and MAPE, the ARMA, AR, and ETS models using real data were found to be excellent. When measuring the predictive performance based on R2, the MA model using real data showed superior performance after ARIMA, ARMA, AR, and ETS, but based on the other two evaluation indicators, the predictive performance was lower than that of the ARIMA, ARMA, AR, and ETS models using the synthetic data created using simulation. Particularly, in the case of the predictive model using regression analysis, all the performance evaluation results were found to be lower when real data and simulation data were used.
As a result of the study, it was found that securing raw data was the most important. In general, the results of performing predictions using raw data were the best. This suggests the importance of data management and securing data quality in future digital twin construction. For the excellent performance of the predictive model, it is necessary to increase the quality by securing the data accuracy, etc., and to make continuous and systematic efforts to manage the raw data. In addition, when synthetic data were made through simulation and applied to the model, the predictive model showed better performance than the predictive model using raw data (in the case of the MA model). This suggests that efforts to explain the data are needed by finding an appropriate model or creating a new model based on the existing data when there is no data due to recording device defects, server instability, workers’ mistakes, etc. In addition, the research results show that predictive models in the fields of AI and machine learning need to be developed. Although regression analysis is clearly the most basic and important factor in the field of prediction, the performance of the other predictive models was the best and shows why AI and machine learning fields need to develop.

5. Discussion and Conclusions

This study explored the need for a prediction model to be employed in a constant gas pressure facility using a digital twin to ensure pressure stability and strengthen the sustainability of the facility amid the increasing demand in the urban gas industry. A constant pressure facility pressure fluctuation prediction model was developed by synthesizing simulated secondary pressure and time data of the constant gas pressure device collected from the SCADA system of CNCITY Energy. During this process, the performance of six forecasting models, including the ARIMA model, was compared and analyzed using the MAPE, RMSE, and R2 indicators to identify the model that exhibited the best forecasting performance. We determined that the model with the ARIMA provided the most accurate prediction results. The prediction models developed in the study indicated that changes in the pressure in gas pressure facilities can be accurately predicted using both raw and synthetic data. This approach enables effective predictions even in the case of insufficient or incomplete data, and our analysis confirms that the prediction models can be coupled with digital twin technology. The implications of this study can be summarized as follows.
First, the importance of synthetic data generated via simulations is highlighted by identifying the model that generates the most accurate prediction results. In particular, the forecasting model using the ARIMA exhibited the best prediction results, which were obtained based on the systematic performance evaluation of the MAPE, RMSE, and R2 indicators. The forecasting accuracy exhibited by the model was high, particularly in the gas industry, providing important implications for the decision-making processes associated with pressure management [80]. The prediction models with the ARIMA can optimize the pressure management of gas pressure facilities, contributing to achieving sustainable goals, including reducing the energy consumption and carbon emissions [30]. Additionally, the prediction models can ensure the stability of the gas supply chain and minimize the energy consumption and carbon emissions by providing reliable predictions even in the case of missing or uncertain data [28,30]. Therefore, the prediction model and data generation method presented in this study can be applied to a wide range of energy-related industries.
Second, we empirically determined the contribution of implementing digital twins in the gas industry to improving the operational efficiency and stability. Based on the prediction model analysis performed using the data collected from the SCADA system of CNCITY Energy, we confirmed that digital twins can optimize the pressure management of gas pressure facilities using real-time data analysis and prediction [6,7]. This can prevent the problems caused by unexpected pressure fluctuations and increase the efficiency and reliability of the gas supply chain. Previous studies have reported that the adjustment of the pressure in constant gas pressure facilities directly impacts the economic profits of companies [6,7]. Based on this, we developed a constant pressure facility prediction model by predicting the pressure values in advance and undertaking pre-emptive measures. This in turn improved the gas company’s price competitiveness and stability via the maintenance and adjustment of the positive pressure equipment [9,15]. We also evaluated the performance of the prediction model using synthetic data and determined that effective prediction is possible even in problematic situations, such as defects in recording devices or missing data. This indicates that the application of the prediction models and digital twin technology in the gas industry can significantly impact the company’s decision-making process, which can serve as an essential tool for future research and technology development [16,17,18].
Third, this study emphasizes the need for a predictive maintenance model to manage gas pressure facilities, suggesting that digital twins can effectively improve the maintenance strategies and operational efficiency in the gas industry [21]. Digital twins create virtual duplicates of physical systems, enabling real-time data- and simulation-based predictions [23]. As reported by Tao et al. [81], digital twins can be a useful tool for monitoring and performing the predictive analysis of complex systems. The proposed predictive maintenance model applied to the digital twin technology combines real-time data analysis and ML algorithms to continuously monitor the status of gas pressure equipment and predict equipment failure or the requirement of maintenance. This proactive maintenance planning based on a predictive maintenance model can improve the industrial stability and sustainability by minimizing unnecessary downtime and optimizing resource allocation [25]. In other words, the stability and sustainability of the industry can be improved by reducing the maintenance costs and maximizing the operational efficiency of the gas supply chain [25]. The integration of the proposed predictive maintenance model and digital twins can innovatively improve the maintenance strategy and operational efficiency of the gas industry. The findings provide a theoretical basis for sustainable development in other industries with large energy consumption.
Fourth, the proposed predictive maintenance model identifies potential gas leak risks in advance and enables the implementation of pre-emptive preventive measures based on the real-time data analysis of gas pressure equipment. Gas leak accidents can result in social and environmental ramifications beyond simple economic losses, and their severity is a major concern as they impact not only the gas industry but the entirety of society [82,83]. For instance, an explosion caused by a gas leak can threaten the surrounding area and cause significant environmental pollution to the ecosystem [82,83]. Considering these risks, the application of a predictive maintenance model to prevent gas leak accidents goes beyond the technical issues and is significant from the perspective of social responsibility and environmental protection [84]. The proposed predictive maintenance model can identify and respond to these risk factors in advance, create a safe operating environment, and minimize damage to life and property from potential accidents. Therefore, the predictive maintenance model plays a key role in strengthening the safety and sustainability of the gas industry. It can be used as an important tool in the industry-wide risk management and disaster prevention strategies [84,85]. Combining this predictive maintenance model with digital twin technology to prevent gas leak accidents can enhance the safety of the gas industry and contribute to sustainable development.
In conclusion, our analysis indicates that the pressure prediction model of gas pressure equipment applicable to digital twins is essential for strengthening the stability and sustainability of the urban gas industry, promoting its digital transformation. The study findings can serve as a reference for establishing digital technology application and optimization strategies not only in the gas industry but also in the energy industry. In particular, ensuring the reliability of energy supply by maximizing the prediction accuracy and pre-emptive maintenance planning through predictive maintenance can contribute to strengthening the stability and sustainability of the energy industry further.

6. Limitations and Future Works

In this study, we explored the applicability of digital twin technology to a prediction model for gas pressure equipment, which is an essential element of the urban gas industry. Although this study lays a fundamental theoretical and practical foundation, certain limitations exist.
First, we used a 5 min data set owing to the limitations in the scope and type of data. This may experience challenges in capturing minute pressure changes in a specific time period and reduce the accuracy of the model with respect to the pressure fluctuations that occur in real time. Therefore, a prediction model that can respond more sensitively to real-time changes should be developed by expanding the processing power of computers and reducing the time interval of data collection to seconds.
Second, although this study focused on the regression model, the performance should be evaluated by applying various prediction models and ML algorithms. For instance, a more efficient and accurate prediction model can be derived by exploring classification and deep learning models and by comparing the performance of each model in predicting the gas pressure.
Third, only the basic factors were used as key variables in predicting the pressure in gas pressure equipment. In future studies, additional external factors such as gas consumption, population density, and the location of regions can be added and analyzed. This can improve the accuracy of prediction further, and the complexity in the actual operating environment can be reflected more accurately. This in turn can provide important implications for establishing efficient management and maintenance strategies for gas pressure equipment.
The developed gas pressure equipment prediction model applicable to the digital twin can facilitate extensive research in terms of measures to prevent gas leaks, reduce the inspection costs, and analyze the economic effects of building a digital twin. Preventing gas leaks using digital twin technology is an important element of enhancing the safety, contributing to the prevention of major accidents in the gas industry, and minimizing the damage to life and property. Moreover, reducing the inspection and maintenance costs can increase the economic efficiency and facilitate the exploration of more sustainable production methods for the gas industry.
Future studies are expected to combine the industrial metaverse and predictive conservation models. The industrial metaverse simulates the actual industrial environment in virtual space and is used to predict and optimize the operation of complex systems based on real-time data analyses and simulations. When applied to the gas industry, the metaverse can approach various aspects, such as leak accident simulation in a virtual environment and response procedure training, beyond building a digital twin of gas pressure equipment. Therefore, the combination of the industrial metaverse and predictive maintenance model can serve as a foundation for the digital transformation and sustainable development of the gas industry.

Author Contributions

Conceptualization, J.Y. and J.K.; methodology, J.Y.; software, J.Y.; validation, J.Y. and J.K.; formal analysis, J.Y.; investigation, J.Y. and S.K.; data curation, J.Y. and J.K.; writing—original draft preparation, J.Y. and S.K.; writing—review and editing, J.Y., S.K. and J.K.; visualization, J.Y.; supervision, J.K.; project administration, J.K. All authors have read and agreed to the published version of the manuscript.

Funding

This work was supported by the Industrial Technology Innovation Program (20014644, Integrated Control System of Digital Twin based SCADA for the city- wide gas regulator Isobaric plant) funded by the Ministry of Trade, Industry & Energy (MOTIE, Korea).

Institutional Review Board Statement

Not applicable.

Informed Consent Statement

Not applicable.

Data Availability Statement

Restrictions apply to the availability of these data. Data were obtained from CNCITY Energy and are available from the authors with the permission of CNCITY Energy.

Conflicts of Interest

The authors declare no conflicts of interest.

References

  1. Gillessen, B.; Heinrichs, H.; Hake, J.-F.; Allelein, H.-J. Natural gas as a bridge to sustainability: Infrastructure expansion regarding energy security and system transition. Appl. Energy 2019, 251, 113377. [Google Scholar] [CrossRef]
  2. Ajayi, T.A. Natural gas rents and institutions as co-growth drivers: Evidence from Gas Exporting Countries Forum with a panel 2SLS approach. Int. J. Energy Sect. Manag. 2024, 18, 474–499. [Google Scholar] [CrossRef]
  3. Safari, A.; Das, N.; Langhelle, O.; Roy, J.; Assadi, M. Natural gas: A transition fuel for sustainable energy system transformation? Energy Sci. Eng. 2019, 7, 1075–1094. [Google Scholar] [CrossRef]
  4. Kotagodahetti, R.; Hewage, K.; Perera, P.; Sadiq, R. Technology and policy options for decarbonizing the natural gas industry: A critical review. Gas Sci. Eng. 2023, 114, 204981. [Google Scholar] [CrossRef]
  5. Li, J.; She, Y.; Gao, Y.; Li, M.; Yang, G.; Shi, Y. Natural gas industry in China: Development situation and prospect. Nat. Gas Ind. B 2020, 7, 604–613. [Google Scholar] [CrossRef]
  6. El Golli, R.; Bézian, J.-J.; Delenne, B.; Menu, F. Modelling of a pressure regulator. Int. J. Press. Vessel. Pip. 2007, 84, 234–243. [Google Scholar]
  7. Jia, J.; Wang, B.; Ma, R.; Deng, Z.; Fu, M. State monitoring of gas regulator station based on feature selection of improved grey relational analysis. IEEE Internet Things J. 2022, 9, 22765–22773. [Google Scholar] [CrossRef]
  8. Chao, A.C. Anomaly Detection for Natural Gas Regulator Stations; Massachusetts Institute of Technology: Cambridge, MA, USA, 2016. [Google Scholar]
  9. Bazyar, A.; Zarrinpoor, N.; Safavian, A. Optimal design of a sustainable natural gas supply chain network under uncertainty. Chem. Eng. Res. Des. 2021, 176, 60–88. [Google Scholar] [CrossRef]
  10. Chen, J.; Xiao, Z.; Bai, J.; Guo, H. Predicting volatility in natural gas under a cloud of uncertainties. Resour. Policy 2023, 82, 103436. [Google Scholar] [CrossRef] [PubMed]
  11. Hailemariam, A.; Smyth, R. What drives volatility in natural gas prices? Energy Econ. 2019, 80, 731–742. [Google Scholar] [CrossRef]
  12. Zhao, J.; Jiang, Q.; Dong, X.; Dong, K. Would environmental regulation improve the greenhouse gas benefits of natural gas use? A Chinese case study. Energy Econ. 2020, 87, 104712. [Google Scholar] [CrossRef]
  13. Nafey, A.S.; Zoghaib, N.; Omar, M.K. Optimization of the Egyptian Natural Gas Transmission Networks. Int. J. Eng. Res. Technol. 2020, 13, 2347–2358. [Google Scholar] [CrossRef]
  14. Zhang, H.; Liang, Y.; Liao, Q.; Chen, J.; Zhang, W.; Long, Y.; Qian, C. Optimal design and operation for supply chain system of multi-state natural gas under uncertainties of demand and purchase price. Comput. Ind. Eng. 2019, 131, 115–130. [Google Scholar] [CrossRef]
  15. Chung, W.H.; Park, G.; Gu, Y.H.; Kim, S.; Yoo, S.J. City Gas Pipeline Pressure Prediction Model. J. Soc. E-Bus. Stud. 2019, 23. [Google Scholar] [CrossRef]
  16. Khotanzad, A.; Elragal, H.; Lu, T.-L. Combination of artificial neural-network forecasters for prediction of natural gas consumption. IEEE Trans. Neural Netw. 2000, 11, 464–473. [Google Scholar] [CrossRef]
  17. Šebalj, D.; Mesarić, J.; Dujak, D. Analysis of methods and techniques for prediction of natural gas consumption: A literature review. J. Inf. Organ. Sci. 2019, 43, 99–117. [Google Scholar] [CrossRef]
  18. Zhu, L.; Li, M.; Wu, Q.; Jiang, L. Short-term natural gas demand prediction based on support vector regression with false neighbours filtered. Energy 2015, 80, 428–436. [Google Scholar] [CrossRef]
  19. Nejatian, I.; Kanani, M.; Arabloo, M.; Bahadori, A.; Zendehboudi, S. Prediction of natural gas flow through chokes using support vector machine algorithm. J. Nat. Gas Sci. Eng. 2014, 18, 155–163. [Google Scholar] [CrossRef]
  20. Hafezi, R.; Alipour, M.; Wood, D.A.; Moghaddam, N.B. Natural gas demand prediction: Methods, time horizons, geographical scopes, sustainability issues, and scenarios. In Sustainable Natural Gas Reservoir and Production Engineering; Elsevier: Amsterdam, The Netherlands, 2022; pp. 29–53. [Google Scholar]
  21. Wanasinghe, T.R.; Wroblewski, L.; Petersen, B.K.; Gosine, R.G.; James, L.A.; De Silva, O.; Mann, G.K.; Warrian, P.J. Digital twin for the oil and gas industry: Overview, research trends, opportunities, and challenges. IEEE Access 2020, 8, 104175–104197. [Google Scholar] [CrossRef]
  22. Wen, K.; Xu, H.; Xu, M.; Pei, Y.; Lu, Y.; Zheng, H.; Li, Z. Digital twin-driven intelligent control of natural gas flowmeter calibration station. Measurement 2023, 217, 113140. [Google Scholar] [CrossRef]
  23. VanDerHorn, E.; Mahadevan, S. Digital Twin: Generalization, characterization and implementation. Decis. Support Syst. 2021, 145, 113524. [Google Scholar] [CrossRef]
  24. Sircar, A.; Yadav, K.; Rayavarapu, K.; Bist, N.; Oza, H. Application of machine learning and artificial intelligence in oil and gas industry. Pet. Res. 2021, 6, 379–391. [Google Scholar] [CrossRef]
  25. Nian, J.; Wang, Y.; Wang, J. Research on Fault Diagnosis of Gas Pressure Regulator Based on Digital Twin. In Proceedings of the 2021 33rd Chinese Control and Decision Conference (CCDC), Kunming, China, 22–24 May 2021; pp. 872–875. [Google Scholar]
  26. Zhang, M.; Zuo, Y.; Tao, F. Equipment energy consumption management in digital twin shop-floor: A framework and potential applications. In Proceedings of the 2018 IEEE 15th International Conference on Networking, Sensing and Control (ICNSC), Zhuhai, China, 27–29 March 2018; pp. 1–5. [Google Scholar]
  27. Rück, T.; Müller, M.; Jobst, S.; Weigl, S.; Pangerl, J.; Bierl, R.; Matysik, F.-M. Digital Twin of a photoacoustic trace gas sensor for monitoring methane in complex gas compositions. Sens. Actuators B Chem. 2023, 378, 133119. [Google Scholar] [CrossRef]
  28. Yu, W.; Patros, P.; Young, B.; Klinac, E.; Walmsley, T.G. Energy digital twin technology for industrial energy management: Classification, challenges and future. Renew. Sustain. Energy Rev. 2022, 161, 112407. [Google Scholar] [CrossRef]
  29. Sleiti, A.K.; Kapat, J.S.; Vesely, L. Digital twin in energy industry: Proposed robust digital twin for power plant and other complex capital-intensive large engineering systems. Energy Rep. 2022, 8, 3704–3726. [Google Scholar] [CrossRef]
  30. Akroyd, J.; Mosbach, S.; Bhave, A.; Kraft, M. Universal digital twin-a dynamic knowledge graph. Data-Centric Eng. 2021, 2, e14. [Google Scholar] [CrossRef]
  31. Pregnolato, M.; Gunner, S.; Voyagaki, E.; De Risi, R.; Carhart, N.; Gavriel, G.; Tully, P.; Tryfonas, T.; Macdonald, J.; Taylor, C. Towards Civil Engineering 4.0: Concept, workflow and application of Digital Twins for existing infrastructure. Autom. Constr. 2022, 141, 104421. [Google Scholar] [CrossRef]
  32. Faliagka, E.; Christopoulou, E.; Ringas, D.; Politi, T.; Kostis, N.; Leonardos, D.; Tranoris, C.; Antonopoulos, C.P.; Denazis, S.; Voros, N. Trends in Digital Twin Framework Architectures for Smart Cities: A Case Study in Smart Mobility. Sensors 2024, 24, 1665. [Google Scholar] [CrossRef] [PubMed]
  33. Glaessgen, E.; Stargel, D. The digital twin paradigm for future NASA and US Air Force vehicles. In Proceedings of the 53rd AIAA/ASME/ASCE/AHS/ASC Structures, Structural Dynamics and Materials Conference 20th AIAA/ASME/AHS Adaptive Structures Conference 14th AIAA, Honolulu, HI, USA, 3–26 April 2012; p. 1818. [Google Scholar]
  34. Grieves, M. Digital twin: Manufacturing excellence through virtual factory replication. White Pap. 2014, 1, 1–7. [Google Scholar]
  35. Liu, M.; Fang, S.; Dong, H.; Xu, C. Review of digital twin about concepts, technologies, and industrial applications. J. Manuf. Syst. 2021, 58, 346–361. [Google Scholar] [CrossRef]
  36. Chen, H.; Zhang, Z.; Karamanakos, P.; Rodriguez, J. Digital twin techniques for power electronics-based energy conversion systems: A survey of concepts, application scenarios, future challenges, and trends. IEEE Ind. Electron. Mag. 2022, 17, 20–36. [Google Scholar] [CrossRef]
  37. Rasheed, A.; San, O.; Kvamsdal, T. Digital twin: Values, challenges and enablers from a modeling perspective. IEEE Access 2020, 8, 21980–22012. [Google Scholar] [CrossRef]
  38. Qi, Q.; Tao, F.; Hu, T.; Anwer, N.; Liu, A.; Wei, Y.; Wang, L.; Nee, A.Y. Enabling technologies and tools for digital twin. J. Manuf. Syst. 2021, 58, 3–21. [Google Scholar] [CrossRef]
  39. Bâra, A.; Oprea, S.-V. Enabling coordination in energy communities: A Digital Twin model. Energy Policy 2024, 184, 113910. [Google Scholar] [CrossRef]
  40. Hosamo, H.H.; Svennevig, P.R.; Svidt, K.; Han, D.; Nielsen, H.K. A Digital Twin predictive maintenance framework of air handling units based on automatic fault detection and diagnostics. Energy Build. 2022, 261, 111988. [Google Scholar] [CrossRef]
  41. Yi, Y.; Yan, Y.; Liu, X.; Ni, Z.; Feng, J.; Liu, J. Digital twin-based smart assembly process design and application framework for complex products and its case study. J. Manuf. Syst. 2021, 58, 94–107. [Google Scholar] [CrossRef]
  42. Botín-Sanabria, D.M.; Mihaita, A.-S.; Peimbert-García, R.E.; Ramírez-Moreno, M.A.; Ramírez-Mendoza, R.A.; Lozoya-Santos, J.d.J. Digital twin technology challenges and applications: A comprehensive review. Remote Sens. 2022, 14, 1335. [Google Scholar] [CrossRef]
  43. Singh, M.; Srivastava, R.; Fuenmayor, E.; Kuts, V.; Qiao, Y.; Murray, N.; Devine, D. Applications of digital twin across industries: A review. Appl. Sci. 2022, 12, 5727. [Google Scholar] [CrossRef]
  44. Pankratova, N.; Grishyn, K.; Barilko, V. Digital twins: Stages of concept development, areas of use, prospects. Syst. Res. Inf. Technol. 2023, 2, 7–21. [Google Scholar]
  45. Arpino, F.; Dell’Isola, M.; Ficco, G.; Vigo, P. Unaccounted for gas in natural gas transmission networks: Prediction model and analysis of the solutions. J. Nat. Gas Sci. Eng. 2014, 17, 58–70. [Google Scholar] [CrossRef]
  46. Yeshitila, D.; Kitaw, D.; Belayneh, M. Application of Machine Learning Modeling for the Upstream Oil and Gas Industry Injury Rate Prediction. Int. J. Occup. Saf. Health 2024, 14, 152–165. [Google Scholar] [CrossRef]
  47. Mohammadpoor, M.; Torabi, F. Big Data analytics in oil and gas industry: An emerging trend. Petroleum 2020, 6, 321–328. [Google Scholar] [CrossRef]
  48. Tariq, Z.; Aljawad, M.S.; Hasan, A.; Murtaza, M.; Mohammed, E.; El-Husseiny, A.; Alarifi, S.A.; Mahmoud, M.; Abdulraheem, A. A systematic review of data science and machine learning applications to the oil and gas industry. J. Pet. Explor. Prod. Technol. 2021, 11, 4339–4374. [Google Scholar] [CrossRef]
  49. Shen, F.; Ren, S.S.; Zhang, X.Y.; Luo, H.W.; Feng, C.M. A digital twin-based approach for optimization and prediction of oil and gas production. Math. Probl. Eng. 2021, 2021, 1–8. [Google Scholar] [CrossRef]
  50. Khalaf, A.H.; Xiao, Y.; Xu, N.; Wu, B.; Li, H.; Lin, B.; Nie, Z.; Tang, J. Emerging AI technologies for corrosion monitoring in oil and gas industry: A comprehensive review. Eng. Fail. Anal. 2023, 155, 107735. [Google Scholar] [CrossRef]
  51. Boschert, S.; Rosen, R. Digital twin—The simulation aspect. In Mechatronic Futures: Challenges and Solutions for Mechatronic Systems and Their Designers; Springer: Berlin/Heidelberg, Germany, 2016; pp. 59–74. [Google Scholar]
  52. Pylianidis, C.; Snow, V.; Overweg, H.; Osinga, S.; Kean, J.; Athanasiadis, I.N. Simulation-assisted machine learning for operational digital twins. Environ. Model. Softw. 2022, 148, 105274. [Google Scholar] [CrossRef]
  53. Chen, R.J.; Lu, M.Y.; Chen, T.Y.; Williamson, D.F.; Mahmood, F. Synthetic data in machine learning for medicine and healthcare. Nat. Biomed. Eng. 2021, 5, 493–497. [Google Scholar] [CrossRef]
  54. Ghosh, A.K.; Ullah, A.S.; Kubo, A. Hidden Markov model-based digital twin construction for futuristic manufacturing systems. Ai Edam 2019, 33, 317–331. [Google Scholar] [CrossRef]
  55. Qin, Y.; Wu, X.; Luo, J. Data-model combined driven digital twin of life-cycle rolling bearing. IEEE Trans. Ind. Inform. 2021, 18, 1530–1540. [Google Scholar] [CrossRef]
  56. Liu, X.; Jiang, D.; Tao, B.; Jiang, G.; Sun, Y.; Kong, J.; Tong, X.; Zhao, G.; Chen, B. Genetic algorithm-based trajectory optimization for digital twin robots. Front. Bioeng. Biotechnol. 2022, 9, 793782. [Google Scholar] [CrossRef]
  57. Liu, Y.; Yu, H.; Tang, J.; Cao, Y.; Li, J.; Deng, Z.; Wu, D.; Lun, H.; Shi, L. Digital twin of the atmospheric turbulence channel based on self-supervised deep learning algorithm. Phys. Lett. A 2023, 481, 128992. [Google Scholar] [CrossRef]
  58. Abbasi, T.; Lim, K.H.; Yam, K.S. Predictive maintenance of oil and gas equipment using recurrent neural network. In Proceedings of the Iop Conference Series: Materials Science and Engineering, Shijiazhuang, China, 19–20 April 2019; p. 012067. [Google Scholar]
  59. Orrù, P.F.; Zoccheddu, A.; Sassu, L.; Mattia, C.; Cozza, R.; Arena, S. Machine learning approach using MLP and SVM algorithms for the fault prediction of a centrifugal pump in the oil and gas industry. Sustainability 2020, 12, 4776. [Google Scholar] [CrossRef]
  60. Wu, Y.; Yang, G.; Sun, J.; Cui, L.; Wang, M. Digital twin modeling and leak diagnosis of temperature and stress fields in LNG storage tanks. Measurement 2024, 228, 114374. [Google Scholar] [CrossRef]
  61. Kim, J.; Chae, M.; Han, J.; Park, S.; Lee, Y. The development of leak detection model in subsea gas pipeline using machine learning. J. Nat. Gas Sci. Eng. 2021, 94, 104134. [Google Scholar] [CrossRef]
  62. Zhou, D.; Jia, X.; Ma, S.; Shao, T.; Huang, D.; Hao, J.; Li, T. Dynamic simulation of natural gas pipeline network based on interpretable machine learning model. Energy 2022, 253, 124068. [Google Scholar] [CrossRef]
  63. Lian, Y.; Geng, Y.; Tian, T. Anomaly detection method for multivariate time series data of oil and gas stations based on digital twin and mtad-gan. Appl. Sci. 2023, 13, 1891. [Google Scholar] [CrossRef]
  64. Sirisha, U.M.; Belavagi, M.C.; Attigeri, G. Profit prediction using ARIMA, SARIMA and LSTM models in time series forecasting: A comparison. IEEE Access 2022, 10, 124715–124727. [Google Scholar] [CrossRef]
  65. Mehdizadeh, S. Using AR, MA, and ARMA time series models to improve the performance of MARS and KNN approaches in monthly precipitation modeling under limited climatic data. Water Resour. Manag. 2020, 34, 263–282. [Google Scholar] [CrossRef]
  66. Panigrahi, S.; Pattanayak, R.M.; Sethy, P.K.; Behera, S.K. Forecasting of sunspot time series using a hybridization of ARIMA, ETS and SVM methods. Sol. Phys. 2021, 296, 6. [Google Scholar] [CrossRef]
  67. Yap, Z.N.; Musa, S. Stream Flow Forcasting on Pahang River by Time Series Models, ARMA, ARIMA and SARIMA. Recent Trends Civ. Eng. Built Environ. 2023, 4, 331–341. [Google Scholar]
  68. Fordyce, K. Linear Regression with a Time Series View, Part 1: Simple Linear Regression. Foresight Int. J. Appl. Forecast. 2024, 72, 35–39. [Google Scholar]
  69. Flores-Sosa, M.; Leon-Castro, E.; Aviles-Ochoa, E.; Merigo, J.M. Forecasting Volatility with Simple Linear Regression and Ordered Weighted Average Operators. Econ. Comput. Econ. Cybern. Stud. Res. 2022, 56, 203–218. [Google Scholar]
  70. Bourdeau, M.; Zhai, X.; Nefzaoui, E.; Guo, X.; Chatellier, P. Modeling and forecasting building energy consumption: A review of data-driven techniques. Sustain. Cities Soc. 2019, 48, 101533. [Google Scholar] [CrossRef]
  71. Charles, A.; Darné, O.; Kim, J.H. Stock return predictability: Evaluation based on interval forecasts. Bull. Econ. Res. 2022, 74, 363–385. [Google Scholar] [CrossRef]
  72. Gautam, S.S.; Abhishekh. A novel moving average forecasting approach using fuzzy time series data set. J. Control Autom. Electr. Syst. 2019, 30, 532–544. [Google Scholar] [CrossRef]
  73. Faghidian, S.F.; Khashei, M.; Khalilzadeh, M. Improving intermittent demand forecasting based on data structure. J. Eng. Res. 2021, 9, 8667. [Google Scholar] [CrossRef]
  74. Khan, S.; Alghulaiakh, H. ARIMA model for accurate time series stocks forecasting. Int. J. Adv. Comput. Sci. Appl. 2020, 11, 524–528. [Google Scholar] [CrossRef]
  75. Fan, D.; Sun, H.; Yao, J.; Zhang, K.; Yan, X.; Sun, Z. Well production forecasting based on ARIMA-LSTM model considering manual operations. Energy 2021, 220, 119708. [Google Scholar] [CrossRef]
  76. Naim, I.; Mahara, T. Comparative analysis of univariate forecasting techniques for industrial natural gas consumption. Int. J. Image Graph. Signal Process. 2018, 11, 33. [Google Scholar] [CrossRef]
  77. Ali, A.; Aliyuda, K.; Elmitwally, N.; Bello, A.M. Towards more accurate and explainable supervised learning-based prediction of deliverability for underground natural gas storage. Appl. Energy 2022, 327, 120098. [Google Scholar] [CrossRef]
  78. Karabiber, O.A.; Xydis, G. Forecasting day-ahead natural gas demand in Denmark. J. Nat. Gas Sci. Eng. 2020, 76, 103193. [Google Scholar] [CrossRef]
  79. Wu, S.; Kong, L.; Wang, A.; Lu, Q.; Feng, X. Exogenous input autoregressive model based on mixed variables for offline prediction thermal errors of CNC Swiss lathes. Int. J. Adv. Manuf. Technol. 2024, 130, 3245–3256. [Google Scholar] [CrossRef]
  80. Filik, U.B.; Kurban, M. A new approach for the short-term load forecasting with autoregressive and artificial neural network models. Int. J. Comput. Intell. Res. 2007, 3, 66–71. [Google Scholar]
  81. Tao, F.; Cheng, J.; Qi, Q.; Zhang, M.; Zhang, H.; Sui, F. Digital twin-driven product design, manufacturing and service with big data. Int. J. Adv. Manuf. Technol. 2018, 94, 3563–3576. [Google Scholar] [CrossRef]
  82. Ghosh, P.; Dhar, P.K. GSM based low-cost gas leakage, explosion and fire alert system with advanced security. In Proceedings of the 2019 International Conference on Electrical, Computer and Communication Engineering (ECCE), Cox’s Bazar, Bangladesh, 7–9 February 2019; pp. 1–5. [Google Scholar]
  83. Suma, V.; Shekar, R.R.; Akshay, K.A. Gas leakage detection based on IOT. In Proceedings of the 2019 3rd International Conference on Electronics, Communication and Aerospace Technology (ICECA), Coimbatore, India, 12–14 June 2019; pp. 1312–1315. [Google Scholar]
  84. Wang, J.; Zhang, R.; Yan, Y.; Dong, X.; Li, J.M. Locating hazardous gas leaks in the atmosphere via modified genetic, MCMC and particle swarm optimization algorithms. Atmos. Environ. 2017, 157, 27–37. [Google Scholar] [CrossRef]
  85. Li, Y.; Qian, X.; Zhang, S.; Sheng, J.; Hou, L.; Yuan, M. Assessment of gas explosion risk in underground spaces adjacent to a gas pipeline. Tunn. Undergr. Space Technol. 2023, 131, 104785. [Google Scholar] [CrossRef]
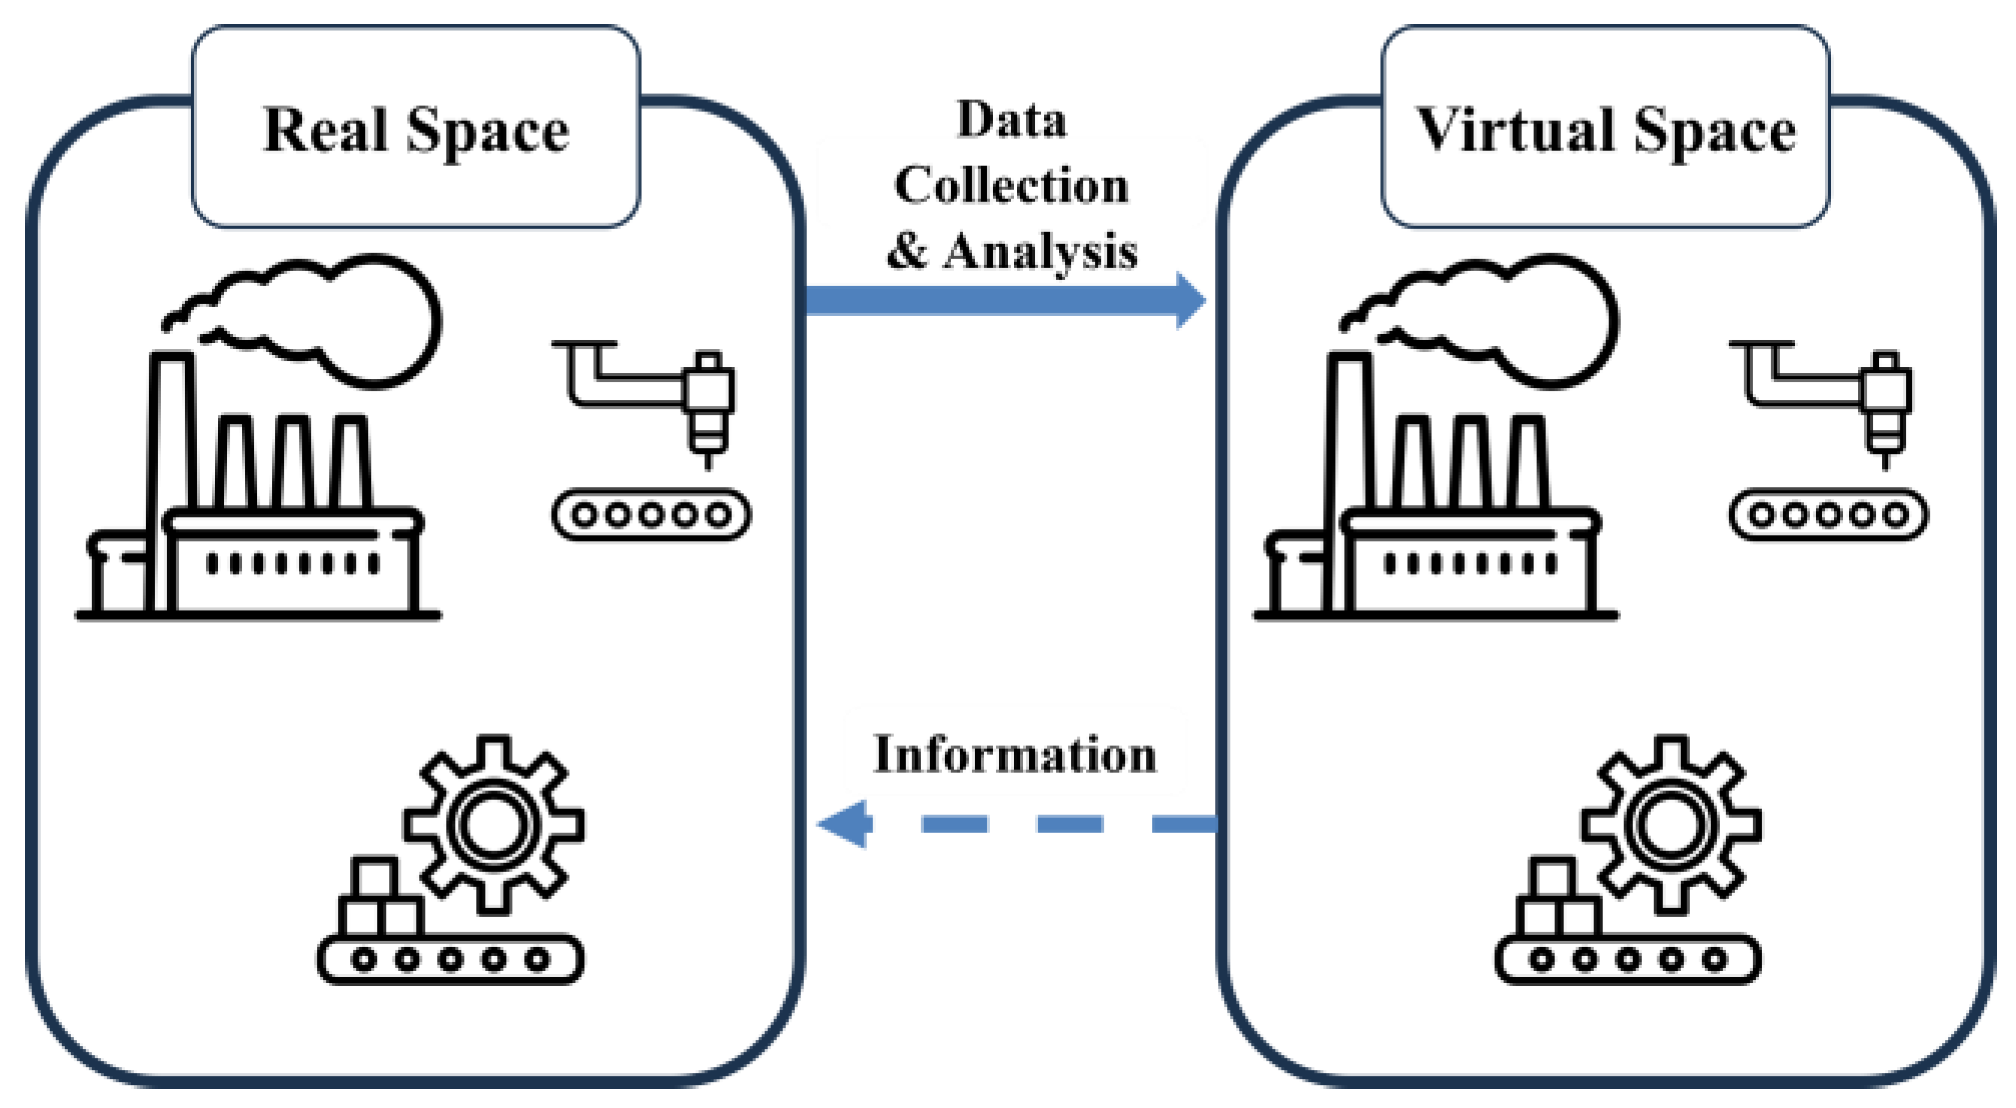
Figure 1. Digital twin concept.
Sustainability 16 05864 g001
Figure 2. CNCITY digital twin: integrated control solution.
Sustainability 16 05864 g002
Figure 3. Research Process.
Sustainability 16 05864 g003
Figure 4. Visualized gas pressure.
Sustainability 16 05864 g004
Figure 5. Prediction results using raw data.
Sustainability 16 05864 g005aSustainability 16 05864 g005bSustainability 16 05864 g005c
Figure 6. Prediction results using simulation data (2%).
Sustainability 16 05864 g006aSustainability 16 05864 g006bSustainability 16 05864 g006c
Figure 7. Prediction results using simulation data (3.5%).
Sustainability 16 05864 g007aSustainability 16 05864 g007bSustainability 16 05864 g007c
Figure 8. Prediction results using simulation data (5%).
Sustainability 16 05864 g008aSustainability 16 05864 g008bSustainability 16 05864 g008c
Table 1. Research on predictive models.
YearIndustryField of PredictionModelAuthor
2019ManufacturingSurface Roughness PredictionHMM (Hidden Markov Models)Ghosh, Ullah, and Kubo
2021ManufacturingProduct Life PredictionCycle GAN (Generative Adversarial Networks)Qin, Wu, and Luo
2022LobotsTrajectory predictionGA (Genetic Algorithm)Liu, Jiang, Tao, Jiang, Sun, Kong, … and Chen
2023EnvironmentAtmospheric turbulenceCNN (Convolutional Neural Networks)Liu, Yu, Tang, Cao, Li, Deng, … and Shi
2019GasAir Booster Compressor (ABC) MotorLSTM (Long Short-Term Memory)Abbasi, Lim, and Yam
2020GasPumpSVM (Support Vector Machines), MLP (Multi-Layer Perceptron)Orrù, Zoccheddu, Sassu, Mattia, Cozza, and Arena
2020GasPipelineGANafey, Zoghaib, and Omar
2021GasPipelineDNN (Deep Neural Network)Kim, Chae, Han, Park, and Lee
2022GasPipelineShortcut ENN (Elman neural network), LSTMZhou, Jia Ma, Shao Huang, Hao, and Li
2023GasPipelineMTAD-GAN (Multivariate Time-series Anomaly Detection via Graph Attention Network)Lian, Geng, and Tian
2024GasStorage tankSVM (Support Vector Machines), CNN, LSTMWu Yang, Sun, Cui, and Wang
Table 2. Secondary gas pressure data set.
Date
(Year.Month.Day. Hour:Minute:Second)
Secondary Gas Pressure
2022.11.01. 00:00:001.98100
2022.11.01. 00:05:001.99000
2022.11.01. 00:10:001.95900
2022.11.01. 00:15:002.01800
2022.11.01. 00:20:002.04200
2022.11.01. 00:25:001.99500
2022.11.01. 00:30:001.97000
2022.11.01. 00:35:002.01800
Table 3. Variables for generating synthetic data.
VariablesDescription
Mean of pressure (m)The average of the past 30 data at the time we want to predict
Standard deviation (s)m × (5%/3.5%/2%)
DistributionGenerating a random number that follows a normal distribution
Table 4. The grid search results.
Model (p, D, q)AIC
ARIMA (0, 1, 0)−221,606.602
ARIMA (3, 1, 1)−236,114.407
ARIMA (2, 1, 1)−236,075.939
ARIMA (3, 1, 0)−235,600.263
ARIMA (3, 1, 2)−236,094.948
ARIMA (2, 1, 0)−234,407.519
ARIMA (2, 1, 2)−237,023.216
ARIMA (1, 1, 2)−235,983.543
ARIMA (2, 1, 3)−236,041.552
ARIMA (1, 1, 1)−235,995.686
ARIMA (3, 1, 3)−236,100.239
Table 5. Performance evaluation results.
RMSEMAPER2
RegressionRaw Data0.067700.018560.60871
2%0.043920.017900.65000
3.5%0.043920.017900.63586
5%0.043920.017900.61352
ARRaw Data0.016800.006450.94276
2%0.030170.012230.81795
3.5%0.030950.012530.80823
5%0.032170.012980.79270
MARaw Data0.033770.013430.83868
2%0.037020.014780.77040
3.5%0.039860.015950.72493
5%0.042120.016880.68576
ARMARaw Data0.015930.006180.94854
2%0.030060.012150.81866
3.5%0.031570.012800.79999
5%0.033010.013400.78403
ARIMARaw Data0.015750.006090.94993
2%0.029890.012080.82224
3.5%0.031870.012940.79851
5%0.033030.013410.78466
ETSRaw Data0.017510.006720.93941
2%0.030330.012280.81855
3.5%0.031600.012750.80501
5%0.032780.013210.79231
Disclaimer/Publisher’s Note: The statements, opinions and data contained in all publications are solely those of the individual author(s) and contributor(s) and not of MDPI and/or the editor(s). MDPI and/or the editor(s) disclaim responsibility for any injury to people or property resulting from any ideas, methods, instructions or products referred to in the content.