Article

Three-Dimensional Modeling and Analysis of Ground Settlement Due to Twin Tunneling Using GIS

by
Ji-seok Yun
1,
Han-eol Kim
2 and
Han-kyu Yoo
3,*
1
Department of Smartcity Engineering, Hanyang University, 55 Hanyangdaehak-ro, Sangnok–gu, Ansan 15588, Republic of Korea
2
Department of Geotechnical Engineering Research, Korea Institute of Civil Engineering and Building Technology, Goyang 10223, Republic of Korea
3
Department of Civil and Environmental Engineering, Hanyang University, 55 Hanyangdaehak-ro, Sangnok–gu, Ansan 15588, Republic of Korea
*
Author to whom correspondence should be addressed.
Sustainability 2024, 16(14), 5891; https://doi.org/10.3390/su16145891
Submission received: 16 May 2024 / Revised: 19 June 2024 / Accepted: 9 July 2024 / Published: 10 July 2024

Abstract

:
Ground settlement occurs because of the surrounding ground behavior during tunnel excavation. A high chance of its occurrence could cause the collapse of buildings; therefore, the accurate prediction and assessment of ground settlement are necessary when structures are concentrated in urban regions. This study leverages Geographic Information Systems (GIS) and 3D modeling to evaluate the effects of tunnel excavation on the ground settlement and damage of buildings along the Mandeok–Centum underground highway in Busan. It integrates the field topography with building data to simulate and visualize construction-induced interactions. Numerical analysis is used to assess the effects of the terrain elevation, building presence, excavation sequences, and lag distance between the twin tunnels on the settlement. The results indicate that high terrain elevation, dense building layouts, and shorter distances between tunnels increase settlement. Furthermore, this study deduces that bidirectional excavation causes a rapid increase in settlement compared with parallel excavation, which is evident from the variations in the inflection points during the excavation process. Finally, this study estimates the damage to buildings and ground settlements and visualizes risk maps using GIS, emphasizing the practicality of 3D modeling based on GIS.

1. Introduction

Urban underground construction has been proven to be highly effective in reducing traffic congestion in densely populated cities [1,2]. The effective utilization of underground spaces requires proximity construction, such as twin tunnels, which balances construction efficiency with the minimization of environmental effects. This strategy has been widely applied in cities, such as London’s Crossrail (Elizabeth Line), Switzerland’s Gotthard Base Tunnel, and New York City’s East Side Access. However, underground excavations could encounter issues such as ground settlement and adjacent tunnel deformation, potentially leading to structural failure [3,4,5]. Therefore, the prediction and monitoring of the ground behavior and surface settlement due to tunneling are essential [6].
Various studies have been conducted on twin tunnels. Zhou et al. [7] proposed a method for predicting the surface settlement based on the excavation of tunnels built near existing tunnels. The stratum deformation prediction equation for twin tunnels was superimposed based on Peck’s empirical theoretical equation. Islam and Iskander [8] studied the relative positions of the twin tunnels. This study suggested that side-by-side tunneling typically results in a lower magnitude of settlement compared to the other arrangements. Mirhabibi and Soroush [9] presented different aspects of twin tunnel and building interactions. They suggested that the stiffness of the building affected the ground settlement and that the weight of the building should be considered in simulations to ensure reliable results. Gong et al. [10] conducted a case study of twin tunnels underpassing a historical masonry building in soft clay. Through a comparison of the numerical analysis between the greenfield and the presence of the building, this study emphasized that the stiffness and weight of the building affected the transverse and longitudinal settlements. Aswathy [11] studied twin tunnel excavations by accurately simulating the material properties and dimensions of all the building components. This study suggested that more realistic simulation procedures for all features of buildings and soils significantly affect the evaluation of settlement and damage to buildings.
Almost all research on twin tunnel construction focuses on the prediction of ground deformation, considering only the state of greenfield sites or single buildings. However, studies that include the terrain and multiple buildings have not yet been conducted. Topography and buildings are parameters that significantly affect settlement during tunnel excavation [12,13,14,15]. To accurately predict and analyze ground settlement owing to tunneling, a three-dimensional (3D) model that precisely simulates the construction location must be established. Geographic Information Systems (GIS) can effectively analyze the effects of tunnel excavation considering the terrain and buildings. Integrating GIS with 3D modeling enhances the settlement prediction accuracy and helps visualize the effects [16,17,18].
This study analyzed the effects of twin tunnel excavation by developing a 3D model that incorporates both topography and existing urban structures using GIS. The model simulated a tunnel section located in the densely built environment of the Mandeok–Centum underground expressway in Busan using Midas GTX NX. Parameters such as the terrain, building presence, excavation sequences (parallel and bidirectional), and lag distances (1D, 2D, 3D, and 4D) were analyzed to assess the effects of twin tunnel excavation. The results of the numerical analyses were used to create a risk map, which was visualized using a GIS to assess and display the effects of tunneling.

2. Literature Review

2.1. Ground Settlements

Volume loss inevitably occurs when a tunnel is excavated. Ground settlement occurs as volume loss occurs, which affects the adjacent structures and could even cause damage. In urban areas where diverse building structures are present, the control of surface settlement is a crucial consideration.
The Gaussian curve, proposed by Peck [19] and substantiated by extensive field data and experiments, is a prevalent method for predicting surface settlement during tunneling. This method illustrates the ground settlement and volume loss using a ground settlement curve (Figure 1) defined as a function of the maximum settlement ( S m a x ) and inflection point (i), as expressed in Equation (1). The inflection area plays a major role in determining the width of the ground settlement curve; it significantly affects the structure because of its role in altering the shape of the curve. The determination of these two variables is the basis for predicting the ground settlement troughs.
Below is Equation (1), where S v denotes
S v x = S m a x ·   exp ( x 2 2 i 2 )
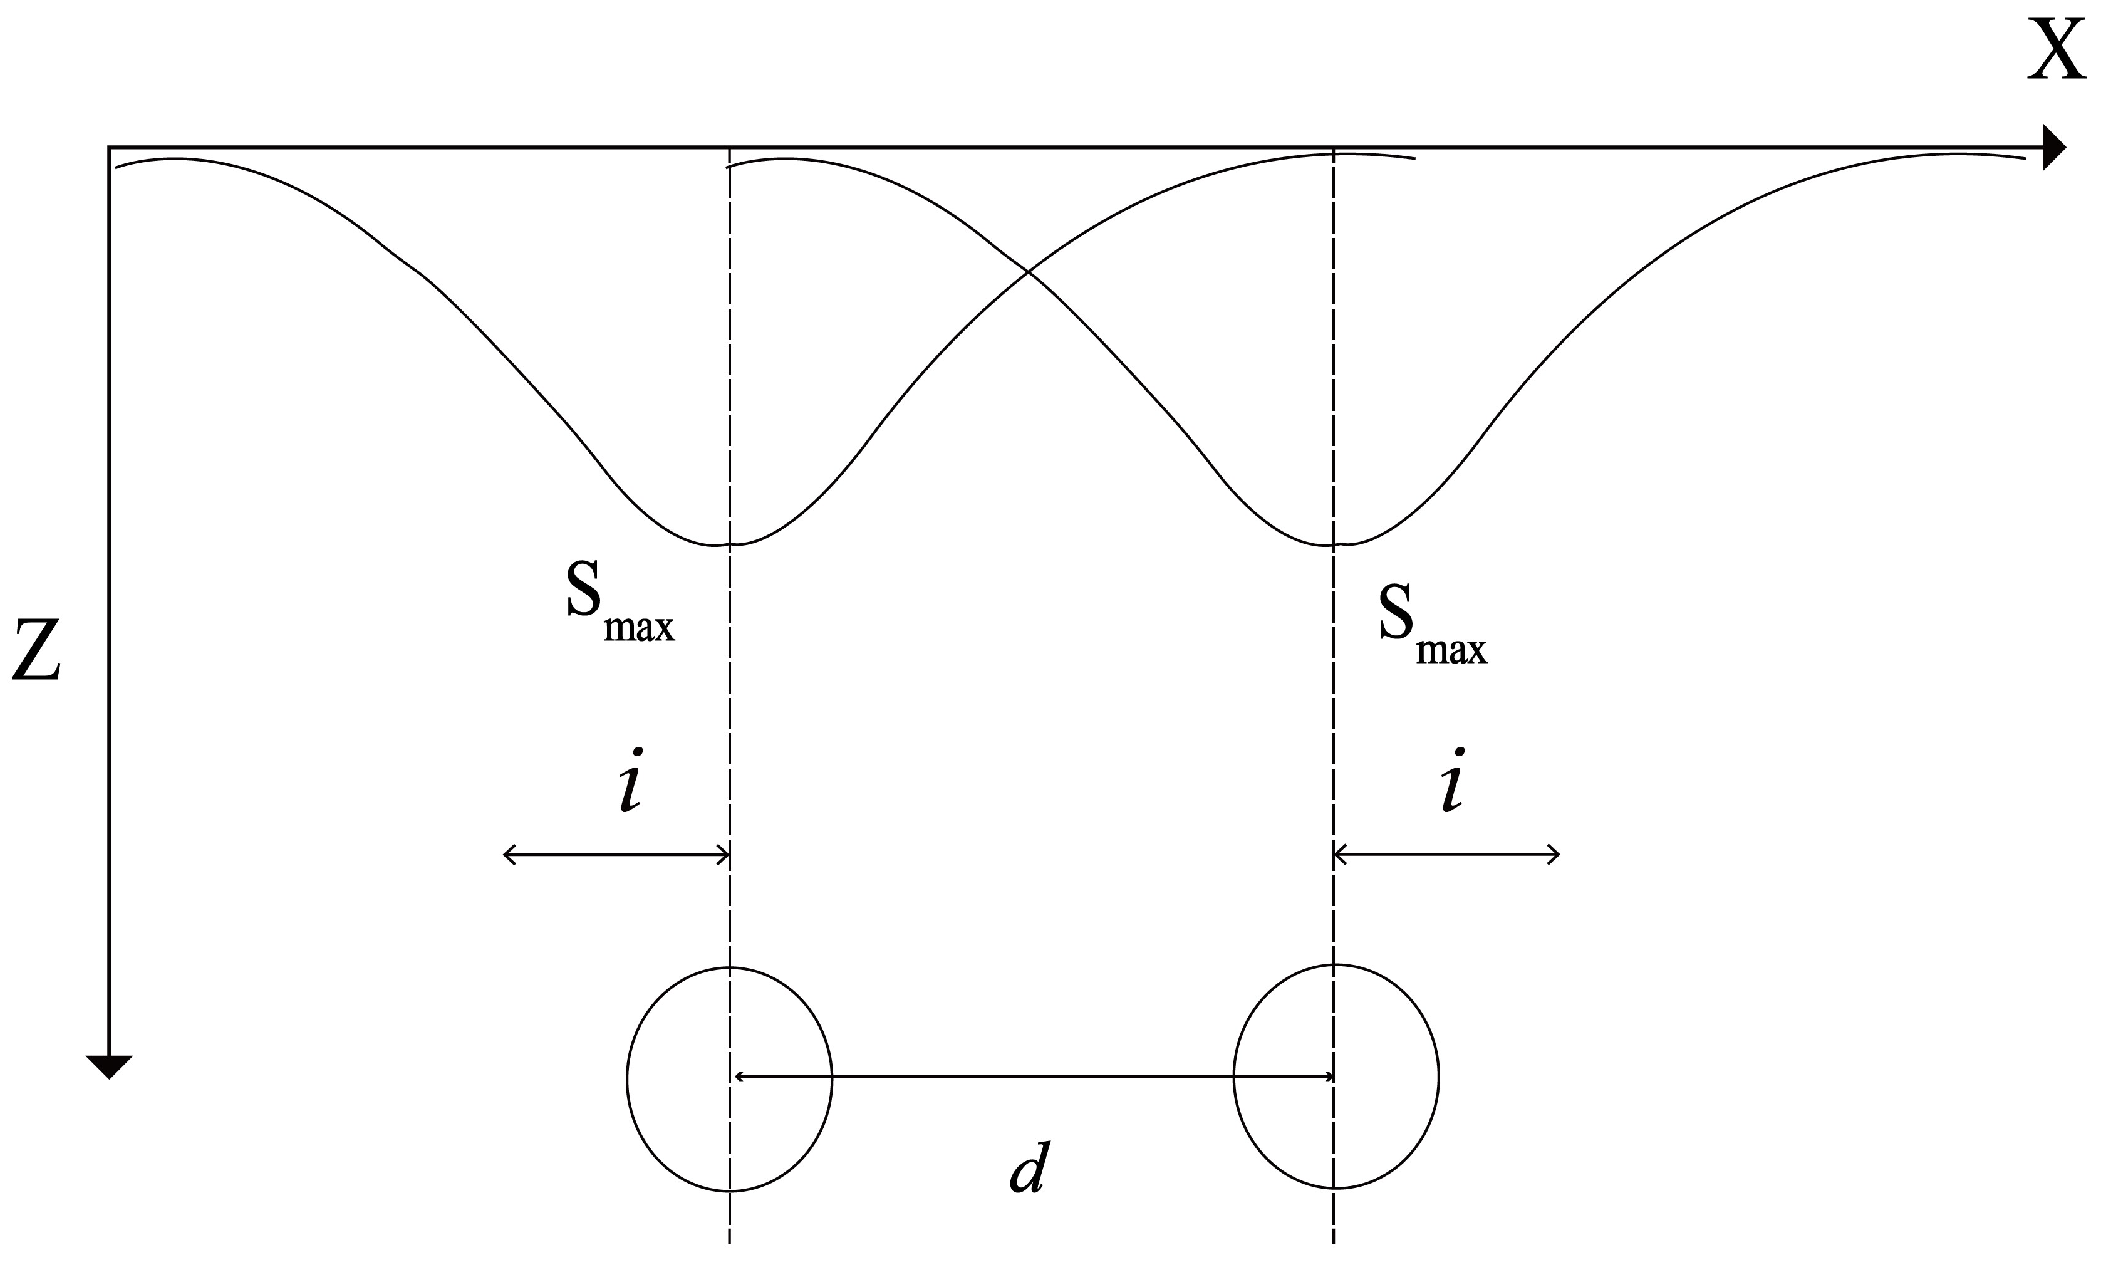
O’Reilly and New [21] proposed a method to assess the ground settlement caused by twin tunnel excavation using superposition without considering the interaction effects. Their proposal was one of the most widely used empirical approaches. This method aggregated the settlement troughs above each tunnel, as shown in Equation (2), where d represents the distance between the twin tunnel centers, and x is the lateral distance from the centerline of the first excavated tunnel. Figure 2 shows the prediction method using Peck’s empirical formula theory and the Cartesian coordinate system [22].
S x , z = S m a x [ e x p x 2 2 i 2 + ( e x p ( x d ) 2 2 i 2 ) ]
However, engineering examples and research showed that when twin tunnels were close, there were significant differences between the settlement curves of the tunnel built first and that built second [23,24]. These differences mainly resulted from the stiffness degradation caused by disturbances in the soil during the excavation of the first tunnel, which was also responsible for the asymmetry of the final settlement curve [25]. Ma [26] presented a superposition diagram of the ground settlement of twin tunnels, considering their interactions (Figure 3).
These approaches are theoretical methods focused solely on greenfield sites without topographical and structural considerations and are overly conservative [27]. In addition to these methods, numerical methods that use continuum near approximation approaches, such as the finite element method (FEM), to estimate ground deformation were used to predict ground settlement [28,29,30,31]. To elaborate further, FEM software can predict ground settlement by applying 2D or 3D models and considering the topography and buildings. Therefore, in this study, numerical methods employing FEM were used to estimate the deformation of the ground considering the terrain and buildings.

2.2. Estimation of Building Damage

Given the varied structural conditions of buildings and potential ground settlement, it is critical to assess the risks associated with tunnel excavation. The estimation of settlements is integral to evaluating potential damage and ensuring the structural stability of buildings, as noted by Marshall [32]. Considerable research has focused on the hazards posed by surface settlement during tunneling. Sowers [33] studied different structures for establishing maximum permissible settlements. Bjerrum [34] suggested that the angular distortion threshold for differential settlements caused by structural displacements, advocating for angular distortions exceeding 1/500, should be avoided to prevent damage. Extending these concepts, Rankin [35] proposed a damage assessment method based on the maximum slope of settlements.
Although Sowers, Bjerrum, and Rankin concentrated on vertical displacements, their study did not encompass the horizontal displacements associated with tunneling. Addressing this gap, Boscardin and Cording [36] proposed a comprehensive method based on the strain theory, which included 3D ground movements. Their approach accounted for both vertical and lateral strains, thereby offering a robust criterion for evaluating building stability and potential damage (Table 1). This standard continues to inform contemporary research and has been applied to assess building damage in various geological settings. In practice, damage assessment typically relies on the measurement of the final displacement after tunnel excavation. To enhance the accuracy of such evaluations, it is essential to comprehensively analyze the ground settlement. This involves considering both the vertical settlement and lateral strain effects on structures [37].

3. Project Overview and 3D Model Considering Topography and Building

3.1. Location and Geology

Busan, the second largest city in South Korea, has a dense population, especially in downtown areas with various infrastructure and modes of transportation. This phenomenon has led to major traffic jams affecting both public transportation systems and private vehicle usage. To mitigate these problems, the development of a transport system such as an underground highway has been a promising solution.
Figure 4 shows the main route and layout of the road in Busan, along with the study site. The Mandeok–Centum underground highway section, a pioneering high-depth underground roadway in Busan, spans 9.62 km as a round-trip four-lane road. It features a twin tunnel with a length of 8.96 km that connects Suyeonggangbyeon-daero in Jaesong-dong, Haeundae-gu, to Mandeok-daero in Mandeok-dong, Buk-gu. The cross-sectional area of the tunnel excavation near Minam Station, the study area, was 94.9 m2, and it was executed using the NATM method.
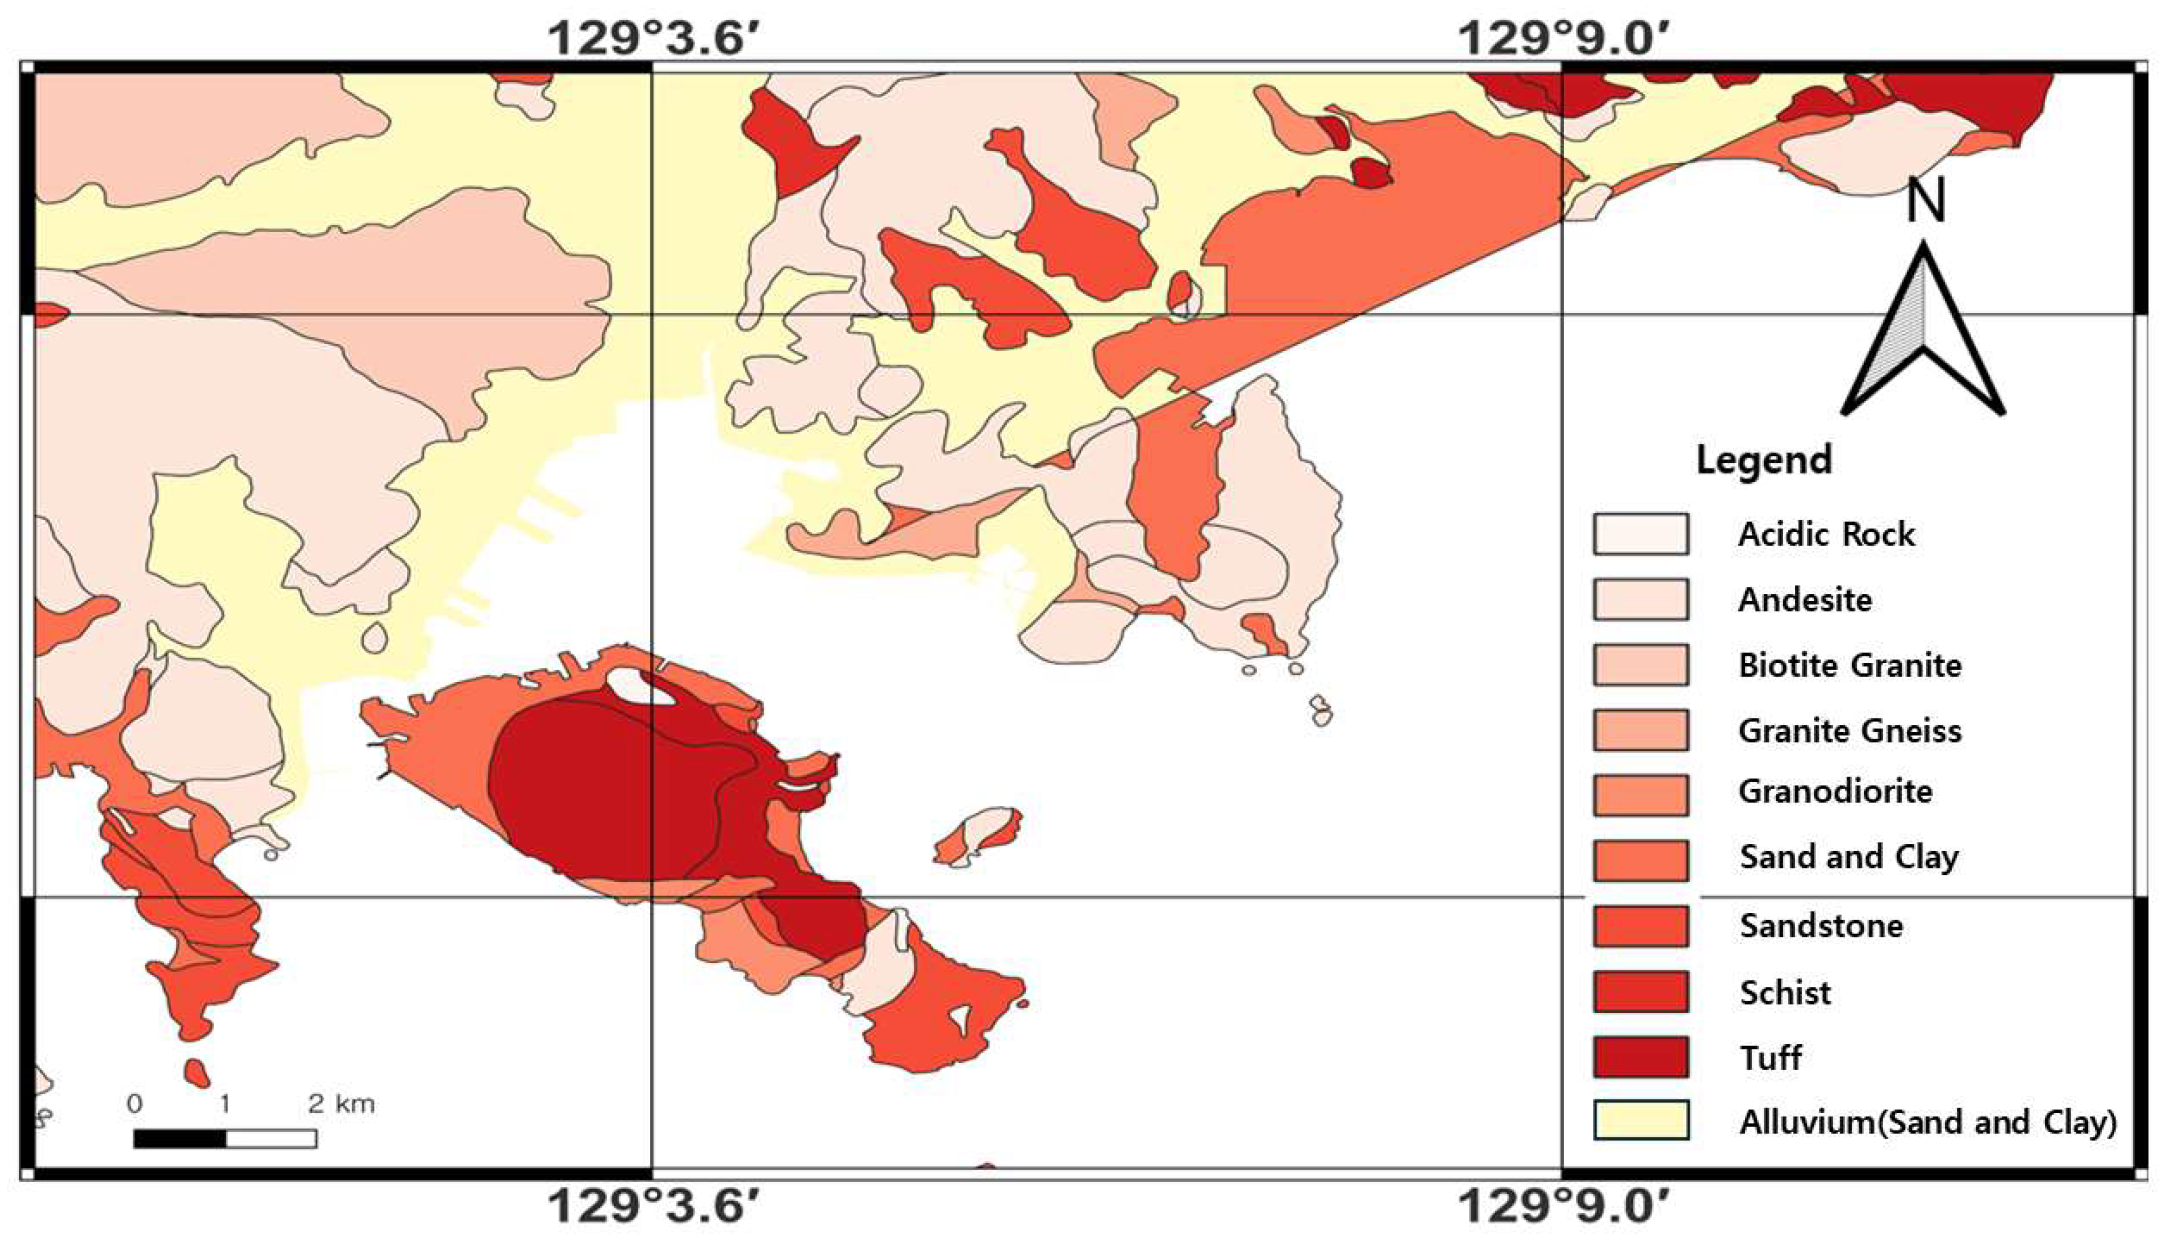
Geographically, Busan has a mountainous terrain with many volcanoes and several adjacent volcanoes. Owing to these geological attributes, the city is covered with granite rock such as andesite and alluvium such as sand and clay (Figure 5). Granite is generally strong and hard, with outstanding groundwater preservation capabilities and excellent ground stability properties. In the 40 m depth zone where the tunnel excavation is placed, the soil profile is relatively uniform throughout the entire city area. This is an ideal condition for tunnel excavation because variable ground conditions do not usually exist and there are no faults.

3.2. 3D Model Using GIS Information

The main purpose of designing a 3D model is to accurately illustrate the construction area. In this study, a 3D model was generated using actual topography and building information, and FEM software was used for the numerical analysis. Finally, a risk map was created to visualize the results of the tunnel excavation using GIS. To achieve this, the following five steps were performed:
  • GIS data were used for the topography and buildings.
  • Rhino and Grasshopper were used to create a 3D model identical to that of the field.
  • The FEM was used for the numerical analyses of the tunnel excavation.
  • The numerical analysis results were interpreted.
  • A GIS was used to visualize the effects of tunneling.
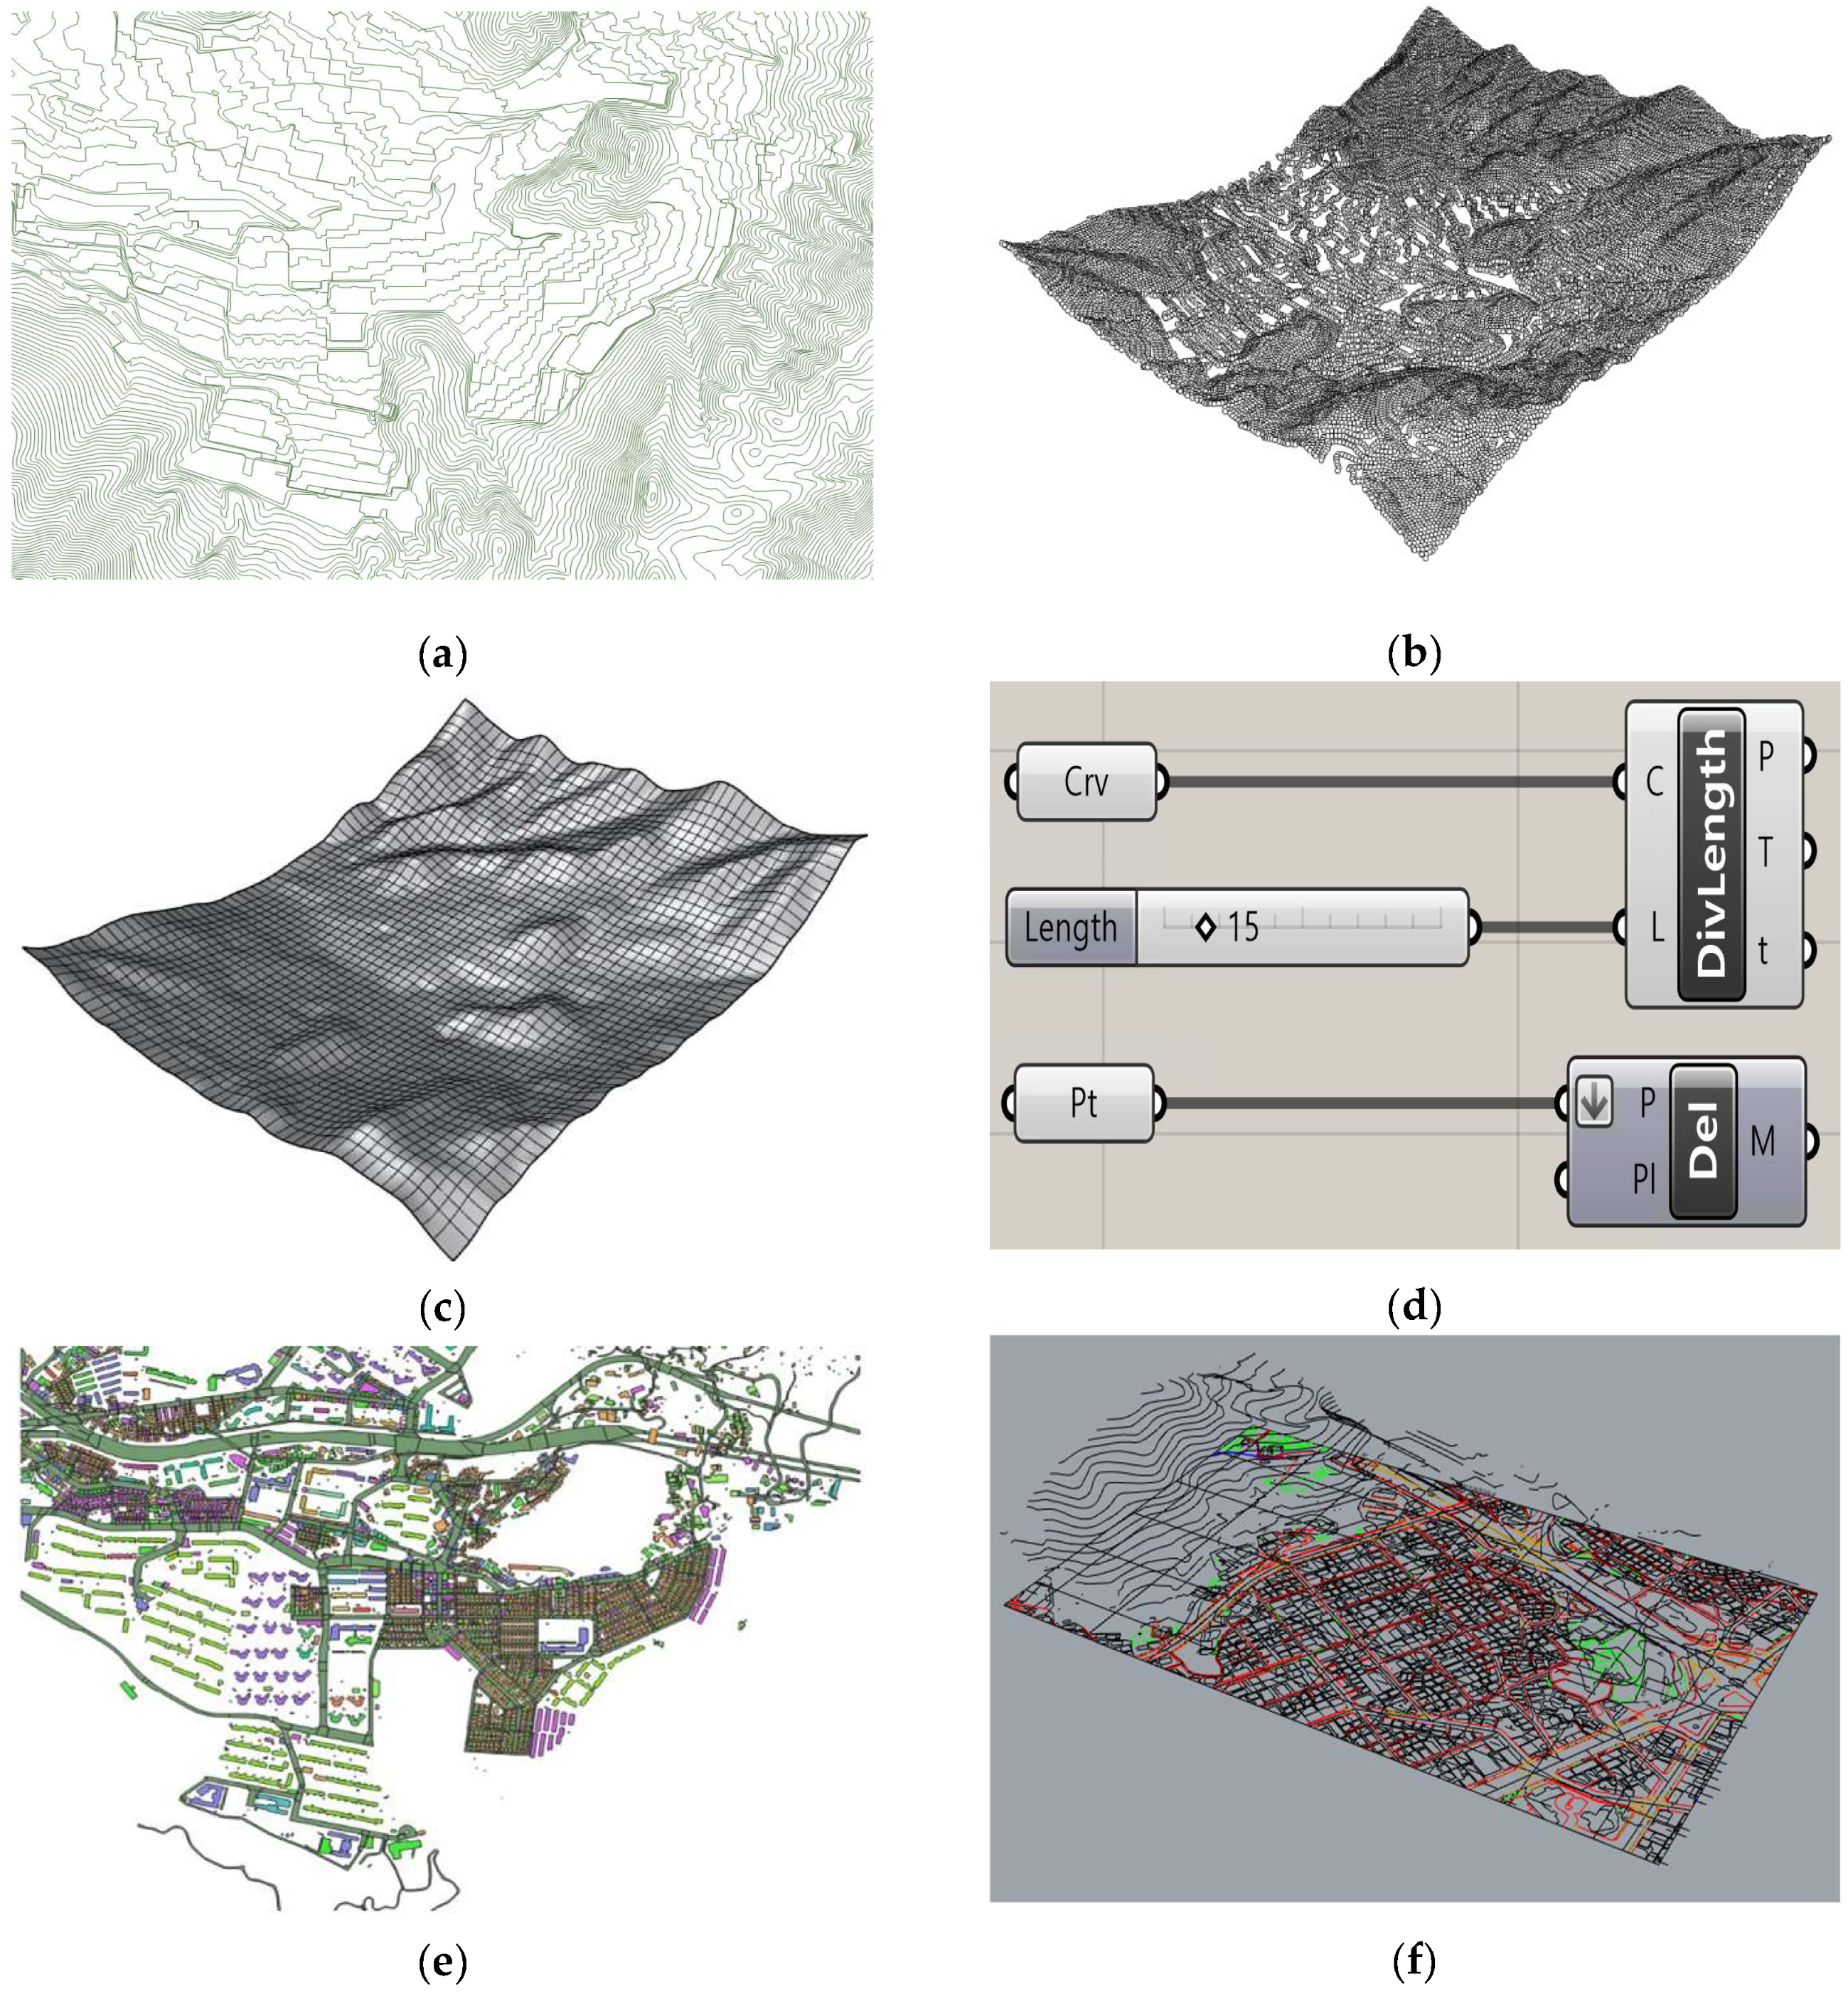
This section presents the 3D modeling process, beginning with the acquisition of topographic data from the Korea National Geographic Information Institute. The contour line file was integrated into GIS software (QGIS ver. 3.24) to ensure the accuracy of the elevation and contour alignments. Given the substantial volume of data provided, a systematic organization was essential to exclude irrelevant data, particularly overlapping lines, as depicted in Figure 6a. After modifying the data, contour line data were imported into the 3D CAD software Rhinoceros ver. 7. For the mesh generation, the nodes were systematically positioned at regular intervals on the contour line (Figure 6b). After entering the nodes, a topographic model was constructed using the Grasshopper optimization algorithm (GOA), as shown in Figure 6c. Figure 6d illustrates the application of the proposed algorithm. This algorithm consistently splits the line based on a specified length and allows for the generation of points or planes along the line [38].
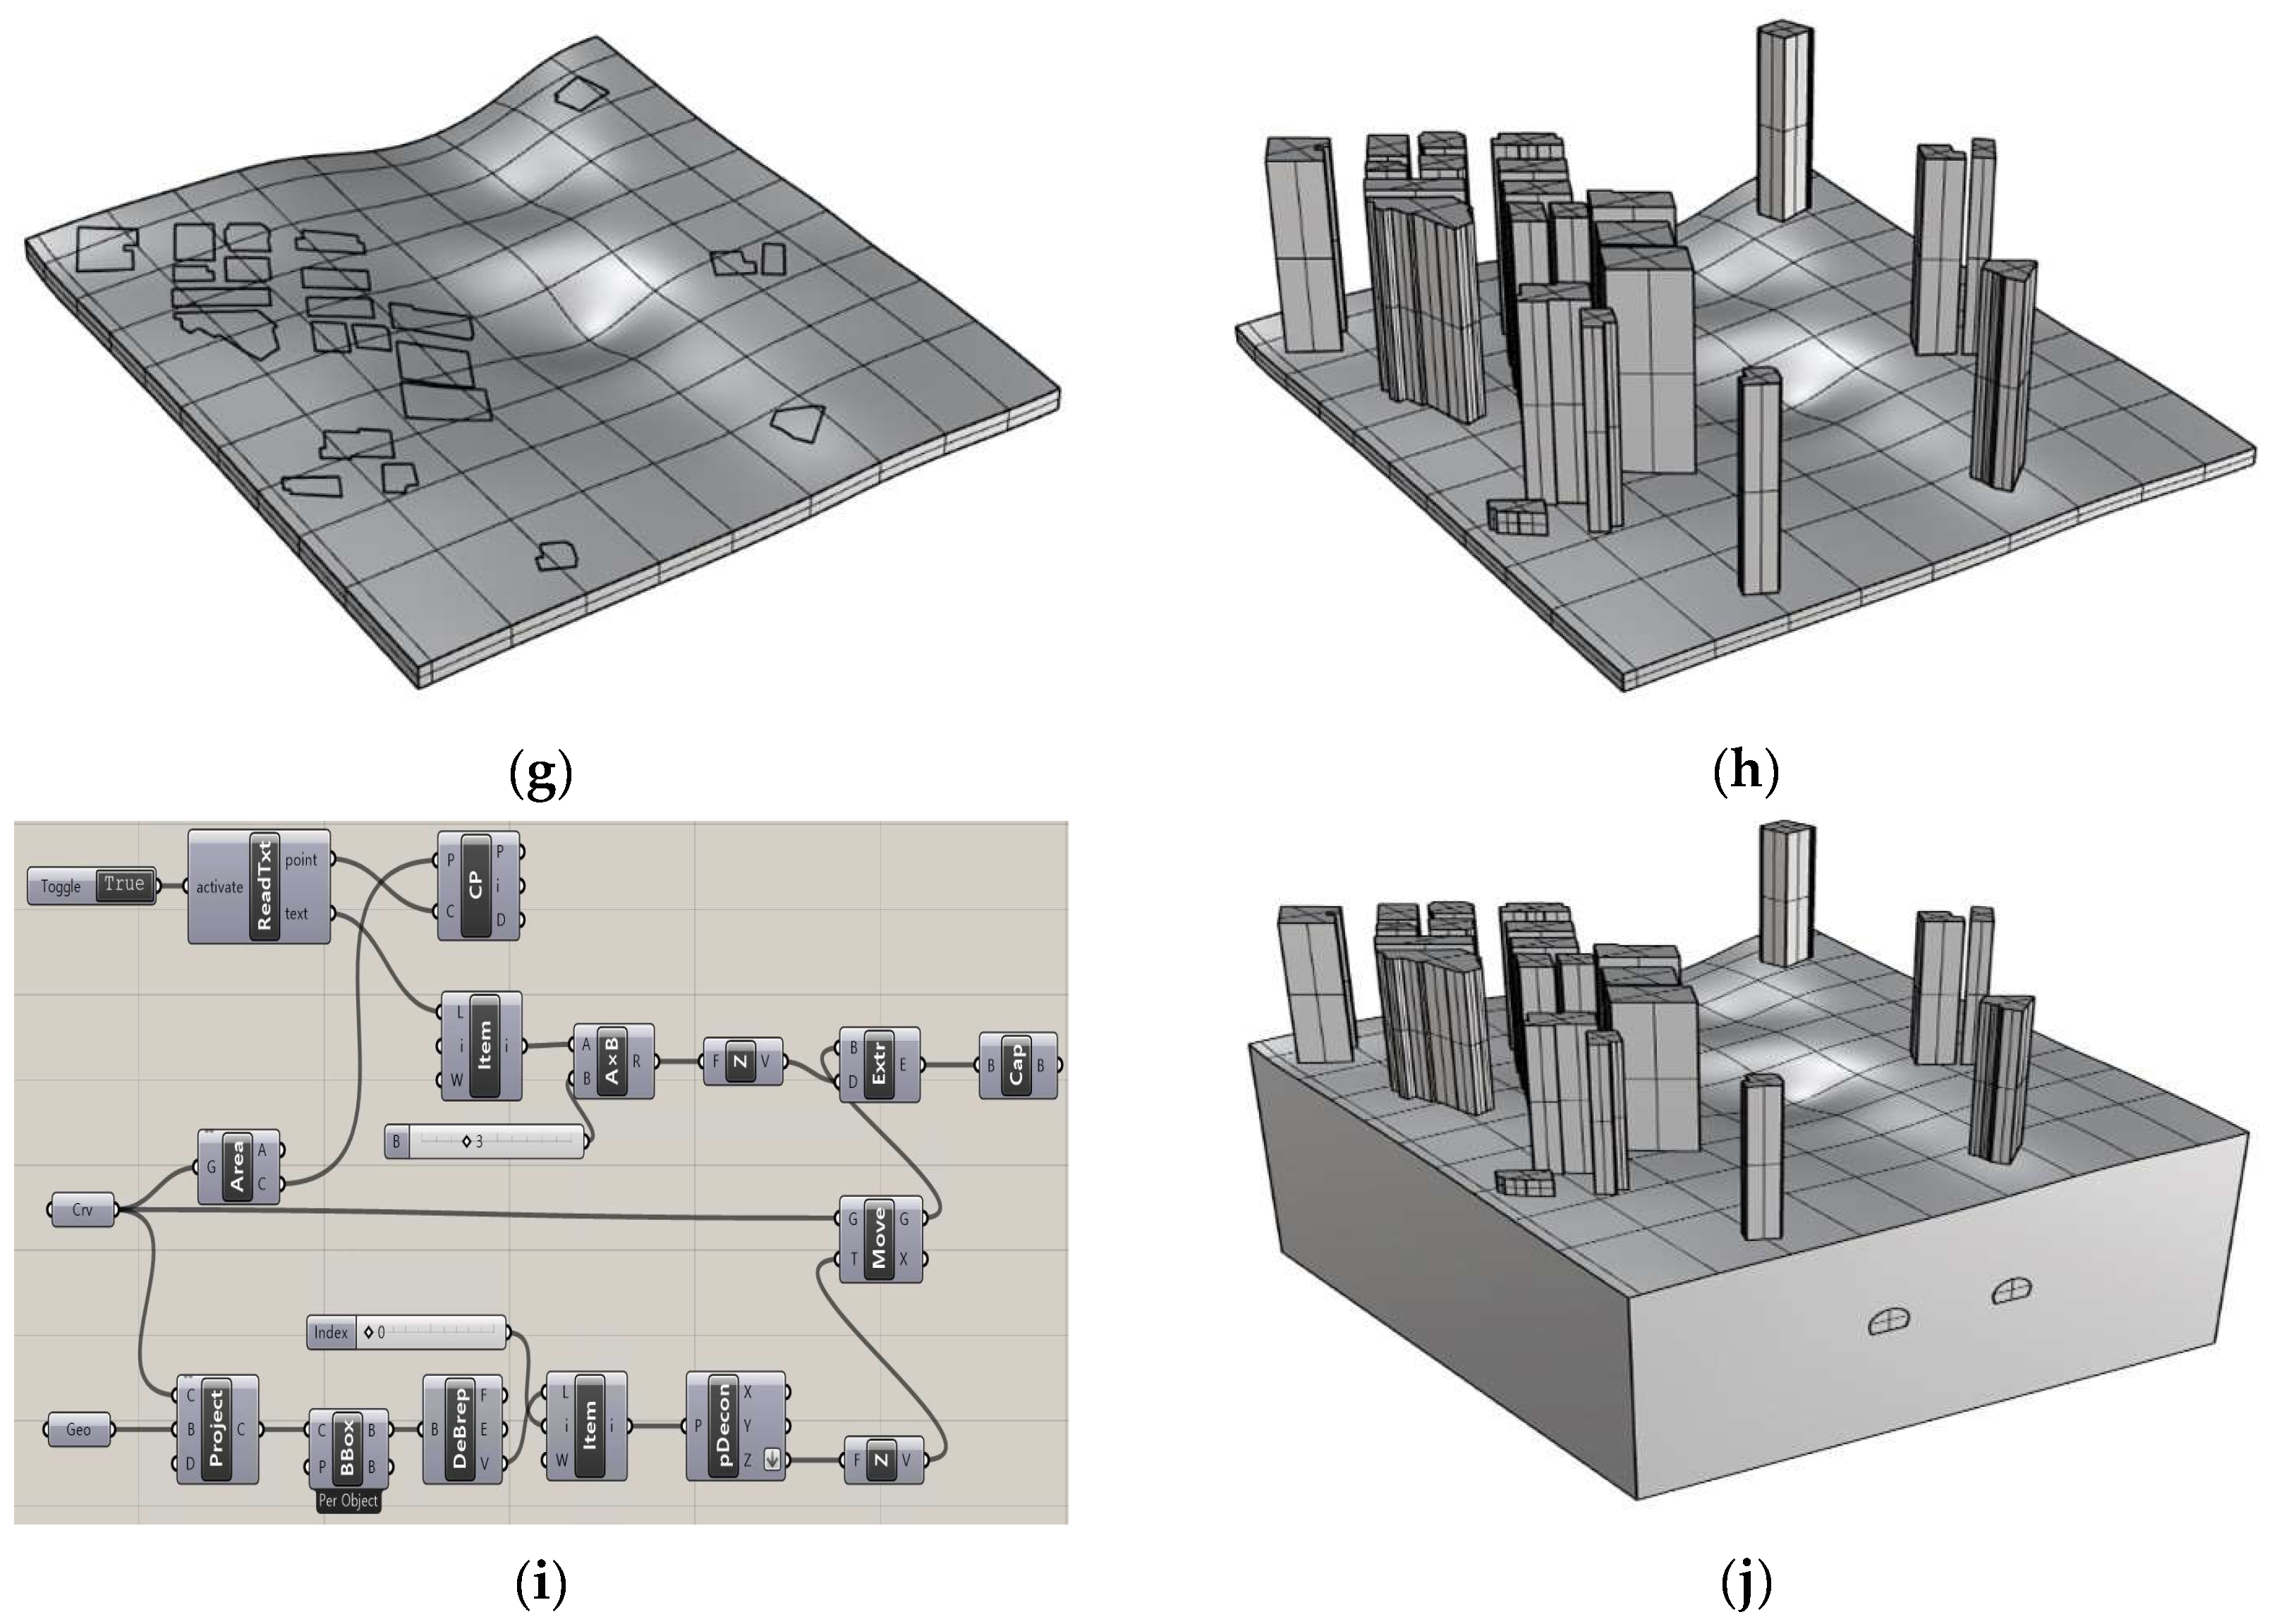
The building data were acquired from the Korea National Territory Information Platform. To refine the data for the target site, they were aligned meticulously using a designated survey map. This arrangement made it easier to gather and categorize building data based on the structural features and number of floors. Layer classification was performed, as shown in Figure 6e. The building data were then imported into Rhinoceros for integration with previously developed terrain models. An interface between the building and terrain model was established through data alignment, as depicted in Figure 6f, and the dimensions for the numerical analysis were set, as shown in Figure 6g. Finally, ground surface modeling was achieved by applying the number of floors in each building using the GOA (Figure 6h). The algorithm used in this study is illustrated in Figure 6i. Finally, the model constructed by considering the topography and buildings is shown in Figure 6j. The algorithm defined boundaries and basic areas through the lower face of the building then integrated them with the terrain model and utilized the pre-processed floor number data of the building in the integrated model to increase the number of floors in the building [38].
Midas GTS NX FEM software was used for the numerical analysis. The geotechnical properties required for this analysis, such as the standard penetration test (SPT) [39], soil density test [40], and direct shear test [41], were determined by field reports from the results measured through field and laboratory experiments. In addition, the final ground characteristics calculated through various empirical formulas and references are summarized in Table 2 [42,43,44,45,46,47]. The physical properties of the buildings and tunnels are listed in Table 3. The ground behavior was modeled using the Mohr–Coulomb criterion, whereas the shotcrete and building properties were considered to exhibit elastic behavior. The diameter of the tunnel was 2 m. After the tunnel excavation, soft shotcrete work was carried out and then conducted using hard shotcrete repeatedly. This study focused on the settlement analysis by considering shotcrete without additional support.
Figure 7 shows the 3D numerical analysis model. Figure 7a shows a flat ground condition that is commonly used in numerical analyses, and Figure 7b presents a topography scenario without a building. Figure 7c,d were generated by considering both the topography and buildings. The building model was in the shape of the lower plane and number of floors based on GIS data, and it was assumed that only the effect of the load was acting. Both side views of the model were used to aid in the analysis of the results. The numerical analysis cases are listed in Table 4. Cases 1, 3, and 5 employed 3D models to assess the effects of the topography and buildings, with slight variations in the tunnel depth owing to topographical considerations. Case 2 was designed to examine the effects of different excavation sequences for the twin tunnel, specifically by comparing simultaneous parallel and bidirectional excavation. Cases 4, 5, 6, and 7 were analyzed to estimate the surface settlement relative to the lag distance of the tunnels. Finally, the damage to the buildings was classified, and a risk map was created.

4. Results and Discussion

4.1. Ground Settlement

To refine the accuracy of ground settlement predictions, it is essential to employ a 3D modeling approach that accurately reflects the actual conditions of the tunneling field. This paper presents the results of a study on ground settlement caused by tunnel excavation in urban areas using a 3D model with various parameters.

4.1.1. Topographic Features and Building

In this section, the results of studies on the interactions between twin tunneling, topography, and surface buildings are presented (Cases 1, 3, and 5). Figure 8 shows the side and top views of the location of the settlement section analyzed in this study.
As illustrated in Figure 9, the existence of the surface building and the consideration of topography led to a difference in settlement compared with the flat condition. Figure 9a,b show the differences in the settlement according to the terrain at the initial excavation point of 0 m and at the final point of 200 m. At 0 m, the altitude of the flat-ground condition was higher, and at 200 m, the altitude was higher in the terrain-considered scenario. Park and Adachi [48] noted that the settlement intensified with increasing ground-inclined layers, which was almost in agreement with the results of the present study, in which the effect of tunnel excavation increased with an increase in the elevation of the terrain.
The presence of buildings significantly influences ground settlement, as shown in Figure 9. The figure illustrates that the maximum settlement occurs in scenarios in which both the topography and building scenarios are considered, compared with scenarios in which only the topography is considered. Figure 9c shows an uplift at the 20 m mark between three buildings post-tunneling, suggesting that structural loads from buildings predominantly affect the ground directly beneath them, with less impact on the narrow spaces between these structures. This indicates that the soil behavior in densely built areas may obscure the direct effects of the surface. The critical distance for the highest settlement, between 80 m and 120 m with an X-distance of 85 m, occurred in densely built areas, as shown in Figure 9d. Supporting earlier findings by Islam and Iskander [8], this study confirmed that settlement increased with a greater building load, demonstrating the substantial impact of the structural presence on ground settlement [9,49].

4.1.2. Sequence of Tunnel Excavation

Twin tunnels are traditionally excavated sequentially with one tunnel followed by the other. However, the simultaneous excavation of twin tunnels has been effectively implemented in several large infrastructure projects. This method is particularly preferred in urban areas and for construction projects such as underpasses, metro lines, and railway tunnels because of its advantages of reducing the construction time and minimizing ground disturbances. Notable examples include the Marmaray Tunnel in Istanbul and the Lee Tunnel Project in London. The simultaneous excavation of a twin tunnel can be performed in either parallel or bidirectional excavations. The results of the study on ground deformation caused by sequences of simultaneous excavations are presented in this section (Case 2).
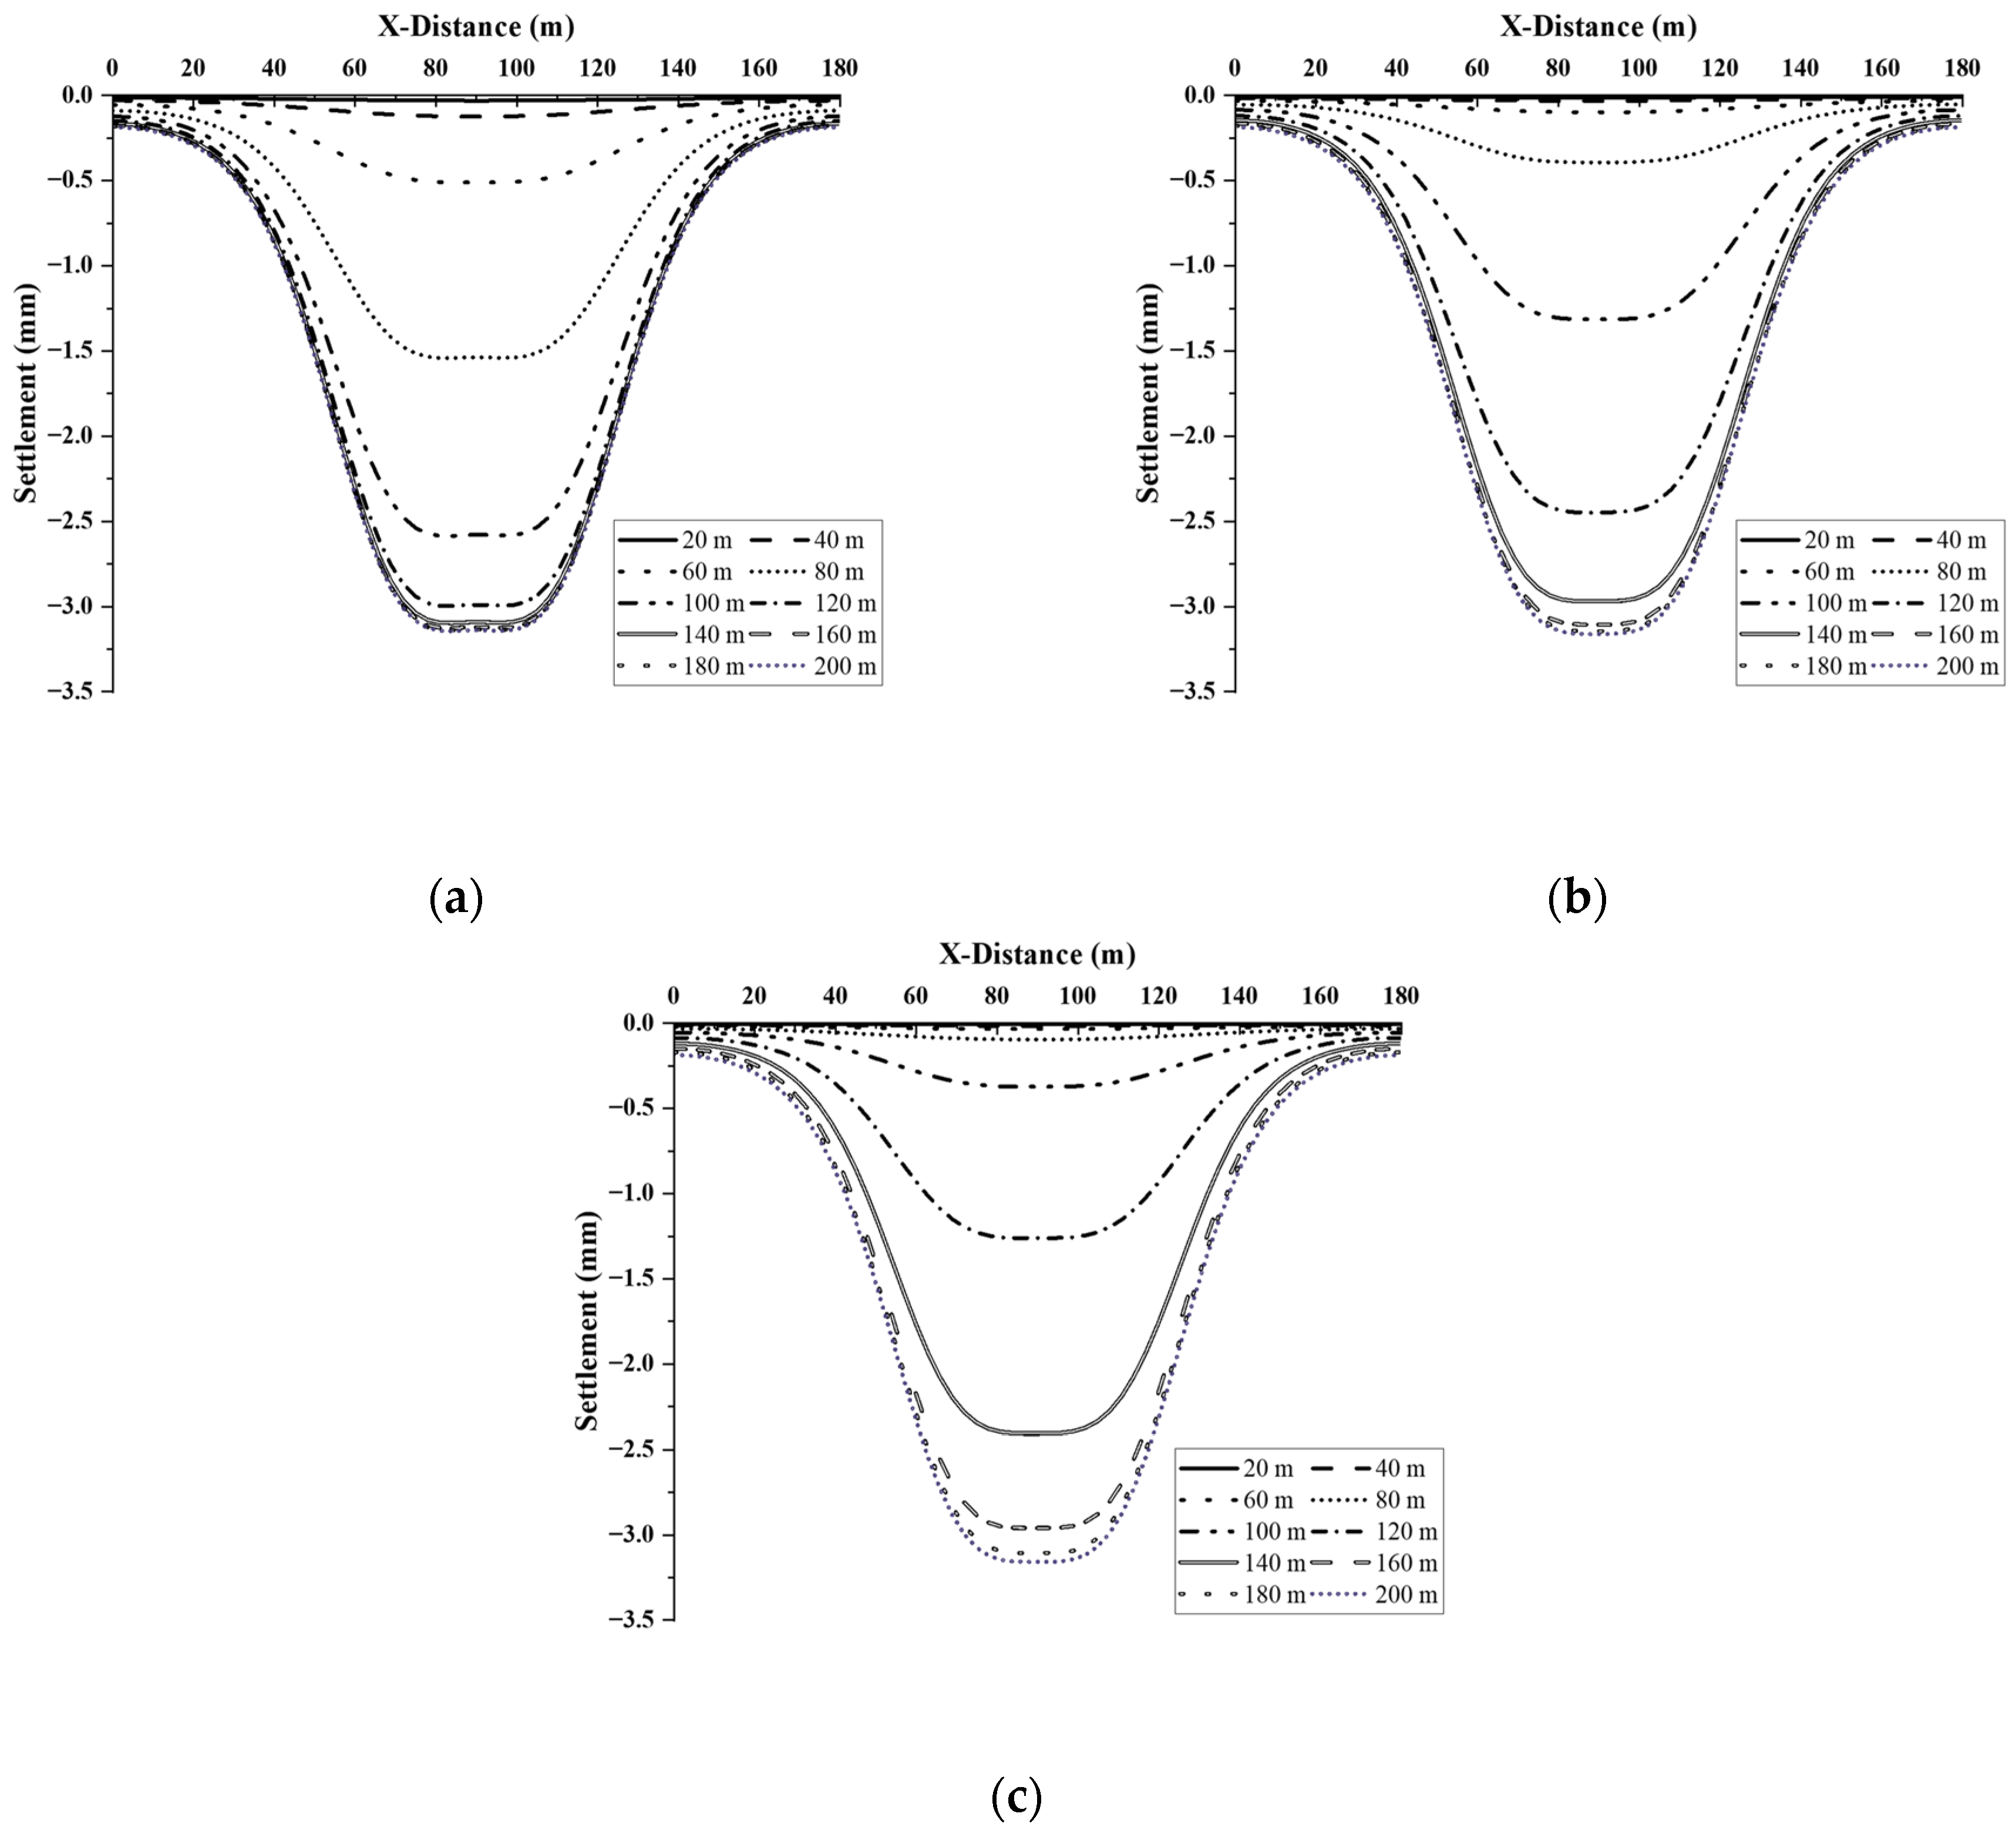
To identify the general differences according to the simultaneous construction method, the analysis focused on flat ground conditions. The transverse settlements are illustrated in Figure 10, where the parallel excavation maintains a nearly constant settlement trough. When excavations of 80, 100, and 120 m were conducted, the surface settlement converged to almost the final amount after approximately 40 m of excavation. Immediately after the tunnel excavation was located directly below the ground position, distinct settlement characteristics were observed at intervals of 20 m. Particularly, within the 80 m segment of the surface, the most significant increase in settlement occurred when the excavation extended to a length of 100 m. A further extension of the tunnel to 120 m led to a significant reduction in the rate of settlement growth. This behavior was consistently observed in both the 100 m and 120 m surface sections, exhibiting a consistent settlement response pattern as the tunnel excavation progressed.
Bidirectional excavation refers to the process of tunneling, where excavation activities are conducted simultaneously from two opposite ends towards a meeting point. Figure 11 shows the subsidence that occurred when bidirectional excavation was applied. The bidirectional excavation demonstrated a pattern distinct from that of the previously analyzed parallel excavation. As the tunnel excavation distance in all ground sections increased to 160 m or more, it converged uniformly with the final settlement. At the 100 m surface ground, a pattern similar to that observed with parallel excavation was observed, although the maximum settlement remained somewhat elevated until just before the completion of excavation. The most significant increase in settlement occurred when the tunnels were excavated between 80 and 100 m. This increase was attributed to the overlapping effects of the tunnels being excavated simultaneously from opposite directions. This interaction notably narrows the settlement trough, increasing the risk of rapid subsidence directly above the excavation site and affecting building stability.
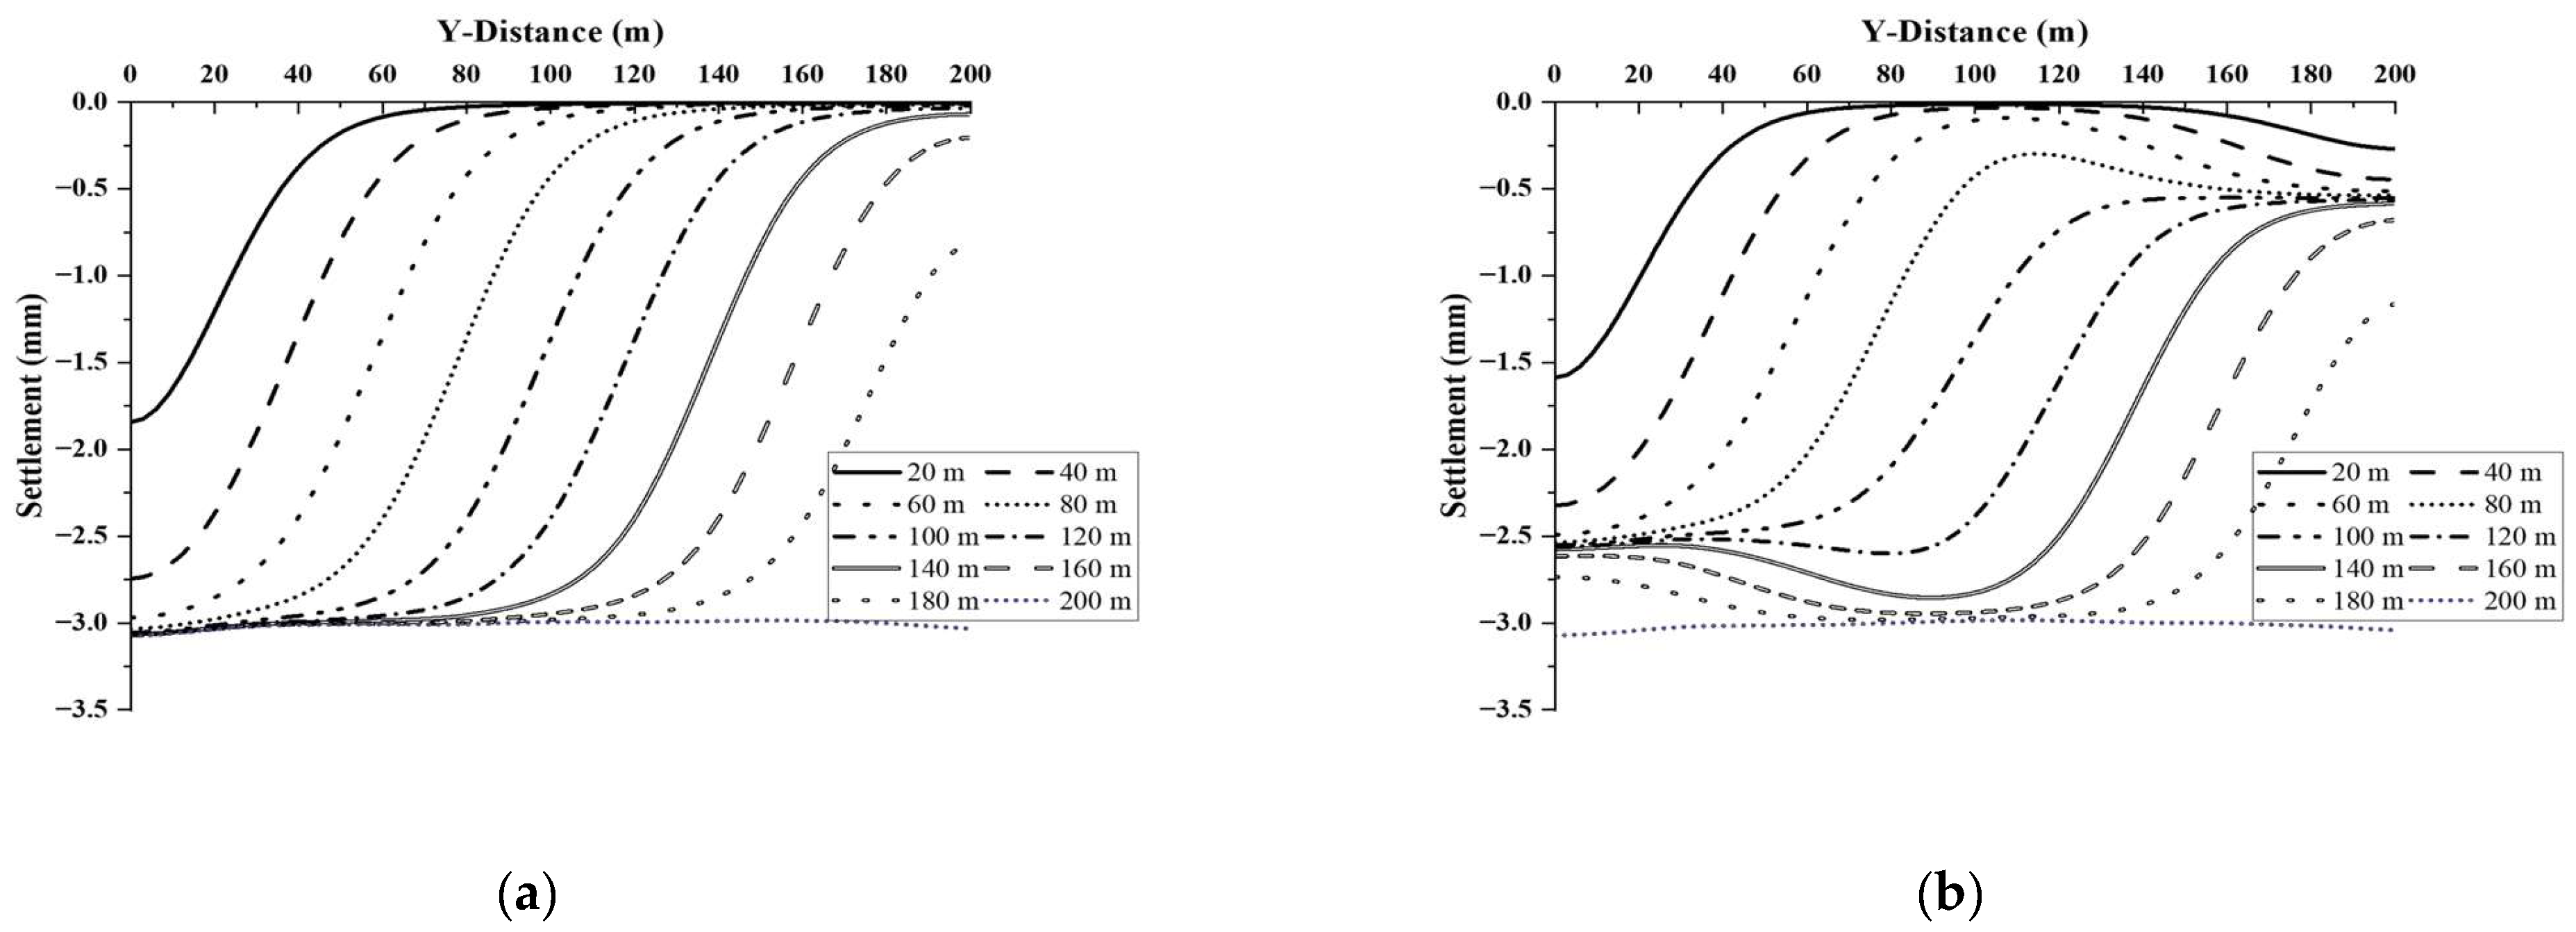
Chakeri et al. [50] mentioned that possible variable excavation sequences have minor effects on the ground surface. The final settlement at the time of excavation completion exhibited the same results as in the aforementioned study; however, there was a significant difference during the excavation. Figure 12 shows the stationary longitudinal settlement curve right above the crown. Initially, the settlement was more pronounced during parallel excavation; however, after reaching a location at 100 m, the settlement became more significant during bidirectional excavation (Figure 12a,b). After 100 m, because one tunnel had already been excavated, subsidence increased owing to the interaction between the two tunnels. Settlement alteration is evident from the shifting positions of the inflection points in the longitudinal subsidence caused by the two excavation methods. Figure 13 shows the inflection points identified for each excavation method relative to the tunnel excavation distance. The inflection point of bidirectional excavation is higher than that of parallel excavation at the beginning of tunneling; however, the position of the inflection point constantly changes to a lower position. This has the advantage of minimizing the initial settlement; however, caution is necessary because the settlement increases gradually.

4.1.3. Lag Distance

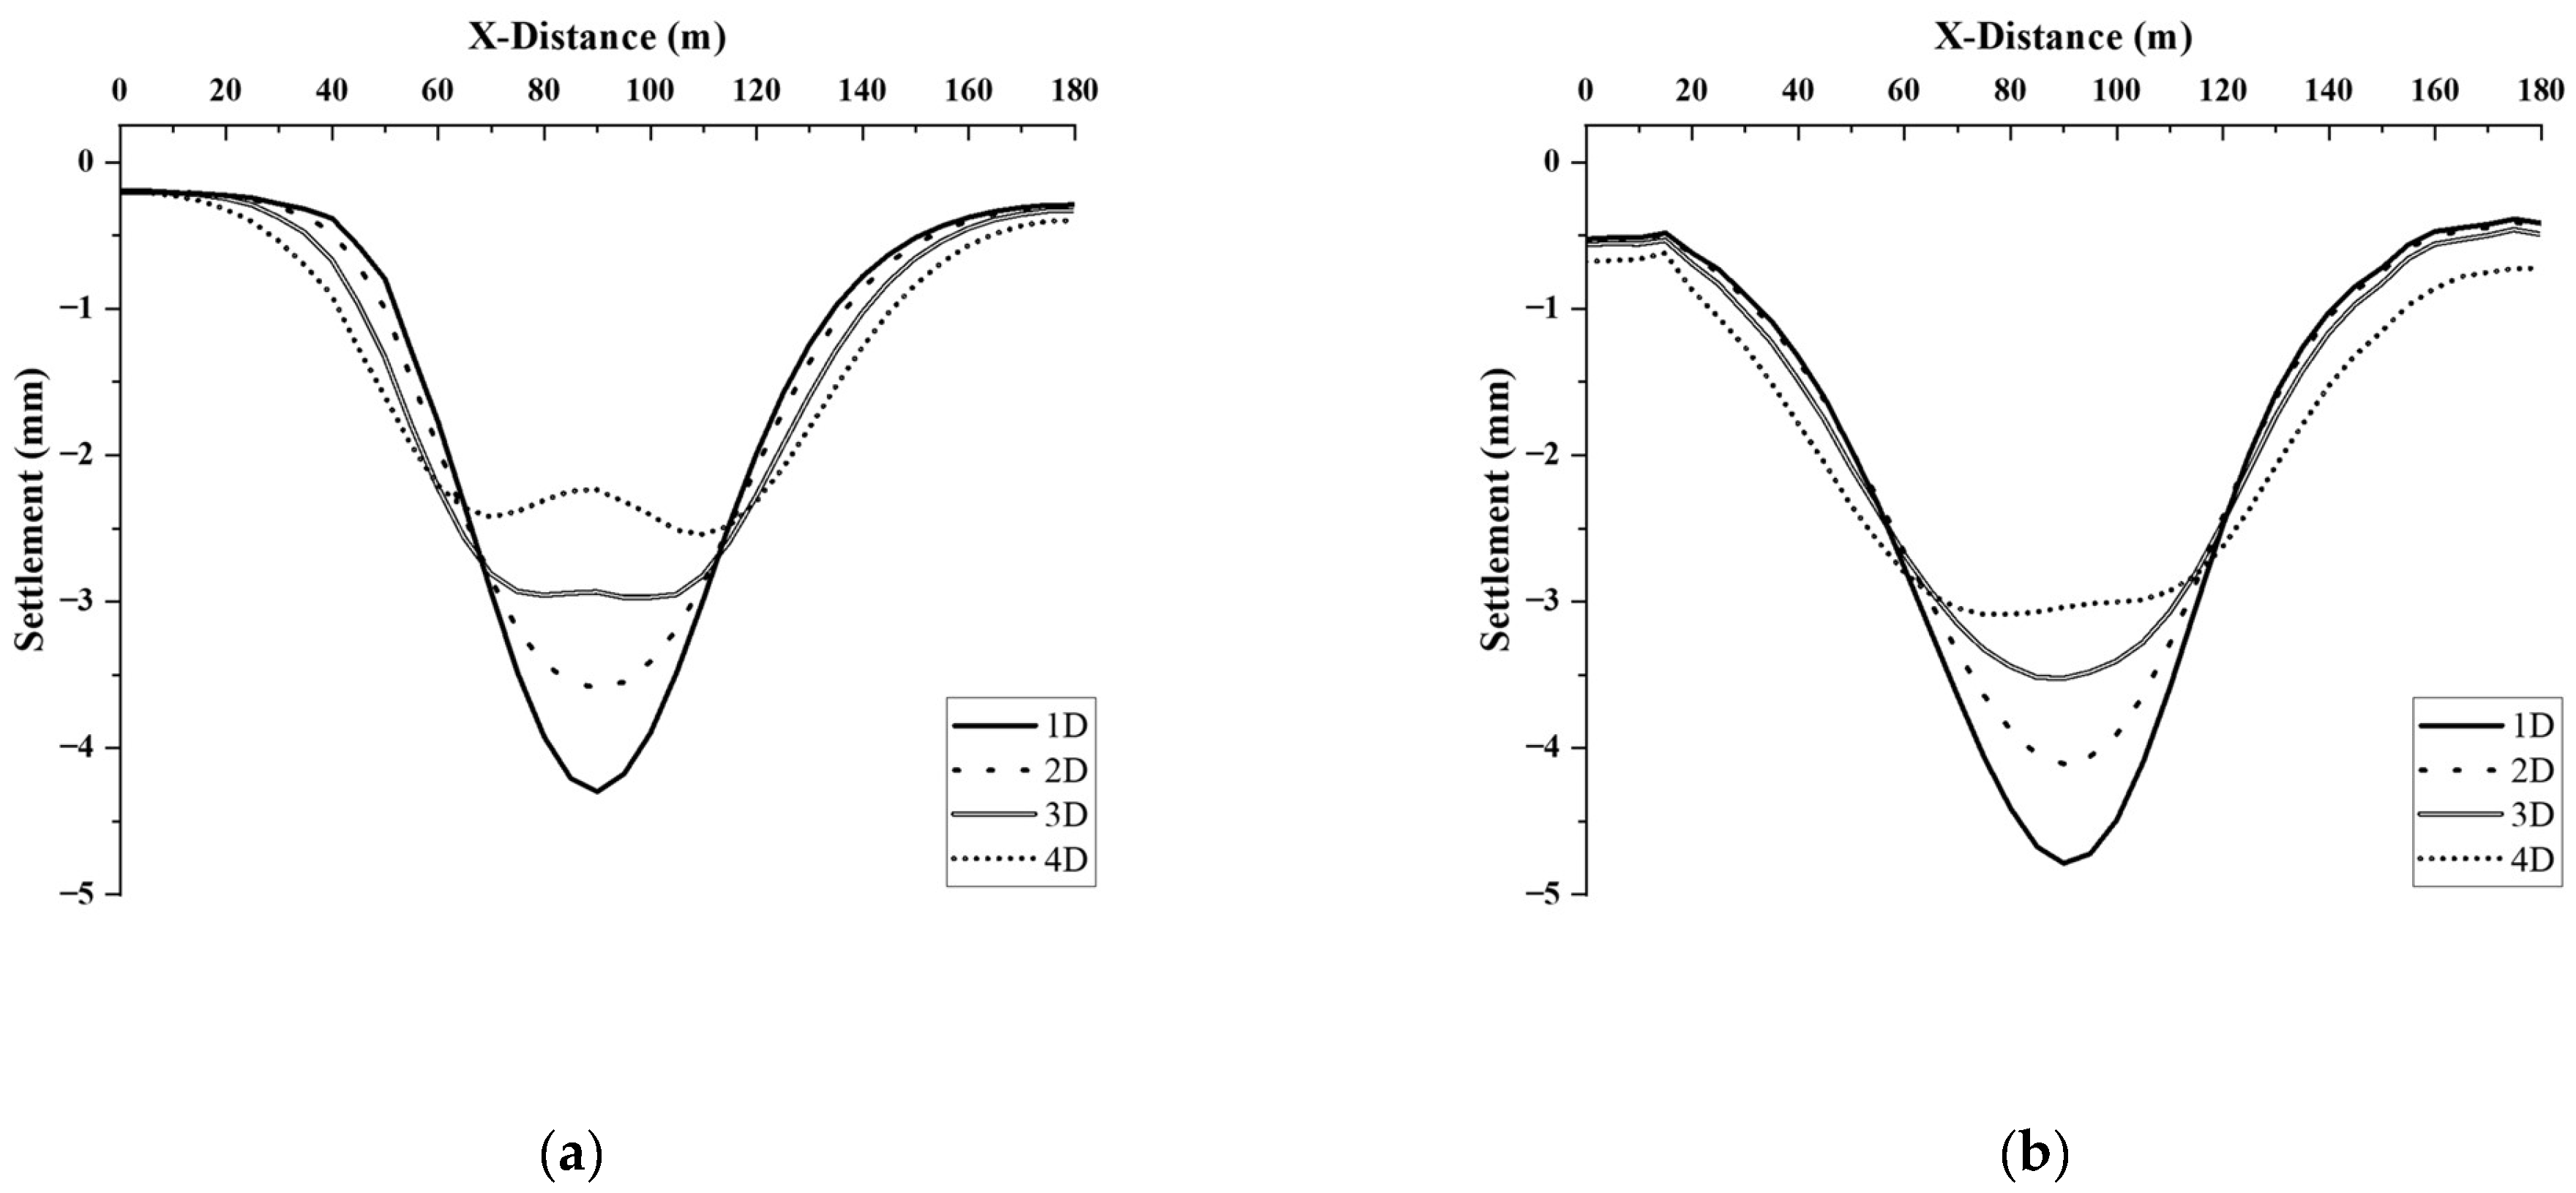
Figure 14 illustrates the settlement observed in the four cases (Case 4, 5, 6, and 7) with varying lag distances between the twin tunnels (1D, 2D, 3D, and 4D). The location of the settlement shown in Figure 14 corresponds to that shown in Figure 8. The data revealed a significant increase in the maximum settlement as the separation distance between the tunnels decreased. It was inferred that the increase in the ground settlement resulted from an increase in the overlapping stresses that occurred as the distance between the tunnels decreased. Specifically, a significant increase in settlement was observed when the distance was reduced from 2D to 1D, emphasizing the enhanced interactions between the tunnels at close proximity. This result aligns with the findings of Chen et al. [51], who demonstrated a significant increase in the interaction at lag distances below 1.25D.
Furthermore, the analysis revealed that the maximum settlement increased with the Y-distance (excavation direction). This trend can be attributed to the rising terrain altitude and consequent deepening of the tunnels. These findings demonstrated the significant influence of the terrain on the settlement, regardless of the separation distance between the tunnels.
Regarding the shape of the settlement troughs, distinct characteristics were identified based on the lag distance: U-shaped troughs manifested in 1D, 2D, and 3D, whereas a W-shaped trough became apparent in 4D. Beyond a distance of 4D, the interactions between the tunnels decreased significantly.
At approximately 20 m in Figure 14c, the surface uplift was the most significant at a lag distance of 4D. As the lag distance increased, there was a considerable increase in the uplift at 20 m, whereas an increase in settlement was observed at approximately 30 m. As the spacing between the tunnels increased, the tunnel on the left moved closer to the buildings. This result indicated that the proximity of the tunnel to the building significantly amplified the effect of the building load on ground settlement.

4.2. Assessment of Building Stability

There are buildings of various structures in urban areas; therefore, analyzing the stability of buildings when developing underground spaces is a fundamental consideration. In this study, the risk to the building was analyzed representatively in Case 5, which is the same as the tunnel construction field. The angular distortion and lateral strain were calculated using the vertical and horizontal displacements occurring in buildings and classified according to the damage criteria proposed by Boscardin and Cording [36].
Table 5 lists the values of the angular distortion calculated using the settlement generated in each building by performing a numerical analysis. Table 6 presents the lateral strain calculated using the horizontal displacement. By applying angular distortion and lateral strain, the classification of the stability of the building was proposed, and the damage caused by negligence was defined for all buildings.
It can be concluded that all buildings were resistant to tunneling. The differences in the settlement and horizontal displacement that occurred in all the buildings were low. This is because the buildings are buried in the soil; thus, the load from the tunnel excavation is distributed to the surrounding ground. The tunnel location in this field construction case is considered to have a very low effect on the building because of the deep and high-strength rock. The buildings B.7628 and B.26268 exhibited the largest and second largest vertical and horizontal displacements, respectively. The corners of these buildings were positioned over the crown of the tunnel (Figure 15). This demonstrates the effect of the location of the tunnel on the buildings. Although considered stable, both buildings required careful monitoring during tunneling. This study is expected to be highly useful for analyzing the risk to buildings when excavating tunnels in megacities.

4.3. The Visualization of the Effect of Tunnel Excavation

This section details the GIS-based visualization employed to assess the ground settlement and structural damage resulting from underground tunnel construction, focusing on the fifth step of the previously described visualization method (Section 3.2). The primary purpose of this process is to effectively depict both the ground settlement and consequential damage to buildings through GIS visualization. The process is divided into four stages:
  • Mapping ground settlement data in a GIS using the interpolation method.
  • Classification based on an assessment of the damage to buildings.
  • Input damage to buildings according to a unique ID of buildings and GIS mapping.
  • A combined ground settlement and damage classification mapping of the buildings.
Interpolation techniques were employed to map ground settlements using the GIS. This method effectively interpolated the values between the known data points and filled them into the space. This approach enhanced the accuracy of the visualizations by adjusting the mapped values to correspond to the height of the terrain, as depicted in Figure 16, which shows the interpolated ground settlement data. Figure 17a shows the settlement contours obtained using the results of the numerical analysis and data interpolation. As illustrated in Figure 17a, it is easily predicted that settlement will increase near the tunnel as the terrain behind it rises. A unique ID of the building was extracted from the building data, and the assessed damage level was input into the GIS. The damage to the building was subsequently visualized using the GIS, as depicted in Figure 17b. The risk map of this study is illustrated in Figure 17c, which merges the maps of the ground settlement and building damage. This integration visualizes the effects of tunnel excavation, providing a clear depiction of both settlement and structural stability.

5. Conclusions

In this study, a 3D model integrating topography and building data was developed using a GIS, and the effects of the terrain, building characteristics, construction methods, and lag distance on ground settlement were analyzed. The main conclusions were as follows:
  • When the terrain was considered, the ground settlement exhibited significant deviations from the Gaussian curve, with an increase in settlement as the elevation of the terrain increased.
  • Accounting for buildings resulted in greater settlement compared to scenarios in which the buildings were not considered. Settlements were particularly pronounced in areas with dense building clusters, because of the substantial influence of multiple building loads on the ground. Slight uplifts were observed in the spaces between densely situated buildings, suggesting a reduction in the impact directly beneath the buildings owing to the distribution of loads.
  • The effect of the tunneling sequence showed that parallel and bidirectional excavations on twin tunnels affected the ground settlement. Although the final settlement values for both methods were similar, the variations in the settlement during the excavation process were considerably different. The analysis of the longitudinal settlements showed a consistent pattern for the inflection points in parallel excavation, indicating a more uniform stress distribution in the soil. In contrast, bidirectional excavation resulted in rapid changes in the inflection points, necessitating careful settlement control.
  • A decrease in the lag distance of the twin tunnels led to increased ground settlement, with the best effects observed when the distance was reduced from 2D to 1D. The shape of the settlement trough indicated that the interactions between the tunnels decreased substantially when the lag distance exceeded 4D.
  • Damage assessment using angular distortion and horizontal displacements in a 3D model identical to the actual field showed that all buildings remained stable. This stability was attributed to the high rock strength and large excavation depth.
  • A risk map for evaluating the stability of the buildings and ground settlement was visualized using a GIS. This GIS-based visualization process provided an accurate perspective on ground settlement and risk to buildings in urban areas with diverse structures. This research is expected to be a substantial resource for predicting settlements and assessing the potential damage to buildings owing to excavation in urban environments.

Author Contributions

Conceptualization, J.-s.Y.; Methodology, J.-s.Y.; Software, J.-s.Y.; Formal analysis, H.-e.K.; Writing—original draft, J.-s.Y.; Writing—review and editing, H.-k.Y. All authors have read and agreed to the published version of the manuscript.

Funding

This work was supported by the Korea Agency for Infrastructure Technology Advancement funded by the Korean Government (RS-2020-KA157786).

Institutional Review Board Statement

Not applicable.

Informed Consent Statement

Not applicable.

Data Availability Statement

Data are contained within the article.

Conflicts of Interest

The authors declare no conflicts of interest.

References

  1. Wu, H.-N.; Shen, S.-L.; Yang, J. Identification of tunnel settlement caused by land subsidence in soft deposit of Shanghai. J. Perform. Constr. Facil. 2017, 31, 04017092. [Google Scholar] [CrossRef]
  2. Lai, J.; Zhou, H.; Wang, K.; Qiu, J.; Wang, L.; Wang, J.; Feng, Z. Shield-driven induced ground surface and Ming Dynasty city wall settlement of Xi’an metro. Tunn. Undergr. Space Technol. 2020, 97, 103220. [Google Scholar] [CrossRef]
  3. Ou, C.-Y.; Hsieh, P.-G.; Chiou, D.-C. Characteristics of ground surface settlement during excavation. Can. Geotech. J. 1993, 30, 758–767. [Google Scholar] [CrossRef]
  4. Zhao, C.; Schmüdderich, C.; Barciaga, T.; Röchter, L. Response of building to shallow tunnel excavation in different types of soil. Comput. Geotech. 2019, 115, 103165. [Google Scholar] [CrossRef]
  5. Finno, R.J.; Voss, F.T., Jr.; Rossow, E.; Blackburn, J.T. Evaluating damage potential in buildings affected by excavations. J. Geotech. Geoenviron. 2005, 131, 1199–1210. [Google Scholar] [CrossRef]
  6. Di, H.; Zhou, S.; Guo, P.; He, C.; Zhang, X.; Huang, S. Observed long-term differential settlement of metro structures built on soft deposits in the Yangtze River Delta region of China. Can. Geotech. J. 2020, 57, 840–850. [Google Scholar] [CrossRef]
  7. Zhou, Z.; Ding, H.; Miao, L.; Gong, C. Predictive model for the surface settlement caused by the excavation of twin tunnels. Tunn. Undergr. Space Technol. 2021, 114, 104014. [Google Scholar] [CrossRef]
  8. Islam, M.S.; Iskander, M. Twin tunnelling induced ground settlements: A review. Tunn. Undergr. Space Technol. 2021, 110, 103614. [Google Scholar] [CrossRef]
  9. Mirhabibi, A.; Soroush, A. Effects of surface buildings on twin tunnelling-induced ground settlements. Tunn. Undergr. Space Technol. 2012, 29, 40–51. [Google Scholar] [CrossRef]
  10. Gong, C.; Ding, W.; Xie, D. Twin EPB tunneling-induced deformation and assessment of a historical masonry building on Shanghai soft clay. Tunn. Undergr. Space Technol. 2020, 98, 103300. [Google Scholar] [CrossRef]
  11. Aswathy, M.S.; Mani, V. Twin tunnelling caused distortions and its effect on a hospital building on mixed ground conditions. J. Geotech. Eng. 2022, 17, 10–25. [Google Scholar]
  12. Fang, Q.; Liu, X.; Zhang, D.; Lou, H. Shallow tunnel construction with irregular surface topography using cross diaphragm method. Tunn. Undergr. Space Technol. 2017, 68, 11–21. [Google Scholar] [CrossRef]
  13. Cai, Y.; Huang, H.; Cai, G.; Cai, Y.; Yan, C.; Shen, H. An analytical approximate solution for stress and displacement around a shallow circular tunnel excavated under concave slope topography. Appl. Math. Model. 2023, 124, 445–487. [Google Scholar] [CrossRef]
  14. Son, M.; Cording, E.J. Responses of buildings with different structural types to excavation-induced ground settlements. J. Geotech. Geoenviron. 2011, 137, 323–333. [Google Scholar] [CrossRef]
  15. Bilotta, E.; Paolillo, A.; Russo, G.; Aversa, S. Displacements induced by tunnelling under a historical building. Tunn. Undergr. Space Technol. 2017, 61, 221–232. [Google Scholar] [CrossRef]
  16. Yoo, C.; Kim, J.-M. Tunneling performance prediction using an integrated GIS and neural network. Comput. Geotech. 2007, 34, 19–30. [Google Scholar] [CrossRef]
  17. Yuan, C.; Wang, X.; Wang, N.; Zhao, Q. Study on the effect of tunnel excavation on surface subsidence based on GIS data management. Procedia Environ. Sci. 2012, 12, 1387–1392. [Google Scholar] [CrossRef]
  18. Yuan, C.-F.; Gm, Y.; Guo, Z.; Li, R.; Li, C.-M. Analysis of surface subsidence caused by excavation of urban tunnel based on GIS. In Proceedings of the 2017 International Conference on Transportation Infrastructure and Materials (ICTIM 2017), Qingdao, China, 9–12 June 2017. [Google Scholar]
  19. Peck, R.B. Deep excavation and tunnelling in soft ground, State of the Art Volume. In Proceedings of the 7th International Conference on Soil Mechanics and Foundation Engineering, Mexico City, Mexico, 25–29 August 1969; Sociedad Mexicana de Mecanica: Mexico City, Mexico, 1969. [Google Scholar]
  20. Yun, J.-S.; Kim, H.-E.; Nam, K.-M.; Jung, Y.-R.; Cho, J.-E.; Yoo, H.-K. Analysis of the influence of existing parallel tunnels according to the location of the new tunnel. J. Korean Tunn. Undergr. Space Assoc. 2022, 24, 193–215. [Google Scholar]
  21. O’reilly, M.P.; New, B. Settlements above Tunnels in the United Kingdom—Their Magnitude and Prediction; Report No.: 090048862X; Institution of Mining & Metallurgy: London, UK, 1982. [Google Scholar]
  22. Liu, B.; Tao, L.G.; Ye, S.G. Back analysis prediction system for ground deformation due to subway tunneling excavation. J. China Univ. Min. Technol.-Chin. Ed. 2004, 33, 277–282. [Google Scholar]
  23. Peck, R.B.; Hendron, A.; Mohraz, B. State of the art of soft-ground tunneling. In Proceedings of the North American Rapid Excavation & Tunneling Conference, Chicago, IL, USA, 5–7 June 1972; pp. 259–286. [Google Scholar]
  24. Moretto, O. Discussion on Deep excavations and tunneling in the soft ground. In Proceedings of the 7th International Conference on Soil Mechanics and Foundation Engineering, Mexico City, Mexico, 25–29 August 1969. [Google Scholar]
  25. Jin, D.; Yuan, D.; Li, X.; Zheng, H. An in-tunnel grouting protection method for excavating twin tunnels beneath an existing tunnel. Tunn. Undergr. Space Technol. 2018, 71, 27–35. [Google Scholar]
  26. Ma, K. Research on the Ground Settlement Caused by the Shield Construction and the Protection of the Adjacent Buildings; Huazhong University of Science and Technology: Wuhan, China, 2008. [Google Scholar]
  27. Potts, D.M.; Addenbrooke, T.I. A structure’s influence on tunnelling-induced ground movements. Proc. Inst. Civ. Eng. Geotech. Eng. 1997, 125, 109–125. [Google Scholar] [CrossRef]
  28. Ercelebi, S.; Çopur, H.; Ocak, I. Surface settlement predictions for Istanbul Metro tunnels excavated by EPB-TBM. Environ. Earth Sci. 2011, 62, 357–365. [Google Scholar] [CrossRef]
  29. Melis, M.; Medina, L.; Rodríguez, J.M. Prediction and analysis of subsidence induced by shield tunnelling in the Madrid Metro extension. Can. Geotech. J. 2002, 39, 1273–1287. [Google Scholar] [CrossRef]
  30. Suwansawat, S.; Einstein, H.H. Artificial neural networks for predicting the maximum surface settlement caused by EPB shield tunneling. Tunn. Undergr. Space Technol. 2006, 21, 133–150. [Google Scholar] [CrossRef]
  31. Eslami, B.; Golshani, A.; Arefizadeh, S. Evaluation of constitutive models in prediction of surface settlements in cohesive soils–a case study: Mashhad Metro Line 2. ISSMGE Int. J. Geoeng. Case Hist. 2020, 5, 182–198. [Google Scholar]
  32. Marshall, A. Tunnelling in Sand and its Effect on Pipelines and Piles; University of Cambridge: Cambridge, UK, 2009. [Google Scholar]
  33. Sowers, G. Shallow foundations. In Foundation Engineering; Leonards, G.A., Ed.; McGraw-Hill Inc.: New York, NY, USA, 1962. [Google Scholar]
  34. Bjerrum, L. Discussion on Proceedings of European Conference on Soil Mechanics and Foundation Engineering vol III. Nor. Geotech. Inst. Publ. 1963, 98, 1–3. [Google Scholar]
  35. Rankin, W. Ground movements resulting from urban tunnelling: Predictions and effects. Geol. Soc. Lond. Eng. Geol. Spec. Publ. 1988, 5, 79–92. [Google Scholar] [CrossRef]
  36. Boscardin, M.D.; Cording, E.J. Building response to excavation-induced settlement. J. Geotech. Eng. 1989, 115, 1–21. [Google Scholar] [CrossRef]
  37. Kim, C.-Y.; Moon, H.-K.; Bae, G.-J. A Study on the safety assessment of adjacent structures caused by tunnel excavation in urban area-focused on the characteristics of geometries and locations for nearby building. J. Geol. Soc. 1999, 15, 19–42. [Google Scholar]
  38. GrasshopperDocs. Grasshopper Component Index. Available online: https://grasshopperdocs.com/completeIndex.html (accessed on 16 June 2024).
  39. ASTM D1586; Standard Test Method for Standard Penetration Test (SPT) and Split-Barrel Sampling of Soils. ASTM International: West Conshohocken, PA, USA, 2018.
  40. ASTM D1556; Standard Test Method for Density and Unit Weight of Soil in Place by Sand-Cone Method. ASTM International: West Conshohocken, PA, USA, 2015.
  41. ASTM D3080-11; Standard Test Method for Direct Shear Test of Soils Under Consolidated Drained Conditions. ASTM International: West Conshohocken, PA, USA, 2011.
  42. Hara, A.; Ohta, T.; Niwa, M.; Tanaka, S.; Banno, T. Shear modulus and shear strength of cohesive soils. Soils Found. 1974, 14, 1–12. [Google Scholar] [CrossRef]
  43. Schmertmann, J.H. Measurement of in situ shear strength, SOA Report. In Proceedings of the ASCE Spec Conference on In Situ Measurement of Soil Properties, Raleigh, NC, USA, 1–4 June 1975. [Google Scholar]
  44. Schmertmann, J. Measurement of in situ shear strength: Proc Conference on In-situ Measurement of Soil Properties, Raleigh, NC, USA, 1–4 June 1975; Volume 2, pp. 57–138, disc P139–179. Int. J. Rock Mech. Min. Sci. Geomech. Abstr. 1978, 15, 67. [Google Scholar] [CrossRef]
  45. Braja, M.D. Principles of Foundation Engineering, 3rd ed.; PWS; Cengage Learning: Boston, MA, USA, 1995. [Google Scholar]
  46. Hunt, R.E. Geotechnical Engineering Investigation Manual; McGraw-Hill: New York, NY, USA, 1984. [Google Scholar]
  47. Seoul Metropolitan Government. Ground Investigation Manual; Technical Review Officer; Seoul Metropolitan Government: Seoul, Republic of Korea, 2006.
  48. Park, S.-H.; Adachi, T. Laboratory model tests and FE analyses on tunneling in the unconsolidated ground with inclined layers. Tunn. Undergr. Space Technol. 2002, 17, 181–193. [Google Scholar] [CrossRef]
  49. Ritter, S.; Giardina, G.; DeJong, M.J.; Mair, R.J. Influence of building characteristics on tunnelling-induced ground movements. Géotechnique 2017, 67, 926–937. [Google Scholar] [CrossRef]
  50. Chakeri, H.; Hasanpour, R.; Hindistan, M.A.; Ünver, B. Analysis of interaction between tunnels in soft ground by 3D numerical modeling. Bull. Eng. Geol. Environ. 2011, 70, 439–448. [Google Scholar] [CrossRef]
  51. Chen, S.; Lee, S.; Gui, M. Effects of rock pillar width on the excavation behavior of parallel tunnels. Tunn. Undergr. Space Technol. 2009, 24, 148–154. [Google Scholar] [CrossRef]
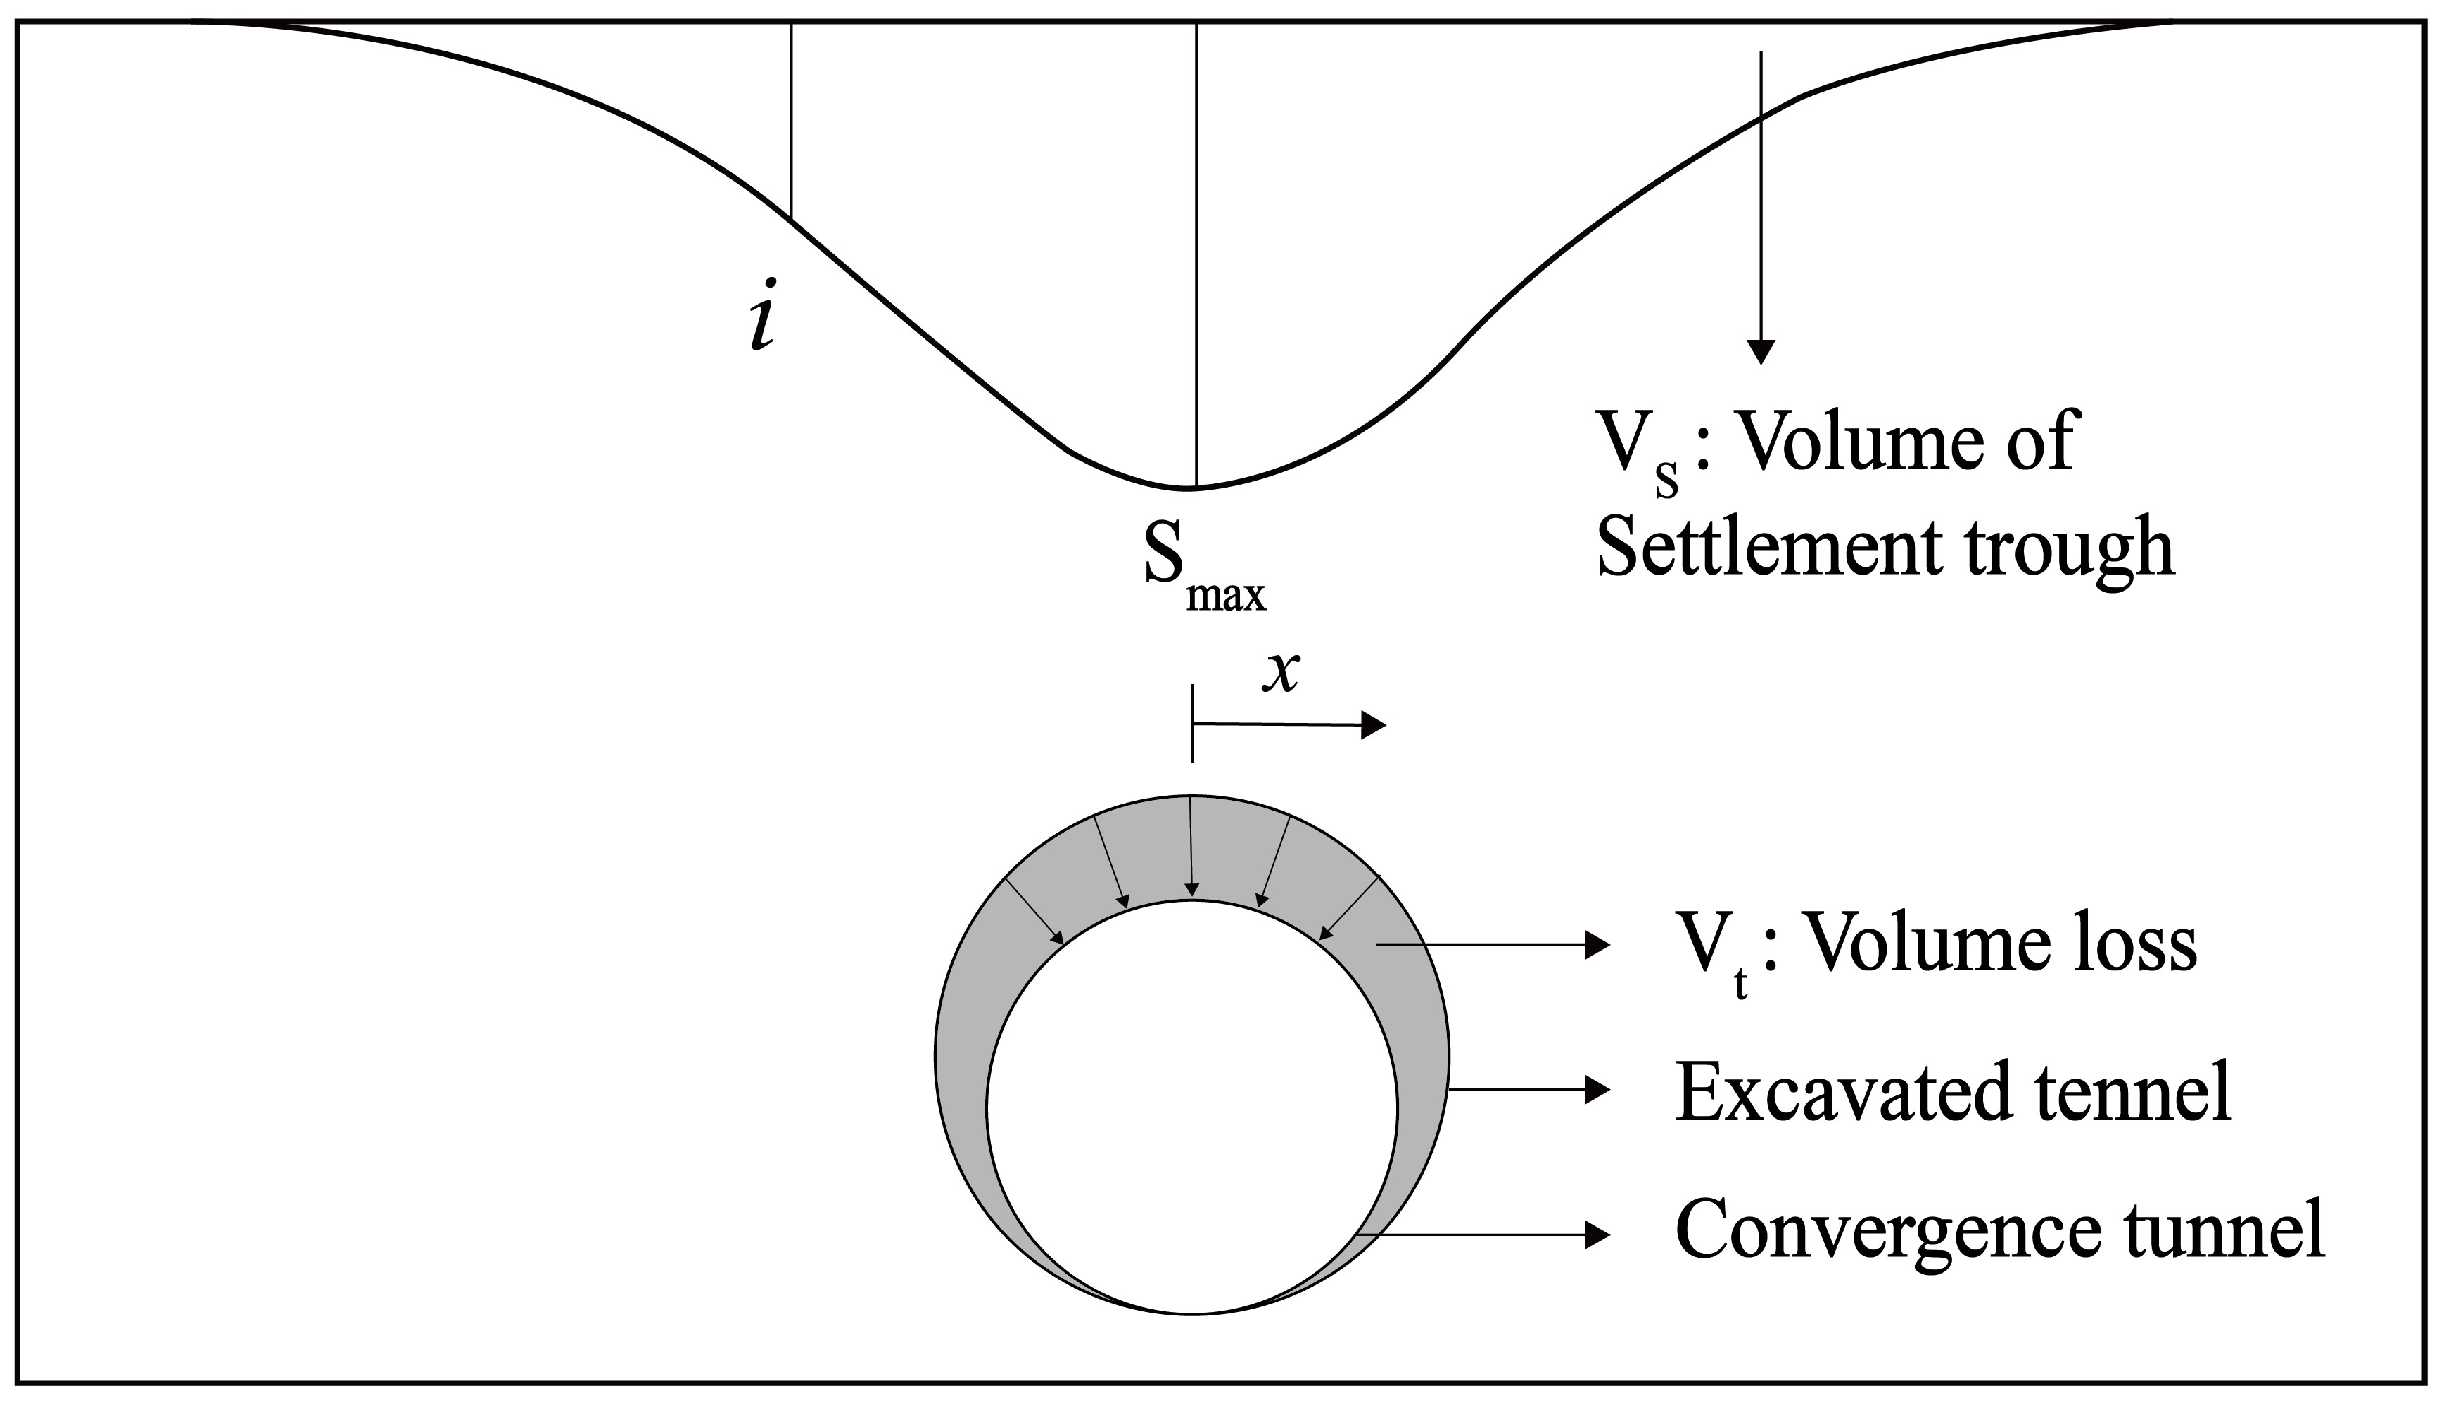
Figure 1. Simulation of ground settlement curve [20].
Sustainability 16 05891 g001
Figure 2. A superposition diagram of the settlement of twin tunnels without considering their interaction.
Sustainability 16 05891 g002
Figure 3. A superposition diagram of the ground settlement of twin tunnels considering their interaction.
Sustainability 16 05891 g003
Figure 4. A location map of the research area of the Mandeok–Centum underground highway sections.
Sustainability 16 05891 g004
Figure 5. Geological map of Busan.
Sustainability 16 05891 g005
Figure 6. Three-dimensional modeling process for topography and building structures: (a) contour data; (b) modification of contour data for meshwork; (c) terrain model; (d) Grasshopper optimization algorithm (GOA) used in terrain model; (e) layer work to classify structure and number of floors of building; (f) work to create interface between building and terrain model; (g) model size setting; (h) surface model to which number of floors of building is applied; (i) building created by GOA to complete surface model; and (j) 3D model.
Sustainability 16 05891 g006aSustainability 16 05891 g006b
Figure 7. Three-dimensional numerical analysis model: (a) flat ground scenario; (b) scenario considering topography; (c) scenario considering topography and building (left view); and (d) scenario considering topography and building (right view).
Sustainability 16 05891 g007
Figure 8. (a) The side view and (b) top view of the settlement section under analysis.
Sustainability 16 05891 g008
Figure 9. Differences in settlement caused by topography and buildings: (a) Y-distance 0 m, (b) Y-distance 200 m, (c) Y-distance 60 m, and (d) Y-distance 110 m.
Sustainability 16 05891 g009
Figure 10. Settlement caused by parallel excavation: (a) Y-distance 80 m, (b) Y-distance 100 m, and (c) Y-distance 120 m.
Sustainability 16 05891 g010
Figure 11. Settlement caused by bidirectional excavation: (a) Y-distance 80 m, (b) Y-distance 100 m, and (c) Y-distance 120 m.
Sustainability 16 05891 g011
Figure 12. Longitudinal settlement caused by sequences of excavation: (a) parallel excavation and (b) bidirectional excavation.
Sustainability 16 05891 g012
Figure 13. Patterns of inflection points in excavation sequences during tunneling.
Sustainability 16 05891 g013
Figure 14. Difference in settlement according to distance between twin tunnels: (a) Y-distance 0 m, (b) Y-distance 200 m, (c) Y-distance 60 m, and (d) Y-distance 110 m.
Sustainability 16 05891 g014aSustainability 16 05891 g014b
Figure 15. Unique ID of buildings and location of tunnel.
Sustainability 16 05891 g015
Figure 16. Settlement interpolation for GIS mapping.
Sustainability 16 05891 g016
Figure 17. Visualization of effect of tunnel excavation using GIS mapping: (a) visualization of settlement, (b) visualization of damage of building, and (c) risk map of settlement and building damage.
Sustainability 16 05891 g017aSustainability 16 05891 g017b
Table 1. Damage types on buildings [36].
ParametersDescription of DamageApproximate Width
of Cracks, mm
NegligibleHairline cracks<0.1
Very SlightFine cracks easily treated during normal
redecoration. Perhaps isolated slight fracture in building. Cracks in exterior brickwork visible upon close inspection.
<1
SlightCracks easily filled. Redecoration probably
required. Several slight fractures inside the building. Exterior cracks visible, some
repointing may be required for weathertightness. Doors and windows may stick slightly.
<5
ModerateCracks may require cutting out and patching. Recurrent cracks can be masked by suitable linings.
Tuck-pointing and replacement of a small amount of exterior brickwork may be required. Doors and windows sticking.
Utility service may be interrupted.
Weathertightness often impaired.
5 to 15 or
several
cracks > 3 mm.
SevereExtensive repair involving removal and replacement of sections of walls, especially over doors and
windows required. Windows and door frames distorted, floor slopes noticeably. Walls lean or bulge noticeably, some loss of bearing in beams. Utility service disrupted.
15 to 25 also
depends on number of cracks.
Very SevereMajor repair required involving partial or complete reconstruction. Beams lose bearing, walls lean badly and require shoring. Windows broken by distortion. Danger of instability.Usually > 25.
Depends on number of cracks.
Table 2. Geotechnical properties.
MaterialUnit Weight
(kN/m3)
Cohesion
(kPa)
Angle of
Friction
(Degree)
Elastic
Modulus (MPa)
Poisson’s RatioDepth
(m)
Model Type
Sedimentary Soil18040150.354–6Mohr–
Coulomb
Weathered Soil182030500.339–11Mohr–
Coulomb
Weathered Rock2330332500.313–16Mohr–
Coulomb
Soft Rock253003512000.2570–75Mohr–
Coulomb
Table 3. Buildings and shotcrete properties.
MaterialUnit Weight (kN/m3)Elastic Modulus (MPa)Poisson’s RatioModel Type
Concrete24.520,0000.22Elastic
Steel78.521,0000.28Elastic
Wood14.716,0000.36Elastic
Soft shotcrete2450000.3Elastic
Hard shotcrete2415,0000.3Elastic
Table 4. Numerical analysis cases.
CaseSurface ConditionConstruction MethodLag Distance
1FlatParallel excavation3D (28.5 m)
2FlatBidirectional excavation3D (28.5 m)
3TopographyParallel excavation3D (28.5 m)
4Topography and BuildingParallel excavation4D (38.0 m)
5Topography and BuildingParallel excavation3D (28.5 m)
6Topography and BuildingParallel excavation2D (19.0 m)
7Topography and BuildingParallel excavation1D (9.5 m)
Table 5. Differences in settlement and angular distortion of buildings.
Structure IDLength of Building (m)Settlement Difference (mm)Angular Distortion
B.762510.35740.1768440.017074
B.762817.85490.9823380.055018
B.76307.97910.2329110.02919
B.763114.40830.4446210.030859
B.76335.36530.0615050.011463
B.763415.59550.2542390.016302
B.775820.89950.4709170.022532
B.77618.56130.3747580.043773
B.77628.11540.5693610.070158
B.78308.51360.2691010.031608
B.783110.27740.4708320.045812
B.783216.38590.9958990.060778
B.783317.05550.9011380.052836
B.783424.77210.7588510.030633
B.783511.30360.5697170.050401
B.78368.57730.4810590.056085
B.79409.71220.5018410.051671
B.81475.57320.2721360.048829
B.81507.06410.0079400.001124
B.818113.04820.0115700.000887
B.2626820.54351.2106390.058931
B.322027.63020.1498660.019641
B.3278614.59310.5223270.035793
Table 6. Differences in horizontal displacement and lateral strain of buildings.
Structure IDLength of Building (m)Horizontal Displacement
Difference (mm)
Lateral Strain
B.762510.35740.0350740.003386
B.762817.85490.2457150.013762
B.76307.97910.0278290.003488
B.763114.40830.1820520.012635
B.76335.36530.0489460.009123
B.763415.59550.0087930.000564
B.775820.89950.0958790.004588
B.77618.56130.0018080.000118
B.77628.11540.0107670.001327
B.78308.51360.0195130.002292
B.783110.27740.0066910.000651
B.783216.38590.0676470.004128
B.783317.05550.1054820.006185
B.783424.77210.1274560.005145
B.783511.30360.0380460.003366
B.78368.57730.0087380.001019
B.79409.71220.0896310.009229
B.81475.57320.0027610.000495
B.81507.06410.0079410.079263
B.818113.04820.0605480.028514
B.2626820.54350.1806910.020960
B.322027.63020.0119080.023186
B.3278614.59310.1665130.010119
Disclaimer/Publisher’s Note: The statements, opinions and data contained in all publications are solely those of the individual author(s) and contributor(s) and not of MDPI and/or the editor(s). MDPI and/or the editor(s) disclaim responsibility for any injury to people or property resulting from any ideas, methods, instructions or products referred to in the content.