Article

Diverse Responses of Vegetation Greenness and Productivity to Land Use and Climate Change: A Comparison of Three Urban Agglomerations in China

by
Fei Xue
1 and
Yi’na Hu
1,2,*
1
School of Environmental and Geographical Sciences, Shanghai Normal University, Shanghai 200234, China
2
Yangtze River Delta Urban Wetland Ecosystem National Field Scientific Observation and Research Station, Shanghai 201722, China
*
Author to whom correspondence should be addressed.
Sustainability 2024, 16(14), 5900; https://doi.org/10.3390/su16145900
Submission received: 10 May 2024 / Revised: 2 July 2024 / Accepted: 4 July 2024 / Published: 11 July 2024

Abstract

:
Vegetation plays a crucial role in enhancing residents’ quality of life, especially in densely populated urban areas. However, previous research has rarely explored the inconsistency between vegetation greenness and productivity or its potential factors, leaving the reasons for their inconsistency unclear. Taking the three largest urban agglomerations in China as study areas, this study examined the inconsistency between vegetation greenness (LAI) and productivity (GPP) after detecting their dynamics based on the Mann–Kendall test. Then, the impact of land use change on the observed inconsistency was explored by contrasting the variations in vegetation greenness and productivity between regions with and without land use changes. The effect of climate change was evaluated by the Spearman correlation method at the pixel level. The results showed that both vegetation greenness and productivity exhibited a rising trend in three agglomerations from 2001 to 2020. Notably, an obvious inconsistency existed between greenness and productivity. Regions with a consistent change in greenness and productivity accounted for 69.87% in Beijing–Tianjin–Hebei (BTH), while only 45.65% and 42.93% in the Pearl River Delta (PRD) and the Yangtze River Delta (YRD), respectively. Land use change and climate change exerted divergent impacts on greenness and productivity across these agglomerations. The conversion of croplands and grasslands to construction lands had a more severe negative effect on vegetation greenness than on productivity in all regions. However, this transition led to a general decline in both greenness and productivity in the YRD and PRD, whereas in BTH, greenness declined while productivity paradoxically increased. As for climatic factors, the responses of greenness and productivity to rainfall and solar radiation exhibited spatial heterogeneity among the three agglomerations. In the YRD and PRD, they had a negative correlation with rainfall and a positive correlation with solar radiation, whereas in BTH, these correlations were reversed. Our spatial comparative analysis provided insights into the inconsistency between vegetation greenness and productivity as well as their potential reasons, offering a fresh perspective for regional vegetation research.

1. Introduction

Vegetation provides numerous vital ecosystem services for human well-being [1,2,3]. In densely populated urban areas, vegetation plays a crucial role in enhancing residents’ quality of life by improving air quality [4,5], creating pleasant living spaces [6], alleviating noise pollution [7], regulating temperature and humidity [8,9], and fostering mental health [10]. Consequently, various urban greening policies have been formulated to preserve and enhance vegetation coverage [11,12]. However, the drastic changes in the global environment [13,14], especially the intensive land use change in urban areas, have resulted in irreversible consequences on vegetation [15,16,17]. These changes pose significant challenges to sustainable urban development [18,19]. Therefore, monitoring the dynamics of vegetation and understanding its influencing mechanism is crucial for informing sustainable urban planning and management strategies.
Vegetation indices are commonly used in the study of vegetation dynamics, encompassing both vegetation greenness and productivity [20,21]. Vegetation indices like the leaf area index (LAI) and normalized difference vegetation index (NDVI), are usually utilized to quantify vegetation greenness, reflecting the health and vitality of plant canopies [22,23,24]. Gross primary production (GPP) and net primary production (NPP) serve as proxies of vegetation productivity, which can measure the amount of carbon fixed by plants through photosynthesis [25,26]. Although a general positive correlation has been observed between vegetation greenness and productivity [27], inconsistencies in their trends were revealed in recent studies [28,29]. For instance, Zhang et al. pointed out that while vegetation may appear to be greener, its actual productivity may not increase proportionally, and the two trends may even be opposed in certain regions [30]. However, the linkage between greenness and productivity remains unclear in urban areas, hindering a comprehensive understanding of urban vegetation dynamics.
The responses of vegetation greenness and productivity to climate change and land use change exhibit significant variations [25]. For example, Xu et al. found that during drought years in Amazon rainforests, vegetation greenness showed a decline, whereas vegetation productivity increased constantly [31]. Despite the increasing attention paid to the mechanisms of vegetation dynamics [32,33,34], much of the research has focused primarily on how land use change and climatic factors influence either greenness or productivity [35,36,37]. The reasons underlying the inconsistencies between these two metrics remain unclear. It is worth noting that the mechanisms may vary significantly across different regions because of their unique environmental backgrounds. Nevertheless, current research on this topic is relatively scarce. Therefore, it is necessary to analyze the distinct influencing mechanisms of greenness and productivity across diverse regions to reveal the potential factors for their inconsistency.
As the regions with the fastest development speed in China, urban agglomerations have experienced dramatic land use change, which has severely affected their vegetation dynamics [33,38]. Research on vegetation in urban agglomerations is of great significance for their sustainable development. This study focused on the three largest urban agglomerations in China including Beijing–Tianjin–Hebei (BTH), the Yangtze River Delta (YRD), and the Pearl River Delta (PRD). With LAI as a proxy for vegetation greenness and GPP as a measurement of productivity, this study explored the spatiotemporal inconsistency between these two metrics from 2001 to 2020 and compared their divergent responses to land use change and climatic factors in the three agglomerations. This paper aimed: (1) to identify the inconsistency between vegetation greenness and productivity as well as its regional differences; (2) to clarify divergent impacts of land use and climate change on vegetation greenness and productivity in the three urban agglomerations.

2. Materials and Methods
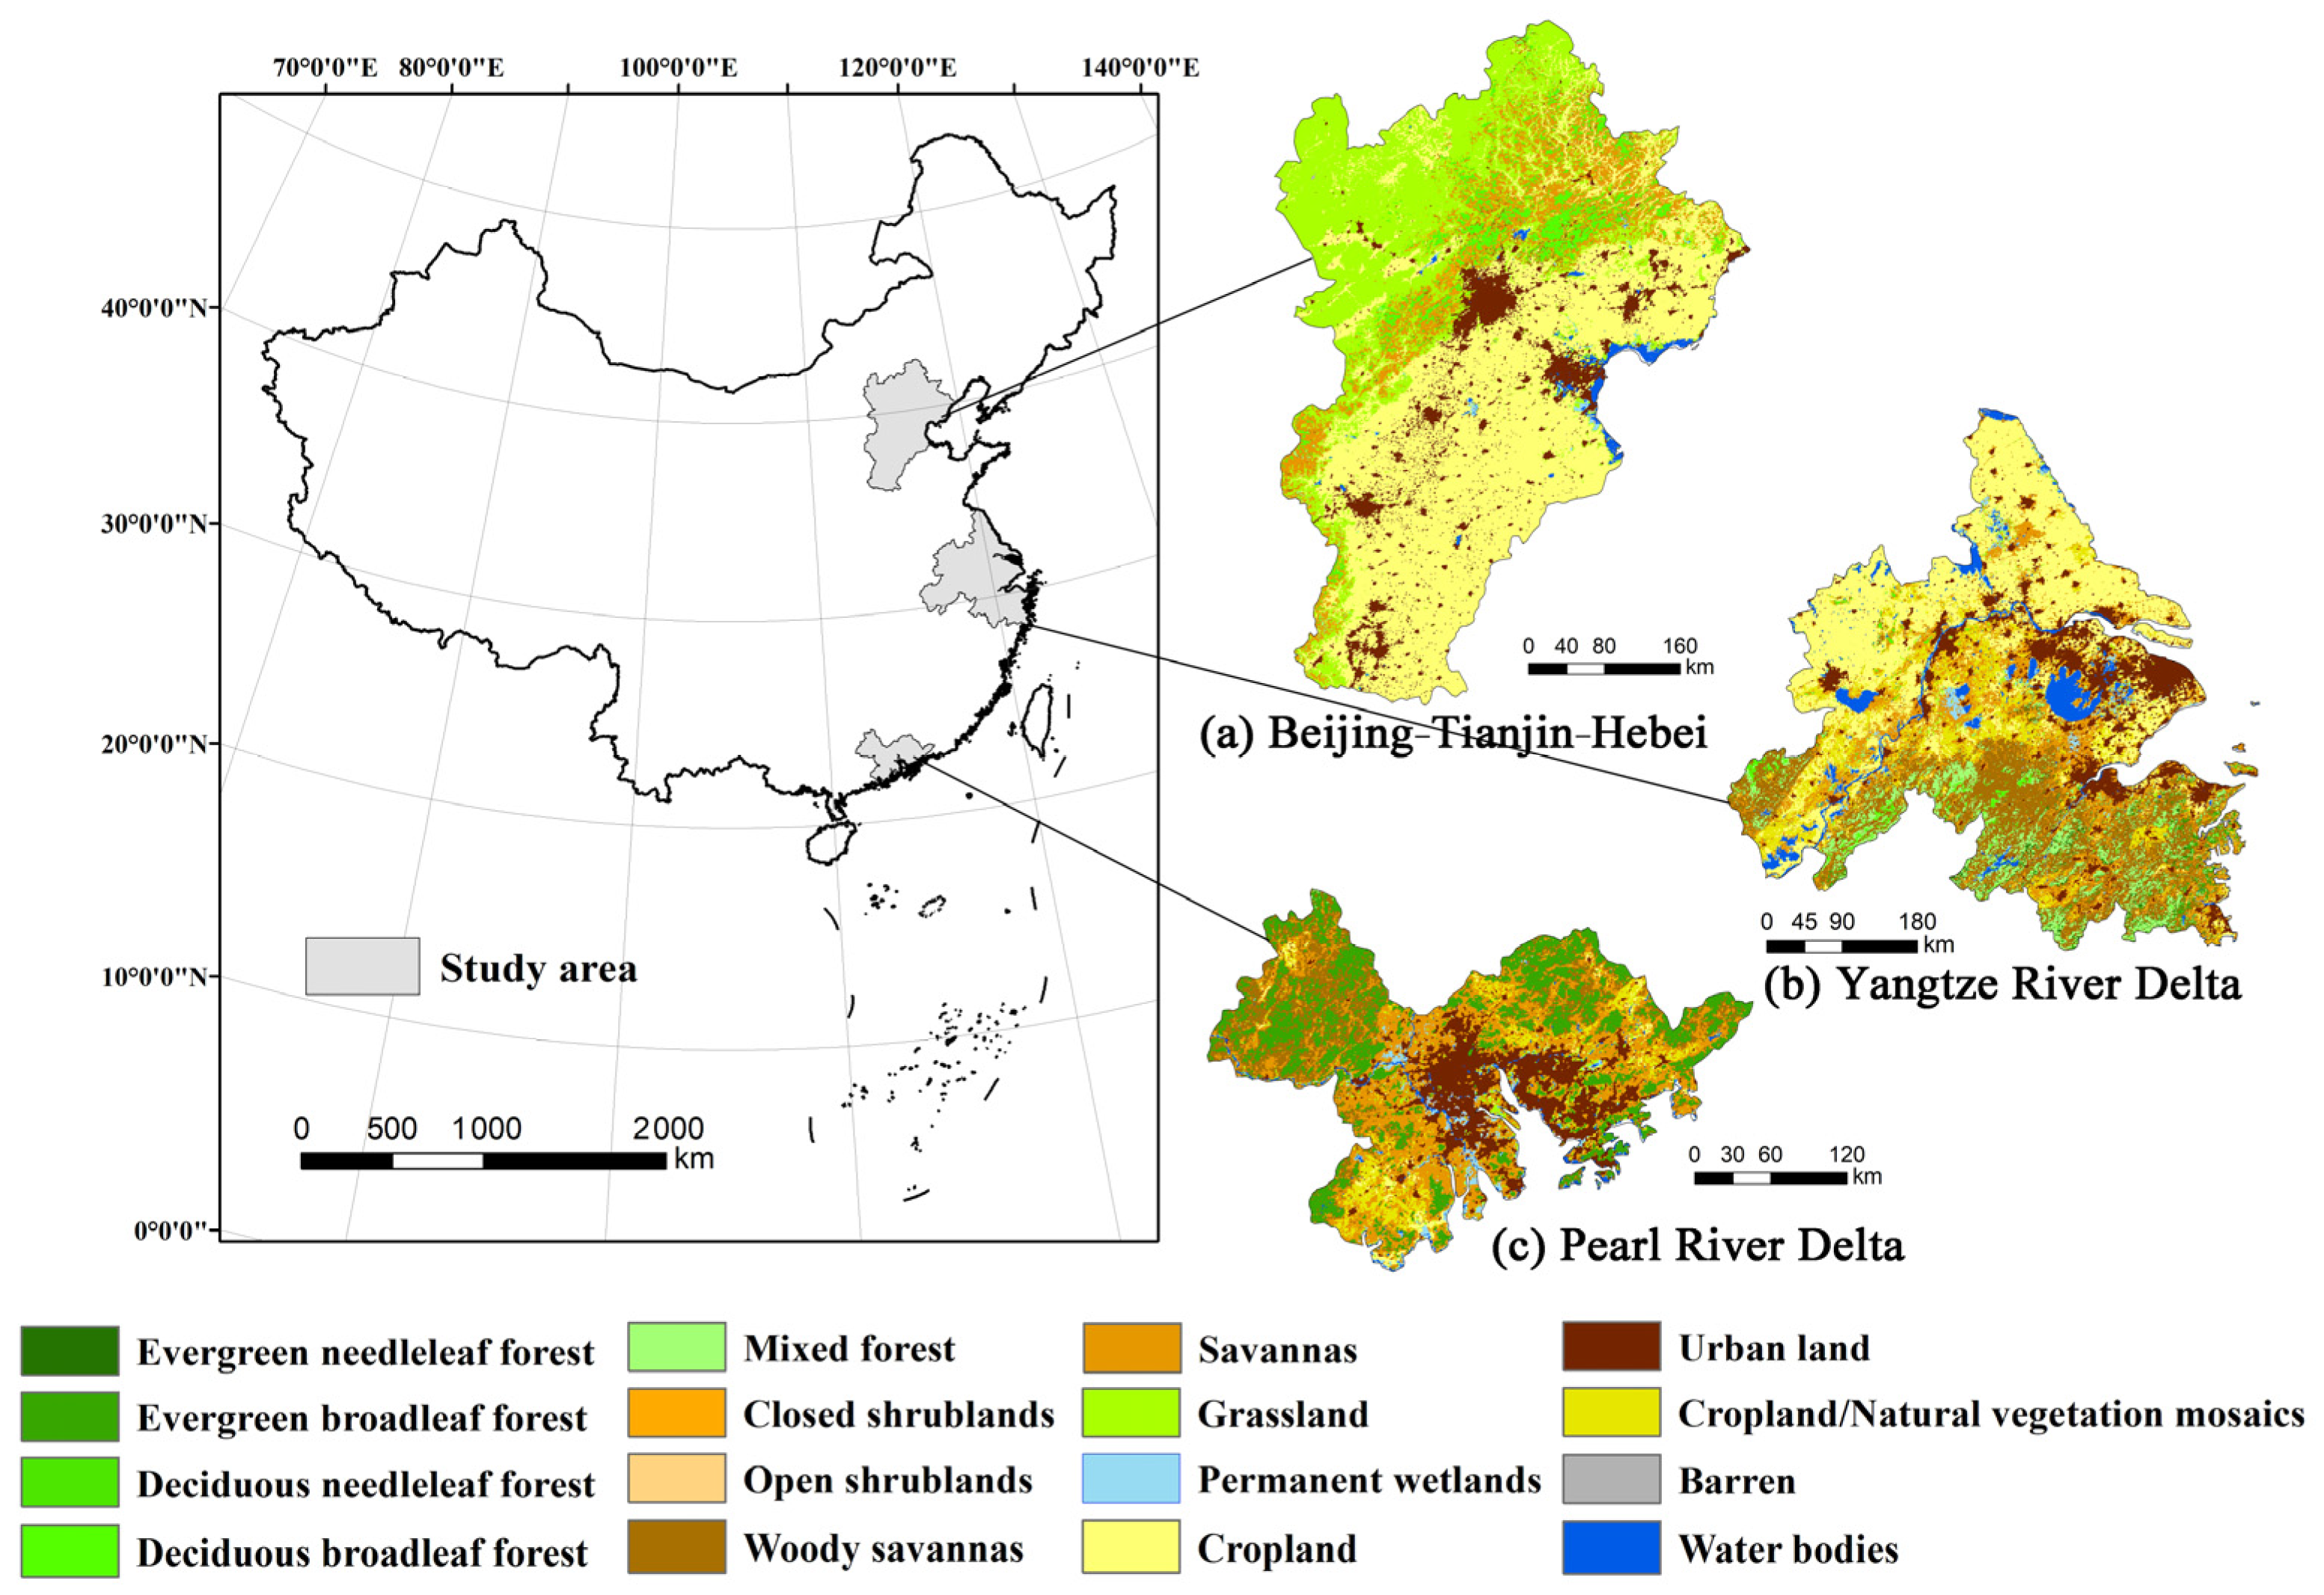
2.1. Study Area

Three urban agglomerations in eastern coastal China were taken as study areas including BTH, YRD, and PRD (Figure 1). BTH, with an area of 58,789 km2, is the largest economic zone in northern China. Characterized by a temperate monsoon climate, the region boasts diverse vegetation types including grasslands, deciduous broadleaf forests, croplands, and savannas. According to “The Yangtze River Delta Urban Agglomeration Development Plan”, the YRD encompasses 26 cities across Jiangsu Province, Zhejiang Province, Anhui Province, and Shanghai Municipality, covering a total land area of 84,779 km2. This subtropical humid monsoon climate zone is predominantly flat, with pockets of mountains and hills in the west and south. The vegetation in YRD is mainly composed of croplands, woody savannas, and mixed forests. Defined according to the “Outline of the Pearl River Delta Reform and Development Plan (2008–2020)”, the PRD, with an area of 63,710 km2, is situated in southeastern China. Boasting a subtropical humid monsoon climate, the region enjoys warmth and humidity throughout the year. It boasts a terrain that includes both expansive plains and undulating hills, while its vegetation types are predominantly evergreen broadleaf forests, woody savannas, savannas, and cropland/natural vegetation mosaics. These three agglomerations have undergone a rapid urbanization process in recent decades, and their drastic land use change has severely impacted the vegetation. Therefore, exploring the impact of regional land use changes as well as climate change on vegetation greenness and productivity holds the utmost importance for promoting sustainable development in these regions.

2.2. Data Sources and Processing

This study utilized the following data, as listed in Table 1: (1) LAI dataset, obtained from MOD15A2H, with a 500 m spatial resolution and 8-day temporal resolution. This study selected LAI from 2001 to 2020, used the mean value of LAI to extract monthly LAI values. (2) GPP dataset, obtained from MOD17A2H, with a 500 m spatial resolution and 8-day temporal resolution. This study selected GPP from 2001 to 2020, and used the sum value of GPP to extract monthly GPP values. (3) Land use/cover data was obtained from the International Geosphere Biosphere Program (IGBP) classification scheme of MCD12Q1 with a 500 m spatial resolution. We reclassified 17 land use types into six categories as follows: cultivated lands, construction lands, grasslands, forest lands, water bodies, and bare lands using Reclassify tool in ArcGIS 10.7. (4) Climatic data, including temperature (Temp), rainfall and solar radiation (Radia), were obtained from the Resource and Environment Science and Data Center. The spatial resolution resampling was 500 m. (5) The administrative boundary was obtained from the Geographical Information Monitoring Cloud Platform.

2.3. Mann–Kendall Test

Mann–Kendall trend analysis is a robust approach to assess non-parametric trends, effectively reflecting how consistently a trend either declines or grows [39]. It has proven to be effective in detecting trends within time series data [20,40]. This study utilized Mann–Kendall trend analysis to evaluate the spatio-temporal trends in greenness and productivity as well as climatic factors, i.e., Radia, Temp, Rainfall, during 2001–2020. The significance of these trends was tested by the Z value, and the specific formulas are shown as:
S = i = 1 n 1 j = i + 1 n s g n ( x j x i )
s g n ( x j x i ) = 1 x j x i > 0   0 x j x i = 0 1 x j x i < 0
Z = S 1 a 2 S > 0 0 S = 0 S + 1 a 2 S < 0
a 2 = n ( n 1 ) ( 2 n + 5 ) 18
where x i represents LAI or GPP or the climatic factor sequence; n represents the number of data; S is the sum of the step function values of the difference between two different points in the time series; and a 2 is the variance. We adopt a significance level of 0.05, where a z-score below −1.96 signifies a statistically significant decline trend, a z-score above 1.96 indicates a significant growth trend, and a z-score falling between −1.96 and 1.96 implies an insignificant trend.

2.4. Impact of Climate and Land Use Change on Vegetation

To assess the impact of land use change on vegetation, we compared variations in vegetation between regions with and without land use change. To accomplish this, we divided each agglomeration into two distinct parts as follows: regions without land use changes and regions with land use change from 2001 to 2020. We then separately analyzed the rates of change in greenness and productivity during 2001–2020 within these two regions. Finally, we considered that the differences in the rates of vegetation change between the two regions indirectly highlighted how land use change influences vegetation dynamics.
To investigate the impact of climatic variables on vegetation greenness and productivity, this study employed the Spearman correlation method to analyze the relationship among rainfall, Temp, Radia, and vegetation metrics at the pixel level. Based on the correlation coefficient (q value) and its significance (p value), we categorized the correlations into five distinct types as follows: strong negative (−1 < q < −0.5, p < 0.05), weak negative (−0.5 < q < 0, p < 0.05), strong positive (0.5 < q < 1, p < 0.05), weak positive (0 < q < 0.5, p < 0.05), and insignificant (p > 0.05) correlations.

3. Results

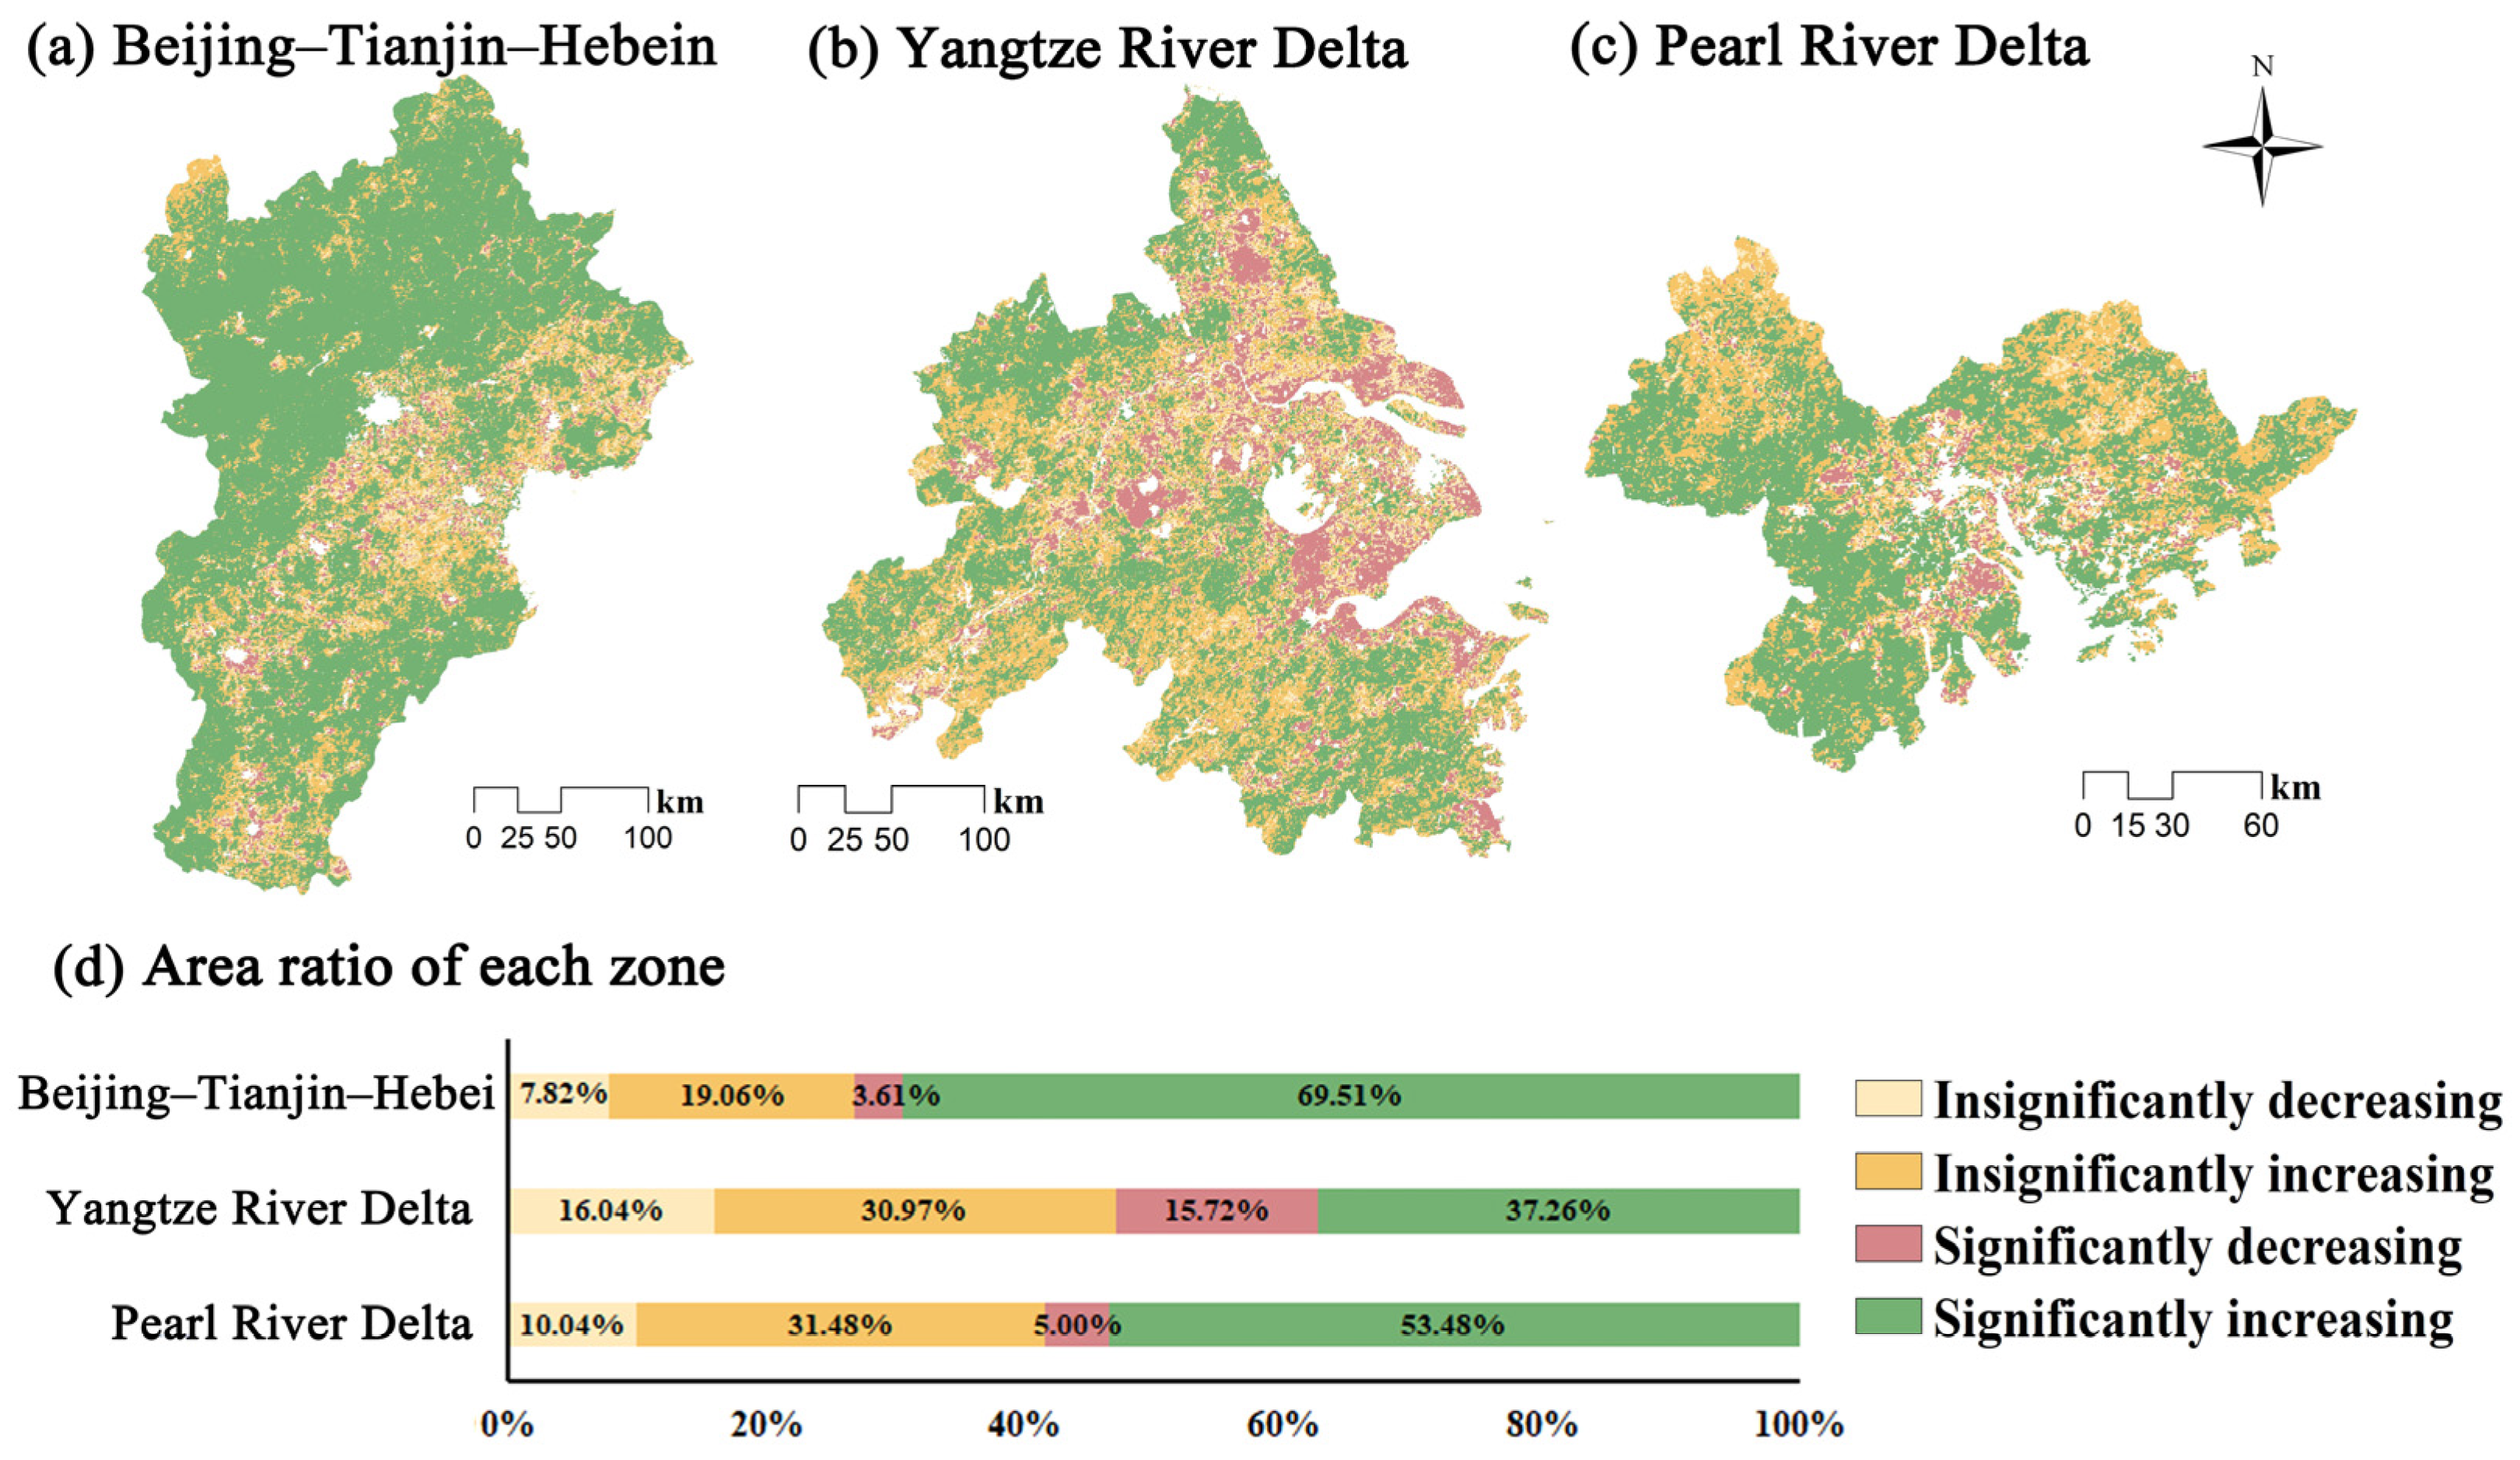
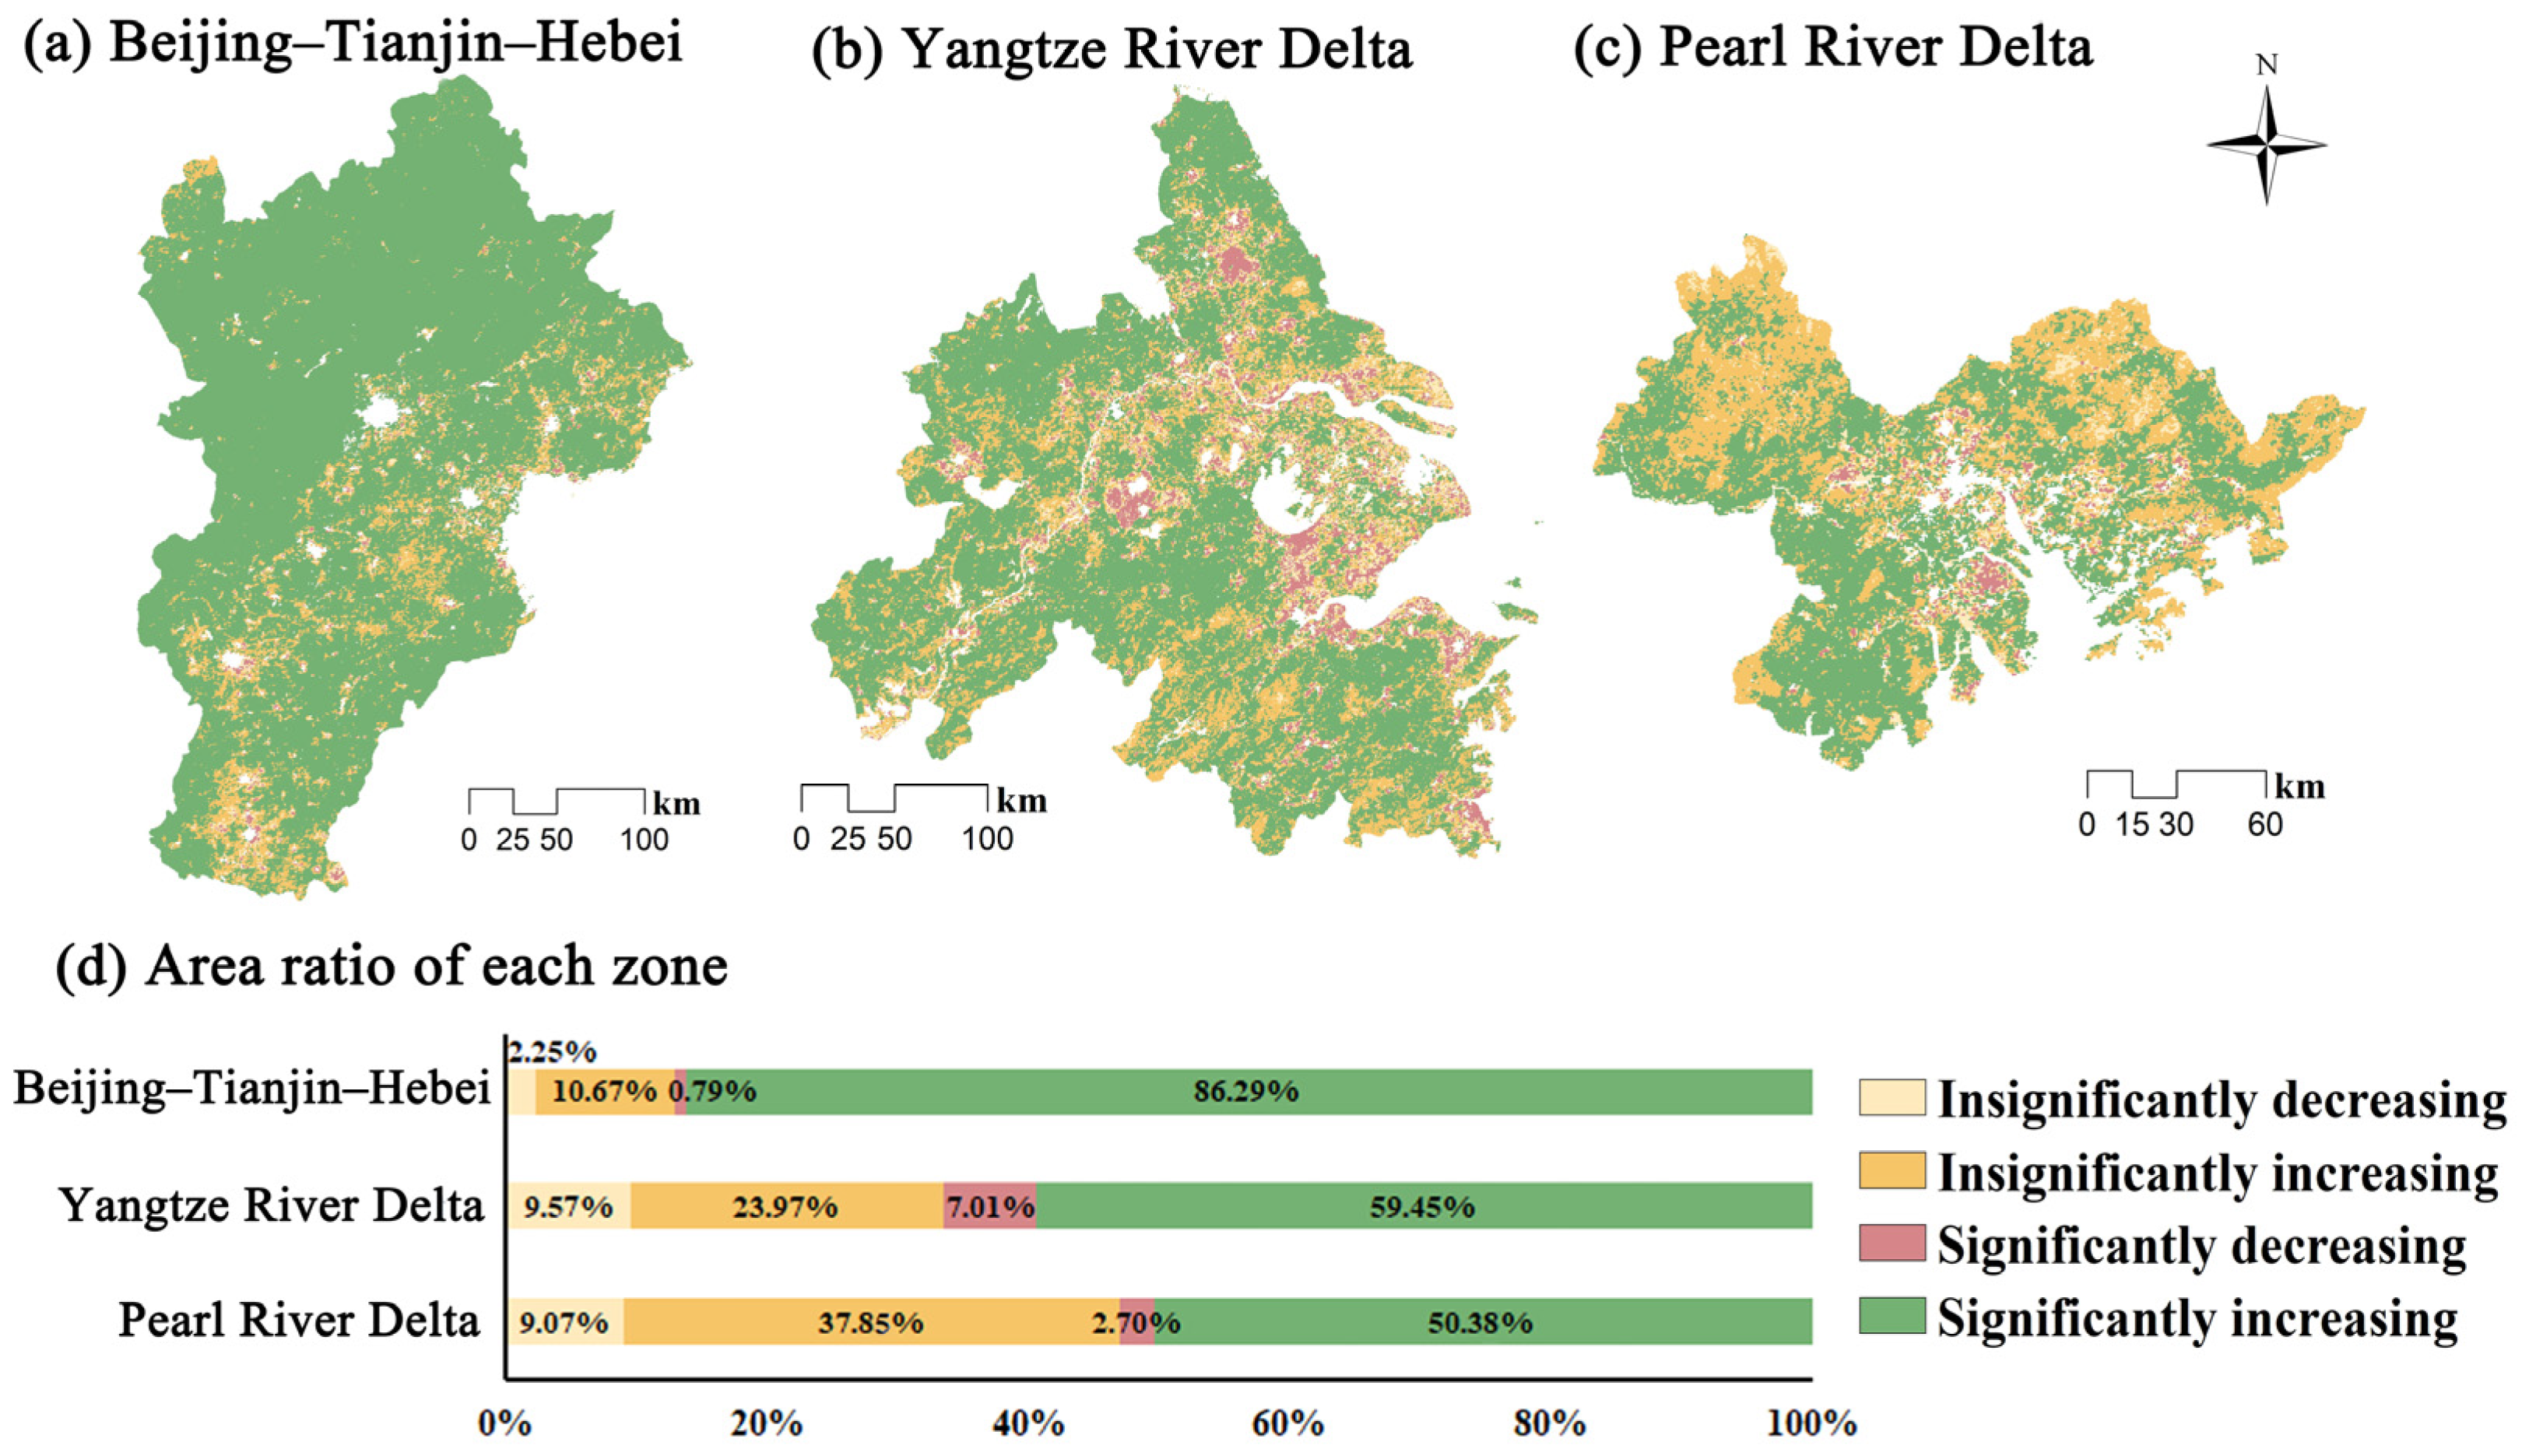
3.1. Dynamics of Vegetation Greenness and Productivity

Vegetation greenness showed an upward trend in the three agglomerations from 2001 to 2020 (Figure 2). Specifically, the PRD experienced a remarkable 32.22% increase in vegetation greenness, while BTH experienced a 27.71% growth. In contrast, the YRD displayed a more modest growth rate of 6.90%, with its average LAI increasing from 1.27 to 1.34. There was also an obvious spatial heterogeneity in vegetation greenness changes within each agglomeration (Figure 2). Notably, the proportion of regions experiencing significant greenness growth exceeded 50% in both BTH and PRD, while in the YRD, this proportion was 37.26%. Conversely, regions experiencing significant greenness decline were relatively limited, accounting for 5.00% and 3.61% of the total area in the PRD and BTH, respectively, but reaching 15.72% in the YRD. Overall, the extent of regions experiencing significant greenness growth outweighed those with insignificant growth, and there were fewer regions with significant decline than those with insignificant decline across three agglomerations.
Vegetation productivity showed an upward trend in the three agglomerations from 2001 to 2020 (Figure 3). Specifically, BTH experienced a remarkable 51.46% increase over this period. In the PRD, productivity showed an 18.30% increase. And productivity increased by 10.82% in the YRD. Spatial heterogeneity was also evident in the changes in productivity within each agglomeration (Figure 3). Notably, the proportion of regions experiencing significant productivity growth exceeded 50% in all agglomerations. Conversely, the proportion of regions with a significant productivity decline was relatively small, at 0.79%, 2.70%, and 7.01% in BTH, PRD, and YRD, respectively. Overall, the regions experiencing significant growth in productivity outweighed those with insignificant growth, while there were fewer regions with a significant decline than those with insignificant decreases across three agglomerations.

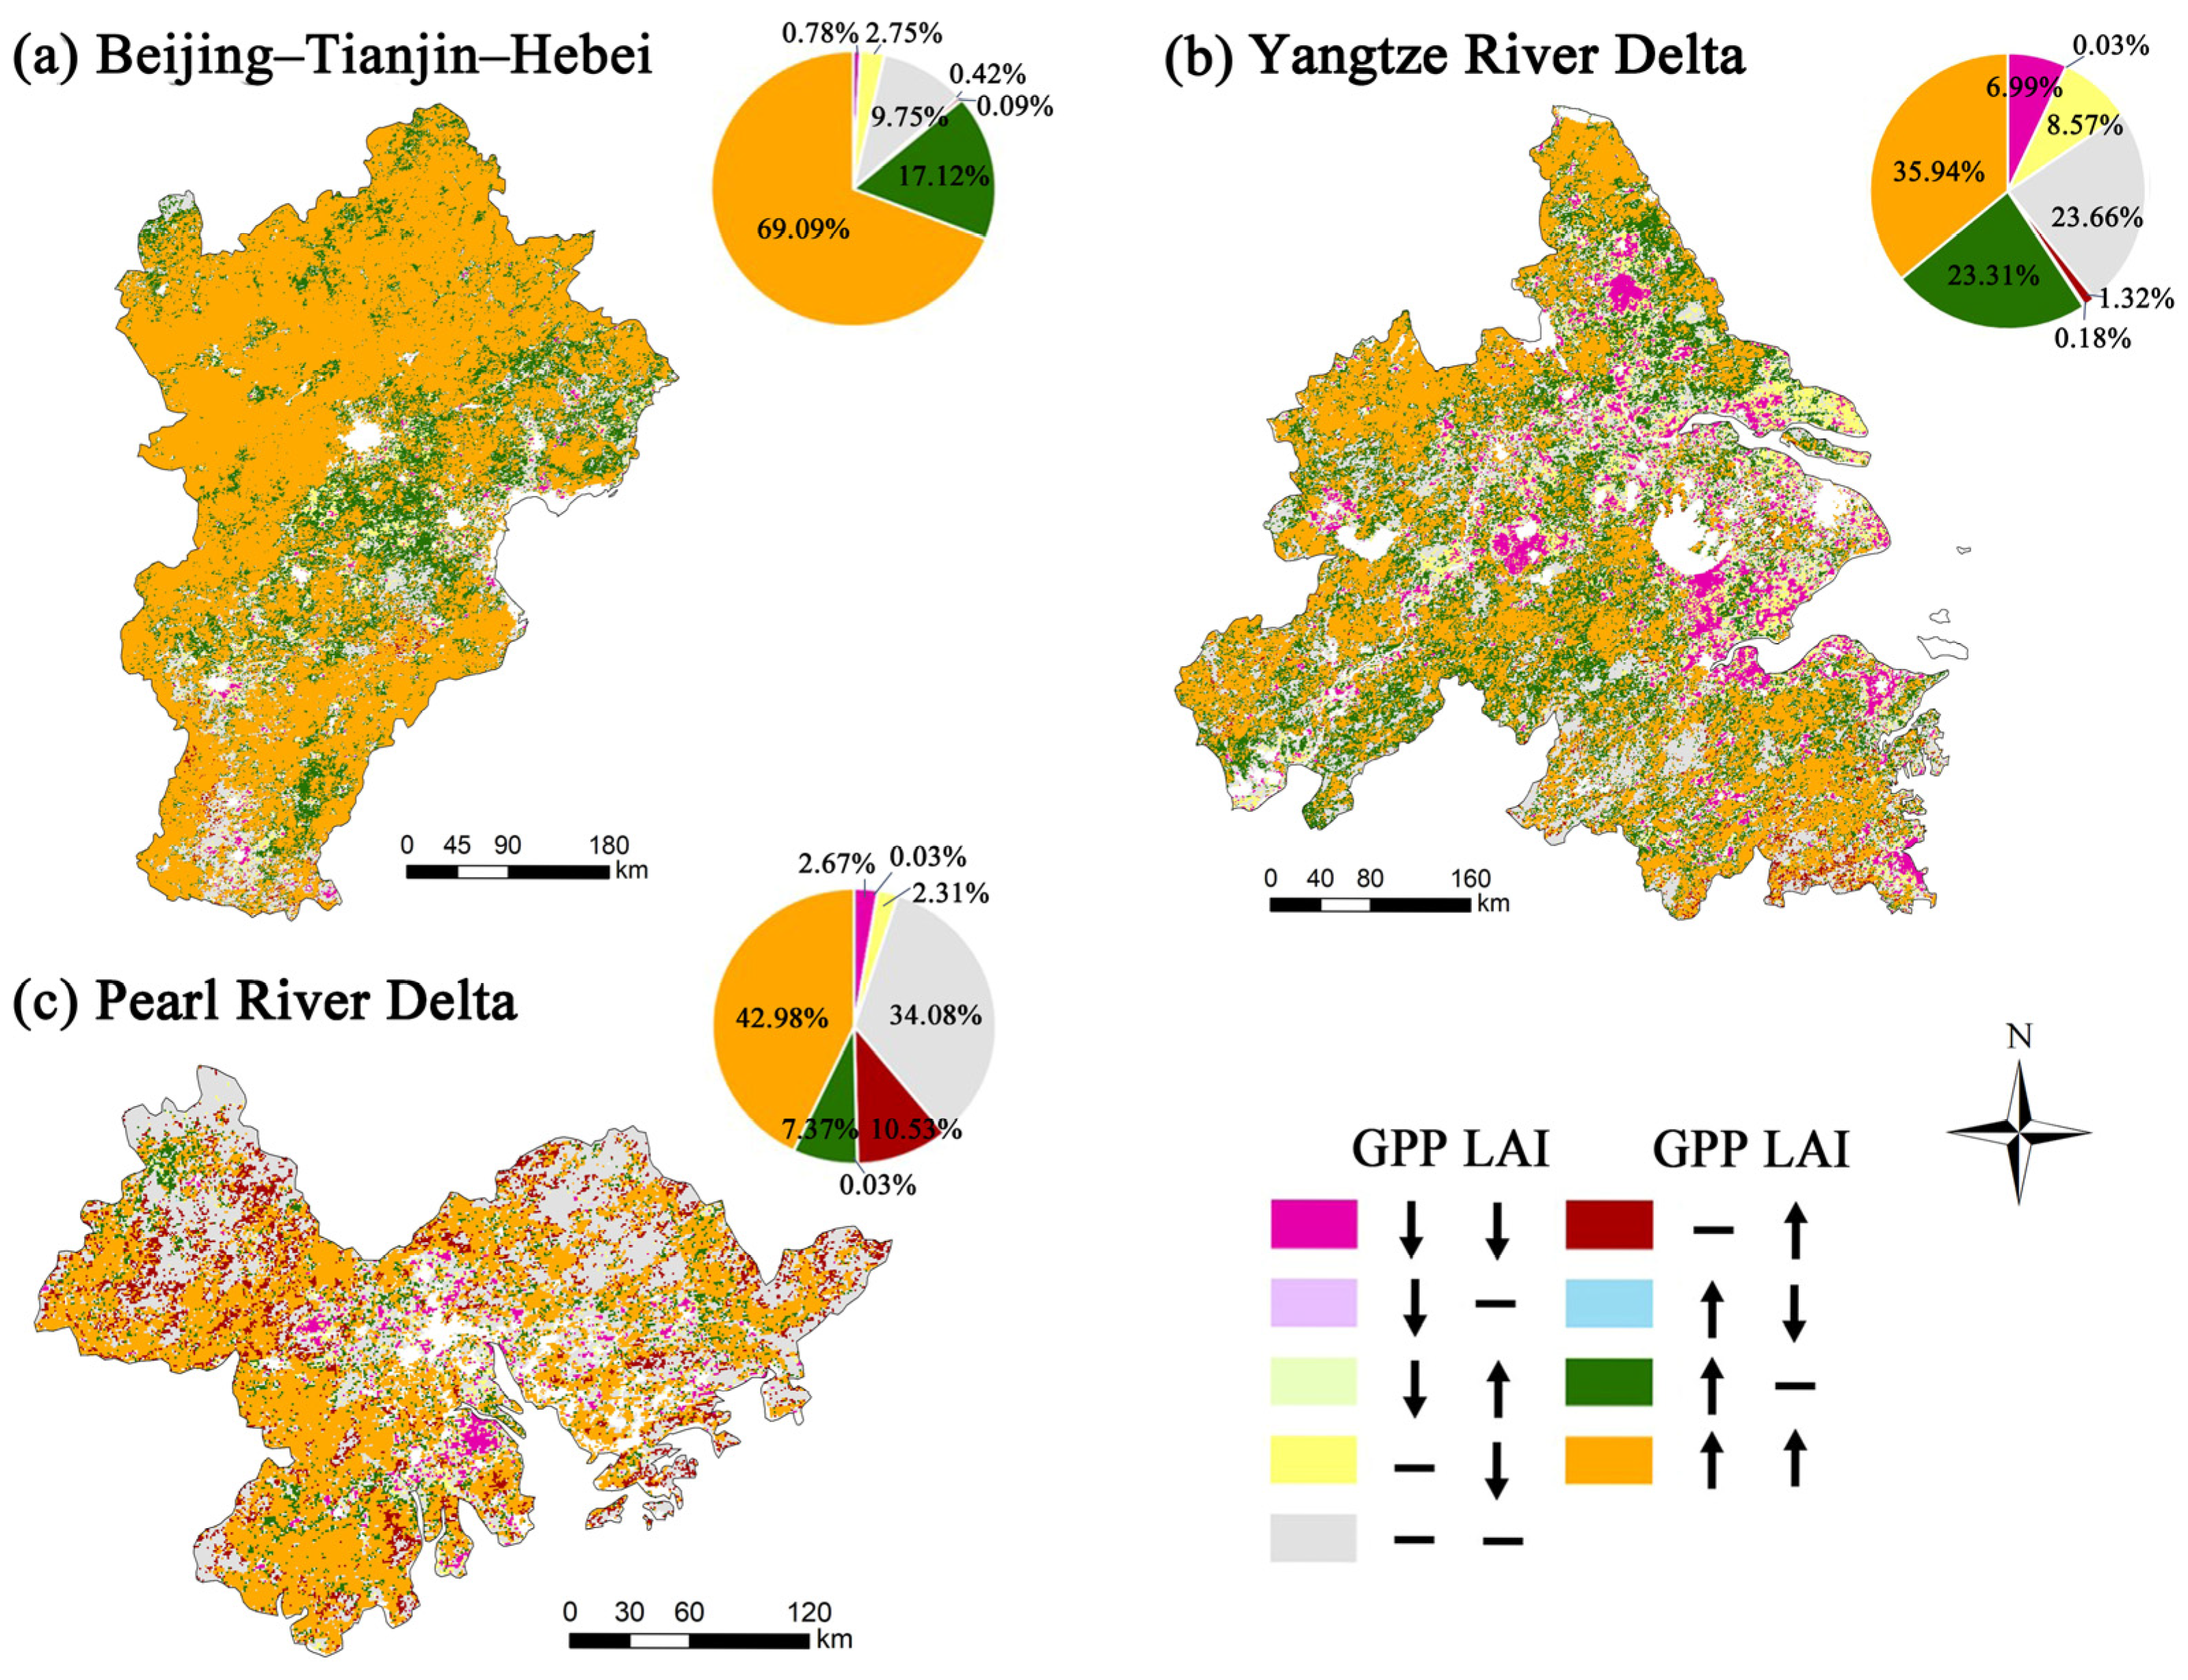
3.2. Inconsistency between Vegetation Greenness and Productivity

Figure 4 showed that the areas exhibiting significant growth in both greenness and productivity constituted the largest share, exceeding 35% in each agglomeration. Especially in BTH, this proportion was the highest, making up 69.09% of the entire region. In contrast, the proportion of regions where both greenness and productivity changed insignificantly was 34.08% and 23.66% in the PRD and YRD, respectively, while in BTH, this proportion accounted for only 9.75%. Additionally, there were regions where productivity increased significantly but greenness changed insignificantly. This pattern was most evident in BTH and YRD, with proportions of 17.12% and 23.31%, respectively, while in the PRD, it was only 7.37%. Conversely, there were also regions where greenness decreased significantly despite insignificant changes in productivity. This trend was most prominent in the YRD, where it accounted for 8.57% of the total area. Both greenness and productivity significantly decreased in 6.99% of the regions in the YRD and 2.67% in the PRD, while the proportion was 0.78% in BTH. Overall, regions with consistent changes in greenness and productivity accounted for 69.87% of BTH but only 45.65% and 42.93% of the PRD and YRD.

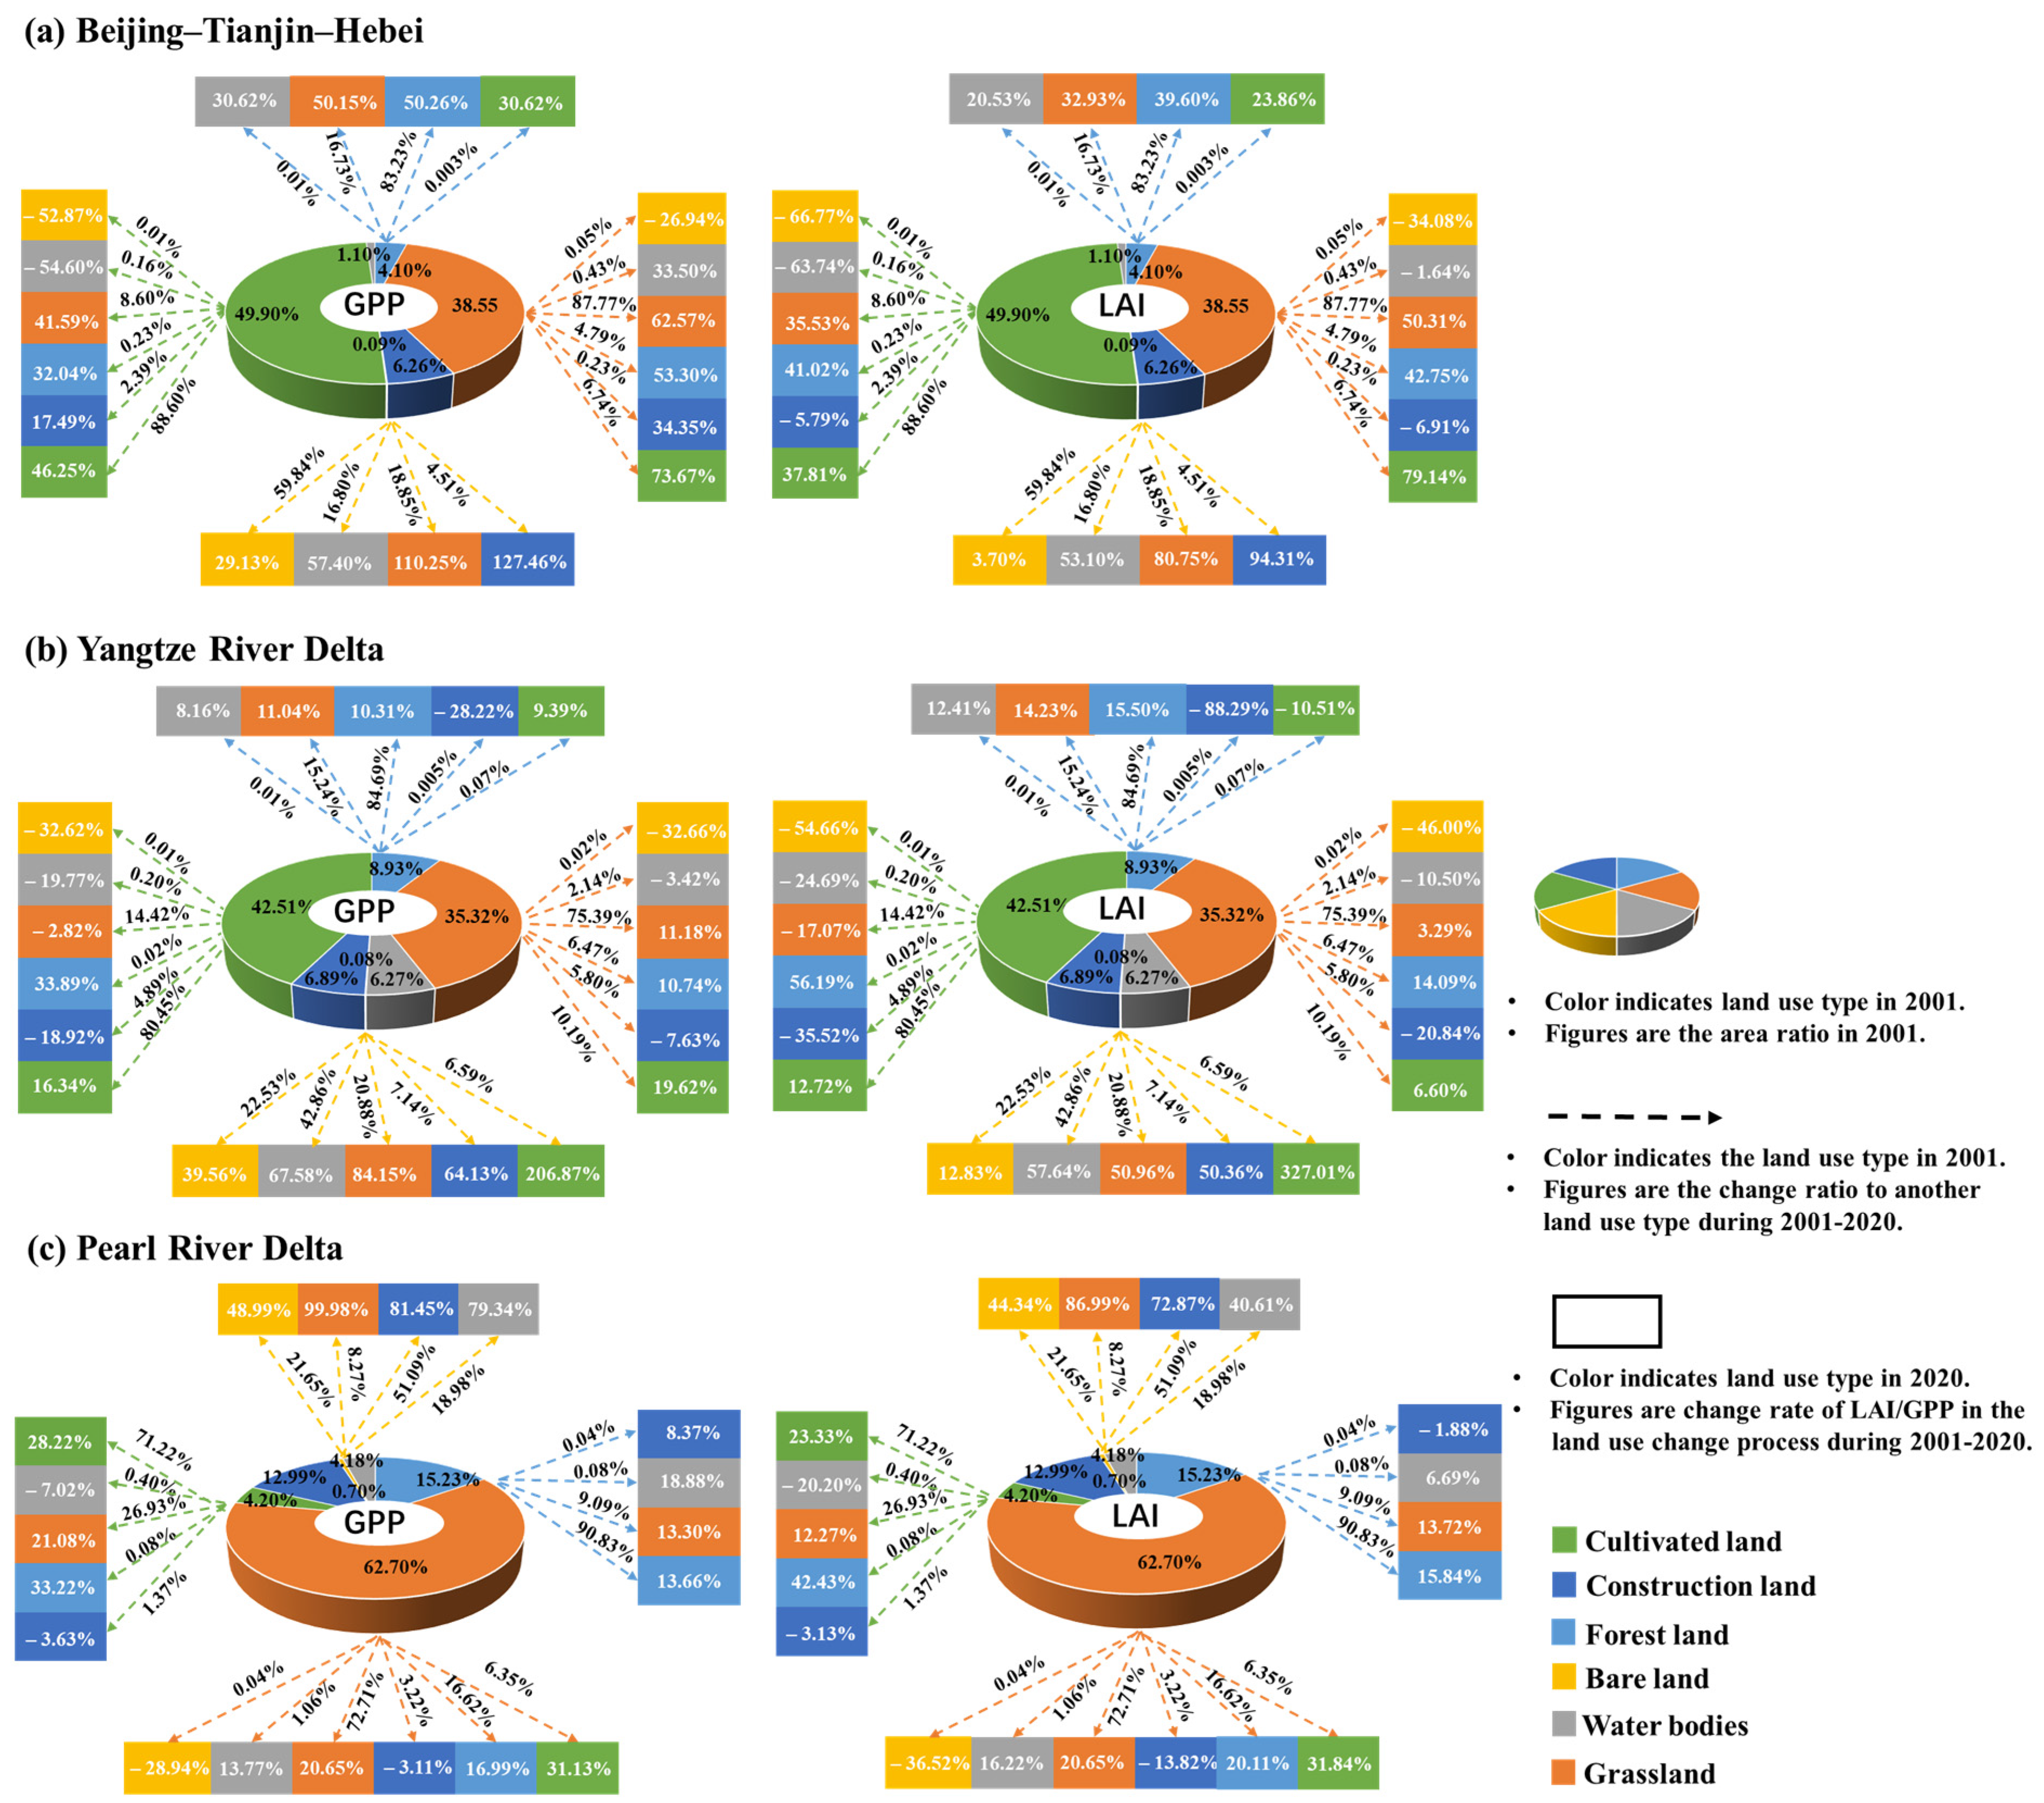
3.3. Impact of Land Use Change on Vegetation Greenness and Productivity

From 2001 to 2020, vegetation greenness and productivity both showed a growth trend in the regions without land use changes, and productivity growth was generally faster than greenness growth (Figure 5). Comparatively, BTH generally experienced faster growth than YRD and PRD, except for unchanged bare lands. As for regions with land use change, the conversion of grasslands, croplands, and forest lands into bare lands, water bodies, and construction lands was the primary factor driving the decline in greenness and productivity (Figure 5). In BTH, the transition of croplands into water bodies and bare lands had the most significant impact. Specifically, this transition resulted in a productivity decrease of 54.60% and 52.87% and a greenness decrease of 63.74% and 66.77%, respectively. In the YRD, the conversion of grasslands and croplands into bare lands caused the largest decline in productivity, with a decrease of 32.66% and 32.62%, respectively. On the other hand, the conversion of forest lands to construction lands had the largest impact on vegetation greenness, resulting in a decrease of 88.29%. In the PRD, the conversion of grasslands to bare lands was the primary driver of the decrease in both greenness and productivity, resulting in respective decreases of 28.94% and 36.52%. In summary, the conversion of croplands, forest lands, and grasslands into construction land generally led to a decrease in vegetation greenness in all three agglomerations. However, the impact on productivity was more variable, with decreases observed in the PRD and YRD but an increase in BTH. Furthermore, the process of converting green land to construction land had a more severe negative impact on vegetation greenness than on productivity in all three agglomerations (Figure 5).

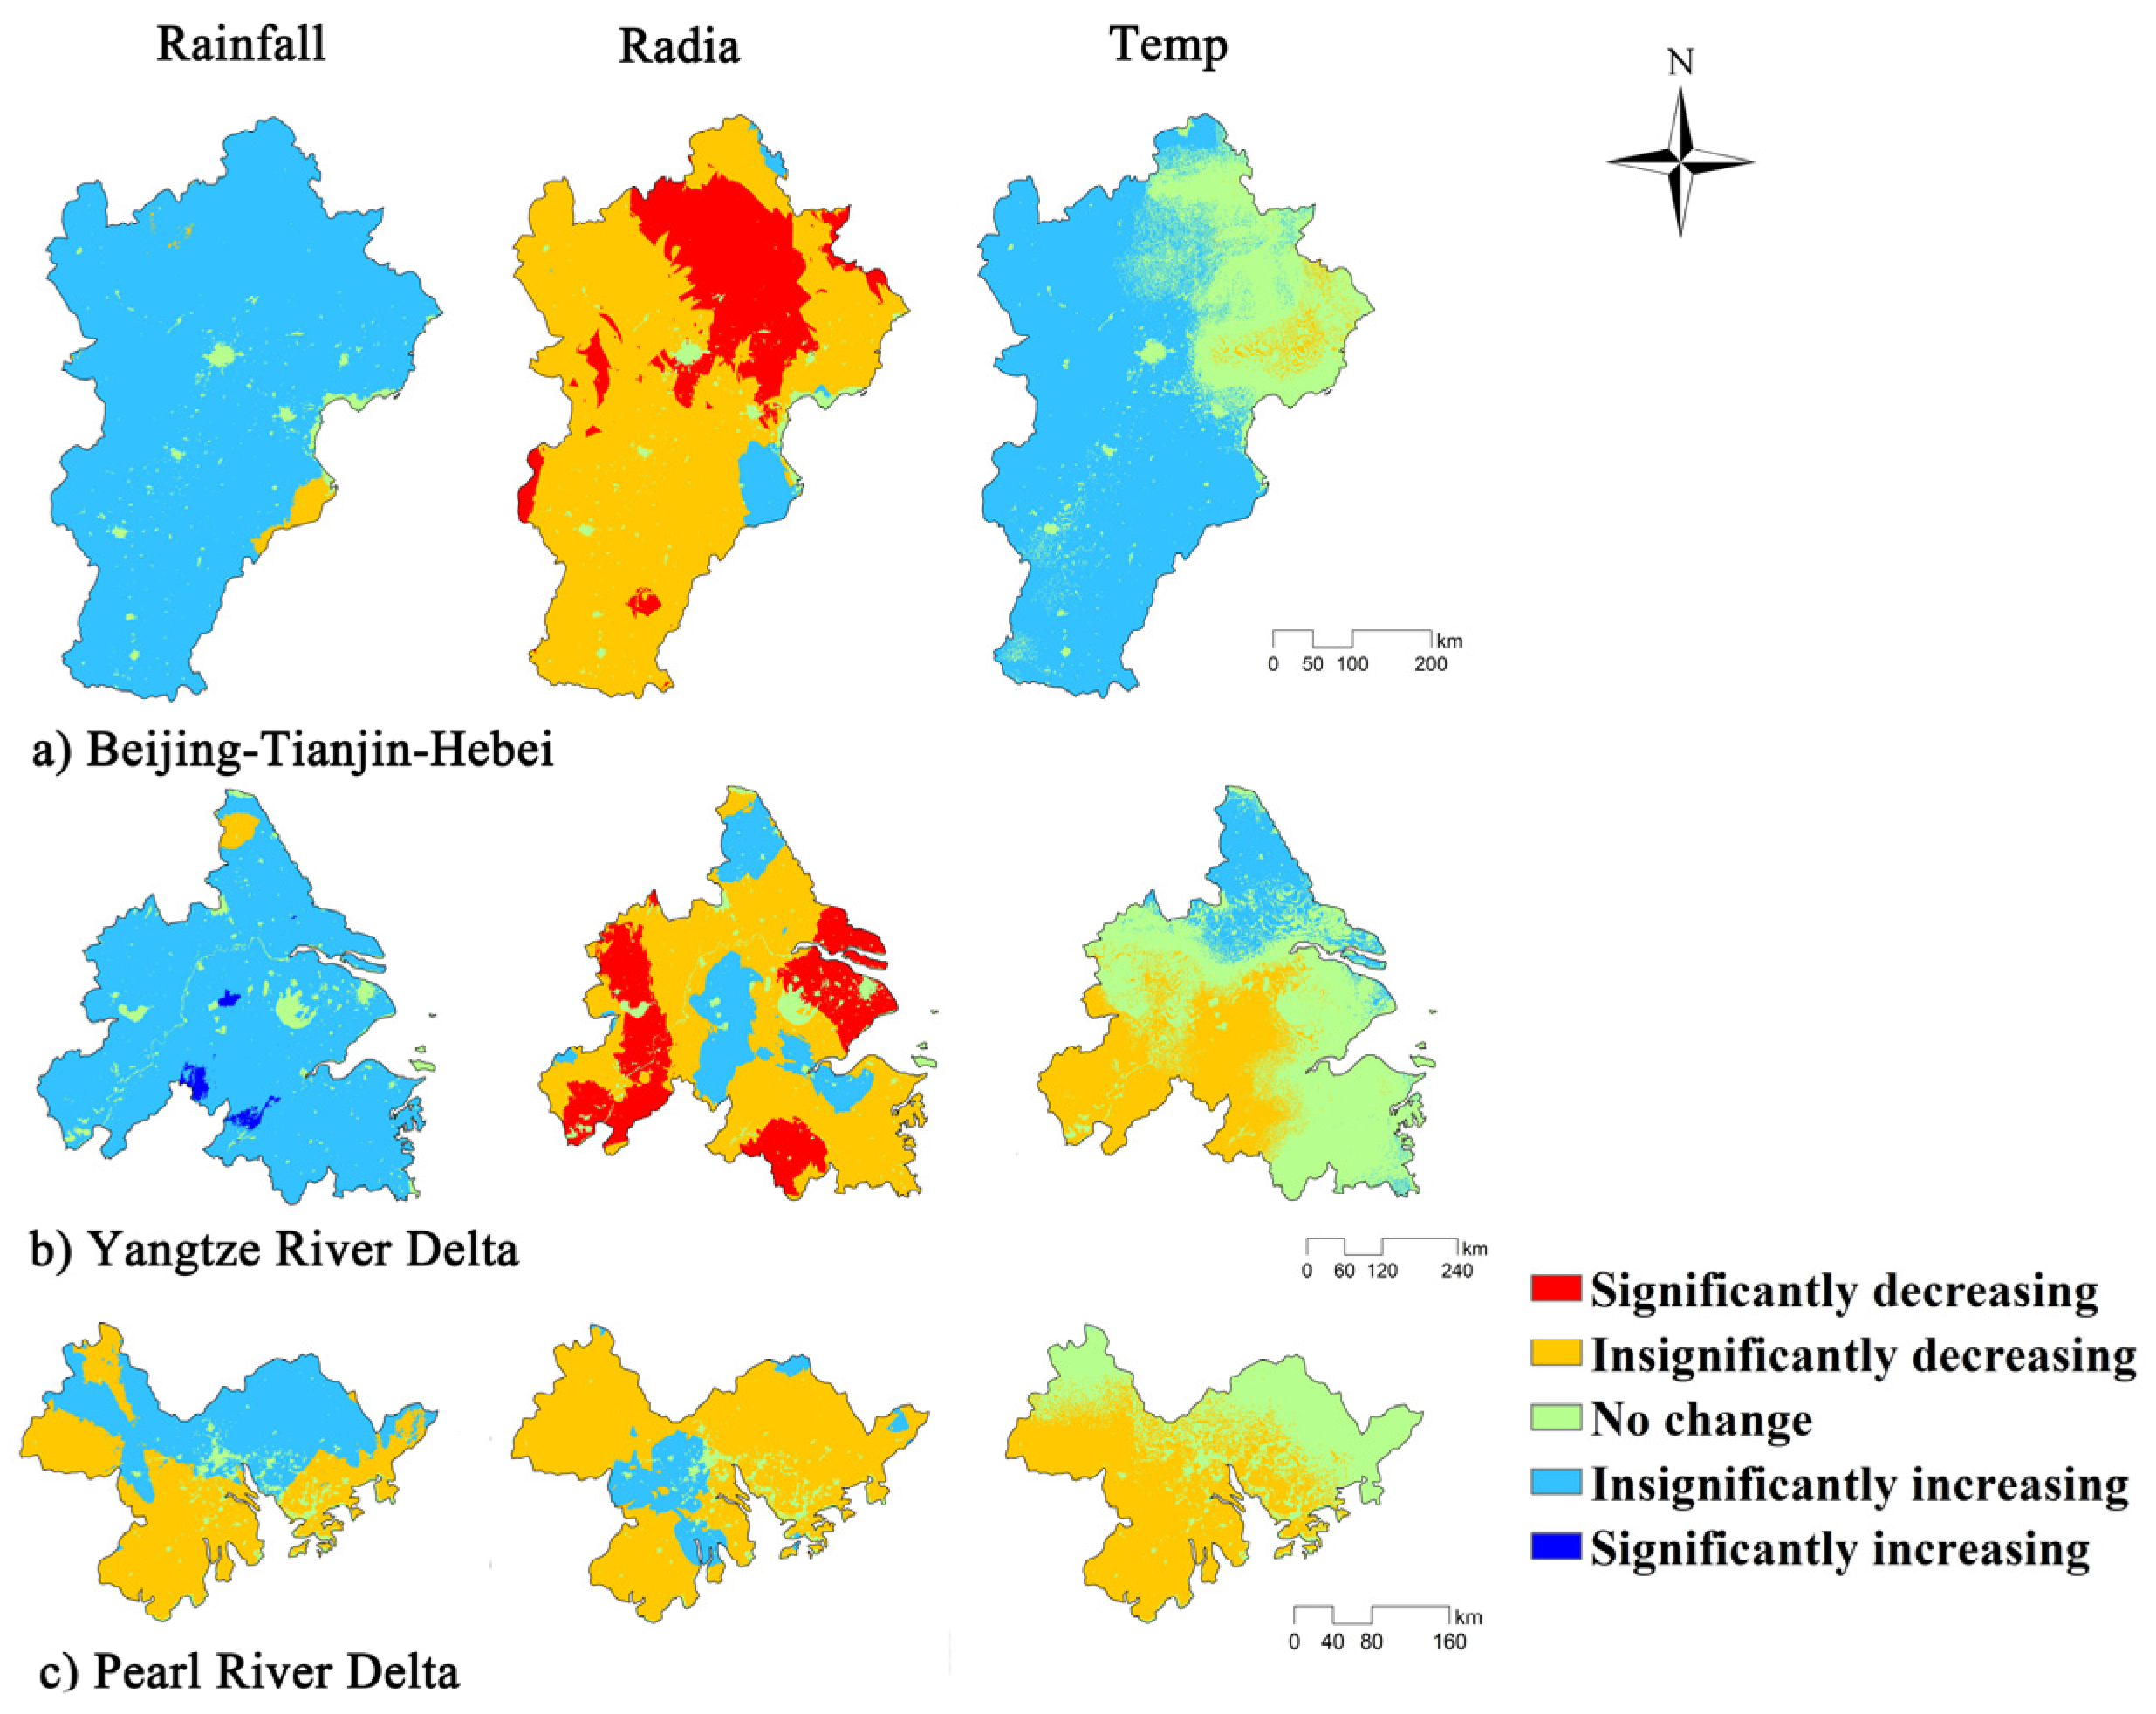
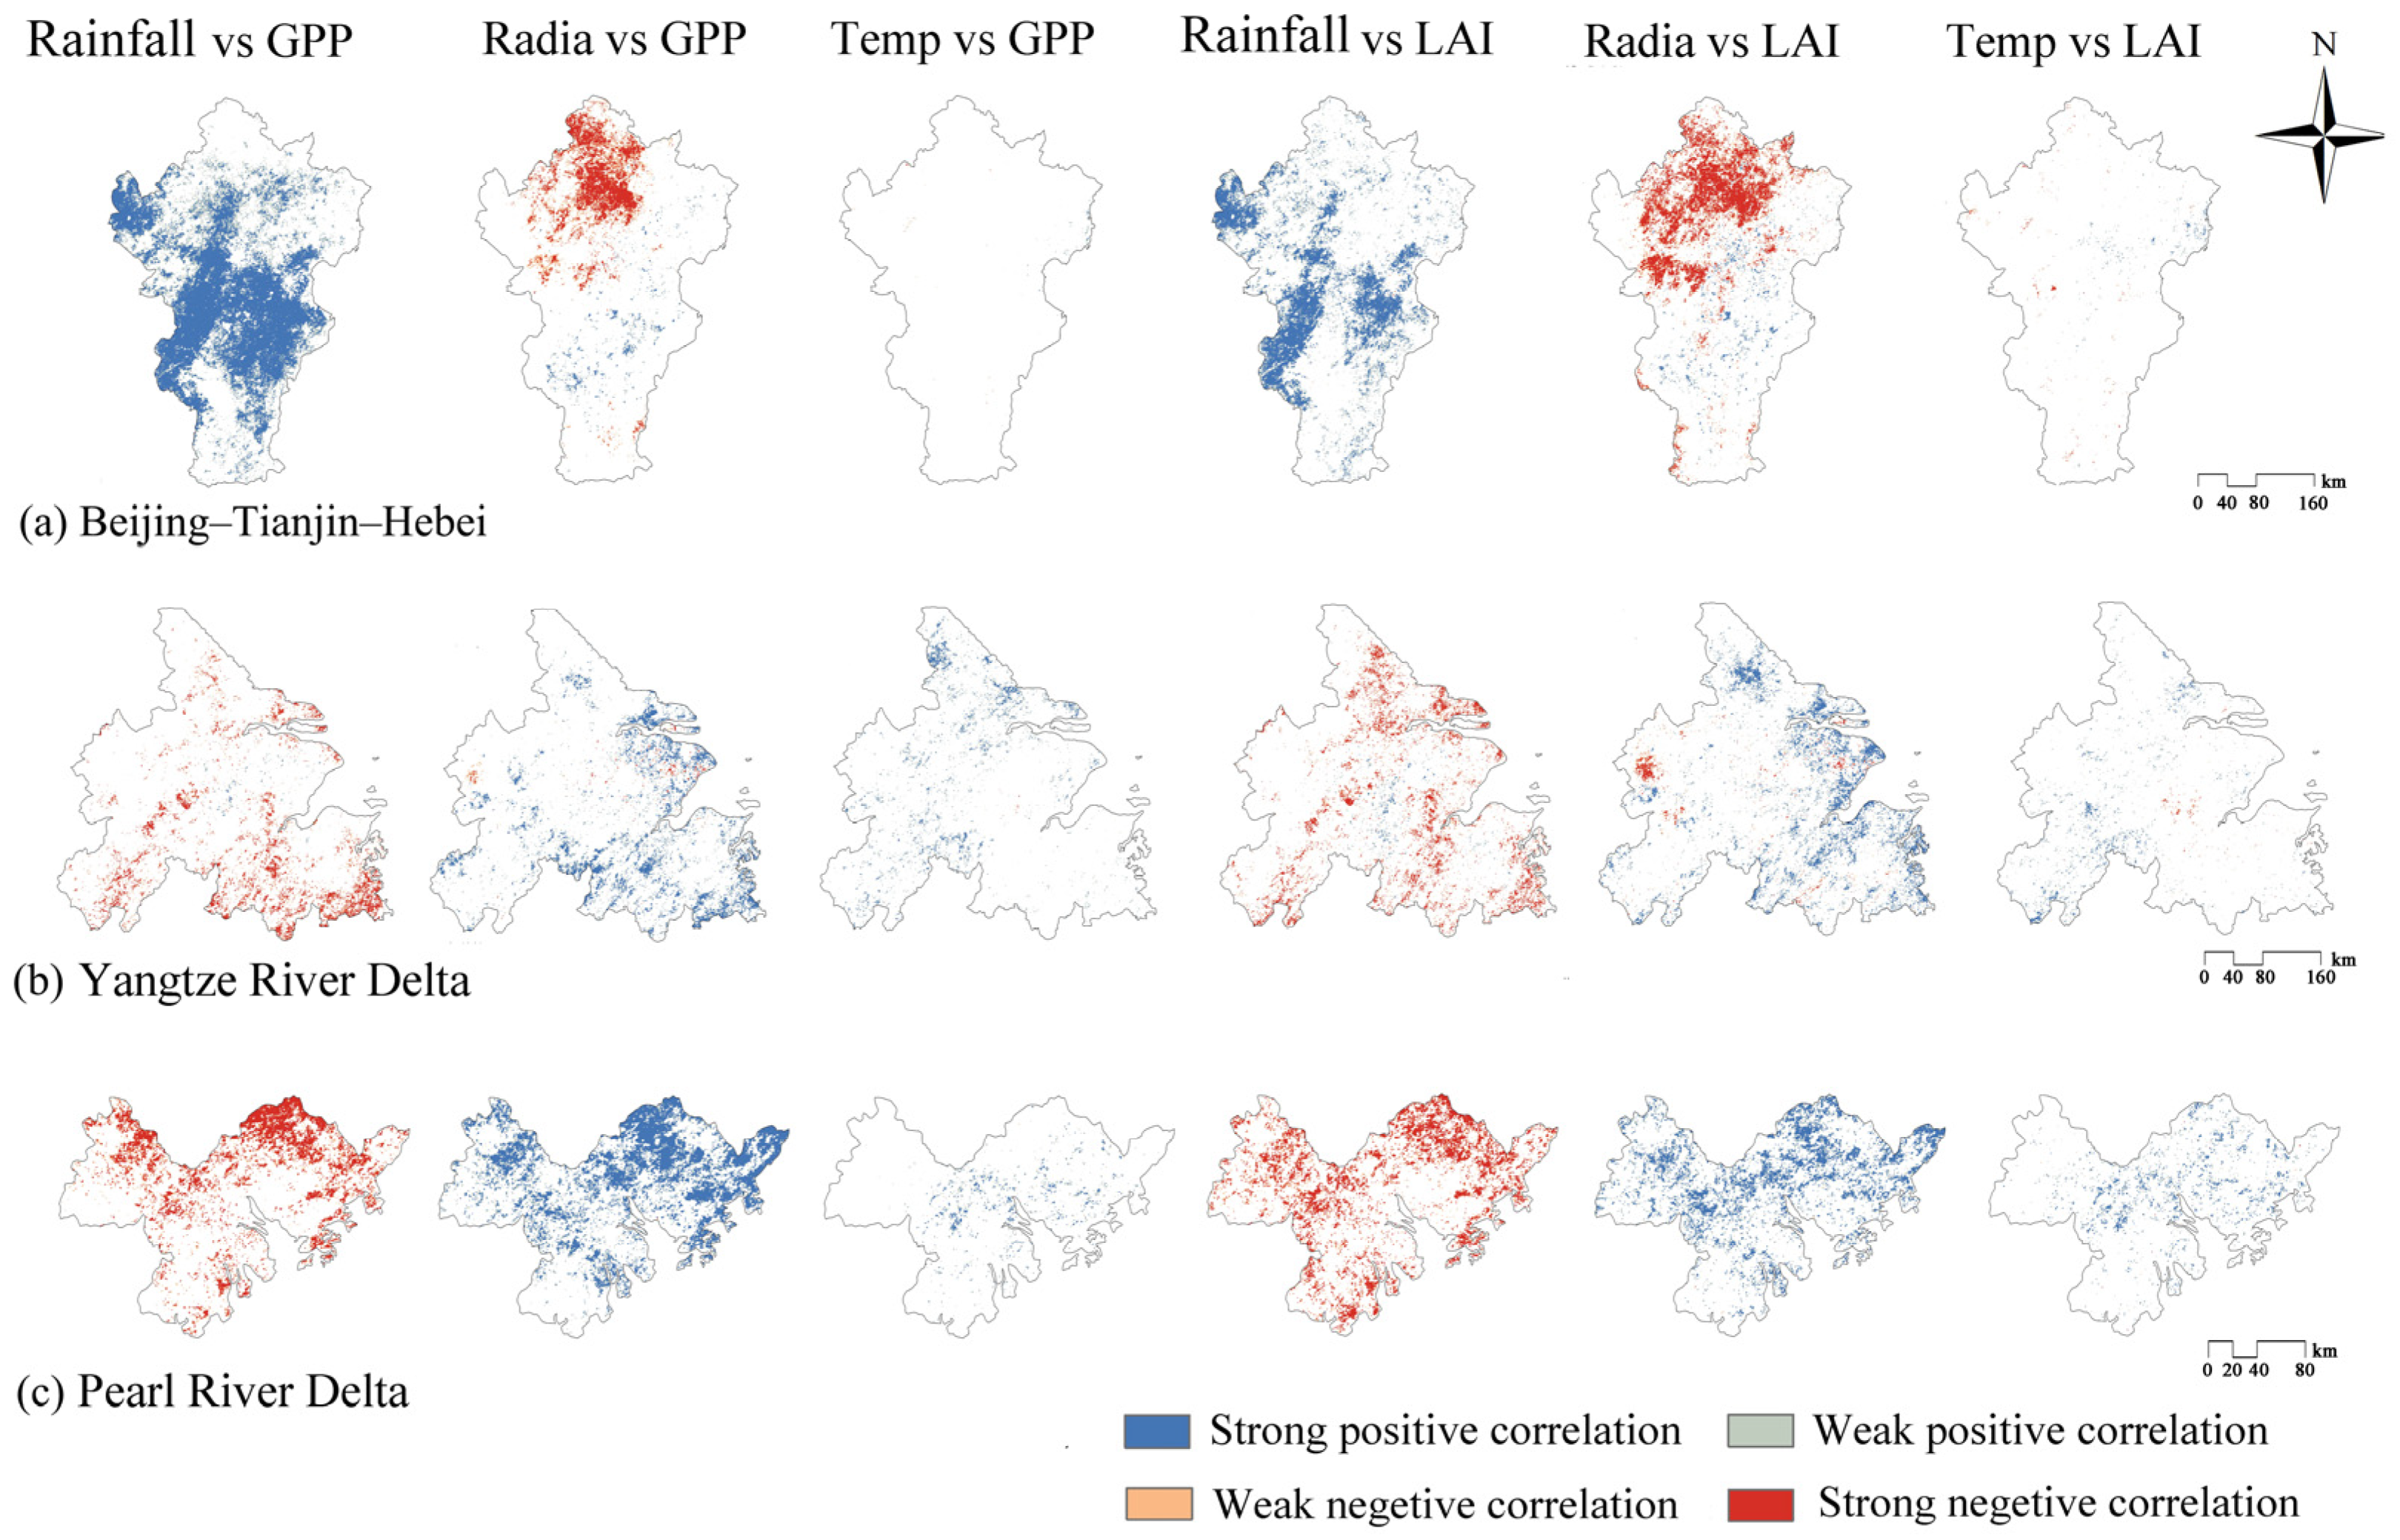
3.4. Impact of Climate Change on Vegetation Greenness and Productivity

Figure 6 showed the dynamic of rainfall, Temp, and Radia during 2001–2020 in three agglomerations. In terms of rainfall, in BTH and YRD, most areas demonstrated insignificant increases, whereas in the PRD, both insignificant increases and decreases coexisted. As for Radia, the majority of areas in these three agglomerations exhibited insignificant decreases, yet in BTH and YRD, a fraction of the areas exhibited significant decreases. As for Temp, most areas in BTH showed insignificant increases, whereas most areas in the PRD demonstrated insignificant decreases. Both these trends were found in the YRD region. Overall, the three climatic factors mainly showed insignificant changes in all three agglomerations between 2001 and 2020.
In BTH, the majority of areas exhibited an insignificant correlation between rainfall and the two metrics, with some regions showing a significant positive correlation (Figure 7a). The regions with a strong negative correlation between Radia and the two metrics were concentrated in the north, while Temp rarely showed significant correlations with greenness and productivity (Figure 7a). In the YRD, greenness and productivity showed an insignificant correlation with rainfall, Radia, and Temp in most areas (Figure 7b). The region where productivity and rainfall were strongly negatively correlated was concentrated in the south, while the regions where greenness and rainfall were negatively correlated were scattered throughout the region. The regions where Radia and the two metrics were significantly positively correlated were primarily distributed in the south and east. In the PRD, the two vegetation metrics were also insignificantly correlated with climatic factors in most areas (Figure 7c). The region where the two metrics and rainfall were strongly negatively correlated was concentrated in the north, while the regions where the two metrics and Radia were strongly positively correlated were scattered throughout the PRD. Overall, the roles of rainfall and Radia in greenness and productivity varied significantly across regions. Rainfall played a positive role, while Radia had a negative role in greenness and productivity in BTH. On the contrary, rainfall had a negative impact, while Radia showed a positive impact in the YRD and PRD. In the three agglomerations, Temp was insignificantly correlated with the two metrics.

4. Discussion

4.1. Inconsistency between Greenness and Productivity and Its Potential Reasons

Previous studies mainly discussed vegetation dynamics using a single index, ignoring the difference between vegetation greenness and productivity. Our findings revealed a marked inconsistency between them across different agglomerations. In BTH, only 69.87% of the area exhibited concurrent changes in both greenness and productivity, while the corresponding figures for the YRD and PRD were lower, at 42.93% and 45.65%, respectively (Figure 4). The regions where these consistent changes occurred were primarily concentrated in areas without land use change. This alignment was further supported by the overlap ratios, which indicated that 87.45% of the consistent change areas in BTH, 79.31% in the YRD, and 77.48% in the PRD correspond to regions without land use change. On the other hand, the areas that exhibited inconsistent changes were distributed within both the regions with and without land use changes. This inconsistency could be attributed to factors including land use change and climate change [41,42,43].
The impact of land use change on the inconsistency between greenness and productivity can be preliminary explored by comparing their dynamics in the regions with and without land use changes. From 2001 to 2020, both greenness and productivity showed a rising trend in the regions without land use change. A notable observation was that the increase rate in productivity exceeded that of greenness, particularly in land use types such as cropland and grassland. The reason for this difference might be that as vegetation matures, the change rate in greenness tends to decelerate in the later stages of growth; conversely, the photosynthesis capacity of vegetation gradually enhances, leading to an accelerated increase in productivity [41]. In the regions with land use change, the responses of greenness and productivity also varied. The transformation of green land into construction land, for example, exerted a more profound negative influence on greenness than on productivity across all agglomerations. This is likely due to the direct removal of vegetative cover during urbanization, which significantly reduces greenness, while residual vegetation may still maintain some level of productivity [44].
Climate change also plays a role in the inconsistency between greenness and productivity [16]. Different climatic factors have varying degrees of influence and often have contrasting effects on greenness and productivity. For example, increased rainfall may enhance greenness by promoting vegetation growth, but excessive rainfall can also lead to flooding and other negative impacts on productivity [26,45]. Similarly, temperature changes can affect both greenness and productivity, but their specific impacts depend on the species and ecological niche of the vegetation [46].
Vegetation greenness is a canopy structural property that has a close linkage with photosynthetic capability [47,48]. Previous studies widely applied vegetation greenness as a proxy to analyze vegetation productivity dynamics [49,50]. Some studies even attempted to estimate vegetation productivity directly based solely on greenness, without relying on additional data [51]. Our study revealed the inconsistency between greenness and productivity, and pointed out that climate change and land use change affect them differently. Greenness primarily reflects the structural properties of the vegetation canopy, while productivity is a measure of the vegetation’s ability to convert solar energy into biomass [52]. Thus, it is necessary to clarify the differences between vegetation greenness and productivity in further research to explore vegetation dynamics in a scientific way [53].

4.2. Divergent Responses of Vegetation Change in the Three Agglomerations

Vegetation provides numerous vital ecosystem services for human well-being; thus, understanding its influencing mechanism is crucial for sustainable urban development. The three urban agglomerations varied in vegetation change and their responses to land use change and climatic factors. Our study found that in unchanged forest lands, vegetation productivity growth exceeded the growth in greenness in BTH. Conversely, in the YRD and PRD, there was a tendency for vegetation greenness to grow faster than productivity. One potential explanation for these differences lies in the varying vegetation types across these regions [26]. The YRD and PRD are primarily characterized by evergreen broadleaf forests, which exhibit rapid growth in leaf area during the vegetation growth process. This rapid leaf area expansion contributes to the faster growth of greenness observed in these regions. On the other hand, the BTH region is dominated by deciduous broadleaf forests and coniferous forests. These forest types exhibit a slower change in leaf area compared with productivity throughout the vegetation growth process. Consequently, the increase in vegetation productivity surpassed the increase in greenness in this region.
Spatial heterogeneity in vegetation dynamics also existed in the regions with land use change. The transition of various land types, such as croplands, grasslands, and forest lands, into construction lands typically resulted in a decline in greenness and vegetation productivity. However, the extent and nature of these changes varied significantly across the YRD, PRD, and BTH. In the YRD and PRD, this transition led to a decrease in both greenness and productivity. In contrast, in BTH, while greenness decreased, vegetation productivity actually increased. This occurrence can be ascribed to several contributing factors. Firstly, the proportion of grasslands and croplands converted into construction lands in BTH was relatively small (the proportion accounted for 0.23% and 2.39%, respectively), resulting in less significant vegetation loss compared with the YRD and PRD. Secondly, this increase may be linked to urban greening efforts and the establishment of green infrastructure, as in BTH, greenness and productivity increased by 15.69% and 36.18%, respectively, in unchanged construction lands (the growth rate was the largest in all agglomerations). Furthermore, this study highlights that the negative impact of converting vegetation into bare lands is generally greater than that of converting vegetation into construction lands. This observation suggests the indirect positive impacts associated with construction lands, such as green infrastructure construction and urban microclimate [54,55].
The effects of climatic factors on vegetation greenness and productivity varied across the three agglomerations. They were negatively correlated with rainfall and positively correlated with Radia in the YRD and PRD. Conversely, in BTH, they were positively correlated with rainfall and negatively correlated with Radia. These variations can be explained by the disparities in vegetation types and climate backgrounds among the three regions. In the YRD and PRD, relatively abundant rainfall ensures that the needs of local vegetation growth are met. However, excessive rainfall can increase cloud cover, which in turn reduces the amount of necessary Radia required for optimal vegetation growth. Therefore, when rainfall is sufficient in these regions, it can actually inhibit vegetation growth, while Radia acts as a promoting factor [26,56,57]. On the other hand, in BTH, there is relatively less rainfall and more Radia. This climate condition satisfies the needs of vegetation for Radia. As a result, excessive Radia does not further promote vegetation growth, while Rainfall acts as a positive factor for local vegetation growth in BTH.

4.3. Limitations and Prospect

Previous studies mainly discussed vegetation dynamics using a specific index, and explored potential reasons in a single region. This study revealed the inconsistency between greenness and productivity in three major agglomerations from 2001 to 2020, and emphasized the crucial role of climatic factors and land use change in shaping these ecological changes. This study provided insights into the vegetation dynamics within the agglomerations and highlighted the regional differences in their responses to external factors, which is crucial for developing targeted policies and management strategies aimed at enhancing urban sustainability.
There are also many limitations in this study. First, this study solely assessed the inconsistency between greenness and productivity, without delving into their correlation. Comprehending the linkages between LAI and GPP is vital to mechanistically explaining how LAI translates into GPP [58]. Future research should explore this relationship in depth to gain insights into the ecological processes driving vegetation growth. Second, this study simply analyzed the impacts of climate and land use change on greenness and productivity. To fully reveal the underlying mechanisms of regional vegetation change, future studies should delve into the contribution rates and impact paths of these two factors. This would provide a deeper understanding of how these external forces shape vegetation patterns and dynamics.

5. Conclusions

Monitoring vegetation dynamics and their influencing mechanism is crucial for informing urban sustainability. However, how different vegetation indices vary in their changes and responses to climate change and land use change remains unclear. Based on the trend detection of vegetation greenness and productivity, this study examined their inconsistency and explored its potential reasons in three agglomerations. The results showed that both vegetation greenness and productivity exhibited an overall upward trend in the three agglomerations during the study period. However, a notable inconsistency was observed, indicating that increases in greenness do not necessarily translate into corresponding increases in productivity. This inconsistency was attributed to the combined effects of land use change and climate change, which operated differently in various regions. Furthermore, this study found that the influence of climatic factors and land use change differed among agglomerations because of variations in natural backgrounds. This study offers a fresh perspective on regional vegetation change research, which is valuable for policymakers and land managers seeking to promote sustainable urban development.

Author Contributions

Conceptualization, methodology, and funding acquisition, Y.H.; software, formal analysis, writing, and editing, Y.H. and F.X. All authors have read and agreed to the published version of the manuscript.

Funding

This research was funded by the National Natural Science Foundation of China (42201102) and Research Project of Shanghai Municipal Bureau of Ecology and Environment (No. 9, HuHuanKe [2023]).

Institutional Review Board Statement

Not applicable.

Informed Consent Statement

Not applicable.

Data Availability Statement

The data supporting this study are available from the following resources in the public domain. The LAI dataset was obtained from MOD15A2H (https://lpdaac.usgs.gov/products/mod15a2hv006/, accessed on 23 May 2024). The GPP dataset was obtained from MOD17A2H (https://lpdaac.usgs.gov/products/mod17a2hv006/, accessed on 23 May 2024). Land use/cover data were obtained from the International Geosphere Biosphere Program (IGBP) classification scheme of MCD12Q1 (https://modis.gsfc.nasa.gov/data/dataprod/mod12.php, accessed on 23 May 2024). Climatic data, including temperature, rainfall, and solar radiation, were obtained from the Resource and Environment Science and Data Center (http://www.resdc.cn, accessed on 24 May 2024). The administrative boundary was obtained from the Geographical Information Monitoring Cloud Platform (http://www.dsac.cn/, accessed on 18 May 2024).

Conflicts of Interest

The authors declare no conflicts of interest.

References

  1. Caparros-Santiago, J.A.; Rodriguez-Galiano, V.; Dash, J. Land surface phenology as indicator of global terrestrial ecosystem dynamics: A systematic review. ISPRS J. Photogramm. Remote Sens. 2021, 171, 330–347. [Google Scholar] [CrossRef]
  2. Huang, K.; Xia, J.; Wang, Y.; Ahlström, A.; Chen, J.; Cook, R.B.; Cui, E.; Fang, Y.; Fisher, J.B.; Huntzinger, D.N.; et al. Enhanced peak growth of global vegetation and its key mechanisms. Nat. Ecol. Evol. 2018, 2, 1897–1905. [Google Scholar] [CrossRef]
  3. Piao, S.; Wang, X.; Park, T.; Chen, C.; Lian, X.; He, Y.; Bjerke, J.W.; Chen, A.; Ciais, P.; Tømmervik, H.; et al. Characteristics, drivers and feedbacks of global greening. Nat. Rev. Earth Environ. 2019, 1, 14–27. [Google Scholar] [CrossRef]
  4. Selmi, W.; Weber, C.; Riviere, E.; Blond, N.; Mehdi, L.; Nowak, D. Air pollution removal by trees in public green spaces in Strasbourg city, France. Urban For. Urban Green. 2016, 17, 192–201. [Google Scholar] [CrossRef]
  5. Santiago, J.L.; Rivas, E. Advances on the influence of vegetation and forest on urban air quality and thermal comfort. Forests 2021, 12, 1133. [Google Scholar] [CrossRef]
  6. Li, Y.; Piao, S.; Li, L.; Chen, A.; Wang, X.; Ciais, P.; Huang, L.; Lian, X.; Peng, S.; Zeng, Z.; et al. Divergent hydrological response to large-scale afforestation and vegetation greening in China. Sci. Adv. 2018, 5, 4182. [Google Scholar] [CrossRef] [PubMed]
  7. Renterghem, V.T. Towards explaining the positive effect of vegetation on the perception of environmental noise. Urban For. Urban Green. 2018, 40, 133–144. [Google Scholar] [CrossRef]
  8. Forzieri, G.; Alkama, R.; Miralles, D.G.; Cescatti, A. Satellites reveal contrasting responses of regional climate to the widespread greening of Earth. Science 2017, 356, 1180–1184. [Google Scholar] [CrossRef]
  9. Poulter, B.; Frank, D.; Ciais, P.; Myneni, R.B.; Andela, N.; Bi, J.; Broquet, G.; Canadell, J.G.; Chevallier, F.; Liu, Y.; et al. Contribution of semi-arid ecosystems to interannual variability of the global carbon cycle. Nature 2014, 509, 600–603. [Google Scholar] [CrossRef]
  10. Hidalgo, A.K. Mental health in winter cities: The effect of vegetation on streets. Urban For. Urban Green. 2021, 63, 127226. [Google Scholar] [CrossRef]
  11. Yang, J.; Huang, C.; Zhang, Z.; Wang, L. The temporal trend of urban green coverage in major chinese cities between 1990 and 2010. Urban For. Urban Green. 2014, 13, 19–27. [Google Scholar] [CrossRef]
  12. Yang, K.; Sun, W.; Luo, Y.; Zhao, L. Impact of urban expansion on vegetation: The case of China (2000–2018). J. Environ. Manag. 2021, 291, 112598. [Google Scholar] [CrossRef] [PubMed]
  13. Huang, J.; Yu, H.; Guan, X.; Wang, G.; Guo, R. Accelerated dryland expansion under climate change. Nat. Clim. Chang. 2016, 6, 166–171. [Google Scholar] [CrossRef]
  14. United Nations. World Urbanization Prospects: The 2019 Revision; United Nations: New York, NY, USA, 2019. [Google Scholar]
  15. Mu, W.; Zhu, X.; Ma, W.; Han, Y.; Huang, H.; Huang, X. Impact assessment of urbanization on vegetation net primary productivity: A case study of the core development area in central plains urban agglomeration, China. Environ. Res. 2023, 229, 115995. [Google Scholar] [CrossRef] [PubMed]
  16. Zhang, Y.; Ye, A. Quantitatively distinguishing the impact of climate change and human activities on vegetation in mainland China with the improved residual method. Giscience Remote Sens. 2021, 58, 235–260. [Google Scholar] [CrossRef]
  17. Xu, Q.; Dong, Y.; Yang, R. Influence of land urbanization on carbon sequestration of urban vegetation: A temporal cooperativity analysis in Guangzhou as an example. Sci. Total Environ. 2018, 635, 26–34. [Google Scholar] [CrossRef] [PubMed]
  18. Malone, S.L.; Tulbure, M.G.; Pérez-Luque, A.J.; Assal, T.J.; Bremer, L.L.; Drucker, D.P.; Hillis, V.; Varela, S.; Goulden, M.L. Drought resistance across California ecosystems: Evaluating changes in carbon dynamics using satellite imagery. Ecosphere 2016, 7, e01561. [Google Scholar] [CrossRef]
  19. Wang, J.; Pauleit, S.; Banzhaf, E. An integrated indicator framework for the assessment of multifunctional green infrastructure-exemplified in a European city. Remote Sens. 2019, 11, 1869. [Google Scholar] [CrossRef]
  20. Pan, N.; Feng, X.; Fu, B.; Wang, S.; Ji, F.; Pan, S. Increasing global vegetation browning hidden in overall vegetation greening: Insights from time-varying trends. Remote Sens. Environ. 2018, 214, 59–72. [Google Scholar] [CrossRef]
  21. Qiu, S.; Hu, T.; Hu, Y.; Ding, Z.; Liu, Y.; Peng, J. Remote sensing based global vegetation products: From vegetation spectral index to fusion datasets. Acta Geogr. Sin. 2022, 77, 1102–1119. (In Chinese) [Google Scholar]
  22. Chen, C.; Park, T.; Wang, X.; Piao, S.; Xu, B.; Chaturvedi, R.K.; Fuchs, R.; Brovkin, V.; Ciais, P.; Fensholt, R.; et al. China and India lead in greening of the world through land-use management. Nat. Sustain. 2019, 2, 122–129. [Google Scholar] [CrossRef] [PubMed]
  23. Li, C.; Li, L.; Wu, X.; Tsunekawa, A.; Wei, Y.; Liu, Y.; Peng, L.; Chen, J.; Bai, K. Increasing precipitation promoted vegetation growth in the Mongolian Plateau during 2001–2018. Front. Environ. Sci. 2023, 11, 1153601. [Google Scholar] [CrossRef]
  24. Peng, C.; Du, L.; Ren, H.; Li, X.; Li, X. Spatial heterogeneity of combined factors affecting vegetation greenness change in the Yangtze River Economic Belt from 2000 to 2020. Remote Sens. 2023, 15, 5693. [Google Scholar] [CrossRef]
  25. Ding, Z.; Peng, J.; Qiu, S.; Zhao, Y. Nearly half of global vegetated area experienced inconsistent vegetation growth in terms of greenness, cover, and productivity. Earth’s Future 2020, 8, e2020EF001618. [Google Scholar] [CrossRef]
  26. Zhao, Y.; Peng, J.; Ding, Z.; Qiu, S.; Liu, X.; Wu, J.; Meersmans, J. Divergent dynamics between grassland greenness and gross primary productivity across China. Ecol. Indic. 2022, 142, 109100. [Google Scholar] [CrossRef]
  27. Yan, D.; Scott, R.L.; Moore, D.J.P.; Biederman, J.A.; Smith, W.K. Understanding the relationship between vegetation greenness and productivity across dryland ecosystems through the integration of PhenoCam, satellite, and eddy covariance data. Remote Sens. Environ. 2019, 223, 50–62. [Google Scholar] [CrossRef]
  28. Bai, Y.; Li, S.; Liu, M.; Guo, Q. Assessment of vegetation change on the Mongolian Plateau over three decades using different remote sensing products. J. Environ. Manag. 2022, 317, 115509. [Google Scholar] [CrossRef] [PubMed]
  29. Hinojo-Hinojo, C.; Goulden, M.L. Plant traits help explain the tight relationship between vegetation indices and Gross Primary Production. Remote Sens. 2020, 12, 1405. [Google Scholar] [CrossRef]
  30. Zhang, Y.; Song, C.; Band, L.E.; Sun, G. No proportional increase of terrestrial gross carbon sequestration from the greening Earth. J. Geophys. Res. Biogeosci. 2019, 124, 2540–2553. [Google Scholar] [CrossRef]
  31. Xu, L.; Samanta, A.; Costa, M.H.; Ganguly, S.; Nemani, R.R.; Myneni, R.B. Widespread decline in greenness of Amazonian vegetation due to the 2010 drought. Geophys. Res. Lett. 2011, 38, L07402. [Google Scholar] [CrossRef]
  32. Ge, W.; Deng, L.; Wang, F.; Han, J. Quantifying the contributions of human activities and climate change to vegetation net primary productivity dynamics in China from 2001 to 2016. Sci. Total Environ. 2021, 773, 145648. [Google Scholar] [CrossRef]
  33. Li, X.; Luo, Y.; Wu, J. Decoupling relationship between urbanization and carbon sequestration in the Pearl River Delta from 2000 to 2020. Remote Sens. 2023, 14, 526. [Google Scholar] [CrossRef]
  34. Zhang, D.; Geng, X.; Chen, W.; Fang, L.; Yao, R.; Wang, X.; Zhou, X. Inconsistency of global vegetation dynamics driven by climate change: Evidences from spatial regression. Remote Sens. 2021, 13, 3442. [Google Scholar] [CrossRef]
  35. Cox, P.M.; Pearson, D.; Booth, B.B.; Friedlingstein, P.; Huntingford, C.; Jones, C.D.; Luke, C.M. Sensitivity of tropical carbon to climate change constrained by carbon dioxide variability. Nature 2013, 494, 341–344. [Google Scholar] [CrossRef] [PubMed]
  36. Erb, K.; Kastner, T.; Plutzar, C.; Bais, A.L.S.; Carvalhais, N.; Fetzel, T.; Gingrich, S.; Haberl, H.; Lauk, C.; Niedertscheider, M.; et al. Unexpectedly large impact of forest management and grazing on global vegetation biomass. Nature 2018, 553, 73–76. [Google Scholar] [CrossRef] [PubMed]
  37. Gao, W.; Zheng, C.; Liu, X.; Lu, Y.; Chen, Y.; Wei, Y.; Ma, Y. NDVI-based vegetation dynamics and their responses to climate change and human activities from 1982 to 2020: A case study in the Mu Us Sandy Land, China. Ecol. Indic. 2022, 137, 108745. [Google Scholar] [CrossRef]
  38. Chen, Y.; Wang, J.; Xiong, N.; Sun, L.; Xu, J. Impacts of land use changes on Net Primary Productivity in urban agglomerations under multi-scenarios simulation. Remote Sens. 2022, 14, 1755. [Google Scholar] [CrossRef]
  39. Mann, H.B. Nonparametric tests against trend. Econometrica 1945, 13, 245–259. [Google Scholar] [CrossRef]
  40. Fang, H.; Liang, S. A hybrid inversion method for mapping leaf area index from MODIS data: Experiments and application to broadleaf and needleleaf canopies. Remote Sens. Environ. 2005, 94, 405–424. [Google Scholar] [CrossRef]
  41. Pan, N.; Wang, S.; Wei, F.; Shen, M.; Fu, B. Inconsistent changes in NPP and LAI determined from the parabolic LAI versus NPP relationship. Ecol. Indic. 2021, 131, 108134. [Google Scholar] [CrossRef]
  42. Wang, S.; Fu, B.; Wei, F.; Piao, S.; Maestre, F.T.; Wang, L.; Jiao, W.; Liu, Y.; Li, Y.; Li, C.; et al. Drylands contribute disproportionately to observed global productivity increases. Sci. Bull. 2023, 68, 224–232. [Google Scholar] [CrossRef] [PubMed]
  43. Yu, Y.; Hua, T.; Chen, L.; Zhang, Z.; Pereira, P. Divergent changes in vegetation greenness, productivity, and rainfall use efficiency are characteristic of ecological restoration towards high-quality development in the Yellow River Basin, China. Engineering 2024, 34, 111–121. [Google Scholar] [CrossRef]
  44. Paolini, L.; Araoz, E.; Gioia, A.; Powell, P.A. Vegetation productivity trends in response to urban dynamics. Urban For. Urban Green. 2016, 17, 211–216. [Google Scholar] [CrossRef]
  45. Diao, C.; Liu, Y.; Zhao, L.; Zhuo, G.; Zhang, Y. Regional-scale vegetation-climate interactions on the qinghai-tibet plateau. Ecol. Inform. 2021, 65, 101413. [Google Scholar] [CrossRef]
  46. Beigait, R.; Tang, H.; Bryn, A.; Skarpaas, O.; Stordal, F.; Bjerke, J.W.; Zliobaite, I. Identifying climate thresholds for dominant natural vegetation types at the global scale using machine learning: Average climate versus extremes. Glob. Chang. Biol. 2022, 28, 3557–3579. [Google Scholar] [CrossRef]
  47. Hu, Z.; Piao, S.; Knapp, A.K.; Wang, X.; Peng, S.; Yuan, W.; Running, S.; Mao, J.; Shi, X.; Ciais, P.; et al. Decoupling of greenness and gross primary productivity as aridity decreases. Remote Sens. Environ. 2022, 279, 113120. [Google Scholar] [CrossRef]
  48. Lindroth, A.; Lagergren, F.; Aurela, M.; Bjarnadottir, B.; Christensen, T.; Dellwik, E.; Grelle, A.; Ibrom, A.; Johansson, T.; Lankreijer, H.; et al. Leaf area index is the principal scaling parameter for both gross photosynthesis and ecosystem respiration of northern deciduous and coniferous forests. Tellus B Chem. Phys. Meteorol. 2008, 60, 129–142. [Google Scholar] [CrossRef]
  49. Forkel, M.; Carvalhais, N.; Rodenbeck, C.; Keeling, R.; Heimann, M.; Thonicke, K.; Zaehle, S.; Reichstein, M. Enhanced seasonal CO2 exchange caused by amplified plant productivity in northern ecosystems. Science 2016, 351, 696–699. [Google Scholar] [CrossRef] [PubMed]
  50. Konings, A.G.; Williams, A.P.; Gentine, P. Sensitivity of grassland productivity to aridity controlled by stomatal and xylem regulation. Nat. Geosci. 2017, 10, 284–288. [Google Scholar] [CrossRef]
  51. Shi, H.; Li, L.; Eamus, D.; Huete, A.; Cleverly, J.; Tian, X.; Yu, Q.; Wang, S.; Montagnani, L.; Magliulo, V.; et al. Assessing the ability of MODIS EVI to estimate terrestrial ecosystem gross primary production of multiple land cover types. Ecol. Indic. 2017, 72, 153–164. [Google Scholar] [CrossRef]
  52. Zhou, D.; Zhang, L.; Hao, L.; Sun, G.; Xiao, J.; Li, X. Large discrepancies among remote sensing indices for characterizing vegetation growth dynamics in nepal. Agric. For. Meteorol. 2023, 339, 109546. [Google Scholar] [CrossRef]
  53. Li, F.; Peng, Y.; Zhang, D.; Yang, G.; Fang, K.; Wang, G.; Wang, J.; Yu, J.; Zhou, G.; Yang, Y. Leaf area rather than photosynthetic rate determines the response of ecosystem productivity to experimental warming in an alpine steppe. J. Geophys. Res. Biogeosci. 2019, 124, 2277–2287. [Google Scholar] [CrossRef]
  54. Huang, B.; Li, Z.; Dong, C.; Zhu, Z.; Zeng, H. Effects of urbanization on vegetation conditions in coastal zone of china. Prog. Phys. Geogr. Earth Environ. 2021, 45, 564–579. [Google Scholar] [CrossRef]
  55. Hu, T.; Dong, J.; Hu, Y.; Qiu, S.; Yang, Z.; Zhao, Y.; Cheng, X.; Peng, J. Stage response of vegetation dynamics to urbanization in megacities: A case study of Changsha City, China. Sci. Total Environ. 2023, 858, 159659. [Google Scholar] [CrossRef] [PubMed]
  56. Li, L.; Wang, Y.P.; Beringer, J.; Shi, H.; Cleverly, J.; Cheng, L.; Eamus, D.; Huete, A.; Hutley, L.; Lu, X.; et al. Responses of LAI to rainfall explain contrasting sensitivities to carbon uptake between forest and non-forest ecosystems in Australia. Sci. Rep. 2017, 7, 11720. [Google Scholar] [CrossRef] [PubMed]
  57. Knapp, A.K.; Ciais, P.; Smith, M.D. Reconciling inconsistencies in precipitation-productivity relationships: Implications for climate change. New Phytol. 2016, 214, 41–47. [Google Scholar] [CrossRef]
  58. Sarmah, S.; Singha, M.; Wang, J.; Dong, J.; Burman, P.K.D.; Goswami, S.; Ge, Y.; Ilyas, S.; Niu, S. Mismatches between vegetation greening and primary productivity trends in South Asia—A satellite evidence. Int. J. Appl. Earth Obs. Geoinf. 2021, 104, 102561. [Google Scholar] [CrossRef]
Figure 1. Study area and its land cover types in 2020.
Sustainability 16 05900 g001
Figure 2. Dynamics of vegetation greenness from 2001 to 2020.
Sustainability 16 05900 g002
Figure 3. Dynamics of vegetation productivity from 2001 to 2020.
Sustainability 16 05900 g003
Figure 4. Inconsistency between vegetation greenness and productivity from 2001 to 2020 (an upward arrow refers to a significant rise, a downward arrow refers to a significant decline, and a horizontal line indicates an insignificant change).
Sustainability 16 05900 g004
Figure 5. The impact of land use change on vegetation greenness and productivity.
Sustainability 16 05900 g005
Figure 6. Dynamics of rainfall, solar radiation, and temperature from 2001 to 2020.
Sustainability 16 05900 g006
Figure 7. The impact of climatic factors on vegetation greenness and productivity.
Sustainability 16 05900 g007
Table 1. Data sources.
DataSpatial ResolutionPeriodSourcesCollected Date
LAI 500 m2001–2020https://lpdaac.usgs.gov/products/mod15a2hv006/23 May 2023
GPP500 m2001–2020https://lpdaac.usgs.gov/products/mod17a2hv006/23 May 2023
Land use/cover500 m2001–2020https://modis.gsfc.nasa.gov/data/dataprod/mod12.php23 May 2023
Climatic data1000 m2001–2020http://www.resdc.cn24 June 2023
Administrative boundary-2020http://www.dsac.cn/18 May 2023
Disclaimer/Publisher’s Note: The statements, opinions and data contained in all publications are solely those of the individual author(s) and contributor(s) and not of MDPI and/or the editor(s). MDPI and/or the editor(s) disclaim responsibility for any injury to people or property resulting from any ideas, methods, instructions or products referred to in the content.

