Abstract
Nowadays, navigation systems are widely used in public travel because they can instantly offer GPS-based route directions. Following the navigation prompt messages while driving is considered a secondary driving task, while vehicle control is regarded as a primary driving task. Navigation prompt messages with more information can deliver more cues to drivers, but they require a higher cognitive demand and vice versa. To systematically explore the effects of the amount of information from navigation voice prompts and further quantify the utility of voice prompts, four types of prompt messages with increasing amounts of information, denoted as a Single Message, Double Message, Triple Message, and Quadruple Message, were designed. A driving simulation experiment was conducted to obtain driving behavior data under different prompt messages. The one-way analysis of variance (ANOVA) and Kruskal–Wallis (KW) test were used to examine the differences in driving performance under the guidance of different prompt messages from multiple perspectives. Then, eight indicators were selected based on the functions of the navigation system and the driver’s response, and the grey near-optimal method was used to determine the utility of the four types of prompt messages. This study found that the four types of navigation prompt messages all began to take effect at about 200 m upstream of the stop bar. The differences between the four types of prompt messages were more significant in the zone from 100 m upstream and ended at 100 m downstream of the stop bar of the intersection. Drivers using Single and Double Messages exhibited more powerful deceleration than those using Triple and Quadruple Messages. The utility values of the four types of prompt messages increased with the increase in the amount of information. This study provides theoretical support for optimizing navigation information and lays a foundation for establishing navigation broadcast guidelines.
1. Introduction
Nowadays, navigation systems have become an important driving assistant tool by instantly offering GPS-based route directions and are widely used in public travel (Yared et al., 2020; Zhong et al., 2022) [1,2]. The Geographic Information Industry Association in China released the latest data indicating that the average daily number of location service requests for Internet maps was up to 130 billion times and covered more than one billion users every day (GIIA, 2022) [3]. The benefits of navigation systems to drivers are obvious, such as saving travel time and avoiding traffic congestion (Chen and Chen 2011) [4]. However, navigation systems can also have negative impacts on drivers. For example, a study found that both visual and auditory tasks made subjects exhibit a late response time in unexpected situations (Jamson and Merat 2005) [5]. Another study found that drivers’ attention to the road environment significantly reduced when using navigation systems (Yuan et al., 2011) [6]. Through these studies, it can be seen that the service provided by navigation systems for drivers should be treated dialectically. Actually, navigation systems, as a medium to convey information to drivers, and their output modes are directly related to drivers’ reception of navigation information; thus, scholars have carried out a series of studies on the output modes.
At present, three common modes to output navigation information exist: only audio, only visual, and audio–visual—with a number of differences between the three modes. Thus, some studies have aimed to compare the differences in behaviors and performance under different information output modes. A study indicated that compared with the only visual mode, adding audio decreased the number of eye glances, but driving performance showed no significant differences (Jensen et al., 2010) [7]. Another study also showed that audio–visual information can reduce drivers’ workload in comparison with only visual output (Zhu et al., 2015) [8]. Hu (2017) [9] found that audio-visual information had the least effect on driving performance and vehicle operation. In addition, there are also some studies dedicated to exploring the effects of navigation information presentation forms and driving situations. For example, Yun et al. (2017) [10] explored how in-vehicle navigation information impacts lane-changing behavior at urban expressway diverge segments in consideration of variation of the first provision time point and traffic flow density. The results indicated that in-vehicle navigation information had a significant positive impact on lane-changing safety under medium- to high-density conditions. Yared et al. (2023) [11] investigated the impact of navigation systems on driver distraction and visual search under various driving conditions, and the result showed that small GPS displays caused greater distraction in terms of average and total gaze duration. Additionally, distraction increased during daytime driving conditions. These studies further revealed the importance of the presentation forms of audio and visual information under different driving situations, providing a reference for the optimization of navigation information output modes.
The above studies indicated that the behaviors and performance of drivers were influenced by the output modes and presentation forms, which may be attributed to the fact that the processing of navigation information and driving jointly occupy drivers’ cognitive resources. Driving a vehicle is a complex task that requires drivers to use operational ability, cognitive ability, and executive functions comprehensively (Xu 2006) [12]. Using navigation systems while driving is equivalent to adding an additional task to the main driving task; these two tasks occupy the limited cognitive resources of a driver together. However, Wickens (2002) [13] proposed that each sensory modality has its own pool of dedicated processing resources. According to this view, because driving imposes demands that are primarily visual and manual, it might seem plausible to assume that additional auditory information can be processed to some extent without significant cost (Dalton et al., 2013) [14]. Some studies also confirmed that voice navigation information was easier to process and respond to than visual navigation information (Moldenhauer and McCrickard 2003; Large and Burnett, 2014) [15,16]. However, another study pointed out that voice navigation information still exerts cognitive demands, although it is relatively easy, and the level of cognitive demand depends on the exact complexity of the voice navigation instructions (Dalton et al., 2013) [14]. Actually, the more complex the navigation voice information is and the more information it contains, the more cognitive resources are occupied by its processing. According to cognitive resource theory (Tversky and Kahneman 1973) [17], fewer cognitive resources will be allocated to the main driving task if the voice navigation information occupies more cognitive resources, which may have negative impacts on driving safety. Thus, it is necessary to explore the effects of the amount of information from navigation voice guidance on driving performance to identify the amount of navigation voice information meeting the needs of drivers.
At present, some studies have been conducted on the amount of information from navigation voice guidance. For example, Dalton et al. (2013) [14] compared driving behavior and performance when guided by simple and complex instructions and found that drivers missed more hazardous pedestrians and had larger speed and steering waivers using the complex instructions than when using simple instructions. Wu et al. (2009) [18] compared driving correctness using simple and complicated voice prompts on different types of roads, and the results showed that drivers had lower driving correctness using the complicated voice prompt than when using the simple one at expressways and major roads. However, it should be noted that the voice guidance in existing studies mainly involved two instruction types: direction and road. In China, distance and lane prompt instructions are also common in the voice guidance information of intersections in addition to direction and road instructions. Previous studies having not involved these two information types make us lack a clear understanding of the effectiveness of voice guidance information including distance and lane instructions, which may lead to an increase in the possibility that inappropriate navigation voice guidance information is used. Thus, this study proposes four types of prompt messages with different amounts of information based on the four information types that are often involved in navigation voice guidance information at intersections in China (distance, direction, road, and lane instructions) to systematically explore the effects of the amount of information from navigation voice prompts on driving performance and to further quantify the utility of voice prompts.
The following work has been carried out to achieve the research objective. Firstly, a driving simulation experiment was designed to collect driving behavior data guided by the four types of prompt messages. Next, the effects of the amount of information from the navigation voice prompts on driving performance were analyzed from multiple perspectives. Finally, according to the driving performance, eight evaluation indicators were selected based on navigation functionality (driving efficiency and safety) and driver response performance (response smoothness and consistency), and the grey near-optimal method was used to determine the utility of the four types of prompt messages, achieving a quantitative evaluation of the utility of navigation voice information.
2. Methods
2.1. Participants
The sample size directly affects the validity of data analysis results; thus, the minimum sample size required for this study was calculated based on the power analysis (Lerman, 1996; Chow et al., 2017) [19,20]. The calculation formula is as follows:
where is the upper ()th quantile of the standard normal distribution, is the upper ()th quantile of the standard normal distribution, and is the meaningful difference.
Typically, a 10% level of significance is chosen to reflect 90% confidence regarding the unknown parameter. A power of 80% and a meaningful difference of 0.5 were used to balance the power and cost-effectiveness. Based on these selected parameters, the value of was calculated as 25.
Thirty-seven participants aged between 21 and 57 years (M = 37.76, SD = 11.89) were recruited from those participants who had no motion sickness symptoms in our previous driving simulation experiments. The sample size in this study met the requirement of the minimum sample size. Among these participants, 25 were male and 12 were female. The ratio of male to female subjects is close to that of licensed drivers in China. All participants held valid driving licenses, and their driving experience ranged from 2 to 35 years (M = 13.53, SD = 9.40). All participants had normal vision or vision corrected to normal with contact lenses. The main reason for selecting participants with such vision was that they could wear the glass-type eye tracker. During the pre-driving orientation and formal test, these participants had no motion sickness symptoms (such as nausea and dizziness). Written and signed informed consent was obtained from all participants. The study was approved by the Ethics Committee of Science and Technology, Beijing University of Technology, and conformed with the Helsinki Declaration.
2.2. Apparatus
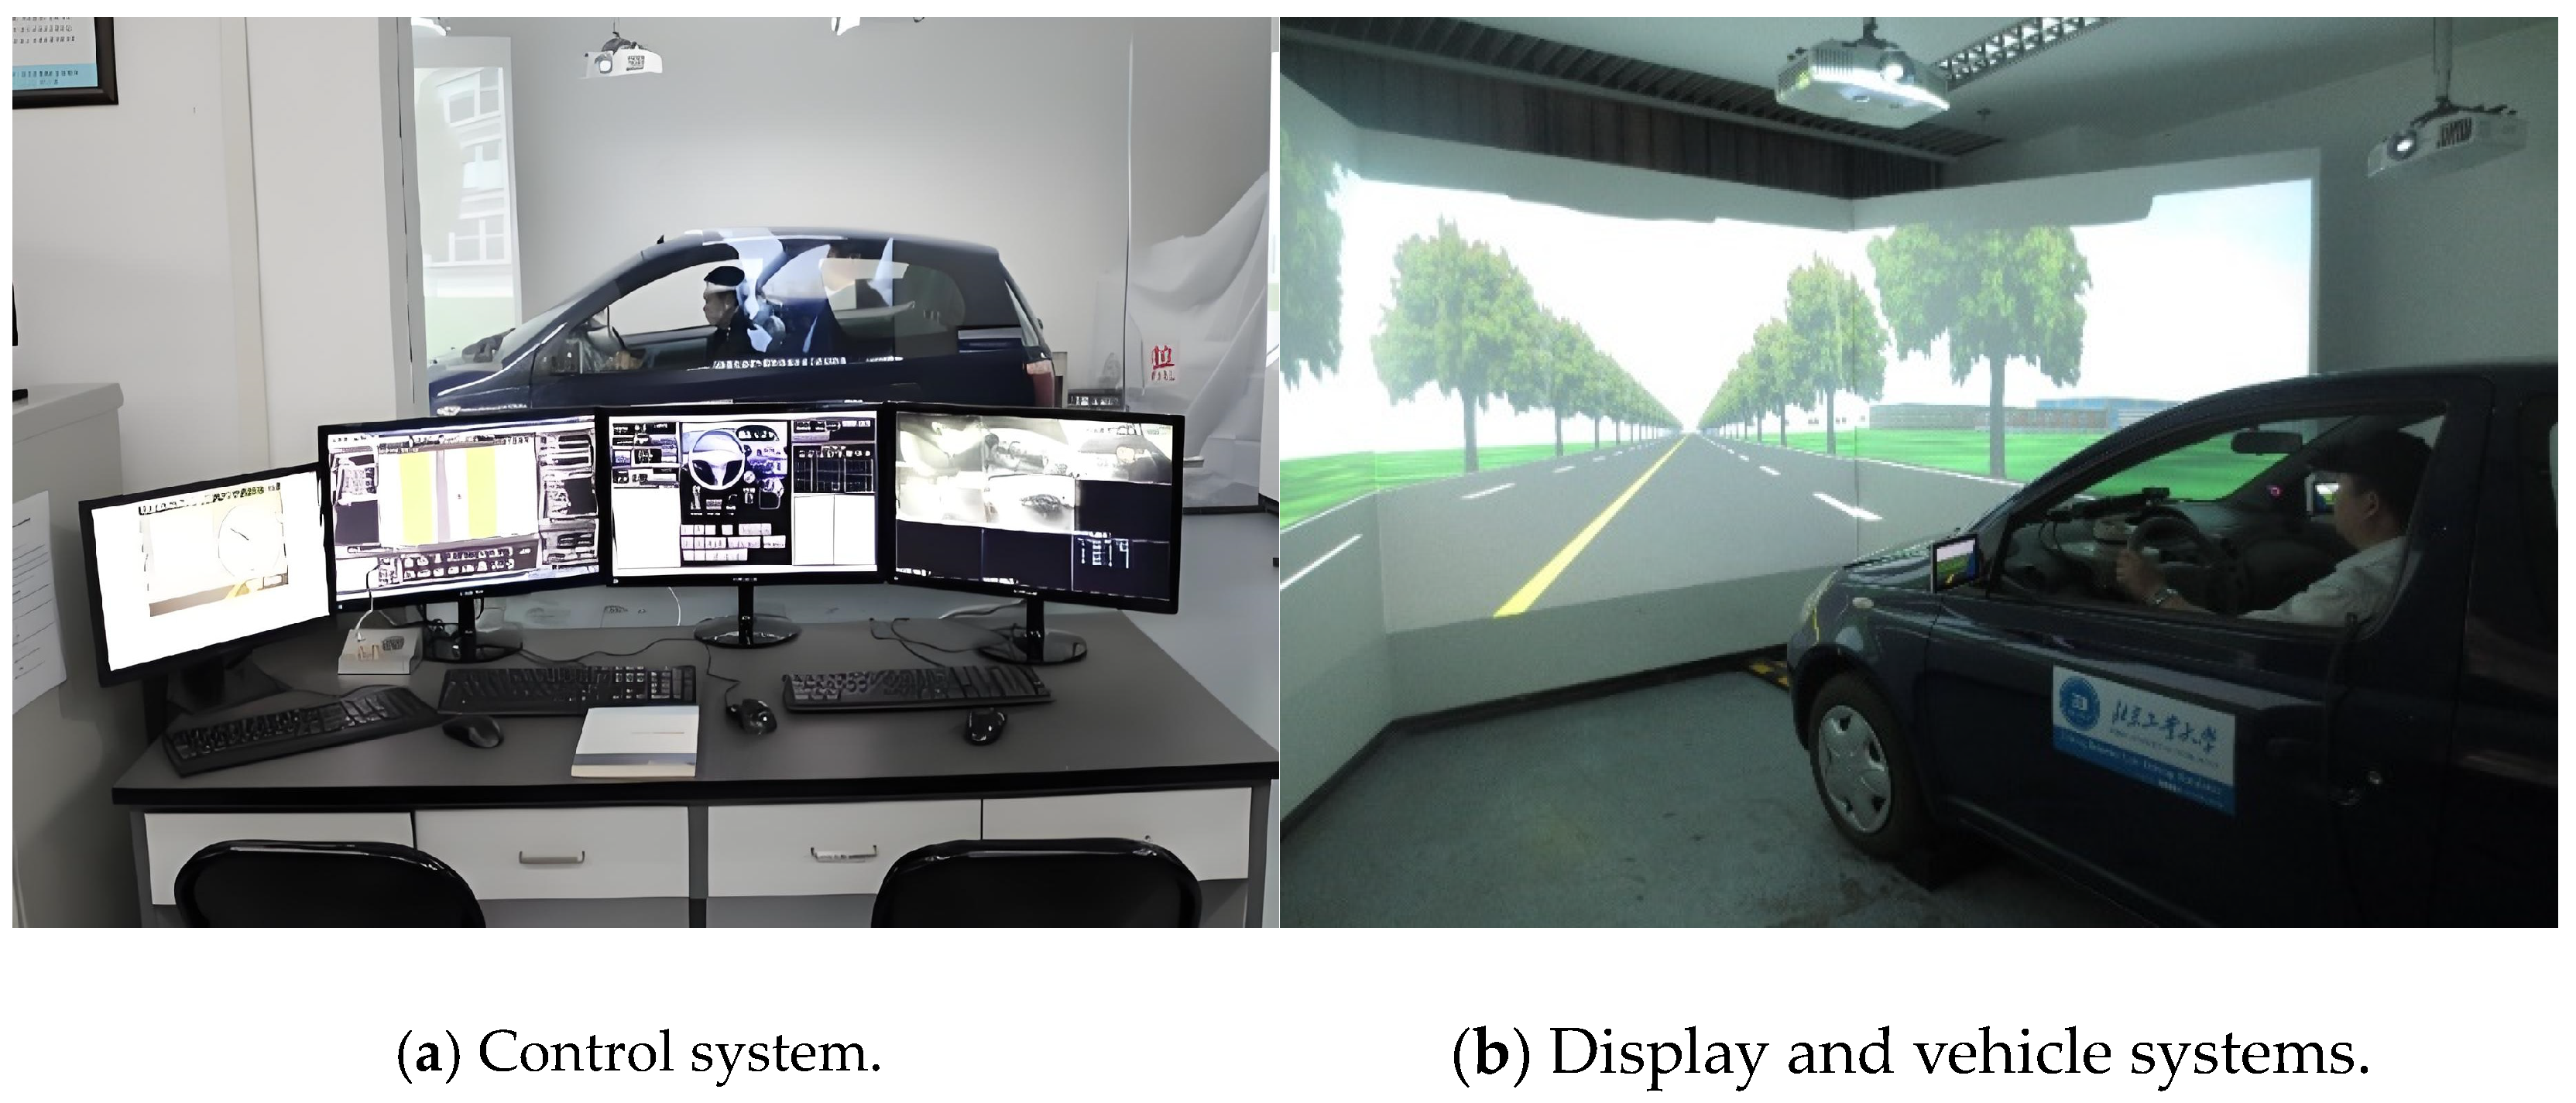
A fixed-base driving simulator was used in the current research (as shown in Figure 1), and the vehicle operating data (such as speed and acceleration) and driver maneuver data (such as gears, clutch, accelerator, and brake) were collected. The data acquisition frequency of the driving simulator was 30 Hz. The road scenario was projected onto three big screens, giving the driver a 130° wide-angle field of view. Moreover, the validity of this simulator in studying driver behavior has been established in previous research (Zhao et al., 2011; Ding et al., 2013; Zhao et al., 2013) [21,22,23]. Until now, 500 drivers who participated in driving simulation studies evaluated this driving simulator through questionnaires. The average score for the reality of the driving simulator, experiment scenarios, and guidance information was approximately 9 (1 denotes not real and 10 means very real). Hence, it was feasible to conduct the effectiveness evaluations and optimizations of navigation voice information based on this driving simulator platform.
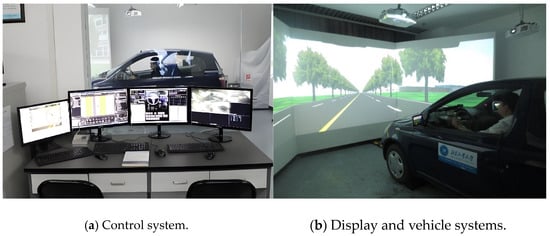
Figure 1.
The driving simulator used in this study.
2.3. Experimental Design
A typical intersection was taken as an example to carry out the experiment and exclude the potential impacts of road types. Generally, the prompt message of one typical intersection was a set of three sequential messages broadcast by the navigation unit. Four types of prompt messages were designed based on the number of instruction types contained in the first two sequential messages; they were denoted as a Single Message, Double Message, Triple Message, and Quadruple Message. Specifically, a Single Message included a direction instruction (e.g., turn XX at the traffic light), a Double Message included direction + road instructions (e.g., turn XX at the traffic light, enter XX road), a Triple Message included distance + direction + road instructions (e.g., turn XX at the traffic light XX ahead, enter XX road), and a Quadruple Message included distance + direction + road + lane instructions (e.g., turn XX at the traffic light XX ahead, enter XX road, take the XX lane). The detailed contents and playback duration of the four types of prompt messages are shown in Table 1. From the Single Message to the Quadruple Message, the amount of information from the navigation voice guidance increased, and this factor was set as a within-subjects factor.

Table 1.
The detailed contents and playback duration of four types of prompt messages.
To better explore the effects of the amount of information from navigation voice guidance, the study ensured that the broadcast completion positions of the same sequential message of the four types of prompt messages were the same, and the completion positions of the three sequential messages were 500, 100, and 0 m upstream of the stop bar, respectively. The settings of the broadcast completion positions were consistent with those of the advance guide signs. The broadcast start positions depended on the amount of information from the navigation voice guidance contained in the prompt message; the greater the amount of information from the navigation voice guidance was, the further the starting broadcast position was from the stop bar.
2.4. Driving Scenario Design
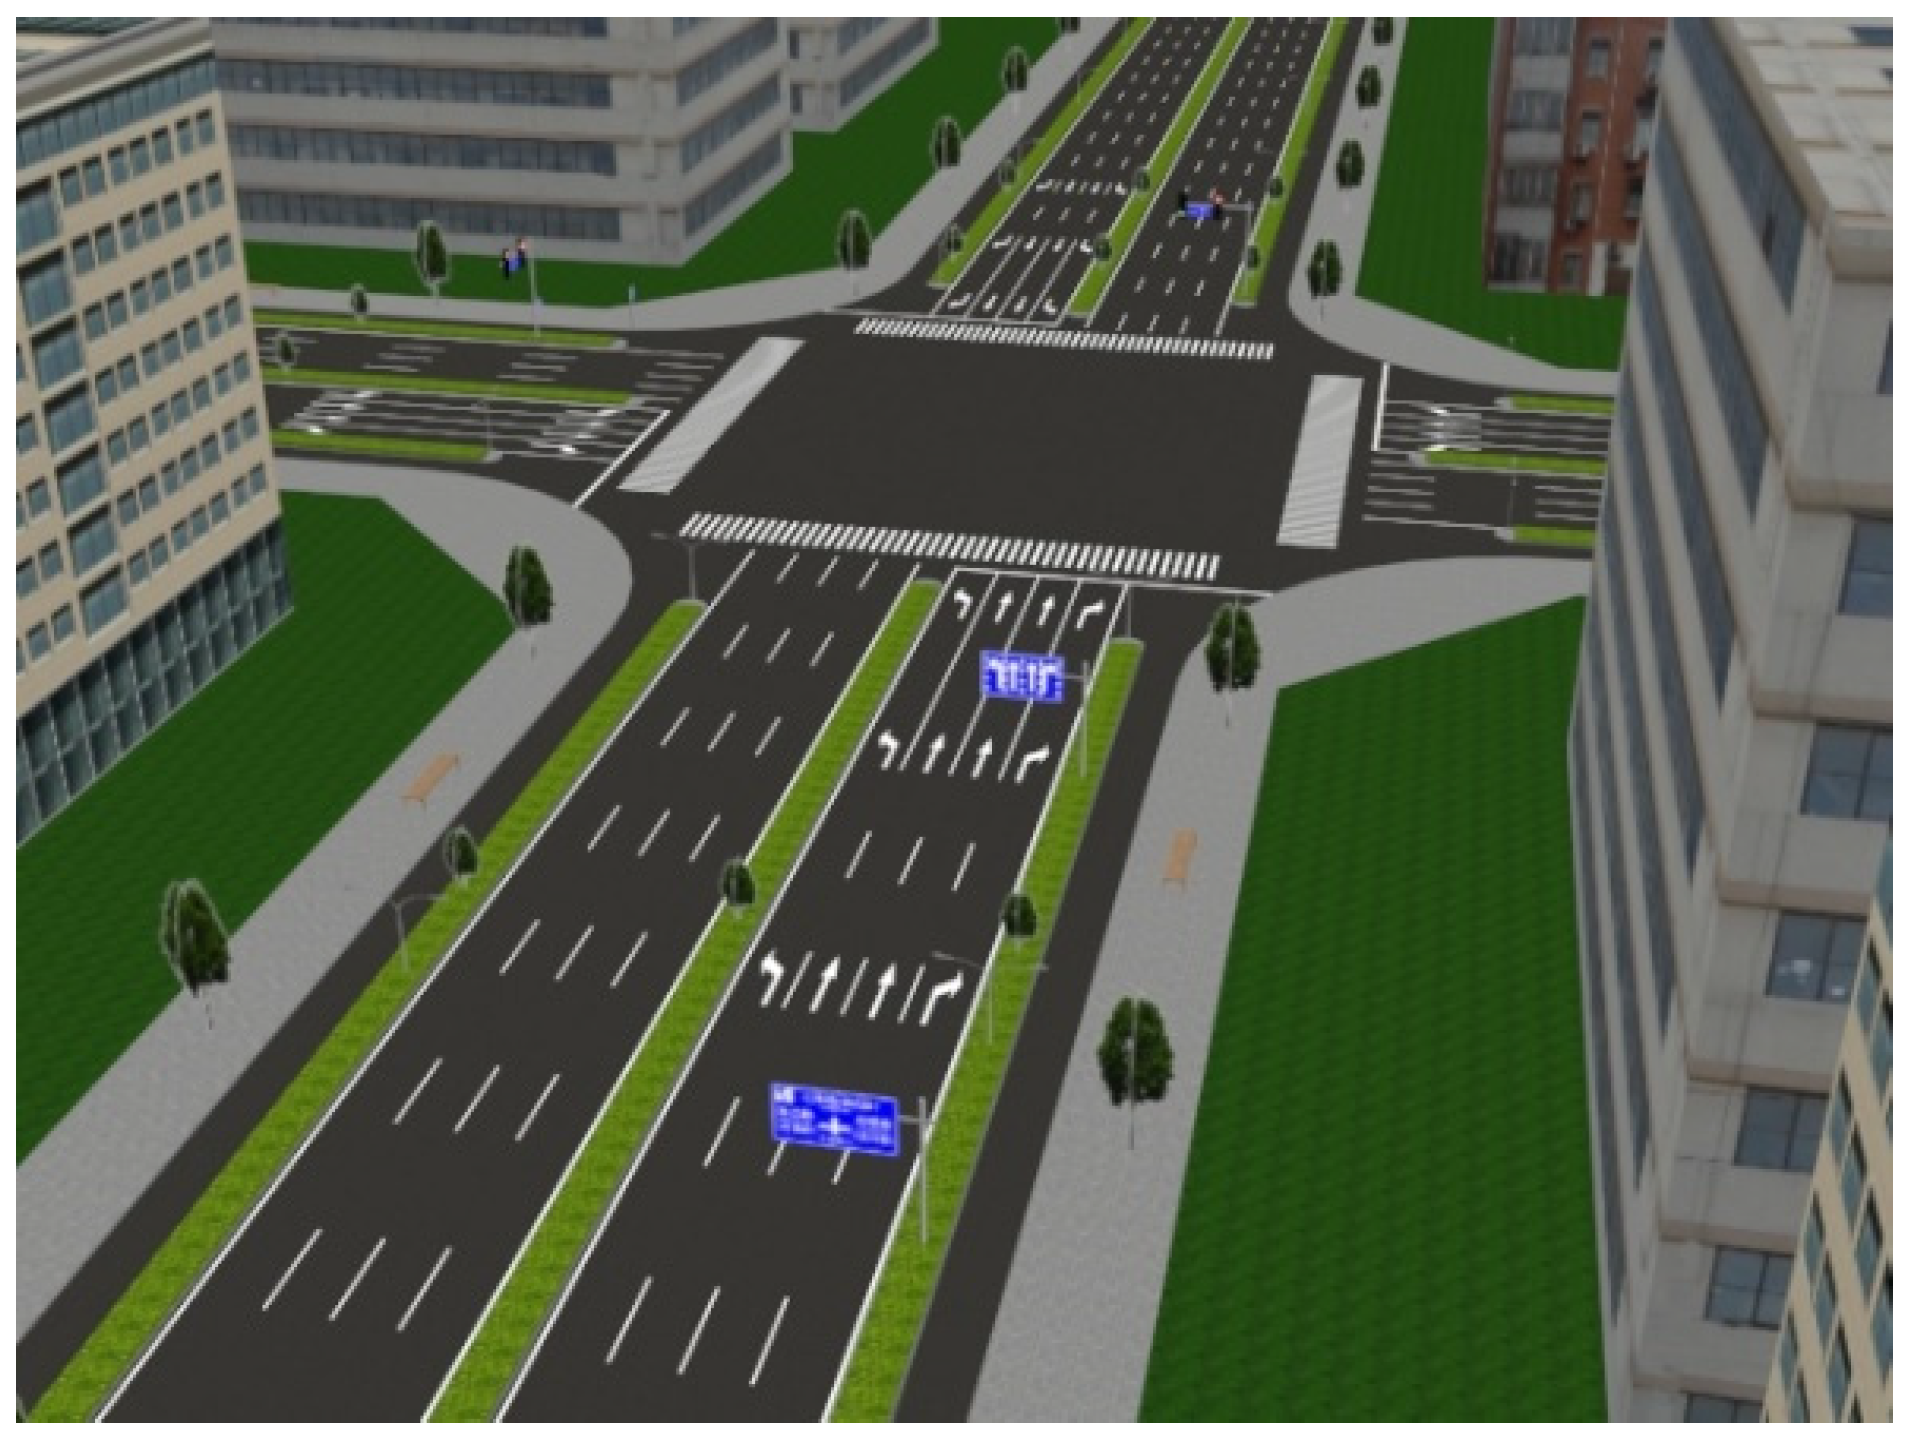
The four types of prompt messages corresponded to four experimental intersections with the same design parameters. The 3D scene of the experimental intersection is shown in Figure 2. The signal lights at the four experimental intersections were all green. The four intersections mentioned above were randomly assigned to four routes. The length of each route was about 10 km, and each route contained 10 intersections. In addition to the experimental intersections used in this study, the remaining intersections were intended to conduct other studies. All participants drove the four routes in a randomized sequence to counterbalance the possible effects of learning or fatigue. The road type was an arterial road with eight two-way lanes, the motorway width was 3.5 m, and the speed limit was 60 km/h. The experimental environment was set to free traffic flow, aiming to avoid the interference of other vehicles to the decision-making and behaviors of the subject vehicle drivers. The free flow was set based on the traffic density, i.e., the number of vehicles per kilometer. A study on the traffic flow of urban arterial roads found that the traffic flow was free flow when the traffic density was less than 25 vehicles/km (Wang et al., 2008) [24]. According to this criterion, combining vehicle speed and visual distance, a maximum of 5 vehicles were kept every kilometer, and a total of 25 vehicles were placed on the experimental route. The vehicle spacing was kept at 200 m at least.
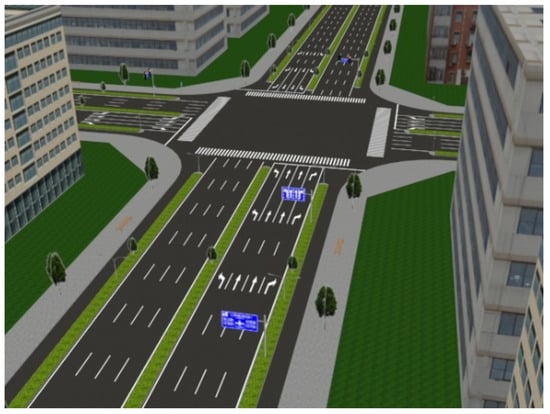
Figure 2.
The 3D scene of the experimental intersection.
The traffic signs and markings in the experiment scenarios were established based on the Chinese national standard GB5768-2009 (AQSIQ and SA 2019) [25]. The designed prompt messages were produced by navigation companies, and their broadcast speed and broadcast style were the same as those used in reality. The prompt messages were imported into the driving simulation platform through interface functions, and they were controlled by trigger functions. Drivers were required to pass through the intersection according to the navigation instructions when approaching the intersection. It should be noted that the driving direction of the subject vehicle was set as a right turn at the four experimental intersections of this study to exclude the effects of turning on the experimental results.
2.5. Procedure
The main process of the experiment was as follows.
First, participants were asked to fill in the basic personal information form.
Secondly, a five-minute pre-driving orientation was conducted to familiarize participants with the operation of the steering wheel, accelerator, and brake pedal. Only those participants with no symptoms of discomfort (such as nausea and dizziness) were allowed to carry out the follow-up formal test.
Thirdly, participants drove four routes in a randomized sequence to counterbalance the possible effects of learning or fatigue. Participants were informed of road types, road speed limit, driving lane, and destinations before the beginning of each experimental route; then, they were asked to drive to the destination according to road traffic signs and navigation prompt messages. Each route needed about 10 min. The formal test was stopped immediately if the participants felt any discomfort. A five-minute break was taken after each route until four routes were completed.
Finally, participants were asked to fill in the validity questionnaire of the driving simulation platform.
2.6. Data Analysis
2.6.1. Analysis of the Effects of Navigation Prompt Messages
The differences in driving performance under the guidance of different prompt messages were analyzed from multiple perspectives to identify how the amount of information from navigation voice prompts affects driving performance. Specifically, a one-way analysis of variance (ANOVA) was used to examine the differences in driving performance over the whole zone and each subzone guided by four types of prompt messages. Additionally, a comparison was made of the rate of speed variation and rate of acceleration variation of each broadcast for the four conditions using the Kruskal–Wallis (KW) test.
- (1)
- The definitions of the whole zone and subzones
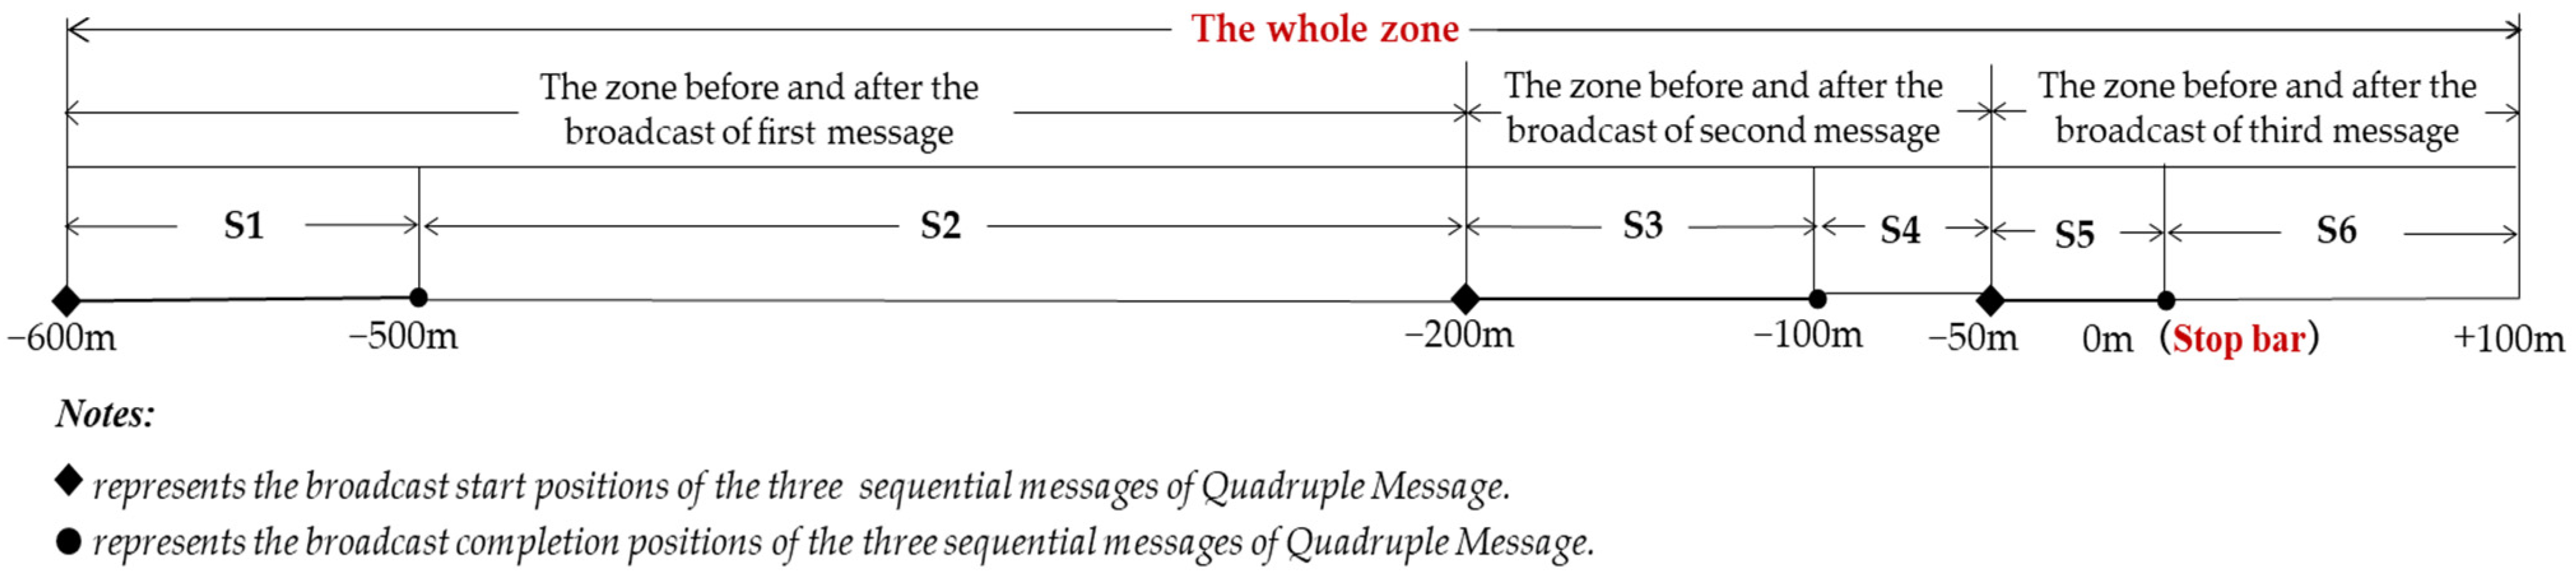
This study identified a data analysis zone of each intersection (called the whole zone), which started from 600 m upstream of the intersection stop bar and ended at 100 m past the stop bar (as shown in Figure 3). This range was selected to ensure drivers could see the first advance guide signs when entering the intersection analysis zone and then complete the turning operation when leaving the intersection analysis zone.

Figure 3.
The data analysis zone of intersections.
In addition, according to the broadcast start and broadcast completion positions of the three sequential messages of the Quadruple Message, the whole zone was divided into six subzones to analyze the driving performance in different subzones. The reason that the subzones were divided based on the Quadruple Message was because the distance between the starting and completion positions of each broadcast of the Quadruple Message was the greatest and could thus cover the distance between the starting and completion positions of other prompt messages. The range of each subzone is shown in Figure 3. The 6 subzones are labeled as S1, S2, S3, S4, S5, and S6, and they represent the First Broadcast, the First Clear Interval, the Second Broadcast, the Second Clear Interval, the Third Broadcast, and the Turning in turn.
- (2)
- The selection of measures of driving performance
- ➢
- Driving performance in the whole zone
Velocity through the whole zone: The mean of all output speeds in the whole zone for each driver (km/h).
Time through the whole zone: The total time taken by each driver to pass through the whole zone (s).
Absolute acceleration in the whole zone: The mean of absolute values of all output accelerations in the whole zone for each driver (m/s2).
Maximal deceleration in the whole zone: The maximum of all output decelerations in the whole zone for each driver (m/s2).
- ➢
- Driving performance in each subzone
Velocity at each subzone: The mean of output speeds at every subzone for each driver (km/h).
Acceleration at each subzone: The mean of output accelerations at every subzone for each driver (m/s2).
- ➢
- Driving performance before and after each broadcast
Rate of speed variation of each broadcast: The rate of speed variation in the subzone in which the current message has finished broadcasting but the following message has not started broadcasting relative to the subzone in which the current message is broadcasting for each driver.
Rate of acceleration variation of each broadcast: The rate of acceleration variation in the subzone in which the current message has finished broadcasting but the following message has not started broadcasting relative to the subzone in which the current message is broadcasting for each driver.
2.6.2. Evaluation of the Utility of Navigation Prompt Messages
Through the above measures, it is possible to preliminarily identify the driving performance in the whole zone, each subzone, and each broadcast under the effects of the four types of prompt messages, but it is not easy to quantify the utility of the four prompt messages. To evaluate the effectiveness of the four types of prompt messages comprehensively and quantitatively, eight evaluation indicators were selected based on the functions of the navigation system and the driver’s response, and the grey near-optimal method was used to determine the utility of the four types of prompt messages.
- (1)
- Evaluation indicators
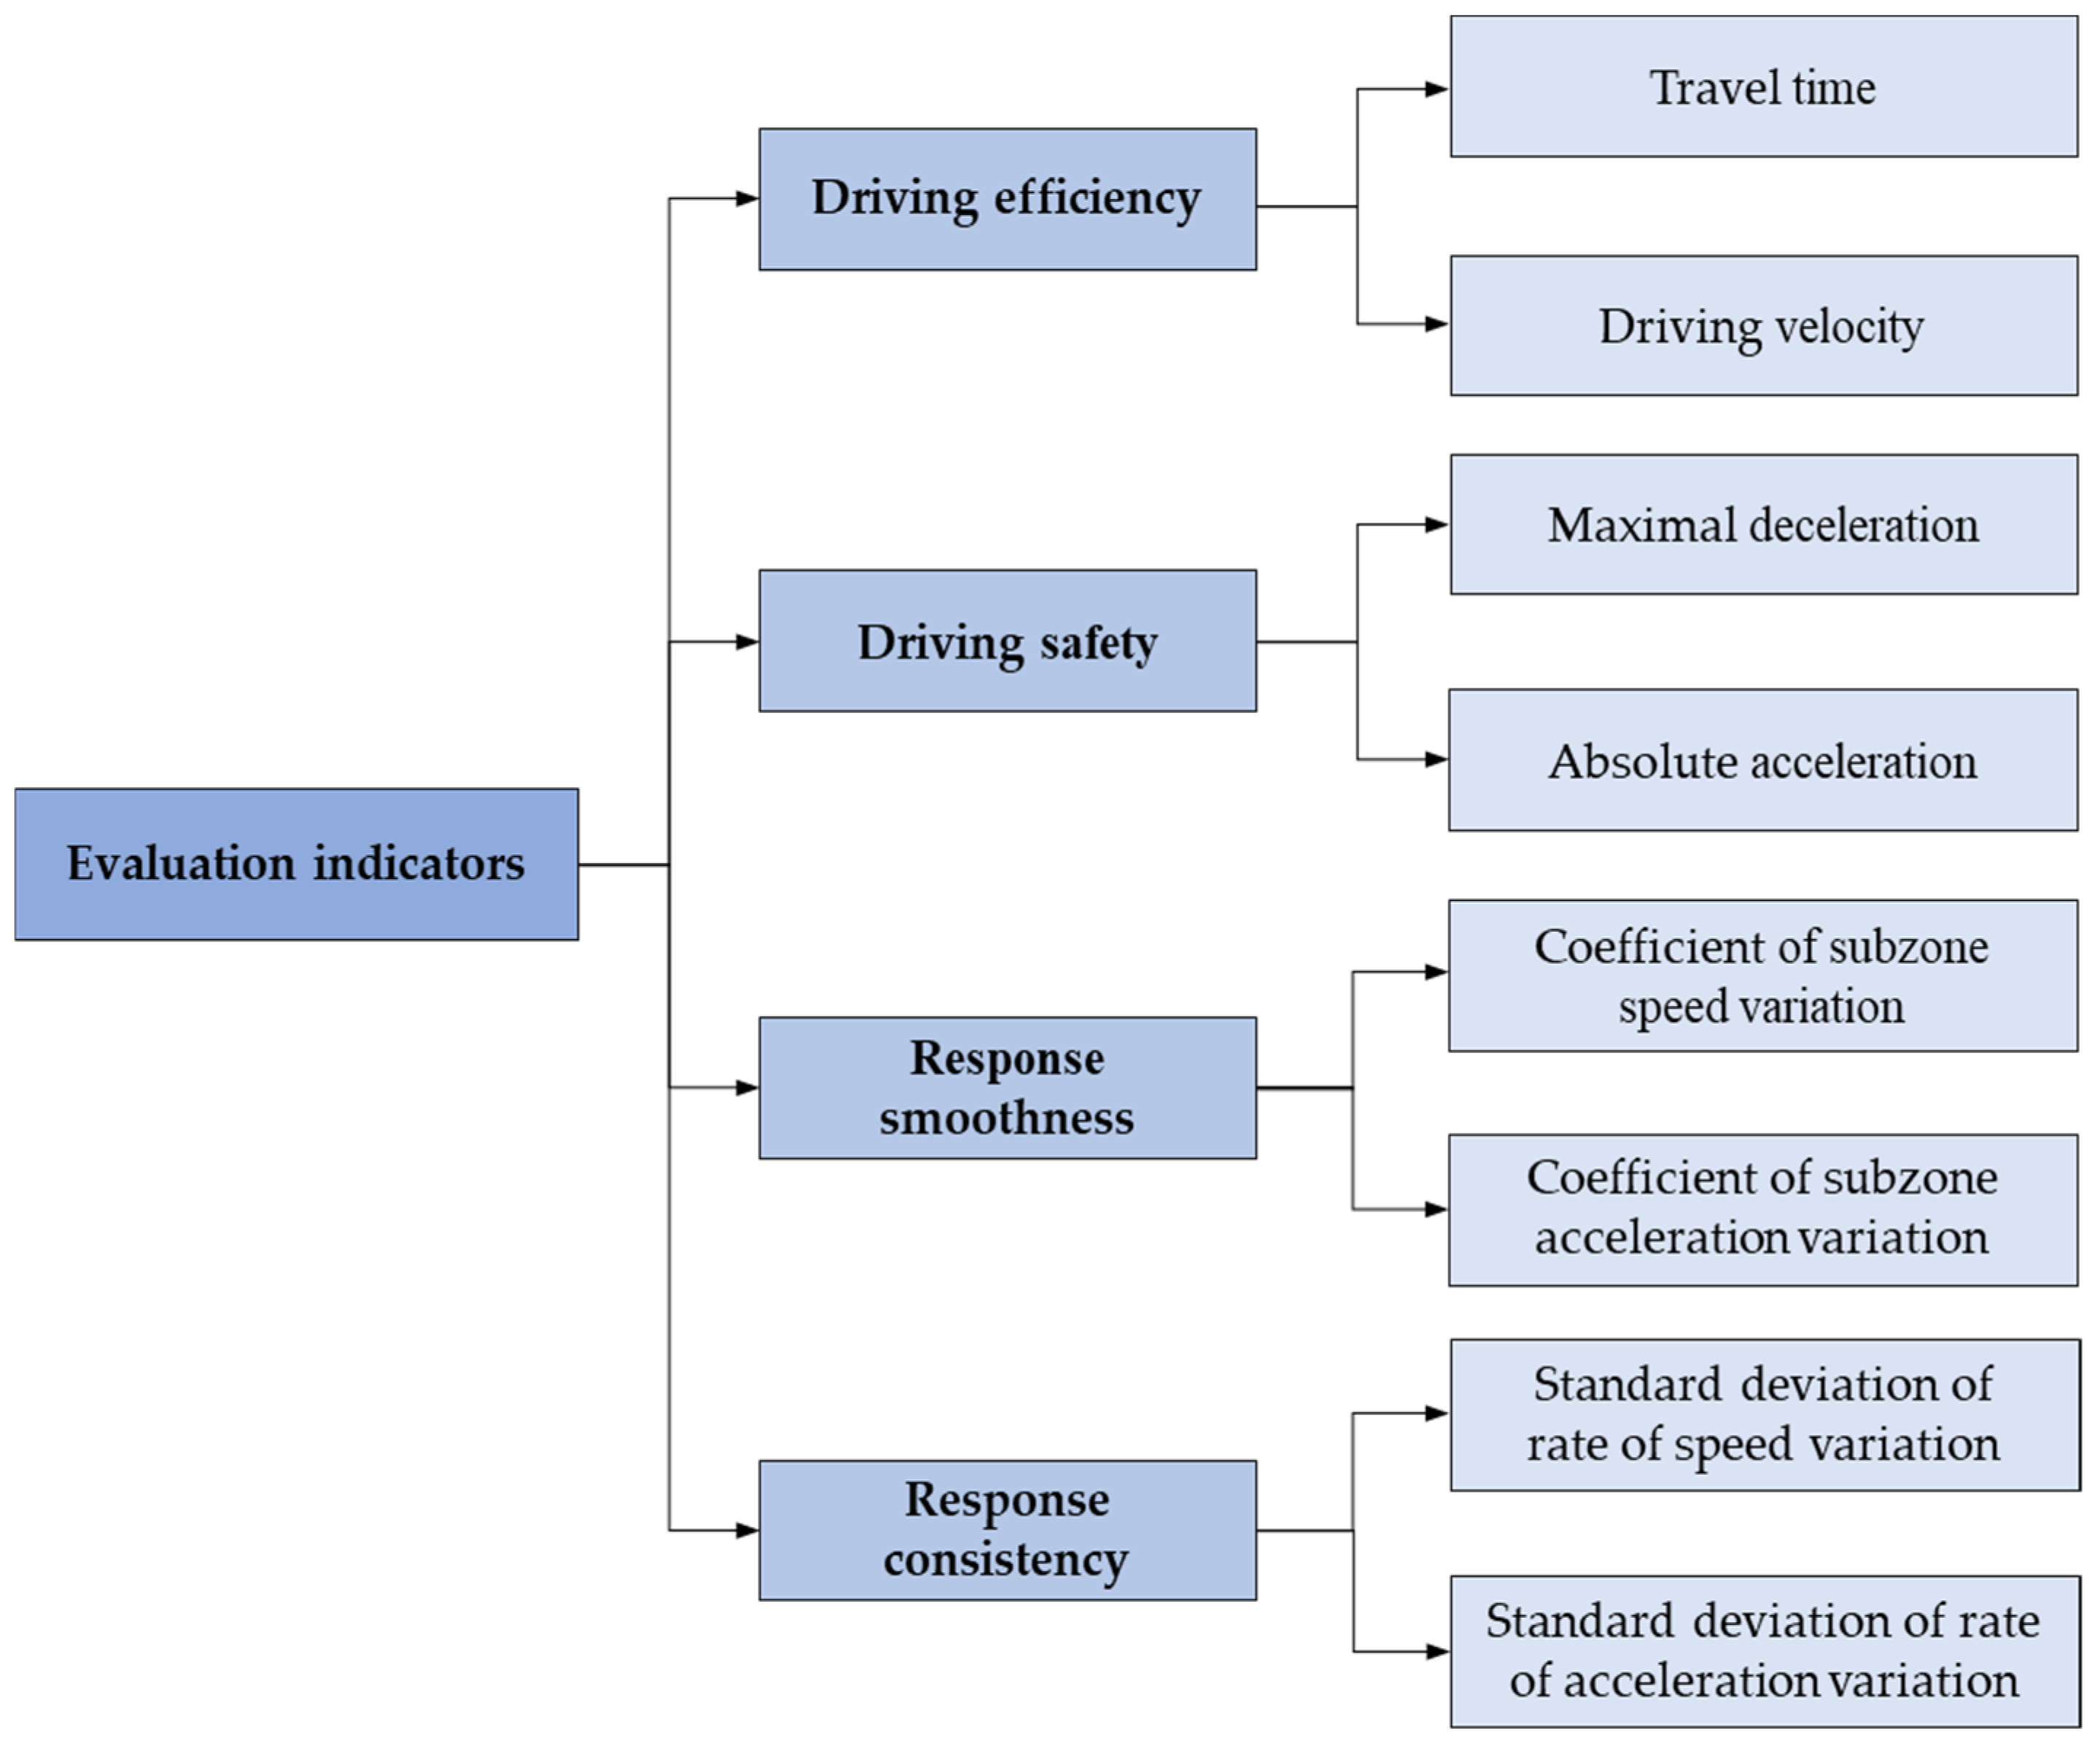
From a functional perspective, a navigation system’s purpose is to guide a driver to reach their destination quickly and safely by transmitting the road direction, location, and distance information; thus, driving efficiency and safety are two important aspects that scholars pay attention to when evaluating the effectiveness of navigation systems (Lee and Cheng 2008; Wu et al., 2009; Jeong et al., 2013) [26,27,28]. Based on this, we selected evaluation indicators from the two aspects of driving efficiency and safety. From a receptive perspective, the driver’s response to the prompt message can directly reflect whether the message is easy to understand and accept; thus, it has also attracted great attention from scholars (Liu and Wen 2004; Jahn et al., 2005; Lavie et al., 2011) [29,30,31]. Referring to these studies, response smoothness and response consistency were treated as the other two aspects of selecting indicators; the former aimed to evaluate the stability of the driver’s response to three sequential messages, and the latter aimed to evaluate the consistency of the driver’s response to the same sequential messages.
For driving efficiency, travel speed and time are common measures in existing studies on navigation systems. For example, Lee and Cheng (2008; 2010) [26,32] and Uang and Hwang (2003) [33] used trip time and driving speed to measure the driving efficiency of different navigation systems. Referring to these studies, both travel time and driving velocity were used as driving efficiency measures. For driving safety, some studies indicated that acceleration and deceleration can be used to identify potential safety hazards (Zhang et al., 2009; Yang et al., 2018) [34,35], so we used maximal deceleration and absolute acceleration as driving safety measures. As for drivers’ responses, some studies implied that they were related to their behavioral performance. For example, Nakayama et al. (1999) [36] found that response times correlated with a steering entropy measure. Another study found that the resulting pattern of percentage error of direction judgment was consistent with response time (Rizzardo and Colle 2013) [37]. Thus, this study used behavioral performance to measure their responses. For response smoothness, given that the coefficient of subzone speed and acceleration variation can reflect the smoothness of speed and acceleration variation across the six subzones under the guidance of different prompt messages, these two indicators were selected to be measured. For response consistency, the standard deviations of the rates of speed and acceleration variation were selected; they can reflect the deviation of each driver’s rate of speed and acceleration variation from the mean of all drivers’ rate of speed and acceleration variation.
The selected indicators are shown in Figure 4.
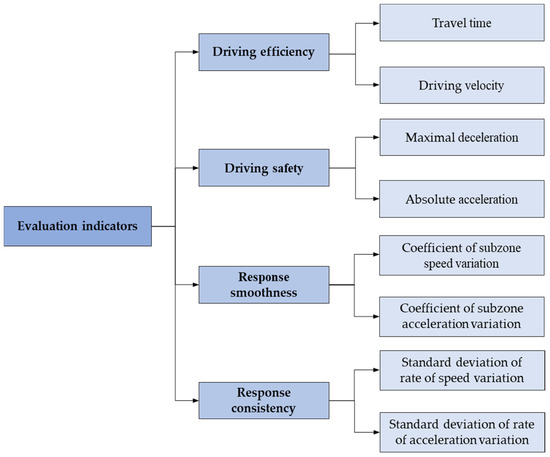
Figure 4.
The selected evaluation indicators.
The definition of each indicator is as follows.
Travel time: The mean of the time all drivers take to pass through the whole zone.
Driving velocity: The mean of the velocity at which all drivers pass through the whole zone.
Maximal deceleration: The mean of the maximal deceleration of all drivers in the whole zone.
Absolute acceleration: The mean of the absolute acceleration of all drivers passing through the whole zone.
Coefficient of subzone speed variation: The mean of the absolute values of average velocity difference between adjacent subzones.
Coefficient of subzone acceleration variation: The mean of the absolute values of average acceleration difference between adjacent subzones.
Standard deviation of the rate of speed variation: The mean of the standard deviation of the rate of speed variation of three broadcasts.
Standard deviation of the rate of acceleration variation: The mean of the standard deviation of the rate of acceleration variation of three broadcasts.
- (2)
- Evaluation method
As shown in Figure 4, in this study, there are more selected evaluation indicators, and fuzziness and randomness are among these indicators; a utility evaluation method of navigation voice prompts that matches the characteristics of the indicators was needed. The gray near-optimal method originates from grey theory and the mathematical theory of dealing with fuzzy phenomena. This method combines the advantages of qualitative and quantitative analyses and has the characteristics of small computational complexity, low sample requirements, and objective and realistic results (Zhu 2023) [38], and it is widely used in evaluation research in the field of transportation (Huang 2018; Wang 2019; Yang et al., 2020) [39,40,41]. Thus, this study used the gray near-optimal method to determine the comprehensive score of driving performance under the effects of each type of navigation voice prompt message, achieving a quantitative evaluation of the utility of navigation voice information. The steps of constructing the grey near-optimal model have been described in another study (Yang et al., 2020) [41].
3. Results
3.1. Velocity and Time through the Whole Zone
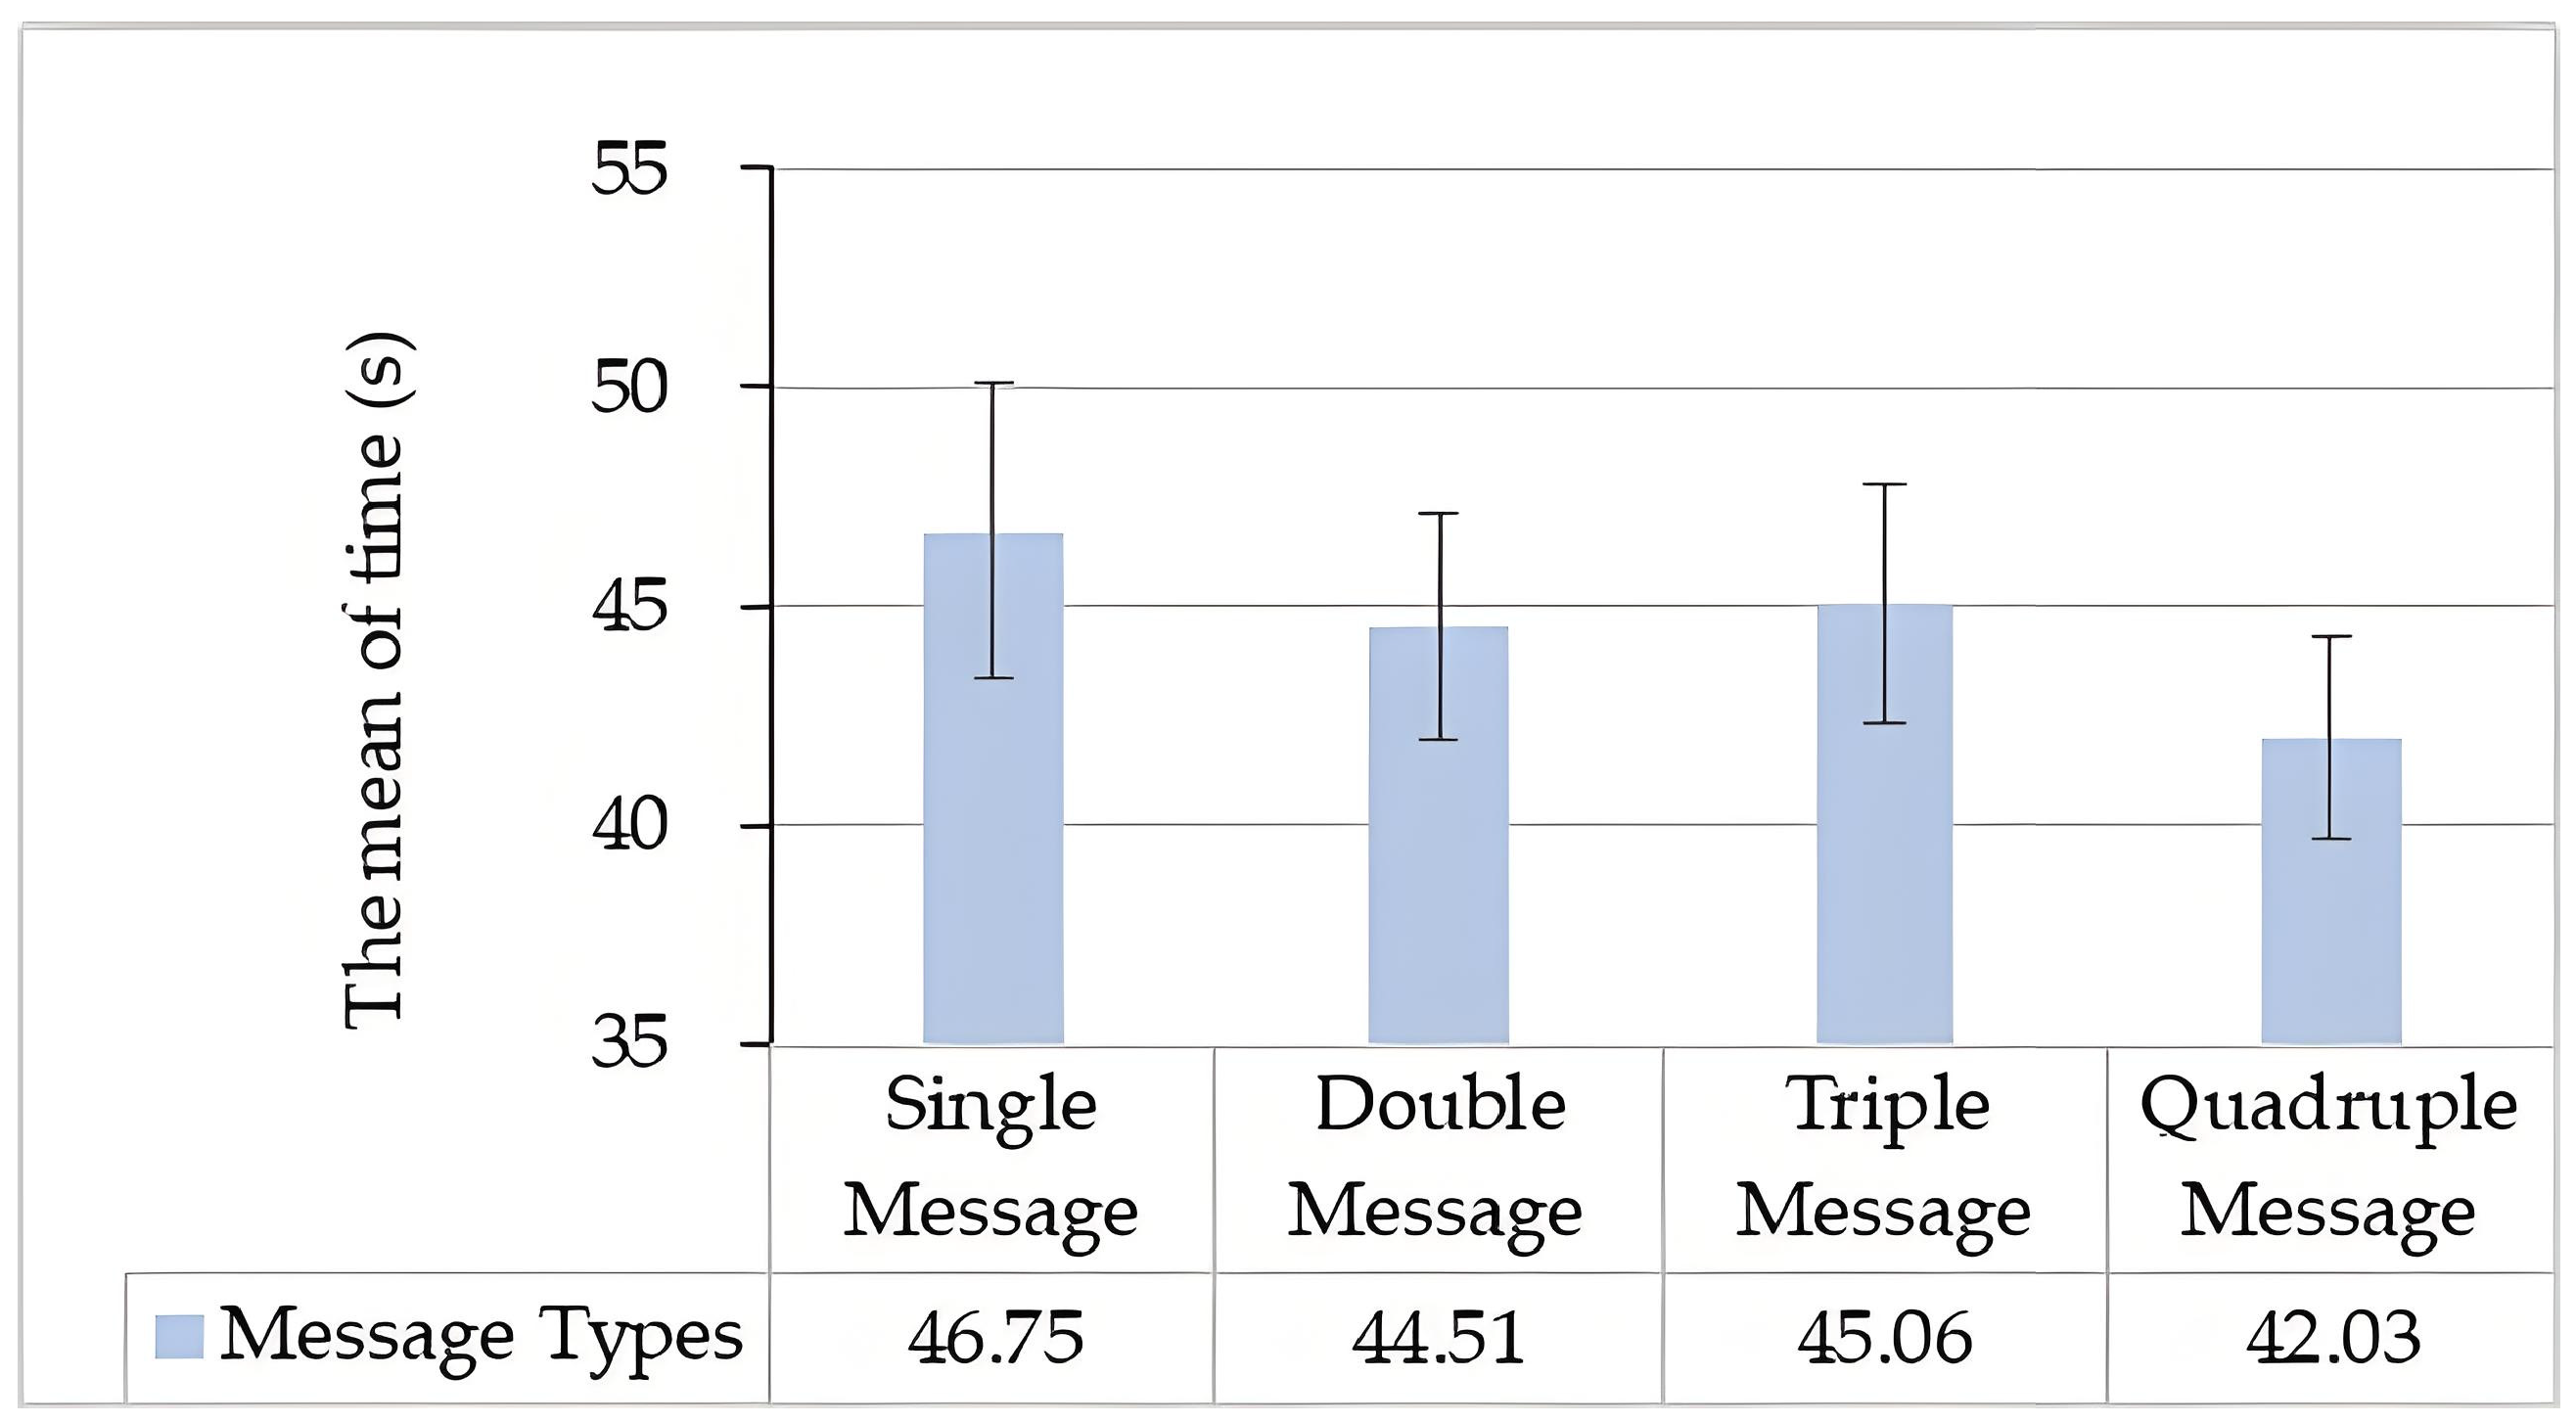
The mean velocity and time at which all drivers passed through the whole zone guided by the four prompt messages are shown in Figure 5 and Figure 6, respectively. The mean velocity under the Single, Double, Triple, and Quadruple Messages was 52.61, 52.75, 52.34, and 54.49 km/h, respectively. The mean time under the Single, Double, Triple, and Quadruple Messages was 46.75, 44.51, 45.06, and 42.03 s, respectively. It should be noted that there was no significant difference in velocity at the starting point of the data analysis zone (i.e., L (–600)) in the four conditions (F = 0.003, p = 1.00), so the potential effects of initial velocity can be excluded. The ANOVA results showed that the amount of information from the navigation voice guidance significantly affected the velocity and time in the whole zone (F (3, 108) = 3.54, p = 0.02; F (3, 108) = 8.98, p = 0.00). The Bonferroni test further showed that the velocity when using the Quadruple Message was significantly greater than that when using the other three prompt messages; the time was also significantly less than that when using the other three prompt messages. However, there was no significant difference in the mean velocity and time with the Single, Double, and Triple Messages. In terms of the velocity and time through the whole zone, the vehicle ran more efficiently when guided by the Quadruple Message than when guided by the other three prompt messages.
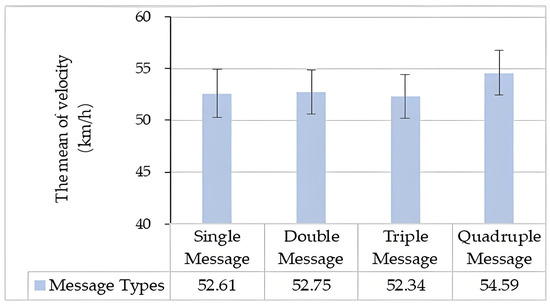
Figure 5.
The mean velocity through the whole zone following four prompt messages.
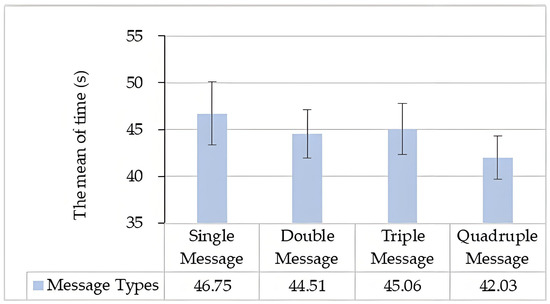
Figure 6.
The mean time through the whole zone following four prompt messages.
3.2. Absolute Acceleration and Maximal Deceleration in the Whole Zone
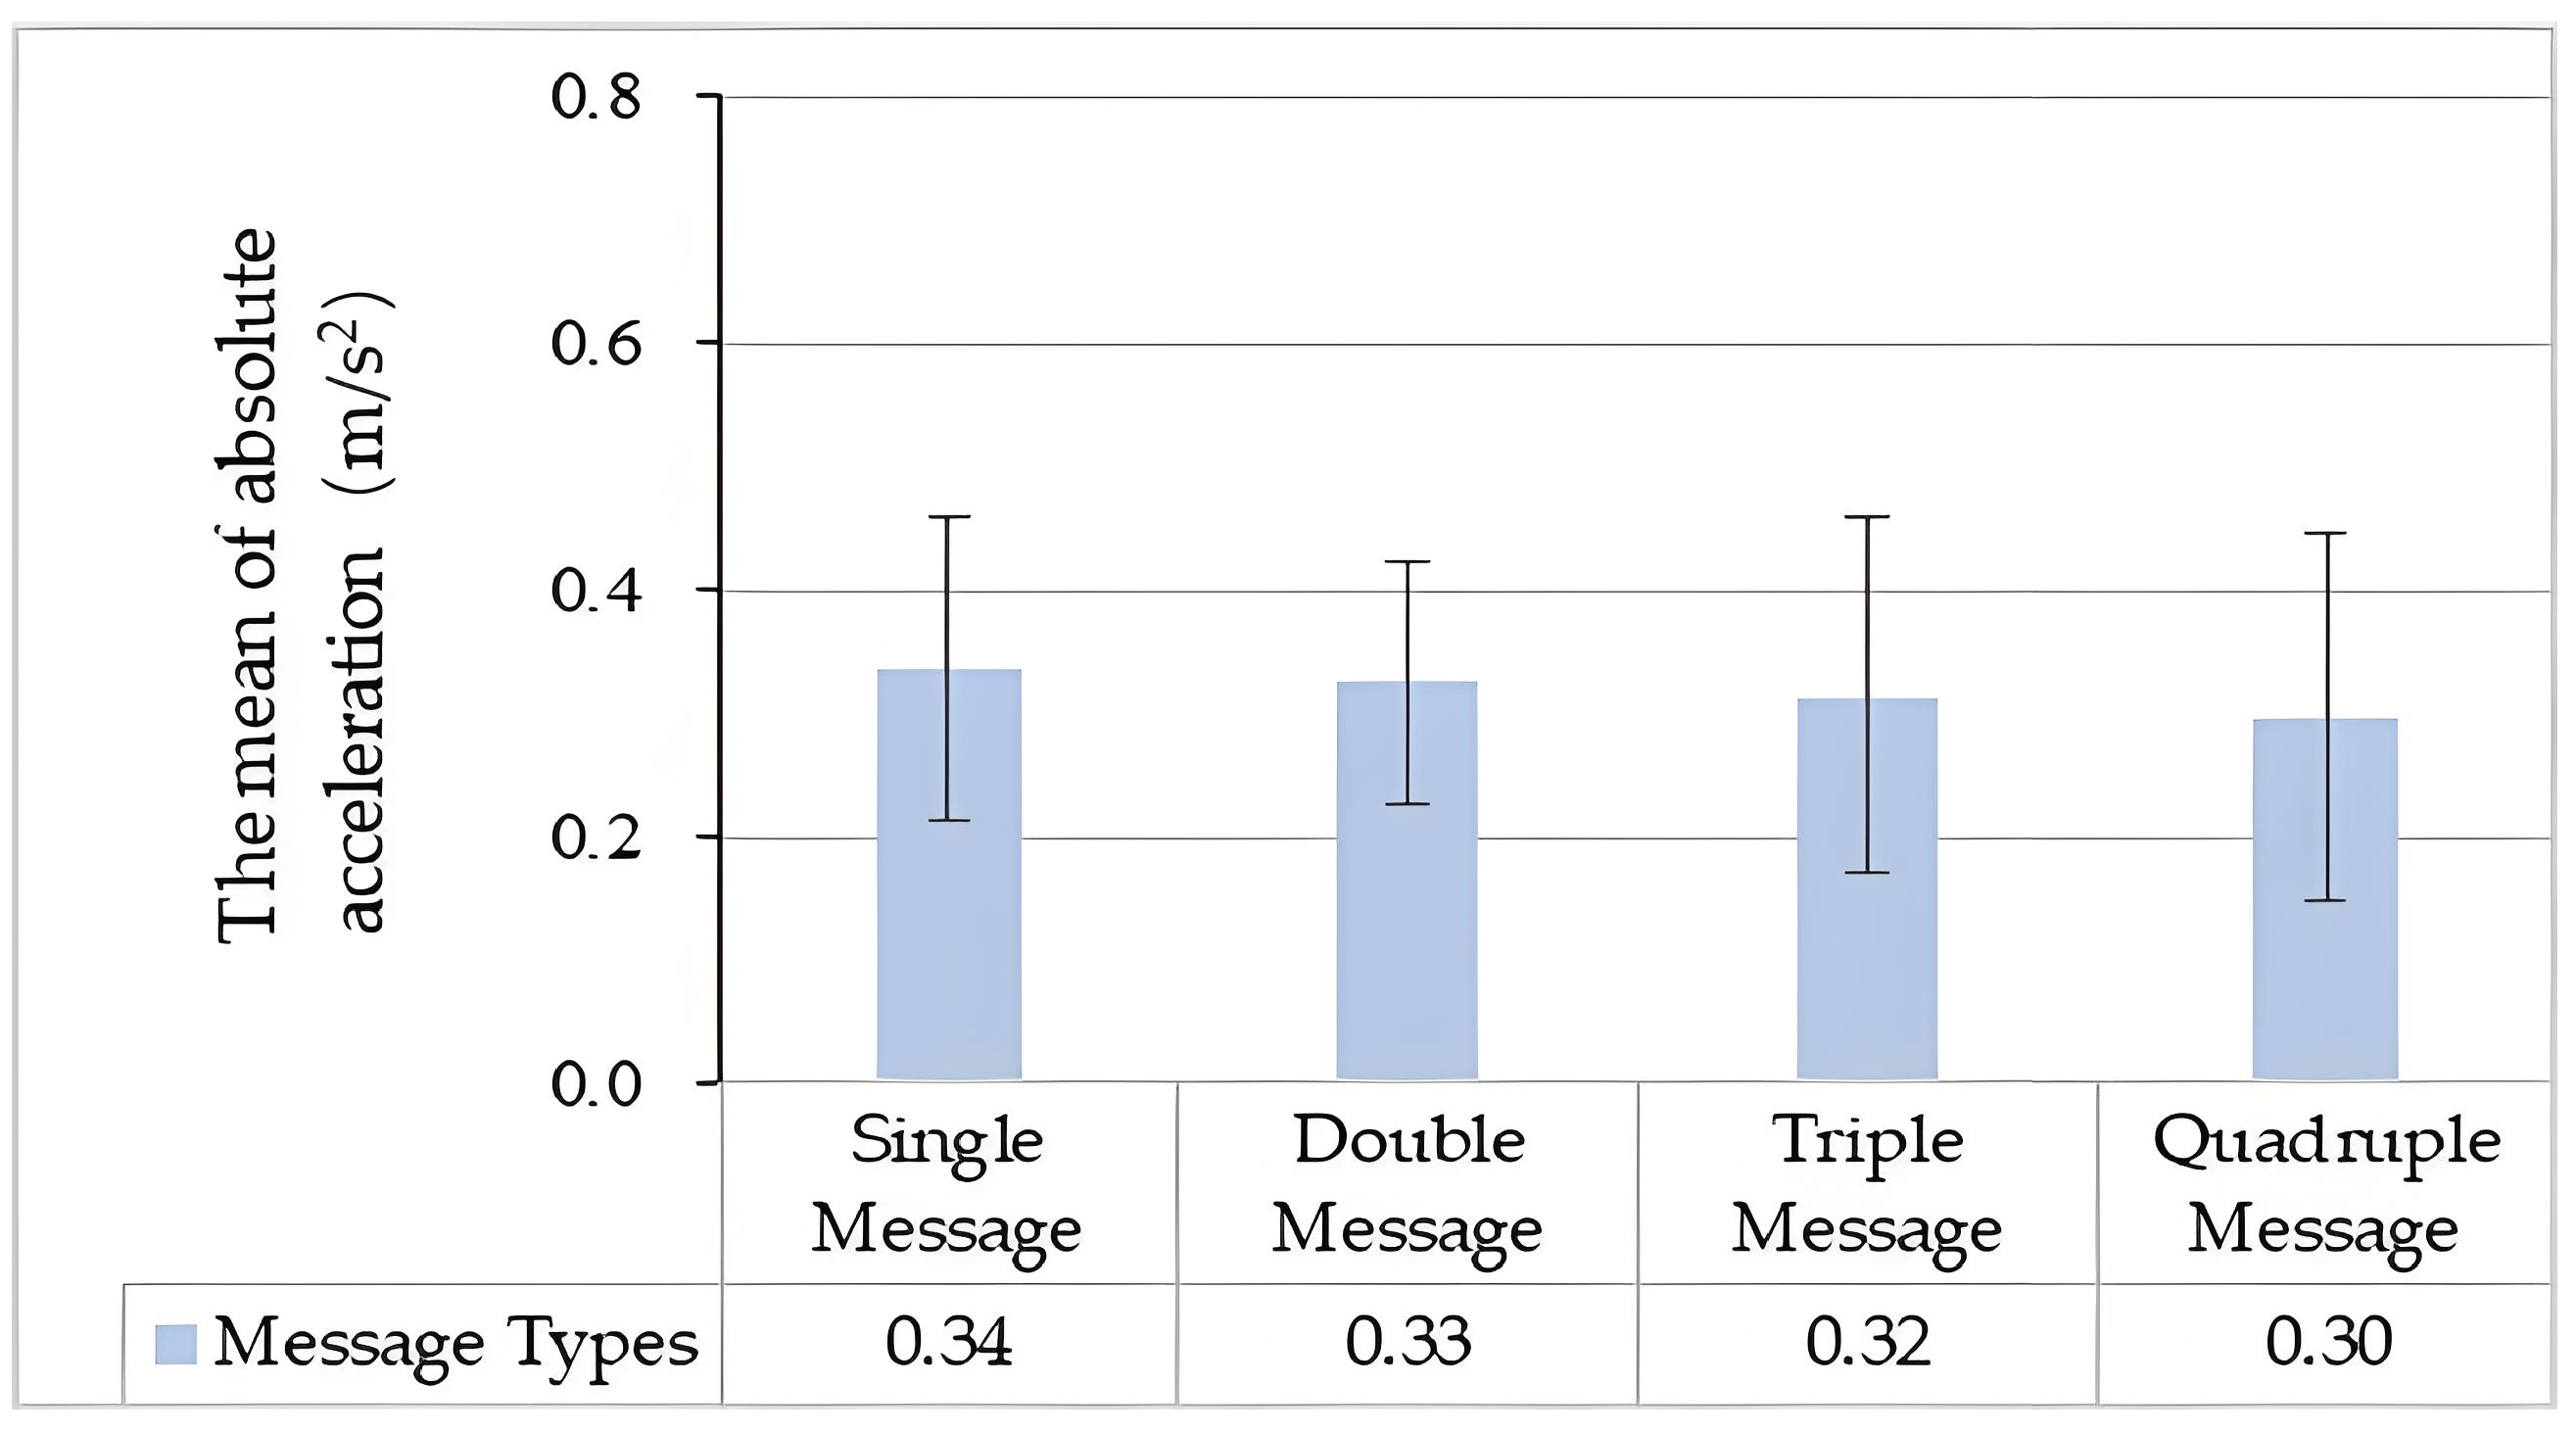
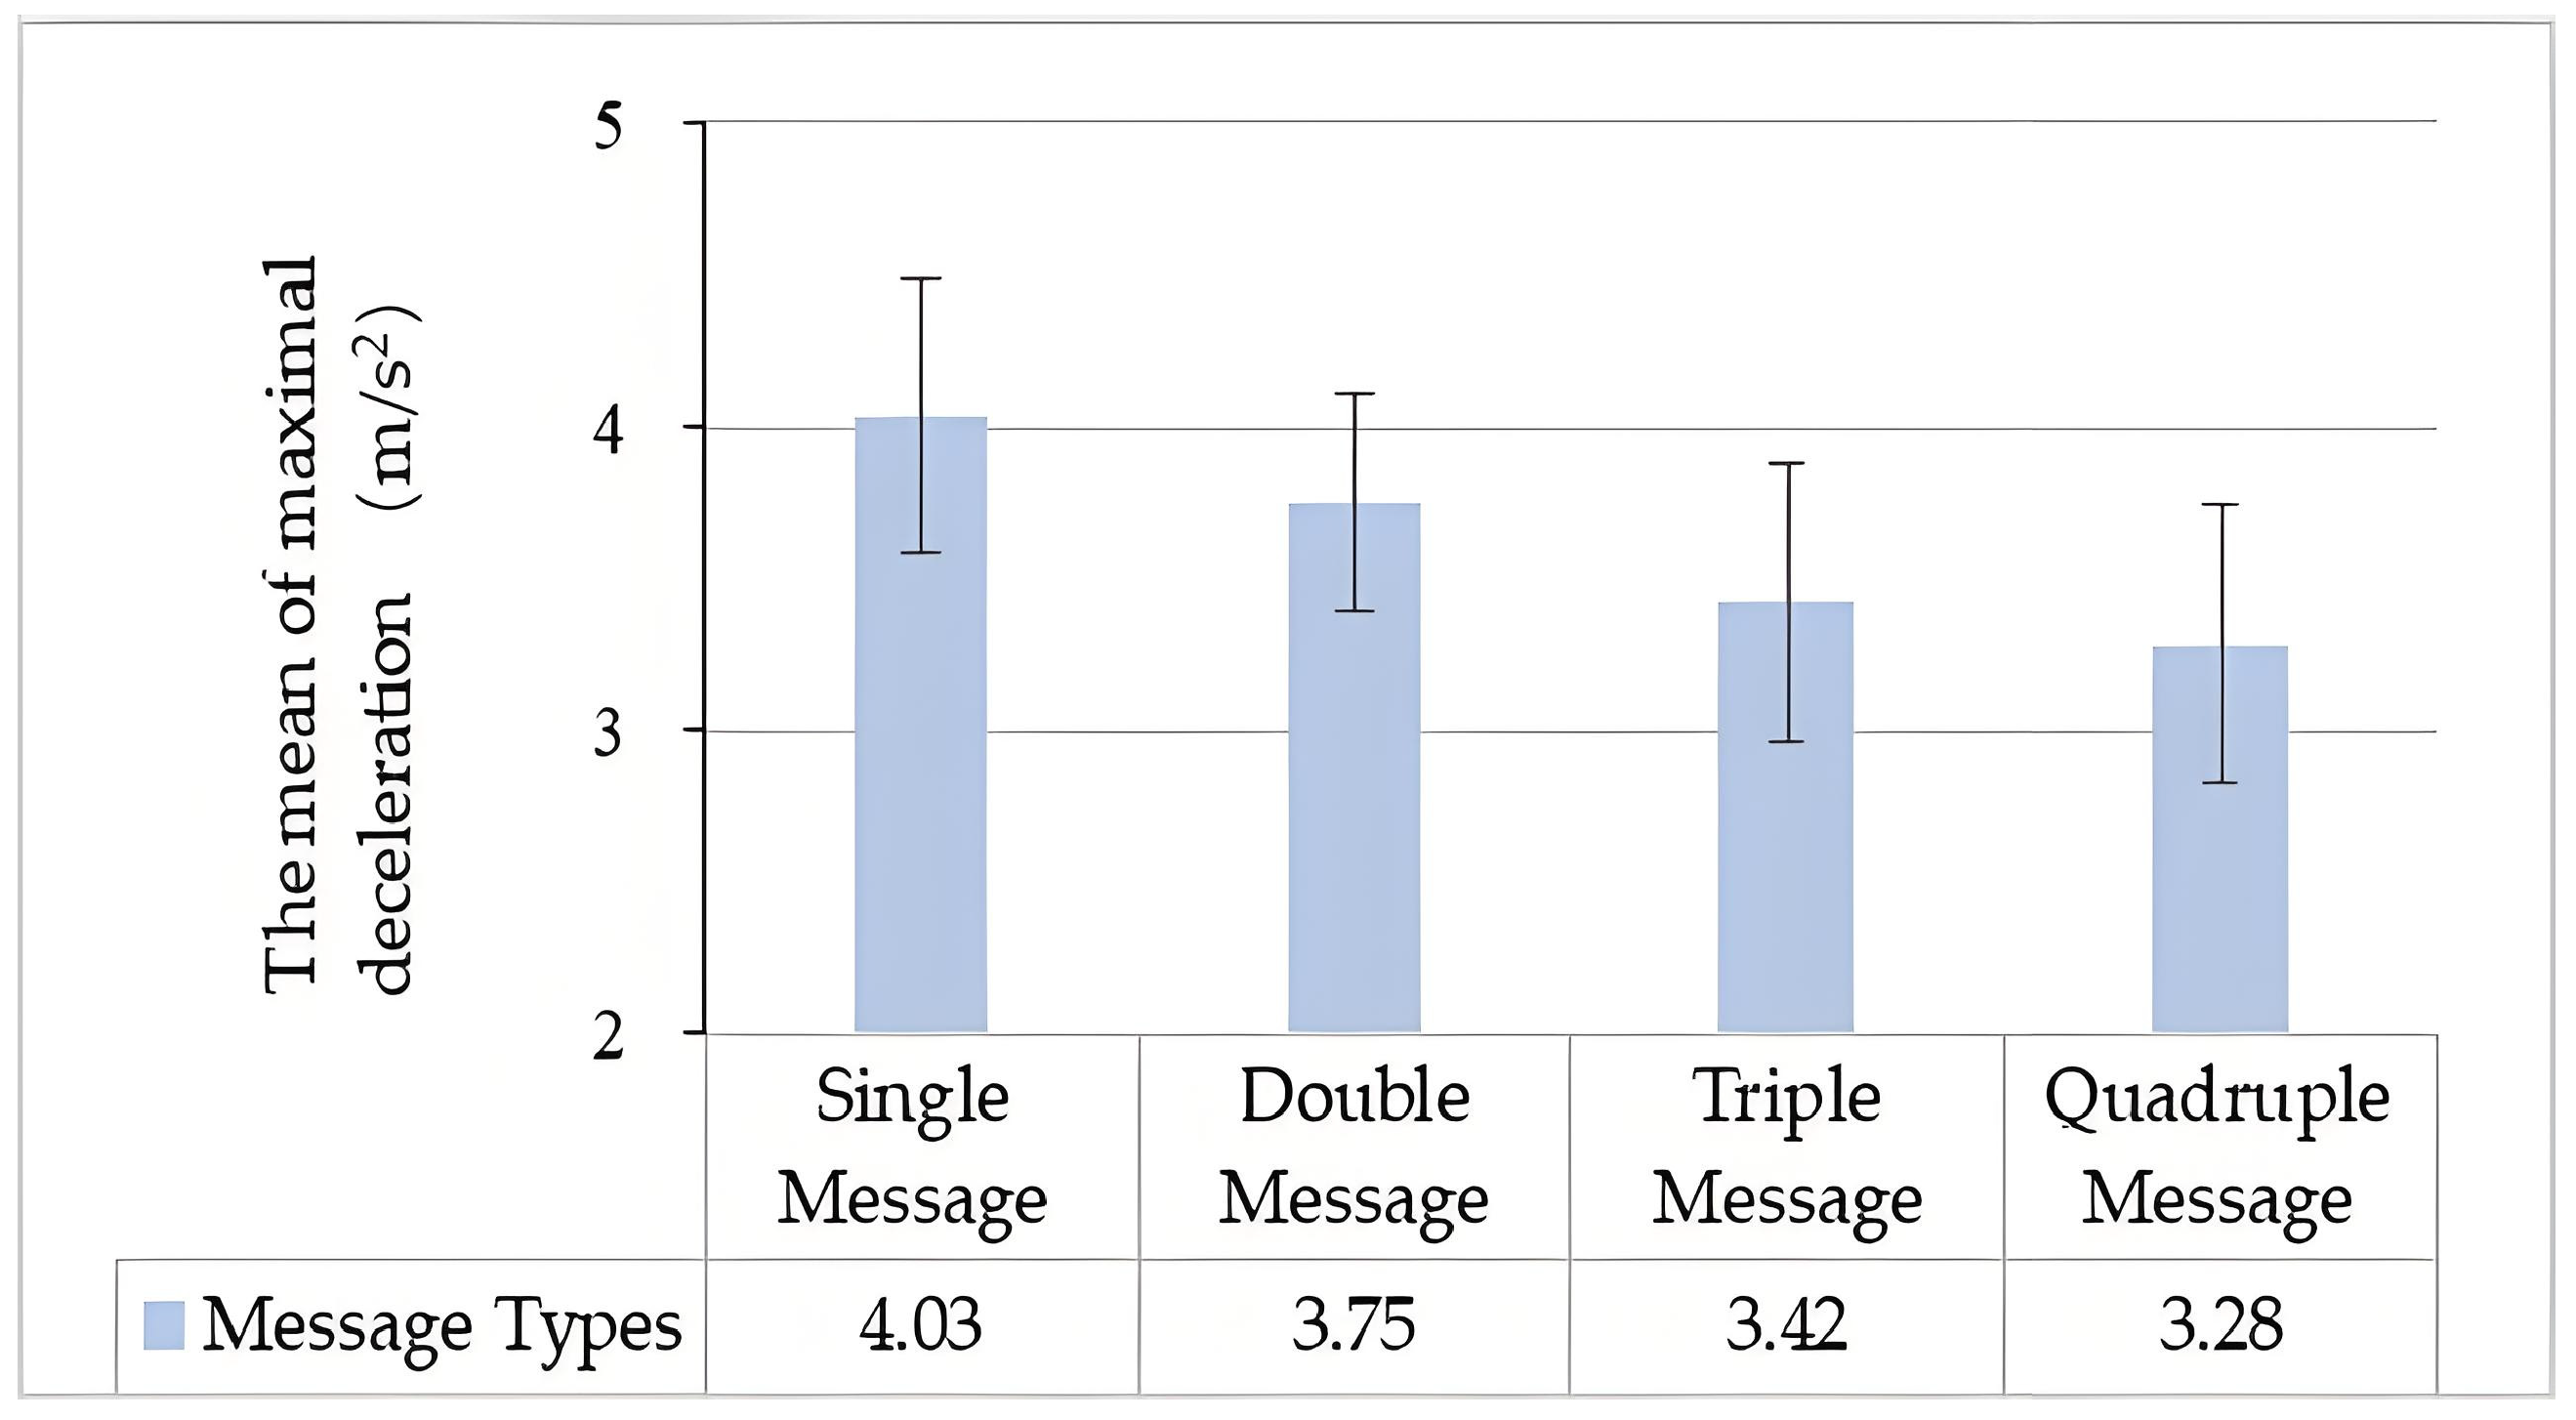
The mean absolute acceleration and mean maximal deceleration of all drivers passing through the whole zone guided by the four prompt messages are shown in Figure 7 and Figure 8, respectively. The mean absolute acceleration following the Single, Double, Triple, and Quadruple Messages was 0.34, 0.33, 0.32, and 0.30 m/s2, respectively. The mean maximal deceleration following the Single, Double, Triple, and Quadruple Messages was 4.03, 3.75, 3.42, and 3.28 m/s2, respectively. From the Single Message to the Quadruple Message, the mean absolute acceleration and maximal deceleration gradually decreased with the increasing amount of information. The ANOVA results showed that the amount of information from the navigation voice guidance significantly affected the maximal deceleration (F (3, 108) = 3.08, p = 0.03), but its effect on absolute acceleration was not significant (F (3, 108) = 1.35, p = 0.266). The Bonferroni test further showed that the maximal deceleration had no significant difference following Single and Double Messages, and Triple and Quadruple Messages; however, the maximal deceleration with the Single Message was significantly greater than that with the Triple and Quadruple Messages. In terms of the maximal deceleration in the whole zone, the operation of the vehicles guided by the Single Message was less safe than that of those guided by the Triple and Quadruple Messages.
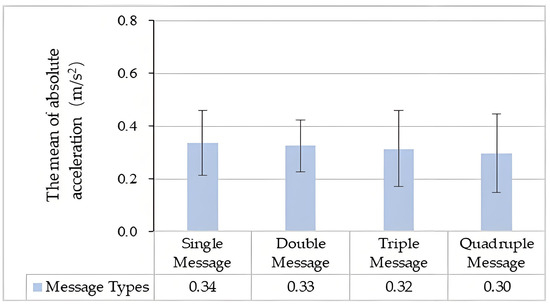
Figure 7.
The mean absolute acceleration in the whole zone following four prompt messages.
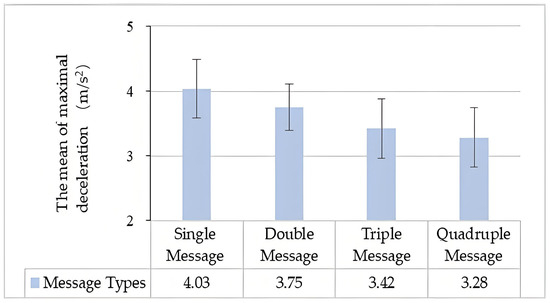
Figure 8.
The mean maximal deceleration in the whole zone following four prompt messages.
3.3. Velocity and Acceleration at Each Subzone
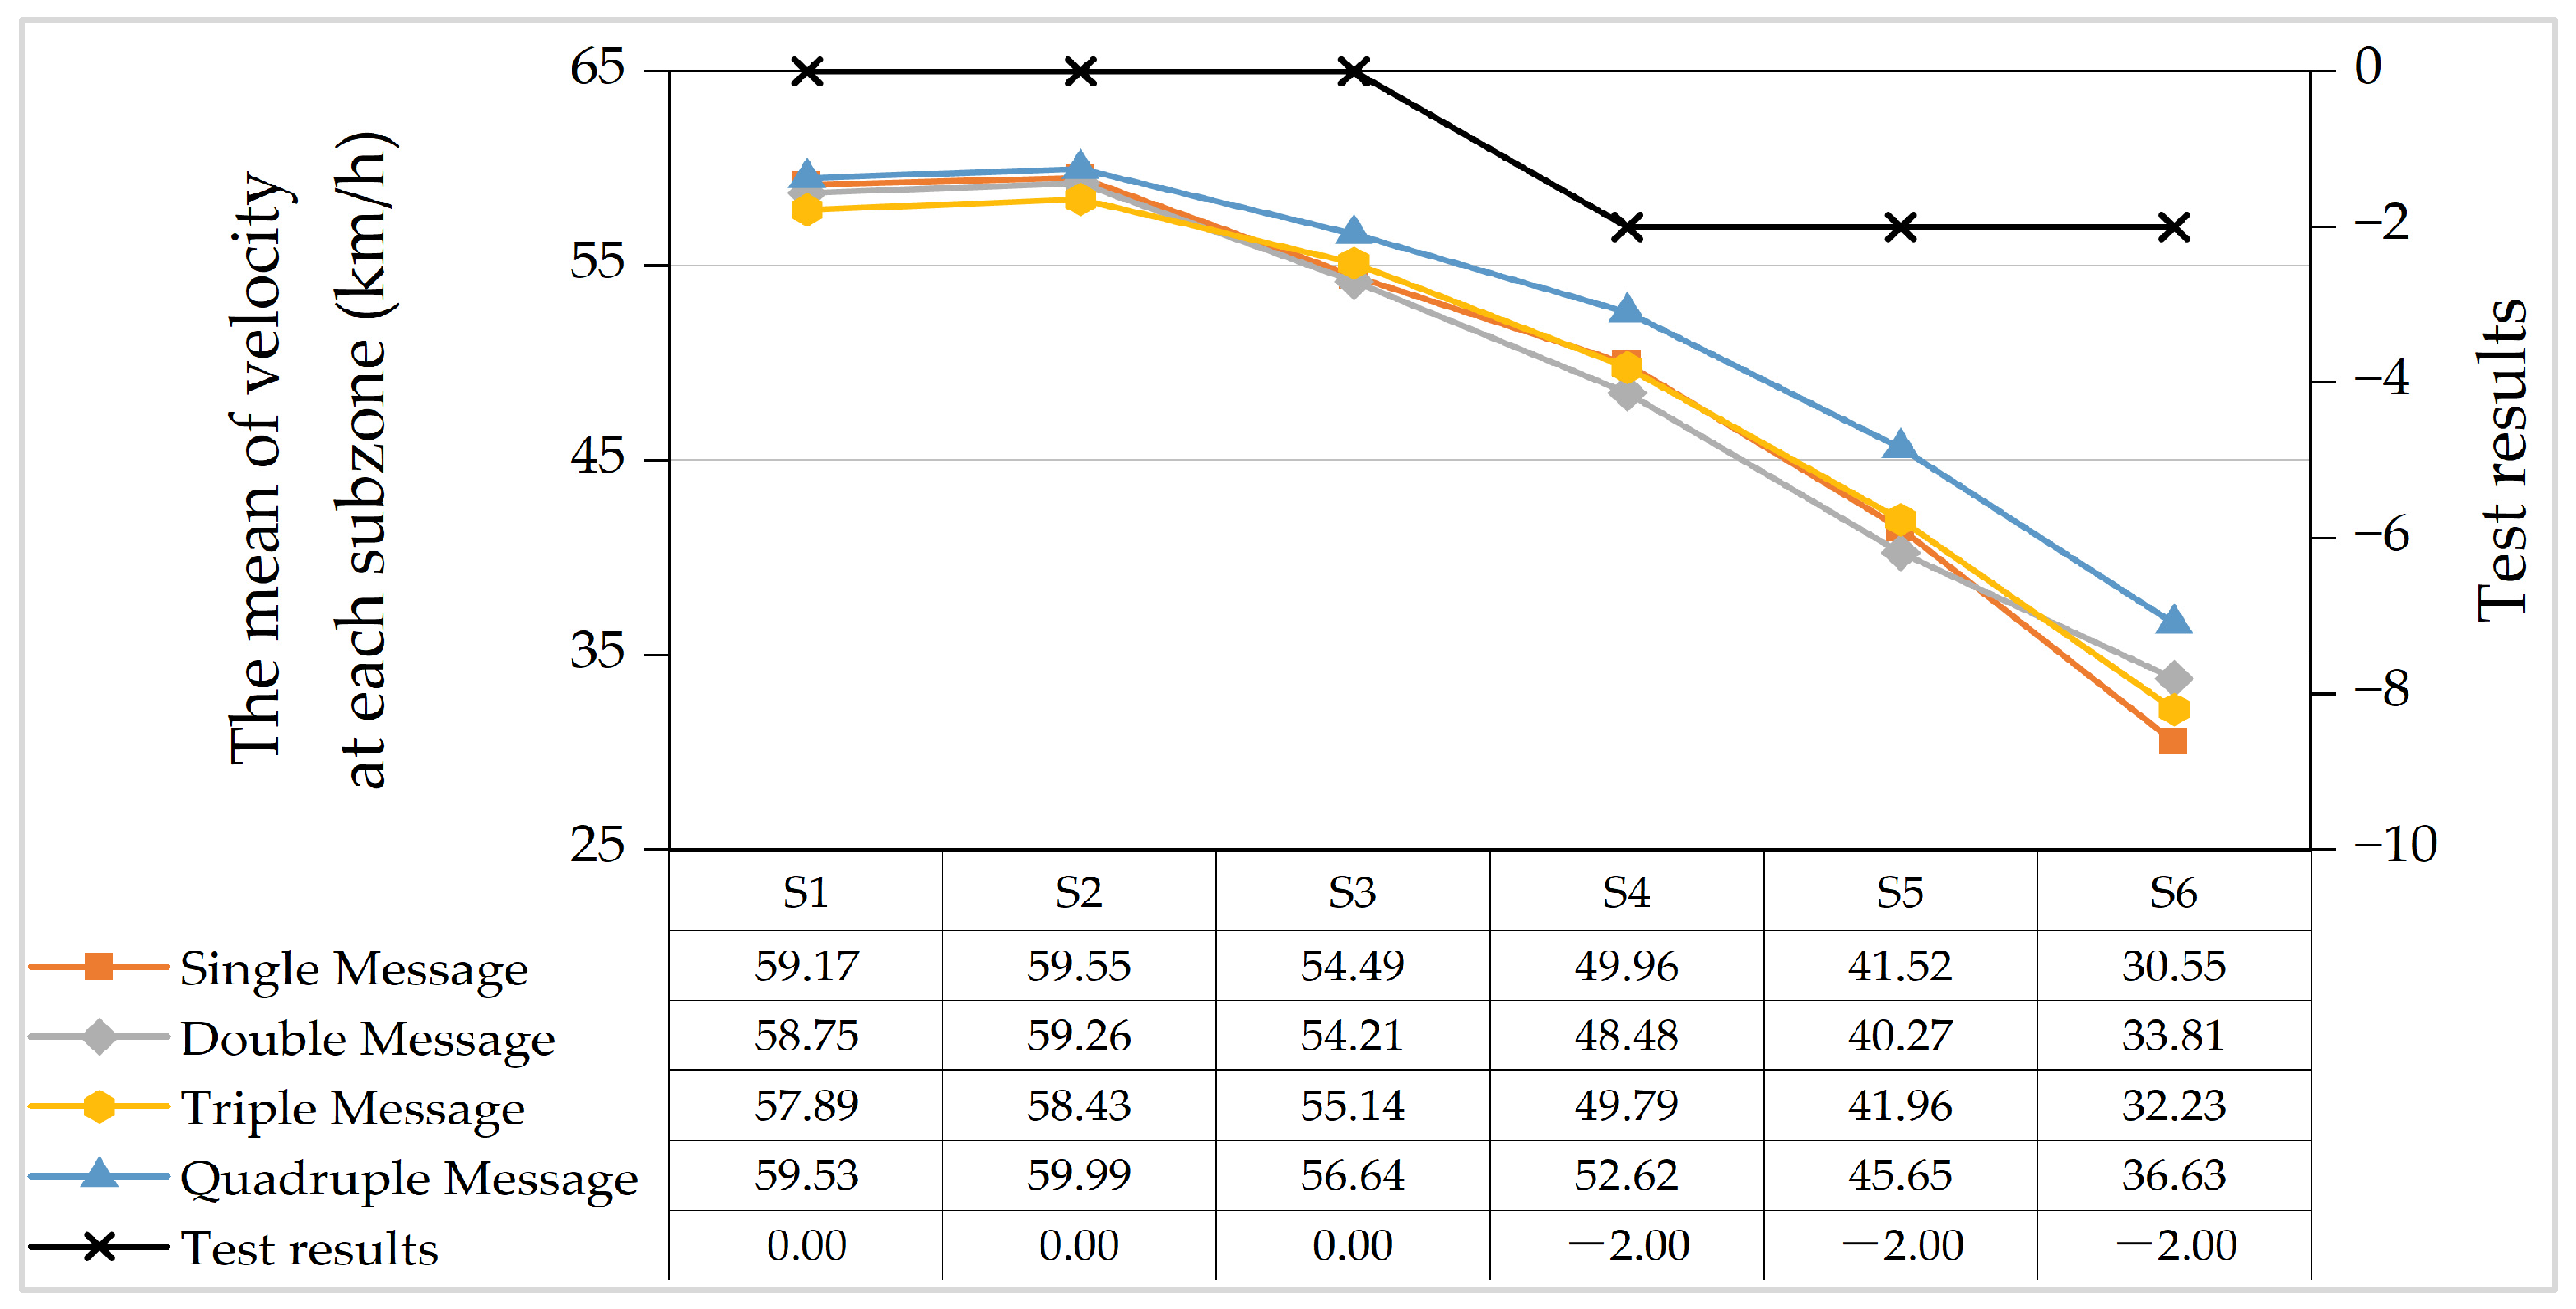
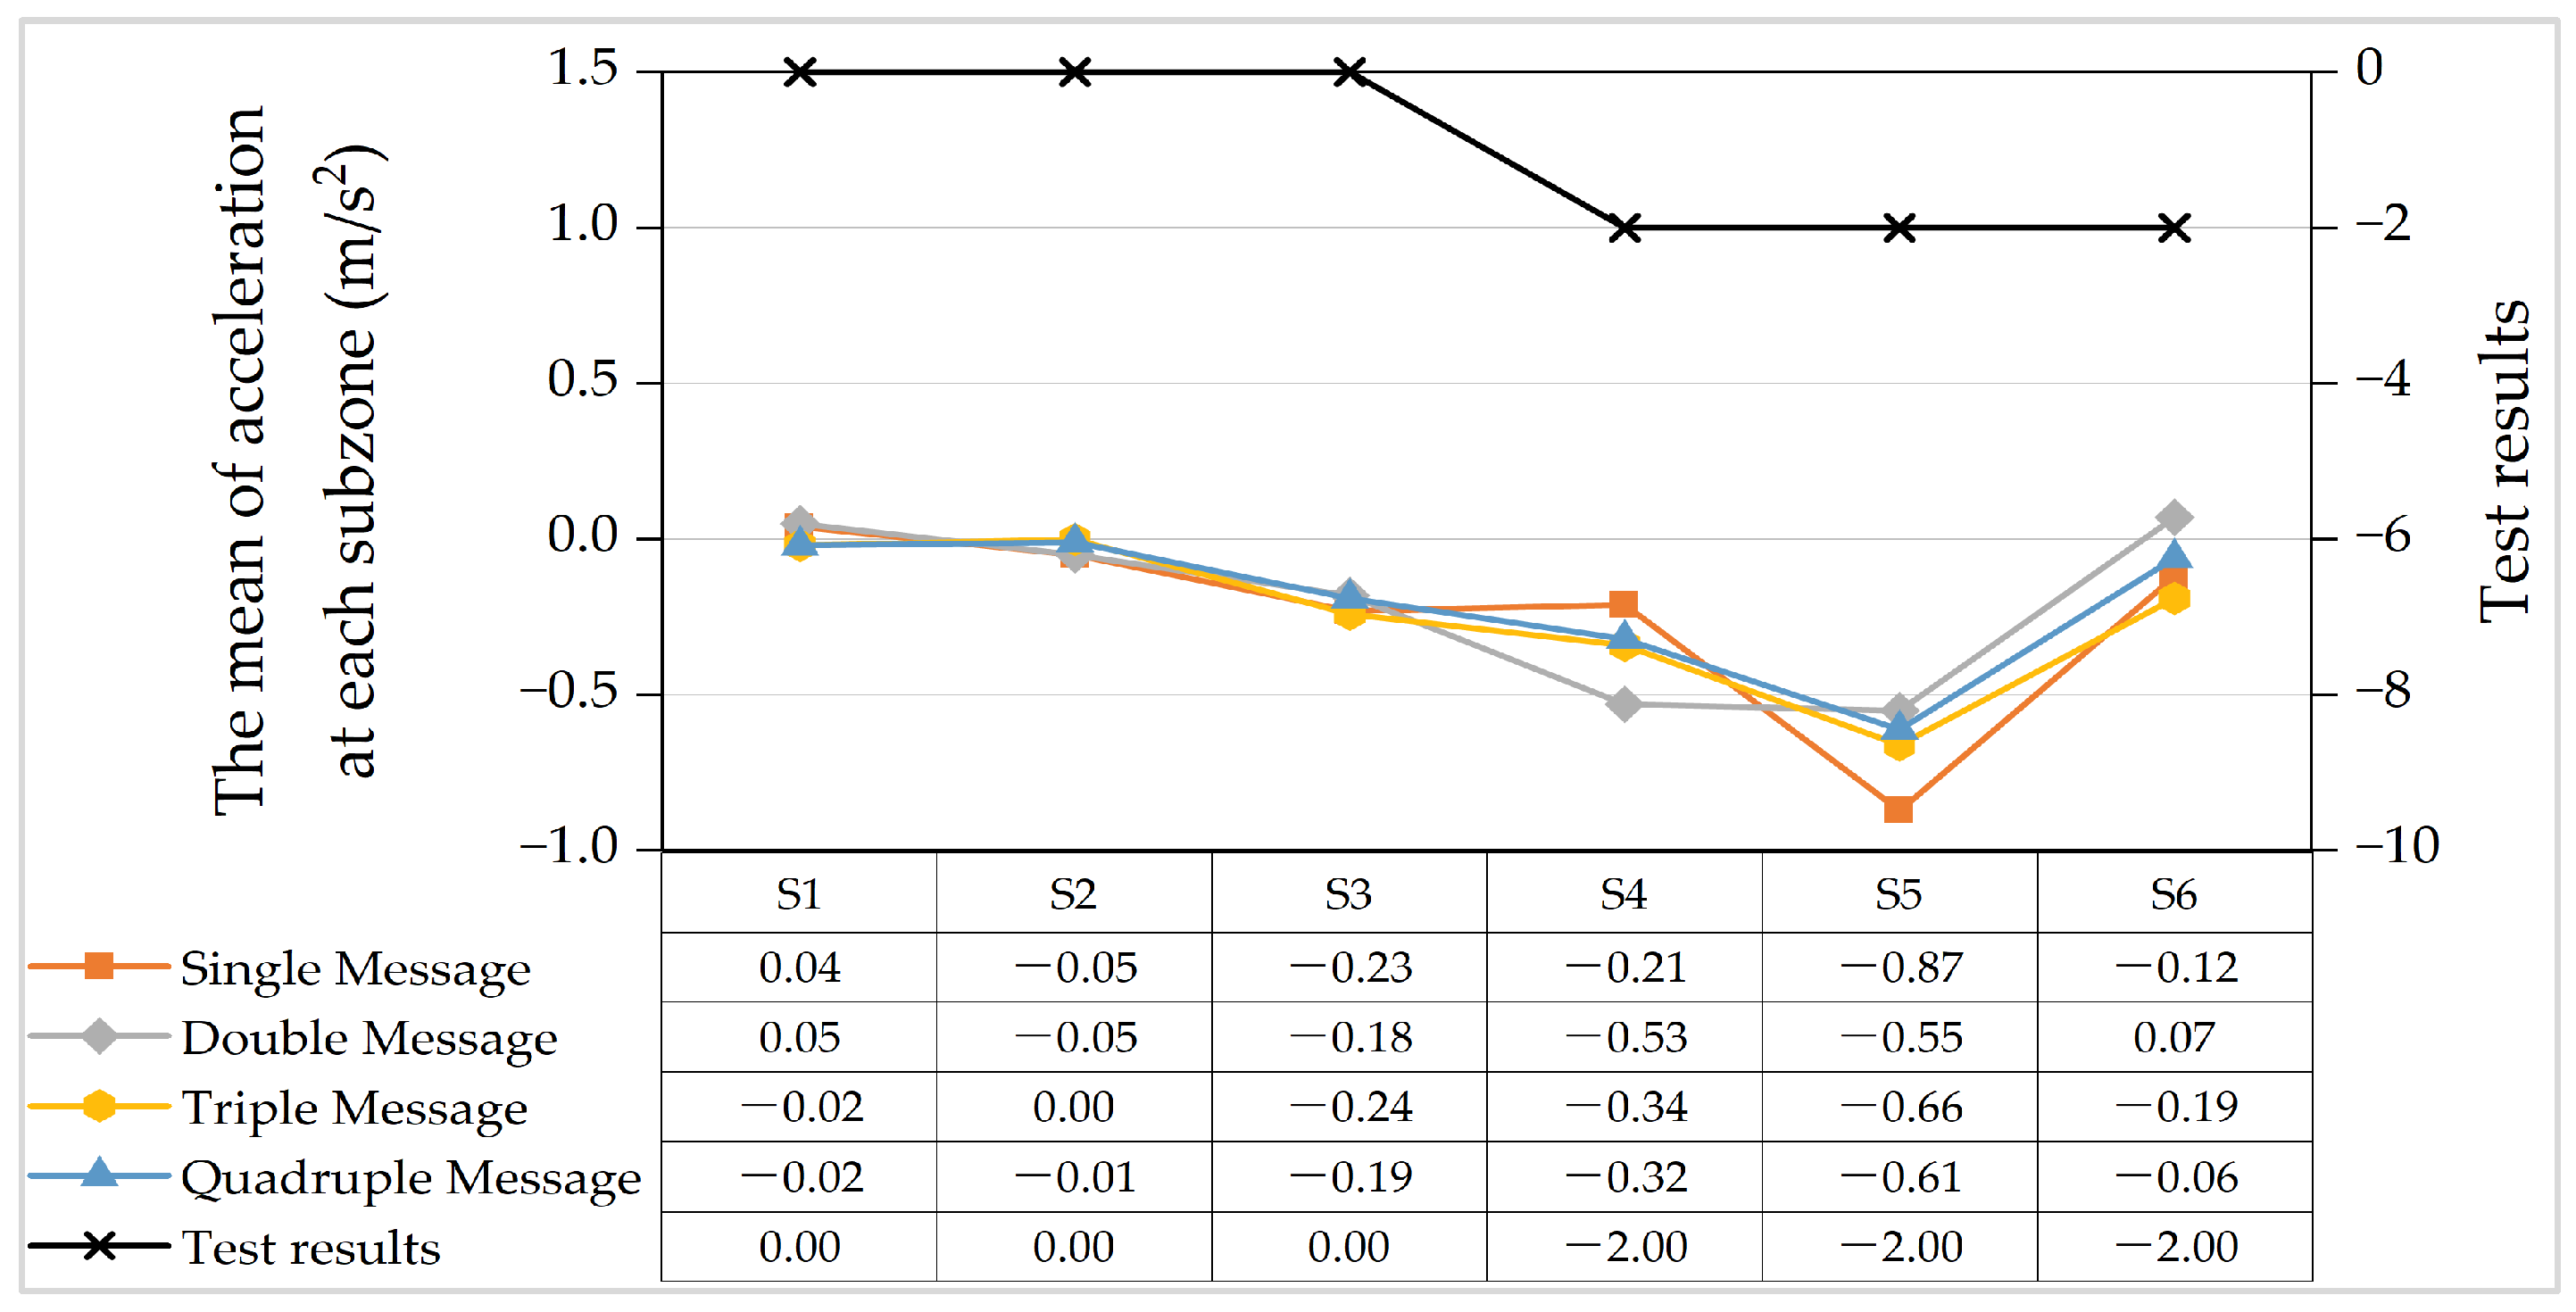
The mean velocity and acceleration at which all drivers passed through each subzone when guided by four prompt messages are shown in Figure 9 and Figure 10, respectively. S1–S6 in Figure 9 and Figure 10 represent the First Broadcast, the First Clear Interval, the Second Broadcast, the Second Clear Interval, the Third Broadcast, and the Turning in turn.
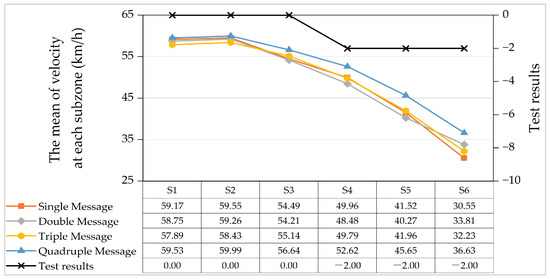
Figure 9.
The mean velocity at each subzone following four prompt messages.

Figure 10.
The mean acceleration at each subzone following four prompt messages.
As shown in Figure 9, from S1 to S2, the mean velocity slightly increased, which showed that drivers did not immediately slow down to prepare for imminent turning after the first message was broadcast. From S3, the mean velocity started to decrease and continued to do so until S6 according to a linear trend, which indicated that drivers began to prepare for imminent turning at the beginning of the broadcast of the second message. The ANOVA results showed that there were significant differences in velocity following the four prompt messages with different amounts of information at S4, S5, and S6 (F (3, 108) = 3.856, p = 0.012; F (3, 108) = 5.679, p = 0.001; F (3, 108) = 14.660, p = 0.000), but the velocity following the four prompt messages had no significant difference at S1 and S2 (F (3, 108) = 0.686, p = 0.562; F (3, 108) = 0.889, p = 0.449). Moreover, the velocity when using the Quadruple Message was significantly higher than that with the other three types of prompt messages, but the velocity with the Single, Double, and Triple Messages showed no significant difference at S4, S5, and S6. In terms of the velocity at each subzone, drivers had a slightly more gradual deceleration when using the Quadruple Message than when using the other three prompt messages from S3 to S6.
As shown in Figure 10, the mean acceleration at S1 and S2 was about 0 m/s2, but the acceleration was less than 0 from S3 to S6 (in addition to the acceleration following the Double Message at S6, which was slightly greater than 0). The ANOVA results also showed that the amount of information from the navigation voice guidance significantly affected the acceleration at S4, S5, and S6 (F (3, 108) = 5.725, p = 0.001; F (3, 108) = 4.964, p = 0.003; F (3, 108) = 5.212, p = 0.002). In summary, based on the acceleration at each subzone, the drivers had a more stable speed adjustment when guided by the Triple and Quadruple Messages compared to the Single and Double Messages from S3 to S6.
3.4. Rate of Speed Variation and Acceleration Variation of Each Broadcast
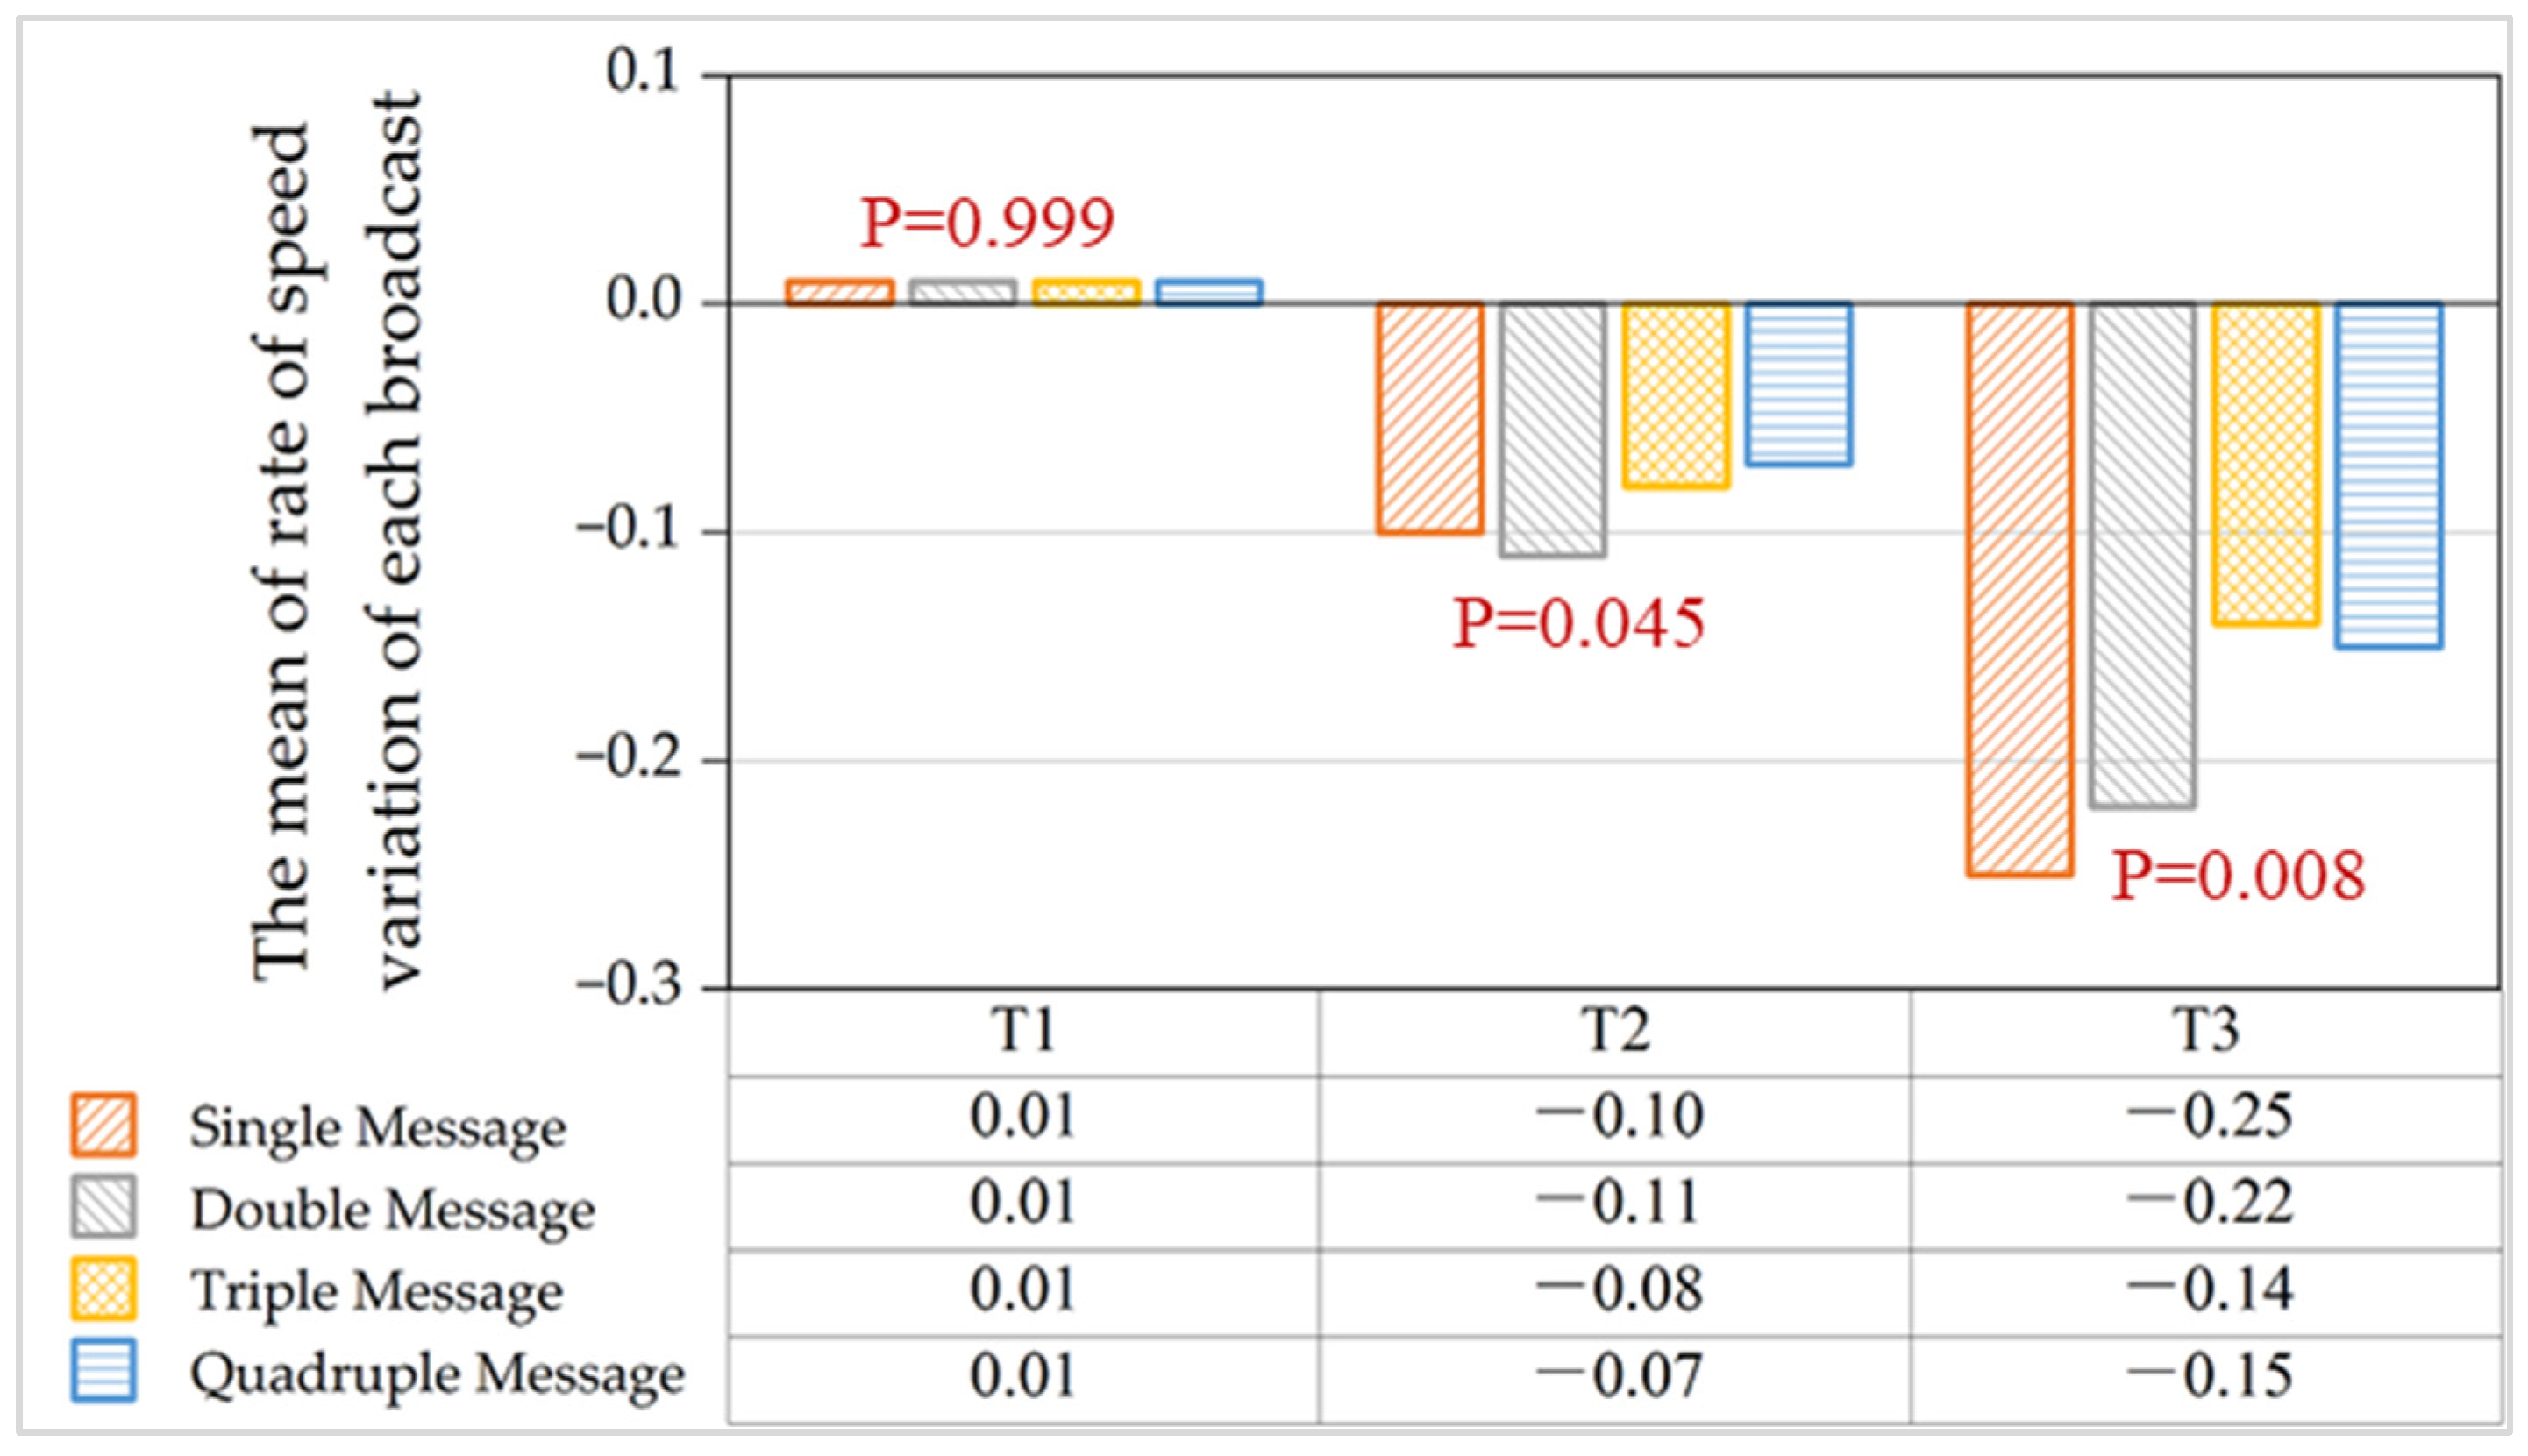
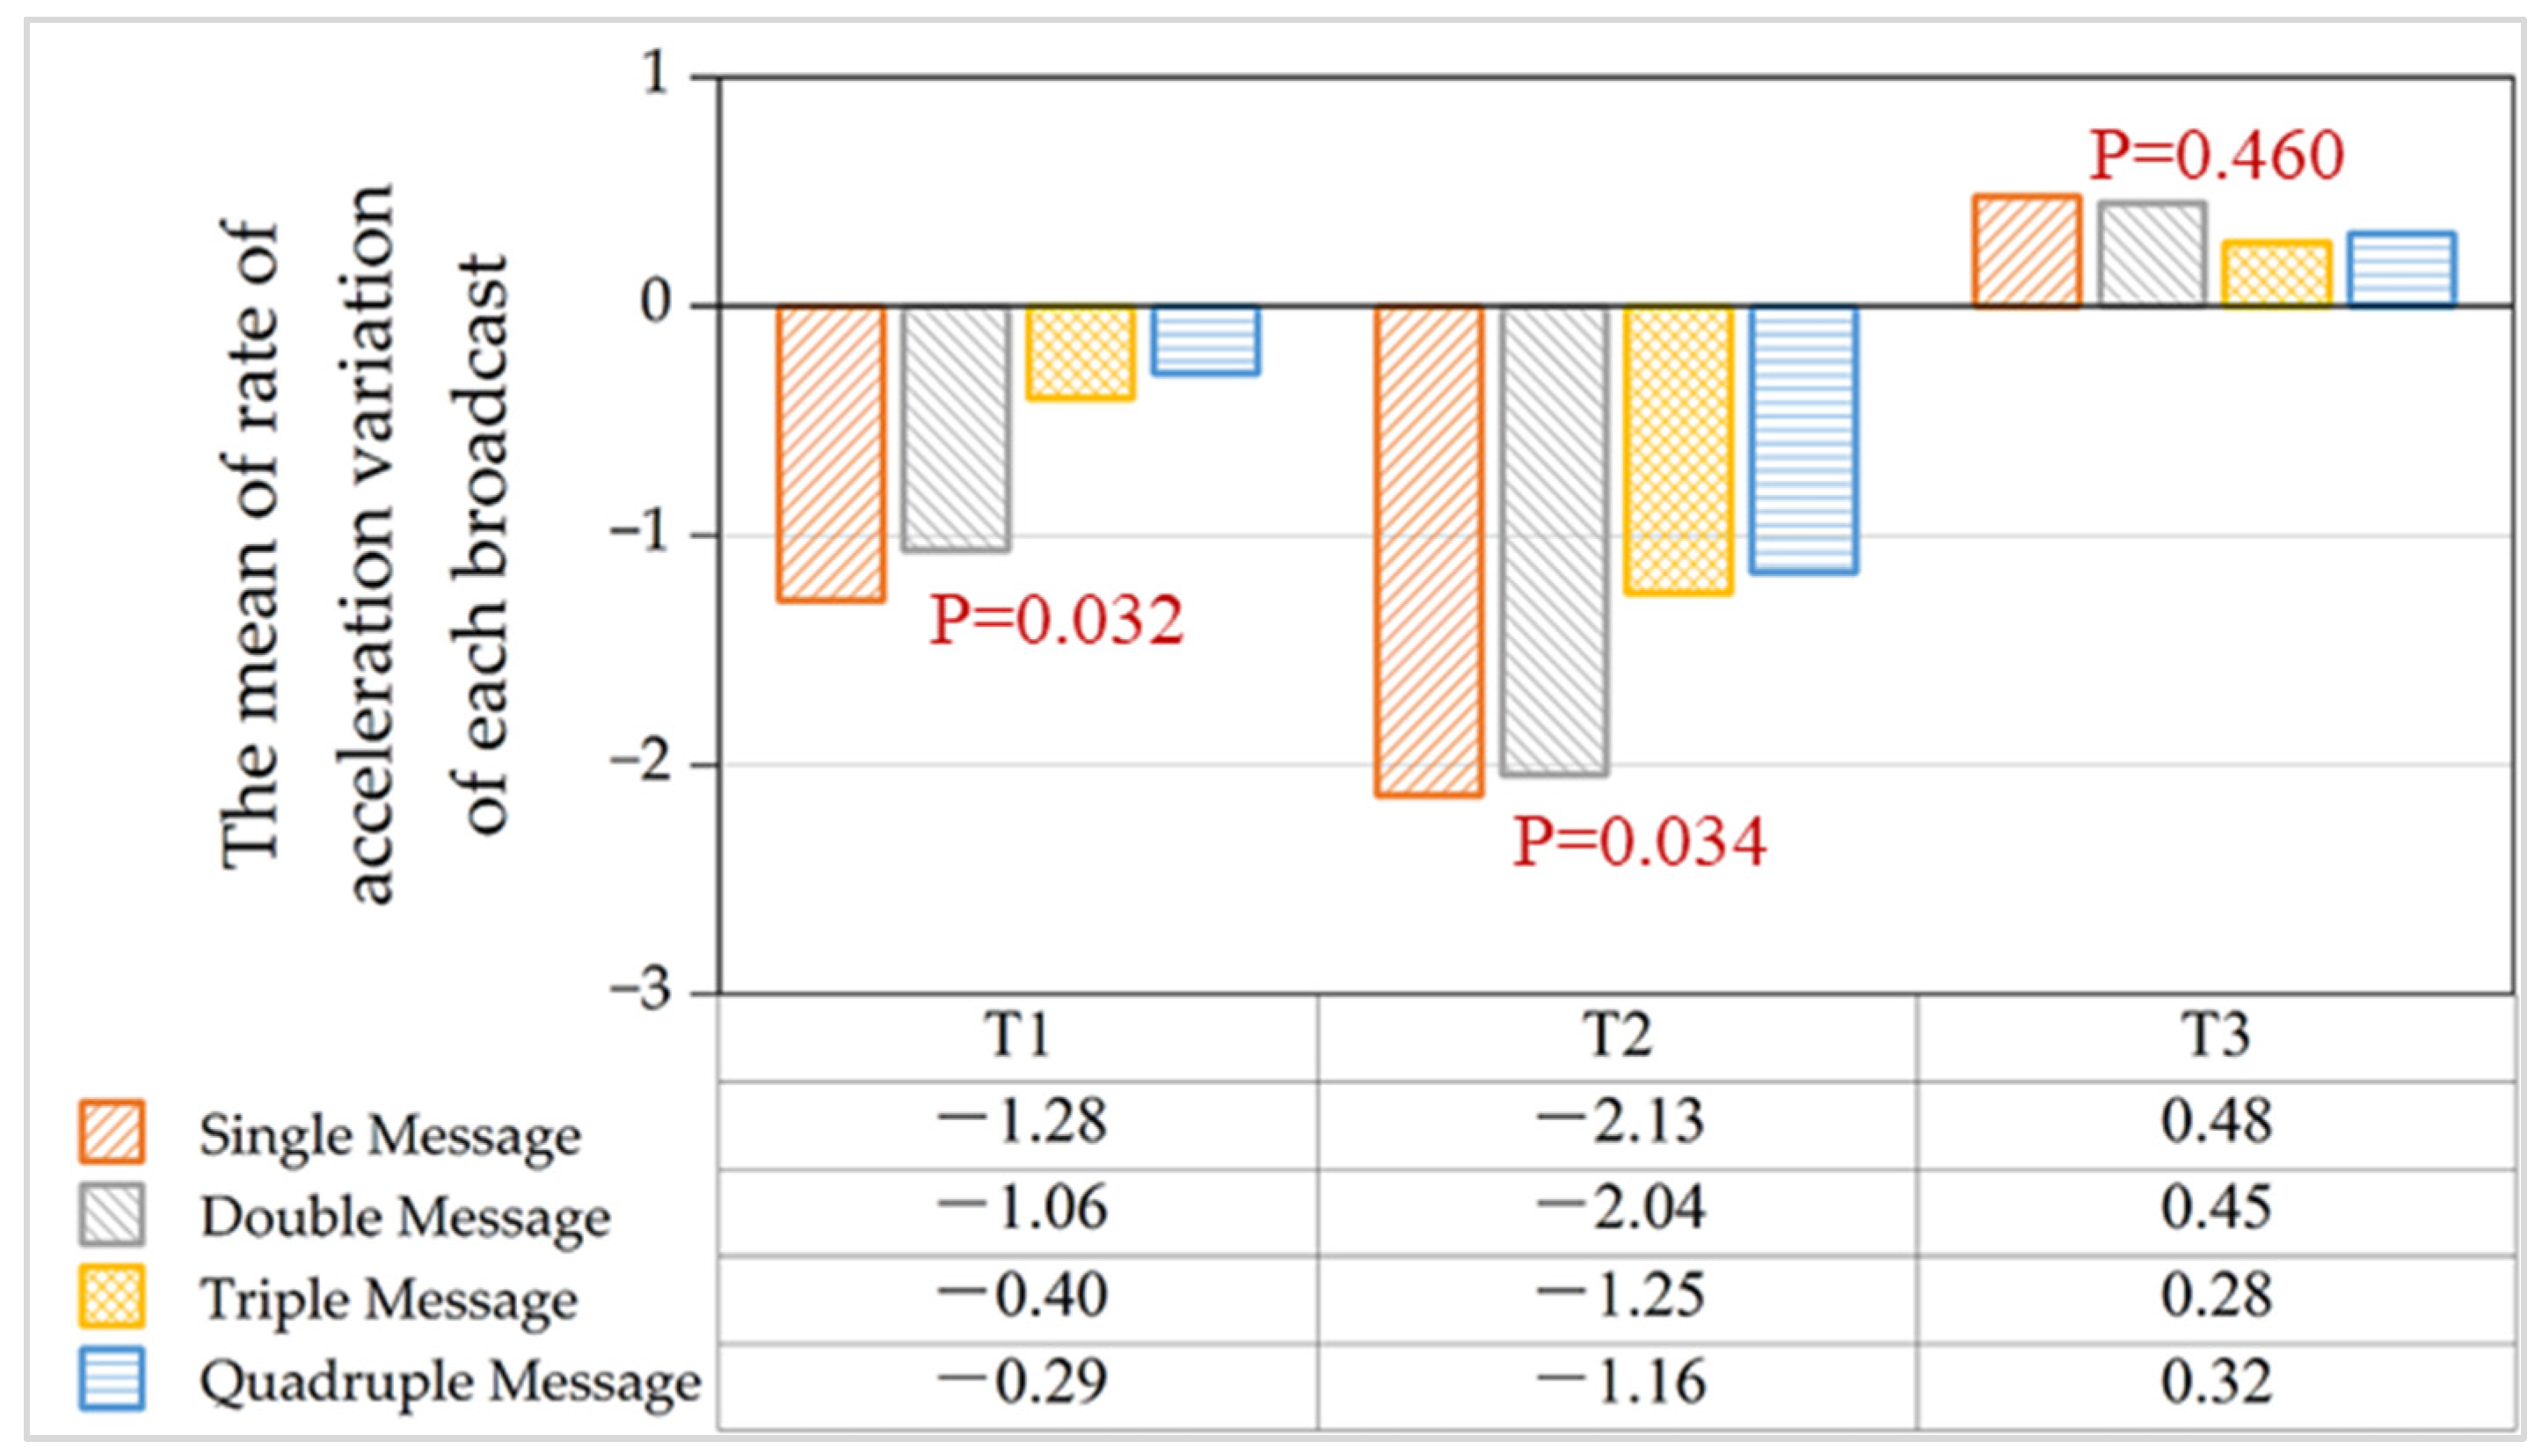
Each prompt message was broadcasted three times; for each broadcast, the change rates of speed and acceleration for the four prompt messages are shown in Figure 11 and Figure 12, respectively. T1–T3 in Figure 11 and Figure 12 represent the first, second, and third broadcasts in turn, respectively.
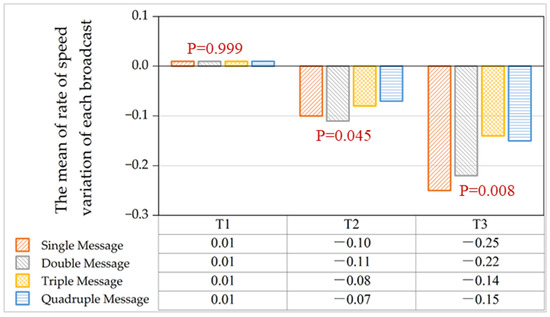
Figure 11.
The mean rate of speed variation of each broadcast of four prompt messages.

Figure 12.
The mean rate of acceleration variation of each broadcast of four prompt messages.
After the first message was broadcast, the speed of the four types of prompt messages all increased by all 1%, while acceleration decreased all around, and the decrease rate when using the Single and Double Messages (−128% and −106%) was larger than that when using the Triple and Quadruple Messages (−40% and −29%).
After the second message was broadcast, the speed and acceleration after using the four types of prompt messages decreased. Specifically, the decrease rate of speed when using the Single and Double Messages (−10% and −11%) was slightly greater than that when using the Triple and Quadruple Messages (−8% and −7%). However, the decrease rate of acceleration when using the Single and Double Messages (−213% and −204%) was much greater than that when using the Triple and Quadruple Messages (−125% and −116%).
After the third message was broadcast, the speed following the four types of prompt messages decreased, while acceleration increased. Specifically, the decrease rate of speed when using the Single and Double Messages (−25% and −22%) was greater than that when using the Triple and Quadruple Messages (−14% and −15%). The increase rate of acceleration when using the Single and Double Messages (48% and 45%) was greater than that when using the Triple and Quadruple Messages (28% and 32%).
The results of the KW test showed that the amount of information from the navigation voice guidance significantly affected the mean rank of the rate of speed variation for the last two broadcasts ( = 8.276, p = 0.045; = 11.517, p = 0.008). In addition, it significantly affected the mean rank of the acceleration change rate for the first two broadcasts ( = 9.200, p = 0.032; = 9.079, p = 0.034). In terms of the change rates of velocity and acceleration, the drivers had a stronger deceleration consciousness guided by the Single and Double Messages compared to the Triple and Quadruple Messages after each broadcast.
3.5. Comprehensive Evaluations of Prompt Messages
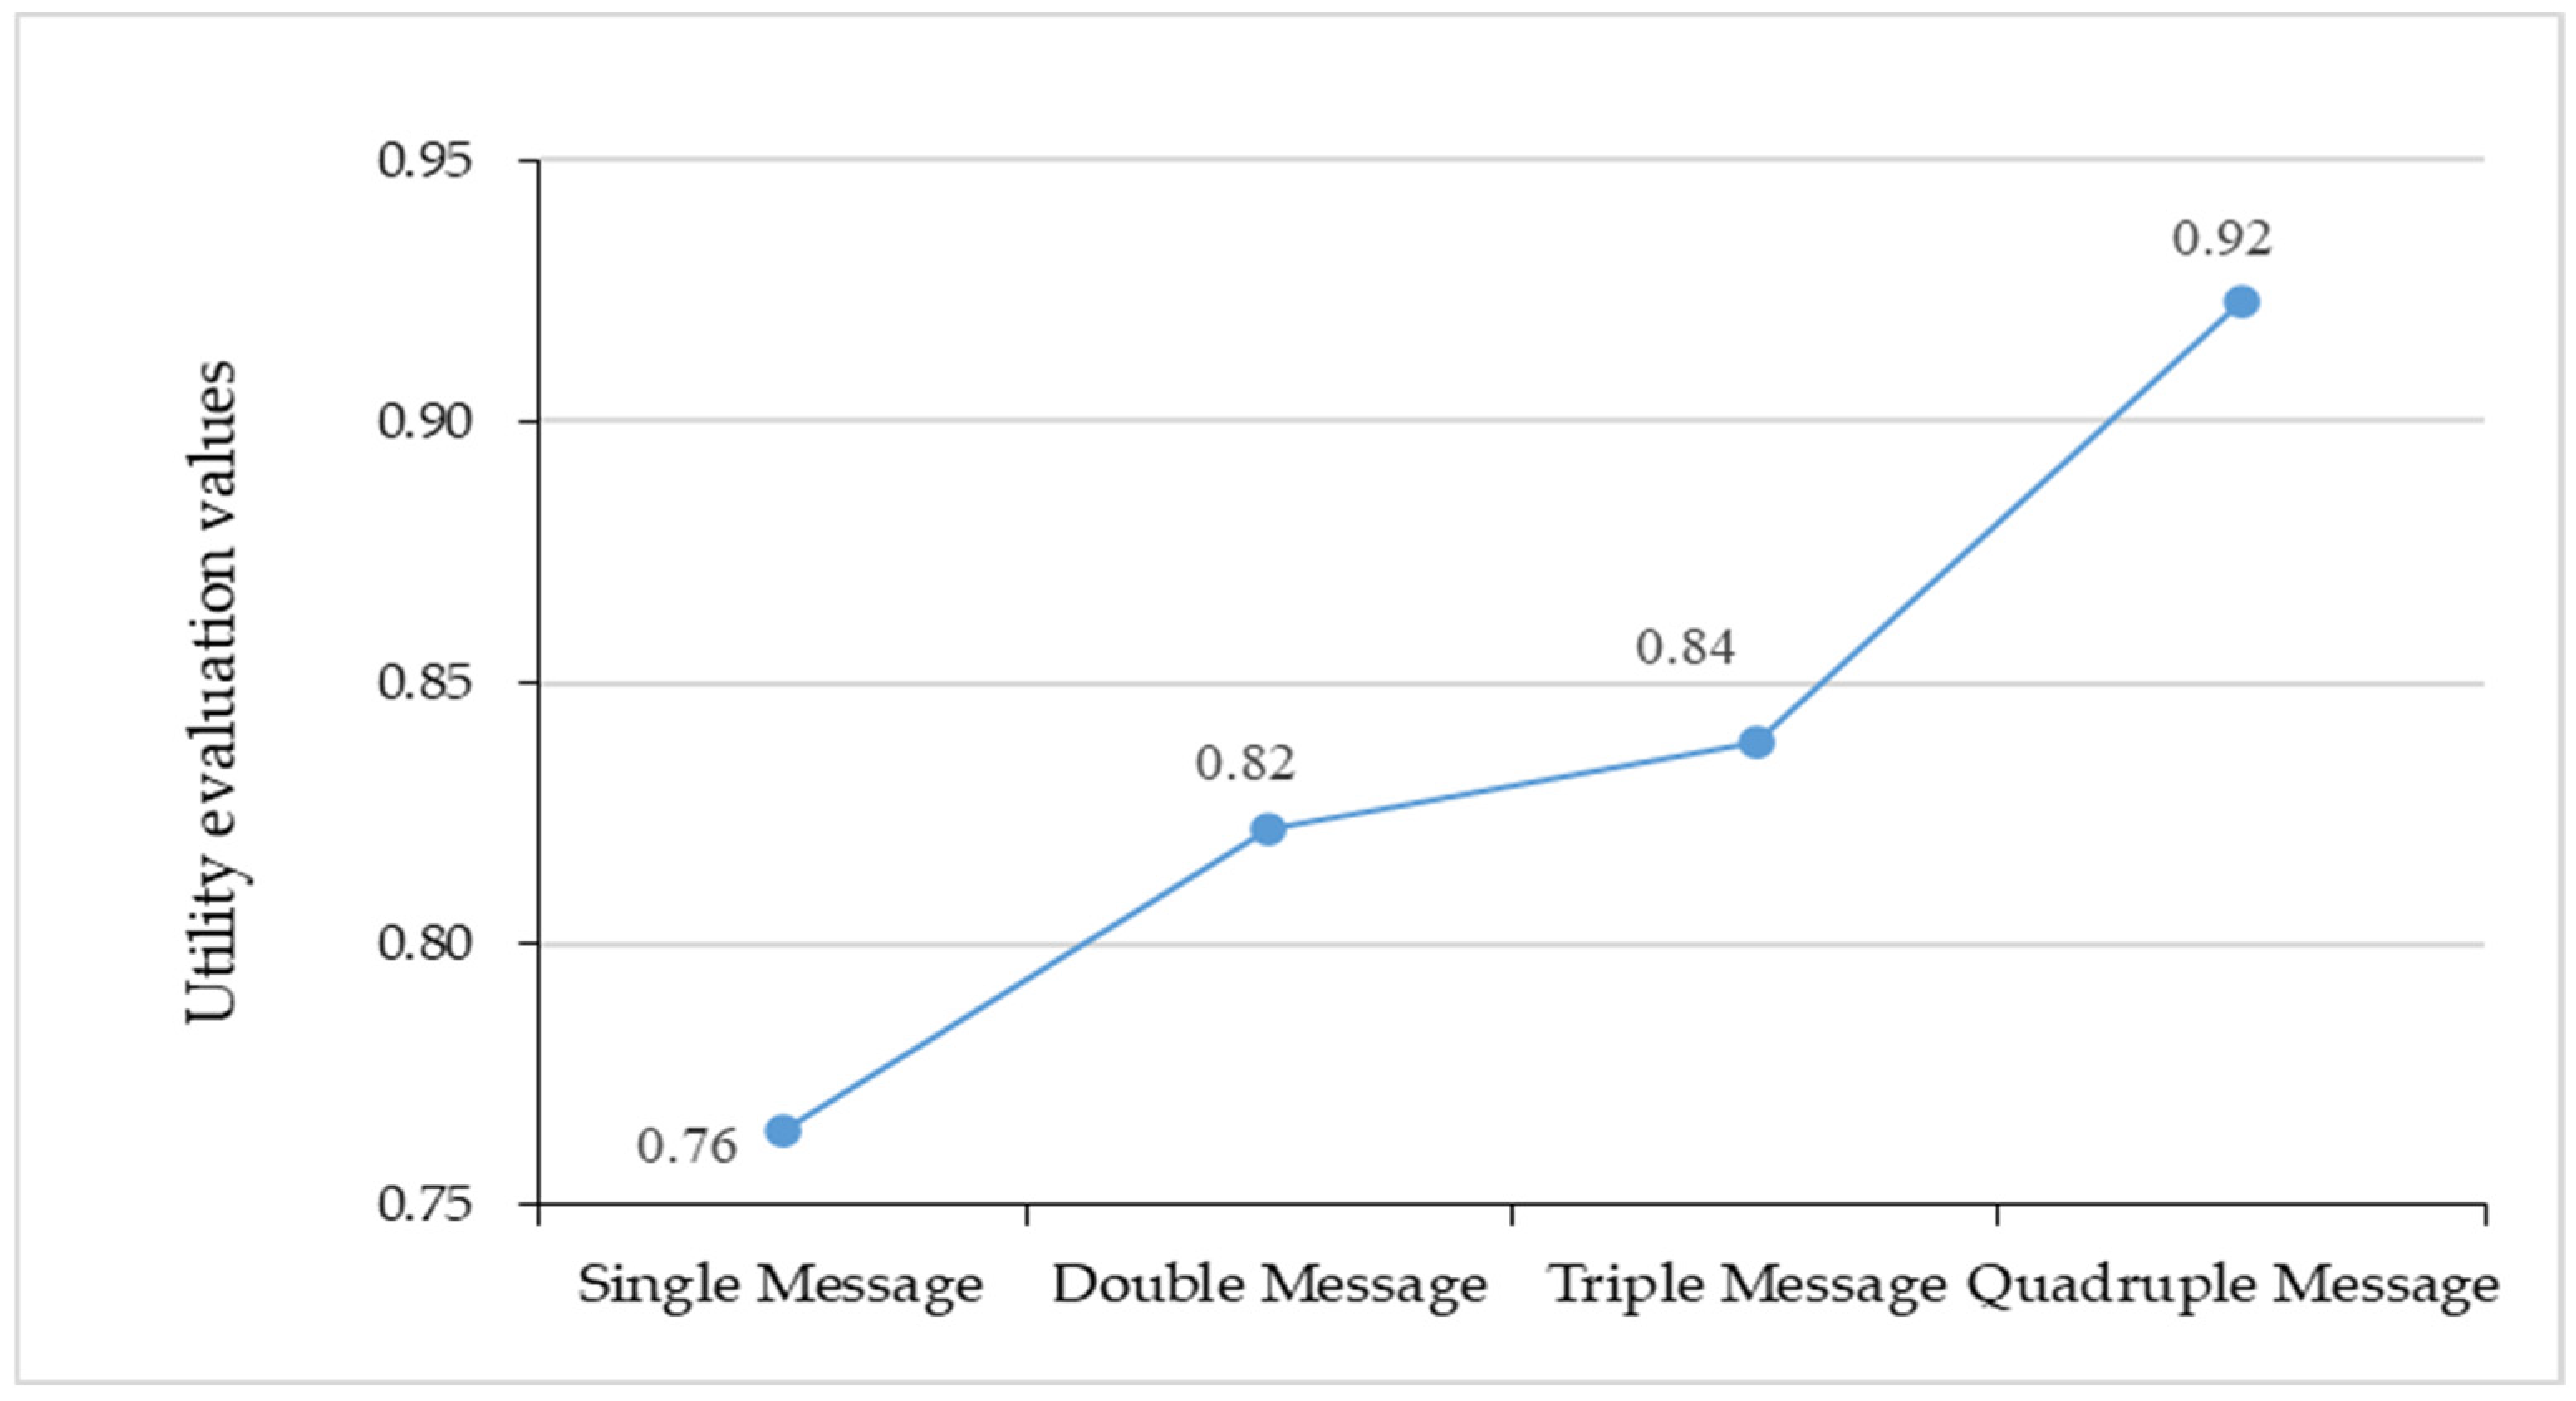
According to the construction steps of the gray near-optimal model, the comprehensive utility values of the four types of prompt messages were calculated, as shown in Figure 13.

Figure 13.
The utility evaluation results of four prompt messages.
The comprehensive utility values of the four types of prompt messages were 0.76, 0.82, 0.84, and 0.92, respectively. It should be noted that the closer the value of the near-optimal degree is to 1, the better the comprehensive performance of the scheme is (Ke et al., 2007) [42]. Obviously, with the enhancement of the level of detail of the prompt messages, the utility values of the prompt messages also increased. Compared with the Single Message, the utility values of the Double, Triple, and Quadruple Messages increased by 7.89%, 10.53%, and 21.92%, respectively. This result showed that the Quadruple Message, which included four-dimensional messages of distance, direction, road, and lane, played a better guidance role than the other three types of prompt messages.
4. Discussion
This study found that the drivers basically did not respond to the first sequential message, which may be because they thought it was too early to make deceleration preparation for the intersection ahead. However, the drivers had an obvious response to the second sequential message, which indicated that the sequential message triggered at 200 m upstream of the intersection can guide drivers in a timelier manner to take preparatory actions for passing the intersection in the current prompt timing combination. Ross and Brade (1993) [43] once pointed out that the appropriate timing of pushing notifications is critical to the acceptability and safety of a navigation system. The findings of this study revealed that there were some significant differences in the responses of drivers to the three sequential messages triggered at different timings. However, the current findings cannot explain which timing combination is appropriate at the typical intersection, so it will be further explored in a future study. In addition, the results indicated that the decrease in speed at S3 (the Second Broadcast, between −200 m and −100 m) was slower than that at the S4 (the Second Clear Interval, between −100 m and −50 m) and S5 (the Third Broadcast, between −50 m and 0 m), which may be due to different deceleration motivations. A previous study showed that the presence of auditory instructions imposes significant processing demands even under familiar conditions (Dalton et al., 2013) [14]. Other studies indicated that an obvious and often used adaptation to a demanding situation is to reduce driving speed (Jordan and Johnson 1993) [44]. Through these studies, it can be inferred that in the zone between −200 m and −100 m (i.e., S3), the drivers may have decreased their speed to better listen to and understand the navigation message. However, the distance between the vehicle and the intersection was less than 100 m in the zone between −100 m and 0 m (i.e., S4 and S5: the Second Clear Interval and the Third Broadcast), and the drivers’ decelerating behavior at this zone may have been aimed at reducing the speed to a level which is suitable for turning at intersections.
This study found that the drivers drove faster when they were guided by the Quadruple Message compared to the other three prompt messages at the zones near the intersection (i.e., the Second Clear Interval, the Third Broadcast, and the Turning), which might be because the Quadruple Message was very detailed. In this study, the Quadruple Message included four-dimensional instructions for distance, direction, road, and lane, which meant that the drivers could have a clear understanding of the road conditions and did not need to slow down to read traffic signs to obtain outside information. Thus, the speed at which the vehicle crossed the intersection was higher. The result of this study is consistent with that of another study on the complexity of auditory instructions (Dalton et al., 2013) [14]. In addition, it should be noted that no matter which prompt message was used, significant changes in acceleration all started at S3 (i.e., the Second Broadcast). However, the change trends for the four prompt messages had some differences, especially from S3 to S5 (S3: the Second Broadcast; S4: the Second Clear Interval; S5: the Third Broadcast). Specifically, the change in acceleration when using the Single and Double Messages was less smooth than that when using the Triple and Quadruple Messages (as shown in Figure 10). The reason may be that the prompt contents of the Single and Double Messages were relatively simple and failed to provide the drivers with detailed guidance information; in this situation, the drivers paid more attention to traffic signs and road conditions, and additional attention to the external environment may weaken the driver’s ability to control the accelerator and brake pedals, resulting in a more uneven change in acceleration.
This study found that before and after each broadcast, the change rates of speed and acceleration with the Single and Double Messages were greater than those with the Triple and Quadruple Messages in most cases. Compared with the Triple and Quadruple Messages, the Single and Double Messages did not contain distance instructions. Cognitive psychology provides strong evidence that humans have difficulties in accurately estimating distances in space (Norman et al., 2015) [45]. With the limitation in distance cognition and the fact that the prompt messages did not give information regarding distance, the drivers might have lacked a clear perception of the distance between the vehicle and the intersection. Another study found that in hazardous situations, drivers decelerated more clearly without navigation instructions than with navigation instructions (Platten et al., 2013) [46], and this was mainly due to the fact that drivers had less complete perceptions in hazardous situations when there were no navigation instructions, and thus, they are more conscious of decelerating to avoid hazards. Similarly, in this study, under the guidance of the Single and Double Messages, the drivers had no accurate estimate of the distance between the vehicle and the intersection. Therefore, the drivers showed a stronger deceleration response to the navigation information to avoid missing a turn or failing to decelerate to a suitable speed for turning when arriving at the turning zone.
The evaluation results showed that the Single Message only including direction instruction had the smallest utility value. Compared to the Single Message, the Double Message added road information, the Triple Message added distance and road instructions, and the Quadruple Message added distance, road, and lane instructions, and the utility values of these three prompt messages increased by 7.89%, 10.53%, and 21.92%, respectively. In other words, the utility values of the four types of prompt messages increased with the increase in the amount of information. This finding of the study implies that the vehicle control and navigation instruction followed did not cause cognitive overload in the research scenario, so the driving performance improved with the increase in the amount of information in the navigation voice prompt. However, it should be noted that in certain complex driving scenarios with higher attention demands, additional navigation information can lead to information overload and therefore render a marginal gain or even reduction in utility.
5. Conclusions
To systematically explore the effects of the amount of information from navigation voice prompts on driving performance and further quantify the utility of voice prompts, four types of prompt messages with different amounts of information were designed, and a driving simulation experiment was conducted to obtain driving behavior data. ANOVA and KW tests were used to identify the differences in driving performance (such as velocity and acceleration in the whole zone and each subzone) following four types of prompt messages. Eight evaluation indicators measuring driving efficiency, driving safety, driver’s response smoothness, and driver’s response consistency were selected, and the gray near-optimal method was further used to evaluate the utility of the four types of prompt messages. The conclusions of this study are as follows:
- (1)
- The four types of navigation prompt messages all began to take effect at about 200 m upstream of the stop bar.
- (2)
- The differences between the four types of prompt messages were more significant in the zone which started at 100 m upstream and ended at 100 m downstream of the stop bar of the intersection.
- (3)
- Drivers following the guidance of the Single and Double Messages exhibited more powerful deceleration than those following the guidance of the Triple and Quadruple Messages.
- (4)
- The utility values of the four types of prompt messages increased with the increase in the amount of information from the navigation voice guidance.
This study has significant theoretical and practical implications. From a theoretical perspective, this study explored the effects of the amount of information from navigation voice guidance on driving performance in detail, which lays theoretical foundations for further exploring the influence mechanism of navigation information. Additionally, this study formed an integrated research framework on navigation voice information from indicator selection to impact analysis and quantitative evaluation, which can provide references for studying other in-vehicle information systems in the future. From a practical perspective, this study determined the utility of four prompt messages with different amounts of information, which provides valuable guidance for optimizing the prompt contents of navigation voice information at general intersections. Furthermore, this study revealed the differences in the effectiveness of the four prompt messages, which can provide references for establishing navigation voice prompt guidelines, further improving the service quality of navigation systems.
This study took general intersections as an example to compare the differences in driving performance when following four types of prompt messages with different amounts of information. The findings of this study may be different from those in certain complex driving scenarios. In a future study, we will take some complex driving scenarios (such as roundabouts and multiple exit roads) as examples and further explore the effects of more detailed (e.g., five-fold and six-fold) messages on driving performance to broaden the understanding of the effects of navigation voice information. In addition, this study mainly focused on the amount of information from the navigation voice prompt. The correctness of prompt messages is also a very noteworthy aspect, which is the basic requirement that navigation information should satisfy. In the future study, we will compare navigation information with the road information in traffic scenes where drivers often make wrong turns or miss turns, identify the traffic scenes with inaccurate navigation messages, build a spatial distribution map of the inaccurate navigation messages, and further determine navigation message optimization nodes of the whole road network.
Author Contributions
Conceptualization, X.Z.; Methodology, M.Z.; Formal analysis, L.Y.; Writing—original draft, L.Y.; Writing—review & editing, Y.B.; Project administration, Y.B.; Funding acquisition, X.Z. and Y.G. All authors have read and agreed to the published version of the manuscript.
Funding
This study was sponsored by the Inovative Team Project of Jinan Government (Grant no. 202333036); the State Key Laboratory of Automotive Safety and Energy under Project (Grant no. KF2017) and the Shandong Natural Science Foundation of China (Grant no. ZR2021QF110).
Institutional Review Board Statement
The study was conducted in accordance with the Declaration of Helsinki, and approved by the Ethics Committee of Science and Technology, BEIJING UNIVERSITY OF TECHNOLOGY (protocol code BJUT-ECST-0126 and date of approval 12 July 2021).
Informed Consent Statement
Informed consent was obtained from all subjects involved in the study.
Data Availability Statement
The data presented in this study are available on request from the corresponding author.
Conflicts of Interest
All authors in the author list have no conflicts of interest, financial or otherwise.
References
- Yared, T.; Patterson, P.; All, E. Are safety and performance affected by navigation system display size, environmental illumination, and gender when driving in both urban and rural areas? Accid. Anal. Prev. 2020, 142, 105585. [Google Scholar] [CrossRef] [PubMed]
- Zhong, Q.; Guo, G.; Zhi, J. Address inputting while driving: A comparison of four alternative text input methods on in-vehicle navigation displays usability and driver distraction. Traffic Inj. Prev. 2022, 23, 163–168. [Google Scholar] [CrossRef] [PubMed]
- Geographic Information Industry Association. The Internet Map Application of China Cover More than 1 Billion Users Every Day. 2022. Available online: https://baijiahao.baidu.com/s?id=1742503727539660457&wfr=spider&for=pc (accessed on 6 June 2024).
- Chen, C.F.; Chen, P.C. Applying the tam to travelers’ usage intentions of GPS devices. Expert Syst. Appl. 2011, 38, 6217–6221. [Google Scholar] [CrossRef]
- Jamson, A.H.; Merat, N. Surrogate in-vehicle information systems and driver behaviour: Effects of visual and cognitive load in simulated rural driving. Transp. Res. Part F Traffic Psychol. Behav. 2005, 8, 79–96. [Google Scholar] [CrossRef]
- Yuan, W.; Fu, R.; Guo, Y.; Ma, Y. Fuzzy clustering evaluation method for driver’s visual search mode. China J. Highw. Transp. 2011, 24, 103–108. [Google Scholar]
- Jensen, B.S.; Skov, M.B.; Thiruravichandran, N. Studying driver attention and behaviour for three configurations of GPS navigation in real traffic driving. In Proceedings of the 28th International Conference on Human Factors in Computing Systems, New York, NY, USA, 10 April 2010. [Google Scholar]
- Zhu, T.; Wu, L.; Lu, Q. Effects of in-vehicle information on driver eye blink duration and workload. J. Southwest Jiaotong Univ. 2015, 50, 504–510. [Google Scholar]
- Hu, L. Research on the Influence of Navigation Function of Smart Phone on Driving Performance. Master’s Thesis, Chang’an University, Xi’an, China, 2017. [Google Scholar]
- Yun, M.; Zhao, J.; Zhao, J.; Weng, X.; Yang, X. Impact of in-vehicle navigation information on lane-change behavior in urban expressway diverge segments. Accid. Anal. Prev. 2017, 106, 53–66. [Google Scholar] [CrossRef] [PubMed]
- Yared, T.; Patterson, P.; Mumani, A. Distraction and Visual Search Characteristics of Young Drivers When Using Navigation System Displays. J. Eng. Res. 2023; in press. [Google Scholar] [CrossRef]
- Xu, Y.; Fan, H.; Li, Y. Health assessment of neurological disorders patients and driving restrictions. J. Beijing Sport Univ. 2006, 29, 1513–1515. [Google Scholar]
- Wickens, C.D. Multiple resources and performance prediction. Theor. Issues Ergon. Sci. 2002, 3, 159–177. [Google Scholar] [CrossRef]
- Dalton, P.; Agarwal, P.; Fraenkel, N.; Baichoo, J.; Masry, A. Driving with navigational instructions: Investigating user behaviour and performance. Accid. Anal. Prev. 2013, 50, 298–303. [Google Scholar] [CrossRef]
- Moldenhauer, D.; McCrickard, S. Effect of Information Modality on Geographic Cognition in Car Navigation Systems; Center for HCI and Department of Computer Science, Virginia Tech University: Blacksburg, VA, USA, 2003. [Google Scholar]
- Large, D.R.; Burnett, G.E. The effect of different navigation voices on trust and attention while using in-vehicle navigation systems. J. Saf. Res. 2014, 49, 69.e1–75. [Google Scholar] [CrossRef] [PubMed]
- Tversky, A.; Kahneman, D. Availability: A heuristic for judging frequency and probability. Cogn. Psychol. 1973, 5, 207–232. [Google Scholar] [CrossRef]
- Wu, C.F.; Huang, W.F.; Wu, T.C. A Study on the design of voice navigation of car navigation system. In Proceedings of the 13th International Conference on Human-Computer Interaction, San Diego, CA, USA, 19–24 July 2009. [Google Scholar]
- Lerman, J. Study design in clinical research: Sample size estimation and power analysis. Can. J. Anaesth. 1996, 43, 184–191. [Google Scholar] [CrossRef] [PubMed]
- Chow, S.C.; Shao, J.; Wang, H.; Lokhnygina, Y. Sample Size Calculations in Clinical Research; Chapman and Hall/CRC: Boca Raton, FL, USA, 2017. [Google Scholar]
- Zhao, X.; Zhang, X.; Rong, J.; Ma, J. Identifying method of drunk driving based on driving behavior. Int. J. Comput. Intell. Syst. 2011, 4, 361–369. [Google Scholar]
- Ding, H.; Zhao, X.; Rong, J.; Ma, J. Experimental research on the effectiveness of speed reduction markings based on driving simulation: A case study. Accid. Anal. Prev. 2013, 60, 211–218. [Google Scholar] [CrossRef]
- Zhao, X.; Guan, W.; Liu, X. A Pilot Study Verifying How the Curve Information Impacts on the Driver Performance with Cognition Model. Discret. Dyn. Nat. Soc. 2013, 2013, 316896. [Google Scholar] [CrossRef]
- Wang, Z.; Shao, C.; Rong, J.; Zhou, J. Analysis of traffic flow characteristics and states of urban arterial street in Beijing. J. Transp. Inf. Saf. 2008, 27, 155–159. [Google Scholar]
- GB5768-2009; The State Standard of the P.R. China: Road Signs and Markings. AQSIQ & SA: Beijing, China, 2009. Available online: http://www.doc88.com/p-3701701707998.html (accessed on 26 May 2021).
- Lee, W.-C.; Cheng, B.-W. Effects of using a portable navigation system and paper map in real driving. Accid. Anal. Prev. 2008, 40, 303–308. [Google Scholar] [CrossRef]
- Wu, H.; Lin, C.; Chien, T. Effects of e-map format and sub-window on navigation performance and glance behavior. In Proceedings of the World Congress on Ergonomics, Beijing, China, 9–14 August 2009. [Google Scholar]
- Jeong, C.; Kim, B.; Yu, S.; Suh, D.; Kim, M.; Suh, M. In-vehicle display HMI safety evaluation using a driving simulator. Int. J. Automot. Technol. 2013, 14, 987–992. [Google Scholar] [CrossRef]
- Liu, Y.C.; Wen, M.H. Comparison of head-up display (HUD) vs. head-down display (HDD): Driving performance of commercial vehicle operators in Taiwan. Int. J. Hum. Comput. Stud. 2004, 61, 679–697. [Google Scholar] [CrossRef]
- Jahn, G.; Oehme, A.; Krems, J.F.; Gelau, C. Peripheral detection as a workload measure in driving: Effects of traffic complexity and route guidance system use in a driving study. Transp. Res. Part F Traffic Psychol. Behav. 2005, 8, 255–275. [Google Scholar] [CrossRef]
- Lavie, T.; Oron-Gilad, T.; Meyer, J. Aesthetics and usability of in-vehicle navigation displays. Int. J. Hum. Comput. Stud. 2011, 69, 80–99. [Google Scholar] [CrossRef]
- Lee, W.-C.; Cheng, B.-W. Comparison of portable and onboard navigation system for the effects in real driving. Saf. Sci. 2010, 48, 1421–1426. [Google Scholar] [CrossRef]
- Uang, S.-T.; Hwang, S.-L. Effects on driving behavior of congestion information and of scale of in-vehicle navigation systems. Transp. Res. Part C Emerg. Technol. 2003, 11, 423–438. [Google Scholar] [CrossRef]
- Zhang, J.; Suto, K.; Fujiwara, A. Effects of in-vehicle warning information on drivers’ decelerating and accelerating behaviors near an arch-shaped intersection. Accid. Anal. Prev. 2009, 41, 948–958. [Google Scholar] [CrossRef]
- Yang, B.; Li, W.; Li, G.; Liu, L.; Fan, Y.; Shi, L. Highway safety evaluation based on vehicle running state. J. Highw. Transp. Res. Dev. (Appl. Tech. Ed.) 2018, 6, 285–288. [Google Scholar]
- Nakayama, O.; Futami, T.; Nakamura, T.; Boer, E.R. Development of a steering entropy method for evaluating driver workload. J. Passeng. Cars 1999, 108, 1686–1695. [Google Scholar]
- Rizzardo, C.A.; Colle, H.A. Dual-coded advisory turn indicators for GPS navigational guidance of surface vehicles: Effects of map orientation. Hum. Factors 2013, 55, 935–945. [Google Scholar] [CrossRef]
- Zhu, L. Evaluation method of urban public transport development based on grey near optimization. J. Heilongjiang Inst. Technol. 2023, 37, 25–33. [Google Scholar]
- Huang, L.; Zhao, X.; Li, Y.; Rong, J. Optimal setting methods of complex diagrammatic guide signs on urban expressway. China J. Highw. Transp. 2018, 31, 139–146. [Google Scholar]
- Wang, K. Optimization Method of Road Traffic Safety Facilities under the Effects of Visibility. Ph.D. Thesis, Hefei University of Technology, Hefei, China, 2019. [Google Scholar]
- Yang, L.; Bian, Y.; Zhao, X.; Ma, J.; Wu, Y.; Chang, X.; Liu, X. Experimental research on the effectiveness of navigation prompt messages based on a driving simulator: A case study. Cogn. Technol. Work 2020, 23, 439–458. [Google Scholar] [CrossRef]
- Ke, H.; Chen, Y.; Xia, B. A multi-objective decision-making algorithm based on approximation to ideal grey relational projection. Acta Electron. Sin. 2007, 35, 1757–1761. [Google Scholar]
- Ross, T.; Brade, S. An empirical study to determine guidelines for optimum timing of route guidance instructions. In Proceedings of the IEE Colloquium on Design of the Driver Interface, London, UK, 19 January 1995. [Google Scholar]
- Jordan, P.W.; Johnson, G.I. Vision in Vehicles-IV; Elsevier: Amsterdam, The Netherlands, 1993. [Google Scholar]
- Norman, J.F.; Adkins, O.C.; Pedersen, L.E.; Reyes, C.M.; Wulff, R.A.; Tungate, A. The visual perception of exocentric distance in outdoor settings. Vis. Res. 2015, 117, 100–104. [Google Scholar] [CrossRef]
- Platten, F.; Milicic, N.; Schwalm, M.; Krems, J. Using an infotainment system while driving—A continuous analysis of behavior adaptations. Transp. Res. Part F Traffic Psychol. Behav. 2013, 21, 103–112. [Google Scholar] [CrossRef]

Disclaimer/Publisher’s Note: The statements, opinions and data contained in all publications are solely those of the individual author(s) and contributor(s) and not of MDPI and/or the editor(s). MDPI and/or the editor(s) disclaim responsibility for any injury to people or property resulting from any ideas, methods, instructions or products referred to in the content. |
© 2024 by the authors. Licensee MDPI, Basel, Switzerland. This article is an open access article distributed under the terms and conditions of the Creative Commons Attribution (CC BY) license (https://creativecommons.org/licenses/by/4.0/).