
Dynamic Spatio-Temporal Simulation of Land Use and Ecosystem Service Value Assessment in Agro-Pastoral Ecotone, China

Abstract
1. Introduction
2. Study Area and Data Sources
2.1. Study Area
2.2. Data Sources and Processing
3. Methodology
3.1. The Calculation of ESV Based on ESV Equivalent Factor Method
3.2. Analysis of Spatial Auto-Correlation
3.3. Future LUCC Simulation under Different Scenarios
3.3.1. Parameter Setting and Accuracy Validation of PLUS Model
3.3.2. Future Differentiation Scenario Settings
- (1)
- Business As Usual scenario (BAU): In this scenario, the land use data of 2005 and 2020 are used to predict the LUCC of the agro-pastoral ecotone in 2035 by the Markov model.
- (2)
- Priority of Cropland Development scenario (PCD): Under this scenario, based on the Markov model prediction, the transfer probability of grassland and unused land to cropland increases by 30%, and the transfer probability of forest to cropland increases by 15%. The transfer probability of grassland and unused land to construction land increases by 15%. Additionally, cropland retention amount increases by 5%.
- (3)
- Priority of Grassland Development scenario (PGD): Under this scenario, based on the Markov model prediction, the transfer probability of cropland and unused land to grassland increases by 30%, the transfer probability of forest to grassland increases by 15%, and grassland retention amount increases by 10%.
4. Result
4.1. Evolution Trend of LUCC in Agro-Pastoral Ecotone
4.1.1. Spatial–Temporal Changes in LUCC from 2000 to 2020
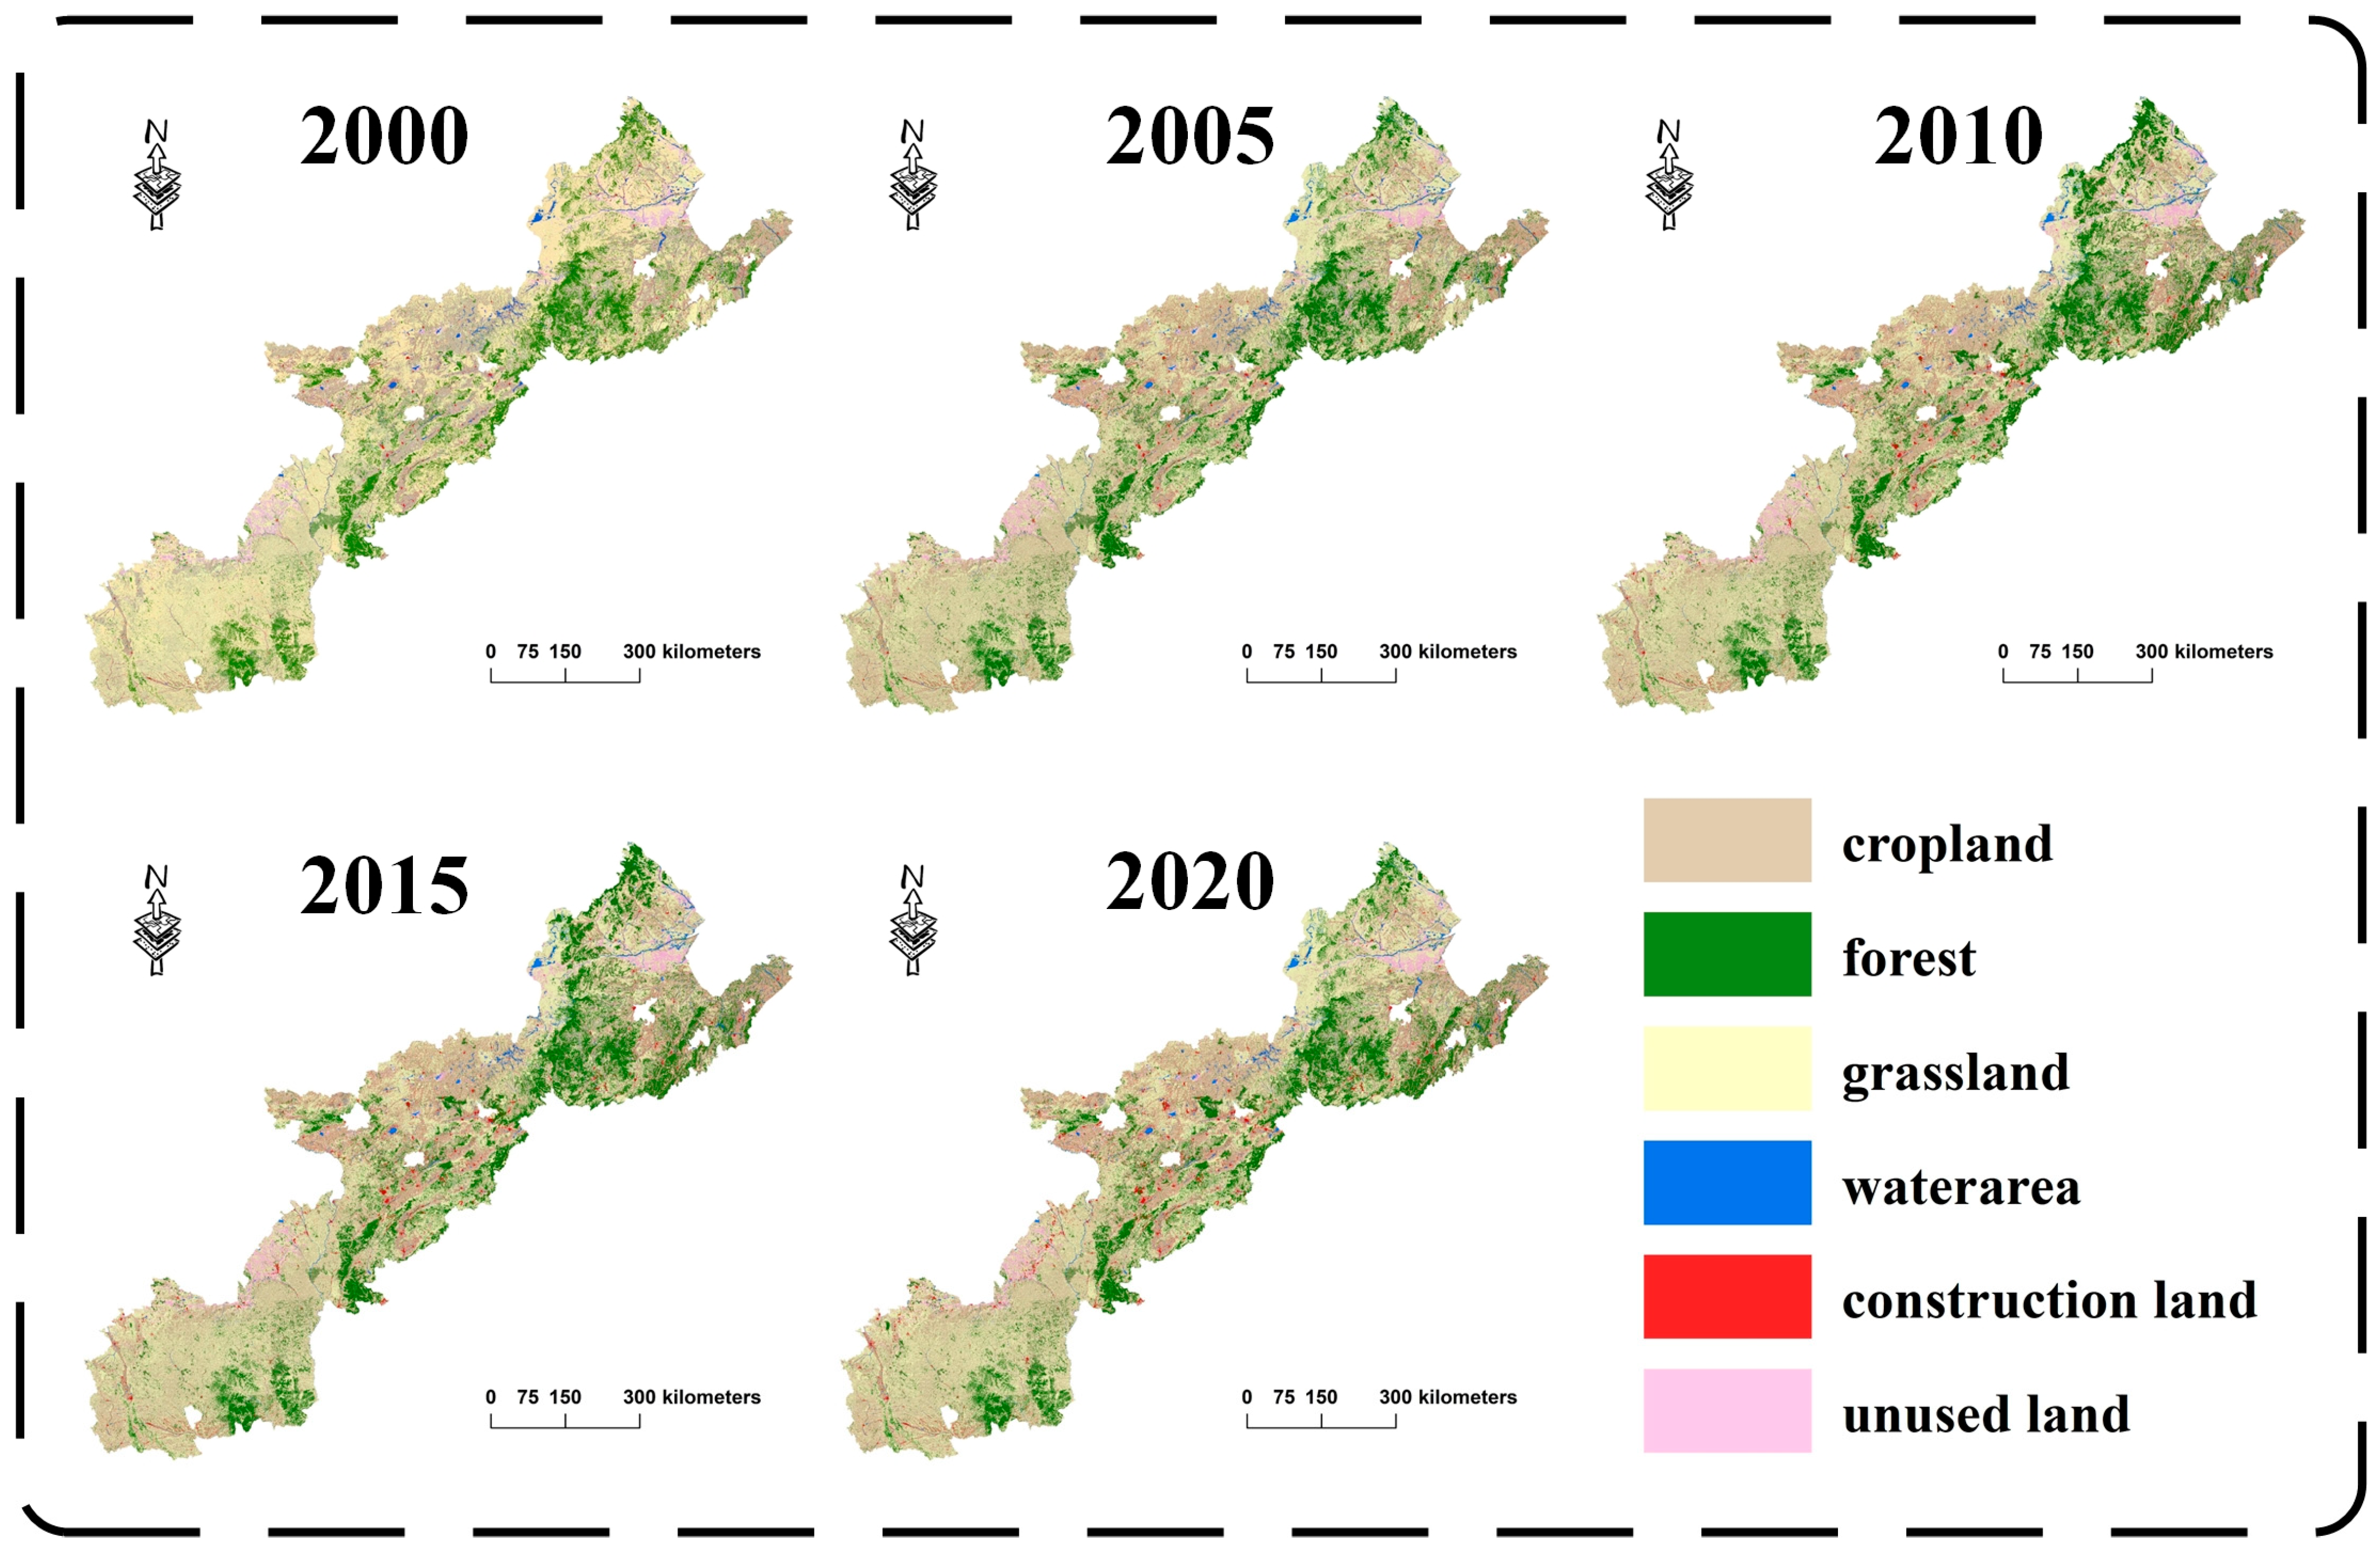
- The spatial and temporal changes in LUCC from 2000 to 2020 are depicted in Figure 4. Overall, during the past two decades, the cropland area exhibited a significant downward trend (9852.20 km2, p < 0.01). Both the forest and water areas initially decreased and then showed an increasing trend. The area of unused land decreased significantly (2942.33 km2, p < 0.05) while the grassland area changed gently. The conversion of land use in the agro-pastoral ecotone is mainly influenced by the Grain for Green Project and the implementation of the “Three-North Shelterbelt” System Construction Project. Specifically, the regional forest area increased from 82,101.66 km2 to 89,732.11 km2. The water area increased from 8757.18 km2 in 2000 to 881.68 km2 in 2015, and then decreased to 8722.24 km2. In addition, rapid economic development and intense urbanization processes resulted in a substantial increase in construction land, which showed a significant increasing trend (5753.95 km2, p < 0.01), reflecting a 65.30% increase compared to 2000.
4.1.2. Validation and Simulation of LUCC under Different Scenarios in 2035
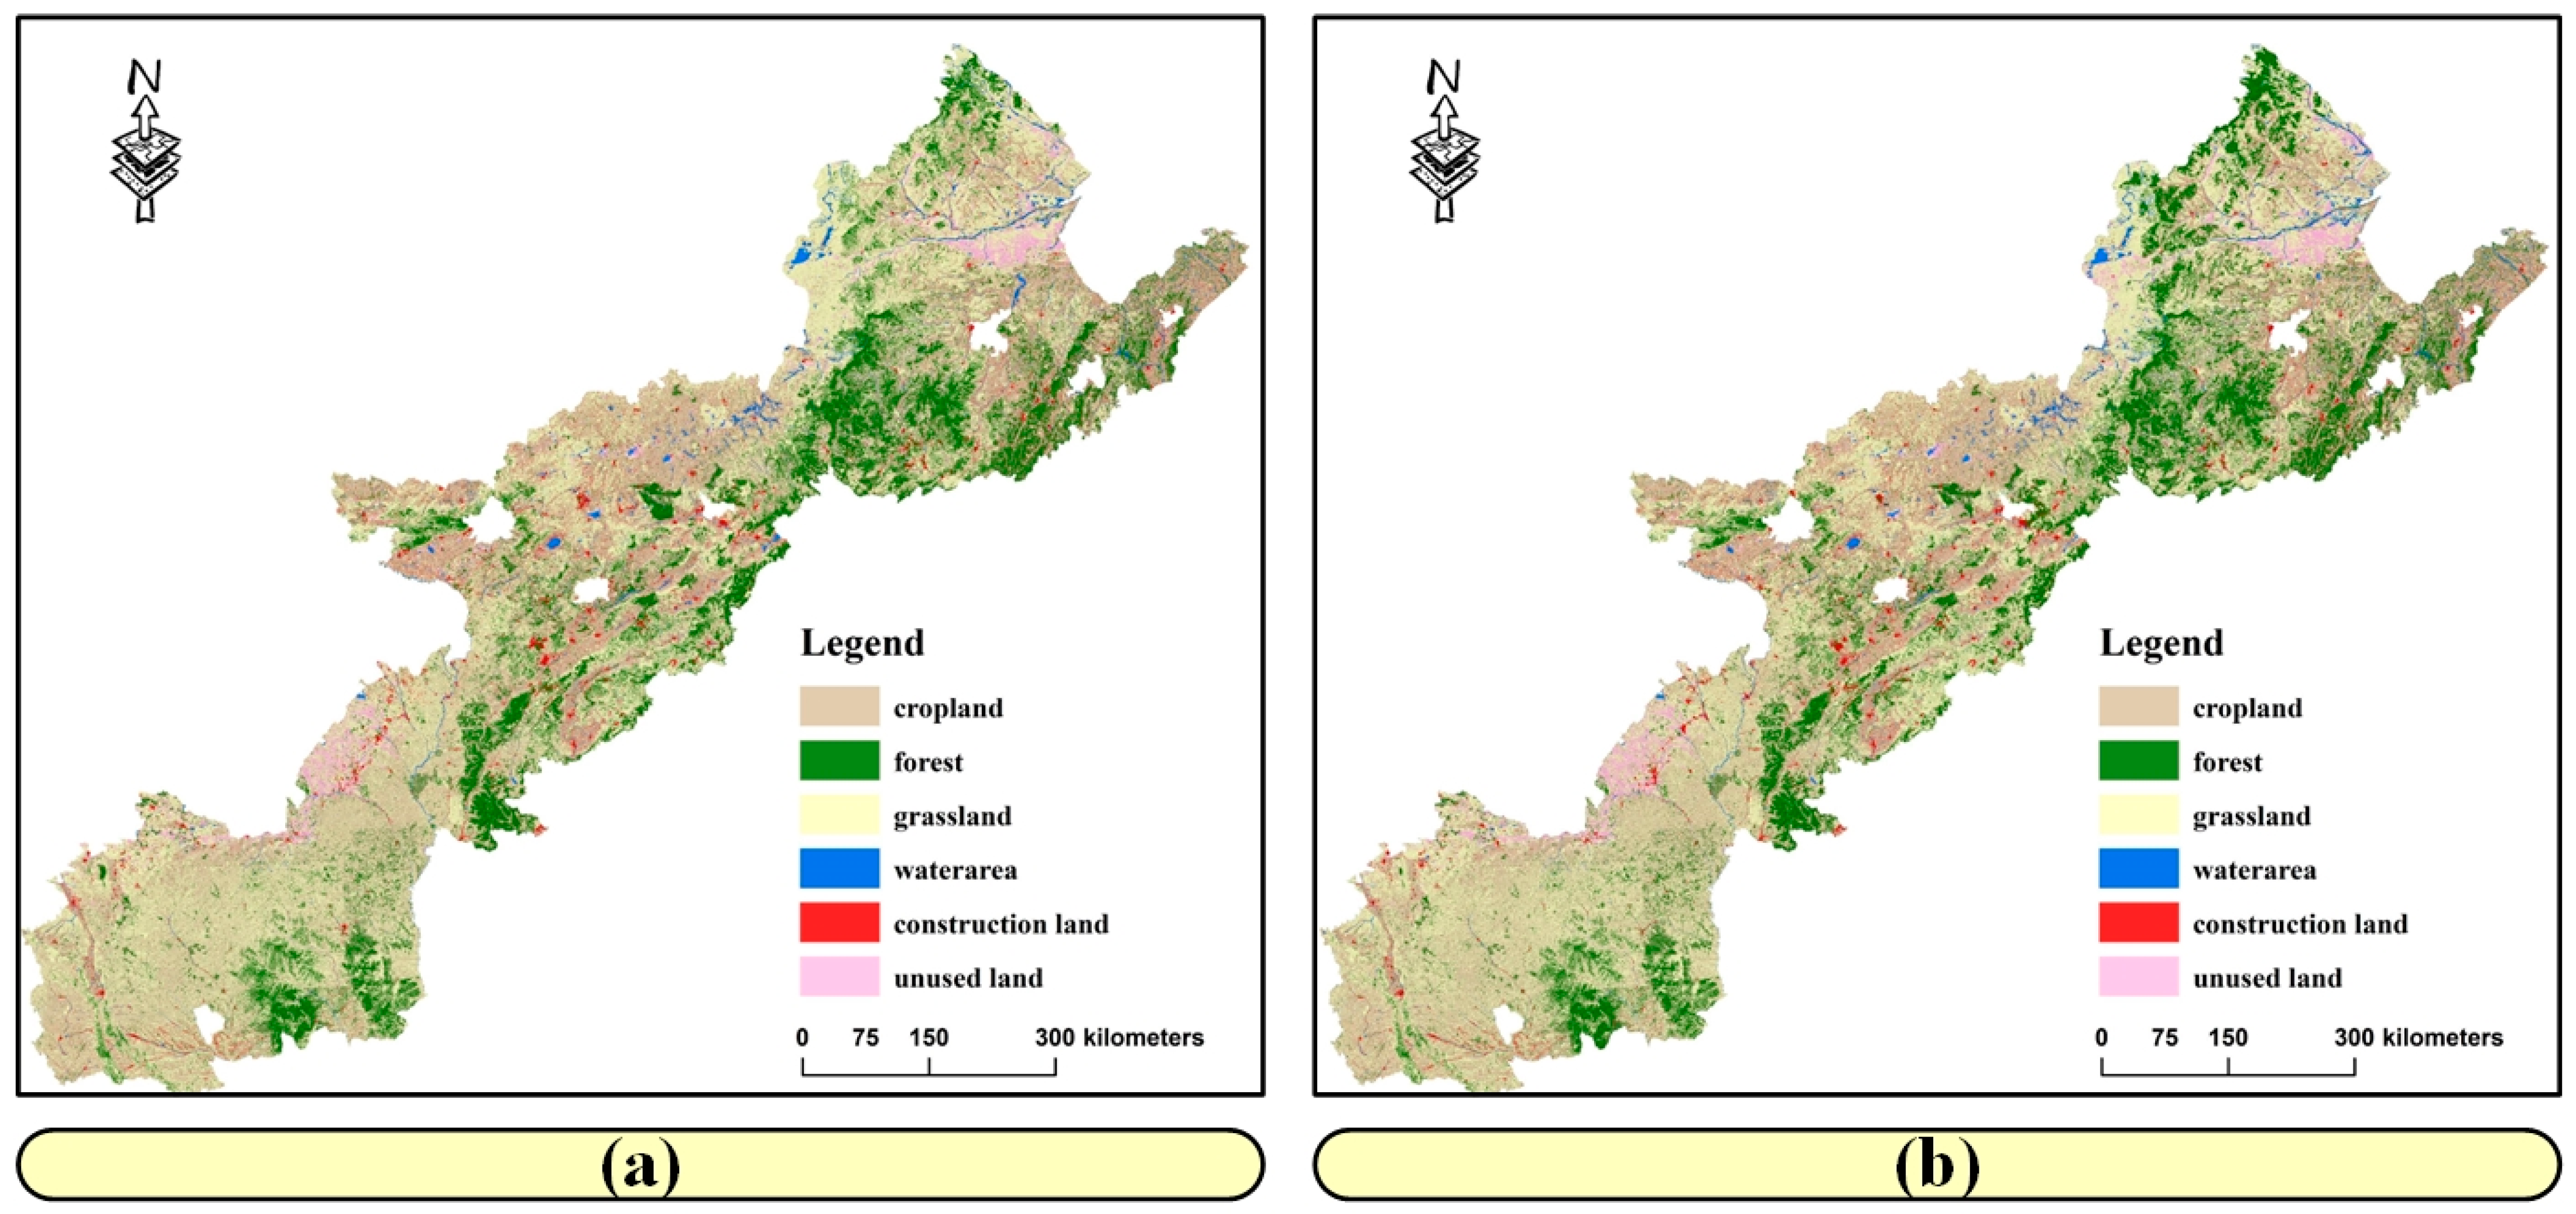
- Based on the land use data from 2010 and 2015, the PLUS model and Markov model were adopted to simulate the land use in 2020 and compare with the actual situation, as shown in Figure 5. The results demonstrated a kappa coefficient of 0.9326 (p < 0.01), indicating a very high simulation accuracy, validating the models’ competency for future LUCC simulations.
- Futural LUCC under different development scenarios was simulated by the PLUS model, as shown in Figure 6. The results showed that under the PCD scenario, the regional cropland area increased by 3962.28 km2 (2.54%) compared with 2020. Conversely, the grassland area decreased by 6072.80 km2 (3.33%) and the unused land decreased by 770.53 km2 (5.78%). Notably, under the PCD scenario, construction land increased by 1548.08 km2. This increase is attributed to the expansion of cropland, which can support a larger population and further stimulate economic development and urbanization. Under the BAU scenario, LUCC followed the previous development trend. Cropland will rapidly decrease by 8486.02 km2, while grassland and construction land will increase by 5948.81 km2 and 5727.56 km2, respectively. This scenario aligns with the development of circular agriculture proposed in the Guiding. Although grassland grew rapidly in this scenario, it ultimately reduced by 2346.48 km2. In the PGD scenario, the area of grassland increased rapidly (12,524.43 km2 compared with 2020). Meanwhile, the area of cropland decreased by 4783.13 km2 and the unused land decreased by 603.49 km2.
- According to the string diagram of land use transfer, the growth of cropland mainly comes from grassland under the PCD scenario. In addition, a large area of grassland was converted to forest, indicating that in order to protect regional ecological security, forest will further occupy grassland. Under the BAU scenario, there were notable interactions between cropland, grassland, and forest. The expansion of construction land mainly came from the encroachment of cropland. In the PDG scenario, the increase in the grassland area was mainly at the expense of the cropland and forest areas.
4.2. Evolution Trend of ESV in Agro-Pastoral Ecotone
4.2.1. Spatial–Temporal Changes in ESV from 2000 to 2020
- A 900 m scale regional grid was established, and the land use types within each grid in the region were statistically analyzed, as shown in Figure 7. Consequently, the ESV within each grid was calculated, respectively. From 2000 to 2020, the total ESV of the agro-pastoral ecotone exhibited a trend of an initial increase followed by a decrease. In 2000, the total value of ESV was CNY 8194.74 million. The highest value was recorded in 2005, with a total ESV of CNY 8207.99 million. In 2020, the total value of ESV was CNY 8195.13 million. From 2000 to 2005, the total ESV increased by CNY 13.24 million, followed by a decline of CNY 12.86 million from 2005 to 2020. In general, the ecosystem service value of the different land use types followed the trend of grassland > water area > forest > cropland > unused land. The ESV of grassland and water area accounted for more than 68% of the total value and constituted an important part of the ESV of the agro-pastoral ecotone. From a spatial perspective, the high-ESV areas were mainly distributed in the northern part of Inner Mongolia and the western part of Liaoning Province, showing a high degree of synergy with grassland distribution.
- The different aspects of ESV are illustrated in Figure 8. The largest single ecosystem service is hydrological regulation (CNY 327.75 billion on average), followed by climate regulation (CNY 151.42 billion on average). These results indicate that hydrological regulation and climate regulation are crucial components of ecosystem services, accounting for approximately 58.40% of the total ESV. Food production showed a significant downward trend (CNY 20.02 billion, p < 0.01), strongly correlated with the decrease in cropland. Maintaining biodiversity averaged CNY 72.17 billion, accounting for 8.8% of the total value. The aesthetic landscape is CNY 33.09 billion, also constituting an important part of the agro-pastoral ecotone.
4.2.2. ESV Evolution under Different Scenarios in 2035
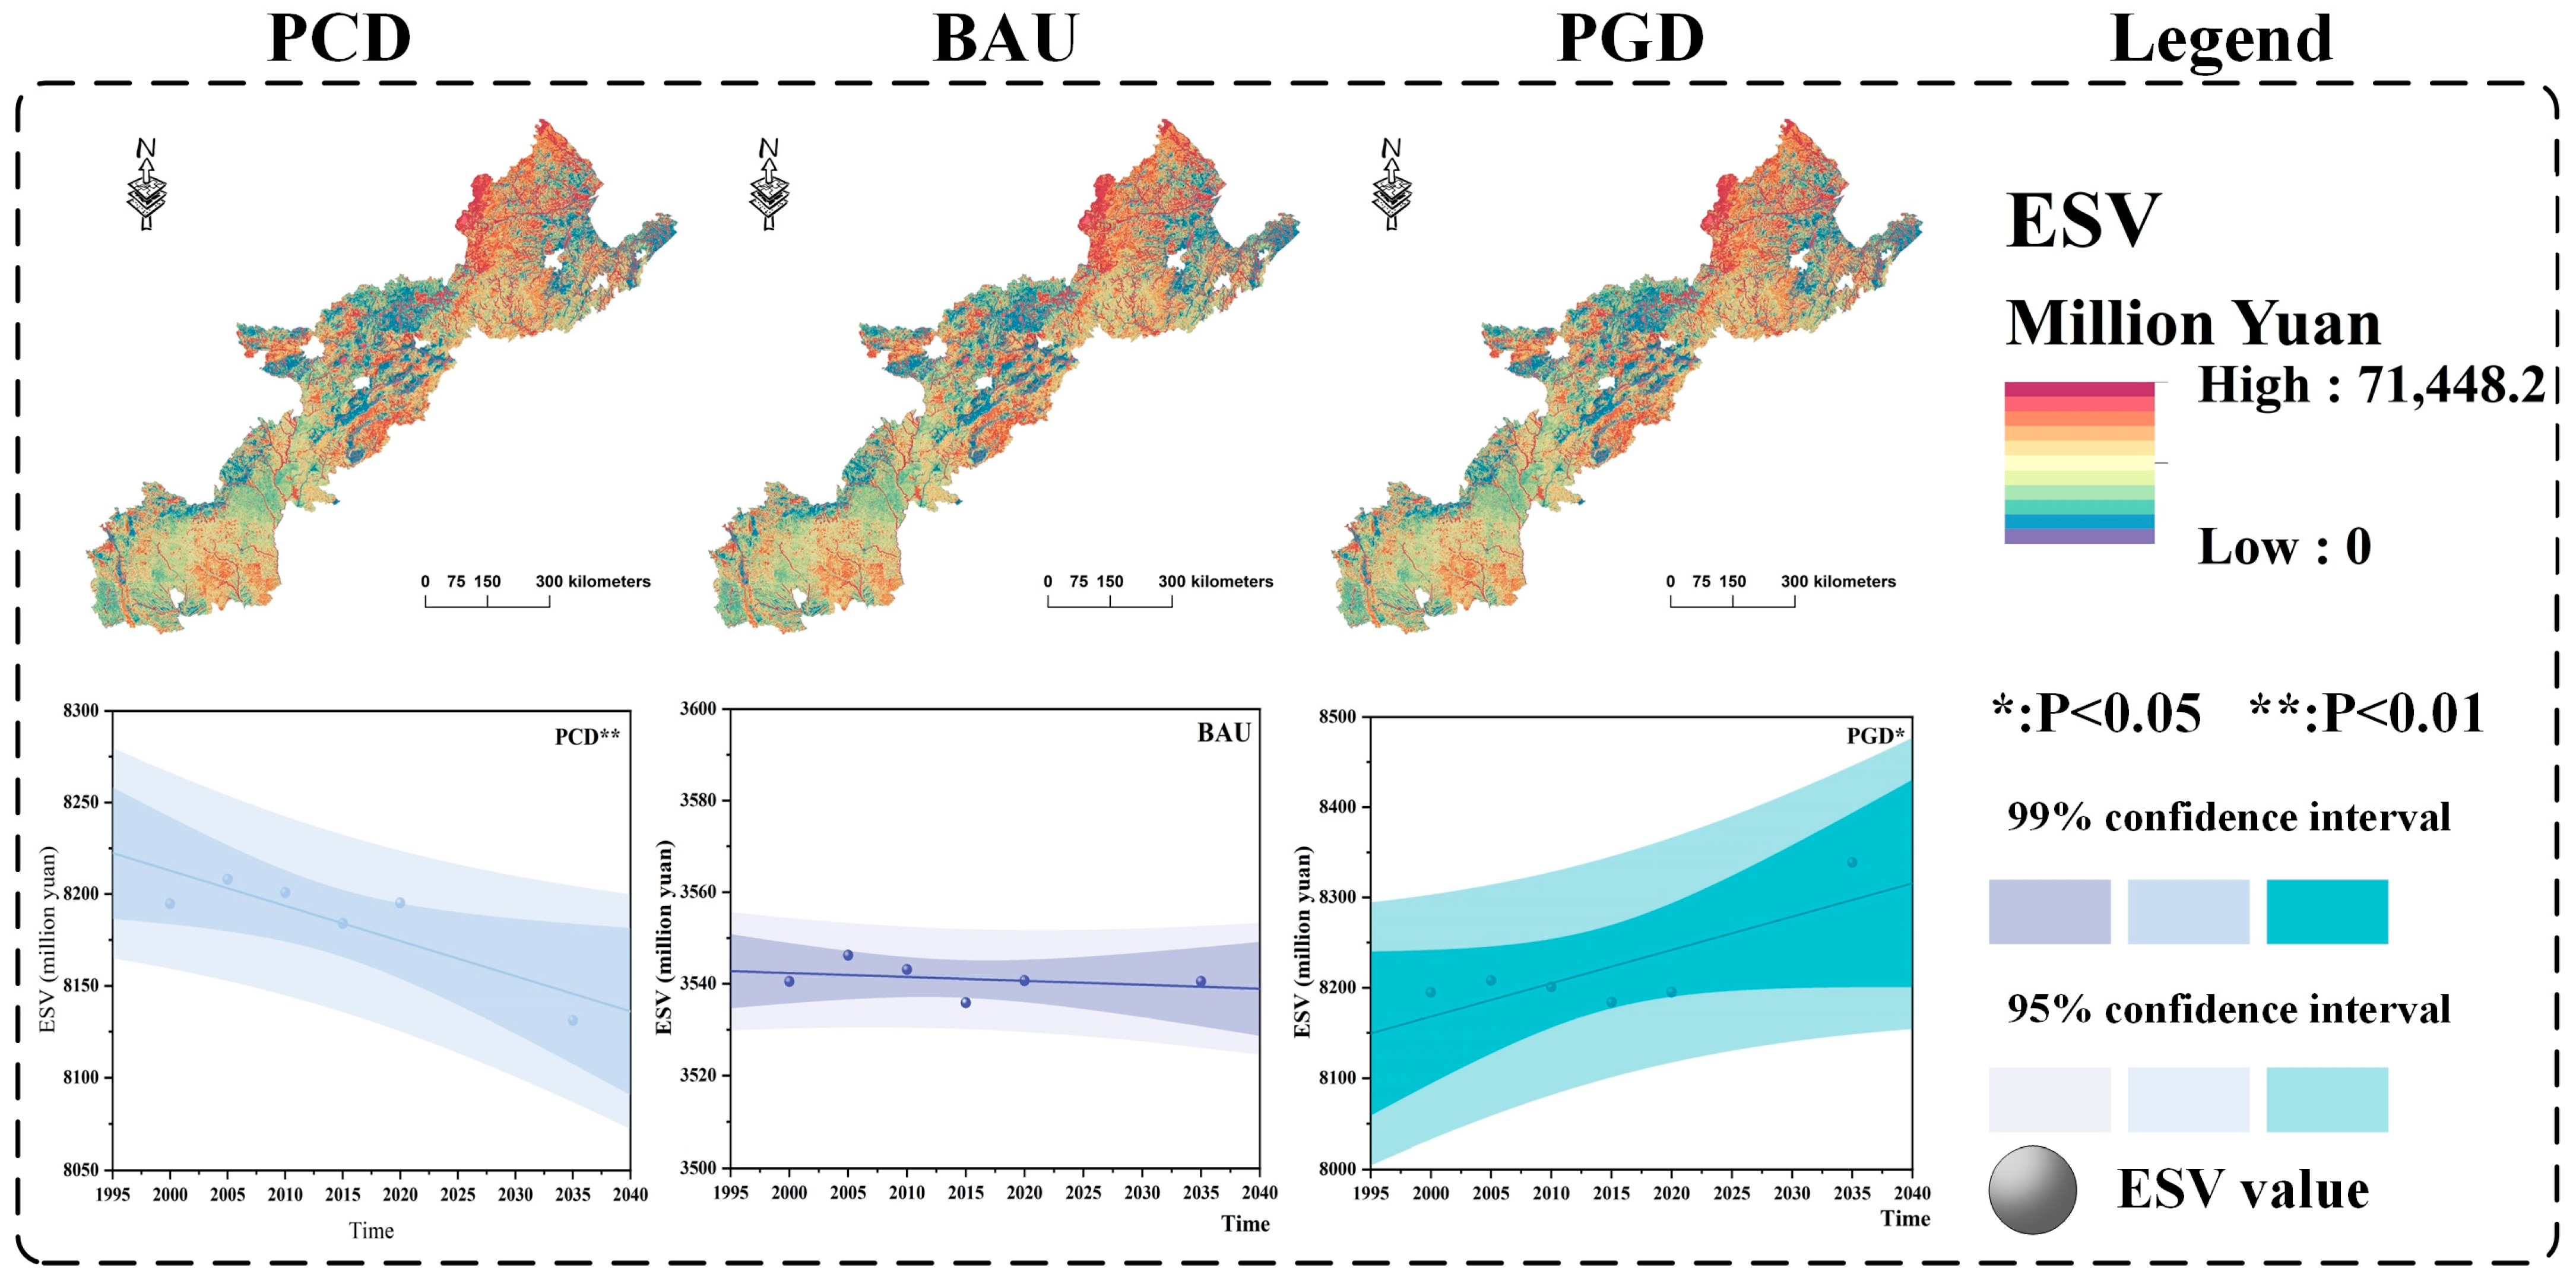
- The ESV also exhibited different development trends under each scenario, as shown in Figure 9. ESV was CNY 8338.79 million, CNY 8194.82 million, and CNY 8131.10 million in the PGD, BAU, and PCD scenarios, respectively. In general, the regional ESV was in a significant downward trend (CNY 64.03 million, p < 0.05) in PCD. In the BAU scenario, the change in ESV has a certain randomness, with an insignificant decrease of CNY 0.31 million compared with 2020. Under the PGD scenario, ESV showed a significant upward trend. Compared with 2020, the total ESV increased by CNY 143.66 million, and p < 0.05.
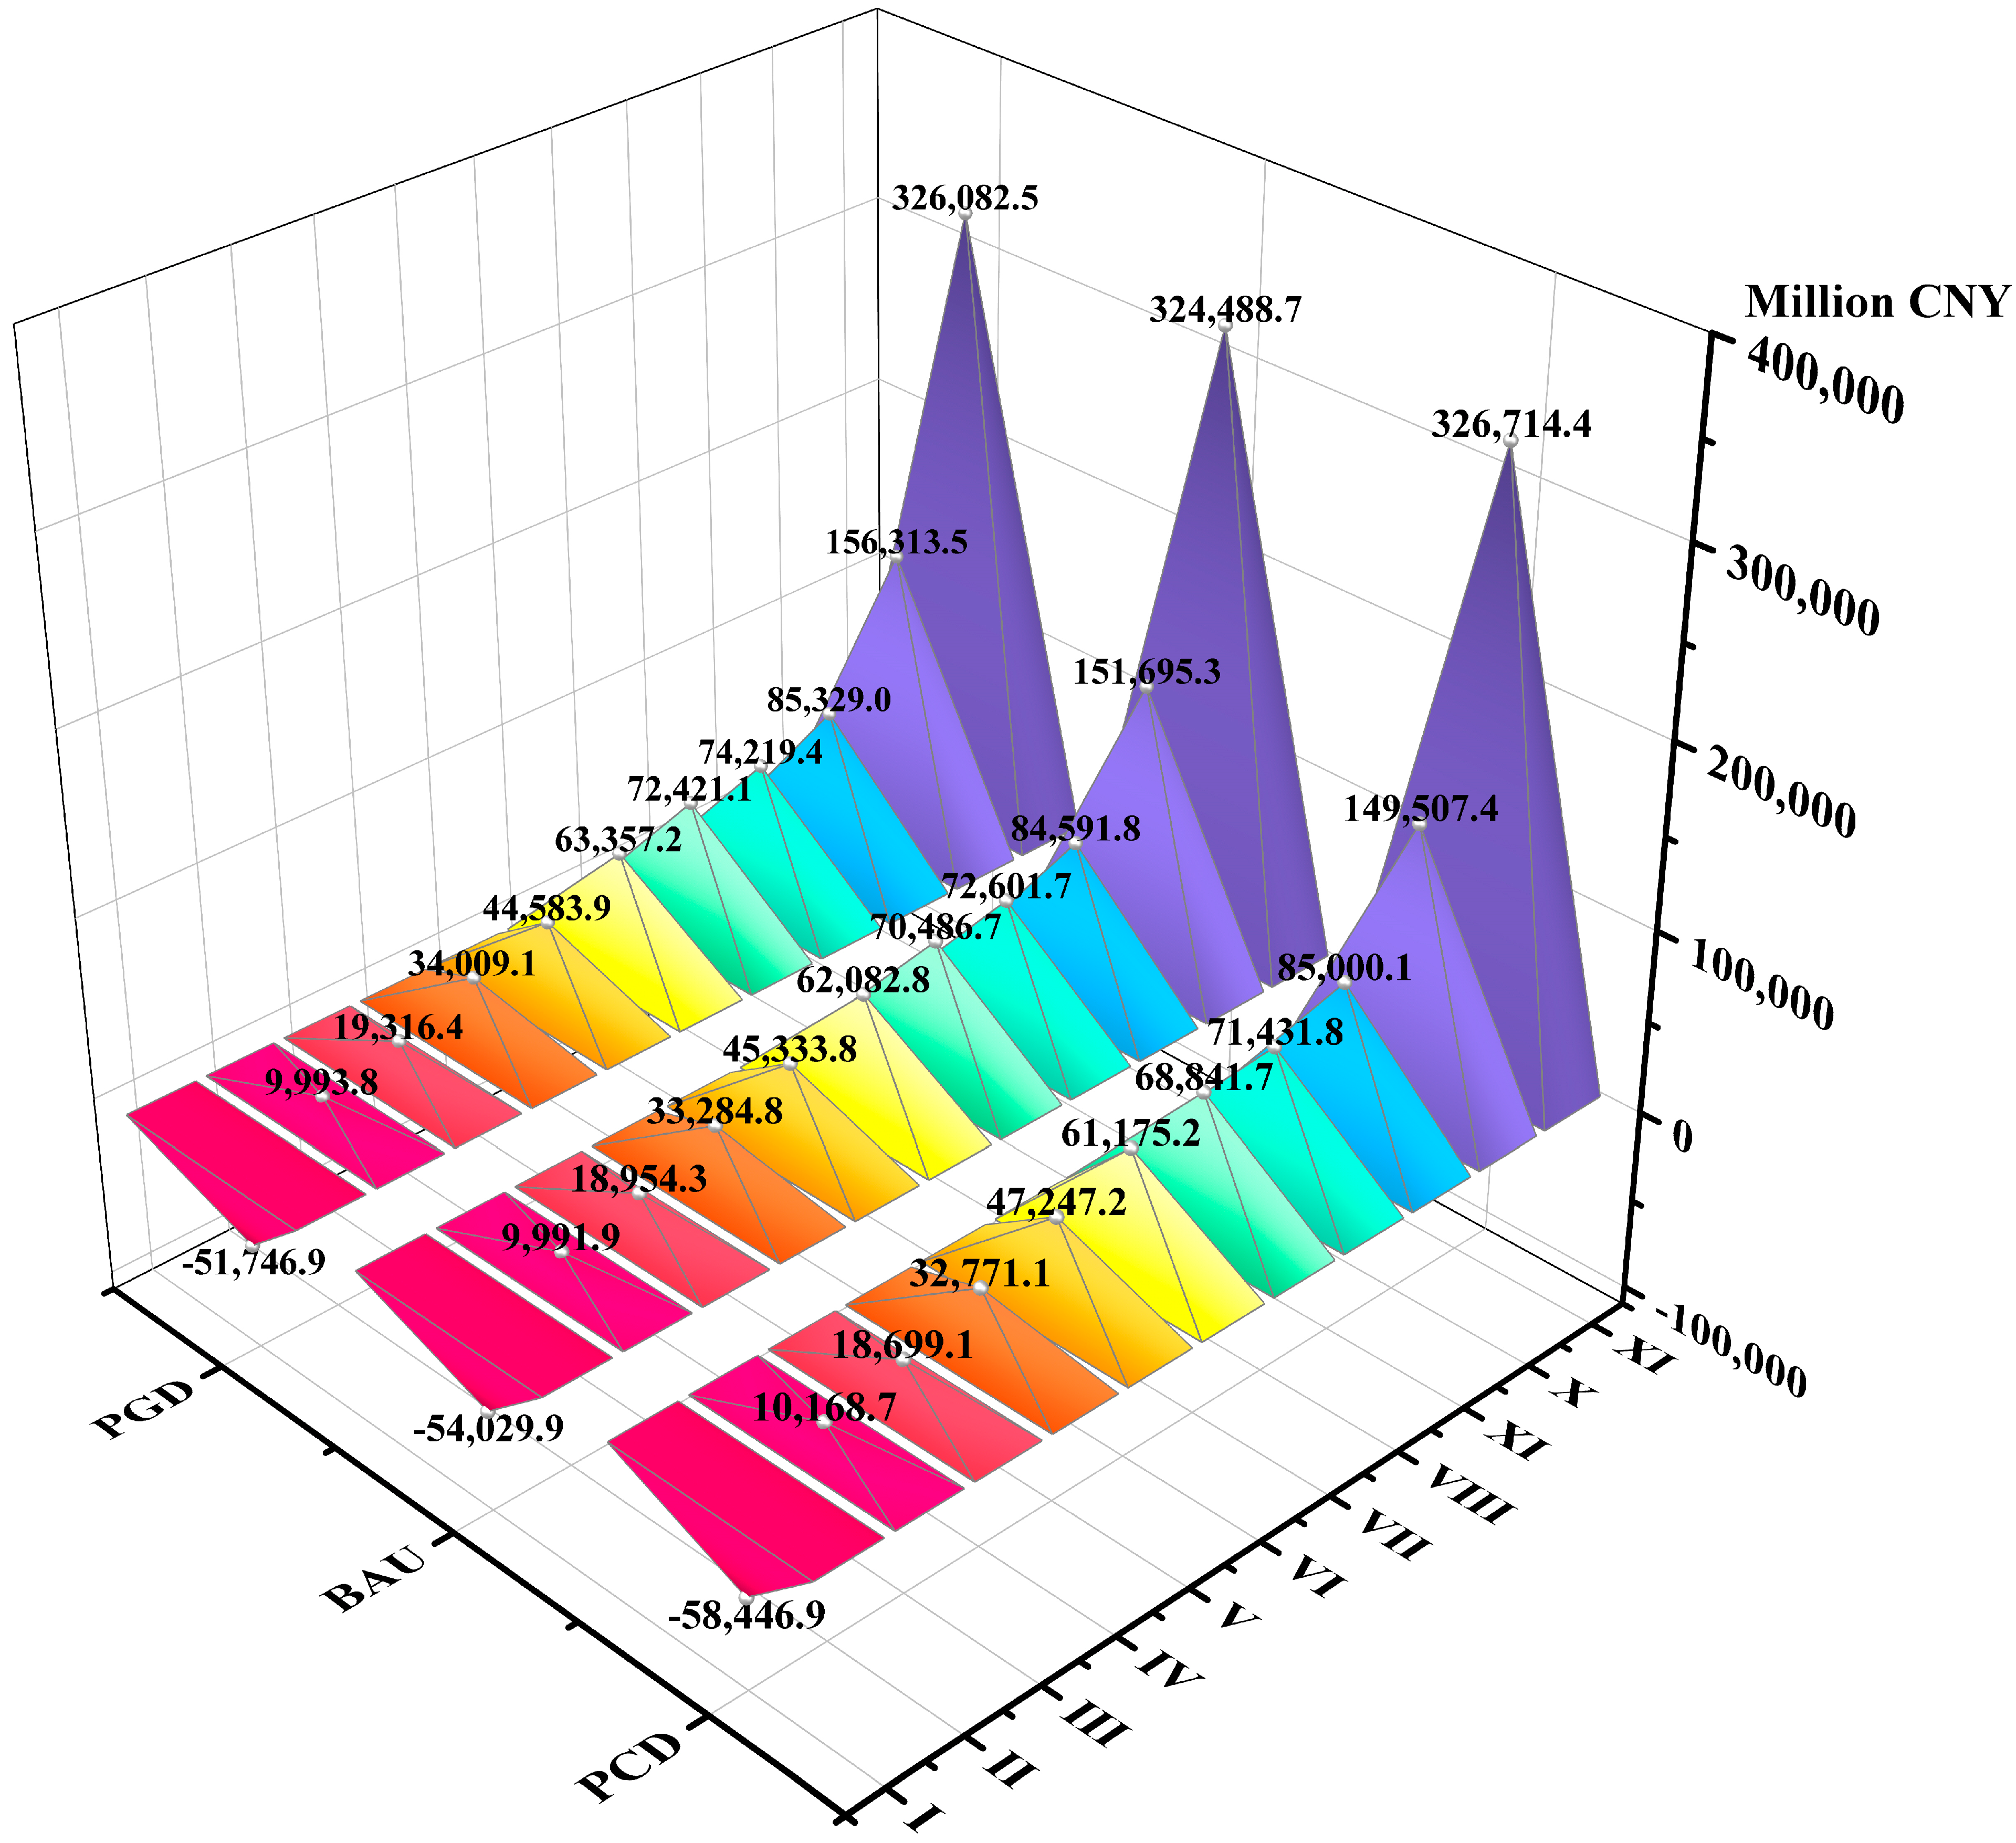
- Each secondary ecosystem service value under different scenarios is illustrated in Figure 10, which reflects the same trend of the total ESV. The highest secondary ESV is hydrologic regulation, while the lowest is water resource supply. This phenomenon is primarily due to the dominance of land use types such as grassland and cropland, which require substantial water to support crop growth and animal husbandry. Overall, the secondary ESVs, regardless of the development scenario, follow the following trend: water resource supply < maintaining nutrient circulation < raw material production < aesthetic landscape < food production < environmental purification < soil conservation < maintaining biodiversity < gas regulation < climate regulation < hydrologic regulation.
5. Discussion
5.1. Environmental Factors’ Contribution to LUCC
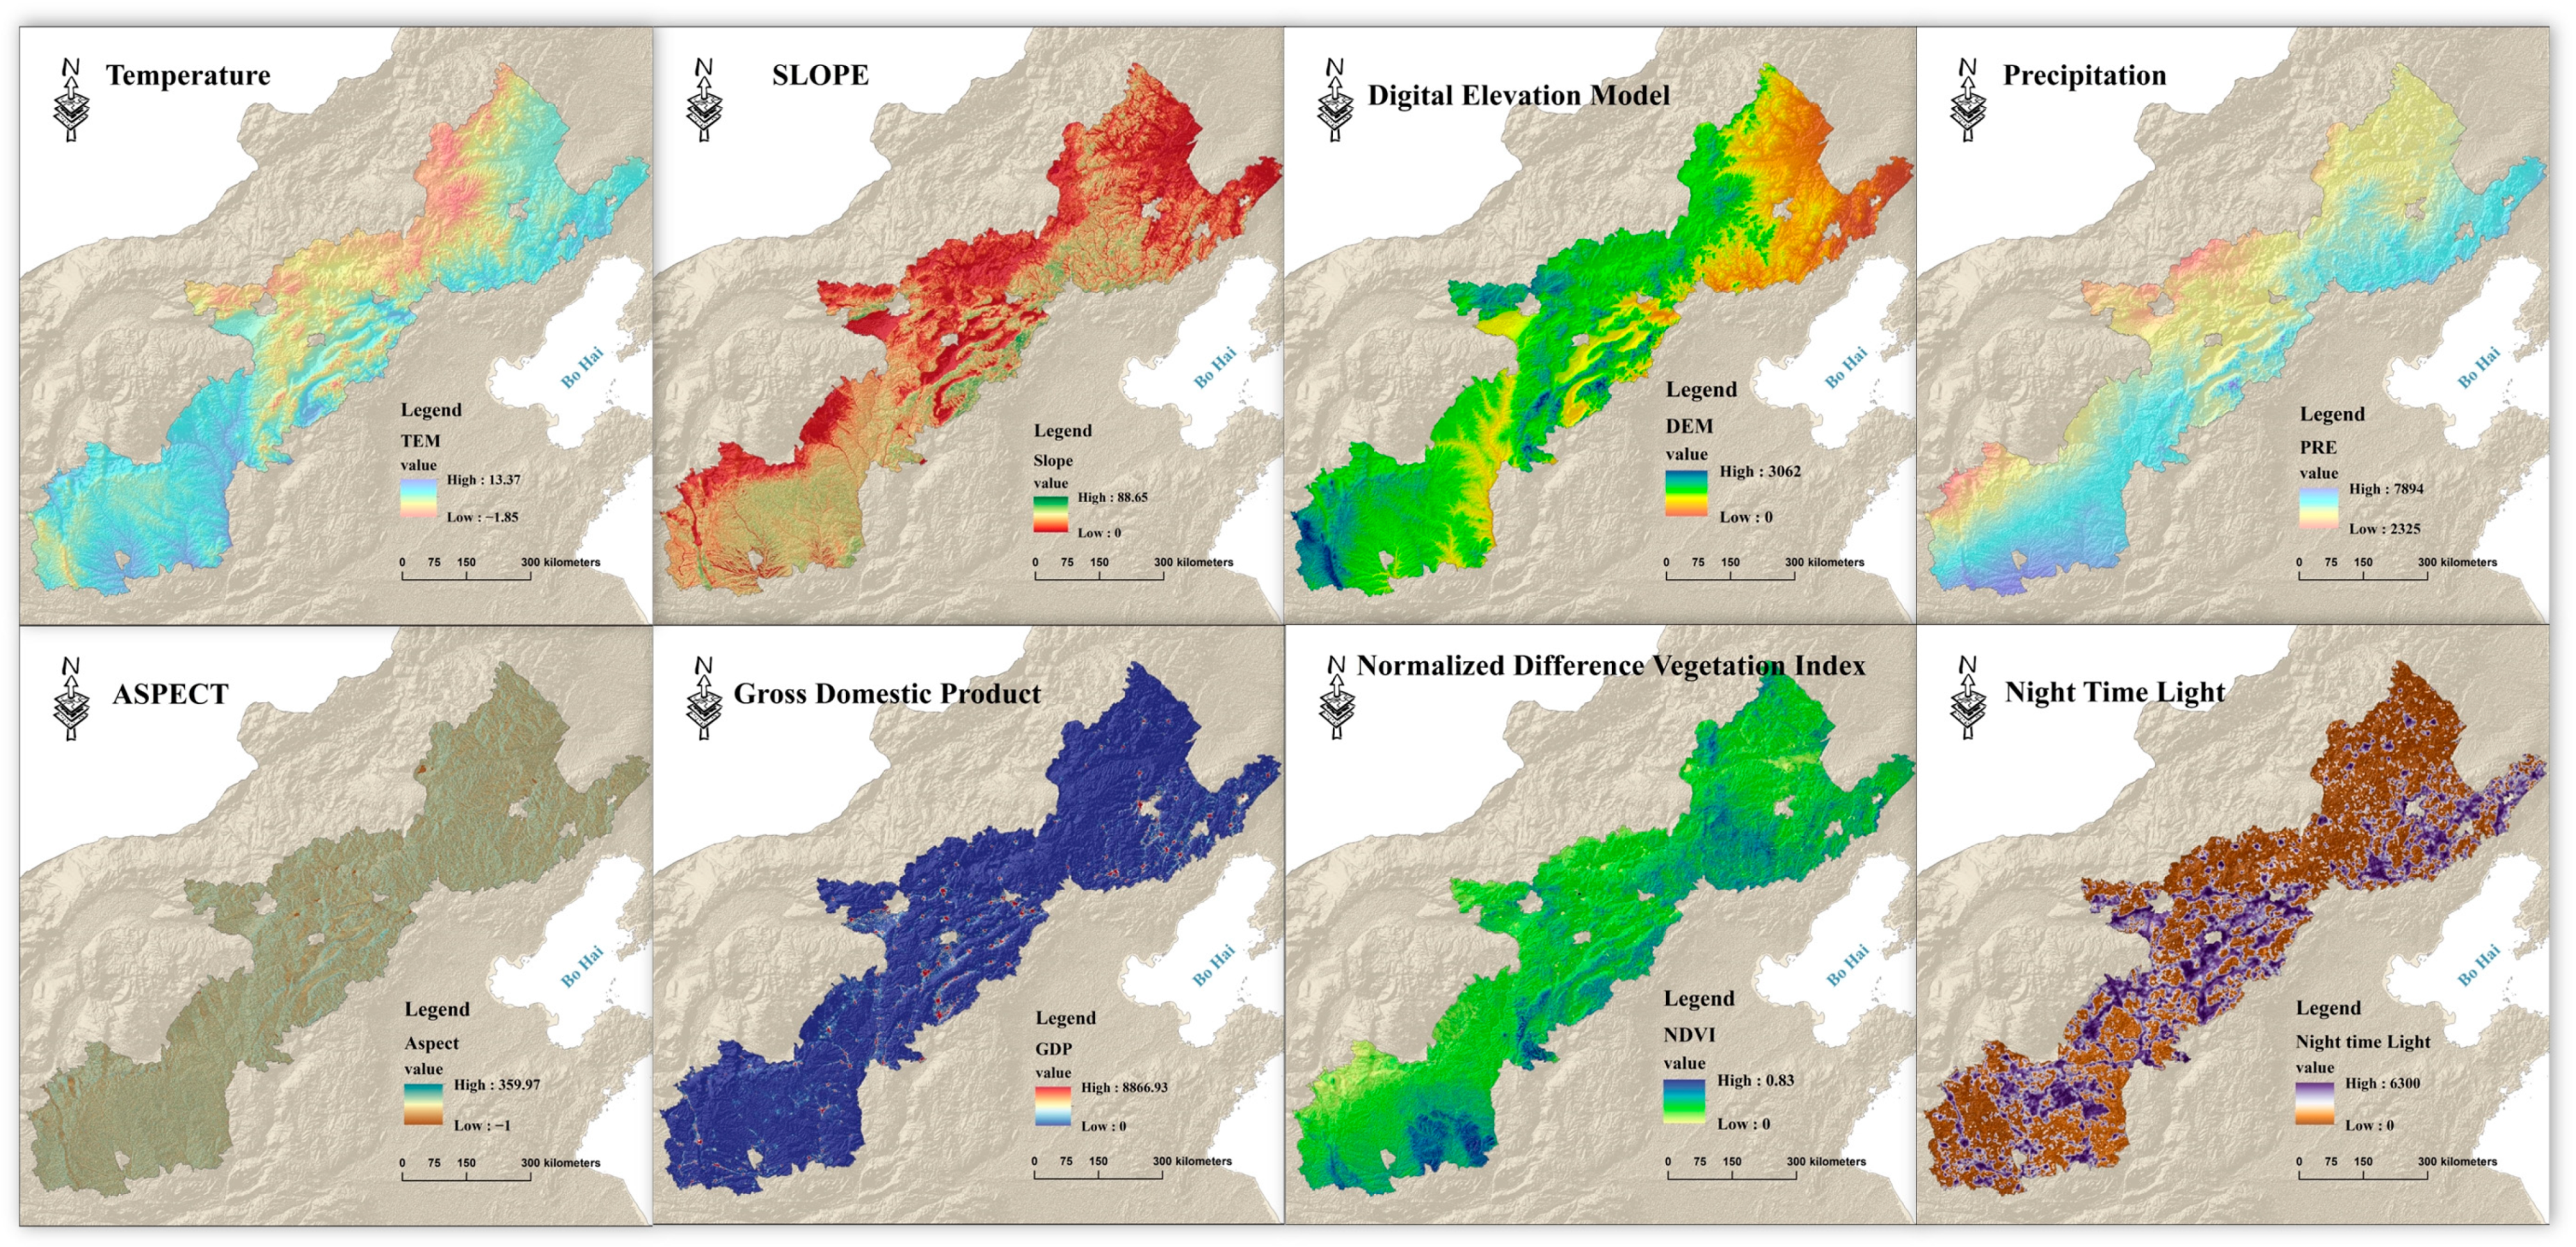
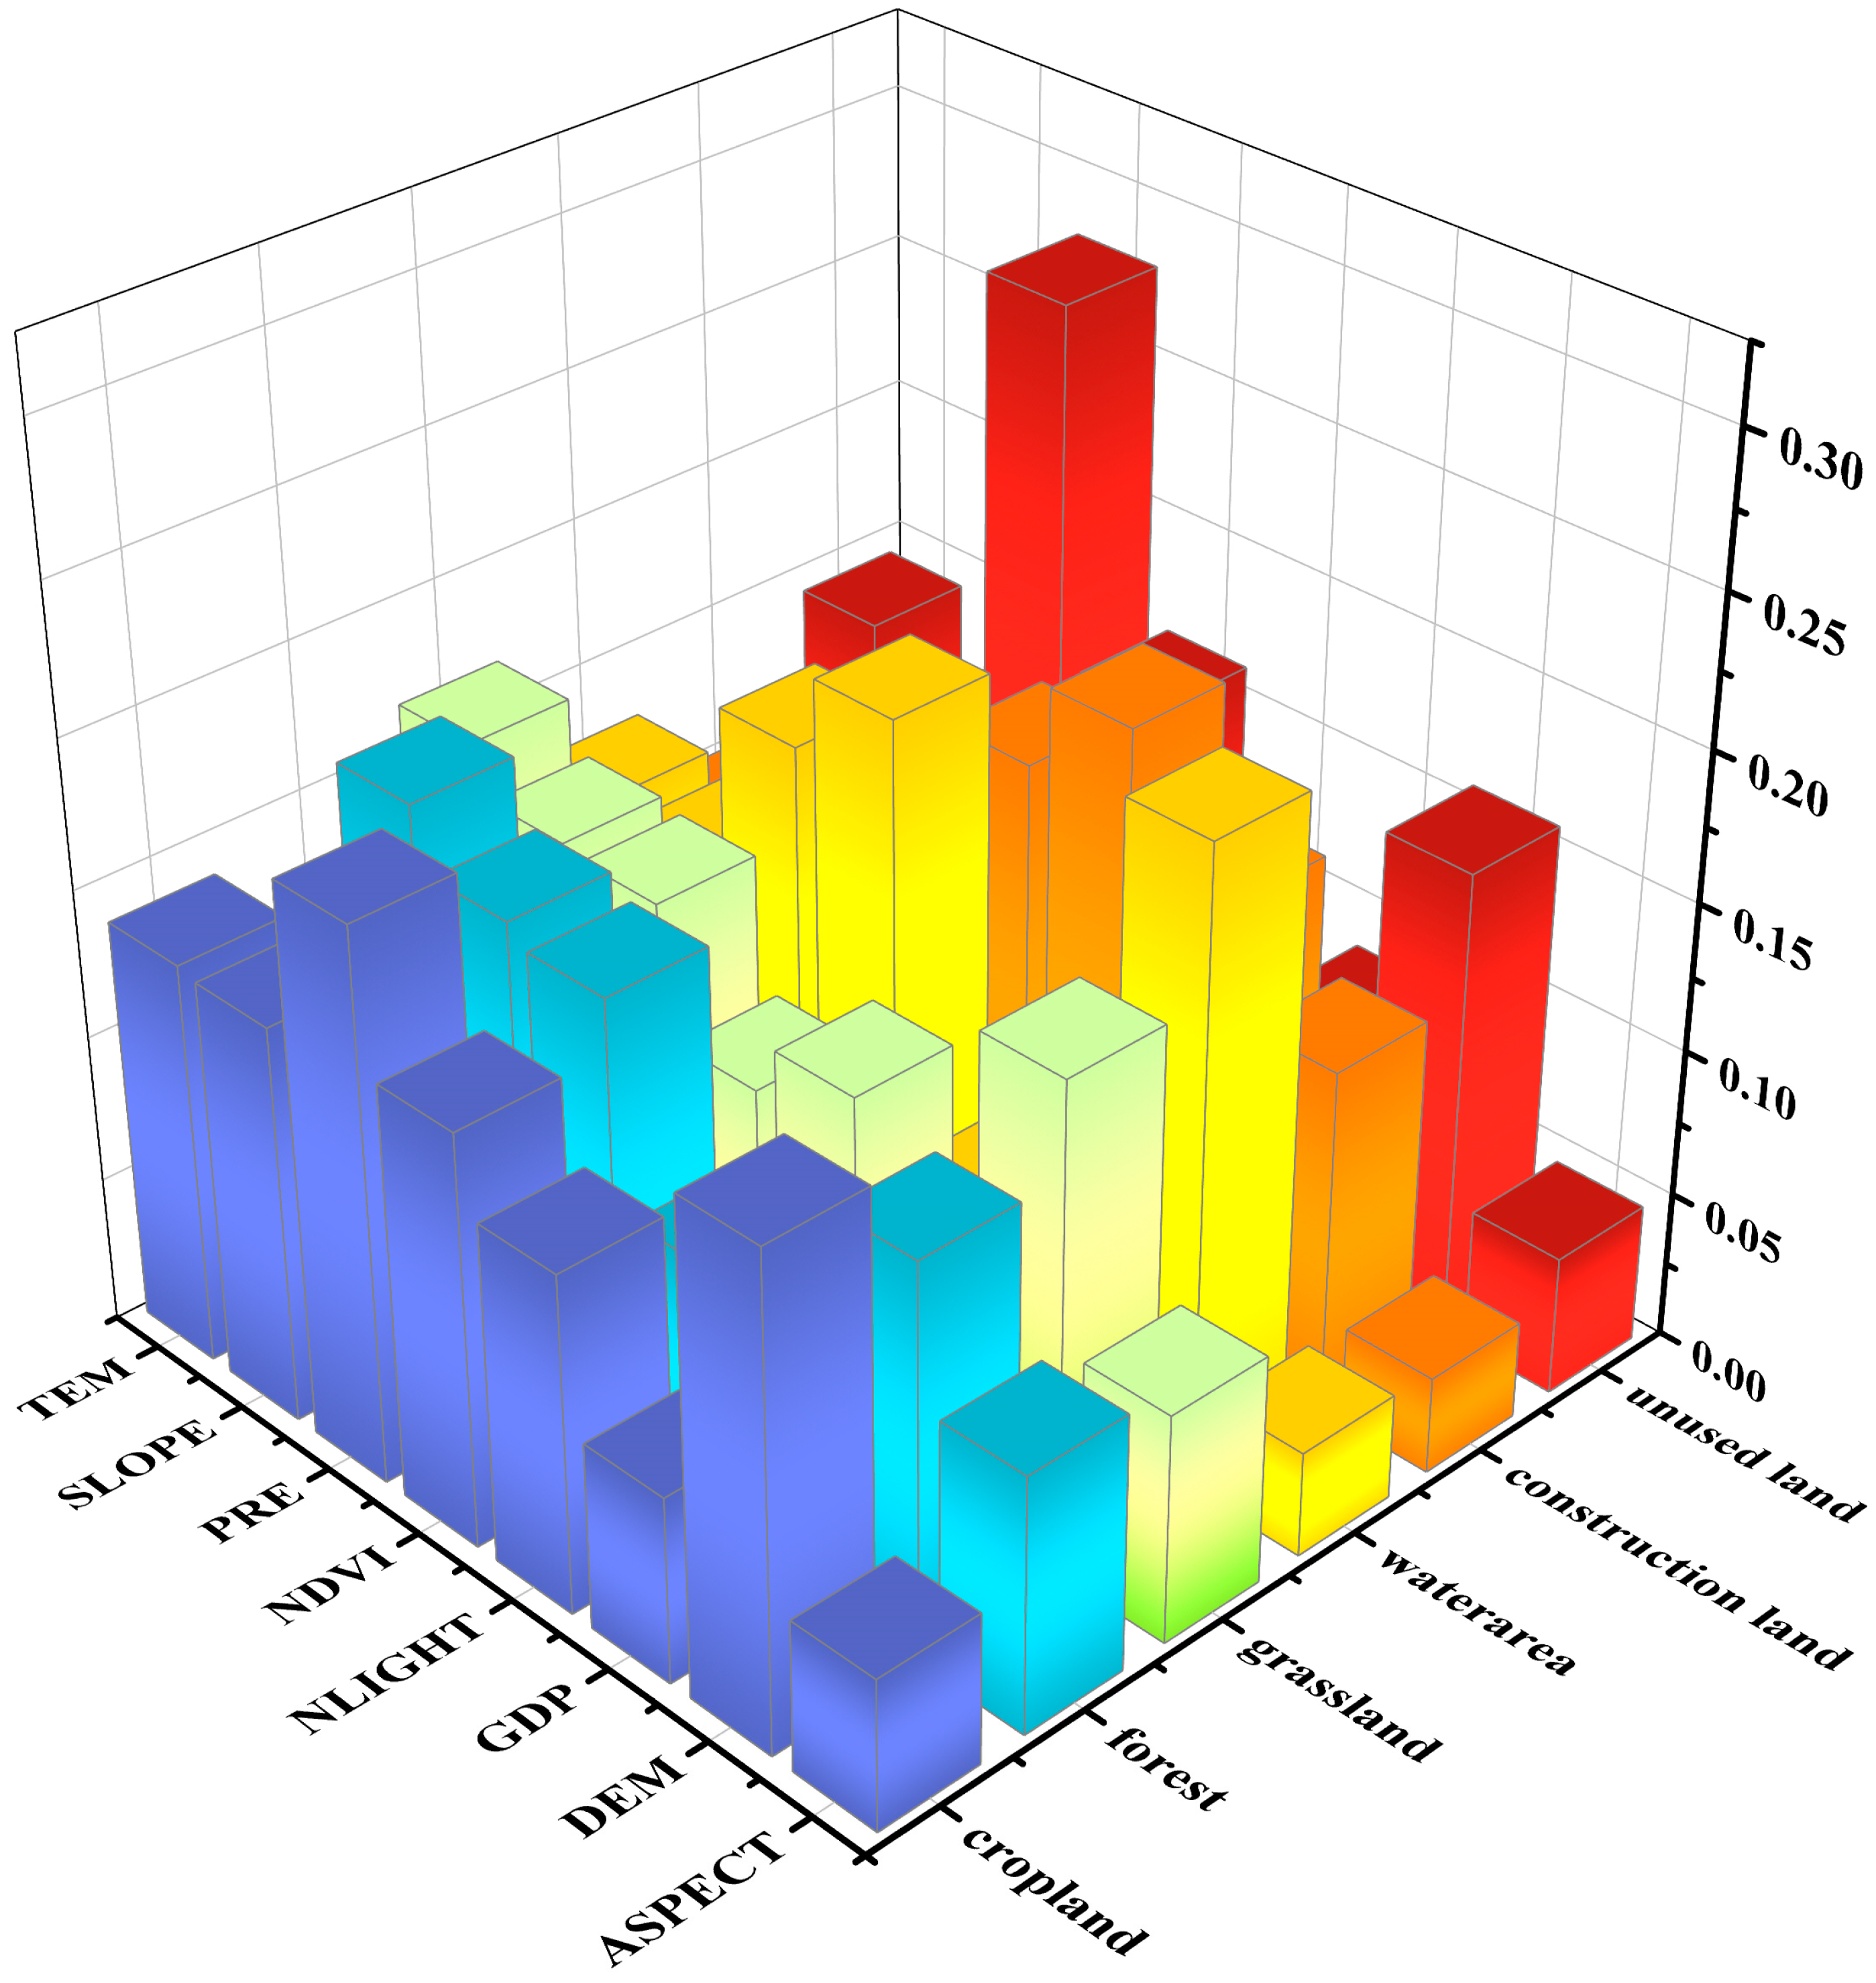
- The PLUS model identifies the contribution rates of different environmental factors to different land use types, as illustrated in Figure 11. The main factors affecting cropland were PRE (19%), DEM (17%), and NDVI (14%), highlighting the importance of precipitation and elevation. For forest, the primary influencing factors were slope (19%), PRE (17%), and NDVI (16%). The main factors affecting grassland were TEM (17%), slope (17%), and DEM (15%). The main influencing factors of unused land were precipitation (28%), DEM (16%), and NDVI (16%). DEM is an important factor affecting the distribution and transformation of cropland, grassland, and unused land. Overall, precipitation (18%), NDVI (16%), and DEM (16%) are important factors affecting LUCC in the agro-pastoral ecotone. Understanding the quantitative influence of these factors provides a basis for the specific protection of each land use type. This knowledge aids in realizing regional sustainable development by implementing proactive measures to maintain the regional environment.
5.2. Scale Effect of Spatial Aggregation
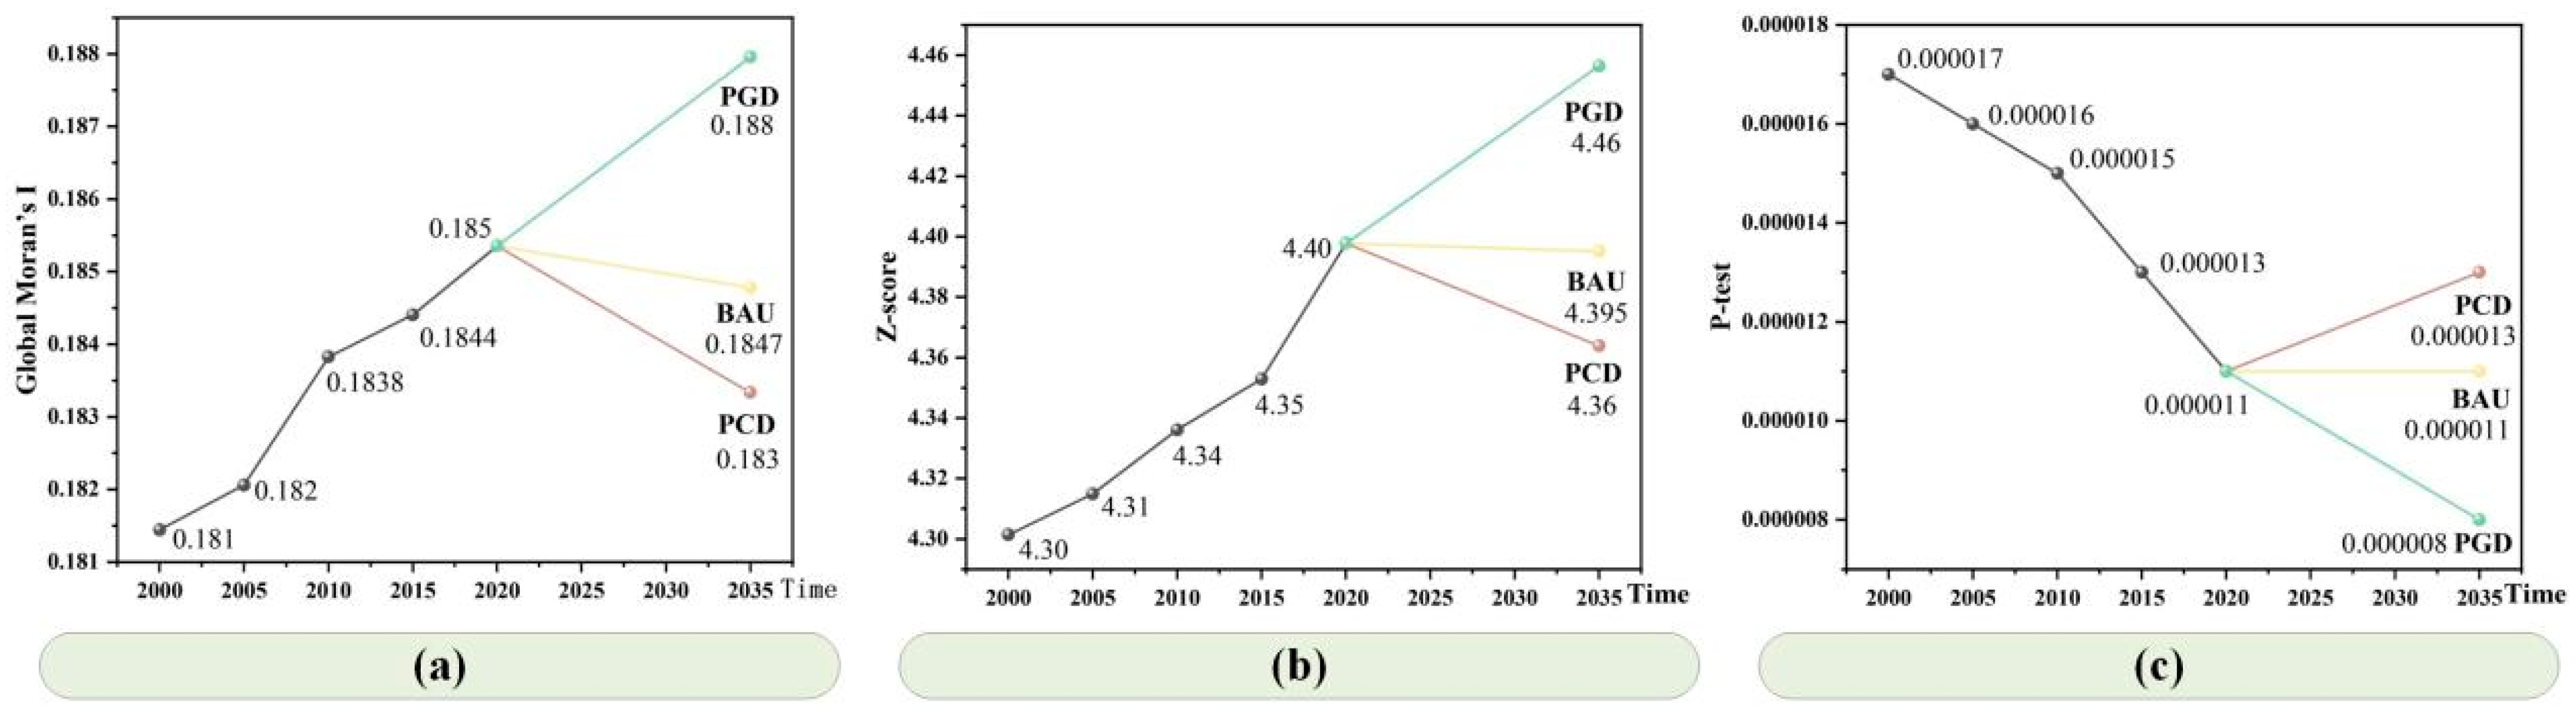
- The county-scale ESV was analyzed and calculated by the ArcGIS 10.8 software to obtain the Global Moran’s I index, which explores the overall agglomeration characteristics of ESV spatial distribution at the county level. The results, shown in Figure 12, indicate that from 2000 to 2020, the spatial agglomeration and its significance increased (Z > 2.58, p < 0.01).
- Under different development scenarios, the overall spatial aggregation degree in PGD showed an upward trend. However, the overall spatial aggregation degree in the BAU scenario and PCD scenario showed a downward trend. The degree of spatial aggregation in all the scenarios passed the significance test of 99%.
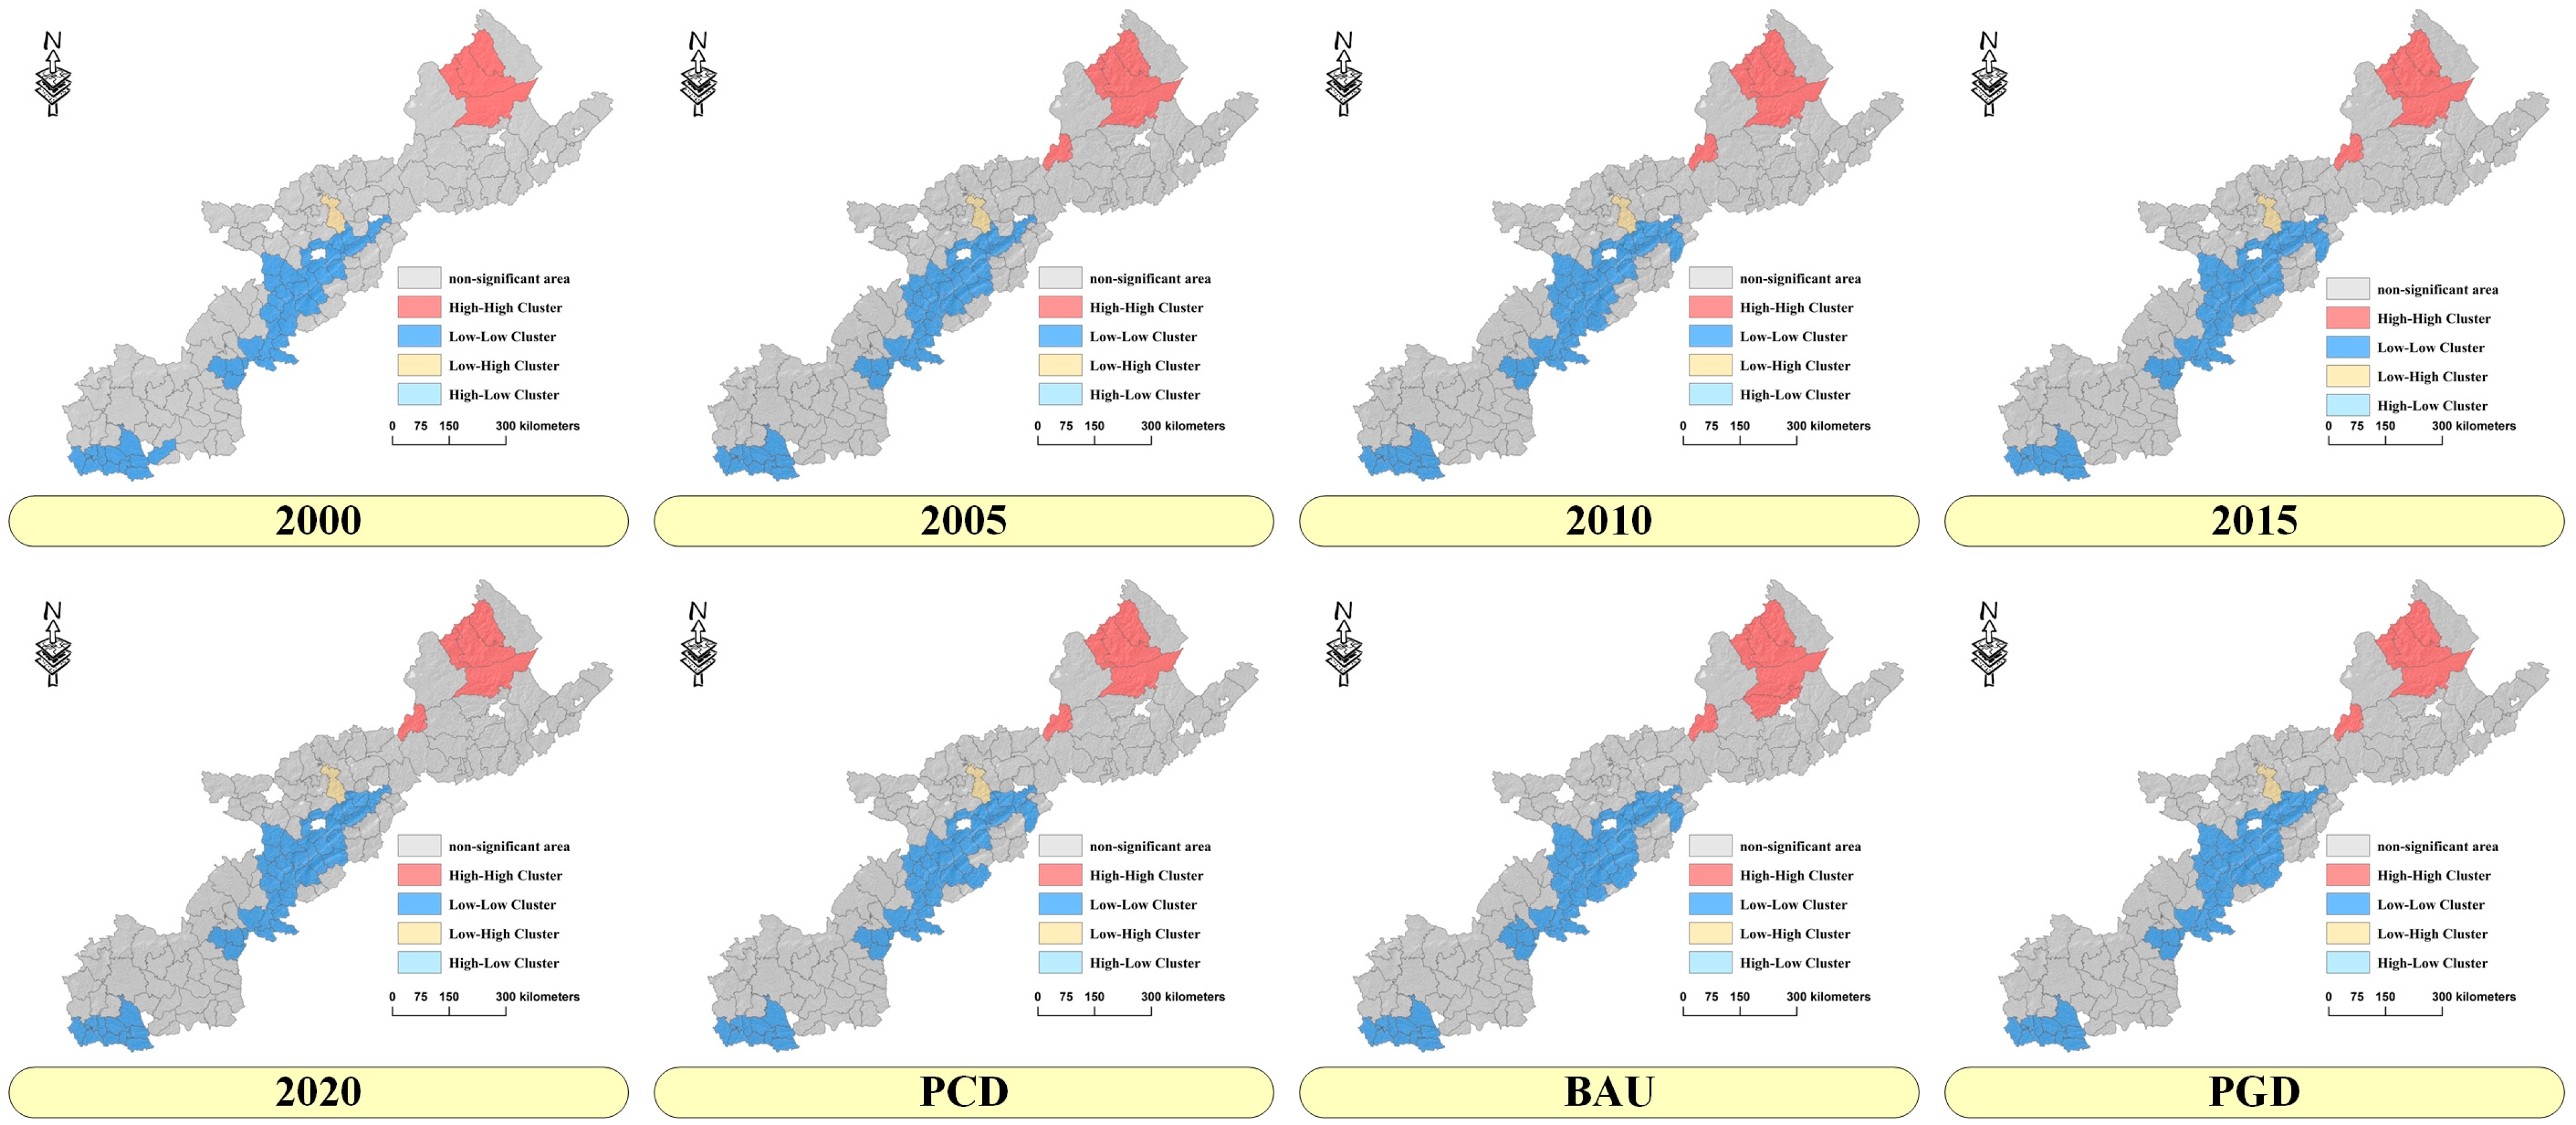
- The LISA index was calculated by the Geoda software (version 1.22), with the result presented in Figure 13. The results reveal that the northeast region of Inner Mongolia mainly shows a high–high spatial cluster correlation. The central area (mainly in Shanxi Province) and the southern area (mainly in Gansu Province) of the agro-pastoral ecotone are mainly concentrated in low–low spatial cluster correlation. In addition, the low–high spatial cluster correlation area is mainly dominated in Xinghe County. In general, the spatial structure of spatial heterogeneity and spatial agglomeration demonstrates a certain stability, exhibiting a high clustering trend in the north and a low clustering trend in the central and southern regions.

5.3. Suggestions for the Future Development Strategy of Agro-Pastoral Ecotone
- (1)
- Further promote the measures of “reducing crop and increasing grass” [57]. The measure of “reducing crop and increasing grass” is the core content of the future development of the agro-pastoral ecotone. Despite its importance, grassland and cropland areas have been decreasing due to the rapid growth of construction land, leading to the conversion of cropland into construction land. Therefore, in the future development process, it is necessary to accelerate the promotion of “reducing crop and increasing grass” measures, consolidate the achievements of returning cropland to forest and grassland [58], and further promote the return of sloping farmland above 25 degrees, seriously desertified cropland, and 15–25 degrees slope cropland in important water sources to grassland. In areas with groundwater over-exploitation and serious ecological degradation, cropland should be fully returned to grassland. Additionally, the growth of plants that prevent wind, fix sand, conserve water, and protect the arable layer should be encouraged [35,46].
- (2)
- Pay attention to regional ecological security. The agro-pastoral ecotone serves as an important ecological security barrier in China. In recent years, the imbalance in agricultural and husbandry structures, combined with increasing resource and environmental pressures, has exacerbated ecological security issues [59]. During the study period, the value of ecosystem services rose first and then declined. The reason is attributed to rapid urbanization, which has occupied a large area of ecological land, resulting in a significant decrease in land use types with high ecosystem service values. At present, regional planning under the SDGs mainly focuses on establishing a regional ecological network and determining regional priority protected areas [60,61]. Therefore, identifying regional ecological sources and corridors is essential for optimizing land resource use in line with the SDGs of the agro-pastoral ecotone.
- (3)
- Adjust and optimize the industrial structure and promote the integrated development of agriculture and husbandry. The agro-pastoral ecotone is an advantageous area for herbivorous animal husbandry and an important producing area for high-quality miscellaneous grains, fruits, and vegetables [62,63]. In recent years, the disconnect between planting and cultivation has become prominent. Promoting the integration of planting and cultivation is crucial for optimizing the regional industrial structure. Against the backdrop of “reducing crop and increasing grass”, developing new quality agricultural productivity and constructing water-saving, recycling, resting, and subsistence agriculture [62] are vital measures to enhance agricultural productivity and foster the integration of agriculture and animal husbandry.
5.4. Innovation, Prospect, and Deficiency
- However, there are still some deficiencies: First of all, in the process of accounting for the ESV, the coefficient of construction land was ignored. Considering that the expansion of construction land can be detrimental to the regional ecosystem and its specific impact remains unclear, the ecosystem service coefficient for construction land was regarded as 0 based on previous research on ESV [19,40]. Determining the impact of construction land on ecosystem services will be a focus of future research. Secondly, although the downscaling method of regional spatial data has been proven effective and reasonably accurate, it may still influence regional ecosystem services and land use change in the agro-pastoral ecotone. Therefore, developing regional high-precision data sets is crucial for realizing and supervising the sustainable development of the agro-pastoral ecotone. Thirdly, the monitoring interval of ESV in the agro-pastoral ecotone is 5 years, resulting in a small sample size that may affect the accuracy of trend fitting. This limitation is primarily due to the dependence on the monitoring of the LUCC data. Future efforts should focus on interpreting LUCC and monitoring ESV changes on an annual basis to better capture the trend with high accuracy.
6. Conclusions
- (1)
- Due to the rapid growth of construction land caused by urbanization, the ESV in the agro-pastoral ecotone will first rise and then decline from 2000 to 2020. In 2000, the ESV was CNY 8194.74 million, peaking at CNY 8207.99 million in 2005, before decreasing to CNY 8195.13 million in 2020. The ecosystem service value of the different land use types showed the trend of grassland > water area > forest > cropland > unused land, and the spatial agglomeration showed an upward trend.
- (2)
- From 2000 to 2020, the land use structure remained unbalanced. In particular, the cropland area decreased rapidly (9852.20 km2) and the construction land increased significantly (5753.95 km2, p < 0.01). The forest increased from 82,101.66 km2 to 89,732.11 km2. Developing agricultural productivity and further deepening the work of returning farmland to forest and grassland will be crucial measures for achieving sustainable development in the agro-pastoral ecotone.
- (3)
- In different scenarios, the ESV of PGD is the highest, followed by BAU and PCD. The spatial agglomeration tended to be PGD > BAU > PCD. Under the PGD scenario, the ESV showed a significant upward trend (CNY 143.66 million, p < 0.05). The PGD scenario is the most suitable scenario for the future development of the agro-pastoral ecotone, aligning with the development concept of the agro-pastoral ecotone proposal.
Author Contributions
Funding
Institutional Review Board Statement
Informed Consent Statement
Data Availability Statement
Acknowledgments
Conflicts of Interest
References
- Regona, M.; Yigitcanlar, T.; Hon, C.; Teo, M. Artificial intelligence and sustainable development goals: Systematic literature review of the construction industry. Sustain. Cities Soc. 2024, 108, 105499. [Google Scholar] [CrossRef]
- Sun, J.; Fu, B.; Zhao, W.; Liu, S.; Liu, G.; Zhou, H.; Shao, X.; Chen, Y.; Zhang, Y.; Deng, Y. Optimizing grazing exclusion practices to achieve Goal 15 of the sustainable development goals in the Tibetan Plateau. Sci. Bull. 2021, 66, 1493–1496. [Google Scholar] [CrossRef]
- Ma, Y.; Huang, L.; Li, J.; Cao, W.; Cai, Y. Carbon potential of China’s Grain to Green Program and its contribution to the carbon target. Resour. Conserv. Recycl. 2024, 200, 107272. [Google Scholar] [CrossRef]
- Mu, H.; Li, X.; Ma, H.; Du, X.; Huang, J.; Su, W.; Yu, Z.; Xu, C.; Liu, H.; Yin, D.; et al. Evaluation of the policy-driven ecological network in the Three-North Shelterbelt region of China. Landsc. Urban Plan. 2022, 218, 104305. [Google Scholar] [CrossRef]
- Sun, M.; Ma, W.; Yao, X.; Zhang, Y.; Yang, Y. Evaluation of glacier service function and value in the Sanjiangyuan Nature Reserve in China (SNRC). J. Clean. Prod. 2023, 412, 137284. [Google Scholar] [CrossRef]
- Baral, H.; Keenan, R.J.; Sharma, S.K.; Stork, N.E.; Kasel, S. Economic evaluation of ecosystem goods and services under different landscape management scenarios. Land Use Policy 2014, 39, 54–64. [Google Scholar] [CrossRef]
- Wen, X.; Wang, J.; Han, X. Impact of land use evolution on the value of ecosystem services in the returned farmland area of the Loess Plateau in northern Shaanxi. Ecol. Indic. 2024, 163, 112119. [Google Scholar] [CrossRef]
- Li, J.; Hu, D.; Wang, Y.; Chu, J.; Yin, H.; Ma, M. Study of identification and simulation of ecological zoning through integration of landscape ecological risk and ecosystem service value. Sustain. Cities Soc. 2024, 107, 105442. [Google Scholar] [CrossRef]
- Sannigrahi, S.; Chakraborti, S.; Joshi, P.K.; Keesstra, S.; Sen, S.; Paul, S.K.; Kreuter, U.; Sutton, P.C.; Jha, S.; Dang, K.B. Ecosystem service value assessment of a natural reserve region for strengthening protection and conservation. J. Environ. Manag. 2019, 244, 208–227. [Google Scholar] [CrossRef]
- Li, R.; Xu, Q.; Yu, J.; Chen, L.; Peng, Y. Multiscale assessment of the spatiotemporal coupling relationship between urbanization and ecosystem service value along an urban–rural gradient: A case study of the Yangtze River Delta urban agglomeration, China. Ecol. Indic. 2024, 160, 111864. [Google Scholar] [CrossRef]
- Nunez, J.A.; Aguiar, S.; Jobbagy, E.G.; Jimenez, Y.G.; Baldassini, P. Climate change and land cover effects on water yield in a subtropical watershed spanning the yungas-chaco transition of Argentina. J. Environ. Manag. 2024, 358, 120808. [Google Scholar] [CrossRef]
- Zhang, M.; Ao, Y.; Liu, M.; Zhao, Y.; Lin, K.; Cheng, T. Ecological security assessment based on ecosystem service value and ecological footprint in the Pearl River Delta urban agglomeration, China. Ecol. Indic. 2022, 144, 109528. [Google Scholar] [CrossRef]
- Qiao, X.; Li, Z.; Lin, J.; Wang, H.; Zheng, S.; Yang, S. Assessing current and future soil erosion under changing land use based on InVEST and FLUS models in the Yihe River Basin, North China. Int. Soil Water Conserv. Res. 2024, 12, 298–312. [Google Scholar] [CrossRef]
- Garcia-Ontiyuelo, M.; Acuna-Alonso, C.; Valero, E.; Alvarez, X. Geospatial mapping of carbon estimates for forested areas using the InVEST model and Sentinel-2: A case study in Galicia (NW Spain). Sci. Total Environ. 2024, 922, 171297. [Google Scholar] [CrossRef] [PubMed]
- Wang, Y.; Ye, A.; Peng, D.; Miao, C.; Di, Z.; Gong, W. Spatiotemporal variations in water conservation function of the Tibetan Plateau under climate change based on InVEST model. J. Hydrol. Reg. Stud. 2022, 41, 101064. [Google Scholar] [CrossRef]
- Aneseyee, A.B.; Elias, E.; Soromessa, T.; Feyisa, G.L. Land use/land cover change effect on soil erosion and sediment delivery in the Winike watershed, Omo Gibe Basin, Ethiopia. Sci. Total Environ. 2020, 728, 138776. [Google Scholar] [CrossRef] [PubMed]
- Wu, Y.; Wang, J.; Gou, A. Research on the evolution characteristics, driving mechanisms and multi-scenario simulation of habitat quality in the Guangdong-Hong Kong-Macao Greater Bay based on multi-model coupling. Sci. Total Environ. 2024, 924, 171263. [Google Scholar] [CrossRef] [PubMed]
- Xiong, C.; Xu, H.; Tian, Y. Assessment of ecosystem service value in China from the perspective of spatial heterogeneity. Ecol. Indic. 2024, 159, 111707. [Google Scholar] [CrossRef]
- Xie, G.; Zhen, L.; Lu, C.; Xiao, Y.; Chen, C. Expert knowledge based valuation method of ecosystem Services in China. J. Nat. Resour. 2008, 23, 911–919. [Google Scholar]
- Liu, M.; Xiong, Y.; Zhang, A. Multi-scale telecoupling effects of land use change on ecosystem services in urban agglomerations—A case study in the middle reaches of Yangtze River urban agglomerations. J. Clean. Prod. 2023, 415, 137878. [Google Scholar] [CrossRef]
- Xiao, J.; Zhang, Y.; Xu, H. Response of ecosystem service values to land use change, 2002–2021. Ecol. Indic. 2024, 160, 111947. [Google Scholar] [CrossRef]
- Liu, J.; Pei, X.; Liao, B.; Zhang, H.; Liu, W.; Jiao, J. Scale effects and spatial heterogeneity of driving factors in ecosystem services value interactions within the Tibet autonomous region. J. Environ. Manag. 2024, 351, 119871. [Google Scholar] [CrossRef]
- Zhang, X.; Zheng, Z.; Sun, S.; Wen, Y.; Chen, H. Study on the driving factors of ecosystem service value under the dual influence of natural environment and human activities. J. Clean. Prod. 2023, 420, 138408. [Google Scholar] [CrossRef]
- Hu, B.; Xie, M.; He, R.; Shi, Z.; Zhou, Y.; Ni, H.; Li, H. Spatio-temporal evolution of cropland ecosystem services value and its spatially varying dominate over the past two decades: A case study in Jiangxi Province in southern China. J. Clean. Prod. 2023, 427, 139228. [Google Scholar] [CrossRef]
- Wang, X.; Lu, B.; Li, J.; Liu, Q.; He, L.; Lv, S.; Yu, S. Spatio-temporal analysis of ecological service value driven by land use changes: A case study with Danjiangkou, Hubei section. Resour. Environ. Sustain. 2024, 15, 100146. [Google Scholar] [CrossRef]
- Wang, Q.; Guan, Q.; Sun, Y.; Du, Q.; Xiao, X.; Luo, H.; Zhang, J.; Mi, J. Simulation of future land use/cover change (LUCC) in typical watersheds of arid regions under multiple scenarios. J. Environ. Manag. 2023, 335, 117543. [Google Scholar] [CrossRef]
- Li, W.; Chen, X.; Zheng, J.; Zhang, F.; Yan, Y.; Hai, W.; Han, C.; Liu, L. A Multi-Scenario Simulation and Dynamic Assessment of the Ecosystem Service Values in Key Ecological Functional Areas: A Case Study of the Sichuan Province, China. Land 2024, 13, 468. [Google Scholar] [CrossRef]
- Liu, X.; Liang, X.; Li, X.; Xu, X.; Ou, J.; Chen, Y.; Li, S.; Wang, S.; Pei, F. A future land use simulation model (FLUS) for simulating multiple land use scenarios by coupling human and natural effects. Landsc. Urban Plan. 2017, 168, 94–116. [Google Scholar] [CrossRef]
- Kiziridis, D.A.; Mastrogianni, A.; Pleniou, M.; Tsiftsis, S.; Xystrakis, F.; Tsiripidis, I. Improving the predictive performance of CLUE-S by extending demand to land transitions: The trans-CLUE-S model. Ecol. Model. 2023, 478, 110307. [Google Scholar] [CrossRef]
- Fu, F.; Jia, X.; Zhao, Q.; Tian, F.; Wei, D.; Zhao, Y.; Zhang, Y.; Zhang, J.; Hu, X.; Yang, L. Predicting land use change around railway stations: An enhanced CA-Markov model. Sustain. Cities Soc. 2024, 101, 105138. [Google Scholar] [CrossRef]
- Jiao, M.; Hu, M.; Xia, B. Spatiotemporal dynamic simulation of land-use and landscape-pattern in the Pearl River Delta, China. Sustain. Cities Soc. 2019, 49, 101581. [Google Scholar] [CrossRef]
- Xu, C.; Zhang, Q.; Yu, Q.; Wang, J.; Wang, F.; Qiu, S.; Ai, M.; Zhao, J. Effects of land use/cover change on carbon storage between 2000 and 2040 in the Yellow River Basin, China. Ecol. Indic. 2023, 151, 110345. [Google Scholar] [CrossRef]
- Nie, W.; Shi, Y.; Siaw, M.J.; Yang, F.; Wu, R.; Wu, X.; Zheng, X.; Bao, Z. Constructing and optimizing ecological network at county and town Scale: The case of Anji County, China. Ecol. Indic. 2021, 132, 108294. [Google Scholar] [CrossRef]
- Wu, R.; Tang, H.; Lu, Y. Exploring subjective well-being and ecosystem services perception in the agro-pastoral ecotone of northern China. J. Environ. Manag. 2022, 318, 115591. [Google Scholar] [CrossRef] [PubMed]
- Lu, H.; Chen, X.; Ma, K.; Zhou, S.; Yi, J.; Qi, Y.; Hao, J.; Chen, F.; Wen, X. Soil health assessment under different soil and irrigation types in the agro-pastoral ecotone of northern China. Catena 2024, 235, 107655. [Google Scholar] [CrossRef]
- Yang, Y.; Wang, K.; Liu, D.; Zhao, X.; Fan, J. Effects of land-use conversions on the ecosystem services in the agro-pastoral ecotone of northern China. J. Clean. Prod. 2020, 249, 119360. [Google Scholar] [CrossRef]
- Zhang, J.; Feng, Z.; Jiang, L. Progress on Studies of Land Use/Land Cover Classification Systems. Resour. Sci. 2011, 33, 1195–1203. [Google Scholar]
- Price, D.T.; McKenney, D.W.; Nalder, I.A.; Hutchinson, M.F.; Kesteven, J.L. A comparison of two statistical methods for spatial interpolation of Canadian monthly mean climate data. Agric. For. Meteorol. 2000, 101, 81–94. [Google Scholar] [CrossRef]
- Workneh, H.T.; Chen, X.; Ma, Y.; Bayable, E.; Dash, A. Comparison of IDW, Kriging and orographic based linear interpolations of rainfall in six rainfall regimes of Ethiopia. J. Hydrol. Reg. Stud. 2024, 52, 101696. [Google Scholar] [CrossRef]
- Xie, G.; Zhang, C.; Zhang, C.; Xiao, Y.; Lu, C. The Value of Ecosystem Services in China. Resour. Sci. 2015, 37, 1740–1746. [Google Scholar]
- Liu, B.; Zhang, S.; Xu, M.; Wang, J.; Wang, Z. Spatial differences in the marine industry based on marine-related enterprises: A case study of Jiangsu Province, China. Reg. Stud. Mar. Sci. 2023, 62, 102954. [Google Scholar] [CrossRef]
- Dong, Y.-H.; Peng, F.-L.; Li, H.; Men, Y.-Q. Spatial autocorrelation and spatial heterogeneity of underground parking space development in Chinese megacities based on multisource open data. Appl. Geogr. 2023, 153, 102897. [Google Scholar] [CrossRef]
- Liang, X.; Guan, Q.; Clarke, K.C.; Liu, S.; Wang, B.; Yao, Y. Understanding the drivers of sustainable land expansion using a patch-generating land use simulation (PLUS) model: A case study in Wuhan, China. Comput. Environ. Urban Syst. 2021, 85, 101569. [Google Scholar] [CrossRef]
- Zhang, J.; Wang, J.; Chen, Y.; Huang, S.; Liang, B. Spatiotemporal variation and prediction of NPP in Beijing-Tianjin-Hebei region by coupling PLUS and CASA models. Ecol. Inform. 2024, 81, 102620. [Google Scholar] [CrossRef]
- Zhang, T.; Xin, X.; He, F.; Wang, X.; Chen, K. How to promote sustainable land use in Hangzhou Bay, China? A decision framework based on fuzzy multiobjective optimization and spatial simulation. J. Clean. Prod. 2023, 414, 137576. [Google Scholar] [CrossRef]
- Ministry of Agriculture and Rural Affair of the Central People’s Government of the People’s Republic of China. Guiding Opinions on the Adjustment of Agricultural Structure in the Northern Agro-Pastoral Ecotone. Available online: https://www.moa.gov.cn/nybgb/2016/shierqi/201711/t20171125_5919525.htm (accessed on 21 January 2024).
- Liu, X.; Liu, Y.; Wang, Y.; Liu, Z. Evaluating potential impacts of land use changes on water supply–demand under multiple development scenarios in dryland region. J. Hydrol. 2022, 610, 127811. [Google Scholar] [CrossRef]
- An, W.; Wang, B.; Duan, L.; Giovanni, C.; Yu, G. Emerging contaminants in the northwest area of the Tai Lake Basin, China: Spatial autocorrelation analysis for source apportionment and wastewater-based epidemiological analysis. Sci. Total Environ. 2023, 865, 161176. [Google Scholar] [CrossRef] [PubMed]
- Gedamu, W.T.; Plank-Wiedenbeck, U.; Wodajo, B.T. A spatial autocorrelation analysis of road traffic crash by severity using Moran’s I spatial statistics: A comparative study of Addis Ababa and Berlin cities. Accid. Anal. Prev. 2024, 200, 107535. [Google Scholar] [CrossRef] [PubMed]
- Xu, Q.; Yang, R.; Dong, Y.-X.; Liu, Y.-X.; Qiu, L.-R. The influence of rapid urbanization and land use changes on terrestrial carbon sources/sinks in Guangzhou, China. Ecol. Indic. 2016, 70, 304–316. [Google Scholar] [CrossRef]
- Li, L.; Tang, H.; Lei, J.; Song, X. Spatial autocorrelation in land use type and ecosystem service value in Hainan Tropical Rain Forest National Park. Ecol. Indic. 2022, 137, 108727. [Google Scholar] [CrossRef]
- Liu, J.; Peng, K.; Zuo, C.; Li, Q. Spatiotemporal variation of land-use carbon emissions and its implications for low carbon and ecological civilization strategies: Evidence from Xiamen-Zhangzhou-Quanzhou metropolitan circle, China. Sustain. Cities Soc. 2022, 86, 104083. [Google Scholar] [CrossRef]
- Wen, L.; Bai, J.; Wang, Y.; Guan, Y.; Zhi, L.; Tang, R. Spatiotemporal responses of ecosystem service values to land use/cover changes in the Baiyangdian region, China. Ecohydrol. Hydrobiol. 2024. [Google Scholar] [CrossRef]
- Wang, J.; Liu, Z.; Gao, J.; Emanuele, L.; Ren, Y.; Shao, M.; Wei, X. The Grain for Green project eliminated the effect of soil erosion on organic carbon on China’s Loess Plateau between 1980 and 2008. Agric. Ecosyst. Environ. 2021, 322, 107636. [Google Scholar] [CrossRef]
- Zhai, J.; Wang, L.; Liu, Y.; Wang, C.; Mao, X. Assessing the effects of China’s Three-North Shelter Forest Program over 40 years. Sci. Total Environ. 2023, 857, 159354. [Google Scholar] [CrossRef]
- Yin, Z.; Feng, Q.; Zhu, R.; Wang, L.; Chen, Z.; Fang, C.; Lu, R. Analysis and prediction of the impact of land use/cover change on ecosystem services value in Gansu province, China. Ecol. Indic. 2023, 154, 110868. [Google Scholar] [CrossRef]
- Ding, Y.; Xu, R.; Wang, R.; Zhang, S.; Ding, H.; Liu, W. Can grain production be synergistic with socioeconomic development?—Empirical evidence from the agro-pastoral ecotone in North China. Ecol. Indic. 2023, 156, 111191. [Google Scholar] [CrossRef]
- Wu, J.; Han, P.; Yu, J.; Jarvie, S.; Zhang, Y.; Zhang, Q. Edge grassland provide a stronger thermal buffer against core grassland in the agro-pastoral ecotone of Inner Mongolia. Ecol. Indic. 2023, 154, 110762. [Google Scholar] [CrossRef]
- Yang, X.; Jia, P.; Hou, Q.; Zhu, M. Quantitative sensitivity of crop productivity and water productivity to precipitation during growth periods in the Agro-Pastoral Ecotone of Shanxi Province, China, based on APSIM. Agric. Water Manag. 2023, 283, 108309. [Google Scholar] [CrossRef]
- Ding, T.; Chen, J.; Fang, L.; Ji, J. Identifying and optimizing ecological security patterns from the perspective of the water-energy-food nexus. J. Hydrol. 2024, 632, 130912. [Google Scholar] [CrossRef]
- Wu, S.; Zhao, C.; Yang, L.; Huang, D.; Wu, Y.; Xiao, P. Spatial and temporal evolution analysis of ecological security pattern in Hubei Province based on ecosystem service supply and demand analysis. Ecol. Indic. 2024, 162, 112051. [Google Scholar] [CrossRef]
- Tang, J.; Bai, H.; Zhang, S.; Xiao, D.; Tianzhu, Z.; Li Liu, D.; Wang, B.; Feng, P. Adaptations of potato production to future climate change by optimizing planting date, irrigation and fertilizer in the Agro-Pastoral Ecotone of China. Clim. Risk Manag. 2024, 44, 100604. [Google Scholar] [CrossRef]
- Tang, J.; Wang, J.; Wang, E.; Yu, Q.; Yin, H.; He, D.; Pan, X. Identifying key meteorological factors to yield variation of potato and the optimal planting date in the agro-pastoral ecotone in North China. Agric. For. Meteorol. 2018, 256–257, 283–291. [Google Scholar] [CrossRef]


| Data Name | Abbreviation | Sources | Resolution | Time Series | Usage |
|---|---|---|---|---|---|
| Land Use and Land Cover Change | LUCC | Resources and Environmental Science Data Platform (https://www.resdc.cn/) Accessed on 24 January 2024 | 30 m | 2000, 2005, 2010, 2015, and 2020 | PLUS model scenarios and ecosystem service assessment |
| Digital Elevation Model | DEM | Geospatial Data Cloud (https://www.gscloud.cn/#page1/1) Accessed on 25 January 2024 | 30 m | - | PLUS model scenarios |
| SLOPE | - | Extraction from DEM | 30 m | - | PLUS model scenarios |
| ASPECT | - | Extraction from DEM | 30 m | - | PLUS model scenarios |
| Prolonged Artificial Nighttime-light Dataset | NIGHTTIME LIGHT | National Tibetan Plateau Scientific Data Center (https://data.tpdc.ac.cn/home/) Accessed on 25 January 2024 | 1000 m | 2020 | PLUS model scenarios |
| Normalized Difference Vegetation Index | NDVI | National Ecosystem Science Data Center (http://www.nesdc.org.cn/) Accessed on 26 January 2024 | 30 m | 2020 | PLUS model scenarios |
| Gross Domestic Product Data | GDP | Resources and Environmental Science Data Platform (https://www.resdc.cn/) Accessed on 24 January 2024 | 1000 m | 2020 | PLUS model scenarios |
| Population Data | POP | Resources and Environmental Science Data Platform (https://www.resdc.cn/) Accessed on 24 January 2024 | 1000 m | 2020 | PLUS model scenarios |
| Precipitation | PRE | Resources and Environmental Science Data Platform (https://www.resdc.cn/) Accessed on 24 January 2024 | 1000 m | 2020 | PLUS model scenarios |
| Temperature | TEM | Resources and Environmental Science Data Platform (https://www.resdc.cn/) Accessed on 24 January 2024 | 1000 m | 2020 | PLUS model scenarios |
| China County Statistical Yearbook | - | - | vector | 2020 | Ecosystem service assessment |
| National Cost and Benefit Compilation of Agricultural Products | - | - | vector | 2020 | Ecosystem service assessment |
| Primary Ecosystem Service | Secondary Ecosystem Service | Coefficient of ESV | ||||
|---|---|---|---|---|---|---|
| Cropland | Forest | Grassland | Water Area | Unused Land | ||
| Supply service | I | 2201.72 | 384.49 | 408.21 | 1429.87 | 12.17 |
| II | 148.72 | 576.65 | 599.99 | 502.62 | 36.52 | |
| III | −4243.14 | 299.00 | 332.40 | 1044.00 | 24.35 | |
| Adjustment service | IV | 1796.78 | 1897.76 | 2111.66 | 1741.26 | 136.83 |
| V | 922.81 | 3519.96 | 5582.05 | 4647.36 | 121.74 | |
| VI | 275.16 | 1650.63 | 1842.75 | 9935.73 | 391.97 | |
| VII | 4390.89 | 3536.18 | 4089.82 | 172,129.99 | 260.02 | |
| Support service | VIII | 25.17 | 2309.66 | 2572.35 | 2107.01 | 161.18 |
| IX | 307.60 | 176.96 | 196.99 | 160.18 | 12.17 | |
| X | 339.96 | 2102.18 | 2337.79 | 6175.20 | 149.00 | |
| Cultural service | XI | 145.73 | 921.42 | 1031.54 | 4291.19 | 62.33 |
| Summary | 6311.41 | 17,374.91 | 21,105.55 | 204,164.41 | 1368.28 | |
| Land Use Type | Cropland | Forest | Grassland | Water area | Construction Land | Unused Land |
|---|---|---|---|---|---|---|
| Cropland | 1 | 1 | 1 | 1 | 1 | 1 |
| Forest | 1 | 1 | 1 | 1 | 0 | 1 |
| Grassland | 1 | 1 | 1 | 1 | 1 | 0 |
| Water area | 1 | 1 | 1 | 1 | 0 | 0 |
| Construction land | 0 | 0 | 0 | 0 | 1 | 0 |
| Unused land | 0 | 0 | 1 | 0 | 1 | 1 |
| Neighbor Weight | 0.336 | 0.193 | 0.392 | 0.019 | 0.031 | 0.029 |
Disclaimer/Publisher’s Note: The statements, opinions and data contained in all publications are solely those of the individual author(s) and contributor(s) and not of MDPI and/or the editor(s). MDPI and/or the editor(s) disclaim responsibility for any injury to people or property resulting from any ideas, methods, instructions or products referred to in the content. |
© 2024 by the authors. Licensee MDPI, Basel, Switzerland. This article is an open access article distributed under the terms and conditions of the Creative Commons Attribution (CC BY) license (https://creativecommons.org/licenses/by/4.0/).
Share and Cite
Liu, L.; Bao, S.; Han, M.; Li, H.; Hu, Y.; Zhang, L. Dynamic Spatio-Temporal Simulation of Land Use and Ecosystem Service Value Assessment in Agro-Pastoral Ecotone, China. Sustainability 2024, 16, 5922. https://doi.org/10.3390/su16145922
Liu L, Bao S, Han M, Li H, Hu Y, Zhang L. Dynamic Spatio-Temporal Simulation of Land Use and Ecosystem Service Value Assessment in Agro-Pastoral Ecotone, China. Sustainability. 2024; 16(14):5922. https://doi.org/10.3390/su16145922
Chicago/Turabian StyleLiu, Longlong, Shengwang Bao, Maochun Han, Hongmei Li, Yingshuang Hu, and Lixue Zhang. 2024. "Dynamic Spatio-Temporal Simulation of Land Use and Ecosystem Service Value Assessment in Agro-Pastoral Ecotone, China" Sustainability 16, no. 14: 5922. https://doi.org/10.3390/su16145922
APA StyleLiu, L., Bao, S., Han, M., Li, H., Hu, Y., & Zhang, L. (2024). Dynamic Spatio-Temporal Simulation of Land Use and Ecosystem Service Value Assessment in Agro-Pastoral Ecotone, China. Sustainability, 16(14), 5922. https://doi.org/10.3390/su16145922