Abstract
In conditions of economic and political instability, when unpredictability affects business, the need for security, including financial security, becomes particularly important. In our study, we address this issue, with the main objective of comparing and evaluating the financial security of small and medium-sized renewable energy companies in Poland according to sustainable development goals. In order to study and describe relationships between selected groups of companies, financial ratios were used, including canonical variate analysis. The liquidity ratios of the surveyed companies indicated a low level of financial security in terms of the ability to meet short-term liabilities. The profitability of operations was low and did not contribute to the improvement of financial security in most of the companies. The lowest return on assets was found in the group of biogas plants. Higher profitability of assets was found in solar power plants, including those with system installations. Solar power plants were also characterized by a high level of total debt and a rapid turnover of assets in comparison to other studied companies. The results show that the financial security of small and medium-sized renewable energy enterprises in Poland is low, which may be a threat to sustainable development in the future.
1. Introduction
In an era of increasing demand for electricity caused by factors such as the growth of the world’s population, economic development, increased industrial production, technological development and progress, development in transportation (especially electric vehicles), urbanization of cities, and climate change, the production of electricity from various non-conventional sources has become increasingly relevant. The energy transition in the European Union is a key factor of the sustainable development strategy to shift from fossil fuel-based economies to energy systems dominated by renewable energy sources. It is a complex process involving technological, regulatory, social, and economic changes [1]. The growing interest in developing renewable energy technologies reflects the repeated calls for environmental protection formulated by scientists and concerned citizens. The possibility of reducing air and water pollution through the use of green energy has encouraged countries localized in different continents to introduce new regulations, emission limits, and recommendations to slow the pace of climate change, which has resulted in a steady rise in the number of renewable energy power plants and increasing electricity generation across the world. The growing demand for energy in developed and developing countries, which try to maintain energy security and to maintain a clean environment by not emitting greenhouse gases and particulate matter, is additionally accelerating this process [2]. The EU’s energy strategy is based on other objectives contributing to Member States’ sustainable development: less energy dependency through energy costs, the security of supply and costs, better energy networks, climate change mitigation, and environmental protection [3]. All these changes must take place in such a way as to ensure the financial security of those directly involved in RES production. The interest in renewable energy is evidenced by the growth in investment in renewable energy from 9.9 billion USD in 2010 to 18.6 billion USD in 2016 [4]. The importance of renewable energy sources (RES) is also evidenced by the impressive amount of research being conducted in various directions and fields. According to Rahman et al. [5], by 2040 the world energy demand will have increased by 56%. Currently, the dominant types of renewable energy producers are hydropower plants, with a share of over 44%, wind farms with 25%, solar power plants at 24%, and a smaller share taken by geothermal and biomass power plants. Zandi and Haseeb [6] highlighted the positive environmental impacts of green energy. Wang et al. [7], analyzing annual data from 1990 to 2017, confirmed that renewable energy sources are environmentally friendly in G7 countries, while Ji et al. [8] found that RESs reduce pollution. In order to maintain these positive values, RES companies, i.e., wind farms, solar power plants, biogas plants, etc., should operate safely and sustainably free from the various hazards, including financial risks, that could affect them. This issue is particularly important during times of economic crisis, constantly changing legislation, a pandemic, or armed conflict. The absence of threats can generally be understood as security, which in the case of companies refers to financial security, defined as the ability to efficiently manage the resources at one’s disposal and to minimize the risk of adverse financial events such as the loss of business agility, the lack of liquidity, or the ability to cover possible losses [9]. Financial security is important, both in times of prosperity and for the endurance of a firm in times of crisis. There are few scientific works in the literature that examine the problem of the financial security of enterprises producing electricity from renewable energy sources, including small and medium-sized enterprises. In our research we address this problem, with the main objective of comparing and evaluating the financial security of small and medium-sized enterprises producing electricity from various renewable energy sources in Poland.
In pursuit of the main objective, the study formulated the following research questions: (1) Are companies producing electricity from different renewable energy sources financially secure? (2) How do small and medium-sized RES enterprises producing electricity from different renewable energy sources develop financial security in times of crisis and in times of stabilizing economic conditions?
This paper contributes to the existing literature on the financial security of renewable electricity generation companies by including the type of renewable energy source in the study. It also compares financial security under different economic conditions. An important added value of our study is that the analyses were carried out on a sample of small and medium-sized enterprises. To the best of the authors’ knowledge, this is the first time this has been done, as other studies have focused on large companies or included analyses of the manufacturing sector. This research highlights the importance of analyzing the financial security of renewable electricity producers not only under normal operating conditions but also during periods of economic turbulence.
The article is structured as follows: Section 2 consists of two parts, a review of the literature on the renewable energy generation sector and the importance of financial security in companies. Section 3 then discusses the data set and the research methodology, explaining the choice of the used financial indicators and the canonical variable analysis. The results obtained are presented in Section 4. The article concludes with a discussion in Section 5 and conclusions and recommendations in Section 6.
2. Literature Review
2.1. Importance of Renewable Energy Sources
Historically, as supplies of firewood proved insufficient to support the growing economies of Europe and the United States, people turned to hydropower, then coal in the nineteenth century, and then oil and natural gas in the twentieth century. Nuclear power was added to the energy mix in the 1950s. Today, fossil fuels (coal, oil, and natural gas) are by far the most dominant source of energy in the industrialized world. The 21st century is already witnessing the beginning of the next major transition of energy sources towards renewables [10]. Renewable energy sources work on the basis of different mechanisms. Considering these mechanisms, we can distinguish the following types of renewable energy: solar energy, wind energy, geothermal energy, biomass energy, and hydroelectric energy (Figure 1).
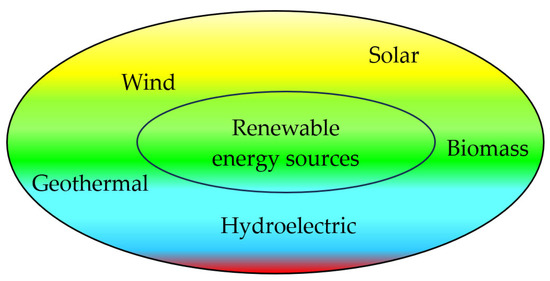
Figure 1.
Renewable energy sources.
The growing demand for energy is leading to increased interest in energy attained from renewable sources. Renewable energy technologies are also a response to repeated calls for environmental protection from scientists and concerned citizens [11]. One of the reasons for these calls is that urban air quality is a real threat to public health in countries where the burning of fossil fuels is still popular. The estimated number of premature deaths in Europe in 2021 due to poor air quality was 253,000 from chronic exposure to fine particulate matter, 52,000 from chronic exposure to nitrogen dioxide, and 22,000 from acute exposure to ozone [12]. Previous studies have considered several major health effects related to the use of solid fuels that affect outdoor air quality, such as infectious respiratory diseases, chronic respiratory diseases, asthma, adverse pregnancy outcomes, and heart disease [13]. As mentioned above, emissions from non-renewable sources such as hard coal and lignite can have a negative impact on air quality, causing a wide range of health problems and reducing quality of life. The use of green energy can limit these problems, especially in the case of heart and bronchial diseases [14]. This is linked to, among other things, limiting carbon emissions and particulate matter in the atmosphere.
Environmental problems can be observed not only as a limitation of air transparency or the presence of smog [15,16] but also in freshwater ecosystems. In such aquatic habitats under pressure from coal mine water discharges, changes in the number of water quality parameters, a decrease in biodiversity, and changes in sediment characteristics can be observed simultaneously [17,18]. Other key issues to address are all aspects of global change. In response to the growing concern about global warming, the Paris Agreement strengthened the efforts to maintain sustainable development by setting a limit to the increase of global warming to below 2 °C above pre-industrial levels and endeavoring to limit the temperature increase to 1.5 °C above pre-industrial levels, recognizing that this would significantly reduce the risks and impacts of climate change [19]. These goals require the creation of a net-zero emissions energy sector to counter fossil fuel-based energy, which currently accounts for two-thirds of global emissions. Renewable energy, combined with energy efficiency and end-use electrification, could deliver 90% of the required CO2 reductions by 2050 [20]. Green energy is a key part of the Nationally Determined Contributions (NDCs), the climate action plans for countries approved under the Paris Agreement. The NDCs differ from country to country depending on the national situation in terms of meeting greenhouse gas emission targets [20].
According to the Eurostat data, the share of RESs in gross final energy consumption in the EU countries increased from 12.6% in 2008 to 23.0% in 2022 [21]. However, this is an average result for all EU countries. The economies of the European Union are very diverse in terms of the sources used to produce electricity. This is confirmed by research conducted by Yu et al. [22] and Kacperska et al. [23]. The unquestionable leaders in this respect are Sweden (66.0%), Finland (47.9%), Latvia (43.3%), Denmark (41.6%), and Austria (33.8%) [21,24]. Sweden, Finland, Austria, Latvia, and Denmark benefit from favorable climatic conditions that correlate with the lack of fossil fuel resources and determine the minimization of energy consumption [3]. Nonetheless, the Central and Eastern European countries also include those for which RESs are still not sufficiently important, with the share of energy from renewable sources remaining low—Ireland (13.1%), Malta (13.4%), Belgium (13.8%), and Luxembourg (14.4%) [21,25,26]. The share of renewables in Poland for 2022 gross final energy consumption reached 16.9% [21,27].
The production of green energy has its individual problems related to intermittent generation (wind and sun energy), recycling processes (wind turbines), and inefficient storage options. Renewable energy can be dependent on weather conditions. This is the case for wind and solar power, which are dependent on the wind and sun, respectively. They also have limitations in terms of available sites, as in the case of wind turbines (regulations on minimum distances from buildings), geothermal energy (often requiring deep drilling), and biogas plants (not suitable for construction in densely populated areas). Thus, RESs can be, to some extent, annoying for residents of nearby homes due to increased noise levels and stroboscopic phenomena (wind turbines), gas emissions to the atmosphere (geothermal), possible odors (biogas plants), poor perception in terms of landscape quality, and impacts on wildlife mainly due to bird mortality caused by horizontal-axis turbines [28,29,30]. These limitations may increase the risk of undertaking business, which may affect the safe operation and development of companies producing energy from different renewable sources.
2.2. Financial Security
Under conditions of economic and political instability as well as the variability of micro- and macro-environmental factors affecting business, the need for security becomes particularly important [31]. According to Maslow’s theory of the hierarchy of needs, among the range of needs and motivations that drive human action, security is at the second level of the hierarchy and forms the basis for higher-order needs (Figure 2).

Figure 2.
Pyramid of business needs (according to Maslow’s ranking of needs).
Therefore, treating an enterprise as an organized human activity, it can be argued that the need for security in an enterprise also plays an important role [31]. The activities of an enterprise are accompanied by many risks that can cause insecurity. In a general sense, security is defined as a state of calm, certainty, and safety [32]. It is often equated with the absence of danger or the presence of active protection [33]. Karbownik [34] emphasizes that a higher level of threat corresponds to a lower level of security (Figure 3).
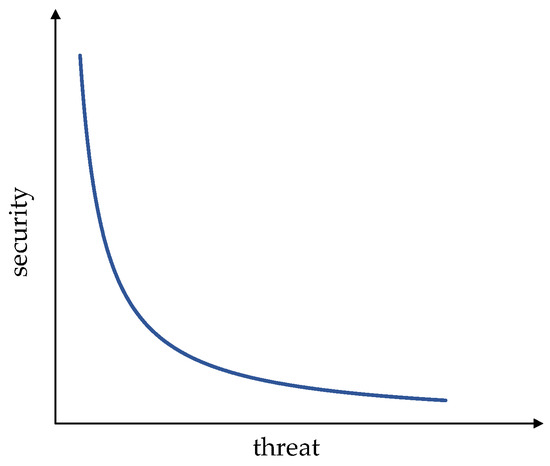
Figure 3.
Security model.
In recent years, increasing attention has been paid to a single component—financial security—which Davydenko [35] explains as the protecting of the financial interests of various entities at all levels of financial relations. Thus, financial security, in its general form as the absence of risk, is considered from the perspective of companies, banks, households, and the state. It can also be considered as an element of financial stability. Financial security affects the achievement of the financial stability of a company. Financial stability is a state in which the financial system as a whole does not show permanent liquidity loss or insolvency [36]. It should also be noted that financial stability is an inherent condition for financial security and vice versa. This approach is in line with the classic division of economic security, which in addition to financial security, takes into account its other dimensions—commodity, energy, social, food, and technological security [37]. Thus, it can be said that enterprise financial security is a component of economic security. Both of these categories can be used as a theoretical framework and methodological apparatus in the study of the substantive features of the concept of “corporate financial security” as an object of control of the financial situation of an entity. This means that the financial security of an enterprise is qualitatively and quantitatively determined by the level of its financial condition [35]. As emphasized by Sylkin and co-authors [38], the financial security of an enterprise is a financial condition of the entity, at which an adequate level of its security is ensured in the long period and there is an opportunity to counteract external and internal risks. In today’s economic reality, achieving the necessary level of financial security of enterprises is a prerequisite for ensuring their sustainable operation and development in the internal and external market environment [39]. Financial security is category of a special kind. This is because, on the one hand, it concerns the creation of conditions for conducting current activities in a continuous and efficient way, and on the other hand, it is oriented towards the development of business activities that result in an increase in the market position and value of the enterprise [40]. Therefore, it is also believed that financial security is one of the stages of the achievement of financial independence by business entities (Figure 4). The achievement of security precedes the stage of the so-called “financial shield”, which means that the company has a level of financial resources that will ensure the continuation of operations in the short term and give time to develop the necessary financial resources for further operations. When a financially secure state is reached, companies provide themselves with the necessary conditions for sustainable continuation of operations and create conditions for growth. The company then has such a stock of production factors that prevent the possibility of bankruptcy or insolvency. This then prevents the short-term risk of bankruptcy. The third stage is financial independence, i.e., a state in which the company has financial resources that will ensure financial security and allow the entity to finance unplanned investments or expenses sometimes unrelated to the business [34]. This is a favorable situation, primarily during unfavorable economic conditions and crisis periods, and also prevents the occurrence of short- and long-term bankruptcy risks.
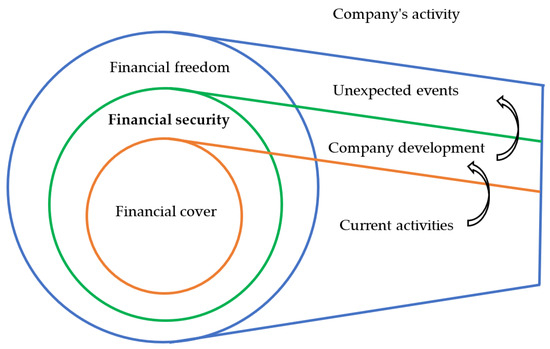
Figure 4.
The role of financial security in building a company’s financial independence.
Identified in this way, the concept of corporate financial security encompasses the issue of a company’s ability to maintain and achieve not only liquidity and financial solvency but also profitability. Raczkowski [41] defines financial security as “the process of continuous reduction and elimination of monetary risk in order to secure capital adequacy in such a way that it is adapted to the risk profile and preferences of a given entity or unit”. The definition highlights the issue of ensuring the liquidity and adequate value of capital in relation to the scale of operations. The level and structure of equity capital are therefore seen as one of the guarantors of safe operations [42]. According to Reverchuk [43], financial security plays a leading role because it is a “remedy” for preventing possible financial losses and bankruptcy. The basis for effective regulation of financial security is a properly structured system of indicators that makes it possible to detect and identify sources and objects of financial risk [44]. Some scientists define corporate financial security as a state of the most efficient use of a company’s resources, in which the financial indicators of liquidity, solvency, profitability of sales, and capital are within the acceptable limits of their threshold values [35]. This is also emphasized by Blakyta and Ganushchak [45], who state that the estimation of financial security is a complex process that involves not only indicators used in the analysis but also their prescriptive values, within which a given indicator must fall. The financial security of a company plays a major role in ensuring its operation, increasing activity and growth [45]. Companies achieve this state as a result of daily efforts over many years to ensure a financial health that will guarantee the existence and development of the company. Therefore, for any company to function efficiently, it must have financial security.
3. Materials and Methods
3.1. Data Collection
The information necessary to present and assess the financial security of the entities under study was obtained from the individual annual financial statements of the companies available at the National Court Register [46]. The study of the companies’ financial security covered the years 2019 and 2021. These years were specifically chosen for the study, as we wanted to capture the behavior of the companies under different economic conditions. The first year is a period of relatively undisturbed economic development and relatively stable regulations for the operation of entities producing energy from renewable sources. In contrast, the second period was a time of global economic decline due to the COVID-19 pandemic, and in Poland, a time of preparation for changes in the way renewable energy production is accounted for. In the year 2022, a transition in accounting for renewable energy production was introduced, switching from net-metering to a new net-billing system [47]. European Union member states were obliged to make this change in order to, among other things, ensure that end users can directly participate in the energy market and benefit from the sale of surplus electricity produced [48]. The survey included 25 companies representing energy production from various renewable energy sources, i.e., onshore wind power plants, offshore wind power plants, geothermal power plants, solar power plants, and biogas plants. Initially, 40 entities were selected for the study, but owing to a lack of complete information in the financial statements, some of them were excluded. The size of the sample by type of source of energy produced is shown in Table 1. Small and medium-sized enterprises were selected for the analysis, which in 2019–2021 continuously conducted their business activities and prepared and published financial statements in the National Court Register. In addition, the entities surveyed were primarily engaged in the one-way renewable energy production business. The exceptions were four companies, i.e., one onshore wind power plant and two solar power plants, in which installation of equipment was carried out in addition to the primary activity, and one company in which energy production was carried out using biogas and solar energy.

Table 1.
Number of surveyed entities by energy source.
3.2. Financial Analyses
Financial security can be defined, analyzed, and assessed in different ways. The main sources of information on the financial performance of a company, including the companies in the renewable energy companies (RECs) industry, are financial indicators [49,50]. When selecting measures for assessing financial security, synthetic measures should be used, which on the one hand provide a wide field of observation and on the other hand make it possible to limit the number of indicators [34]. A review of research conducted in the area of financial security shows that indicator analysis tools are most commonly used to assess financial security, including primarily liquidity, solvency, and business efficiency indicators [51,52]. Kusak [53] notes that liquidity disturbances can lead to financial losses and also undermine the confidence of business partners and financial institutions in the company. The area of creating and ensuring financial security as profitability should is also evaluated. This analysis of the financial security of companies in the REC industry uses indicators from precisely these four areas of financial analysis, i.e., liquidity, solvency, profitability, and efficiency.
Maintaining liquidity as the ability to pay current liabilities on time should be a constant feature of any business, including in companies producing electricity [52]. The choice of liquidity ratios for assessing financial security is debatable. From the group of traditional financial liquidity ratios, two basic ones were originally used in the study, namely the current liquidity ratio and the quick liquidity ratio. The former is calculated by dividing total current assets by total current liabilities [54]. The second ratio is narrower in scope and concerns only current asset items such as receivables, cash, and marketable securities. This excludes the value of stocks. This reduced amount is divided by the total current liabilities [50,55]. Due to the lack of inventory values in many of the units studied, there was a high correlation between these indicators. Therefore, comparative analyses based on the orthogonality of the data set were limited to the current ratio (). In the context of the financial crisis and the associated problem of cash shortages, it has been suggested that classical liquidity measures should be complemented as far as possible by indicators based on cash generation, as they offer a broader possibility for evaluating financial security [54,56]. Unfortunately, this advice could not be applied in this study. This is due to the fact that the surveyed companies are small and medium-sized enterprises, which are not obliged to publish information on cash flow generation according to the current Polish balance sheet law. Thus, in order not to limit the analysis, the assessment of financial liquidity in this study was supplemented by the current debt ratio (), calculated as the share of short-term liabilities and total assets (liabilities) [57]. In this form, the ratio shows the proportion of total capital represented by short-term liabilities. A low level of the ratio indicates secure financing of operations and, at the same time, low financial risk. Pluta and Michalski [58] point out that, unfortunately, a low level of this ratio is the least attractive option because the net profit is small due to high operating costs.
To stay in business and ensure stable growth, companies need to rely on long-term debt [59]. Lenders, investors, and rating agencies have a strong interest in the ability to meet all obligations [50,60]. Therefore, solvency ratios have also been used to assess financial security, to evaluate a company’s ability to meet its obligations in the long term. In our study, in the initial phase of the solvency assessment, two indices of this group were used, i.e., total debt ratio and equity coverage of total assets. As a result of the correlation analysis between these indices, only the total debt–leverage ratio (), calculated as the ratio of total debt to total assets of the enterprise, was used in further studies [57,61]. It is assumed that the value of this ratio should not exceed 50% if a company does not want to operate in a situation of high financial risk. In the contemporary practice of developed economies, this principle is not followed in many countries, and changes occur depending on the economic situation [62]. In favorable economic conditions, the degree of debt increase is driven by the desire to achieve higher profitability. Conversely, economic recessions lead to a more cautious use of external capital and a reduction in the debt ratio [58]. Profitability ratios are used to analyze the ability to make profits and reflect success or failure [50]. From among the many profitability ratios, three classic ones were initially used: return on sales, return on assets, and return on equity. Finally, in comparative analyses based on the assumption of orthogonality of the data set, the return on assets ratio (), calculated as the ratio of net profit to assets, was used. This ratio measures a company’s rate of return on all existing assets [63]. An increase in the ratio indicates that the company is using its assets more efficiently. The higher the ratio, the better the financial health [64], which is also reflected in the security of the company. Financial security is indicated not only by liquidity and profitability but also by the ability to generate sales and the efficiency of asset management. The relationship between a company’s turnover and total assets is determined by the total asset turnover ratio (). This is calculated as the ratio of turnover to total assets [65,66], and it indicates how efficiently a company uses its assets. Its value depends on the particulars of the industry, and it is recommended when comparing the efficiency of enterprises in the same industry [67]. The formulas of the indicators used are shown in Table 2.
Table 2.
Name and construction of the indicators.
3.3. Statistical Methods
Due to the correlations between the financial ratios, multivariate methods were used to analyze the REC industry [50]. It is assumed that denotes the vector of the financial indicators (here ) coming from the th year (i = 1, …, I, here I = 2) for th enterprises (k = 1, …, Nj) from the th predefined group of companies (j = 1, …, J, here J = 8). The multivariate linear model can be written in the form
where is the matrix of observations (N = ), is the vector of general means, is the vector of every element equal to 1, is the matrix of years effects, is the matrix of group effects, is the matrix of interaction effects, , , are design matrices, and is the matrix of errors [68,69]. Finally the considered model can be described in the form
where and [70,71].
Canonical variate coordinates are directions in multivariate space that maximally separate the predefined groups of companies [72,73]. This approach was chosen to simultaneously analyze between-group and within-group covariance matrices [72]. In investigating the relationships between the enterprises and the financial ratios describing them, this method consists of linear transforming of the matrix into a set of new variables, which carry similar information but are distributed in the multivariate Euclidean space [74]. Following the transformation, the vector is converted into a vector , where the vector of object means shifting the input dataset [50,69]. The vectors are determined by the equations , where
and r = the rank of . Using the matrix, the differences between experimental objects are analyzed. Additionally, by using the normalization for all eigenvalues , the canonical variates are arranged to be uncorrelated and have equal within-group variance [73].
On the other hand, the same canonical variate coordinates will allow a determination of the relationship groups of enterprises and the financial indicators in the Euclidean space to be presented. In this case, the analysis is based on a singular value decomposition of the matrix:
where and the vectors , and scalars are determined by the following equations: and . The vectors and are standardized as follows: and . The vectors are called the hth canonical coordinates, and the vectors are called the hth dual canonical coordinates [74]. Dividing dual coordinates by the inverse of the roots of the eigenvalues and shifting using the vector of object means that the averages of the financial ratios for groups of companies in particular years have the same values in both considered canonical spaces [50,69]. To compare groups of companies, the Mahalanobis distances [72,74] were calculated based on the financial ratios.
4. Results of Empirical Research
4.1. Descriptive Statistics
Descriptive statistics make it possible to present the statistical characteristics of the studied variables [65]. Descriptive statistics provide an overview of statistical data regarding minimum, maximum, mean, quartiles, and standard deviations. The results of the descriptive statistical analysis are presented in Table 3 and Table 4.
Table 3.
Descriptive statistics of the data for the year 2019.
Table 4.
Descriptive statistics of the data for the year 2021.
The data show that the current ratio () in the surveyed RECs in 2019 ranged from 0.3 to 21.7, and in 2021 from 0.3 to 17.2. The literature states that the expected values of the current ratio should be in the range of 1.5–2.0 [75,76]. The median current ratio () was 1.5 and 2.0 in the surveyed years, respectively. In the surveyed population, 25% of companies had a current ratio of 1.1–2.0 in 2021, which can be taken as complying with the above recommended range. In 2019, in 50% of the surveyed entities, the level of the indicator was less than or equal to 1.5. On this basis, it can be concluded that half of the surveyed entities may have had difficulties with the timely payment of short-term liabilities. In the year 2021, the median was equal to 2.0. This indicates some improvement in liquidity among the surveyed entities. However, it should be noted that in 25% of the surveyed entities, the current liquidity ratio was within the accepted range. In 25% of the entities it was below, indicating a lack of liquidity, and in 50% it was above, indicating over-liquidity.
The factor that determines financial liquidity is the level of current liabilities [53,60]. Current debt ratio () in the year 2019 was in the range of 1.5% to 94.6%. The asymmetry ratio indicates that during this period there were more entities with a lower share of current liabilities in total capital. The highest values of this indicator occurred in solar power plants and one biogas plant. On the other hand, onshore wind power plants had a small share of short-term liabilities, averaging 12.5%. In 2021, the share of current liabilities decreased, ranging from 0.6% to 92.5%. The average was equal to 26.1%. The asymmetry index indicates that in 2021 there were also more entities in the sample with a lower level of short-term liabilities. Based on this, it can be concluded that more entities in the sample were secure in their ability to pay current liabilities.
In addition to current liabilities, long-term liabilities are included in the loan capital of enterprises [57]. The share of total liabilities in assets indicates solvency [60] and financial security [54]. A high level of debt can lead to bankruptcy [77]. The literature assumes that, from the point of view of financial security, the total debt ratio should be in the range of 57–67% [50,78]. In 2019, the total debt ratio () ranged from 5.0% to 227.8%, and in 2021 from 0.5% to 108.2% (Table 3 and Table 4). The average value in 2019 was 76.9%, and in 2021 it was 57.9%. The data show a clear decrease in total debt in 2021 in the surveyed group of companies. In this group, the level of debt was lower than the lower boundary of the mentioned range in all the examined firms. The median in the year 2021 was 67.6%, which means that in 50% of the surveyed entities, the level of debt did not exceed the upper limit of the adopted recommendations. Therefore, it can be concluded that half of the surveyed entities had a low financial risk and were characterized by financial security. The asymmetry indicator shows that there were more entities with a higher level of total debt.
The financial security of companies is evidenced not only by their liquidity and solvency but also by their ability to generate profit [50]. The data show that the return on assets () in 2019 ranged from −51.5% to 45.8%. The lower quartile was −4.2%, which shows that 25% of the companies were unprofitable and the deficit rate was −4.2% or even more. The average value of return on assets was 3.5%, and the median was equal to 4.3%. This means that in 50% of the entities, the profitability was equal to or higher than 4.3%. In 2021, the financial result measured by return on assets had the lowest value of −3.8% and the highest value of 37.5%; the average was 7.5%, and the median was 3.7%. This indicates improved profitability, including slightly greater financial security compared to 2019. The reason for the low profitability of assets may be the slow turnover of assets, which is assessed as low efficiency [67]. In 2019, asset turnover measured by the total asset turnover ratio () had the lowest value of 0.0 and the highest value of 4.0; the average value was 0.9, and the standard deviation value was 1.7. The asymmetry ratio indicates that more entities had a lower total asset turnover ratio. In 2021, the average value of the indicator increased and reached 1.2. The median remained almost at the same level and was equal to 0.5. This means that in the case of 50% of the studied entities, the turnover of assets was equal to or slower than 0.5. In both analyzed periods, the efficiency of operations was low and did not contribute to the improvement of financial security in most of companies.
4.2. Comparison of the Groups of Renewable Energy Companies
In Figure 5, groups of renewable energy companies in terms of financial security indices are compared. The division of the examined REC groups resulted firstly from the variability of the current debt ratio () and secondly from the return on assets (). In both the analyzed years, 2019 and 2021, solar power plants and onshore wind power plants with the installation of systems had a high share of current liabilities in total capital (from 74.4% to 94.9% in 2019 and 82.5% to 92.5% in 2021) compared to other REC groups. On the other hand, solar power plants with the installation of systems were characterized by relatively lower values of the current debt ratio than in the case of solar power plants and onshore wind power plants with the installation of systems group but had significantly higher values than the other groups. In other REC groups, i.e., onshore wind power plants, offshore wind power plants, geothermal heat plants, biogas plants, and biogas plants with solar power plants, the current debt ratio was significantly lower but at an aligned level. The average values in the studied groups in 2019 were 12.3%, 5.4%, 9.3%, 26.8%, and 18.5%, respectively. In 2021, these values changed slightly, and it is worth emphasizing that the lowest share of the current liabilities of total capital was recorded by the offshore wind power plants, which were also characterized by high current ratios in both studied years. This indicates that these entities maintain financial security as measured by financial liquidity ratios. The second source of variability in the surveyed groups of companies was return on assets. A relatively high return on assets was recorded by solar power plants with the installation of systems. In these entities, profitability was strongly related to total asset turnover. This phenomenon was clearly observed in 2021, when both indicators were high. This suggests that faster turnover of assets contributed to an increase in the return on total assets.
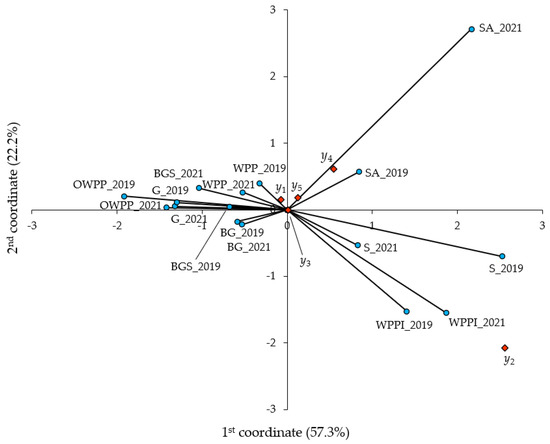
Figure 5.
Renewable energy company groups according to the values of financial security indicators. (“red” means the indicators; “blue” means the experimental objects).
Faster turnover in these entities was caused by an increase in sales revenues, probably obtained from the installation of new photovoltaic installations for customers. This was probably related to the introduction of changes in the legal regulations concerning the settlement of renewable energy source production in the following year. The lowest return on assets, indicating the deficit of the conducted business, was recorded in the biogas plant group. In this group, more than half of the companies suffered a financial loss in 2019. In 2021, the situation improved, but only two companies were unprofitable. The average return on assets in this group was equal to 8.1%. In the other groups, the return on assets also improved in 2021, which indicates an improvement in financial security.
Total debt ratio had the least impact on the diversity of the REC groups included in the study. The reason for this situation was the relatively low share of long-term liabilities in borrowed capital. In the onshore groups of companies, the wind power plants, geothermal heat plants, the biogas plants, and the biogas plants with a solar power plants had similar values for all indicators included in the analysis. Onshore wind power plants and the geothermal heat plant companies outperformed the other two groups.
4.3. Differentiation of Renewable Energy Companies in Terms of Financial Security
The next stage of the research was to determine the difference of REC companies in terms of financial security factors. In 2019, a greater difference was observed between the groups of companies and companies within groups (Figure 6).
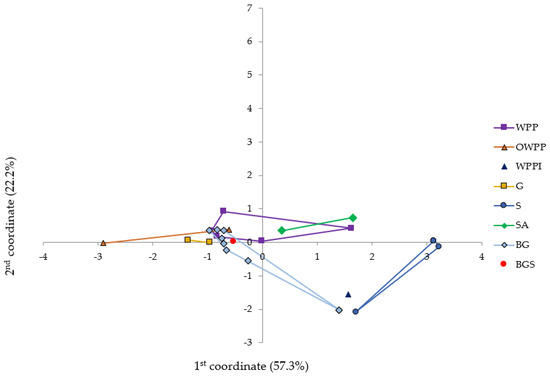
Figure 6.
Differentiation of renewable energy companies for the year 2019.
In 2019, two solar power plant companies were obviously outliers. Both companies were characterized by above-average profitability in comparison with the other surveyed entities (36.3% and 8.5%), high levels of total debt (74.4% and 94.9%), and rapid asset turnover (above 3.5). All indicator values were above average in terms of the surveyed population of companies. The liquidity ratio in both companies was below average. On the other hand, one company of the offshore wind power plants was exceptional, as characterized by a high deficit (−50.3%), relatively high liquidity (2.7), and a low level of total debt, including short-term debt (both indicators characterizing the level of debt were 6.8%) and a slow turnover of assets. The index values determined the Mahalanobis distances calculated for the groups. The largest Mahalanobis distance in the year 2019 was found between the group of solar power plants and the group of offshore wind power plants, with a value of 22.92 (Table 5). In contrast, the lowest Mahalanobis distance was recorded between the offshore wind power plant group and the biogas plant with a solar power plant group (0.98). These enterprises were characterized by a low proportion of short-term liabilities and a slow turnover of assets. In second place, in terms of similarity, were the biogas plants and the biogas plants with a solar power station. The determinants of similarity were a low proportion of short-term liabilities, slow asset turnover, and low profitability. It is worth noting that these two groups of enterprises used the same source of green energy, i.e., biomass.
Table 5.
Mahalanobis distances between particular renewable energy groups of companies, on the basis of financial security features and the general means, in the year 2019.
In 2021, the financial situation of the companies surveyed changed significantly. As shown earlier, financial performance had improved, and this was reflected in better profitability ratios, liquidity, and efficiency in many enterprises. This was reflected in a narrowing of the gap between the groups of surveyed enterprises (Figure 7). However, there was still a large gap between one company involving solar power plants with system installation and the other surveyed companies. The determinants of the differences were high profitability, liquidity, and a low share of total liabilities, including current liabilities in total capital. The second group of units that differed from the others comprised the onshore wind turbines with system installation. This is indicated by the high values of the calculated Mahalanobis distances (Table 6). In both distinct groups of enterprises, the activities carried out were diversified. In addition to energy production, the companies were also active in the service business of installing green energy equipment.
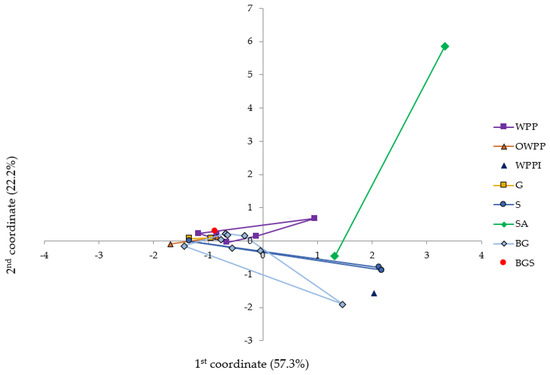
Figure 7.
Differentiation of renewable energy companies for the year 2021.
Table 6.
Mahalanobis distances between particular renewable energy groups of companies, on the basis of financial security features and the general means, in the year 2021.
Comparing the results of the companies in the years under consideration, it can be seen that the values of the indicators included in the analysis changed only slightly in the groups of onshore wind power plants with the installation of systems, geothermal power plants, biogas plants, and biogas plants with solar power plants. The largest changes in the values of the indicators occurred in the groups of solar power plants with system installation and solar power plants. The Mahalanobis distances were 8.46 and 3.15, respectively (Table 7). This situation was probably related to the legislative changes that were to come into force in the following year, which mainly affected solar power plants.
Table 7.
Mahalanobis distances between particular renewable energy groups of companies.
5. Discussion
The financial security of an enterprise plays a central role in ensuring its functioning and increasing its activity and development [45]. Therefore, financial security is also called the financial assurance of the existence and development of an enterprise [34]. To assess the degree of financial security, several tools of indicator analysis are used. Raczkowski [41] provides 37 ratios of financial security. Such a wide range of indicators can lead to difficulties in proper assessment and conclusions [49,54]. Gołaś [79] emphasizes that the number of indicators should be limited and adapted to the aim of the study. Karbownik [34] agrees with this statement and recommends that synthetic measures with a wide field of observation should be used in the selection of indicators to assess financial security.
For this reason, multivariate statistical methods [50] are applied to determine correlations between financial indicators. Multiple regression has often been used to investigate correlations between financial indicators. The advantage of this method is that making a prediction for a single financial indicator and assuming a homogeneous structure of the data set indicates the direction and strength of the independent variables affecting the dependent variable. Additionally, modifications of this method are used, such as logit and probit analysis [80,81] and the use of artificial neural networks [82,83]. This leads to a higher overall prediction accuracy. However, the disadvantage of this approach is the assumption that the variables from which the values of the explanatory variable are estimated are independent. One method that can solve this problem is a linear transformation of the output variables into principal components that are uncorrelated and include information about the studied phenomenon [84,85]. On the other hand, after assuming that the studied groups are distinct, one can additionally use a discriminant function that assigns companies to selected classes, e.g., bankrupt or functioning companies [86,87,88,89]. In the case of a simultaneous analysis of several disconnected groups, one should use canonical variable analysis instead of principal component analysis [50]. This paper provides an example of how to analyze differences between groups of enterprises, taking into account two sources of variation—variation by type of enterprise and by year of study. This can lead to much deeper and broader inferences from the comparative analysis of groups of companies.
In our research, we considered five factors describing security in two periods characterized by different economic conditions. Among these five factors, two sources of volatility were identified: liquidity and profitability. Similar results have been presented for Belgian companies by Deloof [90], for Greek companies by Lazaridis and Tryfonidis [91], and for Polish food companies by Czerwińska et al. [50]. It should be noted that in our study the most important measure in the group of liquidity ratios was the current ratio. On the other hand, the most important measure in the cited studies was the cash conversion cycle.
The second indicator used to differentiate the surveyed enterprises was the return on assets, which in the case of solar power plants with system installation, was strongly linked to the total turnover of assets and the level of indebtedness. The profitability of these companies was higher than the average of the population of companies studied. This may indicate that the formation of profitability levels in these enterprises is linked to faster asset turnover and capital leverage. However, the units with low profitability (biogas plants and biogas plants with solar power plants) had a slow turnover of assets and a low share of liabilities. Similar relationships between profitability and asset turnover have been shown for Polish food companies by Bieniasz et al. [92] and Bieniasz [93] and for Nigerian companies by Olaoye [94]. This suggests that in the studied companies, activity is important for maintaining financial security.
Our research found that renewable energy companies were generally characterized by a low level or lack of profitability, especially in the first year of the analysis, in conditions of relative economic calm. On the other hand, during the period of preparing for the new economic situation that would follow the introduction of new regulations, i.e., the period of uncertainty, the RES companies tried to improve profitability, reduce debt, and at the same time maintain financial liquidity. Gajdosikova et al. [95], in a study of Slovakian firms in the construction sector, found that the global health crisis (COVID-19 pandemic) had a particularly negative impact on firm profitability. A similar finding is presented by Petitjean [96], who noted that environmentally friendly policies, such as climate change initiatives, do not bring significant financial benefits during periods of economic downturn. Furthermore, the same author concludes that in times of crisis, firms are expected to focus solely on economic survival and asset returns and thus become more sensitive after a crisis than before. In a study of Australian companies, Ramiah et al. [97] found that their working capital management practices changed in response to the crisis, shifting to more conservative policies that prioritized liquidity and risk minimization. In other words, investing in certain environmental policies may be more financially viable after a crisis than before.
6. Conclusions
In conditions of economic and political instability, the need for security becomes particularly significant given the unpredictability of micro- and macro-environmental factors [31]. Financial security gives the company a sense of confidence in the operation of the business and provides an opportunity for its development. It is therefore an important and topical issue for business, and in this case, for renewable energy companies.
The liquidity ratios of the surveyed companies indicated a low level of financial security in terms of the ability to meet short-term liabilities. For the majority of enterprises, liquidity was below the level considered to be secure. The situation improved in 2021 when the share of short-term liabilities decreased, thus resulting in a significant improvement of the liquidity ratio.
In both studied periods, the efficiency of operations was low and did not contribute to the improvement of financial security in most of the companies. The lowest return on assets, indicating a deficit of the conducted business, was recorded in the group of biogas plants. High profitability of assets was found in the case of solar power plants with system installation. This phenomenon was clearly observed in 2021, when both indicators were high.
The next stage of the study was to determine the differentiation of RES companies in terms of financial security factors. In 2019, greater differentiation was observed between groups of companies and companies within groups. In that year, there was a clear outlier in the two companies in the solar power group. In comparison to other studied companies, solar power plants were also characterized by above-average profitability and by high levels of total debt and rapid asset turnover. For these companies, profitability was strongly linked to the turnover of assets. In conclusion, we can confirm that companies, including those in the renewable energy sector, secure their operations in times of crisis by ensuring liquidity and also pay more attention to securing profitability in postcrisis periods.
Our study shows that biogas plants should pay attention to asset turnover to im-prove profitability. Solar and wind power plants, on the other hand, should control the proportion of current liabilities, especially as current assets for these companies consist mainly of cash and receivables. Companies with diversified operations are safer, as the study confirms.
The presented results show that small and medium-sized RECs in Poland are characterized by low financial security. Greater differences were observed between groups of companies than between companies within the surveyed groups. This study offers a strong contribution to the research on RECs and their financial health in particular. However, it does not provide answers to all our questions and does not fill all the existing gaps in the scientific knowledge. Such areas include the identification of key determinants of REC financial health as well as the impact of business diversification on financial performance. Potentially, future studies should be focused on identifying the determinants of financial security across groups of entities and across different economic conditions using deterministic methods.
Author Contributions
Conceptualization, D.K. and D.C.-K.; methodology, D.K., J.F. and D.C.-K.; software, D.K.; validation, R.S., J.F. and D.C.-K.; formal analysis, D.K., J.F. and D.C.-K.; investigation, J.F. and D.C.-K.; data curation, J.F. and D.C.-K.; writing—original draft preparation, D.K., R.S., J.F. and D.C.-K.; writing—review and editing, D.K., R.S., J.F. and D.C.-K.; visualization, D.K.; supervision D.C.-K.; funding acquisition, J.F., D.C.-K. and R.S. All authors have read and agreed to the published version of the manuscript.
Funding
The publication and research were co-financed by Faculty of Environmental and Mechanical Engineering (including research topic 506.868.06.00/UPP) and Faculty of Economics of Poznan University of Life Sciences (506.000.08 UPP).
Institutional Review Board Statement
Not applicable.
Informed Consent Statement
Not applicable.
Data Availability Statement
The data presented in this study are available on request from the first author.
Conflicts of Interest
The authors declare no conflicts of interest.
References
- Manowska, A.; Bluszcz, A.; Chomiak-Orsa, I.; Wowra, R. Towards Energy transformation: A case study of EU countries. Energies 2024, 17, 1778. [Google Scholar] [CrossRef]
- Durmuş, Ş.H.N. A bibliometric analysis study of renewable energy’s public health benefits. J. Energy Syst. 2023, 7, 132–157. [Google Scholar] [CrossRef]
- Simionescu, M.; Păuna, C.B.; Diaconescu, T. Renewable Energy and economic performance in the context of the european green deal. Energies 2020, 13, 6440. [Google Scholar] [CrossRef]
- Chrzanowski, M.; Zawada, P. Fraction separation potential in the recycling process of photovoltaic panels at the installation site—A conceptual framework from an economic and ecological safety perspective. Energies 2023, 16, 2084. [Google Scholar] [CrossRef]
- Rahman, A.; Farrok, O.; Haque, M.M. Environmental impact of renewable energy source based electrical power plants: Solar, wind, hydroelectric, biomass, geothermal, tidal, ocean, and osmotic. Renew. Sustain. Energy Rev. 2022, 161, 112279. [Google Scholar] [CrossRef]
- Zandi, G.; Haseeb, M. The importance of green energy consumption and agriculture in reducing environmental degradation: Evidence from Sub-Saharan African countries. Int. J. Financ. Res. 2019, 10, 215. [Google Scholar] [CrossRef]
- Wang, L.; Chang, H.L.; Rizvi, S.K.A.; Sari, A. Are eco-innovation and export diversification mutually exclusive to control carbon emissions in G-7 countries? J. Environ. Manag. 2020, 270, 110829. [Google Scholar] [CrossRef] [PubMed]
- Ji, X.; Umar, M.; Ali, S.; Ali, W.; Tang, K.; Khan, Z. Does fiscal decentralization and eco-innovation promote sustainable environment? A case study of selected fiscally decentralized countries. Sustain. Dev. 2021, 29, 79–88. [Google Scholar] [CrossRef]
- Czerwińska-Kayzer, D.; Bieniasz, A. Financial safety of companies producing feed for livestock. Ann. Pol. Assoc. Agric. Agribus. Econ. 2016, 18, 64–69. [Google Scholar]
- Timmons, D.; Harris, J.M.; Roach, B. The Economics of Renewable Energy; Global Development and Environment Institute, Tufts University: Medford, MA, USA, 2014; Available online: https://www.bu.edu/eci/files/2019/06/RenewableEnergyEcon.pdf (accessed on 8 July 2024).
- Žarković, M.; Lakić, S.; Ćetković, J.; Pejović, B.; Redzepagic, S.; Vodenska, I.; Vujadinović, R. Effects of renewable and non-renewable energy consumption, GHG, ICT on Sustainable Economic Growth: Evidence from Old and New EU Countries. Sustainability 2022, 14, 9662. [Google Scholar] [CrossRef]
- EEA. Harm to Human Health from Air Pollution in Europe: Burden of Disease 2023. Available online: https://www.eea.europa.eu/publications/harm-to-human-health-from-air-pollution/ (accessed on 24 February 2024).
- Holdren, J.P.; Smith, K.R. Energy, the environment, and health. In World Energy Assessment: Energy and the Challenge of Sustainability; Communications Development Incorporated: Washington, DC, USA, 2015; Volume 3, pp. 62–110. Available online: https://www.undp.org/sites/g/files/zskgke326/files/publications/chapter3.pdf (accessed on 8 July 2024).
- Mujtaba, G.; Shahzad, S. Air pollutants, economic growth and public health: Implications for sustainable development in OECD countries. Environ. Sci. Pollut. Res. 2021, 28, 12686–12698. [Google Scholar] [CrossRef] [PubMed]
- Aunan, K.; Hansen, M.H.; Wang, S. Introduction: Air pollution in China. China Q. 2018, 234, 279–298. [Google Scholar] [CrossRef]
- Flaga-Maryańczyk, A.; Baran-Gurgul, K. The impact of local anti-smog resolution in Cracow (Poland) on the concentrations of PM10 and BaP based on the results of measurements of the state environmental monitoring. Energies 2022, 15, 56. [Google Scholar] [CrossRef]
- Kroll, A.; Amézaga, J.; Younger, P.; Wolkersdorfer, C. Regulation of mine waters in the European Union: The contribution of scientific research to policy development. Mine Water Environ. 2002, 21, 193–200. [Google Scholar] [CrossRef]
- Staniszewski, R.; Niedzielski, P.; Sobczyński, T.; Sojka, M. Trace elements in sediments of rivers affected by brown coal mining: A potential environmental hazard. Energies 2022, 15, 2828. [Google Scholar] [CrossRef]
- The Paris Agreement. United Nations Framework Convention for Climate Change; The Paris Agreement: Paris, France, 2016; pp. 1–60. Available online: https://unfccc.int/sites/default/files/resource/parisagreement_publication.pdf (accessed on 8 July 2024).
- IRENA. Energy Transition Holds Key to Tackle Global Energy and Climate Crisis. Available online: https://www.irena.org/news/pressreleases/2022/Mar/Energy-Transition-Holds-Key-to-Tackle-Global-Energy-and-Climate-Crisis (accessed on 24 February 2024).
- Eurostat Database. Available online: https://ec.europa.eu/eurostat/data/database (accessed on 3 July 2024).
- Yu, B.; Fang, D.; Yu, H.; Zhao, C. Temporal-spatial determinants of renewable energy penetration in electricity production: Evidence from EU countries. Renew. Energy 2021, 180, 438–451. [Google Scholar] [CrossRef]
- Kacperska, E.; Łukasiewicz, K.; Pietrzak, P. Use of renewable energy sources in the European Union and the Visegrad Group Countries—Results of cluster analysis. Energies 2021, 14, 5680. [Google Scholar] [CrossRef]
- Brodny, J.; Tutak, M.; Bindzár, P. Assessing the level of renewable energy development in the European Union Member States. A 10-year perspective. Energies 2021, 14, 3765. [Google Scholar] [CrossRef]
- Wałachowska, A.; Ignasiak-Szulc, A. Comparison of renewable energy sources in ‘New’ EU Member States in the context of national energy transformations. Energies 2021, 14, 7963. [Google Scholar] [CrossRef]
- Gajdzik, B.; Nagaj, R.; Wolniak, R.; Bałaga, D.; Žuromskaitė, B.; Grebski, W.W. Renewable energy share in European industry: Analysis and extrapolation of trends in EU countries. Energies 2024, 17, 2476. [Google Scholar] [CrossRef]
- Kryszk, H.; Kurowska, K.; Marks-Bielska, R.; Bielski, S.; Eźlakowski, B. Barriers and prospects for the development of renewable energy sources in Poland during the energy crisis. Energies 2023, 16, 1724. [Google Scholar] [CrossRef]
- Agarwal, T.; Verma, S.; Gaurh, A. Issues and challenges of wind energy. In Proceedings of the 2016 International Conference on Electrical, Electronics, and Optimization Techniques (ICEEOT), Chennai, India, 3–5 March 2016; pp. 67–72. [Google Scholar] [CrossRef]
- Tagne, R.F.T.; Dong, X.; Anagho, S.G.; Kaiser, S.; Ulgiati, S. Technologies, challenges and perspectives of biogas production within an agricultural context. The case of China and Africa. Environ. Dev. Sustain. 2021, 23, 14799–14826. [Google Scholar] [CrossRef]
- Tawalbeh, M.; Al-Othman, A.; Kafiah, F.; Abdelsalam, E.; Almomani, F.; Alkasrawi, M. Environmental impacts of solar photovoltaic systems: A critical review of recent progress and future outlook. Sci. Total Environ. 2021, 759, 143528. [Google Scholar] [CrossRef] [PubMed]
- Delas, V.; Nosova, E.; Yafinovycha, O. Financial security of enterprises. Procedia Econ. Financ. 2015, 27, 248–266. [Google Scholar] [CrossRef][Green Version]
- Zięba, R. Institutionalisation of European Security: Concepts-Structures–Functioning; Scholar: Warszawa, Poland, 2004; p. 461. [Google Scholar]
- Kraś, I. Policy of the Central Bank and financial security of a state. Przegl. Strateg. 2013, 1, 185–200. [Google Scholar] [CrossRef][Green Version]
- Karbownik, L. The concept and areas of creation and assurance of the enterprise financial security. Acta Univ. Lodz.—Folia Econ. 2012, 267, 63–77. [Google Scholar]
- Davydenko, N.M. Genesis of enterprise financial security. Econ. Process. Manag. Int. Sci. E-J. 2015, 2. Available online: https://essuir.sumdu.edu.ua/bitstream-download/123456789/40296/1/Davydenko.pdf;jsessionid=2DAA72119D63A7D8D938630FCE498E67 (accessed on 8 July 2024).
- Crockett, A. Why is financial stability a goal of public policy. Econ. Rev. 1997, 4, 8–12. [Google Scholar]
- Redo, M.; Siemiątkowski, P. External Financial Security of the State; Nicolaus Copernicus University in Toruń: Toruń, Poland, 2017; p. 161. [Google Scholar] [CrossRef]
- Sylkin, O.; Kryshtanovych, M.; Zachepa, A.; Bilous, S.; Krasko, A. Modeling the process of applying anti-crisis management in the system of ensuring financial security of the enterprise. Bus. Theory Pract. 2019, 20, 446–455. [Google Scholar] [CrossRef]
- Sosnovska, O.; Zhytar, M. Financial architecture as the base of the financial safety of the enterprise. Balt. J. Econ. Stud. 2018, 4, 334–340. [Google Scholar] [CrossRef]
- Melnychenko, O. Is artificial intelligence ready to assess an enterprise’s financial security? J. Risk Financ. Manag. 2020, 13, 191. [Google Scholar] [CrossRef]
- Raczkowski, K. Financial security. In Economics of National Security in Outline; Płaczek, J., Ed.; Difin: Warsaw, Poland, 2014; pp. 299–324. [Google Scholar]
- Chmelíková, G. Possibilities and limits for capital structure optimalising model design of Czech dairy industry. Agric. Econ. 2002, 48, 321–326. [Google Scholar] [CrossRef]
- Reverchuk, N.Y. Economical Security Management of Enterprise Structures; LBI NBU: Lviv, Ukraine, 2004; p. 195. [Google Scholar]
- Gospodarchuk, G.; Suchkova, E. Financial stability: Problems of inter-level and cross-sectoral equilibrium. Equilib. Q. J. Econ. Econ. Policy 2019, 14, 53–79. [Google Scholar] [CrossRef]
- Blakyta, G.; Ganushchak, T. Enterprise financial security as component of the economic security of the state. Invest. Manag. Financ. Innov. 2018, 15, 248–256. [Google Scholar] [CrossRef]
- National Court Register. Available online: https://web.archive.org/web/20230327163623/https://www.arch.ms.gov.pl/en/national-registers/national-court-register/ (accessed on 30 September 2023).
- Dz, U. 2021 poz. 2376. Available online: https://isap.sejm.gov.pl/isap.nsf/DocDetails.xsp?id=WDU20210002376 (accessed on 30 September 2023).
- Directive (EU) 2019/944 of the European Parliament and of the Council of 5 June 2019 on Common Rules for the Internal Market for Electricity and Amending Directive 2012/27/EU (Recast). Text with EEA Relevance. Available online: http://data.europa.eu/eli/dir/2019/944/oj (accessed on 30 September 2023).
- Pitera, R. Financial Ratios as a Source of Information about the Company’s Financial Condition; Silva Rerum: Poznan, Poland, 2015; p. 112. [Google Scholar]
- Czerwińska-Kayzer, D.; Florek, J.; Staniszewski, R.; Kayzer, D. Application of canonical variate analysis to compare different groups of food industry companies in terms of financial liquidity and profitability. Energies 2021, 14, 4701. [Google Scholar] [CrossRef]
- Zuba, J. Influence of indebtedness on the profitability and the financial safety of chosen milk co-operatives in Poland. Ann. Pol. Assoc. Agric. Agribus. Econ. 2014, 16, 344–349. [Google Scholar]
- Borowiec, L.; Kacprzak, M.; Król, A. Information value of individual and consolidated financial statements for indicative liquidity assessment of Polish Energy Groups in 2018–2021. Energies 2023, 16, 3670. [Google Scholar] [CrossRef]
- Kusak, A. Financial Liquidity. Analysis and Management; Scientific Publishing House of the Faculty of Management of the University of Warsaw: Warsaw, Poland, 2006; p. 221. [Google Scholar]
- Wasilewski, M.; Ganc, M.A. dynamic and static view of the financial security of dairy cooperatives. Ann. Pol. Assoc. Agric. Agribus. Econ. 2021, 23, 109–119. [Google Scholar] [CrossRef]
- Kirkham, R. Liquidity analysis using cash flow ratios and traditional ratios: The telecommunications sector in Australia. J. New Bus. Ideas Trends 2012, 10, 1–13. Available online: http://www.jnbit.org (accessed on 28 July 2020).
- Sharma, D.S. The role of cash flow information in predicting corporate failure: The state of the literature. Financ. Manag. 2001, 27, 3–28. [Google Scholar] [CrossRef]
- Panova, E. Determinants of capital structure in Russian small and medium manufacturing enterprises. Equilib. Q. J. Econ. Econ. Policy 2020, 15, 361–375. [Google Scholar] [CrossRef]
- Pluta, W.; Michalski, G. Short-Term Capital Management. How to Maintain Financial Liquidity, 2nd ed.; C.H. Beck: Warsaw, Poland, 2013; p. 154. [Google Scholar]
- Kramoliš, J.; Dobeš, K. Debt as a financial risk factor in SMEs in the Czech Republic. Equilib. Q. J. Econ. Econ. Policy 2020, 15, 87–105. [Google Scholar] [CrossRef]
- Kajananthan, R.; Velnampy, T. Liquidity, solvency and profitability analysis using cash flow ratios and traditional ratios: The telecommunication sector in Sri Lanka. Res. J. Financ. Account. 2014, 5, 163–171. Available online: https://core.ac.uk/download/pdf/234630372.pdf (accessed on 8 July 2024).
- Jaworski, J.; Czerwonka, L. Determinants of Enterprises’ Capital structure in energy industry: Evidence from European Union. Energies 2021, 14, 1871. [Google Scholar] [CrossRef]
- Ritcher, F.; Petrusch, E. Internationale Entwicklung der Rentabilität und der Eigenkapitalentwicklung von Industriebetrieben, vergleichen anhand aggregierter Bilanzdaten. J. Betriebswirtschaft 1983, 33, 130–141. [Google Scholar]
- Kamar, K. Analysis of the effect of return on equity (ROE) and debt to equity ratio (DER) on stock price on cement industry listed in Indonesia Stock Exchange (IDX) in the year of 2011–2015. Int. J. Bus. Manag. 2017, 19, 66–76. [Google Scholar] [CrossRef]
- Robinson, T.; Henry, E.; Pirie, W.; Broihahn, M. International Financial Statement Analysis, 3rd ed.; John Wiley & Sons Inc.: Hoboken, NJ, USA, 2015; p. 1072. [Google Scholar]
- Nurlaela, S.; Mursito, B.; Kustiyah, E.; Istiqomah, I.; Hartono, S. Asset turnover, capital structure and financial performance consumption industry company in Indonesia Stock. Exchange. Int. J. Econ. Financ. 2019, 9, 297–301. [Google Scholar] [CrossRef]
- Wang, G.; Bai, J.; Xing, J.; Shen, J.; Dan, E.; Zheng, X.; Zhang, L.; Liu, P.; Feng, R. Operational efficiency and debt cost: The mediating effect of carbon information disclosure in Chinese Listed Companies. Sustainability 2023, 15, 1512. [Google Scholar] [CrossRef]
- Florek, J.; Stanisławska, J.; Czerwinska-Kayzer, D. The financial situation of the food industry in Poland in comparison with 2005 and 2010. Ann. Pol. Assoc. Agric. Agribus. Econ. 2015, 17, 41–48. [Google Scholar]
- Sajnóg, A.; Koko, E.; Kayzer, D.; Barałkiewicz, D. Chemometric approach to find relationships between physiological elements and elements causing toxic effects in herb roots by ICP-MS. Sci. Rep. 2021, 11, 20683. [Google Scholar] [CrossRef]
- Zydlik, Z.; Kayzer, D.; Zydlik, P. The influence of some climatic conditions on the yield and fruit quality of replanted apple orchard. Pol. J. Environ. Stud. 2024, 33, 4493–4501. [Google Scholar] [CrossRef]
- Kayzer, D.; Frankowski, P.; Zbierska, J.; Staniszewski, R. Evaluation of trophic parameters in newly built reservoir using canonical variates analysis. In Proceedings of the XLVIII Seminar of Applied Mathematics, Boguszów-Gorce, Poland, 9–11 September 2018; Volume 23, p. 00019. [Google Scholar] [CrossRef]
- Kupiec, J.M.; Staniszewski, R.; Kayzer, D. Assessment of water quality indicators in the Orla river nitrate vulnerable zone in the context of new threats in Poland. Water 2022, 14, 2287. [Google Scholar] [CrossRef]
- Krzanowski, W.J. Principles of Multivariate Analysis: A User’s Perspective, 2nd ed.; Oxford University Press: New York, NY, USA, 2000; p. 608. [Google Scholar]
- Campbell, N.A.; Atchley, W.R. The geometry of canonical variate analysis. Syst. Biol. 1981, 30, 268–280. [Google Scholar] [CrossRef]
- Lejeune, M.; Caliński, T. Canonical analysis applied to multivariate analysis of variance. J. Multivar. Anal. 2000, 72, 100–119. [Google Scholar] [CrossRef]
- Sukiennik, M. The analysis of mining company liquidity indicators. J. Min. Geoengin. 2012, 36, 339–344. [Google Scholar]
- Tóth, M.; Čierna, Z.; Serenčéš, P. Benchmark values for liquidity ratios in Slovak agriculture. Acta Sci. Pol. Oecon. 2013, 12, 83–90. [Google Scholar]
- Anuara, H.; Chin, O. The development of debt to equity ratio in capital structure model: A case of micro franchising. Procedia Econ. Financ. 2016, 35, 274–280. [Google Scholar] [CrossRef]
- Sierpińska, M.; Jachna, T. Assessment of Enterprises According to World Standards; PWN: Warszawa, Poland, 2007; p. 406. [Google Scholar]
- Gołaś, Z. Effect of inventory management on profitability: Evidence from the Polish food industry: Case study. Agric. Econ./Zeměd. Ekon. 2020, 66, 234–242. [Google Scholar] [CrossRef]
- Toudas, K.; Archontakis, S.; Boufounou, P. Corporate bankruptcy prediction models: A comparative study for the construction sector in Greece. Computation 2024, 12, 9. [Google Scholar] [CrossRef]
- Pavlicko, M.; Mazanec, J. Minimalistic logit model as an effective tool for predicting the risk of financial distress in the Visegrad Group. Mathematics 2022, 10, 1302. [Google Scholar] [CrossRef]
- Prado, J.W.; Carvalho, F.M.; Benedicto, G.C.; Lima, A.L.R. Analysis of credit risk faced by public companies in Brazil: An approach based on discriminant analysis, logistic regression and artificial neural networks. Estud. Gerenc. 2019, 35, 347–360. [Google Scholar] [CrossRef]
- Zhu, Y.; Xie, C.; Sun, B.; Wang, G.-J.; Yan, X.-G. Predicting China’s SME credit risk in supply chain financing by logistic regression, artificial neural network and hybrid models. Sustainability 2016, 8, 433. [Google Scholar] [CrossRef]
- Olbryś, J.; Majewska, E. Assessing commonality in liquidity with principal component analysis: The case of the Warsaw Stock Exchange. J. Risk Financ. Manag. 2020, 13, 328. [Google Scholar] [CrossRef]
- Sabău-Popa, C.D.; Simut, R.; Droj, L.; Bențe, C.C. Analyzing financial health of the SMES listed in the AERO Market of Bucharest Stock Exchange using principal component analysis. Sustainability 2020, 12, 3726. [Google Scholar] [CrossRef]
- Boratyńska, K. The theoretical aspects of measuring the costs of corporate bankruptcy. Equilib. Q. J. Econ. Econ. Policy 2014, 9, 43–57. [Google Scholar] [CrossRef][Green Version]
- Ogachi, D.; Ndege, R.; Gaturu, P.; Zoltan, Z. Corporate bankruptcy prediction model, a special focus on listed companies in Kenya. J. Risk Financ. Manag. 2020, 13, 47. [Google Scholar] [CrossRef]
- Mokrišová, M.; Horváthová, J. Domain knowledge features versus LASSO features in predicting risk of corporate bankruptcy—DEA approach. Risks 2023, 11, 199. [Google Scholar] [CrossRef]
- Issa, S.; Bizel, G.; Jagannathan, S.K.; Gollapalli, S.S.C. A comprehensive approach to bankruptcy risk evaluation in the financial industry. J. Risk Financ. Manag. 2024, 17, 41. [Google Scholar] [CrossRef]
- Deloof, M. Does working capital management affect profitability of Belgian firms? J. Bus. Financ. Account. 2003, 30, 373–587. [Google Scholar] [CrossRef]
- Lazaridis, I.; Tryfonidis, D. The relationship between working capital management and profitability of listed companies in the Athens Stock Exchange. J. Financ. Manag. Anal. 2006, 19, 26–35. [Google Scholar]
- Bieniasz, A.; Czerwińska-Kayzer, D.; Gołaś, Z. Analiza Rentowności Przedsiębiorstwa z Wykorzystaniem Metody Różnicowania. J. Agribus. Rural Dev. 2008, 3, 23–32. Available online: http://www1.up.poznan.pl/jard/index.php/jard/article/view/924/758 (accessed on 8 July 2024).
- Bieniasz, A. Determinants of return on equity of companies in the food industry. Res. Pap. Wrocław Univ. Econ. 2015, 399, 8–15. [Google Scholar] [CrossRef]
- Olaoye, F.O.; Adekanbi, J.A.; Oluwadare, O.E. Working capital management and firms’ profitability: Evidence from quoted firms on the Nigerian Stock Exchange. Intell. Inf. Manag. 2019, 11, 43–60. [Google Scholar] [CrossRef]
- Gajdosikova, D.; Valaskova, K.; Kliestik, T.; Machova, V. COVID-19 Pandemic and its impact on challenges in the construction sector: A case study of Slovak enterprises. Mathematics 2022, 10, 3130. [Google Scholar] [CrossRef]
- Petitjean, M. Eco-friendly policies and financial performance: Was the financial crisis a game changer for large US companies? Energy Econ. 2019, 80, 502–511. [Google Scholar] [CrossRef]
- Ramiah, V.; Zhao, Y.; Moosa, I. Working capital management during the global financial crisis: The Australian experience. Qual. Res. Financ. Mark. 2014, 6, 332–351. [Google Scholar] [CrossRef]
Disclaimer/Publisher’s Note: The statements, opinions and data contained in all publications are solely those of the individual author(s) and contributor(s) and not of MDPI and/or the editor(s). MDPI and/or the editor(s) disclaim responsibility for any injury to people or property resulting from any ideas, methods, instructions or products referred to in the content. |
© 2024 by the authors. Licensee MDPI, Basel, Switzerland. This article is an open access article distributed under the terms and conditions of the Creative Commons Attribution (CC BY) license (https://creativecommons.org/licenses/by/4.0/).