Article

Impact of Land Use/Land Cover Change on Ecosystem Service Trade-Offs/Synergies—A Case Study of Gangu County, China

1
College of Resources and Environment, Gansu Agricultural University, Lanzhou 730070, China
2
College of Management, Gansu Agricultural University, Lanzhou 730070, China
*
Author to whom correspondence should be addressed.
Sustainability 2024, 16(14), 5929; https://doi.org/10.3390/su16145929
Submission received: 7 June 2024 / Revised: 5 July 2024 / Accepted: 8 July 2024 / Published: 11 July 2024

Abstract

:
The aim of this article is to analyze the impact of land use changes on trade-offs/synergies of the ecosystem service in Gangu County, Gansu province, China, from 2000 to 2020, and intends to provide a reference for decision-making on regional ecological environment protection and restoration. We analyzed the land use changes in Gangu County with the dynamic degree of single land use. Changes in ecosystem service values (ESV) were analyzed using the equivalent factor method. The temporal and spatial distribution patterns of ecosystem service trade-offs/synergies were elaborated with the help of the correlation coefficient method and local autocorrelation analysis. The impact of land use change on trade-offs/synergies of ecosystem service was analyzed according to the ecological contribution rate of land use changing and the changing of land use area. The results showed that: (1) cultivated land and grassland were the dominant land use types in Gangu County, China; the largest increase in the dynamic degree of single land use was in construction land, followed by grassland, and the largest decrease in the dynamic degree of single land use was in unused land, followed by grassland. (2) Between 2000 and 2020, the ESV showed an upward trend; the regulating service provided the largest part of the ESV among the four first ecosystem service types. The medium ESV zone occupied the largest area, and the spatial distribution pattern of ESV was high in the south and low in the north of Gangu County, China. (3) The relationships of ecosystem services were dominated by synergistic and supplemented by trade-offs. The strongest synergistic relationship was expressed between EP and BP, then, between EP and AL. Meanwhile, the strongest trade-off relationship was carried out between BP and FP. During the 20 years, the relationship of ecosystem service showed a weak shift from mainly synergistic to trade-off temporally. Spatially, the synergistic relationship was dominated and concentrated in the central and southern parts of the study area. (4) The increase in the area of grassland and forest land were the root causes resulting in the increase of ESV in Gangu County. In the time dimension, land use change had the greatest impact on the trade-off synergistic relationship between FP and all other services. In the spatial dimension, land use change has little impact on trade-offs/synergies in the northern region and more in the central and southern regions of Gangu County. The results of this study can provide a scientific basis for improving the ecological environment and promoting sustainable development in Gangu County. At the same time, it will lay the foundation for the region to realize a win–win situation between economic development and ecological protection.

1. Introduction

Ecosystem services (ESs) are all the benefits humans derive, directly or indirectly, from ecosystem to satisfy and sustain their life needs, including supply services (for example, food production, raw material), regulation services (for example, gas regulation, climate regulation), support services (for example, maintenance of nutrient cycling, biodiversity protection) and culture services (for example, aesthetic landscape) [1,2]. With the rapid development of economic and social elements, increasing human activities have led to a series of serious environmental issues, such as the loss of green space, the destruction of natural habitats, soil erosion, and pollution [3], which means ESs and ecosystems face tremendous pressure [4]. Therefore, there is an urgent need to rationally adjust the existing ecosystems to fit in with economic and social development [5,6]. In this context, scholars have begun to focus on the study of the ecosystem service value (ESV) [7,8,9]. At present, research on ESV evaluation has become a hotspot [10,11].
ESV is expressed as a numerical value for the benefits that human beings obtain from the ecosystem [12] to intuitively reflect the quality of the ecological environment. The higher the ESV value, the better the ecological environment quality. In 1997, Costanza [2] calculated the global ESV, and its estimation methods and principles laid the foundation for ESV assessments. After that, Xie Gaodi et al. [13] revised the value equivalent factor multiple times according to Costanza’s study. They formulated the “Table of Equivalent Factors for the Value of Terrestrial Ecosystem Services in China” [14] and established the calculation of the value equivalent per unit area in China [15]. Domestic scholars have conducted a large amount of research based on this equivalence scale. For example, Wang Zhuangzhuang et al. [16] and Chen Xiangbiao et al. [17] explored the influence of LULC changes on the spatiotemporal pattern of ESV in watersheds and its ecological sensitivity. Liu Ying et al. [18] and Gou Mengmeng et al. [19] explored the spatio-temporal heterogeneity of LULC transformation processes and ESV based on the “three lives space” perspective using geographically weighted models and geographic information mapping.
With the deepening of research on ecosystem service valuation, the trade-off synergistic relationship has gradually received attention from multiple disciplines, such as geography [20], ecology [21], and ecological economics [22,23]. Some scholars have researched the tradeoffs and synergies of ESs. For example, Li Donghua et al. [24] used ecosystem service change indices (ESCI) and correlation coefficients to portray the evolution process of ESs and trade-off synergistic relationships based on the township scale. The results found that the correlation relationship of ESs in each township unit was dominated by a synergistic relationship. Zhu Junjun et al. [25] explored the differences between four ESs, namely water production (WP), food production (FP), soil conservation (SC), and carbon storage (CS), in terms of land types and regions. The trade-off synergistic relationship of ESs in the Nanjing metropolitan area was explored using methods such as correlation coefficients and difference comparisons. The trade-offs and synergies obtained by the two methods were found to be different. Although research on ES trade-offs and synergistic relationships has already yielded some results [26,27], there are also some problems and limitations. Most of the previous studies, such as Zhao Xu et al. [20] and Wu Yanzhen et al. [28], have focused on the spatial and temporal variation of the trade-off synergistic relationship of ecosystem service values measured by the correlation coefficient method. There are fewer studies on the impact of land use change on this trade-off synergistic relationship. Therefore, this paper focuses on the impact of land use change on the trade-off synergistic effect of ecosystem service value at a specific scale and also analyzes the specific ways in which different land use changes affect the trade-off synergistic effect of ESV.
Based on the above considerations, land use changing (LUC) on ecosystem service value and its trade-off synergies relationship are studied with the methods of ecological contribution rate of land use/cover (LUCC) change and ecosystem service change index under 2200 m × 2200 m grid scale in Gangu County. Using the correlation coefficient method with the help of SPSS 26 software and OriginPro 2021 (64-bit) 9.8.0.200 software, we attempted to explore the relevant relationships between ESs on the time series. It reveals the long-term changes and periodic changes of ESV. Combining GeoDa 1.20.0 software to deeply characterize the spatial dynamics of trade-off synergies between ESs. We focused on exploring the extent to which land use change affects ecosystem service trade-offs/synergies and the ways in which different land use types affect trade-offs/synergies specifically. At the same time, combining grid scales can more accurately capture the spatial pattern of distribution and change of ESs. It improves the precision and interpretability of the study and breaks the limitations of the administrative scale.
The outcomes of this study have great scientific meaning and practical value. They can offer important scientific support for local environmental protection management and sustainable development. It also brings new knowledge and inspiration to the application of ES theory research and methodology.

2. Study Area and Data Resources
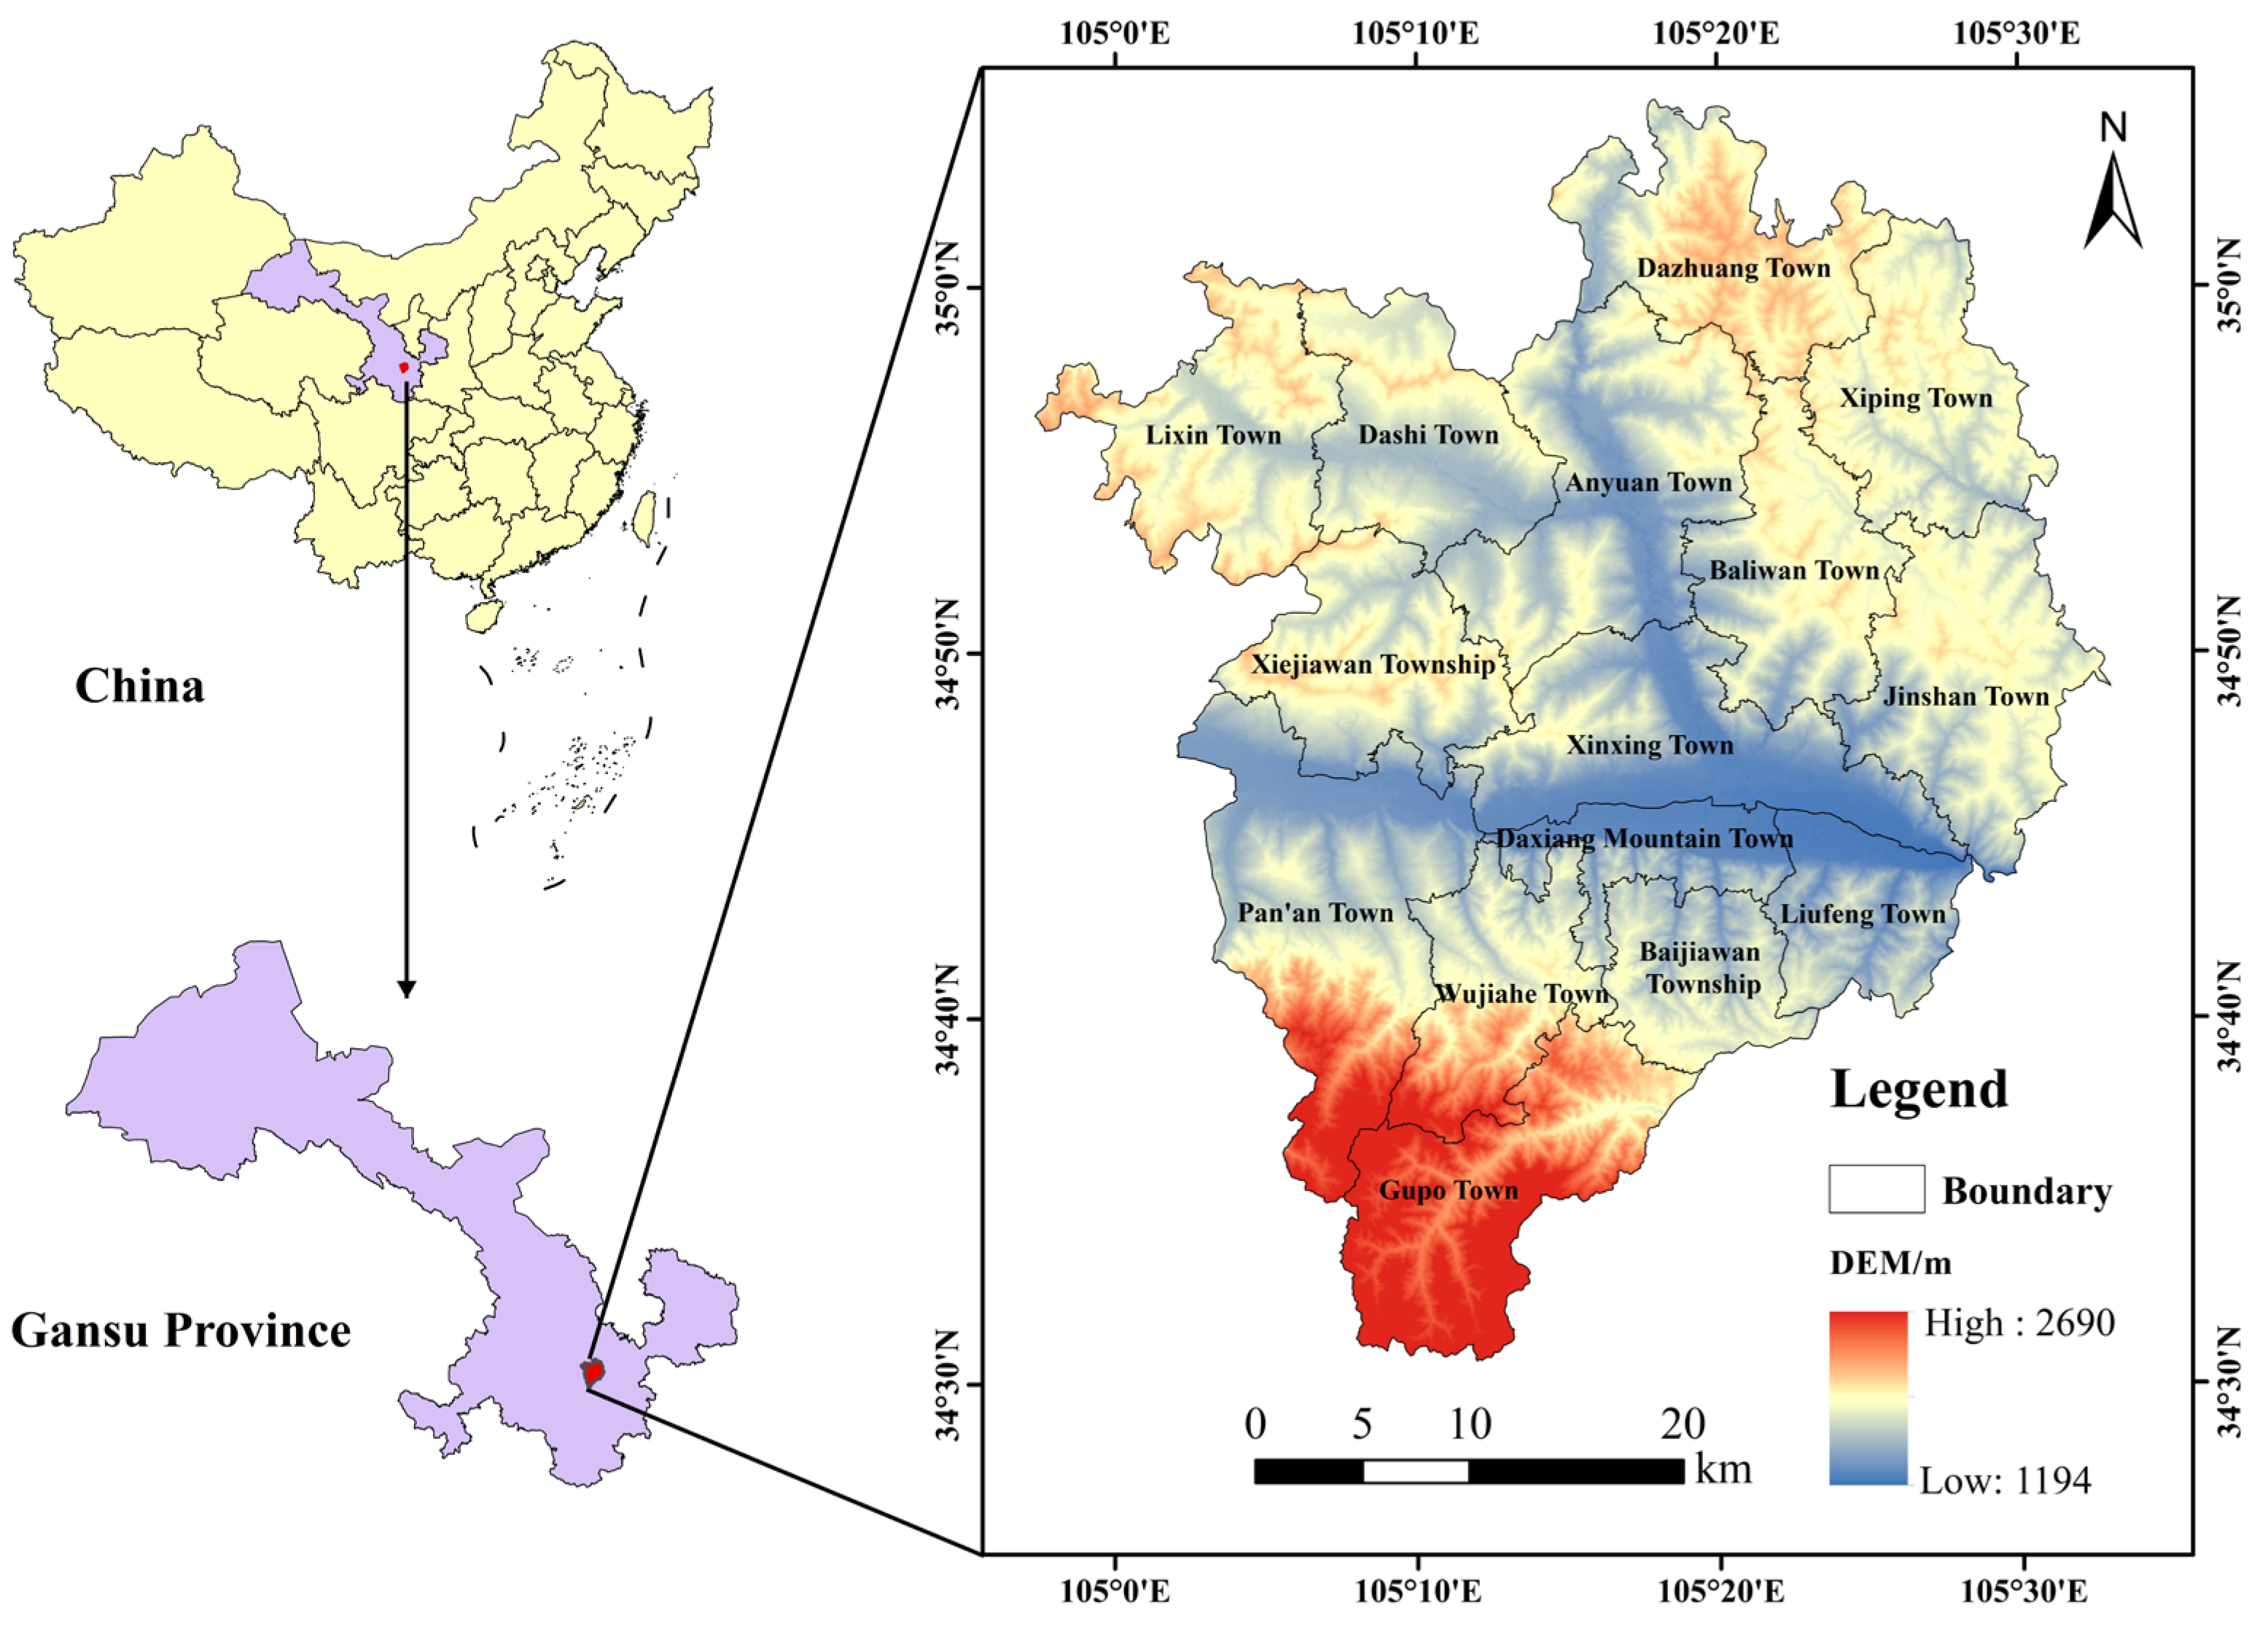
2.1. Study Area

Gangu County belongs to Tianshui City, Gansu Province, and is located in southeastern Gansu Province. The study area is shown in Figure 1. It is in the northwestern part of Tianshui City and the upstream of the Wei River. It is adjacent to Qin’an County and Maiji District in the east, Qinzhou District and Lixian County in the south, bordering Wushan County in the west, and Tongwei County in the north. Gangu County, known as “Ji” in ancient times, is the birthplace of the Huaxia civilization. It is known by historians as “Huaxia First County“, the county jurisdiction of 13 towns and 2 townships, 405 village committees, with a total population of 639,000 people and a total area of 1572.6 km2. Gangu County is located in the continental hinterland. It has a temperate continental monsoon climate with four seasons and a dry winter and wet summer. The yearly mean temperature is 11.8 °C, and the yearly mean precipitation is about 500 mm [29], which is extremely unevenly distributed. The surface morphology of the county is mainly mountains, hills, and river valleys. The Wei River crosses the whole territory from west to east, and the middle part of the county is a broken and sunken river valley. The Wei River, on both sides of the small alluvial plains, has both deep terrain and flat soil. Irrigation is convenient and suitable for planting, making the area the county’s main agricultural economic zone, but it is also the county’s industrial and commercial services center. Gangu County is known as the “Golden Belt”.

2.2. Data Sources

The study mainly involves data including LULC data, county and township boundaries, the sown area of grain crops, and the total grain output, etc. The land use data for the five periods 2000, 2005, 2010, 2015, and 2020 were obtained from the Resource and Environment Science and Data Centre of the Chinese Academy of Sciences (https://www.resdc.cn/, accessed on 13 June 2023). According to the Chinese Academy of Sciences (CAS) LULC classification standards, the LULC types were reclassified by ArcGIS 10.2 software and were divided into six LULC types, namely, forest land, cultivated land, grassland, construction land, watershed, and unused land. County boundaries and township boundaries were obtained from the database of the Third National Land Survey of Gangu County. Data on the sown area of grain crops and total grain output come from the “Gangu Yearbook” (2011–2020) and the Tianshui City National Economic and Social Development Statistics Bulletin, among other statistics.

3. Materials and Methods

3.1. Land Use Dynamics

A single land use dynamic degree expresses the quantitative change of a certain land use type in a certain time period in the study area. It is used to reflect the rate of land use change [30]. The expression is:
K = U b U a U a × 1 T × 100 %
where K denotes the land use type dynamic attitude. U a and U b represents the number of a certain land use types in the pre and post-study periods, respectively. T is defined as the length of the study period.

3.2. ESV Assessment Methodology

Based on the ESV system model proposed by Costanza [2] and the revised table of equivalent value of terrestrial ESs in China by Xie Gaodi [13]. The economic value of grain output per unit area of farmland in this study area was revised by combining the actual socio-economic development of Gangu County. The average food production in the study area from 2011 to 2020 was 3819.07 kg/hm2. To eliminate the effect of grain price fluctuation, the mean grain yield and mean per-unit price of grain for the last 10a in the study area were used as the baseline. According to one ESV equivalent that is 1/7 of the grain production value per unit area [31], the economic value of one ESV equivalent factor in Gangu County was calculated to be 1112.99 CNY/hm2. The formula is as follows:
V C k = 1 7 P × i = 1 n Q i
where V C k denotes the value of the equivalent factor (CNY/hm2). P denotes the mean grain price in the research area (CNY/kg). Q i denotes the average food production in the research area (kg/hm2).
Since construction land does not involve relevant ecological functions, it is represented by 0. The coefficient of ESV per unit area in Gangu County was calculated according to the base equivalent table of ESV per unit area for each LULC type in Gangu County (Table 1). The mathematical expression is:
E S V = k = 1 n V C k × A k
where ESV represents the total ESV of the research area (CNY). V C k represents the ESV per unit area of the type of LULC in category k (CNY/hm2). A k represents the area of the type of land use in category k (hm2), and n represents the six types of land use in the research.

3.3. The Ecological Contribution Rate of LULC Changes

This approach represents characterizing the rate of change in the ESV caused by the conversion of one LULC type to another [32]. To reveal the ecological effect of the land use change at a deeper level, the mathematical expression is:
L i j = ( C j C i ) × A i j i = 1 n j = 1 n [ ( C j C i ) × A i j ] × 100 %
where L i j denotes the contribution rate of LULC transformation to the ESV, L i j > 0 indicates that the transformation of LULC types has improved the local ecological environment, and vice versa, it causes deterioration of the local environment. C i and C j denote the coefficients of ecosystem service value of LULC types i and j, respectively. A i j denotes the area of LULC type i transformed to j.

3.4. Ecological System Service Change Index (ESCI, Ec)

The ESCI was used to represent the status of ecosystem service loss or gain in Gangu County [33]. Positive values indicate the gain of ESs. Negative values indicate the loss of ESs. And zero indicates the stability or insignificant change of ecosystem service level. This calculation expression is as follows:
E c = E 2 E 1 E 1
E c represents the index of change in the value of individual ecosystem services. E 2 represents the end ESV. E 1 represents the beginning ESV.

3.5. Calculation of the Correlation Coefficient

The method was used to evaluate the correlations and their strength between single ESs on the time series in the study area [34]. If R x y > 0 , it represents a synergistic relationship between the two variables, if R x y < 0 then it is a trade-off relationship. The formula is as follows:
R x y = i = 1 n ( x i x ¯ ) ( y i y ¯ ) i = 1 n ( x i x ¯ ) 2 i 1 n ( y i y ¯ ) 2
where R x y denotes the correlation coefficient. x i and y i denote the ESVs in category i for x and y, respectively. x ¯ and y ¯ denote the average values of x and y, respectively, and n denotes the sample size.

3.6. Bivariate Spatial Autocorrelation Models

Using bivariate spatial autocorrelation analyses, we measure the spatial trade-offs and synergies of ecosystem services and explore their spatial correlation characteristics and heterogeneity [35].

3.6.1. Bivariate Global Spatial Autocorrelation

This method can study the overall spatial correlation, spatial clustering, and significance between ecosystem services in Gangu County [36]. The range of I values was calculated to be [−1, 1]. If I > 0, it means a synergistic relationship between the two variables. When I < 0, it means a trade-off relationship between two variables. The expression is as follows [37]:
I = n i = 1 n j = 1 n W i j ( x i x ¯ ) ( x j x ¯ ) i = 1 n ( x i x ¯ ) i = 1 n j = 1 n W i j
where I denotes the bivariate global spatial autocorrelation index. n denotes the amount of grids. x i and x j denote the attribute values of grids i and j. x ¯ denotes the mean value of the attribute, and W i j denotes the spatial weighting matrix.

3.6.2. Local Spatial Autocorrelation

We used this model to identify association features at different locations in space. By plotting the LISA aggregation map, we explore spatially specific variations in synergy and trade-off relationships. The calculation process is shown in the following expression [38]:
I i = ( x i x ¯ ) j = 1 n W i j ( x j x ¯ ) j = 1 n ( x i x ¯ ) 2 / n
where I i denotes the local spatial autocorrelation index. x i , x j , x ¯ , and W i j denote the same meaning as the Formula (7).

4. Results and Analyses

4.1. Analysis of Land Use Change in Gangu County

4.1.1. Spatial Distribution of Land Use Types

The distribution of land use types in Gangu County from 2000 to 2020 is shown in Figure 2. Cultivated land was the main land use type distributed more in the central and northern parts of Gangu County, with an average area of 88,997.15 hm2 in the five periods. Grassland was concentrated in the steep mountains in the south and on both sides of the Wei River Basin in the central region. In 2010, the central region showed a significant expansion trend, with an average area of 53,245.84 hm2. Forest land was the third land use type, with an average area of 8908.70 hm2. It was mainly distributed in Gupo Town, Pan’an Town, and Wujiahe Town in the south. Construction land was the fourth land type, mainly concentrated in the central urban area and scattered throughout the study area. The watershed area and unused area have no obvious geospatial characteristics, with an average area of 1191.08 hm2 and 96.138 hm2, respectively.

4.1.2. Land Use Area Change and Dynamics

As shown in Figure 3 and Table 2, from 2000 to 2005, due to the gradual implementation of policies such as returning farmland to forest and grassland, land use changes in Gangu County were significantly affected. During this period, the area of cultivated land decreased by 1706.76 hm2, and the area of forestland and grassland increased by 1494.36 hm2. The dynamic changes of unused land and construction land were more obvious, with dynamic degrees of −10.80% and 4.68%, respectively.
Overall, land use in Gangu County has changed significantly between 2000 and 2020. With the implementation of ecological projects, urban expansion, and the policy of returning farmland to forest and grassland, the area of cultivated land has been greatly reduced, while grassland and construction land have increased significantly.

4.2. Characteristics of Spatial and Temporal Distribution of ESV in Gangu County

4.2.1. Temporal Changes in ESV

As shown in Figure 4 and Table 3, the total ESV in Gangu County is presenting a growth trend from 2000 to 2020. The total ESV of Gangu County improved significantly from 2000 to 2010, with an increase rate of 4.91% over the entire study period. It was related to the launch of eco-engineering projects such as forestry ecological construction, the return of farmland to forests, afforestation in barren mountains, and comprehensive governance of small watersheds during this period.
The grassland was the main contributing factor among land use types, its ESV was more than 53% of the total value, then followed by forest land and Watershed. Cultivated land ESV shows a yearly decline, with an ESCI index of −7.38% from 2000 to 2020. The ESV of forest land showed an increasing and then decreasing trend, with an overall large increase, and the ESCI index was 5.22% from 2000 to 2020. Grassland and watershed ESV showed an increase or decrease of alternation, and the ESCI index was 10.47% and −0.38% in 2000–2020, respectively. The ESV of unused land remains unchanged. Therefore, the changes in the area of forested land and watersheds were the major causes of changes in the total ESV in Gangu County over the last 20 years. The increase in grassland and forest land area is the underlying cause of the increase in the total ESV from 2000 to 2010.
The changes in a single ESV are shown in Table 4. The value of the regulation service function provided in Gangu County was the largest during the study period, accounting for more than 63% of the total ESV in all cases. It mainly originated from HR and CR, then was followed by the value of the support service function with a share of about 27%, it was mainly derived from SC and BP. The value of the supply service function remained at about 4.5% and was mainly derived from FP. The value of the cultural service function was the smallest. The value of FP, RM, WRS, and MNC decreased from 2000 to 2010, but the value of the seven ecosystem service functions increased, which was consistent with the trend of total ESV change. During this period, as a result of the promotion of the return of farmland to forest in Gangu County, grassland and forest land expanded greatly. This led to a substantial increase in CR, EP, and HR services. From 2010 to 2020, the changing trend of value in GR, HR, and SC services was opposite to that from 2000 to 2010. While the value of CR, EP, BP, and Al services followed the same changing pattern with the total value of ESV and changed with different degrees.
The LULC change is one of the most basic practical activities of human beings. It is also an important manifestation of the direct interactions between human activity and the natural environment. This change directly drives the quality, process, structure, and function of the ecosystem. The ESV is an objective representation of these changes and their influence, and there is a close association between the LUCC and ESV [24]. The contribution rate of land use type to ESV is shown in Table 5. The reasons for the changes in ESV are mainly the changes among land use types and regional differences of LUCC [20]. From 2000 to 2005, the improvement of ecosystem services in Gangu County was dominated by “cultivated land—grassland” and “cultivated land—forest land”. The ecological contribution rate of the two forms of transformation reached more than 70%. The transfer (in or out) of grassland may be a key part of the improvement and deterioration of the ecosystem service in Gangu County. The transformation of grassland to cultivated land is the main cause of the deterioration of ecosystem services in Gangu County. The contribution rate of “grassland-cultivated land” transformation was the highest in the periods of 2000–2005 and 2010–2015, with the value ranging from 55% to 62%. The conversion of river lakes to cultivated land is another important reason for the deterioration of ecosystem services during the study period, and it was most prominent from 2005 to 2010. However, the contribution of “grassland-cultivated land” and “ watershed-cultivated land” conversions showed a clear trend of decreasing in 2015–2020, along with the strengthening of ecological environmental protection.

4.2.2. Spatial Change Characteristics of ESV

This article expresses the ESV of Gangu County through the grid method. In the past, the research of Lu et al. [39] and Hu et al. [40] were divided according to the administrative division. Using a grid can reduce the spatial scale to a finer scale and increase the spatial accuracy of ESV. The grid method makes the results more comparable [41,42,43]. In this paper, a grid of 2200 m × 2200 m is used, and the ESV of each grid is measured with the help of ArcGIS software. It is classified into five ranks based on the natural breakpoint method, namely low ESV zone, lower ESV zone, medium ESV zone, higher ESV zone, and high ESV zone. The area of each level was tallied, as shown in Table 6. During the study, the area of the low ESV zone of Gangu County was below 5%, and the change in its area was relatively small. The largest area of ESV was clustered in the medium value zone; its proportion is above 40% and showed a great changing range from 47.16% to 69.15% in different time stages. These results reflected the remarkable changes of LUCC, especially changes in grassland, cultivated land, and forest land.
Meanwhile, the area of the lower ESV zone and the medium ESV zone in 20 years has shown a decrease in the trend. This may mean damage to ecological functions caused by ecological recession or human intervention in the area. The area proportion of higher ESV zone and high ESV zone were increasing. In 2020, the area proportion of these two was more than 25% together. We could then interpret the increase of total ESVin Gangu County during the study period.
In order to further investigate the spatial distribution pattern of ESV in Gangu County, the ESV rank map and the spatial distribution map of the ESCI were drawn, as shown in Figure 5. The spatial pattern of ESV in Gangu County from 2000 to 2020 changed more frequently in different periods. There were obvious high-value agglomeration zones and low-value agglomeration zones with significant spatial heterogeneity. The high-value zone was mainly located in the southern part of Gangu County, where natural grassland and secondary forests were distributed over a large area, as well as in the central part of the Weihe River region. Due to the weak intensity and interference of human activity in the region, the land use structure and vegetation structure tend to be stable. As a result, these area continues to retain high ecological value and strong ecological functions. The higher value zones were scattered throughout Gangu County with little variation. Medium-value zones were dominantly distributed throughout Gangu County, consistent with the distribution pattern of cultivated land and grasslands. The lower value zones were mainly distributed in the construction land and cultivated area in the middle and north of the research area. The low-value zones were spread out in the periphery of the research region. With the evolution of time, the spatial distribution of ESV mainly evolved from low to high values and gradually reduced from south to north, the overall ESV performance of the trend of high south and low north.
The value of the ESCI in 2000–2020 ranged from −30% to 30%, and the number of grids accounted for 94%. The proportion of grids achieving an increase in the total ESV was 60%. Among them, 19 grids, which achieved an increase in the total ESV of more than 30%, were mainly distributed in the central part of Gangu County along the Weihe River Basin. The proportion of grids declined, and the total value of ESV was 40%. This was primarily located in the cultivated land area of Gangu County, which is a construction area with a dense population and high urbanization.

4.3. The Impact of Land Use Change on Ecosystem Service Trade-off Synergies in Gangu County

The trade-off synergistic relationship between ESs is deeply excavated. It can provide a decision-making basis for the future sustainable development of ecosystems in the region and promote the harmonious development of humans and nature [44].

4.3.1. Impact of Land Use Change on ES Trade-off Synergies in the Time Dimension

According to Equation (6), the correlation coefficients between individual ecosystem services in Gangu County during 2000–2020 were obtained with the help of SPSS software and Origin software. It mainly represents the overall trade-off synergistic relationship through the numerical value. If the correlation coefficient value is greater than 0, it indicates that there is a synergistic relationship between ESs. Conversely, it shows a trade-off relationship [24]. According to the results of Figure 6, 66 groups of correlation coefficient values were formed between 11 individual ecosystem services in Gangu County. Among them, there are 21 groups of negative correlations and 45 groups of positive correlations. It shows that the trade-off relationship and synergistic relationship accounted for 31.8% and 68.2%, respectively. Therefore, synergistic relationships were the dominant relationships for ecosystem services over 20 years in Gangu County.
Synergistic relationships mainly existed in regulating, supporting, and cultural services. EP-BP and EP-AL showed the strongest synergistic relationship with a value of 0.999. Meanwhile, the trade-off relationship was mainly concentrated on supply services. BP-FP exhibits the strongest trade-off relationship. The trade-off relationship between FP, RM, and MNC, and other individual services accounted for 50% of the total trade-off relationship in the study area. Combined with Figure 3, the land use structure has been adjusted considerably due to the need of social development in Gangu from 2000 to 2020. The reduction of large areas of cultivated land directly led to a decrease in the production of food and raw materials and a reduction in agricultural activities. The use of chemical fertilizers and pesticides was reduced, thus reducing the pollution of water resources. At the same time, the increase in the area of grassland promoted the stable supply of water resources but indirectly broke the stability of the nutrient cycle. Therefore, there was a weak trade-off between WRS and FP, RM, and MNC. The expansion of construction land has changed the degree of land use intensification, which in turn affected the nutrient cycle. Therefore, FP, RM, and MNC again showed a strong synergistic relationship. As a result of the implementation of the policy of returning farmland to forests and grasslands, a significant increase in forest and grasslands has been promoted. This has led to the emergence of strong synergistic relationships between the various service functions in the regulation service. The construction of new buildings, parks, squares, and other public spaces promoted the development of aesthetic landscapes due to the renewal and modernization of the urban landscape occupying large areas of arable land. This reduced the production of food and raw materials, as well as the destruction of nutrient cycles, resulting in a trade-off between AL and FP, RM, and MNC. AL is synergistic with six other ecosystem services, of which AL is weakly synergistic with WRS and strongly synergistic with all other ecosystem services.
The characteristics of the changing trade-off synergistic relationships between 11 individual services caused by LUCC in Gangu County were explored from different periods. As can be seen from Figure 7, the correlation coefficients between the seven service functions of GR, CR, EP, HR, SC, BP, and AL are all above 0.8 in the four time periods. This indicated that there was a significant synergistic relationship and stable development between the seven service functions and other individual services. The land use diversity index has shown a continuous increase during the period 2000–2020, which means that more land use types are retained. It favored the development of the diversity of ESs. This promoted the synergistic relationship among the seven ecosystem services to be stabilized in the four stages. However, a small number of land use types have been transformed, resulting in an unreasonable adjustment of the land use structure due to the needs of social development. This has led to significant changes in the trade-off synergies between FP, RM, WRS, and MNC. As a result, the trade-off and synergy relationship between the four services and the other single services had also changed.
Combined with Table 5, Figure 8 and Figure 9, it can be seen that there is a strong synergistic relationship between FP and each service function between 2000 and 2005. Since the rate of the reduction of cropland was relatively slow in this period, the reduced cropland was used for inefficient and unsuitable land for farming. Therefore, the reduction of arable land did not have a significant impact on FP. Between 2005 and 2010, with the acceleration of urbanization, arable land was over-occupied, and the land base for food production was seriously threatened. Although the increase in grassland still has a positive impact on the ecological environment, the resource consumption and environmental pressure brought about by urbanization have a strong negative impact on food production, resulting in a significant weakening of the synergistic relationship.
During the period 2010–2020, the government paid more attention to the protection of forest land and grassland. With part of the arable land converted into ecological land, while urban construction continued to accelerate, it resulted in a strong trade-off between FP and other services. The synergistic trade-offs between RM and MNC and services gradually weakened in the four time periods. The reduction of trade-off synergies between RM and services was more pronounced. This was mainly caused by the conversion of agricultural land to non-agricultural land. The synergies between WRS and individual services weakened between 2005 and 2010. This was mainly due to the rapid increase in demand for water resources as a result of urbanization and the lag in water resources management. However, with the strengthening of water protection and management policies and the improvement of technology, the degree of synergy gradually increased and stabilized in the period 2010–2020. In summary, LUCC resulted in significant changes in the trade-offs and synergies between FP, RM, WRS, BP, and other services. This suggests that these services are more strongly influenced by human activities and environmental change, leading to larger changes in the way they are provided or in their quality.

4.3.2. Ecosystem Service Trade-off Synergies in the Spatial Dimensions in Response to LUCC

To further explore the spatially specific changes in tradeoffs and synergies in ecosystem services, we used Geoda 1.20.0 software and ArcGIS 10.2 software to more intuitively map the distribution of spatially localized correlations from 2000 to 2020. In the map, H-H clusters and L-L clusters indicate synergistic relationships, and H-L clusters and L-H clusters indicate trade-off relationships [45]. As shown in Table 7, Moran’s I for total ESV and the four individual services in Gangu County from 2000 to 2020 were all more than 0, and all p-values were less than 0, it suggested that there was obvious spatial clustering of ecosystem service functions with high and low values and that there is a remarkable positive spatial relationship. The Moran’s I of total ESV and individual ESs all showed a rising trend of fluctuation. This suggests that the overall spatial correlation of ESs has increased over the past 20 years.
As shown in Table 8, the global autocorrelation indices were all positive, and all passed the significance test of 0.001. There were significant spatial synergistic relationships among the four individual services. They showed similar spatial distribution patterns in neighboring areas. From 2000 to 2020, Moran’s I all showed an increasing trend, indicating that the synergistic relationship between ESs has increased.
Local autocorrelation analysis was introduced to further deepen and explore the internal spatial differentiation characteristics of tradeoffs and synergistic relationships between ecosystem services from 2000 to 2020. As can be seen from Figure 10 and Figure 11, the spatial distribution of trade-offs and synergies was obviously heterogeneous. In general, there was a strong synergistic relationship between the four services of supply, regulation, support, and culture. The synergistic relationship was concentrated in Pan’an Town and Daxiangshan Town in the central part and Wujiahe Town and Gupo Town in the southern region. Because the above townships had large areas of grassland and woodland, and the degree of land use was low. At the same time, the activity of land use change was low, human disturbance was less, and the ecological background quality was high. Therefore, the degree of synergy between the four service functions in the southern region was strong. However, the area of land use types in the southern region has changed greatly. For example, the increase or decrease in the area of Gupo Township between 2000 and 2010 ranged from 300 hm2 to 500 hm2. This was mainly due to the obvious change of grassland and cultivated land area, but it had little impact on the synergy of ecosystem service functions. The degree of trade-off synergy in the northern region was not obvious. The number of grids showing trade-off relationships was very small in the whole study area, and the trade-off relationships mainly existed in supply regulation services, concentrating in the central Weihe River Basin. Due to the conversion of cultivated land to construction land, human disturbance has disrupted the stable ecosystem structure, which has led to the presentation of a trade-off relationship in the center.
From a temporal perspective, the synergy and trade-off relationships have undergone a significant change between 2000 and 2020. This was mainly in the central region, while the northern and southern regions were basically stable. During the period 2000–2005, the implementation of the policy of returning farmland to forest and grassland in Daxiangshan Town and Xinxing Town led to a decrease in cultivated land area and an increase in grassland area. However, the supply regulation service has changed from a trade-off relationship to a weak synergy relationship. This was mainly because the increase in grassland had increased the ecological regulation value more than the decrease in cultivated land, resulting in a decrease in supply services. This has increased the value of the entire ecosystem service, thereby promoting weak synergy relationships in the supply culture, regulation culture, and support culture. At the same time, Xinxing Town was affected by the substantial increase in urban construction land in regional development, and most of the natural environment was occupied and transformed. This has led to the destruction and degradation of the ecosystem, thereby reducing the support service function. However, the increase in cultural service functions has led to a trade-off between support services and cultural services. From 2005 to 2010, Daxiangshan Town and Xinxing Town continued to increase grassland, and the increase in construction land was accompanied by effective ecological restoration and environmental protection measures. The synergistic relationship between ecosystem service functions was enhanced. At the same time, the substantial reduction in cultivated land areas in Pan’an Town and Xinxing Town has further intensified the trade-off between supply and regulation services.
From 2010 to 2020, the trade-off and synergy relationship between the ecosystem service functions in the central and southern regions remained basically stable, showing a strong synergistic relationship. Although the area of arable land has shown a continuous decrease, the area of grassland and construction land has continued to increase. However, with the improvement of the level of economic development and the optimization of the land use structure, as well as the policies promulgated by the Chinese Government during this period, such as the ”Tianshui City Twelfth Five-Year Plan for Ecological Environmental Protection” and the “Tianshui City Thirteenth Five-Year Plan for Ecological Environmental Protection”, the protection and restoration of the ecosystem have been improved accordingly. Therefore, the impact of land use change on the synergistic effect of trade-offs in the value of ecosystem services during the period 2010–2020 was weak.

5. Discussion

5.1. Causes of Changes in ESV

The results of the study show that the overall trend of the total ESV value in Gangu County has been increasing in the last 20 years. The findings are the same as those of Ma Shuyi et al. [46] on the study of Poyang Lake urban agglomeration and Chen Xiangbiao et al. [36] on the study of the Shilin Karst area. The area of cultivated land decreased by 6859.62 hm2. The areas of grassland and forest increased by 441.63 hm2 and 5257.62 hm2, respectively. The corresponding ESV growth rates were 5.22% and 10.47%. Much of the reduction in cultivated land was transferred to forest and grassland, resulting in a decline in ESVs such as FP. The increase in forests and grasslands has led to a substantial increase in the ecological value provided by services such as CR, EP, and BP. Meanwhile, owing to the fast expansion of urbanization and industrialization in Gangu County, the extension of land for construction has also largely exacerbated the decrease in cultivated land. The reduction rate of ESV due to the reduction of cultivated land in the last 20 years was 7.38%, which mainly occurred in 2005–2010. This suggests that the conservation and restoration of the ecological environment of Gangu County from 2010 to 2020 have been significantly strengthened. Although the watershed area is a smaller proportion of the total area, the ESV produced by them is similar to that produced by forest land (Table 3 and Figure 2). This is mainly because the sum of the value coefficients of watersheds is much higher than the sum of the value coefficients of the remaining land categories. Therefore, the demands of the human community and the protection of the ecological environment need to be considered in an integrated manner in future development. Adjustments will be made through integrated planning, strengthening environmental protection and restoration, promoting green technology, and raising public awareness of environmental protection to promote sustainable development in the future.

5.2. ES Trade-offs/Synergies and LULC Change

The interactions between ESs are divided into synergies and trade-offs. Understanding the complex interactions between ESs is the basis for improving ecosystem service management. The formation of trade-offs or synergistic relationships between ESs is usually related to LULC, environmental factors, and interactions between ecosystem services [20]. This paper concludes that the correlations between ecosystem services are mainly dominated by synergistic relationships in time change. It is consistent with the findings of scholars Wu Yanzhen et al. [28] and Wen Yuling et al. [47]. All four ecosystem services showed spatial synergistic relationships among them in spatial changes. It is consistent with the results of Zhao Xu et al. [20]. The studies by scholars Zheng Defeng et al. [48] and Zhang Min et al. [49] only explored tradeoffs and synergies among ESs across the study period. However, this study found a shift in the tradeoffs and synergies across time and spatial locations. This shift was caused by a change in the LULC. When the area of arable land is reduced below 87,444.18 hm2, the effect of tradeoffs among ecosystem services increases. Not only is food security threatened, but other service functions will also be constrained, leading to a decrease in ecological security. Due to the rapid economic growth and population increase, the level of urbanization in Gangu County from 2010 to 2020 increased from 18.13% to 43%, which promoted the urbanization process. Most of the agricultural land has been used for urban building and industrial development, leading to a marked decline in cultivated land in the central urban region. This has led to an imbalance in tradeoffs and synergies in the central region. Meanwhile, the Government has increased significantly more awareness of environmental protection in recent years [50]. To protect the ecological environment, some land originally used for resource development has been converted into protected areas or ecological land. This has had an obvious impact on supply services. This change has both positive impacts and challenges for future ecological development. The shift to stronger trade-offs has led to a greater focus on environmental protection and sustainable development in land use planning and service provision. This has helped to reduce environmental damage, conserve biodiversity, and improve ecosystem health. However, the shift to stronger trade-offs may lead to insufficient or unbalanced provision of services in some areas. This affects the standard of living of the residents and social development.
Therefore, food security must be ensured while improving ecological security in the future development of Gangu County. We should focus on the coordinated development of the central zone. The government should integrate and optimize agricultural space, ecological space, and urban space. It should also scientifically plan permanent basic farmland, urban development boundaries, and ecological protection red lines. We will make adjustments to the region’s future development in strict accordance with the norms of three zones and three lines. We will strengthen the protection and restoration of ecology and reduce the tradeoffs among ecosystem services. This will promote ecological environment management and sustainable development in the area.

5.3. Applications and Shortcomings

The mechanisms behind tradeoffs and synergies among ESs are extremely complex. However, they can be attributed to land use change, drivers, and internal interactions between ecosystems. However, quantitative explanations of them are far from adequate. In the future, the internal and driving mechanisms of ESs should be explored in depth. The focus should be on what factors are influencing the spatio-temporal dynamics of ecosystem service tradeoffs and synergies. The data and methods mentioned in this study can also be applied to other areas. It is useful for ecological management in a way similar to the present study area.

6. Conclusions

The spatiotemporal changes of ESV over 20 years were analyzed under a 2200 m × 2200 m grid in Gangu County with the help of SPSS, Origin, and ArcGIS. Changes in trade-offs and synergistic interactions among ESs in this study zone were investigated in both temporal and spatial dimensions. The mean conclusion are:
(1)
Cultivated land, grassland, and construction land were the major land use types in Gangu County. From 2000 to 2020, the conversion of cultivated land to grassland and construction land, driven by human activities, was the major characteristic of land use changes in the study area.
(2)
In terms of temporal characteristics, the overall ESV in Gangu County was on the rise. Grasslands were the main contributing factor. The regulating service function had the highest value. Grassland was a key land use type in the development of ESV in Gangu County. The primary cause of Gangu County’s degradation in ecosystem services was the transformation of grassland to cultivated land. The deterioration trend was significantly weakened in the last five years, along with the strengthening of ecological protection.
(3)
The spatial distribution of ESV showed that the study area was mainly concentrated in the medium value zone. The protection status of high ESV zones was good. The spatial distribution of ESV had a close correlation with land use types. With the evolution of time, the spatial distribution of ESV mainly evolved from low to high values and gradually decreased from south to north. The overall distribution pattern was high in the southern region and low in the northern region.
(4)
The trade-off synergies in the time dimension showed that synergies between ecosystem services dominated in Gangu County during the period 2000–2020. Changes in trade-off synergies between FP, RM, WRS, BP, and other services were influenced by land use changes. Among them, the change from strong synergies to strong trade-offs between FP and other services was most significantly affected by land use change.
(5)
In terms of the spatial distribution of trade-offs and synergies, the trade-offs and synergistic relationships among the four individual services were spatially heterogeneous. The trade-offs and synergistic relationships in the central and southern regions remained basically stable from 2010 to 2020. The influence of land use change on the trade-offs and synergistic relationships among ecosystem services was stronger during 2000–2010 and weaker during 2010–2020. Increases and decreases in cropland, grassland, and construction land were important drivers of changes in trade-offs and synergies among ecosystem services.
(6)
The increase in the area of grassland and forest land were the root causes resulting in increasing of ESV in Gangu County. In the time dimension, land use change had the greatest impact on the trade-off synergistic relationship between food supply and all other services. In the spatial dimension, land use change has little impact on trade-offs/synergies in the northern region and more in the central and southern regions of Gangu County. The results of this study can provide a scientific basis for improving the ecological environment and promoting sustainable development in Gangu County. At the same time, it will lay the foundation for the region to realize a win–win situation between economic development and ecological protection.

Author Contributions

Conceptualization, Y.W. and X.L.; methodology, Y.W.; software, Y.W.; validation, X.L., Y.W. and Q.Z.; formal analysis, H.L.; investigation, Q.Z.; resources, Y.W.; data curation, F.Q.; writing—original draft preparation, Y.W.; writing—review and editing, Y.W.; visualization, M.Z.; supervision, X.L.; project administration, X.L.; funding acquisition, X.L. All authors have read and agreed to the published version of the manuscript.

Funding

Research on Ecological Land Reclamation and Ecological Barrier Function in the Context of Multi-regulation: GAU-XZ-20160812.

Institutional Review Board Statement

Not applicable.

Informed Consent Statement

Not applicable.

Data Availability Statement

The data generated during and/or analyzed during the current study are available from the corresponding author upon reasonable request.

Conflicts of Interest

The authors declare no conflicts of interest.

References

  1. Wang, N.; Yang, G.; Han, X.Y.; Jia, G.P.; Liu, F.; Li, T.; Jia, N. Land Use Change and Ecosystem Service Value in Inner Mongolia from 1990 to 2018. J. Soil Water Conserv. 2020, 34, 244–250. [Google Scholar]
  2. Costanza, R.; d’Arge, R.; De Groot, R.; Farber, S.; Grasso, M.; Hannon, B.; Limburg, K.; Naeem, S.; O’neill, R.V.; Paruelo, J. The value of the world’s ecosystem services and natural capital. Nature 1997, 387, 253–260. [Google Scholar] [CrossRef]
  3. Niu, X.G.; Zhu, X.L.; Liu, M.Y. Study on the Spatiotemporal Evolution and lmprovement Strategies of the Ecological Environment Carrying Capacity in Taihang Mountains. J. Hebei Geol. Univ. 2024, 47, 100–106. [Google Scholar]
  4. Yan, E.P.; Lin, H.; Wang, G.X.; Xia, C.Z. Analysis of evolution and driving force of ecosystem service values in the Three Gorges Reservoir region during 1990–2011. Acta Ecol. Sin. 2014, 34, 5962–5973. [Google Scholar]
  5. Gao, D. Land Use Change and Its Ecosystem Service Value Response in Metropolitan Areas—Take Jinan City as an Example. China Resour. Compr. Util. 2021, 39, 72–74. [Google Scholar]
  6. Mamat, A.; Halik, Ü.; Rouzi, A. Variations of ecosystem service value in response to land-use change in the Kashgar Region, Northwest China. Sustainability 2018, 10, 200. [Google Scholar] [CrossRef]
  7. Wu, X.; Liu, S.; Zhao, S.; Hou, X.; Xu, J.; Dong, S.; Liu, G. Quantification and driving force analysis of ecosystem services supply, demand and balance in China. Sci. Total Environ. 2019, 652, 1375–1386. [Google Scholar] [CrossRef]
  8. Häyhä, T.; Franzese, P.P. Ecosystem services assessment: A review under an ecological-economic and systems perspective. Ecol. Modell. 2014, 289, 124–132. [Google Scholar] [CrossRef]
  9. Lautenbach, S.; Kugel, C.; Lausch, A.; Seppelt, R. Analysis of historic changes in regional ecosystem service provisioning using land use data. Ecol. Indic. 2011, 11, 676–687. [Google Scholar] [CrossRef]
  10. Xie, G.D.; Zhang, C.X.; Zhang, C.S.; Xiao, Y.; Lu, C.X. The value of ecosystem services in China. Resour. Sci. 2015, 37, 1740–1746. [Google Scholar]
  11. Costanza, R.; De Groot, R.; Braat, L.; Kubiszewski, I.; Fioramonti, L.; Sutton, P.; Farber, S.; Grasso, M. Twenty years of ecosystem services: How far have we come and how far do we still need to go? Ecosyst. Serv. 2017, 28, 1–16. [Google Scholar] [CrossRef]
  12. Jiang, H.; Wu, Q. Ecological Service Value Evaluation and Temporal-spatial Evolution Characteristics in Jiangsu Province Based on LUCC. Resour. Environ. Yangtze Basin 2021, 30, 2712–2725. [Google Scholar]
  13. Xie, G.D.; Lu, C.X.; Leng, Y.F.; Zhen, D.; Li, S.C. Valuing Ecological Assets on the Tibetan Plateau. J. Nat. Resour. 2003, 18, 189–196. [Google Scholar]
  14. Xie, G.D.; Zhen, L.; Lu, C.X.; Xiao, Y.; Chen, C. Expert Knowledge Based Valuation Method of Ecosystem Services in China. J. Nat. Resour. 2008, 23, 911–919. [Google Scholar]
  15. Zhang, R.S.; Gao, Y.; Chen, H.F.; Gao, M.M.; Wei, J.M.; Li, X.H.; Yan, Y.Y. Land-use change and its impact on the value of ecosystem services in Alxa. Agric. Technol. 2022, 42, 71–75. [Google Scholar]
  16. Wang, Z.Z.; Zhang, L.W.; Li, X.P.; Wang, P.T.; Li, Y.J.; Lv, Y.H.; Yan, J.P. The spatial-temporal pattern of hotspots and coldspots of ecosystem services at the watershed scale. Acta Ecol. Sin. 2019, 39, 823–834. [Google Scholar]
  17. Chen, X.B.; Ding, W.R.; Li, X.C. Analysis of Cross-Sensitivity of Land Use Transition and Ecosystem Service Value of Urban Agglomeration in Central Yunnan. Res. Soil Water Conserv. 2022, 29, 233–241. [Google Scholar]
  18. Liu, Y.; Geng, W.L.; Shao, J.W.; Zhou, Z.M.; Zhang, P.Y. Land Use Change and Ecosystem Service Value Response from the Perspective of “Ecological-Production-Living Spaces”: A Case Study of the Lower Yellow River. Areal Res. Dev. 2021, 40, 129–135. [Google Scholar]
  19. Gou, M.M.; Liu, C.F.; Li, L.; Xiao, W.F.; Wang, N.; Hu, J.W. Ecosystem service value effects of the Three Gorges Reservoir Area land use transformation under the perspective of “production-living-ecological” space. Chin. J. Appl. Ecol. 2021, 32, 3933–3941. [Google Scholar]
  20. Zhao, X.; Wang, H.; Zhao, Z.L.; Zhao, F.F. Evolution and Tradeoff/Synergy Relationship of Ecosystem Services Value in Cascade Hydropower Project Reservoir Area of the Lower Reaches of Jinsha River. J. Ecol. Rural Environ. 2024, 40, 44–54. [Google Scholar]
  21. Fan, Y.K.; Ma, S.M. Ecosystem services and their trade-offs/synergies analysis under multi-scenario simulation of land use change—A case study of Shenyang and Fushun City, Liaoning Province. Acta Sci. Circum. 2023, 43, 419–434. [Google Scholar]
  22. Zheng, D.F.; Hao, S.; Lv, L.T.; Xu, W.J.; Wang, Y.Y.; Wang, H. Spatial-temporal change and trade-off/synergy relationships among multiple ecosystem services in Three-River-Source National Park. Geogr. Res. 2020, 39, 64–78. [Google Scholar]
  23. Qian, C.Y.; Gong, J.; Zhang, J.X.; Liu, D.Q.; Ma, X.C. Change and tradeoffs-synergies analysis on watershed ecosystem services: A case study of Bailongjiang Watershed, Gansu. Acta Geogr. Sin. 2018, 73, 868–879. [Google Scholar]
  24. Li, D.H.; Zhang, X.Y.; Wang, Y.; Zhang, X.; Li, L.; Lu, L. Evolution process of ecosystem services and the trade-off synergy in Xin’an River Basin. Acta Ecol. Sin. 2021, 41, 6981–6993. [Google Scholar]
  25. Zhu, J.J.; Gao, Z.B.; Wang, J.X.; Liao, K.H.; Lv, L.G. Spatiotemporal Changes and Trade-off/Synergy Relationship of Ecosystem Services in Nanjing Metropolitan Area. Res. Soil Water Conserv. 2023, 30, 383–394. [Google Scholar]
  26. Jia, X.Q.; Fu, B.J.; Feng, X.M.; Hou, G.H.; Liu, Y.; Wang, X.F. The tradeoff and synergy between ecosystem services in the Grain-for-Green areas in Northern Shaanxi, China. Ecol. Indic. 2014, 43, 103–113. [Google Scholar] [CrossRef]
  27. Feng, Q.; Zhao, W.W.; Fu, B.J.; Ding, J.Y.; Wang, S. Ecosystem service trade-offs and their influencing factors: A case study in the Loess Plateau of China. Sci. Total Environ. 2017, 607, 1250–1263. [Google Scholar] [CrossRef] [PubMed]
  28. Wu, Y.Z.; Wang, X.C.; Wang, S.Z. Spatio-Temporal Changes and Trade-offs of Ecosystem Service Value and Their Correlation with Human Activity Intensity—A Case Study of Cili County. J. Soil Water Conserv. 2022, 29, 311–321. [Google Scholar]
  29. Li, H.L. Gangu County Marigold Industry Development Status and Suggestions. Bull. Agric. Sci. Technol. 2024, 28–30. [Google Scholar]
  30. Luo, J.H.; He, Q.Y.; Zhao, Z.L.; Li, W.; Huang, L.; Lv, S.S.; Zhao, W.Q. The impact of LUCC on the spatiotemporal evolution of ecosystem service value in the “Two Lake Basin” in the central Guizhou region. Environ. Ecol. 2024, 6, 63–73. [Google Scholar]
  31. Zhang, Y.Y.; Sun, M.Y.; Yang, R.J.; Zhang, L. Impact of land-use change on ecosystem service value in Southwest China. J. Environ. Eng. Technol. 2022, 12, 207–214. [Google Scholar]
  32. Wu, Z.P.; Zhang, J.Y.; Wang, J.J.; Lv, S.Y.; Li, B.C. Study on the Spatio-temporal Changes of Oasis Land Use and Ecosystem Service Value in Jinghe River Basin. J. Ecol. Rural Environ. 2021, 37, 1168–1175. [Google Scholar]
  33. Liu, H.Y.; Xiao, W.F.; Li, Q.; Tian, Y.; Zhang, Q.R.; Zhu, J.H. Spatiotemporal variations and trade-offs of ecosystem services in Beijing. Chin. J. Ecol. 2021, 40, 209–219. [Google Scholar]
  34. Chen, A.; Li, J.J.; Wang, M.S.; Zhang, H.; Bian, L.J.; Li, W.T.; Xu, W. Research for Change of Ecosystem Service and the Tradeoff-Synergy Relation of the YLN Basin in the Tibet Autonomous Region. J. Soil Water Conserv. 2022, 29, 313–319+329+312. [Google Scholar]
  35. Guan, Q.C.; Hao, J.M.; Xu, Y.Q.; Ren, G.P.; Kang, L. Zoning of agroecological management based on the relationship between supply and demand of ecosystem services. Resour. Sci. 2019, 41, 1359–1373. [Google Scholar]
  36. Chen, X.B.; Ding, W.R. Spatial-temporal Evolution and Trade-off Synergy Relationships of Ecosystem Services in Karst Area of Shilin. Res. Soil Water Conserv. 2023, 30, 285–293. [Google Scholar]
  37. Ma, Y.; Ling, X.; Tong, Y. Ecosystem service value estimation and spatiotemporal differentiation characteristics of typical tourism cities at grid scale: A case of Sanya. Acta Ecol. Sin. 2021, 41, 7542–7554. [Google Scholar]
  38. Li, L.; Wu, D.F.; Wang, F.; Liu, Y.Y.; Liu, Y.H.; Qian, L.X. Prediction and tradeoff analysis of ecosystem service value in the rapidly urbanizing Foshan City of China: A case study. Acta Ecol. Sin. 2020, 40, 9023–9036. [Google Scholar]
  39. Lu, X.; Shi, Y.; Chen, C.; Yu, M. Monitoring cropland transition and its impact on ecosystem services value in developed regions of China: A case study of Jiangsu Province. Land Use Proc. 2017, 69, 25–40. [Google Scholar] [CrossRef]
  40. Hu, X.S.; Hong, W.; Qiu, R.Z.; Hong, T.; Chen, C.; Wu, C.Z. Geographic variations of ecosystem service intensity in Fuzhou City, China. Sci. Total Environ. 2015, 512, 215–226. [Google Scholar] [CrossRef]
  41. Chrobak, A.; Novotný, J.; Struś, P. Geodiversity assessment as a first step in designating areas of geotourism potential. Case study: Western Carpathians. Front. Earth Sci. 2021, 9, 752669. [Google Scholar] [CrossRef]
  42. Stojilković, B. Towards transferable use of terrain ruggedness component in the geodiversity index. Resources 2022, 11, 22. [Google Scholar] [CrossRef]
  43. Nhancale, B.A.; Smith, R.J. The influence of planning unit characteristics on the efficiency and spatial pattern of systematic conservation planning assessments. Biodivers. Conserv. 2011, 20, 1821–1835. [Google Scholar] [CrossRef]
  44. Peng, J.; Hu, X.X.; Zhao, M.Y.; Liu, Y.X.; Tian, L. Research progress on ecosystem service trade-offs: From cognition to decision-making. Acta Geogr. Sin. 2017, 72, 960–973. [Google Scholar]
  45. Yang, K.; Cao, Y.G.; Li, S.P.; Wang, S.F.; Feng, Y.; Bai, Z.K. Trade-off and synergy of ecosystem service value in typical mine-agriculture-urban compound area: A case study in north Shanxi, China. Acta Ecol. Sin. 2022, 42, 9857–9870. [Google Scholar]
  46. Ma, S.Y.; Huang, X.L.; Huang, J. Temporal and Spatial Variation of Ecosystem Service Value and Its Trade-offs and Synergies in the Urban Agglomeration Around Poyang Lake. Res. Soil Water Conserv. 2024, 31, 391–400. [Google Scholar]
  47. Wen, Y.L.; Zhang, X.L.; Wei, J.H.; Wang, X.; Cai, Y.J. Temporal and spatial variation of ecosystem service value and its trade-offs and synergies in the peripheral region of the Poyang Lake. Geogr. Sin. 2022, 42, 1229–1238. [Google Scholar]
  48. Zheng, D.F.; Wan, J.Y.; Bai, L.N.; Lv, L.T. Multi-scale Analysis of Ecosystem Service Trade-offs/Synergies in Yanshan-Taihang Mountains Area. J. Ecol. Rural Environ. 2022, 38, 409–417. [Google Scholar]
  49. Zhang, M.; Dilinuer, A. Spatiotemporal Evolution, Trade-offs and Synergies Among Ecosystem Services in Bosten Lake Basin. J. Hydroecol. 2022, 43, 29–36. [Google Scholar]
  50. Yin, Y. Research on Township “Multi-Planning” Planning Methods—Taking Pan’an Township of Gangu County as an Example. Intell. City 2020, 6, 137–139. [Google Scholar]
Figure 1. Geographical location of the study area.
Sustainability 16 05929 g001
Figure 2. Distribution of Land use types in Gangu County from 2000 to 2020.
Sustainability 16 05929 g002
Figure 3. Changes in land use area in Gangu County from 2000 to 2020.
Sustainability 16 05929 g003
Figure 4. The value of service value of various land ecosystems in Gangu County from 2000 to 2020.
Sustainability 16 05929 g004
Figure 5. Spatial distribution of ESV in Gangu County at the grid scale.
Sustainability 16 05929 g005
Figure 6. Trade-offs and synergy relationship of ESs in Gangu County, 2000–2020.
Sustainability 16 05929 g006
Figure 7. Trade-offs and synergies among ESs at different times in Gangu County: (a) 2000–2005; (b) 2005–2010; (c) 2010–2015; (d) 2015–2020.
Sustainability 16 05929 g007
Figure 8. Changes in the trade-off synergies between the four services and the individual services at different times in Gangu County.
Sustainability 16 05929 g008
Figure 9. Changes in land use area in Gangu County for the four time periods 2000–2020.
Sustainability 16 05929 g009
Figure 10. Bivariate local spatial autocorrelation analysis of ESs in Gangu County, 2000–2020.
Sustainability 16 05929 g010
Figure 11. Gangu County land use dynamics and area changes, 2000–2020.
Sustainability 16 05929 g011
Table 1. The correction coefficient of ESV per unit area in Gangu County.
First CategorySecond CategoryCultivated LandForest LandGrasslandWatershedUnused Land
Supply servicesFP946.04281.03259.70729.010.00
RM445.19645.53382.13406.240.00
WRS−1474.71333.90211.476054.640.00
Regulation servicesGR745.702123.021343.001485.8422.26
CR400.676352.363550.423277.740.00
EP111.301861.471172.345091.91111.30
HR300.514157.002600.6870,379.6433.39
Support servicesSC1146.382584.911636.091803.0422.26
MNC133.56197.55126.14139.120.00
BP144.692353.961487.695798.6522.26
Culture servicesAL66.781032.29656.663683.9811.13
Total4463.0721,923.0313,426.3198,849.80222.60
Note: FP, RM, WRS, GR, CR, EP, HR, SC, MNC, BP, and AL denote food production, raw material, water resource supply, gas regulation, climate regulation, environment purification, hydrologic regulation, soil conservation, maintenance of nutrient cycling, biodiversity protection, and aesthetic landscape, respectively.
Table 2. Land use dynamics in Gangu County from 2000 to 2020.
Land Use TypeLand Use Dynamics/%
2000–20052005–20102010–20152015–20202000–2020
Cultivated land−0.37−0.83−0.05−0.26−1.48
Forest land1.380.08−0.05−0.341.04
Grassland0.361.43−0.040.292.09
Watershed−0.160.640.03−0.57−0.08
Construction land0.840.501.121.874.68
Unused land−0.04−10.156.73−6.00−10.80
Table 3. Various land ecosystem service values of Gangu County from 2000 to 2020.
LULC TypeEcosystem Service Values/(108 CNY)Ecological Service Change Index (ESCI)/%
200020052010201520202000–
2005
2005–
2010
2010–
2015
2015–
2020
2000–
2020
Cultivated land2.75722.70662.59372.58742.5538−1.84−4.17−0.24−1.30−7.38
Forest land1.85471.98251.99071.98581.95156.890.41−0.25−1.725.22
Grassland6.74066.86307.35467.34007.44651.827.16−0.201.4510.47
Watershed1.16851.15941.19671.19841.1640−0.783.220.14−2.87−0.38
Unused land0.00030.00030.00010.00020.0001−0.20−50.7433.65−30.01−54.02
Total12.521412.711813.135813.111813.11601.523.34−0.180.034.75
Table 4. The value of service value of the single ecosystem of Gangu County from 2000 to 2020.
First CategorySecond CategoryESV/(108 CNY)
20002005201020152020
Supply servicesFP1.04221.03001.00391.00150.9922
RM0.66510.66470.66210.66070.6575
WRS−1.1649−1.1364−1.0701−1.0672−1.0514
Total0.5424 0.5583 0.5959 0.5950 0.5982
Regulation servicesGR1.56461.57641.59851.59501.5934
CR2.73112.79342.91172.90562.9182
EP0.90990.92900.97020.96840.9718
HR2.76872.80502.91692.91372.9000
Total7.9743 8.1038 8.3973 8.3828 8.3833
Support ServicesSC2.12712.13732.15522.15052.1458
MNC0.20580.20580.20550.20500.2042
BP1.14911.17341.22541.22311.2275
Total3.4820 3.5166 3.5861 3.5786 3.5775
Culture servicesAL0.52260.53320.55640.55540.5570
Total0.5226 0.5332 0.5564 0.5554 0.5570
Table 5. Contribution of LULC to ESV in Gangu County from 2000 to 2020.
Status2000–20052005–20102010–20152015–2020
Type of ConversionEcological ContributionType of ConversionEcological ContributionType of ConversionEcological ContributionType of ConversionEcological Contribution
Deterioration%1–261.571–257.381–259.041–255.72
5–217.805–221.805–217.635–211.88
4–26.504–16.854–27.115–37.96
4–15.114–26.084–15.264–16.85
2–34.252–34.162–35.174–26.33
1–32.541–31.941–32.472–35.15
Melioration%2–160.792–165.882–160.412–164.52
2–414.872–517.242–518.852–515.27
2–513.862–46.162–46.902–46.61
1–45.151–44.031–45.571–45.28
3–22.573–22.253–23.303–23.19
3–11.403–11.573–12.163–12.26
Among them, 1–6 represents grassland, cultivated land, construction land, forest land, watershed, and unused land.
Table 6. Gangu County’s ESV is in different levels of area from 2000 to 2020.
YearType of StatisticLow ESV ZoneLower ESV ZoneMedium ESV ZoneHigher ESV ZoneHigh ESV Zone
2000 Area (hm2)5150.4322,616.2699,642.2513,675.3217,145.08
Proportion (%)3.2614.2962.978.6410.84
2005Area (hm2)4798.7923,706.37109,417.6714,211.176095.34
Proportion (%)3.0314.9869.158.983.85
2010Area (hm2)5473.7123,149.2087,340.0422,070.8820,195.50
Proportion (%)3.4614.6355.2013.9512.76
2015Area (hm2)6493.0044,820.0574,620.4314,994.9517,300.90
Proportion (%)4.1028.3347.169.4810.93
2020Area (hm2)5957.7120,305.0990,675.1120,127.9121,163.50
Proportion (%)3.7712.8357.3112.7213.38
Table 7. Univariate global spatial autocorrelation of four ESs in Gangu County.
Type of Ecosystem
Service
20002005201020152020
Moran’s IpMoran’s IpMoran’s IpMoran’s IpMoran’s Ip
Total value of ESV0.442<0.0010.728<0.0010.436<0.0010.468<0.0010.462<0.001
Supply services0.498<0.0010.814<0.0010.531<0.0010.534<0.0010.530<0.001
Regulation services0.418<0.0010.751<0.0010.452<0.0010.455<0.0010.449<0.001
Support Services0.445<0.0010.562<0.0010.439<0.0010.439<0.0010.433<0.001
Culture services0.518<0.0010.752<0.0010.526<0.0010.528<0.0010.522<0.001
Table 8. Bivariate global autocorrelation of ecosystem service pairs in Gangu County.
YearSupply-
Regulation
Supply-
Support
Supply-
Culture
Regulation-
Support
Regulation-
Culture
Support–
Culture
20000.445 ***0.414 ***0.501 ***0.384 ***0.447 ***0.448 ***
20050.776 ***0.600 ***0.778 ***0.603 ***0.751 ***0.601 ***
20100.482 ***0.419 ***0.520 ***0.403 ***0.473 ***0.447 ***
20150.485 ***0.418 ***0.522 ***0.402 ***0.475 ***0.447 ***
20200.480 ***0.412 ***0.517 ***0.397 ***0.470 ***0.441 ***
Note: *** denotes passing the significance level test of p < 0.001.
Disclaimer/Publisher’s Note: The statements, opinions and data contained in all publications are solely those of the individual author(s) and contributor(s) and not of MDPI and/or the editor(s). MDPI and/or the editor(s) disclaim responsibility for any injury to people or property resulting from any ideas, methods, instructions or products referred to in the content.

