
Resilience Approach for Assessing Fish Recovery after Compound Climate Change Effects on Algal Blooms

Abstract
:1. Introduction
2. Materials and Methods
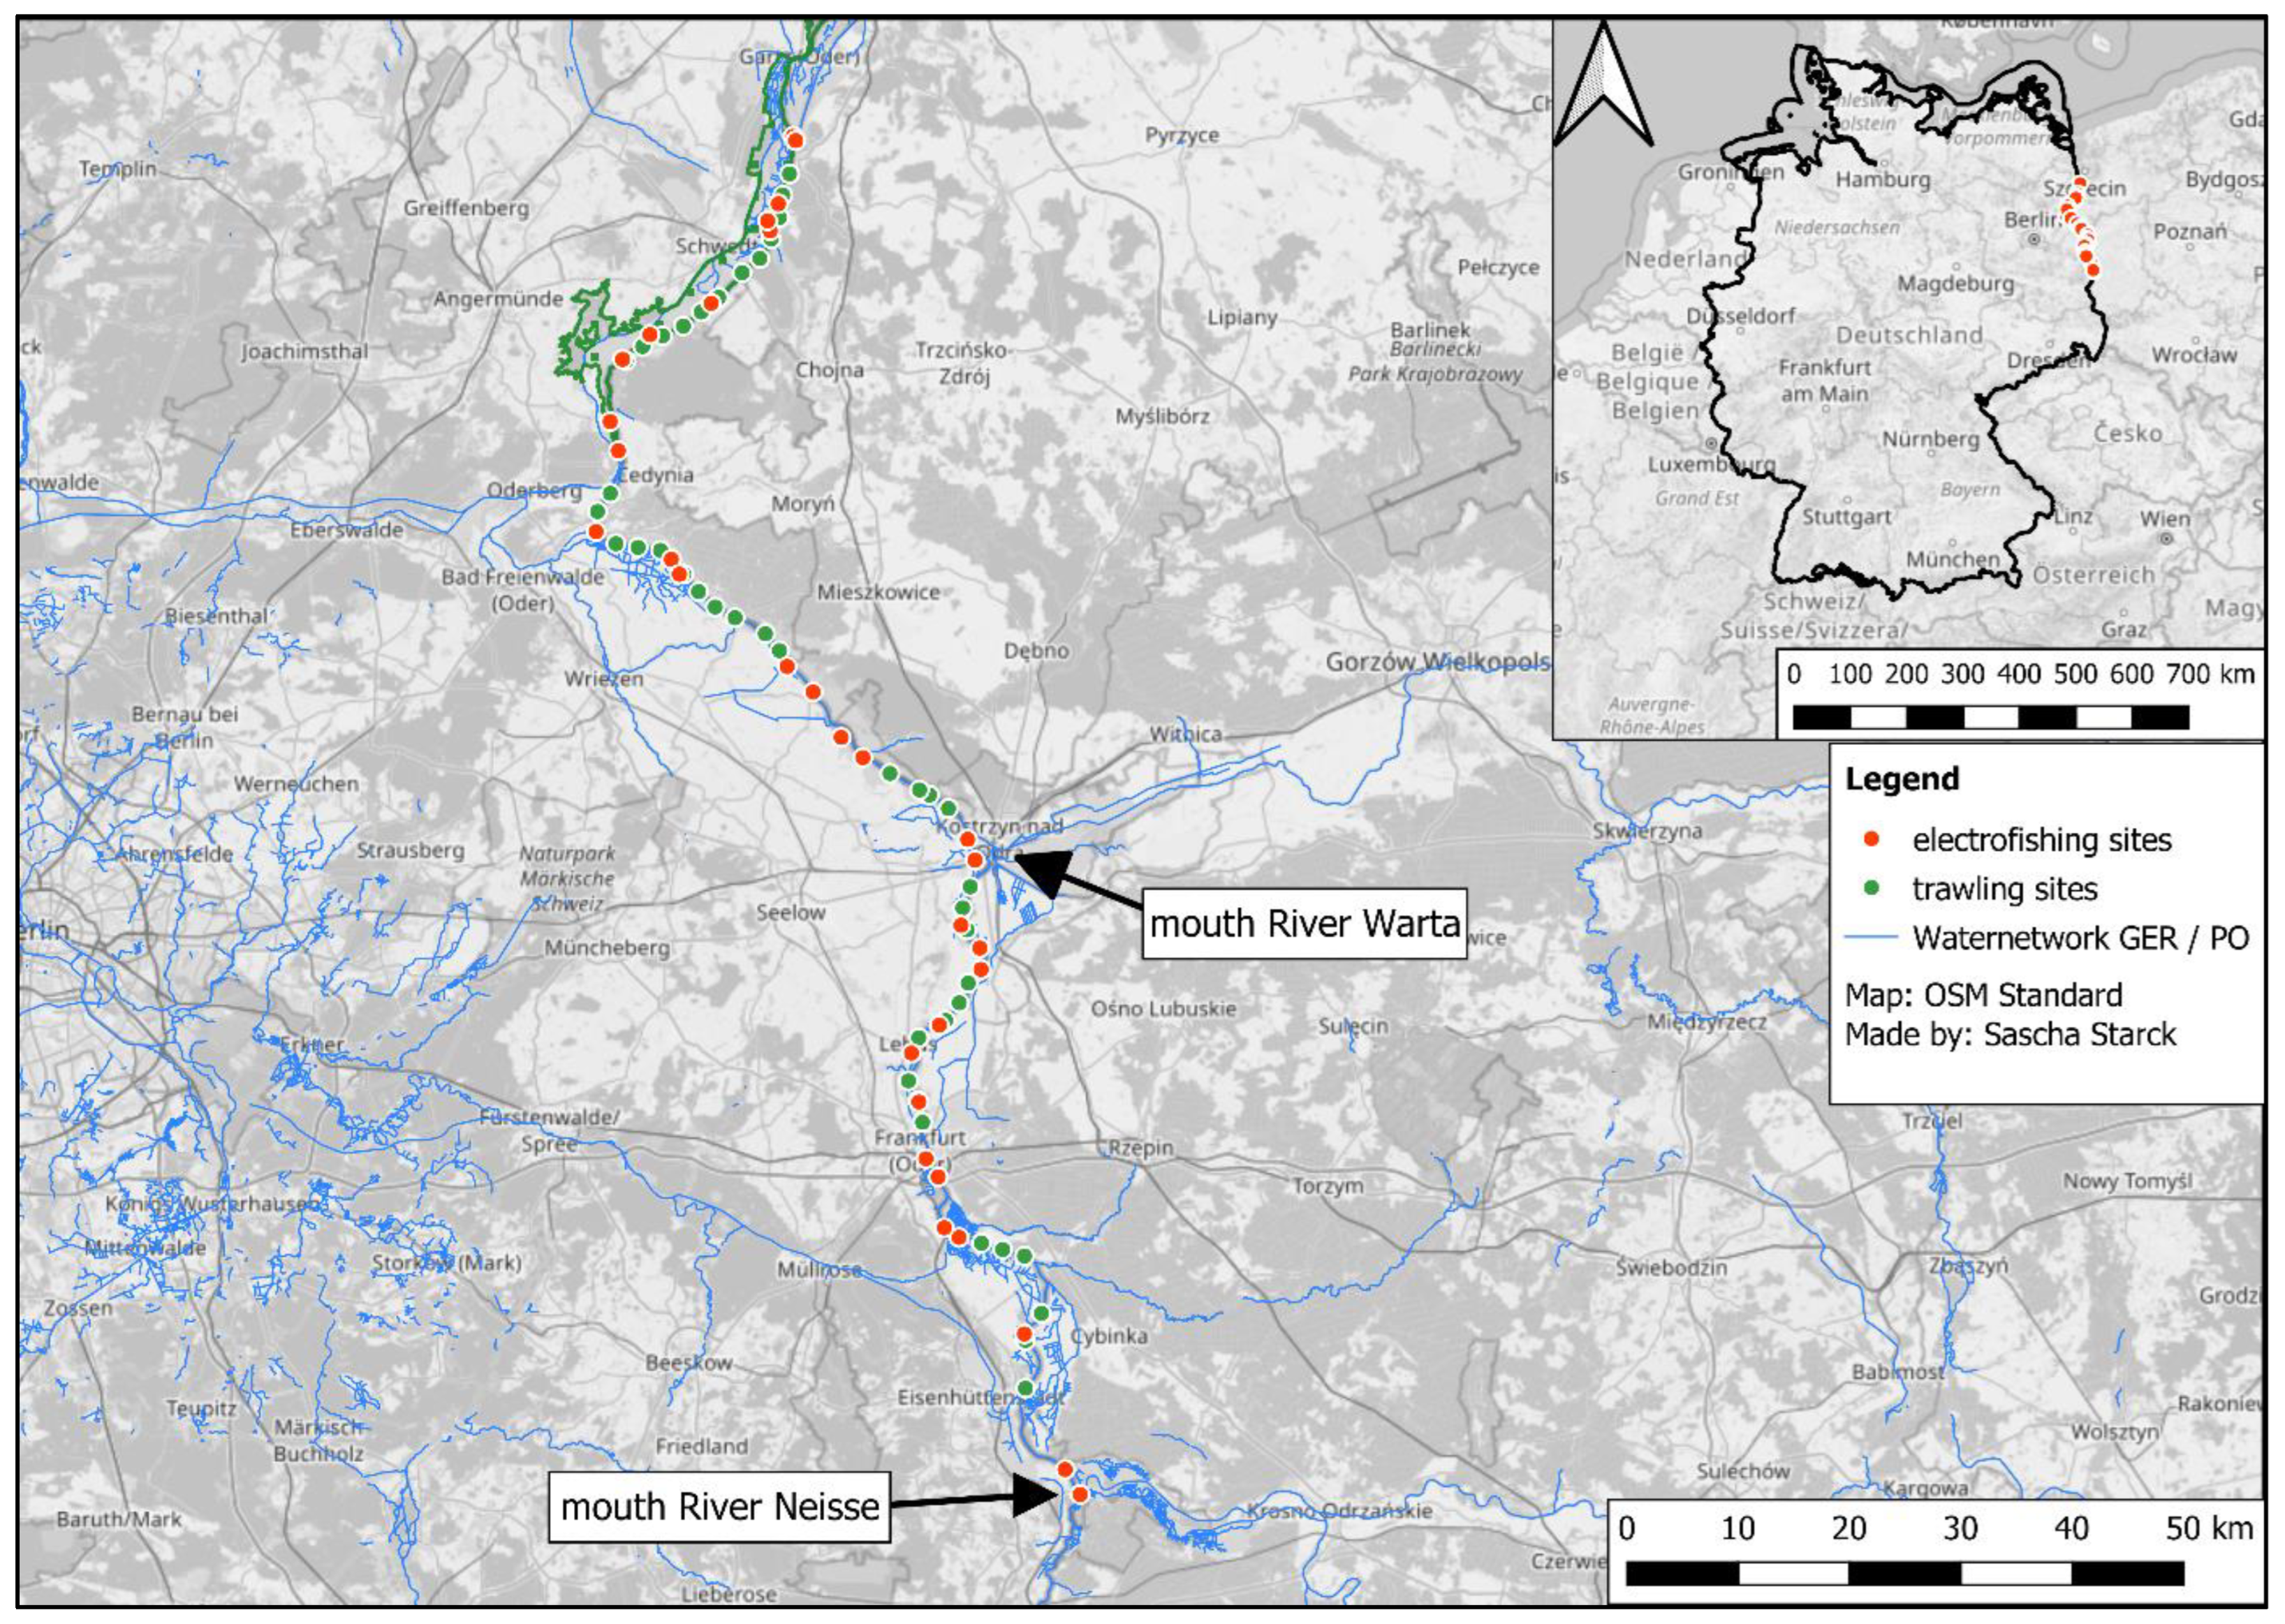
2.1. Study Area
2.2. Fish Sampling
2.3. Data Analysis
3. Results
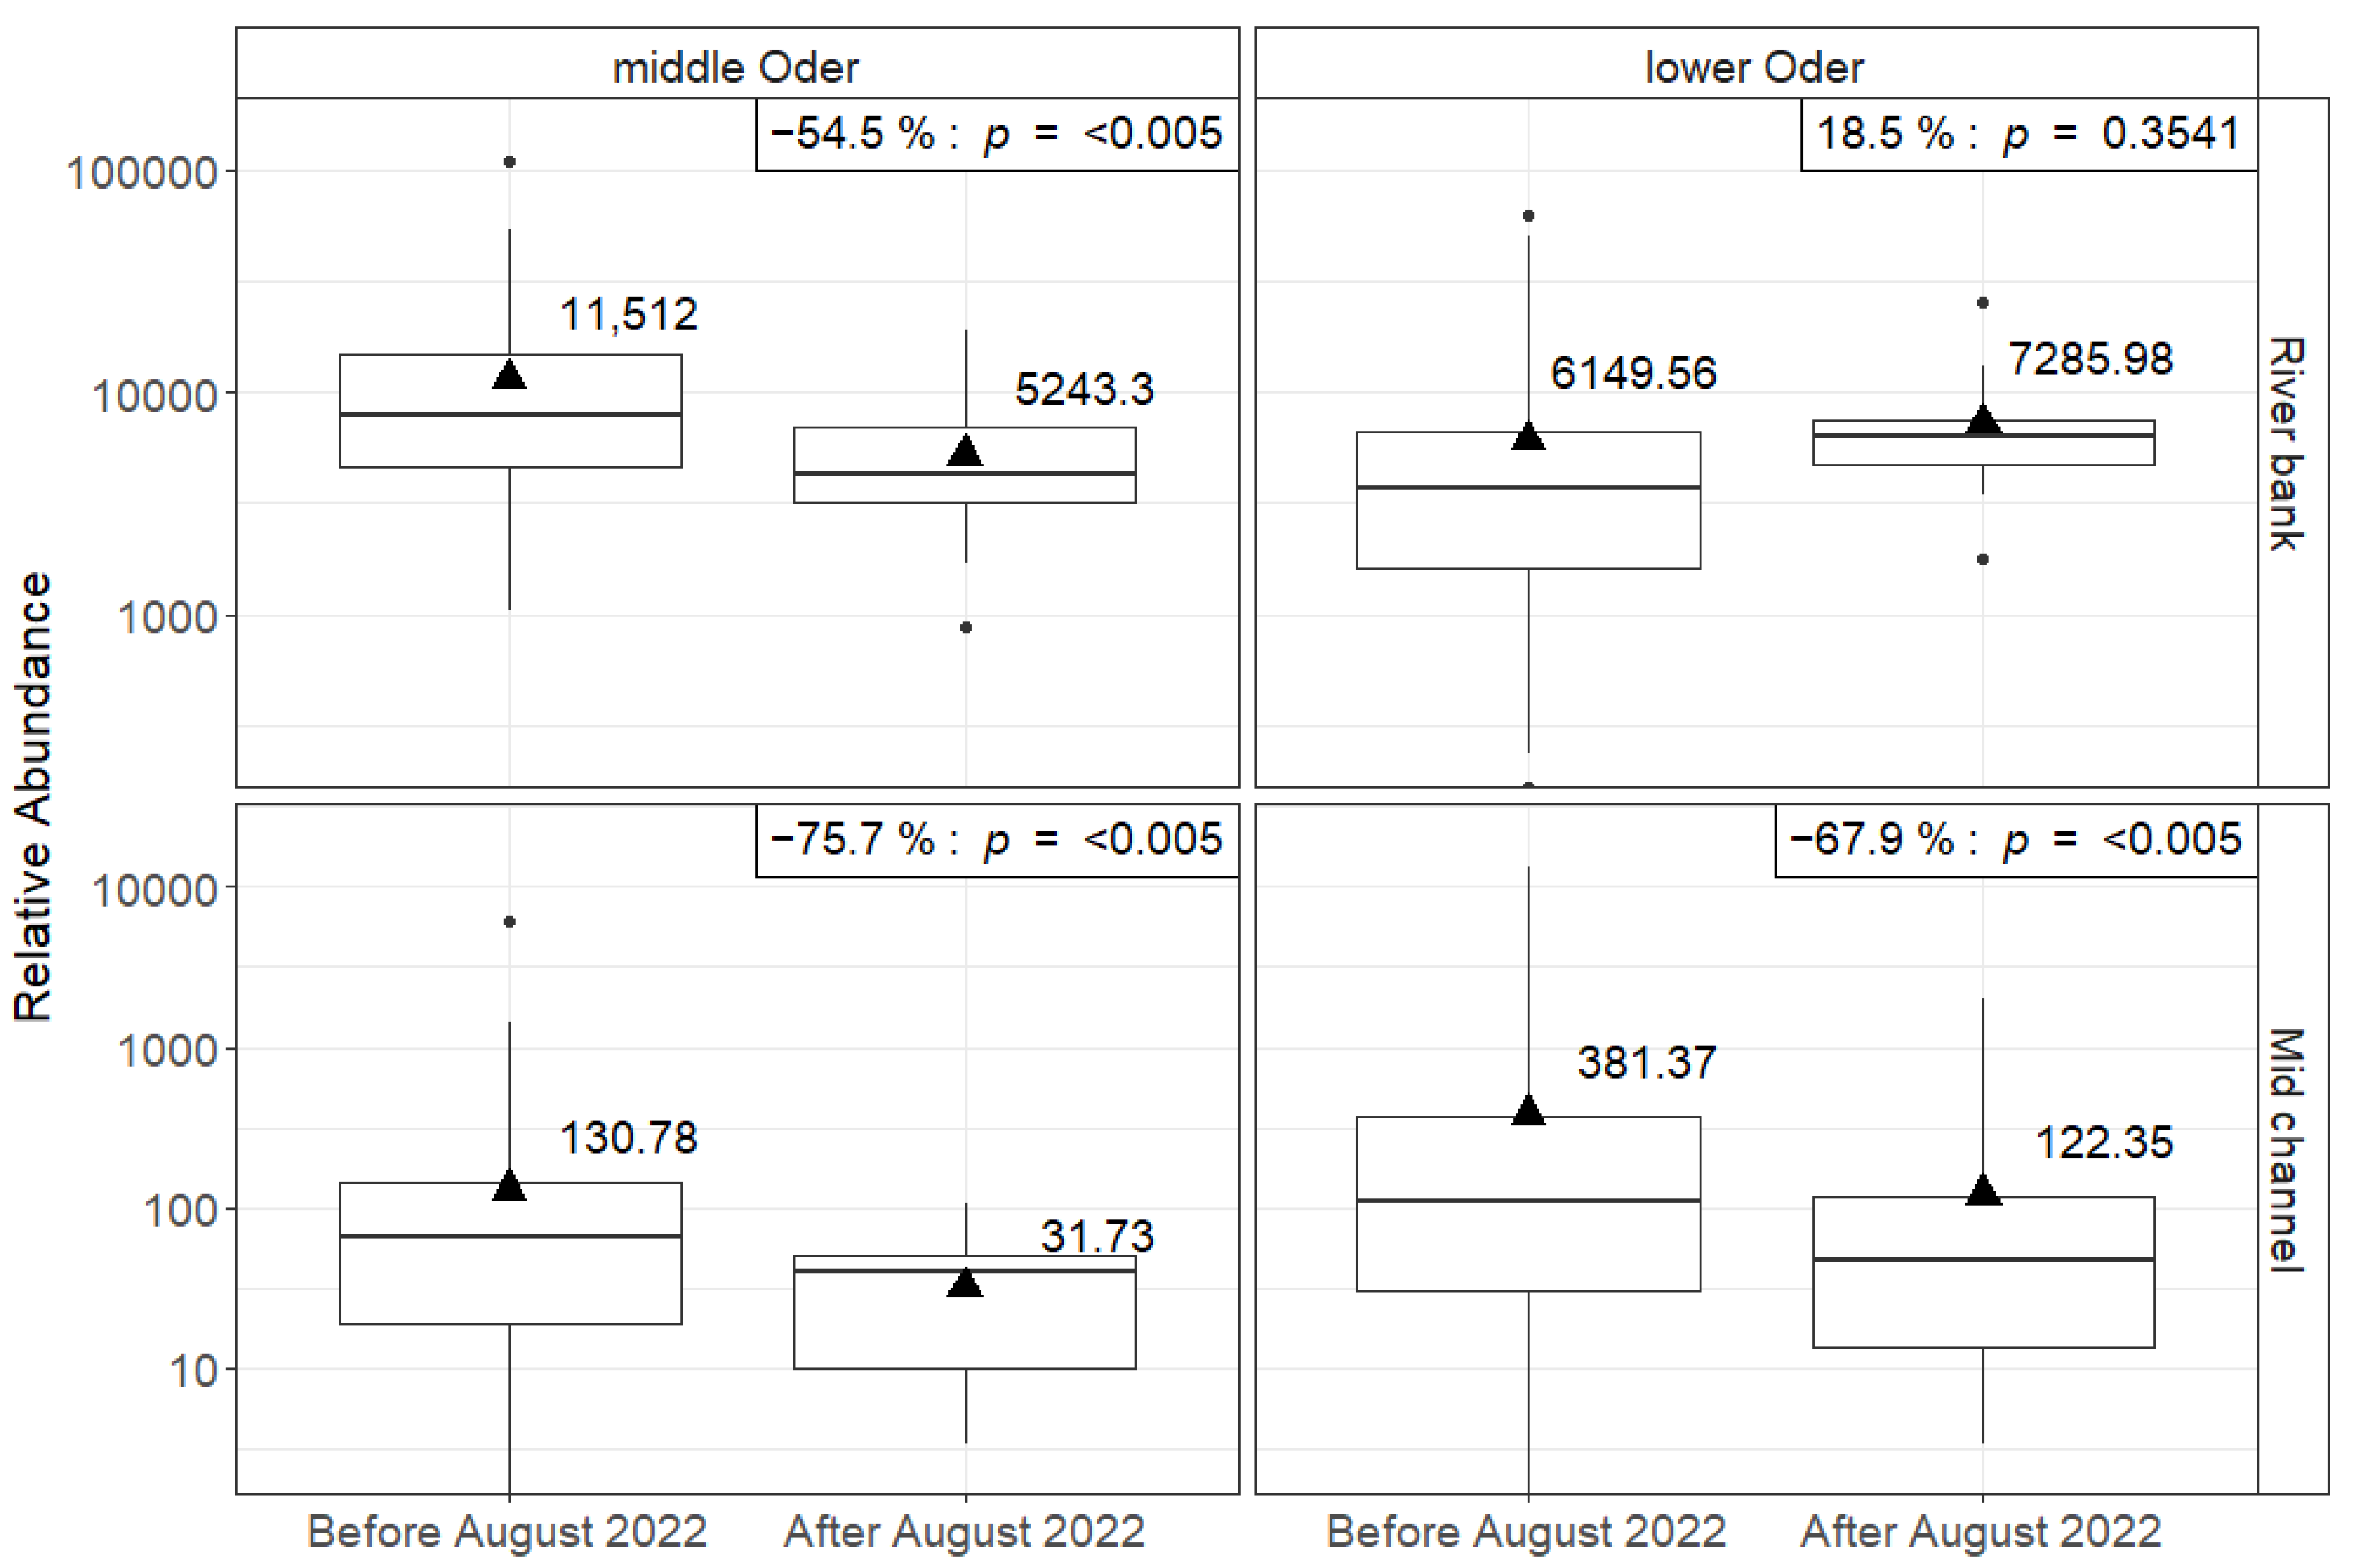
3.1. Abundance
3.2. Biomass
3.3. Distribution Changes
4. Discussion
5. Conclusions
Supplementary Materials
Author Contributions
Funding
Data Availability Statement
Conflicts of Interest
References
- Intergovernmental Panel on Climate Change (IPCC). Climate Change 2022—Impacts, Adaptation and Vulnerability: Working Group II Contribution to the Sixth Assessment Report of the Intergovernmental Panel on Climate Change, 1st ed.; Cambridge University Press: Cambridge, UK, 2023; ISBN 978-1-00-932584-4. [Google Scholar]
- Blöschl, G.; Hall, J.; Parajka, J.; Perdigão, R.A.P.; Merz, B.; Arheimer, B.; Aronica, G.T.; Bilibashi, A.; Bonacci, O.; Borga, M.; et al. Changing Climate Shifts Timing of European Floods. Science 2017, 357, 588–590. [Google Scholar] [CrossRef] [PubMed]
- Bormann, H.; Pinter, N. Trends in Low Flows of German Rivers since 1950: Comparability of Different Low-flow Indicators and Their Spatial Patterns. River Res. Appl. 2017, 33, 1191–1204. [Google Scholar] [CrossRef]
- Cubasch, U.; Kadow, C. Global Climate Change and Aspects of Regional Climate Change in the Berlin-Brandenburg Region. DIE ERDE–J. Geogr. Soc. Berl. 2019, 142, 3–20. [Google Scholar] [CrossRef]
- Hattermann, F.F.; Huang, S.; Koch, H. Climate Change Impacts on Hydrology and Water Resources. Meteorol. Z. 2015, 24, 201–211. [Google Scholar] [CrossRef]
- Garack, S.; Wollrab, S.; Jähnig, S.; Günther, K.; Berger, S.A.; Neubert, M.; Albrecht, J.; Friedrichs-Manthey, M.; Sauer, A.; Kirillin, G. Entwicklung Der Ökologischen Beschaffenheit von Oberflächengewässern Im Klimawandel; Umweltbundesamt: Dessau-Roßlau, Germany, 2022; pp. 98–107. [Google Scholar] [CrossRef]
- Mantyka-Pringle, C.S.; Martin, T.G.; Moffatt, D.B.; Linke, S.; Rhodes, J.R. Understanding and Predicting the Combined Effects of Climate Change and Land-use Change on Freshwater Macroinvertebrates and Fish. J. Appl. Ecol. 2014, 51, 572–581. [Google Scholar] [CrossRef]
- Donadi, S.; Degerman, E.; McKie, B.G.; Jones, D.; Holmgren, K.; Sandin, L. Interactive Effects of Land Use, River Regulation, and Climate on a Key Recreational Fishing Species in Temperate and Boreal Streams. Freshw. Biol. 2021, 66, 1901–1914. [Google Scholar] [CrossRef]
- Markovic, D.; Scharfenberger, U.; Schmutz, S.; Pletterbauer, F.; Wolter, C. Variability and Alterations of Water Temperatures across the Elbe and Danube River Basins. Clim. Change 2013, 119, 375–389. [Google Scholar] [CrossRef]
- Franke, F.; Armitage, S.A.O.; Kutzer, M.A.M.; Kurtz, J.; Scharsack, J.P. Environmental Temperature Variation Influences Fitness Trade-Offs and Tolerance in a Fish-Tapeworm Association. Parasites Vectors 2017, 10, 252. [Google Scholar] [CrossRef]
- Guijarro, J.A.; Cascales, D.; García-Torrico, A.I.; García-Domínguez, M.; Méndez, J. Temperature-Dependent Expression of Virulence Genes in Fish-Pathogenic Bacteria. Front. Microbiol. 2015, 6, 700. [Google Scholar] [CrossRef]
- Waldner, K.; Bechter, T.; Auer, S.; Borgwardt, F.; El-Matbouli, M.; Unfer, G. A Brown Trout (Salmo trutta) Population Faces Devastating Consequences due to Proliferative Kidney Disease and Temperature Increase: A Case Study from Austria. Ecol. Freshw. Fish 2020, 29, 465–476. [Google Scholar] [CrossRef]
- Brookes, A. The Distribution and Management of Channelized Streams in Denmark. Regul. Rivers Res. Mgmt. 1987, 1, 3–16. [Google Scholar] [CrossRef]
- Petts, G.E.; Möller, H.; Roux, A.L. (Eds.) Historical Change of Large Alluvial Rivers: Western Europe; Wiley: Chichester, UK; New York, NY, USA, 1989; ISBN 978-0-471-92163-9. [Google Scholar]
- Tockner, K.; Zarfl, C.; Robinson, C.T. Rivers of Europe, 2nd ed.; Elsevier: Amsterdam, The Netherlands, 2022; ISBN 978-0-08-102613-7. [Google Scholar]
- Parasiewicz, P.; King, E.L.; Webb, J.A.; Piniewski, M.; Comoglio, C.; Wolter, C.; Buijse, A.D.; Bjerklie, D.; Vezza, P.; Melcher, A.; et al. The Role of Floods and Droughts on Riverine Ecosystems under a Changing Climate. Fish Manag. Ecol. 2019, 26, 461–473. [Google Scholar] [CrossRef]
- Van Vliet, M.T.H.; Thorslund, J.; Strokal, M.; Hofstra, N.; Flörke, M.; Ehalt Macedo, H.; Nkwasa, A.; Tang, T.; Kaushal, S.S.; Kumar, R.; et al. Global River Water Quality under Climate Change and Hydroclimatic Extremes. Nat. Rev. Earth Environ. 2023, 4, 687–702. [Google Scholar] [CrossRef]
- Arthington, A.H.; Kennen, J.G.; Stein, E.D.; Webb, J.A. Recent Advances in Environmental Flows Science and Water Management—Innovation in the Anthropocene. Freshw. Biol. 2018, 63, 1022–1034. [Google Scholar] [CrossRef]
- Li, L.; Knapp, J.L.A.; Lintern, A.; Ng, G.-H.C.; Perdrial, J.; Sullivan, P.L.; Zhi, W. River Water Quality Shaped by Land–River Connectivity in a Changing Climate. Nat. Clim. Change 2024, 14, 225–237. [Google Scholar] [CrossRef]
- Wiederhold, J.; Buchinger, S.; Düster, L.; Fischer, H.; Hahn, J.; Helms, M.; Hermes, N.; Jewell, K.; Kleinteich, J.; Krenek, S.; et al. Untersuchungen Zum Fischsterben in Der Oder Im August 2022: Bericht; Bundesanstalt für Gewässerkunde: Koblenz, Germany, 2023. [Google Scholar]
- Free, G.; Van de Bund, W.; Gawlik, B.; Van Wijk, L.; Wood, M.; Guagnini, E.; Koutelos, K.; Annunziato, A.; Grizzetti, B.; Vigiak, O.; et al. An EU Analysis of the Ecological Disaster in the Oder River of 2022: Lessons Learned and Research Based Recommendations to Avoid Future Ecological Damage in EU Rivers, a Joint Analysis from DG ENV, JRC and the EEA; Publications Office: Luxembourg, 2023. [Google Scholar]
- La, V.T.; Cooke, S.J. Advancing the Science and Practice of Fish Kill Investigations. Rev. Fish. Sci. 2011, 19, 21–33. [Google Scholar] [CrossRef]
- Brooks, B.W.; James, S.V.; Valenti, T.W., Jr.; Urena-Boeck, F.; Serrano, C.; Berninger, J.P.; Schwierzke, L.; Mydlarz, L.D.; Grover, J.P.; Roelke, D.L. Comparative Toxicity of Prymnesium Parvum. JAWRA J. Am. Water Resour. Assoc. 2010, 46, 45–62. [Google Scholar] [CrossRef]
- Granéli, E.; Salomon, P.S. Factors Influencing Allelopathy and Toxicity in Prymnesium Parvum. JAWRA J. Am. Water Resour. Assoc. 2010, 46, 108–120. [Google Scholar] [CrossRef]
- Guo, M.; Harrison, P.J.; Taylor, F.J.R. Fish Kills Related to Prymnesium Parvum N. Carter (Haptophyta) in the People’s Republic of China. J. Appl. Phycol. 1996, 8, 111–117. [Google Scholar] [CrossRef]
- Hallegraeff, G.M. A Review of Harmful Algal Blooms and Their Apparent Global Increase. Phycologia 1993, 32, 79–99. [Google Scholar] [CrossRef]
- Fu, F.-X.; Tatters, A.; Hutchins, D.A. Global Change and the Future of Harmful Algal Blooms in the Ocean. Mar. Ecol. Prog. Ser. 2012, 470, 207–233. [Google Scholar] [CrossRef]
- Smayda, T.J. Harmful Algal Blooms: Their Ecophysiology and General Relevance to Phytoplankton Blooms in the Sea. Limnol. Oceanogr. 1997, 42, 1137–1153. [Google Scholar] [CrossRef]
- Lutz-Carrillo, D.J.; Southard, G.M.; Fries, L.T. Global Genetic Relationships Among Isolates of Golden Alga (Prymnesium parvum). J. Am. Water Resour. Assoc. 2010, 46, 24–32. [Google Scholar] [CrossRef]
- Roelke, D.L.; Barkoh, A.; Brooks, B.W.; Grover, J.P.; Hambright, K.D.; LaClaire, J.W.; Moeller, P.D.R.; Patino, R. A Chronicle of a Killer Alga in the West: Ecology, Assessment, and Management of Prymnesium Parvum Blooms. Hydrobiologia 2016, 764, 29–50. [Google Scholar] [CrossRef]
- Kell, V.V.; Noack, B. Kurze Mitteilung: Fischsterben Durch Prymnesium saltans Massart Im Kleinen Jasmunder Bodden (Rügen) Im April 1990. J. Appl. Ichthyol. 1991, 7, 187–192. [Google Scholar] [CrossRef]
- Death, R.G. The Resilience of Riverine Ecological Communities. In Resilience and Riverine Landscapes; Elsevier: Amsterdam, The Netherlands, 2024; pp. 23–39. ISBN 978-0-323-91716-2. [Google Scholar]
- Van Looy, K.; Tonkin, J.D.; Floury, M.; Leigh, C.; Soininen, J.; Larsen, S.; Heino, J.; LeRoy Poff, N.; Delong, M.; Jähnig, S.C.; et al. The Three Rs of River Ecosystem Resilience: Resources, Recruitment, and Refugia: The Three Rs of River Resilience: Resources, Recruitment and Refugia. River Res. Appl. 2019, 35, 107–120. [Google Scholar] [CrossRef]
- Wolter, C.; Zahn, S.; Gessner, J. Entwicklung, Nutzung Und Schutz Der Fischfauna in Der Brandenburgischen Oder; Schriften Des Inst. Für Binnenfisch. E.V.: Potsdam-Sacrow, Germany, 2023; Volume 65, ISSN 1438-4876. [Google Scholar]
- Gessner, J.; Arndt, G.-M.; Kapusta, A.; Shibayev, S.; Gushin, A.; Pilinkovskij, A.; Povliūnas, J.; Medne, R.; Purvina, S.; Tambets, M.; et al. HELCOM Action Plan for the Protection and Recovery of the Baltic Sturgeon (Acipenser Oxyrinchus Oxyrinchus) in the Baltic Sea Area for the Period of 2019–2029; Baltic Sea Environment Proceedings 168; Baltic Marine Environment Protection Commission (Helsinki Commission/HEL-COM): Helsinki, Finland, 2019. [Google Scholar]
- Dutilleul, P.; Legendre, P. Spatial Heterogeneity against Heteroscedasticity: An Ecological Paradigm versus a Statistical Concept. Oikos 1993, 66, 152. [Google Scholar] [CrossRef]
- Hastings, A.; Hom, C.L.; Ellner, S.; Turchin, P.; Godfray, H.C.J. Chaos in Ecology: Is Mother Nature a Strange Attractor? Annu. Rev. Ecol. Syst. 1993, 24, 1–33. [Google Scholar] [CrossRef]
- Stine, R. An introduction to bootstrap methods: Examples and ideas. Sociol. Methods Res. 1989, 18, 243–291. [Google Scholar] [CrossRef]
- Achleitner, D.; Gassner, H.; Luger, M. Comparison of Three Standardised Fish Sampling Methods in 14 Alpine Lakes in Austria: Comparison of Fish Sampling Methods for Lakes. Fish. Manag. Ecol. 2012, 19, 352–361. [Google Scholar] [CrossRef]
- Fischer, J.R.; Quist, M.C. Characterizing Lentic Freshwater Fish Assemblages Using Multiple Sampling Methods. Environ. Monit. Assess. 2014, 186, 4461–4474. [Google Scholar] [CrossRef] [PubMed]
- Mueller, M.; Pander, J.; Knott, J.; Geist, J. Comparison of Nine Different Methods to Assess Fish Communities in Lentic Flood-Plain Habitats: Flood-Plain Monitoring Methods. J. Fish. Biol. 2017, 91, 144–174. [Google Scholar] [CrossRef]
- Wickham, H. Ggplot2: Elegant Graphics for Data Analysis, 2nd ed.; Use R!; Springer: Cham, Switzerland, 2016; ISBN 978-3-319-24275-0. [Google Scholar]
- Pearsons, T.N.; Li, H.W.; Lamberti, G.A. Influence of Habitat Complexity on Resistance to Flooding and Resilience of Stream Fish Assemblages. Trans. Am. Fish. Soc. 1992, 121, 427–436. [Google Scholar] [CrossRef]
- Marques, H.; Dias, J.H.P.; Perbiche-Neves, G.; Kashiwaqui, E.A.L.; Ramos, I.P. Importance of Dam-Free Tributaries for Conserving Fish Biodiversity in Neotropical Reservoirs. Biol. Conserv. 2018, 224, 347–354. [Google Scholar] [CrossRef]
- van Treeck, R.; Van Wichelen, J.; Wolter, C. Fish Species Sensitivity Classification for Environmental Impact Assessment, Conservation and Restoration Planning. Sci. Total Environ. 2020, 708, 135173. [Google Scholar] [CrossRef]
- Sedell, J.R.; Reeves, G.H.; Hauer, F.R.; Stanford, J.A.; Hawkins, C.P. Role of Refugia in Recovery from Disturbances: Modern Fragmented and Disconnected River Systems. Environ. Manag. 1990, 14, 711–724. [Google Scholar] [CrossRef]
- Hartman, K.J.; Wellman, D.I.; Kingsbury, J.W.; Cincotta, D.A.; Clayton, J.L.; Eliason, K.M.; Jernejcic, F.A.; Owens, N.V.; Smith, D.M. A Case Study of a Prymnesium Parvum Harmful Algae Bloom in the Ohio River Drainage: Impact, Recovery and Potential for Future Invasions/Range Expansion. Water 2021, 13, 3233. [Google Scholar] [CrossRef]
- Israël, N.M.D.; VanLandeghem, M.M.; Denny, S.; Ingle, J.; Patiño, R. Golden Alga Presence and Abundance Are Inversely Related to Salinity in a High-Salinity River Ecosystem, Pecos River, USA. Harmful Algae 2014, 39, 81–91. [Google Scholar] [CrossRef]
- Hill, P.R.; Kumar, A.; Temimi, M.; Bull, D.R. Machine Learning, Remote Sensing-Based Detection of Harmful Algal Blooms. IEEE J. Sel. Top. Appl. Earth Obs. Remote Sens. 2020, 13, 3229–3239. [Google Scholar] [CrossRef]


| Before August 2022 | After August 2022 | Statistics | ||||||||
|---|---|---|---|---|---|---|---|---|---|---|
| Species | Region | Mean | sd | n | Mean | sd | n | Change [%] | Cohens d | p-Value |
| Blicca bjoerkna | LO | 76.52 | 220.09 | 855 | 21.57 | 66.69 | 39 | −71.8 | 0.255 | 0.0261 |
| MO | 17.52 | 40.72 | 352 | 1.53 | 1.39 | 18 | −91.2 | 0.402 | <0.005 | |
| Romanogobio belingi | LO | 9.68 | 29.74 | 855 | 0.06 | 0.28 | 39 | −99.4 | 0.330 | 0.0499 |
| MO | 3.96 | 9.20 | 352 | 0.28 | 0.53 | 18 | −92.9 | 0.410 | <0.005 | |
| Abramis brama | LO | 20.16 | 44.68 | 855 | 10.54 | 20.25 | 39 | −47.7 | 0.219 | 0.068 |
| MO | 3.51 | 7.85 | 352 | 0.42 | 0.61 | 18 | −88.0 | 0.404 | <0.005 | |
| Ballerus ballerus | LO | 10.28 | 42.86 | 855 | 11.44 | 11.86 | 39 | 11.3 | - | 0.7454 |
| MO | 15.80 | 122.33 | 352 | 12.08 | 10.02 | 18 | −23.5 | - | 0.7684 | |
| Before August 2022 | After August 2022 | Statistics | ||||||||
|---|---|---|---|---|---|---|---|---|---|---|
| Species | Region | Mean | sd | n | Mean | sd | n | Change [%] | Cohen’s d | p-Value |
| Alburnurs alburnus | LO | 654.62 | 1850.39 | 227 | 2599.03 | 4376.27 | 19 | 297.0 | −0.908 | <0.005 |
| MO | 2323.21 | 6986.11 | 100 | 649.12 | 885.66 | 16 | −72.1 | 0.257 | 0.041 | |
| Rutilus rutilus | LO | 1320.37 | 2706.92 | 227 | 1313.64 | 1302.15 | 19 | −0.5 | - | 0.9897 |
| MO | 1660.27 | 1571.95 | 100 | 608.72 | 387.27 | 16 | −63.3 | 0.715 | <0.005 | |
| Lota lota | LO | 515.28 | 626.31 | 227 | 15.45 | 25.47 | 19 | −97.0 | 0.829 | 0.0015 |
| MO | 48.87 | 90.52 | 100 | 2.08 | 6.45 | 16 | −95.7 | 0.554 | <0.005 | |
| Perca fluviatilis | LO | 838.02 | 1332.53 | 227 | 813.54 | 986.27 | 19 | −2.9 | - | 0.9259 |
| MO | 635.73 | 1070.30 | 100 | 162.46 | 211.64 | 16 | −74.4 | 0.473 | <0.005 | |
| Gobio gobio | LO | 71.03 | 278.73 | 227 | 303.55 | 405.44 | 19 | 327.4 | −0,82 | 0.0053 |
| MO | 1093.68 | 3329.56 | 100 | 228.47 | 295.94 | 16 | −79.1 | 0.279 | 0.033 | |
| Before August 2022 | After August 2022 | Statistics | ||||||||
|---|---|---|---|---|---|---|---|---|---|---|
| Species | Region | Mean | sd | n | Mean | sd | n | Change [%] | Cohen’s d | p-Value |
| Blicca bjoerkna | LO | 9.17 | 30.64 | 855 | 2.57 | 8.02 | 39 | −72.0 | 0.220 | 0.0342 |
| MO | 3.21 | 6.60 | 352 | 0.32 | 0.40 | 18 | −90.0 | 0.448 | <0.005 | |
| Romanogobio belingi | LO | 0.06 | 0.21 | 855 | 0.00 | 0.00 | 39 | −99.4 | 0.268 | <0.005 |
| MO | 0.03 | 0.07 | 352 | 0.00 | 0.01 | 18 | −90.0 | 0.384 | <0.005 | |
| Abramis brama | LO | 12.82 | 33.78 | 855 | 12.22 | 23.55 | 39 | −4.7 | - | 0.8968 |
| MO | 3.92 | 9.75 | 352 | 0.76 | 1.36 | 18 | −80.6 | 0.333 | 0.012 | |
| Ballerus ballerus | LO | 3.79 | 16.64 | 855 | 4.66 | 4.85 | 39 | 23.0 | - | 0.5192 |
| MO | 5.36 | 38.85 | 352 | 5.59 | 4.66 | 18 | 4.3 | - | 0.9554 | |
| Before August 2022 | After August 2022 | Statistics | ||||||||
|---|---|---|---|---|---|---|---|---|---|---|
| Species | Region | Mean | sd | n | Mean | sd | n | Change [%] | Cohen’s d | p-Value |
| Alburnurs alburnus | LO | 1.64 | 2.97 | 227 | 4.97 | 6.90 | 19 | 203.0 | −0.976 | <0.005 |
| MO | 3.51 | 6.17 | 100 | 2.63 | 6.16 | 16 | −25.1 | - | 0.655 | |
| Rutilus rutilus | LO | 15.70 | 18.70 | 227 | 16.74 | 14.40 | 19 | 6.6 | - | 0.7675 |
| MO | 18.71 | 19.55 | 100 | 5.52 | 5.38 | 16 | −70.5 | 0.720 | 0.012 | |
| Lota lota | LO | 22.50 | 25.75 | 227 | 0.33 | 0.88 | 19 | −98.5 | 0.895 | 0.0012 |
| MO | 1.67 | 2.96 | 100 | 0.26 | 0.76 | 16 | −84.4 | 0.511 | <0.005 | |
| Perca fluviatilis | LO | 14.20 | 19.63 | 227 | 15.38 | 20.34 | 19 | 8.3 | - | 0.8250 |
| MO | 17.98 | 37.29 | 100 | 3.17 | 4.30 | 16 | −82.4 | 0.410 | 0.006 | |
| Gobio gobio | LO | 0.31 | 1.17 | 227 | 4.57 | 11.86 | 19 | 1374.2 | −1.25 | <0.005 |
| MO | 2.84 | 5.09 | 100 | 1.74 | 2.42 | 16 | −38.7 | - | 0.260 | |
| Middle River Oder | Lower River Oder | |||||||
|---|---|---|---|---|---|---|---|---|
| Species | Before | After | Change [%] | Before | After | Change [%] | ||
| Riverbank | ||||||||
| Leuciscus idus | 16.9 | 3.5 | −79.3 | 29.6 | 32.1 | 8.4 | ||
| Barbus barbus | 4.7 | 9.6 | 104.3 | 2.3 | 1.3 | −43.5 | ||
| Rhodeus amarus | 108.8 | 377.4 | 246.9 | 65.1 | 94.9 | 45.8 | ||
| Squalius cephalus | 59.3 | 58.3 | −1.7 | 20.4 | 68.2 | 234.3 | ||
| Leuciscus leuciscus | 22.5 | 17.7 | −21.3 | 6.0 | 5.5 | −8.3 | ||
| Esox lucius | 19.8 | 11.9 | −39.9 | 15.4 | 11.7 | −24.0 | ||
| Gymnocephalus cernua | 3.0 | 6.6 | 120.0 | 15.0 | 7.2 | −52.0 | ||
| Leuciscus aspius | 7.9 | 6.1 | −22.8 | 7.3 | 10.4 | 42.5 | ||
| Scardinius erythrophthalmus | 22.8 | 28.3 | 24.1 | 31.2 | 39.5 | 26.6 | ||
| Tinca tinca | 2.2 | 4.3 | 95.5 | 3.1 | 2.2 | −29.0 | ||
| Barbatula barbatula | 5.7 | 4.2 | −26.3 | 4.5 | 0.0 | −100.0 | ||
| Cobitis taenia | 105.2 | 92.6 | −12.0 | 105.7 | 72.8 | −31.1 | ||
| Vimba vimba | 3.2 | 4.9 | 53.1 | 2.4 | 1.0 | −58.3 | ||
| Sander lucioperca | 1.3 | 2.7 | 107.7 | 1.5 | 1.0 | −33.3 | ||
| Mid-channel | ||||||||
| Leuciscus idus | 2.9 | 0.0 | −100.0 | 3.9 | 1.2 | −69.2 | ||
| Barbus barbus | 1.4 | 1.0 | −28.6 | 1.2 | 1.0 | −16.7 | ||
| Squalius cephalus | 1.8 | 1.2 | −33.3 | 1.5 | 1.7 | 13.3 | ||
| Esox lucius | 1.0 | 0.0 | −100.0 | 1.7 | 1.6 | −5.9 | ||
| Gymnocephalus cernua | 3.2 | 0.0 | −100.0 | 4.2 | 2.4 | −42.9 | ||
| Leuciscus aspius | 1.2 | 1.0 | −16.7 | 1.4 | 1.7 | 21.4 | ||
| Vimba vimba | 1.3 | 1.3 | 0.0 | 2.1 | 1.0 | −52.4 | ||
| Sander lucioperca | 1.4 | 0.0 | −100.0 | 4.2 | 3.1 | −26.2 | ||
| ≥−100 | <−75 | <−50 | <−25 | 0 | <25 | <50 | <75 | ≥100 |
Disclaimer/Publisher’s Note: The statements, opinions and data contained in all publications are solely those of the individual author(s) and contributor(s) and not of MDPI and/or the editor(s). MDPI and/or the editor(s) disclaim responsibility for any injury to people or property resulting from any ideas, methods, instructions or products referred to in the content. |
© 2024 by the authors. Licensee MDPI, Basel, Switzerland. This article is an open access article distributed under the terms and conditions of the Creative Commons Attribution (CC BY) license (https://creativecommons.org/licenses/by/4.0/).
Share and Cite
Starck, S.; Wolter, C. Resilience Approach for Assessing Fish Recovery after Compound Climate Change Effects on Algal Blooms. Sustainability 2024, 16, 5932. https://doi.org/10.3390/su16145932
Starck S, Wolter C. Resilience Approach for Assessing Fish Recovery after Compound Climate Change Effects on Algal Blooms. Sustainability. 2024; 16(14):5932. https://doi.org/10.3390/su16145932
Chicago/Turabian StyleStarck, Sascha, and Christian Wolter. 2024. "Resilience Approach for Assessing Fish Recovery after Compound Climate Change Effects on Algal Blooms" Sustainability 16, no. 14: 5932. https://doi.org/10.3390/su16145932