Article

A Green Marketing and Operations Management Decision-Making Approach Based on QFDE for Photovoltaic Systems

by
Mario Fargnoli
*,
Emilio Salvatori
and
Massimo Tronci
Department of Mechanical and Aerospace Engineering, Sapienza University of Rome, via Eudossiana 18, 00184 Rome, Italy
*
Author to whom correspondence should be addressed.
Sustainability 2024, 16(14), 5941; https://doi.org/10.3390/su16145941
Submission received: 2 June 2024 / Revised: 3 July 2024 / Accepted: 10 July 2024 / Published: 12 July 2024
(This article belongs to the Section Sustainable Products and Services)

Abstract

:
Today, to properly address circular economy practices, strategic decisions encompassing all the various life cycle stages of products or services have become critically important in the market. However, companies still have difficulties in balancing the technical and environmental requirements of their offerings, and numerous studies outline the need for more research on ecodesign tools to support them in decision-making. To reduce such a research gap, a decision-making framework based on the integrated use of the quality function deployment for the environment (QFDE), analytic hierarchy process (AHP), strengths, weaknesses, opportunities, and threats (SWOT), and TOWS matrix methods was developed through a case study related to the provision of photovoltaic solar systems for domestic use. The results achieved show that to better enhance the company’s offering of ensuring customer satisfaction and green compliance, a shift towards a product–service system (PSS) approach is required, and practical implementation strategies are suggested. Overall, this study contributes to the environmental research literature by streamlining marketing strategy planning decision-making through a novel QFD-based approach that aligns customer requirements with environmental concerns and improvement options. Thus, it provides both academics and practitioners with a useful framework to better address the implementation of circular economy practices.

1. Introduction

Nowadays, companies face significant challenges in balancing the technical and environmental requirements of their offerings since the “green performances” of both products and services have achieved paramount relevance in the market [1,2]. On the one hand, this push towards more sustainable solutions is due to the increasingly large number of regulations that affect the market following the evolution of the concept of “sustainable development”, whose latest goals can be considered the ones stated by the Agenda 2030 promoted worldwide by the United Nations [3]. For example, in the European Union context, the adoption of the Green Deal Plan in 2019 has led to defining a roadmap that will culminate in the adoption of the Ecodesign for Sustainable Products Regulation in the ambit of the New Circular Economy Action Plan [4,5], which aims at achieving a European market characterized by more sustainable, repairable, and circular products. Similar efforts to make sustainable products and reduce resource use have been carried out by other countries. For example, the Singapore and South Korean governments also emphasize the transition to a circular economy (CE) through policy initiatives such as “The Singapore Green Plan 2030” and “The Korean Green New Deal”, respectively [6]. Similarly, Japan adopted several policies that follow the issue of the Sound Material-Cycle Society (SMCS) plan and are aimed at augmenting resource efficiency and establishing sustainable production and consumption patterns, contributing to a circular economy society [7].
On the other hand, consumers also show an ever-greater awareness of environmental issues [8], leading companies towards so-called “green-washing” to augment their market share [9].
In such a context, green manufacturing and green marketing appear as the best strategies to match consumers’ preferences and create long-term business perspectives [10,11], where the latter, also called “sustainable marketing” or “eco-friendly marketing”, concerns the promotion of products and services capable of balancing environmental advantages and values with a company’s revenues [12]. Additionally, strategic decisions also involve the company’s management and operations, when a new offering (i.e., a product, a service, or a combination of them) has to be put on the market [13]. Actually, these decisions involve both product manufacturers and service providers, entailing the whole supply chain’s actors participating in the different life cycle stages of the product/service [14].
Thus, following a circular economy perspective, decision-making should aim not only at satisfying traditional customers’ requirements (i.e., the product/service performances that consumers are longing for) but also at ensuring environmentally friendly performances such as components’ durability and maintainability, easiness to reuse and recycle, and disposal [15]. In other words, when a company has to decide what type of product (and the related services) to offer to customers, each stage of the life cycle has to be considered as a value for both customers and the environment [16].
However, companies continue to face challenges in adopting circular economy business models, and in the literature, the need for further research into the decision-making process to support these companies in embracing CE practices emerges [17,18]. As a matter of fact, integrating circular economy practices requires new business models and operation restructuring. To face these changes, rather than implementing the development of new tools, companies need to understand how to use existing ones to optimize decision-making through strategic management support [19,20].
To reduce the above difficulties, in the literature, numerous approaches can be found, starting from the total life cycle (TLC) approach proposed by Hapuwatte and Jawahir [16], which developed a holistic methodology to include in a circular perspective triple bottom line (TBL) and the 6Rs (reuse, reduce, recycle, remanufacture, recover, redesign) approach together with the perpetual resource flow. Chrispim et al. [21] reviewed 38 tools aimed at assessing the contributions and limitations of tools for assessing circular economy product development. Bocken et al. [22] analyzed the current research on circular design and business model strategies, bringing to light the effectiveness of the access and performance model, which consists of offering the product’s capability or services to satisfy customers’ needs, eliminating the physical ownership of products (i.e., adopting a product–service system PSS approach). These authors also point out the need for the development of practical case studies to validate business model strategies. The demand for more research on environmentally conscious design tools (or ecodesign tools [23,24]) to support companies in decision-making when developing new offerings to meet customer requests also emerged from other studies [25,26,27]. Accordingly, green product development mostly consists of intuitive and difficult-to-quantify decision-making activities. Thus, more scientific tools for sustainability assessment must be investigated [28]. By investigating this research context, Jiang et al. [29] revealed that most used approaches are based on life cycle assessment (LCA) and quality function deployment (QFD) methods. In particular, the latter approach has been recognized as one of the most powerful tools for addressing environmentally conscious product planning and conceptual design [30]. Accordingly, Puglieri et al. [31] found that QFD-based approaches for ecodesign (or green design) represent a sizable segment of sustainable development practices, although the literature still lacks extensive case studies focusing on operational issues (i.e., usability, low application efforts, validation in industrial practices) on the one hand and involving the whole life cycle of the product on the other.
With these considerations, the current study aims to reduce the outlined research gaps and limitations by proposing a methodology based on the QFD approach capable of supporting decision-makers in defining an offering that merges environmental concerns with consumers’ expectations. More specifically, the following research questions were raised:
RQ1. 
How can one elicit the best improvement options related to the offer of a product and its related services considering both the environmental and customers’ requirements?
RQ2. 
How can one select the best strategies to enhance marketing and operations management activities ensuring customer satisfaction and green compliance?
The theoretical contribution of this study pertains to the methodological approach used, which is based on the quality function deployment for the environment (QFDE) method [32] augmented by the analytic hierarchy process (AHP) [33] and strengths, weaknesses, opportunities, and threats (SWOT) analysis [34], augmented by the TOWS matrix [35]. To the authors’ knowledge, the extant literature has scarcely addressed the combined use of these tools especially in the ambit of green marketing, management, and operations decision-making.
Moreover, such an approach has been studied in the context of intermediary business models, in collaboration with a company that operates as an energy provider and is aiming to optimize its offering of photovoltaic (PV) solutions to be used by private citizens in urban and suburban contexts. Indeed, differently from the traditional perspective where manufacturers usually elaborate their offerings based on existing products and additional services, in the intermediary business market, such as the one of energy providers, the company is usually an intermediary between manufacturers and customers [36]. In such a context, the achievement of sustainable solutions in terms of offerings that match the customer needs is even more difficult since it often consists of customized combinations of products and services [37]. Thus, this case study can contribute to the development of practical insights into the ambit of the provision of PV solutions for domestic use, whose market has been ever-increasing in recent years due to both the rise of energy prices and the financial support issued by many governments to foster the achievement of the Agenda 2030 sustainable development goals [38,39]. Accordingly, the selection of the best improvement strategy for putting a PV solution on the market that meets customers’ expectations and allows for the highest efficiencies and the shortest payback periods is indeed crucial for PV system providers [40].
The remainder of this paper consists of the following: In Section 2, materials and methods are described, and the proposed methodology is outlined. In Section 3, the case study is described, while its results are discussed in Section 4. Section 5 reports conclusive remarks proposing future research hints.

2. Materials and Methods

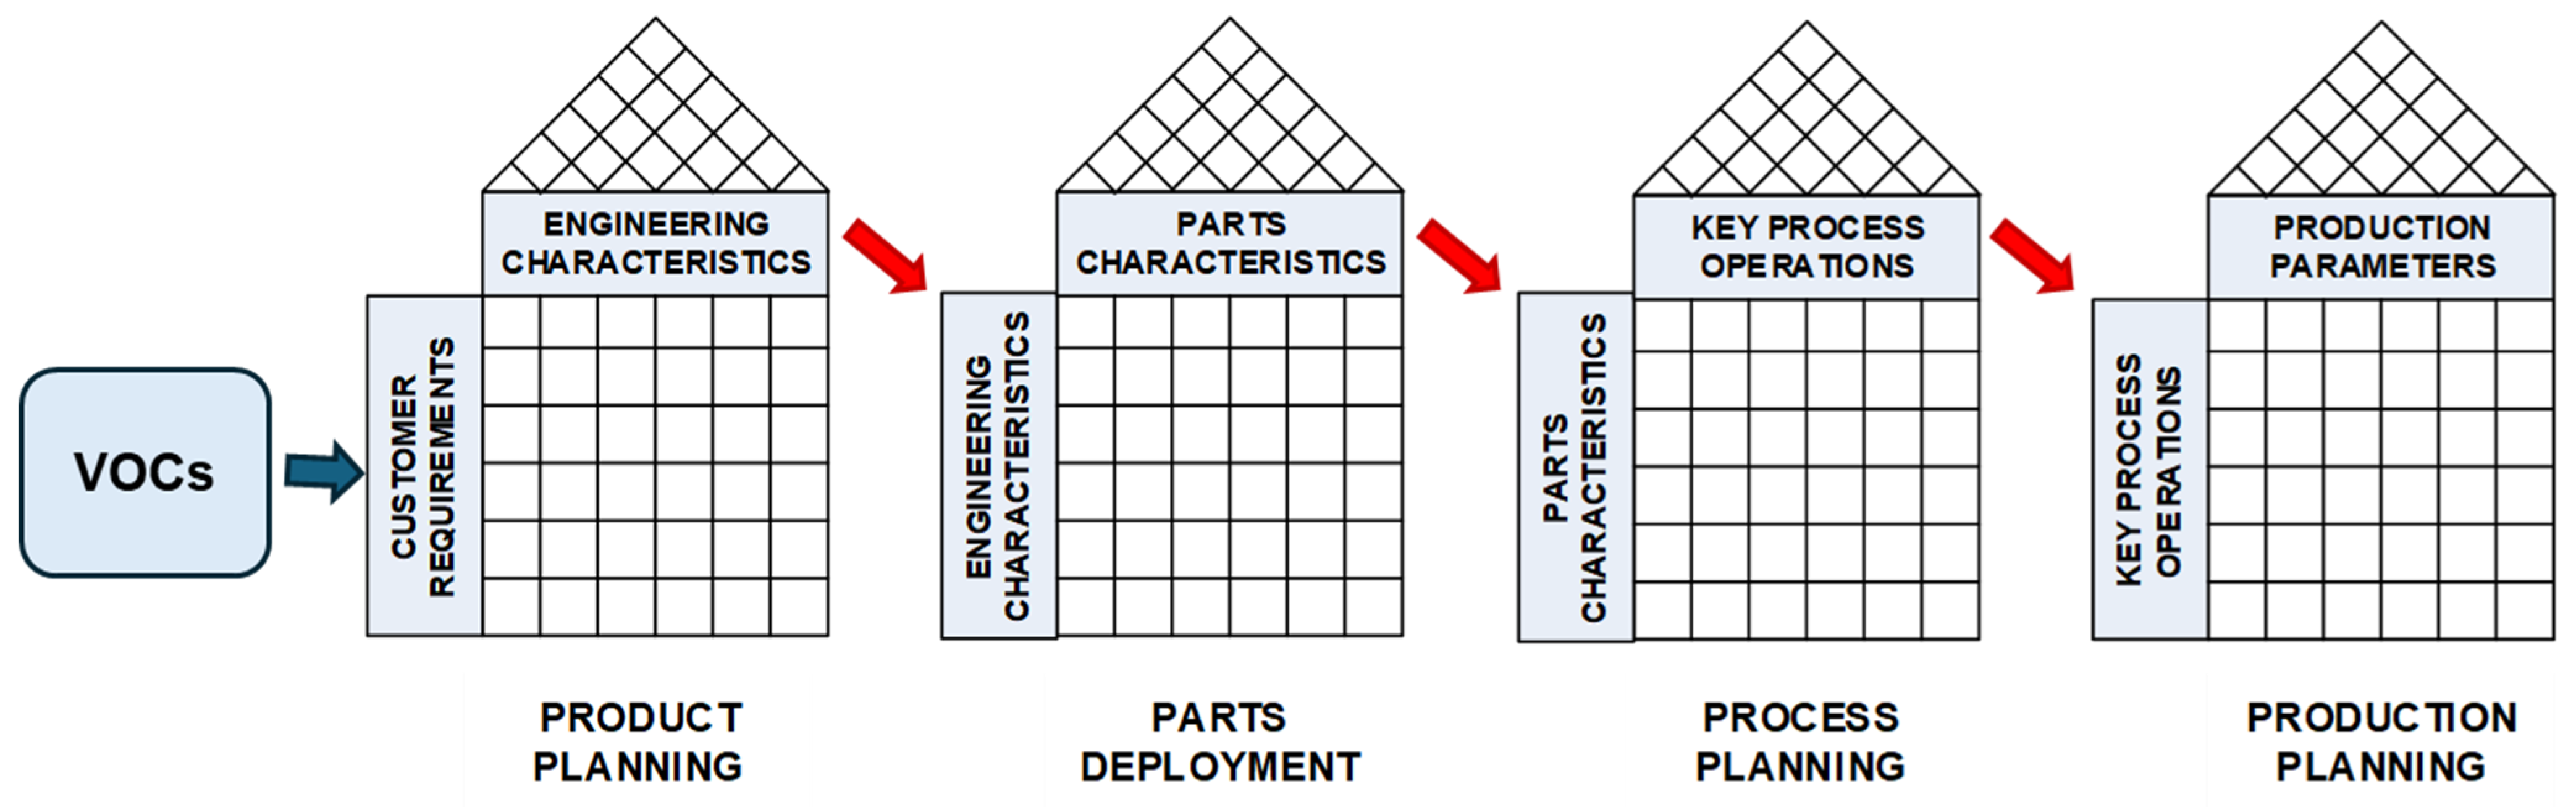
2.1. Quality Function Deployment for the Environment (QFDE)

The quality function deployment (QFD) method is a very diffused tool in engineering and managerial practices, and a large number of studies have investigated its use for the development of products and services in different sectors [41,42,43]. The core of the method is represented by a set of matrices that is called “House of Quality”, which in its traditional version allows engineers to combine in a systematic manner inputs (i.e., customer requirements (CRs)) and outputs (engineering characteristics (ECs)), providing at the same time the assessment of their mutual inferences. In other words, this embedded “cause–effect” mechanism ensures the elicitation of customer requirements to better address decision-making when developing products, services, or their combination [44]. Accordingly, the conventional method developed by Akao [45] consists of four phases, each one characterized by a different HoQ (Figure 1), which starting from the analysis of the Voice of Customers (VoCs) namely provides a set of features:
  • Engineering characteristics (ECs) from customer R=requirements (CRs) in the first phase (product planning);
  • Part Characteristics (PCs) from engineering characteristics (ECs) in the second phase (parts deployment);
  • Process Operations (POs) from Part Characteristics (PCs) in the third phase (process planning);
  • Production Requirements (PRs) from Process Operations (POs) in the fourth phase (production/quality control).
Based on this scheme, numerous variations have been proposed mainly focusing on the first phase [42,46], which allows for the translation of customers’ needs and expectations in engineering metrics, thus properly addressing the further steps of product/service development [47].
In particular, a number of studies can be found in the literature that investigated the use of QFD for the development of environmentally friendly solutions [44,48]. Most of them include environmental characteristics together with customer requirements in the HoQ, whose development allows engineers to elucidate and prioritize the Voice of Customers (VOCs) and Voices of the Environment (VOEs) for their transformation into engineering metrics (EMs) following the rules and paths of the conventional method [49,50,51,52]. A large part of these studies, as in most QFD practices, mainly focus on the first phase of the method (i.e., the HoQ), adapting it to the specific research context, such as the Environmentally Conscious Quality Function Deployment (ECQFD) approach proposed by Vinodh and Rathod [53] or the Eco-QFD developed by Kuo et al. [54] and the Green-QFD used by Zhang et al. [55], Bovea and Wang [56], and Mehta and Wang [57] among others.
In such a context, Masui et al. [32] proposed the quality function deployment for the environment (QFDE) method, which uses the HoQ mechanism to evaluate different design options through a four-phase approach. In practice, such an approach differs from the above studies considering the methodical point of view since it does not focus on the development of a product (or a service) following the product (service) development process as in the case of the conventional QFD method, but it helps designers in making decisions when different options have to be evaluated. In other words, the first two phases of the method are similar to the conventional approach, as follows:
Phase I: the conventional VOCs and environmental VOCs (also called VOEs) are translated into engineering metrics (EMs);
Phase II: EMs are translated into product components (PCs).
Conversely, the third phase uses the same scheme as Phase II, and different matrices are developed depending on the number of different options selected by the design team. Each option consists of a product component that is worth investigating from both the technical and environmental points of view.
The evaluation is carried out by computing only the most relevant scores of this component (or a combination of them) in relation to the related EMs, while other scores in the matrix are considered null. This allows engineers to obtain the improvement rate values of the engineering metrics for each option.
To better highlight the differences between QFDE and conventional QFD, in Figure 2, a qualitative scheme of the QFDE functioning is illustrated considering three different options: solution (a), solution (b), and solution (c). For each phase of the method, inputs and outputs are also reported.
Then, in the fourth phase, the Phase I matrix is used, and the improvement rate values of the engineering metrics for each option are combined with the VOC improvement rate values to obtain a final score that is called the “total improvement effect” (TIE). Hence, for each design option, a total improvement effect is calculated, and these values are used by the design team to decide which is the best solution.
Based on this, one might note that although in the literature, several authors have used the term QFDE to indicate environmental QFD-based applications, most of them follow the conventional QFD approach, which largely differs from the original idea behind the QFDE by Masui et al. [32] and improperly use the term QFDE. To avoid any confusion, we specify that in this study, the original QFDE by Masui et al. [32] is used.

2.2. Analytic Hierarchy Process (AHP)

The AHP method was developed by Saaty [33] and is a decision-making tool that uses pairwise comparisons and expert judgments to provide a priority scale of a certain list of characteristics, using absolute judgments to determine the dominance of one element over another. Such a tool is widely used to augment the effectiveness of the HoQ allowing for a clearer prioritization of customer requirements [58,59]. The method consists of four main phases [34]:
  • The definition of the goal of the analysis (i.e., the decision-making problem);
  • The definition of the hierarchy of the elements to be evaluated;
  • The construction of a set of pairwise comparison matrices;
  • The computation of the final priorities.
We used the AHP to better elicit the customer weights in the first phase of QFDE. For this purpose, a pairwise comparison approach was adopted where each VOC was compared to another via a 1 (equally important)-to-9 (extremely important) scale [33].

2.3. Strengths, Weaknesses, Opportunities, and Threats (SWOT) Analysis

As remarked by Phadermrod et al. [60], SWOT analysis is a widespread method used to evaluate the company’s resources and environment in four regions related to a specific issue: strengths (S), weaknesses (W), opportunities (O), and threats (T). In detail, strengths and weaknesses are internal factors, while opportunities and threats are external factors that enable or hinder a specific issue. Thus, external analysis can help managers evaluate market opportunities and threats by examining competitors’ resources, the industry environment, and the general environment [61]. This managerial tool has been used to support the QFD’s application providing clearer input data [62,63] or to maximize the mutual influence of engineering metrics in the correlation matrix [64]. In this study, we use the SWOT analysis to evaluate the QFDE output. More precisely, the strengths, weaknesses, opportunities, and threats of the selected option derived from the QFDE analysis are evaluated by a group of experts. The internal strengths and weaknesses of the company’s offer (i.e., both the product and the related services) are examined, while the external opportunities and threats are identified.

2.4. Threats, Opportunities, Weaknesses, and Strengths (TOWS) Matrix

To better translate general considerations emerging from SWOT analysis into effective strategies that consider marketing opportunities based on the company’s management and operation capabilities, the TOWS matrix is used [35]. TOWS analysis allows managers to combine (1) internal strengths (S) with external opportunities (O) and threats (T), as well as (2) internal weaknesses (W) with external opportunities (O) and threats (T). Based on these logical combinations, the TOWS matrix can be implemented, which identifies four strategic groups:
(a)
Strengths–opportunities (SO), which follows a “maxi-maxi” approach including strategies that use strengths to maximize opportunities;
(b)
Strengths–threats (ST) that is based on a “maxi-mini” approach, i.e., strengths are used to minimize threats;
(c)
Weaknesses–opportunities (WO), which follows a “mini-maxi” approach where the minimization of weaknesses is used to maximize opportunities;
(d)
Weaknesses–threats (WT), which fosters a “mini-mini” approach aimed at minimizing weaknesses and avoiding threats.

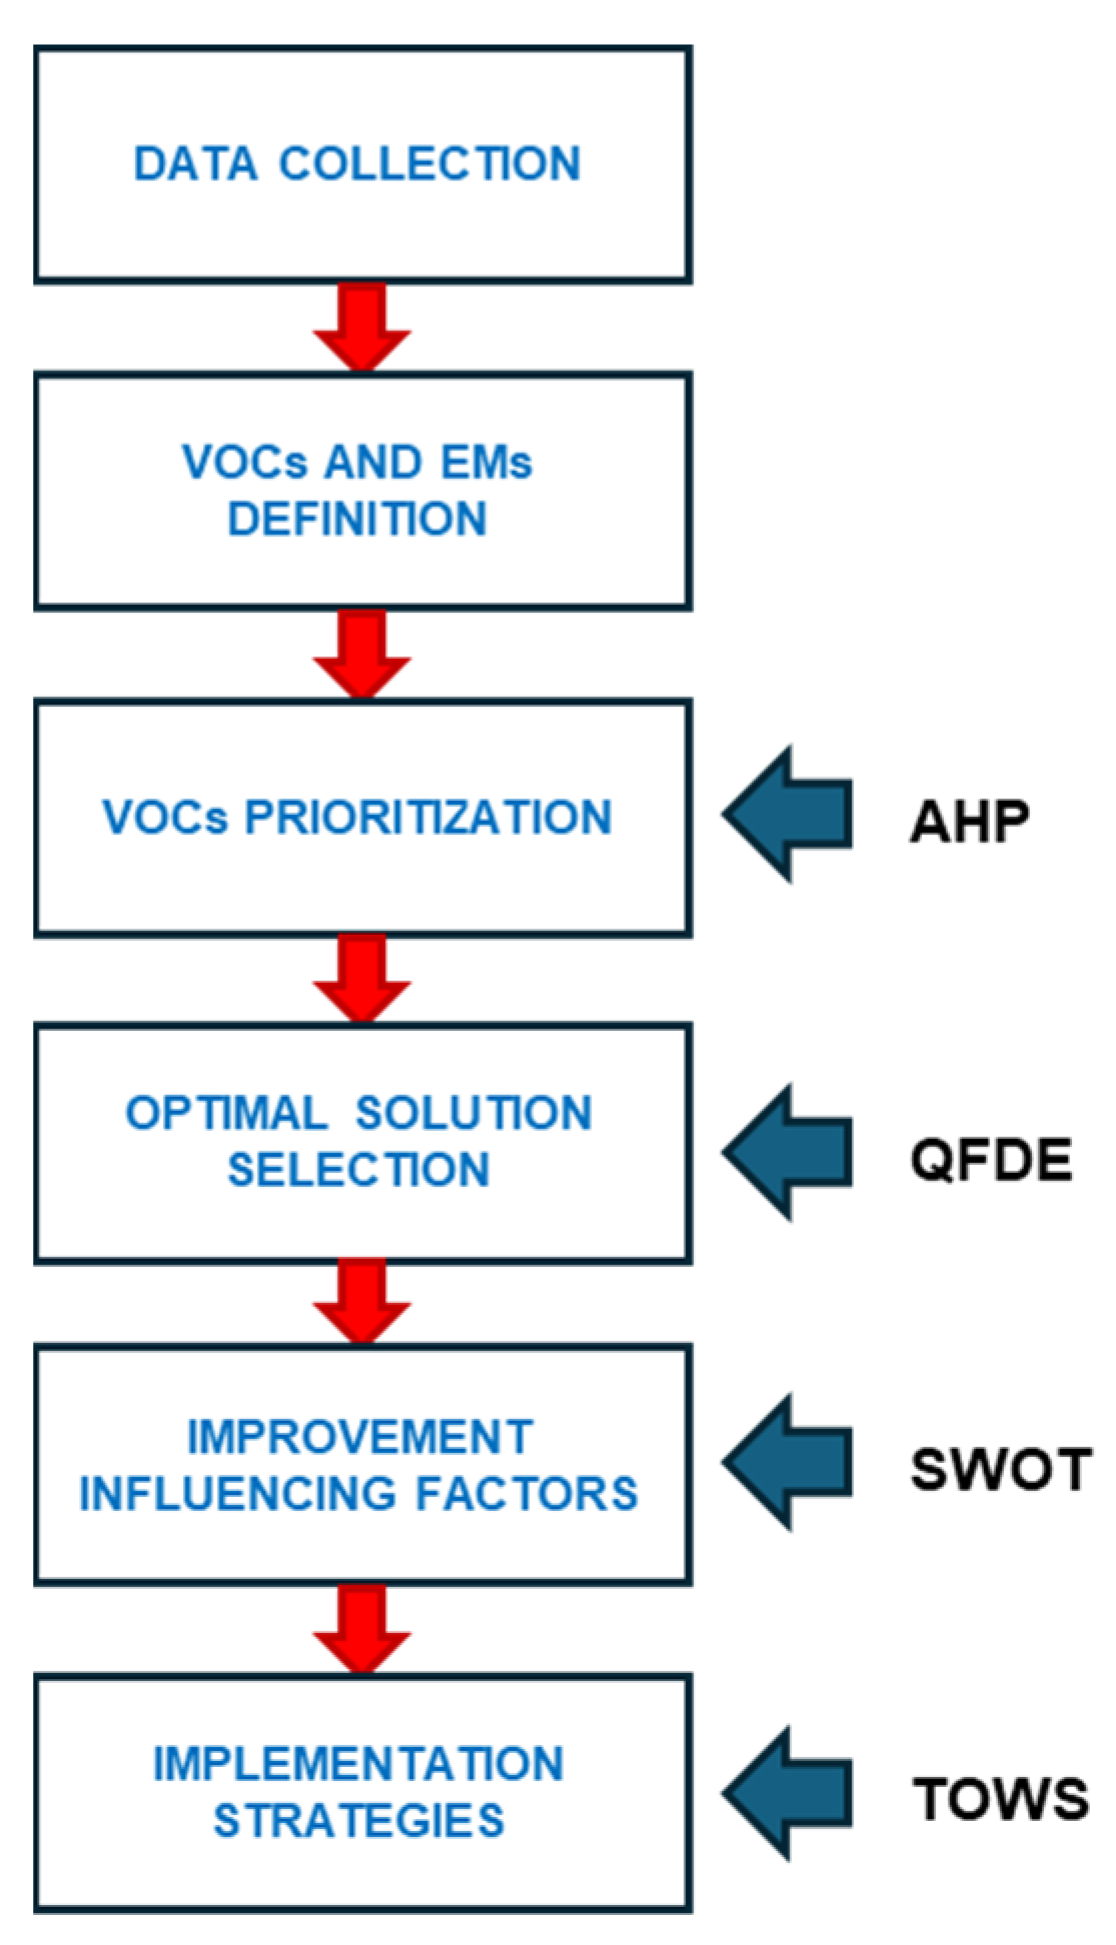
2.5. Research Approach

In Figure 3, a scheme of our research approach is illustrated, which consists of five main steps:
  • The definition of VOCs and EMs: together with a team of experts belonging both to the marketing and technical departments of the company, a set of VOCs and engineering metrics was defined.
  • The application of the AHP to prioritize VOCs through a survey among customers.
  • The implementation of the QFDE’s four phases based on the AHP output.
  • The SWOT analysis of the QFDE output.
  • The implementation of the TOWS matrix to address the company’s marketing strategies.
For the development of the current research, MS Office 365 tools [65] were used.

3. The Results of the Research

3.1. Case Study Context

In recent years, urbanization and environmental awareness have led to a shift in energy challenges, with PV energy emerging as a key solution [66]. Actually, considering all renewable energy sources, solar energy is one of the most abundant and holds the greatest potential as a global energy source [67]. Cities often have high energy consumption, contributing to greenhouse gas emissions and environmental issues [68]. Hence, the integration of photovoltaic energy in urban contexts is not only an adaptation to growing energy needs but also a strategic response to transitioning towards sustainable and low-carbon energy sources [69]. In addition, compared to other energy sources, solar photovoltaic systems integrated with urban buildings offer several benefits, such as the following: reduction in losses due to the transmission and distribution of energy, reduction in investment in transmission and distribution lines, reduced idle generation capacity, short-term installation capabilities, etc. [70]. Moreover, many countries adopted governmental subsidies to reduce citizens’ investment costs and thus facilitate the adoption of solar technology [71].
As underlined by El-Bayeh et al. [72], choosing the optimal improvement strategy for launching a PV solution that meets customer expectations, achieves maximum efficiency, and ensures the shortest payback periods is essential for PV system providers. Several studies have proposed selection criteria to find the best PV solution focusing on the choice of solar panels in the photovoltaic system’s design [73,74,75].
Bączkiewicz et al. [76] analyzed the use of multi-criteria decision-making tools to select PV manufacturers. In this context, besides technical parameters, customer expectations must also be considered, which include utility and aesthetic aspects [77].
Differently from the above studies, the current analysis is aimed at finding the best improvement option for a PV system to be launched on the market by a company that operates in the context of intermediary business models. In other words, the company is an energy operator that provides private individuals with PV solutions, which include installation, maintenance, and take-back activities. The customer benefits from the autonomous production of energy for domestic use and from selling to the provider the portion of excess energy that is not used.

3.2. Data Collection and VOCs-EMs’ Definition

The first step of the analysis consisted of gathering information concerning customer expectations and market analysis. For this purpose, the company’s set of offerings was analyzed as well as data provided by the customer care department to establish customers’ preferences and expectations. Together with the company’s experts, a sample of 40 customers was interviewed concerning their expectations and needs. The sample was selected randomly among customers who contacted the company in the first 4 months of this year: to be more precise, we contacted 54 people, and 40 agreed to answer our questions. The selected individuals are customers living in an urban or suburban context who contacted the company as they are willing to purchase a PV system to be installed in their house/apartment. More in detail, we contacted them and asked them to list the main features they expect from the PV system’s offering. The responses were elaborated together with the group of experts to define the conventional VOCs. Regarding the environmental VOCs, together with the group of experts, we provided these customers with a list of potential green requirements from which to choose the most relevant ones (in line with Masui et al. [32]). In Table 1, both conventional and environmental VOCs are reported. It must be noted that due to a non-disclosure agreement (NDA) with the company, additional information on the sample interviewed cannot be provided.
In a similar manner, engineering metrics (EMs) were also defined, distinguishing them into conventional and environmental EMs (Table 2).

3.3. Prioritization of VOCs

The next step consisted of the application of the AHP method to prioritize VOCs based on data collected through a questionnaire, which was administered to the same sample of customers to carry out the pairwise comparison. In the questionnaire, the comparison between VOCs was made using a 1-to-9 scale, where 1 indicates equal importance and 9 represents the extreme importance of one VOC over another [33]. In Figure 4, the results of this analysis are shown by reporting the values of the final weights of the VOCs and the consistency assessment values. It must be noted that the consistency ratio (CR) should be no higher than 0.1 [78].
These results (Figure 5) bring to light that the most relevant VOC for customers is the profit (VOC4), i.e., the possibility of saving money by autonomously producing energy. Then, the system efficiency (VOC5) was also a very relevant aspect, followed by the system reliability (VOC2). Conversely, the PV system’s dimensions and end-of-life (EoL) management were considered the least important aspects.

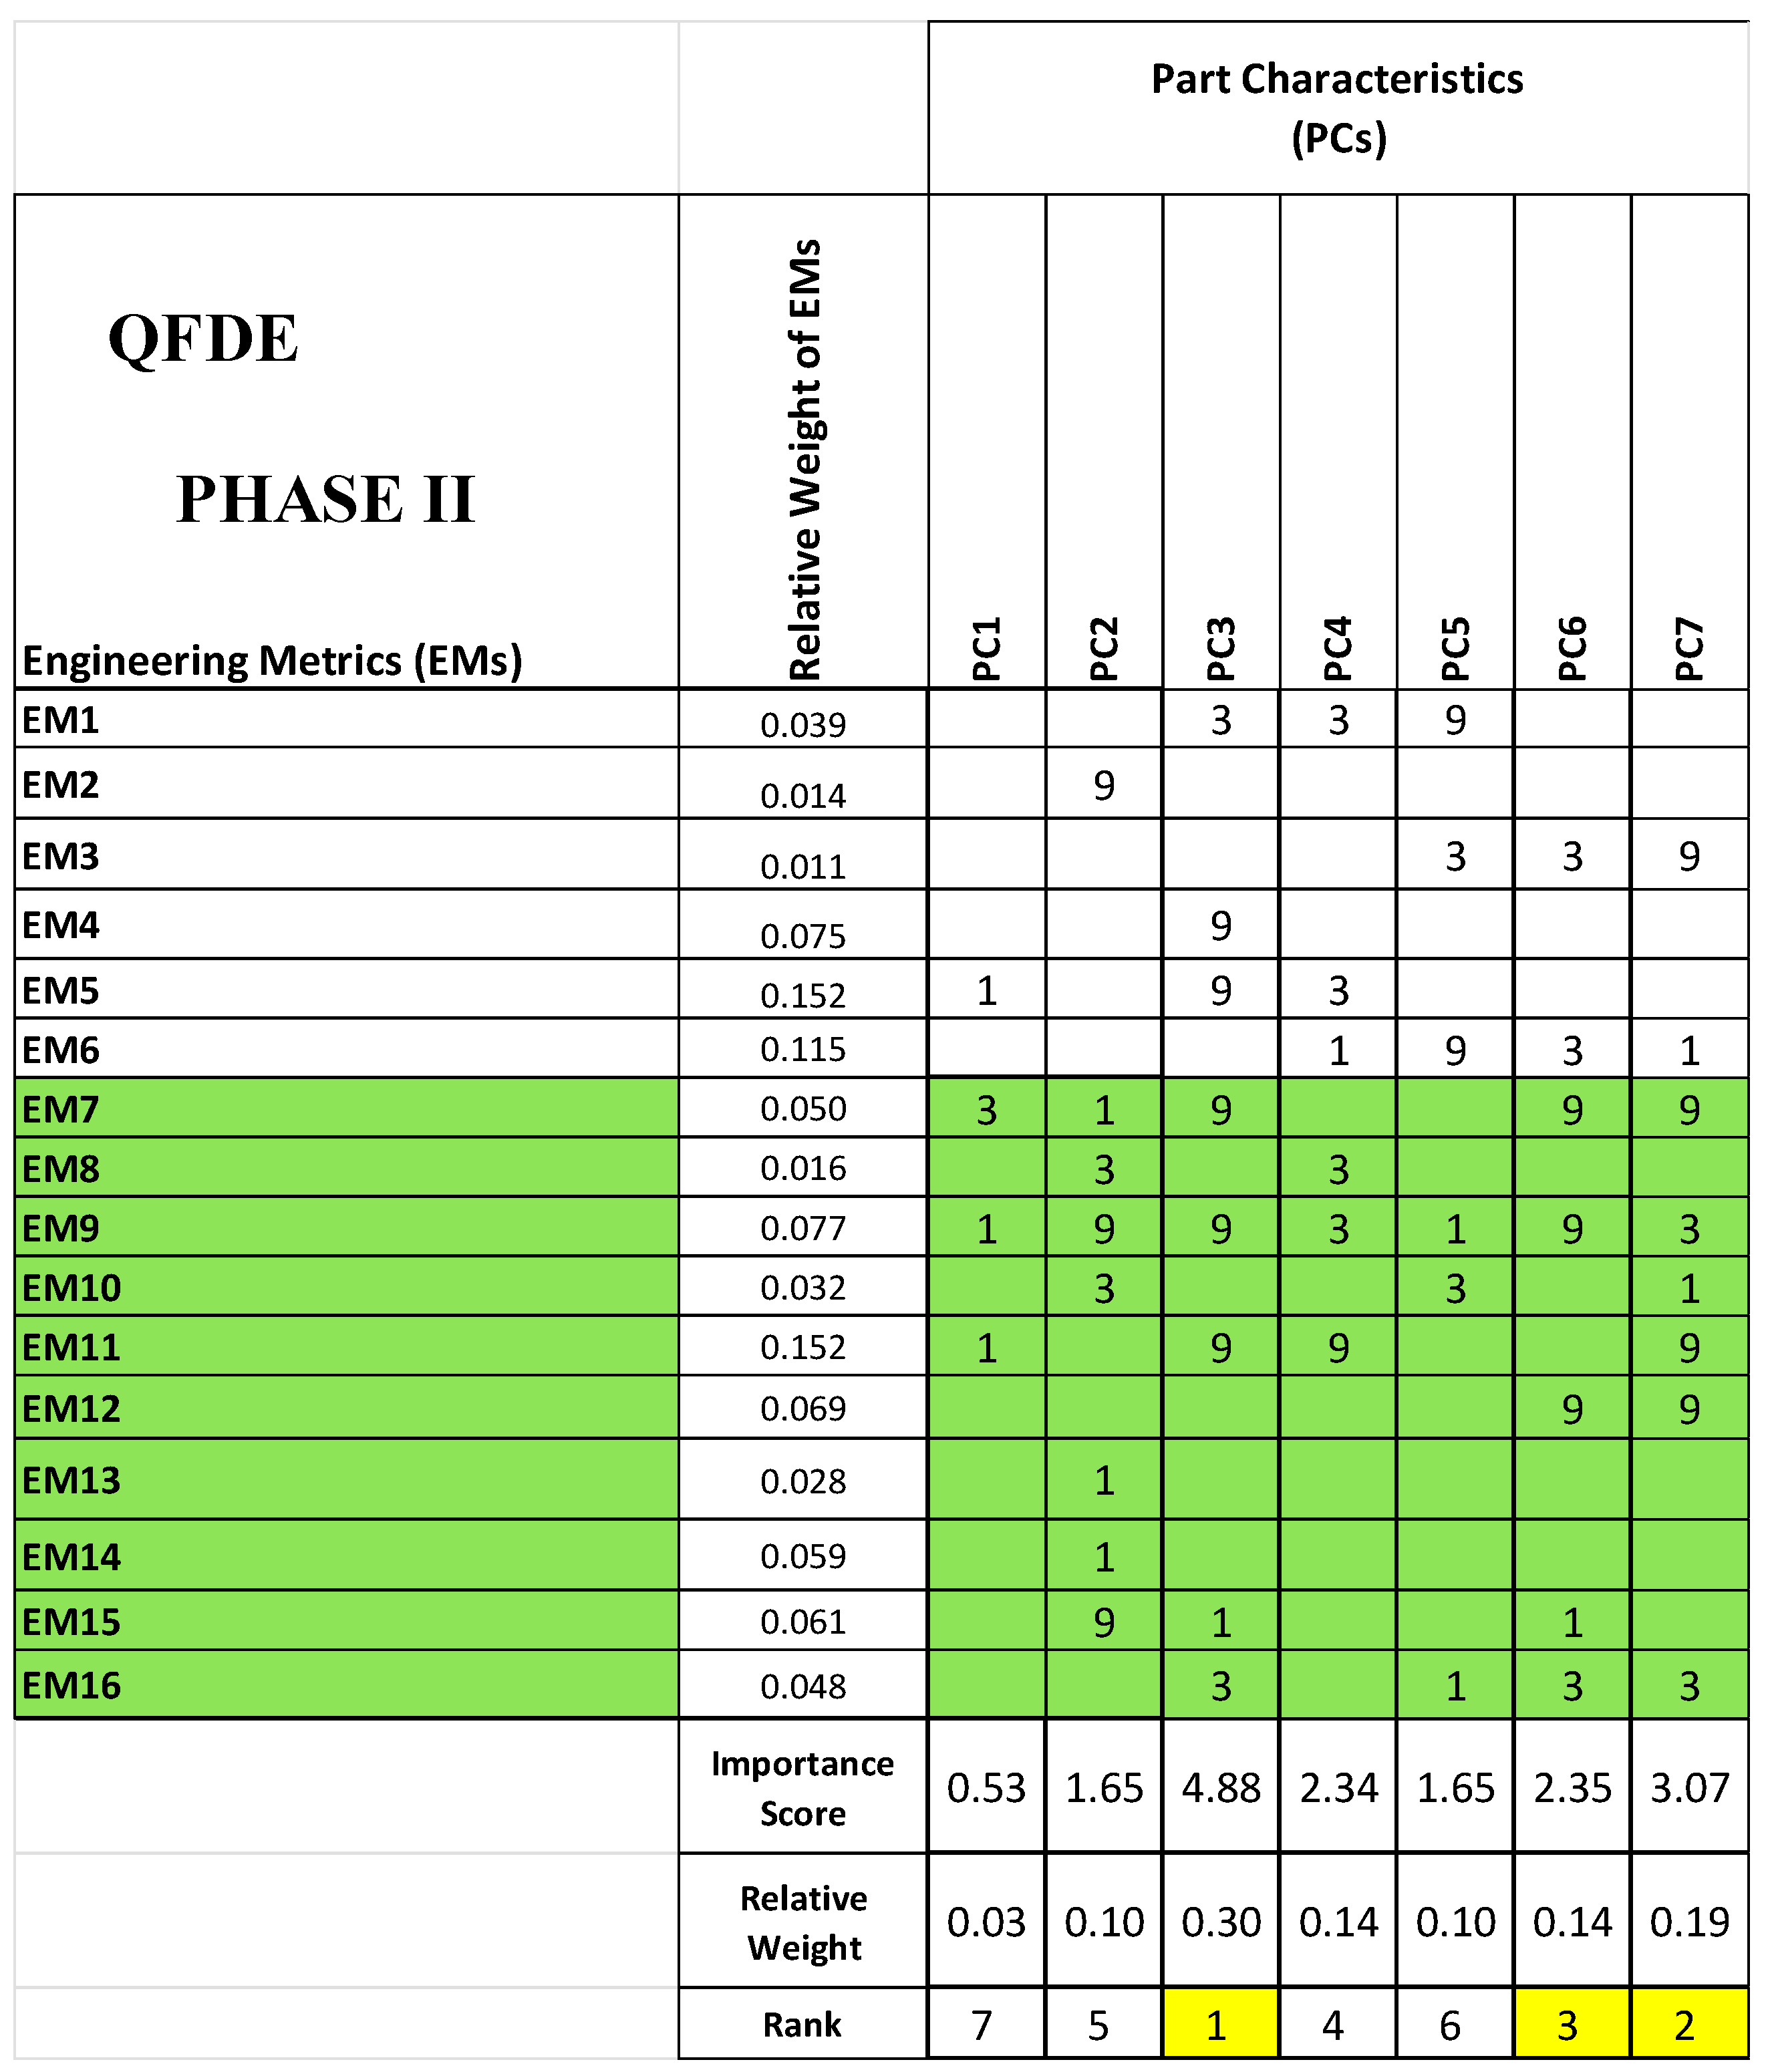
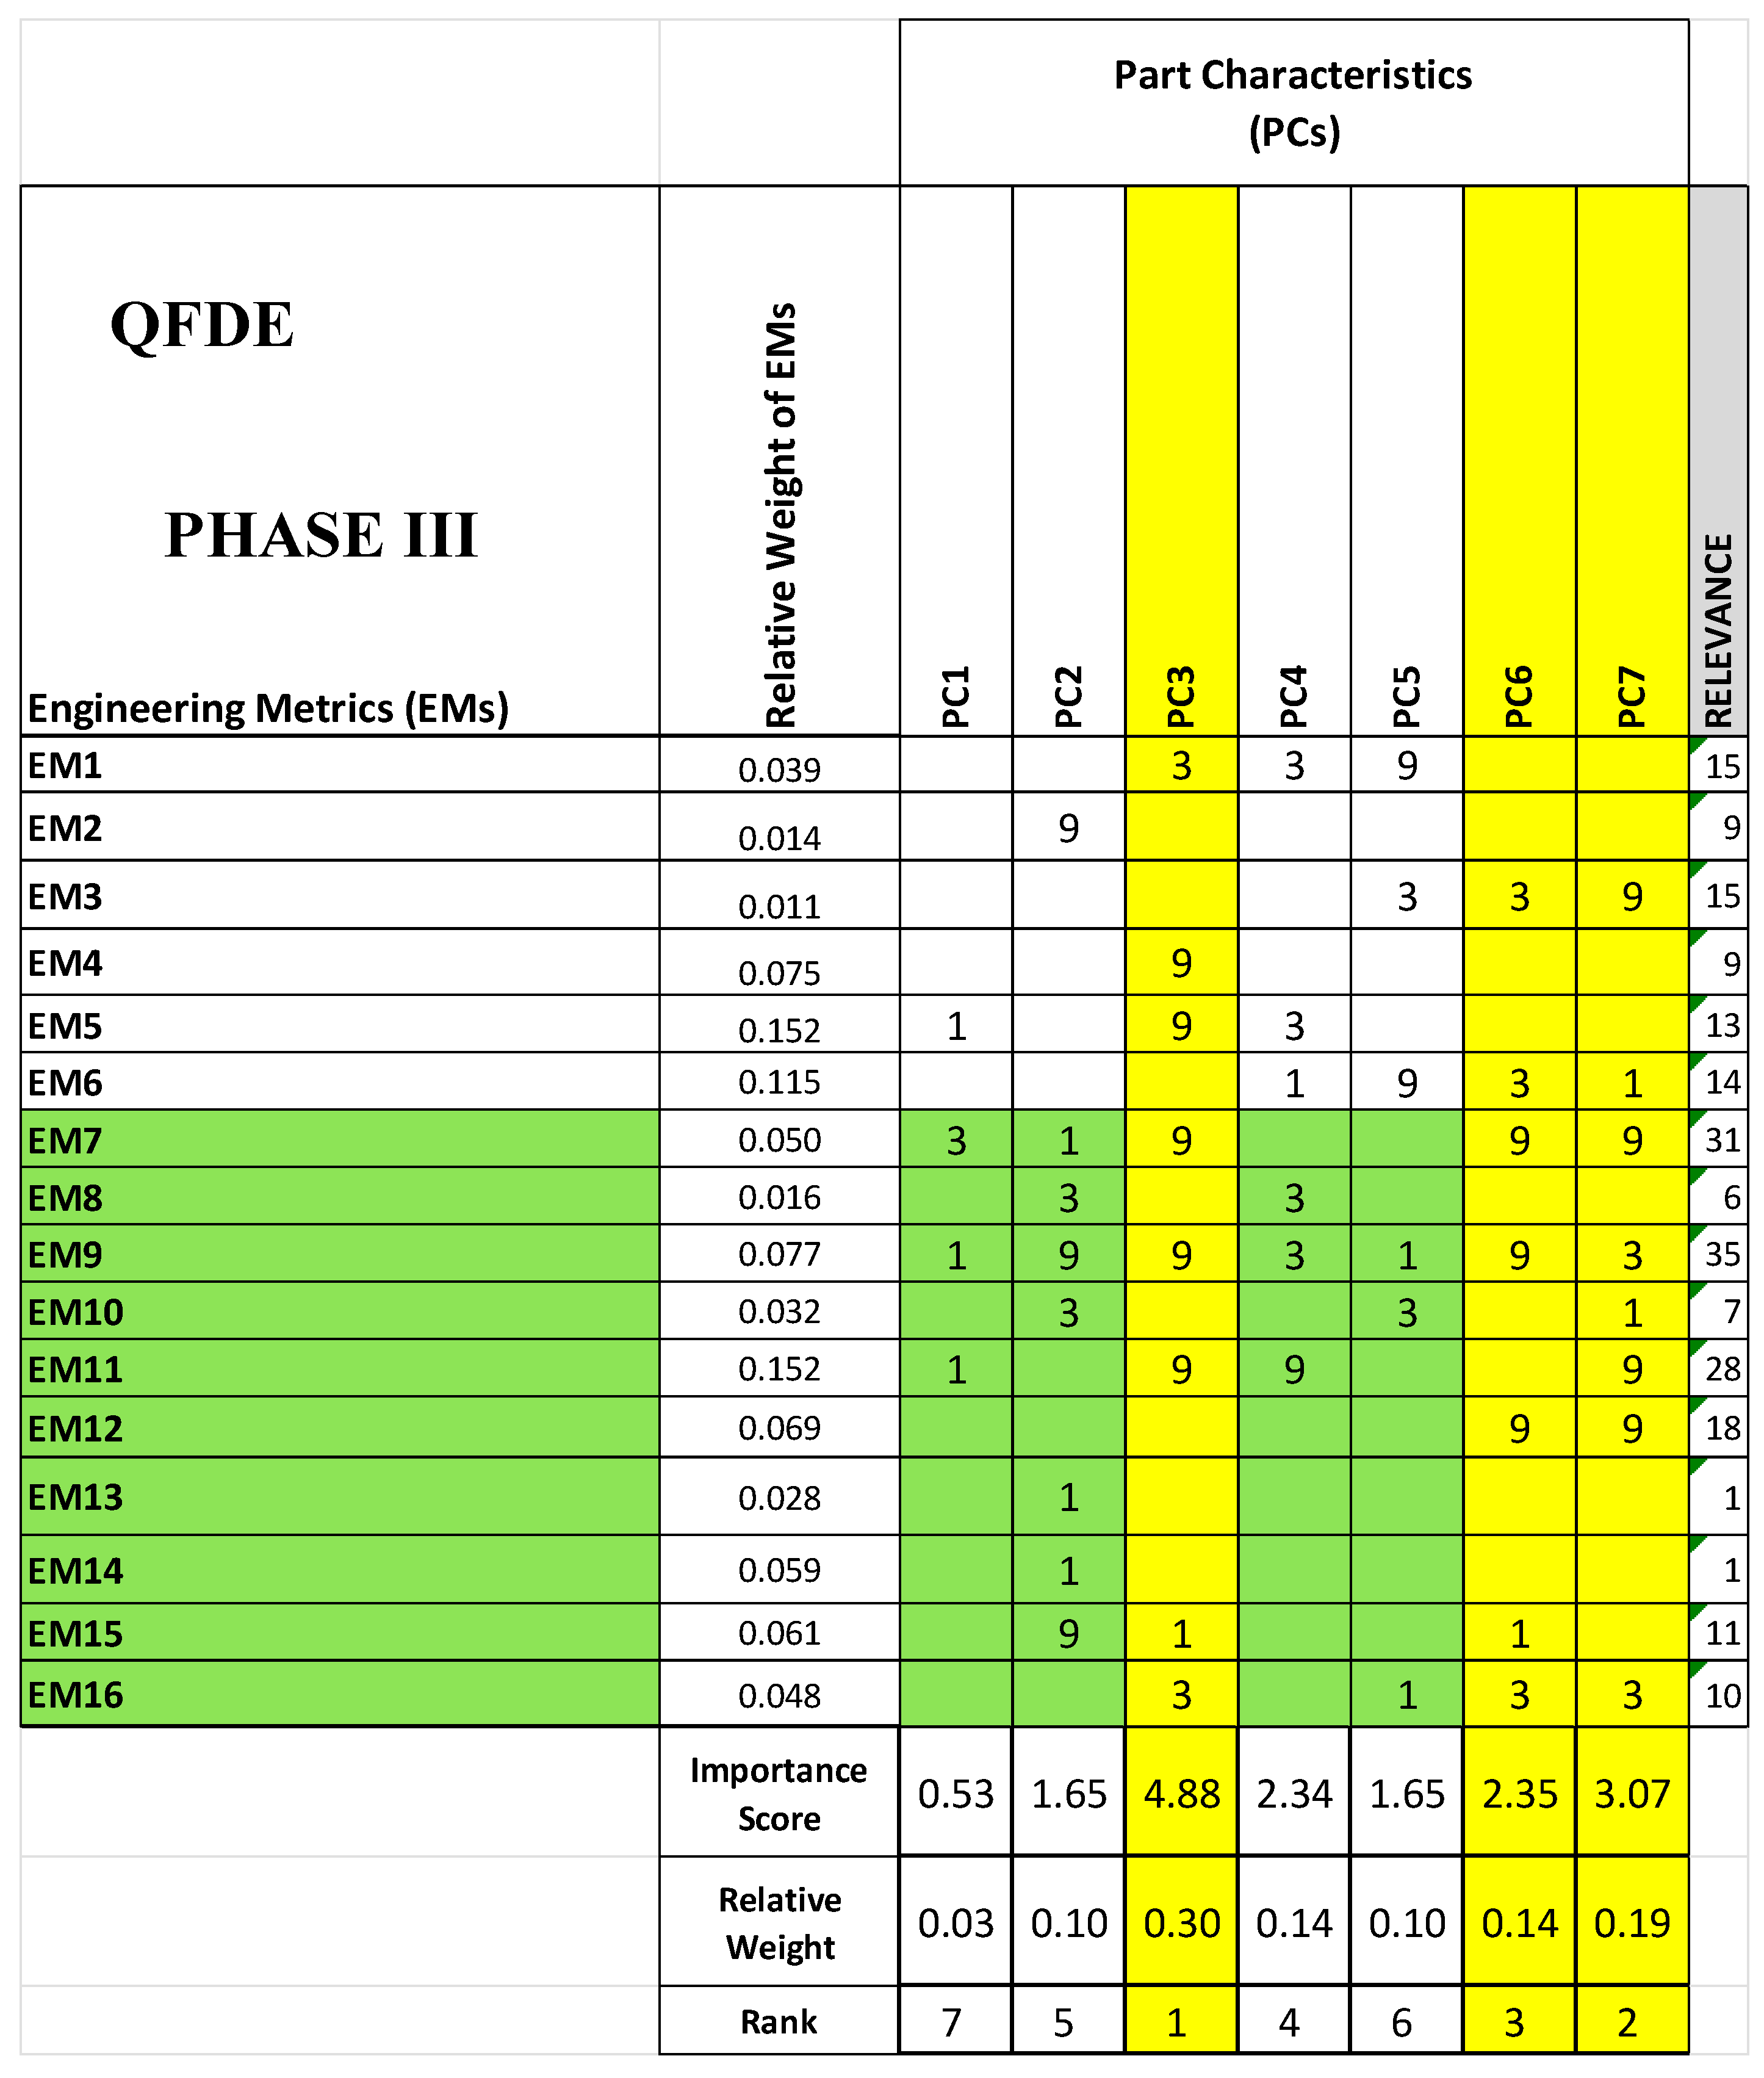
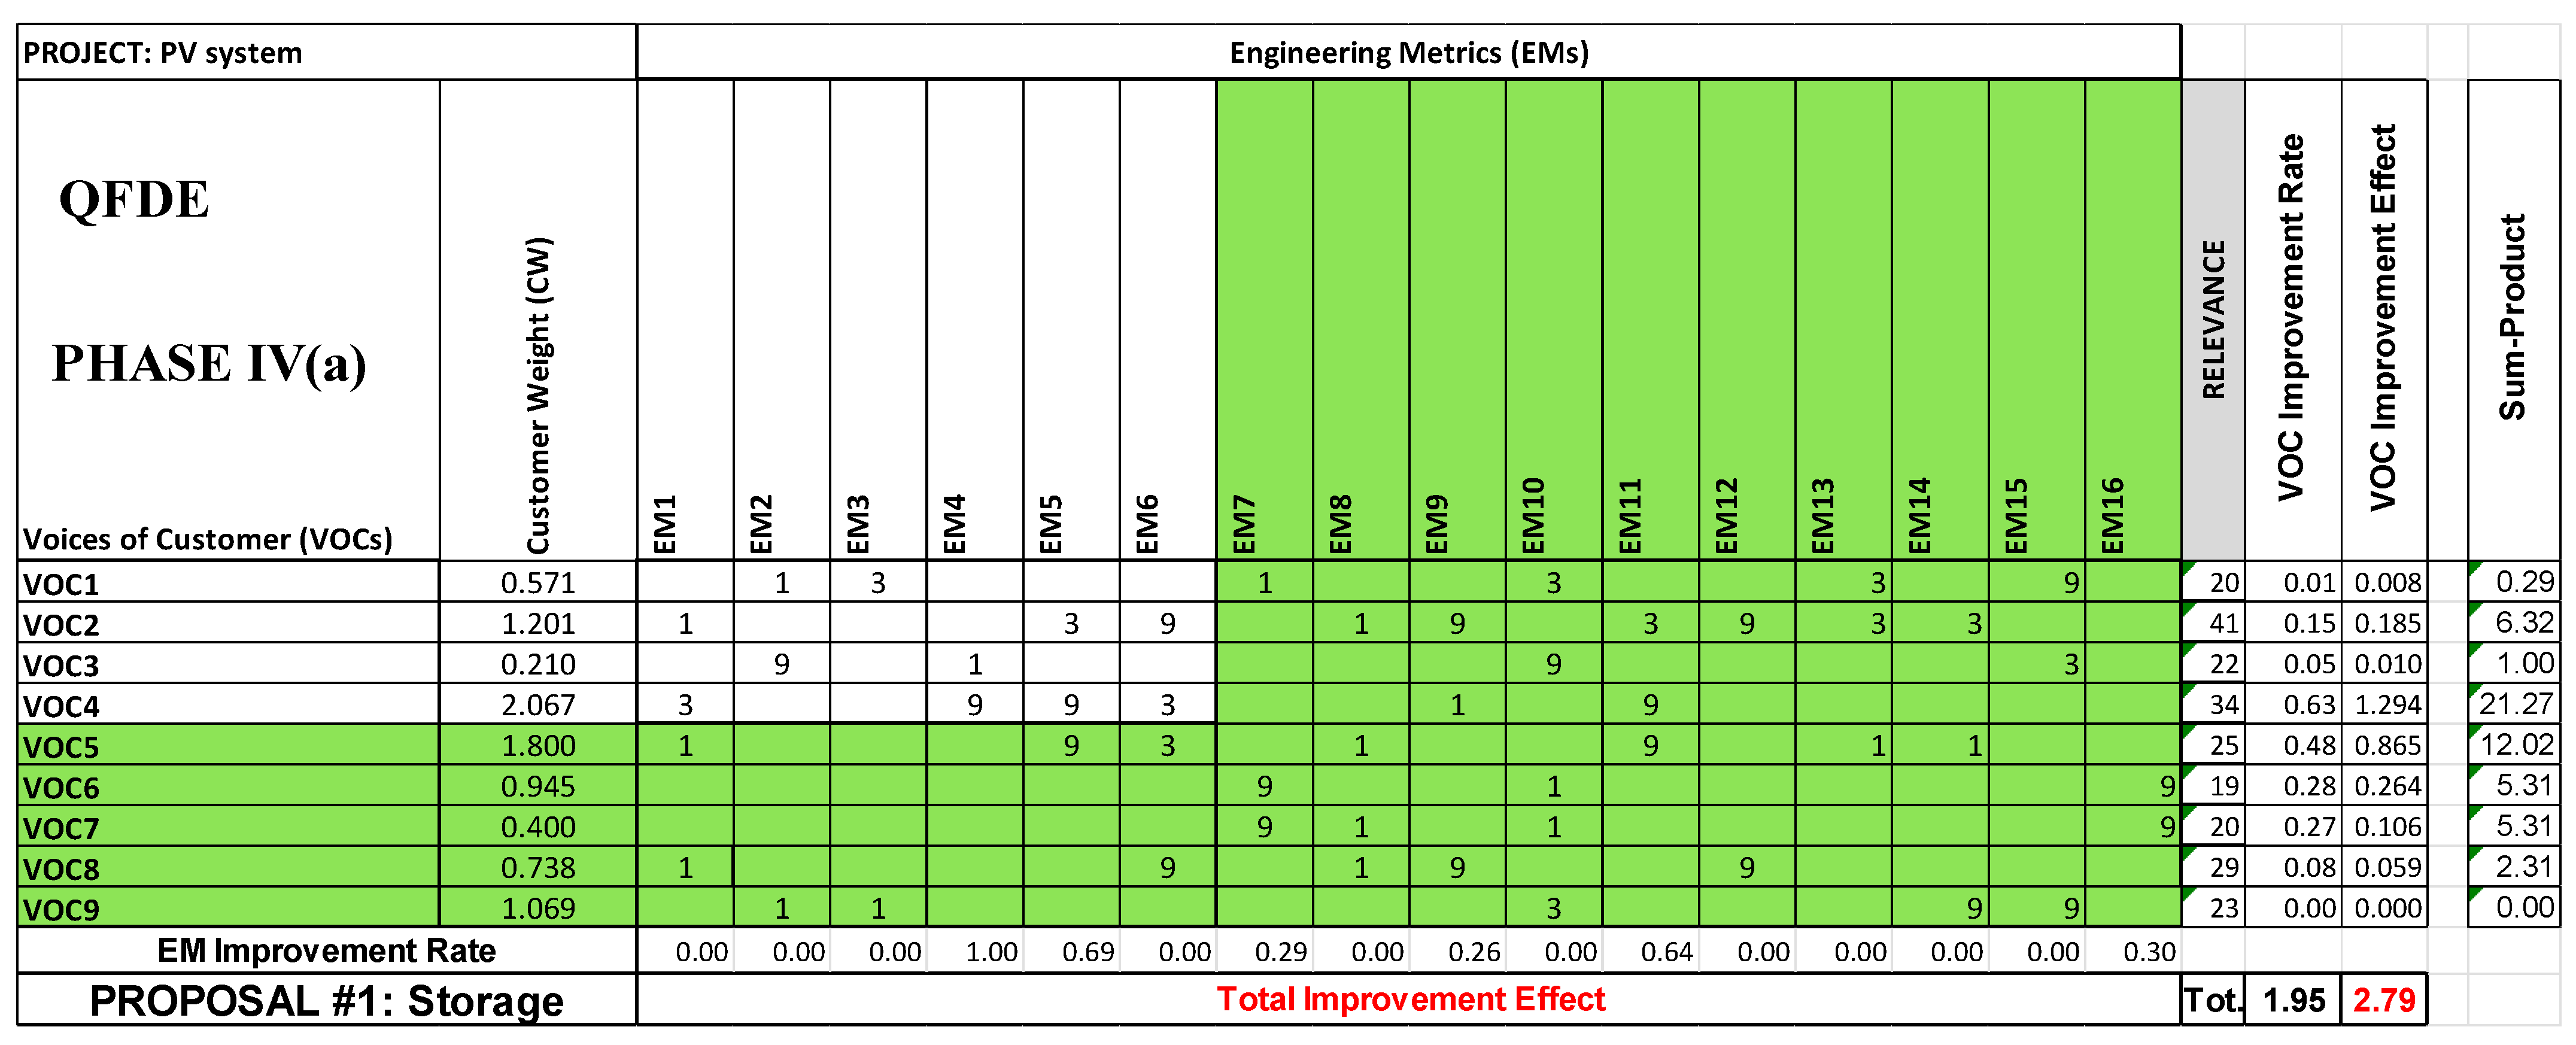
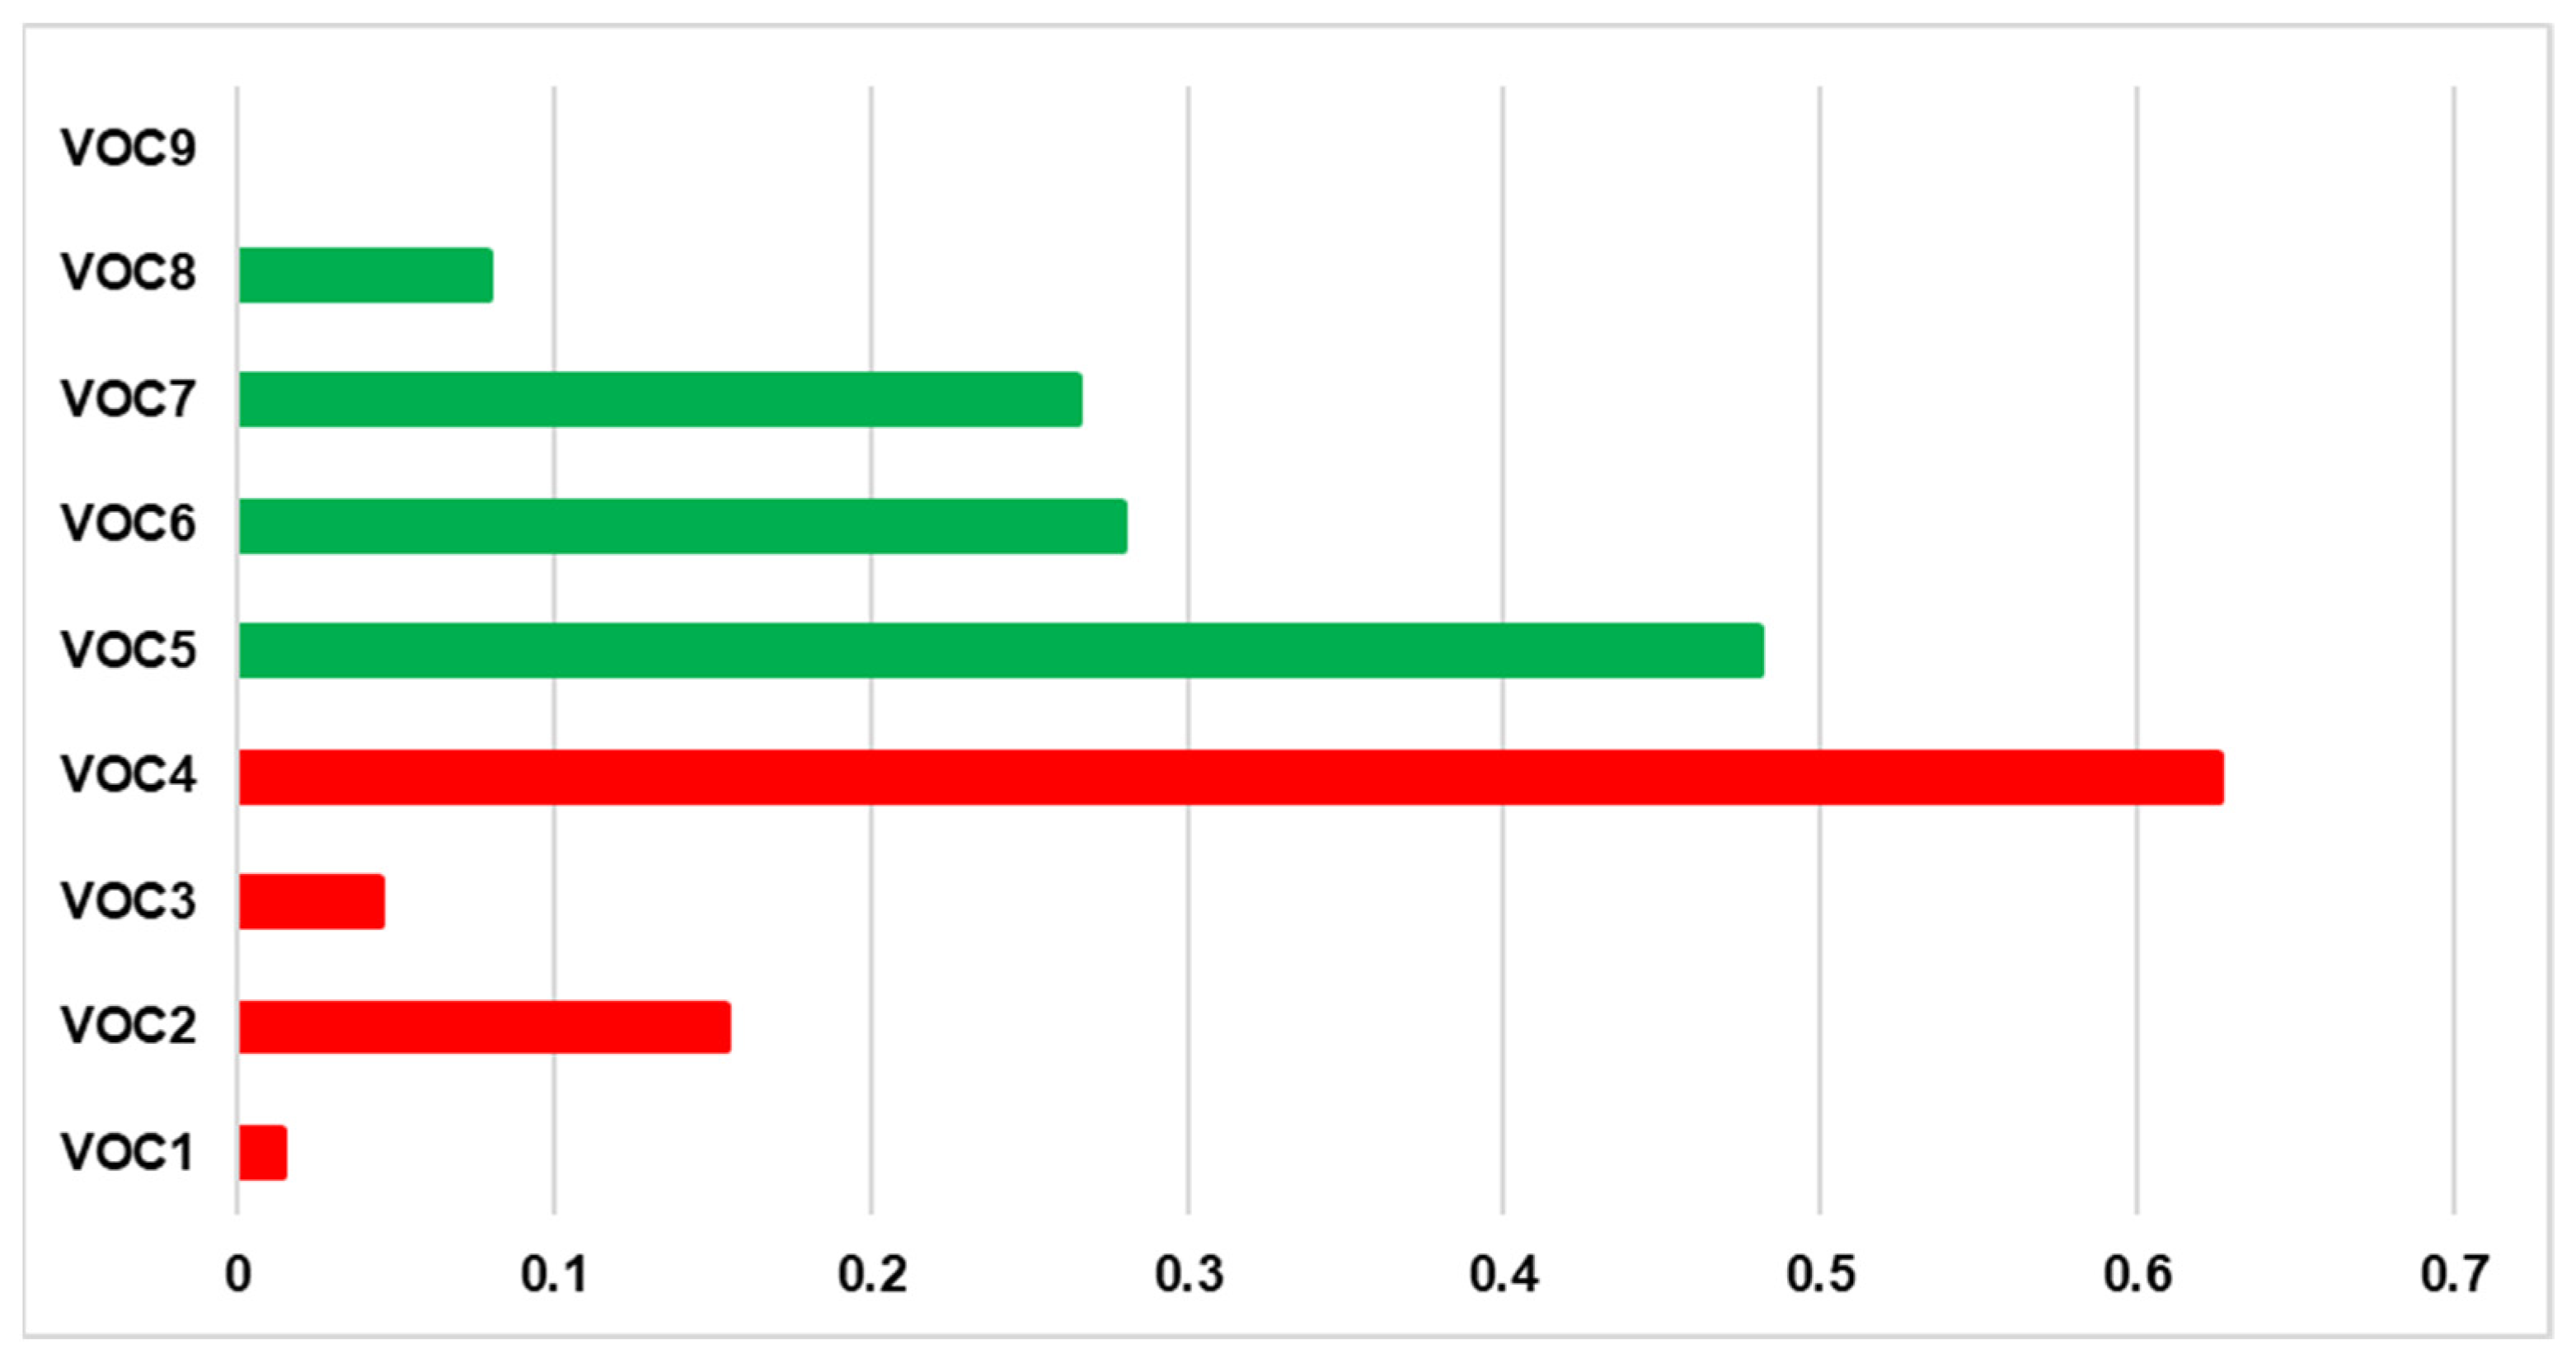
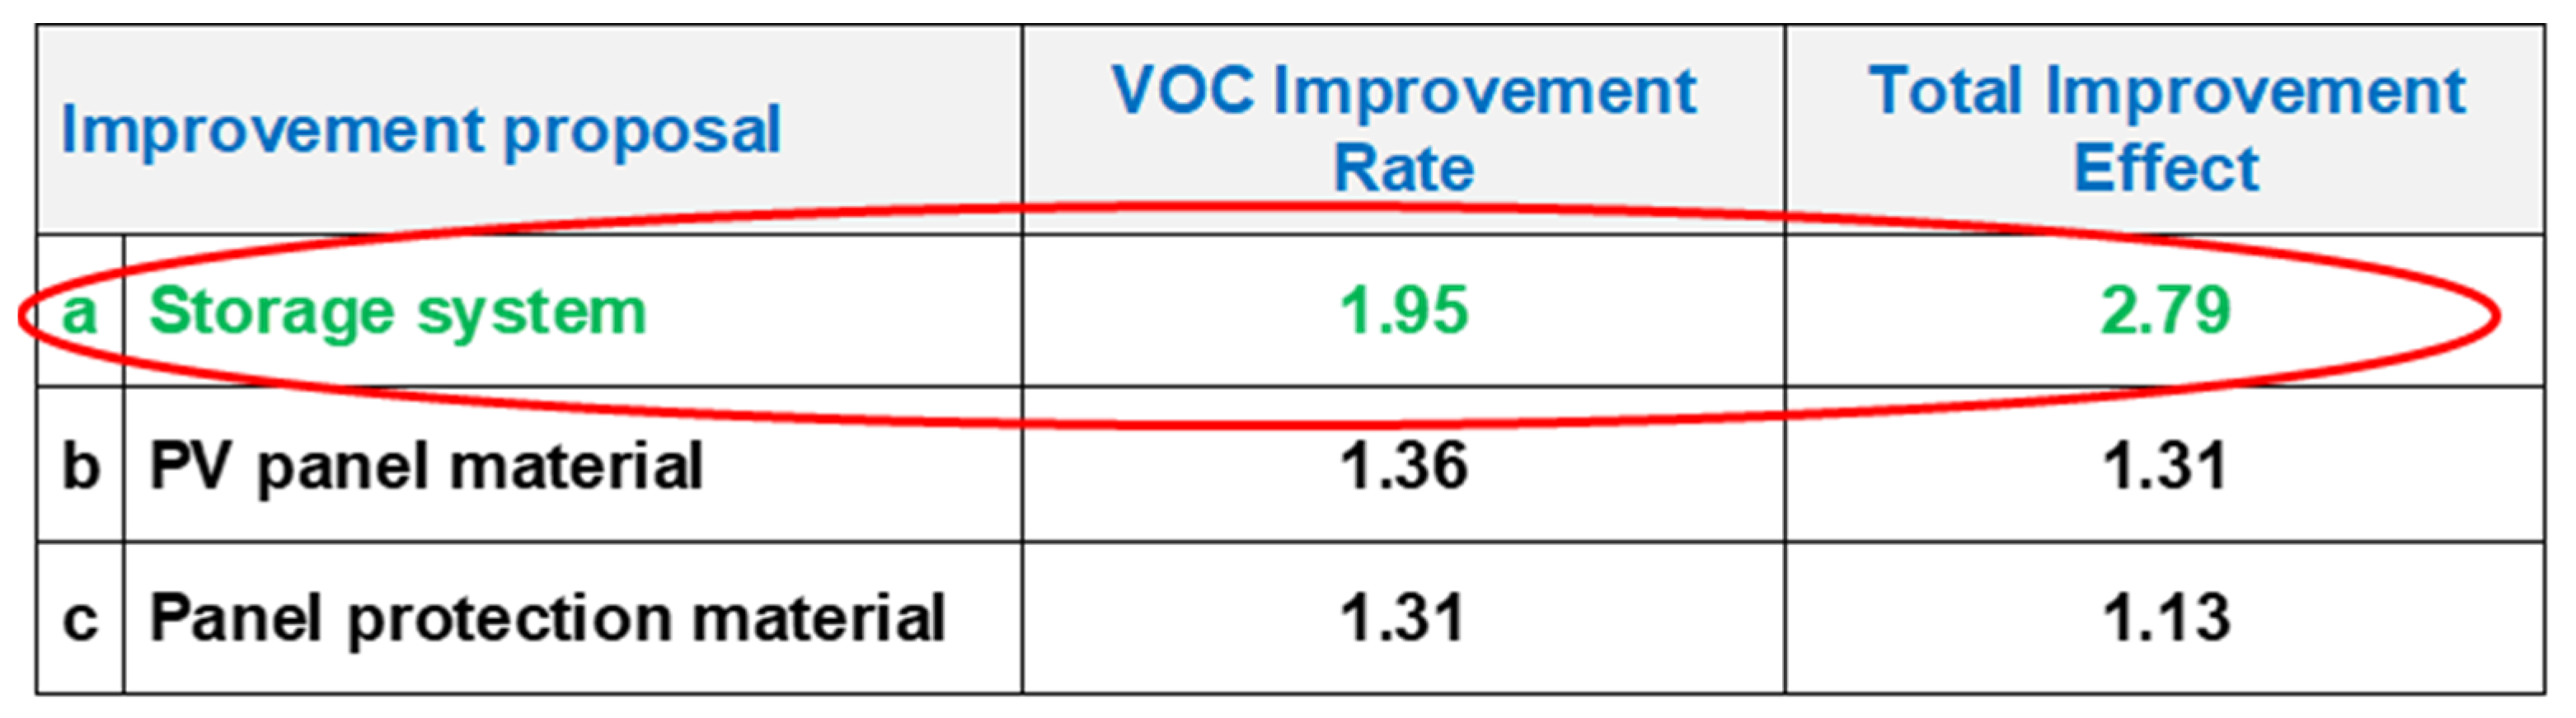
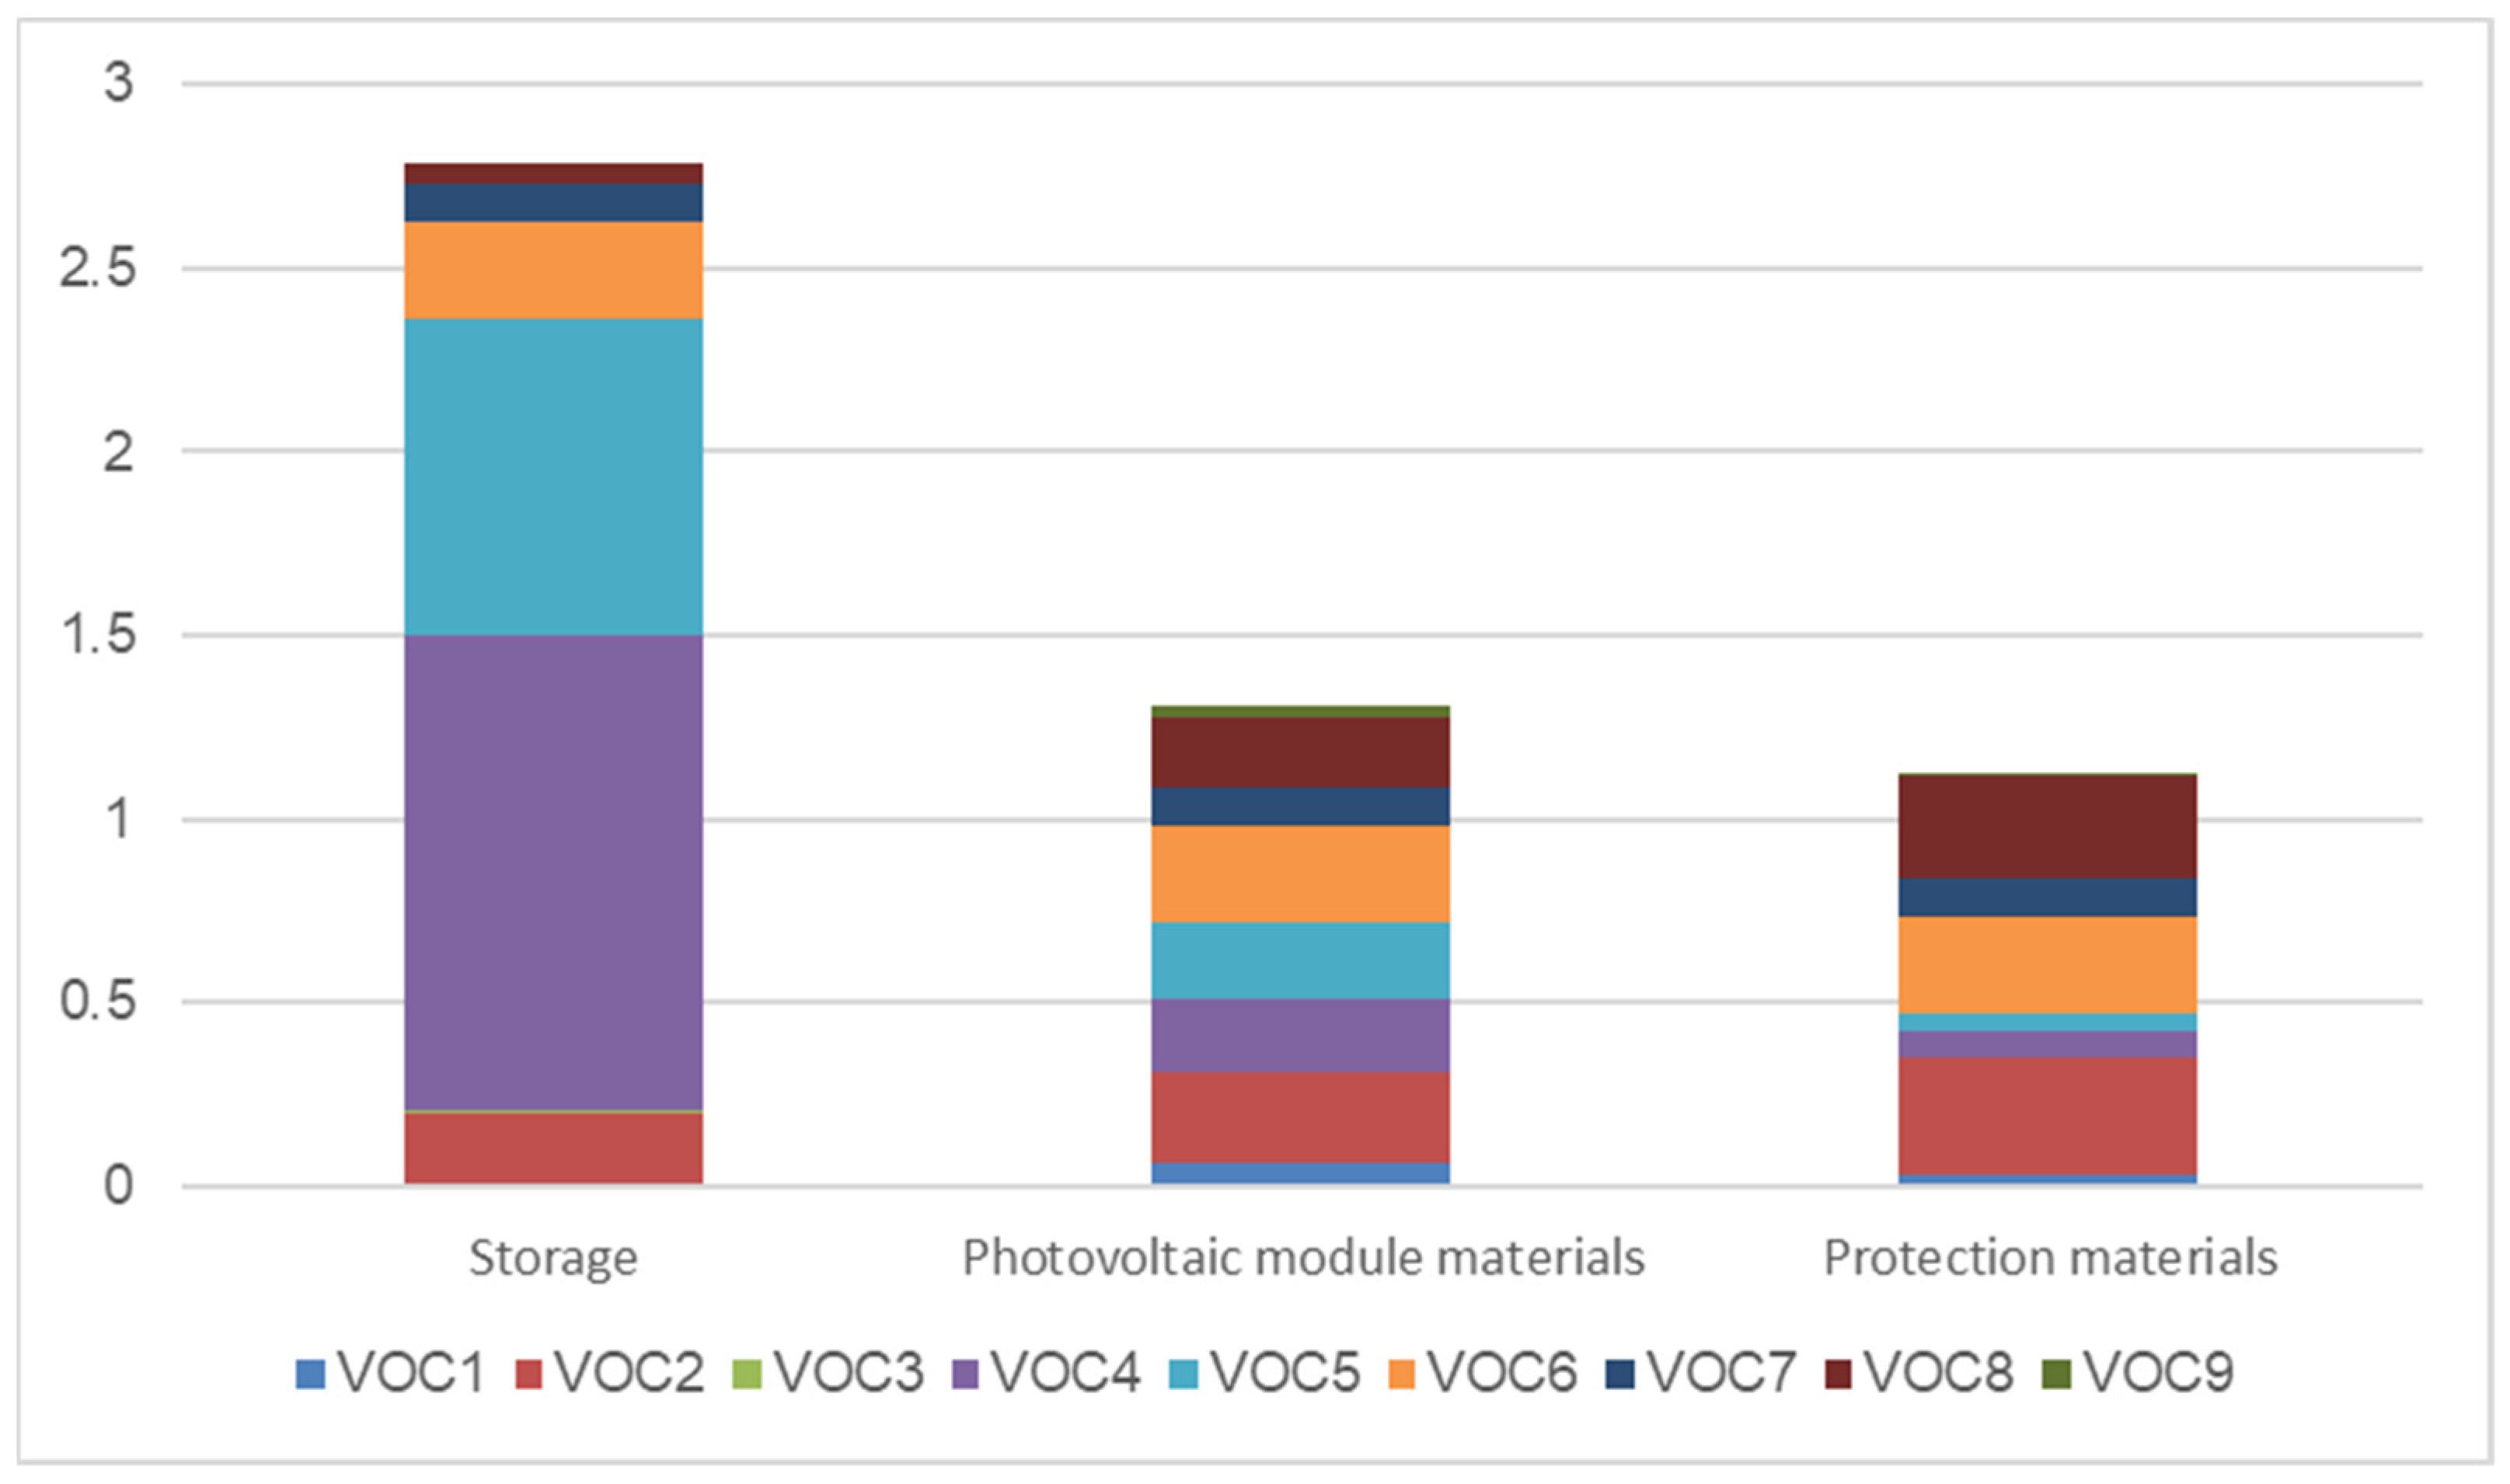
3.4. QFDE Application

The implementation of the QFDE method was carried out in collaboration with the company’s experts. First, the definition of QFDE Phase I was performed by filling the HoQ that combines VOCs and EMs (Figure 6): note that in the column reporting the customer weight (CW) of each VOC, the weights obtained through the AHP method are used. As far as the relationship matrix is concerned, it must be underlined that in the QFDE, the same scoring system as in the conventional QFD is used, i.e., a 1-3-9 scale is used to indicate a “somewhat important”, “important”, or “very important” relationship, respectively. If there is no relationship, the cell is left blank, and a score equal to 0 is computed. For the QFDE implementation, the software Microsoft 365—Excel [79] was used.
This first HoQ brought to light that the most important EMs are EM5 (storage efficiency), EM11 (energy production efficiency), and EM6 (maintainability), while the less important engineering metrics are EM3 (product size) and EM2 (aesthetics).
Then, the list of the PV system’s main components (Part Characteristics—PCs) was defined (Table 3), and QFDE Phase II was performed (Figure 7).
As shown in Figure 7 (highlighted in yellow), the most relevant components of the system are PC3 (storage unit), PC7 (panel protection system), and PC6 (solar panel). Hence, the attention in QFDE Phase III was focused on these three parts of the PV system. Then, the development of the third phase of the method consisted of the implementation of three different HoQs, one per each of the above components. More in detail, as suggested by Masui et al. [32], in this phase, the effects of a product’s improvement on engineering metrics (EMs) are estimated. Hence, based on the priority given to PC3, PC6, and PC7, their relevance is compared considering only the most important values of the EMs. The starting point of this phase is the development of the whole HoQ, as shown in Figure 8.
Then, for each one of the selected PCs, a further relationship matrix was developed where only relevant scores are saved, while the others are considered null. Thus, three different HoQs were developed:
  • Phase III(a) for the proposal of PC3 (storage unit) improvement;
  • Phase III(b) for the proposal of PC6 (solar panel) improvement;
  • Phase III(c) for the proposal of PC7 (panel protection system) improvement.
In Figure 9, the relationship matrix related to PC3 is shown, while the one concerning PC7 is reported in Figure 10. In the former, the relevant EM was considered the energy production efficiency (EM11), while in the former the system durability (EM9). The same engineering metric was considered for the improvement of the protection materials (PC6).
The last step of the QFDE method concerned the development of the three HoQs of Phase IV. In practice, the EM improvement rates obtained for each proposal in Phase III are used to augment the evaluation of VOCs as follows. Starting from the Phase I matrix, for each VOC, the SUMPRODUCT function is applied to generate a value that combines the EM improvement rates and the VOC scores. In this way, the SUM-PRODUCT column is generated (Figure 11). Then, the VOC improvement rate column is generated by computing for each VOC the ratio between the corresponding value of the SUM-PRODUCT column and that of the column RELEVANCE. Finally, for each VOC, the improvement effect is calculated by multiplying the VOC customer weight times the VOC improvement effect. Therefore, it is possible to calculate the total improvement effect of the proposal, which is equal to the sum of all values in the column VOC improvement effect. As shown in Figure 11, the total improvement effect (TIE) for the storage improvement is equal to 2.79.
In detail, the outputs of this phase for the improvement of the storage system are illustrated in Figure 12 (VOC improvement rates), where the scores of VOCs improvement rates related to the storage system are shown.
In the same manner, the other two proposals were also evaluated, and the TIE value of each proposal is compared in Figure 13, where it emerges that the most promising proposal is the improvement of the storage system.
More in detail, the VOC improvement effects of the three proposals are illustrated in Figure 14.

3.5. SWOT Analysis

Based on the output of QFDE, the SWOT analysis was applied to bring to light the benefits and barriers related to the improvement of the storage system. This activity was carried out in a meeting with the company’s group of experts, and the results are synthesized in Figure 15. The experts focused on the system improvement and the related environmental concerns when completing both the internal strengths and weaknesses and the external opportunities and threats sections of the SWOT analysis.
With reference to the former section, the analysis was focused on operations management, which was evaluated considering the system development opportunities and the supply chain capabilities. Regarding the external section, threats included the problems of technological changes and government/regulatory actions.

3.6. TOWS Matrix Strategic Planning

After assessing SWOT factors, implementation strategies were developed through the use of the TOWS matrix, which was applied to systematize strategic choices, considering both internal and external factors. The output of this analysis is summarized in Figure 16. Given that the company operates as an energy provider in the context of intermediary business models, manufacturing activities are not considered. Instead, other operations involved in the PV system supply chain were evaluated, such as the purchase and installation of higher quality components, as well as the provision of services along with the PV system lifespan, up to the implementation of a product–service system (PSS) approach [80] to better handle end-of-life activities.
It must be noted that due to a non-disclosure agreement (NDA) with the company, the data illustrated in both the SWOT and TOWS analyses were simplified.

4. Discussion

This article proposed a procedure aimed at defining strategic improvement options to enhance the market offering of PV systems for private customers living in urban and suburban contexts. The use of the QFDE method combined with the AHP technique allowed us to better elicit conventional and environmental VOCs. As shown in Figure 5, the most relevant expectation of customers concerns the opportunity to reduce the payback period, making a financial profit. This aspect is strictly related to the other most important requirements (VOC5—High efficiency and VOC2—reliability), stressing the customers’ search for a durable system that can allow them to autonomously produce their own electricity supply and potentially export the surplus electricity to the national grid, making an additional profit. Customers also pay attention to the ease of maintenance of the system (VOC9—Installation complexity and VOC6—Ease of disassembling), while the system cost (VOC1) appears to be not so crucial. This result, in contrast to other studies carried out in the sector [81], is due to European policies that allow governments to provide significant financing opportunities for the installation of solar panels for domestic use. Hence, the major concern is not the cost of batteries and PV panels but their maintenance and end-of-life management. This attitude of customers is in line with the results of other research investigating the willingness and intention to purchase PV solar systems under governmental financial support [82,83]. Moreover, the relevance of VOC5 and VOC9 shows that customers have a certain level of knowledge regarding the technical features of PV systems. This is also demonstrated by the low importance of VOC3 given that the system dimensions (especially those of panels and batteries) are standardized characteristics of the products currently on the market.
Considering the company standpoint, the VOC improvement rates (Figure 12) represent the opportunities to improve the offerings on the market: the results achieved show that augmenting the performances of the storage system can largely impact the profit for customers, i.e., payback opportunities that are strictly related to the increase in the energy efficiency of the system and its reliability. Accordingly, the combination of these results can respond to RQ1 suggesting the best improvement option related to the offer of a PV solution considering both the environmental and customers’ requirements.
To accomplish this, the company has to implement a set of strategies that are characterized by two main elements:
(1)
From the technical point of view, the search for better components and modular products can allow the company to offer a system with increased efficiency and easier installation and maintenance operations.
(2)
From the environmental point of view, the implementation of the PSS approach can allow the company to better manage both maintenance and EoL activities.
Actually, the latter issue can be very beneficial for the achievement of a more sustainable business model, as argued by many scholars that investigated the environmental positive effects of a Product-as-a-Service (PaaS) model [84,85,86]. The primary benefit of PaaS is that it allows the company to use the value embedded in physical goods across several life cycles [87]. Such an implementation can be at different levels, as stressed by Golinska-Dawson et al. [88]; thus, the strategy planning that emerged from the TOWS matrix can support the company in deciding which options better fit with the company’s capabilities. In this way, the complexity of implementing a PaaS model can be reduced, in line with Hidalgo-Crespo et al. [89]. This practical insight can respond to RQ2.
At a more general level, the methodological implications of this research should also be outlined. The coordinated use of QFDE with the APH, SWOT, and TOWS to the authors’ knowledge represents a novelty in the QFD literature, providing a framework that allows engineers not only to select an optimal product/service improvement option but also to verify its feasibility at the strategic level in terms of marketing and operation capabilities. The results achieved confirm that shifting from the provision of the PV system and related maintenance towards a PaaS can allow for a greener solution in the context of circular economy business models. Therefore, this outcome accomplishes research hints by Van Opstal and Smeets [37] in a practical manner. Hence, the contribution of the proposed approach lies in the advancement of the knowledge for developing improvement options of product/service offerings considering not only the environmental and technical features of the system but also the related operations to manage it once it is launched on the market, thus involving knowledge and competencies from different domains. This research finding can fulfill the need for more interdisciplinary approaches in the context of environmental sustainability research [90], as the proposed framework can elucidate the issues it tackles and the tools and methods to support it.
Additionally, the current study certainly presents several limitations that need to be solved in further research and practical applications. First, there are limits of the HoQ in providing an unbiased and correct evaluation of qualitative attributes, as well as those related to the prioritization of the latter [91]. The use of the AHP can reduce these limits [92], but more complex elaborations are still needed [42]. Furthermore, the SWOT analysis has also often been criticized for some weaknesses mainly due to the lack of assessment criteria to be used to evaluate the importance of SWOT factors [93]. The use of the TOWS matrix can help managers focus on the core competitive advantages and disadvantages of a certain solution, but a limitation still exists in providing a detailed output that helps the company quickly grasp its competitive position, enabling timely adjustments to its strategic planning and resource allocation [94].
Finally, it must be noted that the current research considers only a company and a specific target customer, i.e., an individual living in an urban or suburban context who is willing to purchase a PV system to be installed in his/her house or apartment. A wider potential customer analysis (e.g., the analysis of the socio-demographic characteristics of respondents) and an in-depth market analysis (e.g., involving other companies) are out of the scope of this research. Indeed, although considering the latter issues can certainly augment the value of this research, the current study is more focused on the methodological approach.

5. Conclusions

This research aims to provide a new rationale for decision-making when implementing sustainable business models by means of an original framework that integrates the QFDE, AHP, SWOT, and TOWS tools. To verify the effectiveness of such a procedure, it was applied to a case study concerning the provision of photovoltaic solar systems for domestic use. The results achieved suggest that the selection of the best improvement strategy for putting a solution on the market that can meet customers’ expectations and allow for the highest efficiencies required to shift towards a circular business model, where the company can also manage the EoL stage of the system. Hence, these outcomes confirm that transitioning from providing PV systems and related maintenance to a Product-as-a-Service (PaaS) model offers a greener solution within circular economy business models. This result can offer practical hints not only to companies operating in the PV market but also to policymakers to better direct the lines of development of the renewable energy market and the related financial support. From the theoretical point of view, the proposed approach advances knowledge in improving product/service offerings by considering environmental, technical, and operational aspects, requiring interdisciplinary knowledge and competencies. Such an output highlights the need for more interdisciplinary approaches in environmental sustainability, providing insights for scholars to better address further research on the implementation of circular economy practices.
Hence, on the one hand, this study can contribute to augmenting the knowledge of tools for the implementation of sustainable business models. On the other hand, further research is needed to expand the validity of this study over the case study context. For example, a wider analysis of potential customers as well as an in-depth market analysis can provide more generalizable outcomes to be used not only by companies operating in the market of PV systems but also in other renewable energy sectors where the system customization and green performances have to be matched.
Another potential future study should concern the refinement of qualitative analyses that can be obtained using the proposed procedure through the adoption of additional tools to improve the effectiveness of prioritization assessments.

Author Contributions

Conceptualization, M.F.; methodology, M.F., E.S., and M.T.; validation, M.F., E.S., and M.T.; writing—review and editing, M.F., E.S., and M.T. All authors have read and agreed to the published version of the manuscript.

Funding

This research received no external funding.

Institutional Review Board Statement

Not applicable.

Informed Consent Statement

Not applicable.

Data Availability Statement

The data presented in this study are available on request from the corresponding author.

Conflicts of Interest

The authors declare no conflicts of interest.

References

  1. Mukonza, C.; Swarts, I. The Influence of Green Marketing Strategies on Business Performance and Corporate Image in the Retail Sector. Bus. Strateg. Environ. 2020, 29, 838–845. [Google Scholar] [CrossRef]
  2. Fargnoli, M.; Haber, N. A QFD-based approach for the development of smart product-service systems. Eng. Rep. 2023, 5, e12665. [Google Scholar] [CrossRef]
  3. United Nations. Transforming Our World: The 2030 Agenda for Sustainable Development. Available online: https://sdgs.un.org/2030agenda (accessed on 13 March 2024).
  4. European Commission. Ecodesign for Sustainable Products Regulation. Available online: https://commission.europa.eu/energy-climate-change-environment/standards-tools-and-labels/products-labelling-rules-and-requirements/sustainable-products/ecodesign-sustainable-products-regulation_en (accessed on 13 March 2024).
  5. European Union. JRC Science for Policy Report, Ecodesign for Sustainable Products Regulation—Preliminary Study on New Product Priorities. Available online: https://susproc.jrc.ec.europa.eu/product-bureau/sites/default/files/2023-01/Preliminary%20ESPR%20WP%20Report_MERGED_CLEAN_.pdf (accessed on 13 March 2024).
  6. Kim, C.H.; Kuah, A.T.; Thirumaran, K. Morphology for circular economy business models in the electrical and electronic equipment sector of Singapore and South Korea: Findings, implications, and future agenda. Sustain. Prod. Consum. 2022, 30, 829–850. [Google Scholar] [CrossRef]
  7. Arai, R.; Calisto Friant, M.; Vermeulen, W.J. The Japanese Circular Economy and Sound Material-Cycle Society Policies: Discourse and Policy Analysis. Circ. Econ. Sustain. 2024, 4, 619–650. [Google Scholar] [CrossRef]
  8. Nekmahmud, M.; Fekete-Farkas, M. Why Not Green Marketing? Determinates of Consumers’ Intention to Green Purchase Decision in a New Developing Nation. Sustainability 2020, 12, 7880. [Google Scholar] [CrossRef]
  9. Martínez, M.P.; Cremasco, C.P.; Filho, L.G.; Junior, S.S.B.; Bednaski, A.V.; Quevedo-Silva, F.; Correa, C.M.; Da Silva, D.; Padgett, R.C.M.L.; Gabriel, C.P.C. Fuzzy inference system to study the behavior of the green consumer facing the perception of greenwashing. J. Clean. Prod. 2020, 242, 116064. [Google Scholar] [CrossRef]
  10. Dangelico, R.M.; Vocalelli, D. “Green marketing”: An analysis of definitions, strategy steps, and tools through a systematic review of the literature. J. Clean. Prod. 2017, 165, 1263–1279. [Google Scholar] [CrossRef]
  11. García-Salirrosas, E.E.; Escobar-Farfán, M.; Gómez-Bayona, L.; Moreno-López, G.; Valencia-Arias, A.; Gallardo-Canales, R. Influence of environmental awareness on the willingness to pay for green products: An analysis under the application of the theory of planned behavior in the Peruvian market. Front. Psychol. 2024, 14, 282383. [Google Scholar] [CrossRef] [PubMed]
  12. Kaur, B.; Gangwar, V.P.; Dash, G. Green Marketing Strategies, Environmental Attitude, and Green Buying Intention: A Multi-Group Analysis in an Emerging Economy Context. Sustainability 2022, 14, 6107. [Google Scholar] [CrossRef]
  13. Cronin, J.J.; Smith, J.S.; Gleim, M.R.; Ramirez, E.; Martinez, J.D. Green marketing strategies: An examination of stakeholders and the opportunities they present. J. Acad. Mark. Sci. 2010, 39, 158–174. [Google Scholar] [CrossRef]
  14. Mestre, A.; Cooper, T. Circular Product Design. A Multiple Loops Life Cycle Design Approach for the Circular Economy. Des. J. 2017, 20, S1620–S1635. [Google Scholar] [CrossRef]
  15. Spreafico, C. An analysis of design strategies for circular economy through life cycle assessment. Environ. Monit. Assess. 2022, 194, 180. [Google Scholar] [CrossRef] [PubMed]
  16. Hapuwatte, B.M.; Jawahir, I.S. Closed-loop sustainable product design for circular economy. J. Ind. Ecol. 2021, 25, 1430–1446. [Google Scholar] [CrossRef]
  17. Acerbi, F.; Taisch, M. A literature review on circular economy adoption in the manufacturing sector. J. Clean. Prod. 2020, 273, 123086. [Google Scholar] [CrossRef]
  18. Matschewsky, J.; Kambanou, M.L.; Sakao, T. Designing and providing integrated product-service systems—Challenges, opportunities and solutions resulting from prescriptive approaches in two industrial companies. Int. J. Prod. Res. 2018, 56, 2150–2168. [Google Scholar] [CrossRef]
  19. Diaz, A.; Schöggl, J.-P.; Reyes, T.; Baumgartner, R.J. Sustainable product development in a circular economy: Implications for products, actors, decision-making support and lifecycle information management. Sustain. Prod. Consum. 2021, 26, 1031–1045. [Google Scholar] [CrossRef]
  20. Bocken, N.M.P.; Schuit, C.S.C.; Kraaijenhagen, C. Experimenting with a circular business model: Lessons from eight cases. Environ. Innov. Soc. Transit. 2018, 28, 79–95. [Google Scholar] [CrossRef]
  21. Chrispim, M.C.; Mattsson, M.; Ulvenblad, P. The underrepresented key elements of Circular Economy: A critical review of assessment tools and a guide for action. Sustain. Prod. Consum. 2023, 35, 539–558. [Google Scholar] [CrossRef]
  22. Bocken, N.M.P.; de Pauw, I.; Bakker, C.; van der Grinten, B. Product design and business model strategies for a circular economy. J. Ind. Prod. Eng. 2016, 33, 308–320. [Google Scholar] [CrossRef]
  23. Su, D.; Casamayor, J.L.; Xu, X. An integrated approach for eco-design and its application in LED lighting product development. Sustainability 2021, 13, 488. [Google Scholar] [CrossRef]
  24. Fargnoli, M.; De Minicis, M.; Tronci, M. Product’s life cycle modelling for ecodesigning product-service systems. In Proceedings of the DESIGN 2012, the 12th International Design Conference, Dubrovnik, Croatia, 21–24 May 2012; pp. 869–878. [Google Scholar]
  25. Fargnoli, M.; Kimura, F. Sustainable design of modern industrial products. In Proceedings of the International Conference of Life Cycle Engineering, LCE 2006, Leuven, Belgium, 31 May–2 June 2006; pp. 189–194. [Google Scholar]
  26. Younesi, M.; Roghanian, E. A framework for sustainable product design: A hybrid fuzzy approach based on Quality Function Deployment for Environment. J. Clean. Prod. 2015, 108, 385–394. [Google Scholar] [CrossRef]
  27. Perez-Gallardo, J.R.; Azzaro-Pantel, C.; Astier, S. Combining Multi-Objective Optimization, Principal Component Analysis and Multiple Criteria Decision Making for ecodesign of photovoltaic grid-connected systems. Sustain. Energy Technol. Assess. 2018, 27, 94–101. [Google Scholar] [CrossRef]
  28. Jayal, A.D.; Badurdeen, F.; Dillon, O.W.; Jawahir, I.S. Sustainable Manufacturing: Modeling and Optimization Challenges at the Product, Process and System Levels. CIRP J. Manuf. Sci. Technol. 2010, 2, 144–152. [Google Scholar] [CrossRef]
  29. Jiang, P.; Dieckmann, E.; Han, J.; Childs, P.R.N. A Bibliometric Review of Sustainable Product Design. Energies 2021, 14, 6867. [Google Scholar] [CrossRef]
  30. Sakao, T.A. QFD-centred design methodology for environmentally conscious product design. Int. J. Prod. Res. 2007, 45, 4143–4162. [Google Scholar] [CrossRef]
  31. Puglieri, F.N.; Ometto, A.R.; Salvador, R.; Barros, M.V.; Piekarski, C.M.; Rodrigues, I.M.; Diegoli Netto, O. An Environmental and Operational Analysis of Quality Function Deployment-Based Methods. Sustainability 2020, 12, 3486. [Google Scholar] [CrossRef]
  32. Masui, K.; Sakao, T.; Aizawa, S.; Inaba, A.I. Quality Function Deployment for Environment (QFDE) to Support Design for Environment (DFE). In Proceedings of the ASME 7th Design for Manufacturing Conference, Montreal, QC, Canada, 29 September–2 October 2002; pp. 415–423. [Google Scholar] [CrossRef]
  33. Saaty, T. Decision-making with the AHP: Why is the principal eigenvector necessary. Eur. J. Oper. Res. 2003, 145, 85–91. [Google Scholar] [CrossRef]
  34. Weihrich, H. The TOWS matrix—A tool for situation analysis. Long Range Plan 1982, 15, 54–66. [Google Scholar] [CrossRef]
  35. Ravanavar, G.M.; Charantimath, P.M. Strategic formulation using TOWS matrix—A case study. Int. J. Res. Dev. 2012, 1, 87–90. [Google Scholar]
  36. Överholm, H. Alliance formation by intermediary ventures in the solar service industry: Implications for product-service systems research. J. Clean. Prod. 2017, 140, 288–298. [Google Scholar] [CrossRef]
  37. Van Opstal, W.; Smeets, A. Circular economy strategies as enablers for solar PV adoption in organizational market segments. Sustain. Prod. Consum. 2023, 35, 40–54. [Google Scholar] [CrossRef]
  38. Obaideen, K.; AlMallahi, M.N.; Alami, A.H.; Ramadan, M.; Abdelkareem, M.A.; Shehata, N.; Olabi, A. On the contribution of solar energy to sustainable developments goals: Case study on Mohammed bin Rashid Al Maktoum Solar Park. Int. J. Thermofluid 2021, 12, 100123. [Google Scholar] [CrossRef]
  39. Aniello, G.; Bertsch, V. Shaping the energy transition in the residential sector: Regulatory incentives for aligning household and system perspectives. Appl. Energy 2023, 333, 120582. [Google Scholar] [CrossRef]
  40. Seker, S.; Kahraman, C. Socio-economic evaluation model for sustainable solar PV panels using a novel integrated MCDM methodology: A case in Turkey. Socio-Econ. Plan. Sci. 2021, 77, 100998. [Google Scholar] [CrossRef]
  41. Chan, L.K.; Wu, M.L. Quality function deployment: A literature review. Eur. J. Oper. Res. 2002, 143, 463–497. [Google Scholar] [CrossRef]
  42. Sivasamy, K.; Arumugam, C.; Devadasan, S.R.; Murugesh, R.; Thilak, V.M.M. Advanced models of quality function deployment: A literature review. Qual. Quant. 2016, 50, 1399–1414. [Google Scholar] [CrossRef]
  43. Vinayak, K.; Kodali, R. Benchmarking the quality function deployment models. Benchmarking Int. J. 2013, 20, 825–854. [Google Scholar] [CrossRef]
  44. Fargnoli, M.; Sakao, T. Uncovering differences and similarities among quality function deployment-based methods in Design for X: Benchmarking in different domains. Qual. Eng. 2017, 29, 690–712. [Google Scholar] [CrossRef]
  45. Akao, Y. Quality Function Deployment: Integrating Customer Requirements into Product Design; Productivity Press: New York, NY, USA, 2004. [Google Scholar]
  46. Carnevalli, J.A.; Miguel, P.A.C. Review, analysis and classification of the literature on QFD-Types of research, difficulties and benefits. Int. J. Prod. Econ. 2008, 114, 737–754. [Google Scholar] [CrossRef]
  47. Franceschini, F.; Rossetto, S. QFD: The Problem of Comparing Technical/Engineering Design Requirements. Res. Eng. Des. 1995, 7, 270–278. [Google Scholar] [CrossRef]
  48. Zhou, J.; Shen, Y.; Pantelous, A.A.; Liu, Y. Quality Function Deployment: A Bibliometric-Based Overview. IEEE Trans. Eng. Manag. 2022, 56, 1–22. [Google Scholar] [CrossRef]
  49. Bereketli, I.; Genevois, M.E. An integrated QFDE approach for identifying improvement strategies in sustainable product development. J. Clean. Prod. 2013, 54, 188–198. [Google Scholar] [CrossRef]
  50. Wu, Y.; Luo, B.; Li, M. Application of quality function deployment for environment in product eco-design. In Proceedings of the IEEE International Symposium on Assembly and Manufacturing, Seoul, Republic of Korea, 17–20 November 2009; pp. 254–257. [Google Scholar] [CrossRef]
  51. Popoff, A.; Millet, D. Sustainable life cycle design using constraint satisfaction problems and Quality Function Deployment. Procedia CIRP 2017, 61, 75–80. [Google Scholar] [CrossRef]
  52. Yu, S.; Yang, Q.; Tao, J.; Xu, X. Incorporating Quality Function Deployment with modularity for the end-of-life of a product family. J. Clean. Prod. 2015, 87, 423–430. [Google Scholar] [CrossRef]
  53. Vinodh, S.; Kamala, V.; Jayakrishna, K. Integration of ECQFD, TRIZ, and AHP for innovative and sustainable product development. Appl. Math. Model. 2014, 38, 2758–2770. [Google Scholar] [CrossRef]
  54. Kuo, T.C.; Wu, H.H.; Shieh, J.I. Integrating of environmental considerations in quality function deployment by using fuzzy logic. Expert Syst. Appl. 2009, 36, 7148–7156. [Google Scholar] [CrossRef]
  55. Zhang, Y.; Wang, H.; Zhang, C. Green QFD-II: A life cycle approach for environmentally conscious manufacturing by integrating LCA and LCC into QFD matrices. Int. J. Prod. Res. 1999, 37, 1075–1091. [Google Scholar] [CrossRef]
  56. Bovea, M.D.; Wang, B. Redesign methodology for developing environmentally conscious products. Int. J. Prod. Res. 2007, 45, 4057–4072. [Google Scholar] [CrossRef]
  57. Mehta, C.; Wang, B. Green quality function deployment III: A methodology for developing environmentally conscious products. J. Des. Manuf. Autom. 2001, 1, 1–16. [Google Scholar] [CrossRef]
  58. Bhattacharya, A.; Sarkar, B.; Mukherjee, S.K. Integrating AHP with QFD for robot selection under requirement perspective. Int. J. Prod. Res. 2005, 43, 3671–3685. [Google Scholar] [CrossRef]
  59. Das, D.; Mukherjee, K. Development of an AHP-QFD framework for designing a tourism product. Int. J. Serv. Oper. Manag. 2008, 4, 321–344. [Google Scholar] [CrossRef]
  60. Phadermrod, B.; Crowder, R.M.; Wills, G.B. Importance-performance analysis based, SWOT analysis. Int. J. Inf. Manag. 2019, 44, 194–203. [Google Scholar] [CrossRef]
  61. Sammut-Bonnici, T.; Galea, D. SWOT analysis. In Willey Encyclopedia of Management: Volume 12 Strategic Management, 3rd ed.; McGee, J., Sammut-Bonnici, T., Eds.; John Wiley & Sons: Chichister, UK, 2014; pp. 495–502. [Google Scholar] [CrossRef]
  62. Clegg, B.; Tan, B. Using QFD for e-business planning and analysis in a micro-sized enterprise. Int. J. Qual. Reliab. Manag. 2007, 24, 813–828. [Google Scholar] [CrossRef]
  63. Saragih, L.L.; Simarmata, E.; Aloina, G.; Tarigan, U.P.; Ramadhani, V.B.; Ginting, S.E. Product development of canned fish using SWOT and quality function deployment (QFD). AIP Conf. Proc. 2020, 2227, 040017. [Google Scholar] [CrossRef]
  64. Pur, M.M.; Tabriz, A.A. SWOT analysis using of modified fuzzy QFD—A Case study for strategy formulation in Petrokaran film factory. Procedia Soc. Behav. Sci. 2012, 41, 322–333. [Google Scholar] [CrossRef]
  65. Microsoft Office 365. Available online: https://www.microsoft.com/en-us/microsoft-365 (accessed on 13 March 2024).
  66. Liu, H.Y.; Skandalos, N.; Braslina, L.; Kapsalis, V.; Karamanis, D. Integrating Solar Energy and Nature-Based Solutions for Climate-Neutral Urban Environments. Solar 2023, 3, 382–415. [Google Scholar] [CrossRef]
  67. Akrofi, M.M.; Okitasari, M. Integrating solar energy considerations into urban planning for low carbon cities: A systematic review of the state-of-the-art. Urban Gov. 2022, 2, 157–172. [Google Scholar] [CrossRef]
  68. Sahu, Β.Κ. A study on global solar PV energy developments and policies with special focus on the top ten solar PV power producing countries. Renew. Sustain. Energy Rev. 2015, 43, 621–634. [Google Scholar] [CrossRef]
  69. Formolli, M.; Croce, S.; Vettorato, D.; Paparella, R.; Scognamiglio, A.; Mainini, A.G.; Lobaccaro, G. Solar Energy in Urban Planning: Lesson Learned and Recommendations from Six Italian Case Studies. Appl. Sci. 2022, 12, 2950. [Google Scholar] [CrossRef]
  70. Ferreira, A.; Kunh, S.S.; Fagnani, K.C.; De Souza, T.A.; Tonezer, C.; Dos Santos, G.R.; Coimbra-Araújo, C.H. Economic overview of the use and production of photovoltaic solar energy in brazil. Renew. Sustain. Energy Rev. 2018, 81, 181–191. [Google Scholar] [CrossRef]
  71. Mundaca, L.; Samahita, M. What drives home solar PV uptake? Subsidies, peer effects and visibility in Sweden. Energy Res. Soc. Sci. 2020, 60, 101319. [Google Scholar] [CrossRef]
  72. El-Bayeh, C.Z.; Alzaareer, K.; Brahmi, B.; Zellagui, M.; Eicker, U. An Original Multi-Criteria Decision-Making Algorithm for Solar Panels Selection in Buildings. Energy 2021, 217, 1–15. [Google Scholar] [CrossRef]
  73. Balo, F.; Sagbansua, L. The selection of the best solar panel for the photovoltaic system design by using AHP. Energy Procedia 2016, 100, 50–53. [Google Scholar] [CrossRef]
  74. Siwiec, D.; Pacana, A. Model of Choice Photovoltaic Panels Considering Customers’ Expectations. Energies 2021, 14, 5977. [Google Scholar] [CrossRef]
  75. Alaaeddin, M.H.; Sapuan, S.M.; Zuhri, M.Y.M.; Zainudin, E.S.; Al-Oqla, F.M. Photovoltaic Applications: Status and Manufacturing Prospects. Renew. Sustain. Energy Rev. 2019, 102, 318–332. [Google Scholar] [CrossRef]
  76. Bączkiewicz, A.; Kizielewicz, B.; Shekhovtsov, A.; Yelmikheiev, M.; Kozlov, V.; Sałabun, W. Comparative Analysis of Solar Panels with Determination of Local Significance Levels of Criteria Using the MCDM Methods Resistant to the Rank Reversal Phenomenon. Energies 2021, 14, 5727. [Google Scholar] [CrossRef]
  77. Pacana, A.; Siwiec, D. Model to Predict Quality of Photovoltaic Panels Considering Customers’ Expectations. Energies 2022, 15, 1101. [Google Scholar] [CrossRef]
  78. Franěk, J.; Kresta, A. Judgment Scales and Consistency Measure in AHP. Procedia Econ. Financ. 2014, 12, 164–173. [Google Scholar] [CrossRef]
  79. MS EXCEL. Available online: https://www.microsoft.com/en-ie/microsoft-365/excel (accessed on 13 March 2024).
  80. Sakao, T.; Nordholm, A.K. Requirements for a Product Lifecycle Management System Using Internet of Things and Big Data Analytics for Product-as-a-Service. Front. Sustain. 2021, 2, 735550. [Google Scholar] [CrossRef]
  81. Pandey, A.K.; Kalidasan, B.; Reji Kumar, R.; Rahman, S.; Tyagi, V.V.; Krismadinata; Said, Z.; Salam, P.A.; Juanico, D.E.; Ahamed, J.U.; et al. Solar Energy Utilization Techniques, Policies, Potentials, Progresses, Challenges and Recommendations in ASEAN Countries. Sustainability 2022, 14, 11193. [Google Scholar] [CrossRef]
  82. Jabeen, G.; Ahmad, M.; Zhang, Q. Perceived critical factors affecting consumers’ intention to purchase renewable generation technologies: Rural-urban heterogeneity. Energy 2021, 218, 119494. [Google Scholar] [CrossRef]
  83. Setyawati, D. Analysis of perceptions towards the rooftop photovoltaic solar system policy in Indonesia. Energy Policy 2020, 144, 111569. [Google Scholar] [CrossRef]
  84. Mont, O. Clarifying the concept of product–service system. J. Clean. Prod. 2002, 10, 237–245. [Google Scholar] [CrossRef]
  85. Gräßler, I.; Pottebaum, J. Generic Product Lifecycle Model: A Holistic and Adaptable Approach for Multi-Disciplinary Product–Service Systems. Appl. Sci. 2021, 11, 4516. [Google Scholar] [CrossRef]
  86. Kesavapanikkar, P.; Amit, R.K.; Ramu, P. Product as a service (PaaS) for traditional product companies: An automotive lease practice evaluation. J. Indian Bus. Res. 2021, 15, 40–54. [Google Scholar] [CrossRef]
  87. Blüher, T.; Amaral, D.C.; Lindow, K.; Costa, J.M.H.; Stark, R. Research opportunities in PSS design focusing on the potentials of agile approaches. Procedia CIRP 2019, 84, 832–837. [Google Scholar] [CrossRef]
  88. Golinska-Dawson, P.; Zysnarska, Z.; Pender, A. Assessment of the maturity of product-as-a-service business models for household appliances from the perspective of R strategies in Circular Economy. Procedia CIRP 2024, 122, 1083–1088. [Google Scholar] [CrossRef]
  89. Hidalgo-Crespo, J.; Riel, A.; Duberg, J.V.; Bunodiere, A.; Golinska-Dawson, P. An exploratory study for product-as-a-service (PaaS) offers development for electrical and electronic equipment. Procedia CIRP 2024, 122, 521–526. [Google Scholar] [CrossRef]
  90. Sakao, T.; Brambila-Macias, S.A. Do we share an understanding of transdisciplinarity in environmental sustainability research? J. Clean. Prod. 2018, 170, 1399–1403. [Google Scholar] [CrossRef]
  91. Zhang, X.; Tong, S.; Eres, H.; Wang, K.; Kossmann, M. Towards avoiding the hidden traps in QFD during requirements establishment. J. Syst. Sci. Syst. Eng. 2015, 24, 316–336. [Google Scholar] [CrossRef]
  92. Fargnoli, M.; Lombardi, M.; Haber, N. A fuzzy-QFD approach for the enhancement of work equipment safety: A case study in the agriculture sector. Int. J. Reliab. Saf. 2018, 12, 306–326. [Google Scholar] [CrossRef]
  93. Wu, J.; Zhao, N.; Yang, T. Wisdom of crowds: SWOT analysis based on hybrid text mining methods using online reviews. J. Bus. Res. 2024, 171, 114378. [Google Scholar] [CrossRef]
  94. Benzaghta, M.A.; Elwalda, A.; Mousa, M.; Erkan, I.; Rahman, M. SWOT Analysis Applications: An Integrative Literature Review. J. Glob. Bus. Insights 2021, 6, 55–73. [Google Scholar] [CrossRef]
Figure 1. A scheme of the conventional QFD phases.
Sustainability 16 05941 g001
Figure 2. A scheme of the QFDE method functioning.
Sustainability 16 05941 g002
Figure 3. A scheme of the research approach.
Sustainability 16 05941 g003
Figure 4. AHP outputs.
Sustainability 16 05941 g004
Figure 5. VOC ranking (in green, environmental VOCs; in red, conventional VOCs).
Sustainability 16 05941 g005
Figure 6. Phase I of the QFDE method.
Sustainability 16 05941 g006
Figure 7. Phase II of the QFDE method.
Sustainability 16 05941 g007
Figure 8. Phase III of the QFDE method.
Sustainability 16 05941 g008
Figure 9. Phase III(a) of the QFDE method (related to the improvement of the storage system).
Sustainability 16 05941 g009
Figure 10. Phase III(b) of the QFDE method (related to the improvement of the panel’s material): the scores considered for the evaluation are those included in the bold box (red line), belonging to the line/row highlighted in yellow (i.e., those containing the most impactful scores), in accordance with the QFDE rules by Masui et al. [32].
Sustainability 16 05941 g010
Figure 11. Phase IV(a) of the QFDE method (related to the improvement of the storage system).
Sustainability 16 05941 g011
Figure 12. VOC improvement rates related to the storage system (in green, environmental VOCs; in red, conventional VOCs).
Sustainability 16 05941 g012
Figure 13. A comparison of the total improvement effects.
Sustainability 16 05941 g013
Figure 14. A comparison of the VOC improvement effects related to the improvement of the storage system.
Sustainability 16 05941 g014
Figure 15. The results of the SWOT analysis.
Sustainability 16 05941 g015
Figure 16. TOWS matrix.
Sustainability 16 05941 g016
Table 1. List of the selected Voices of Customers (VOCs).
TypeCodeVOCs
Conventional VOCsVOC1Purchase cost
VOC2Reliability
VOC3Dimensions
VOC4Profit
Environmental VOCsVOC5Energy efficiency
VOC6Ease of disassembling and parts sorting
VOC7Easy to dispose
VOC8Lifespan duration
VOC9Installation complexity
Table 2. A list of the selected engineering metrics (EMs).
TypeCodeVOCs
Conventional EMsEM1Monitoring
EM2Product size
EM3Aesthetics
EM4Storage capacity
EM5Storage efficiency
EM6Maintainability
Environmental EMsEM7Materials recyclability
EM8Accessibility
EM9Durability
EM10Product modularity
EM11Energy production efficiency
EM12Materials resistance
EM13Quality of preliminary inspection
EM14Quality of installation
EM15Reduced number of components
EM16Product disposal/recycling
Table 3. The list of the Part Characteristics (PCs).
CodePCs
PC1Connection cables
PC2Installation system
PC3Storage unit
PC4Inverters
PC5Control system
PC6Panel protection (materials)
PC7Panel (materials)
Disclaimer/Publisher’s Note: The statements, opinions and data contained in all publications are solely those of the individual author(s) and contributor(s) and not of MDPI and/or the editor(s). MDPI and/or the editor(s) disclaim responsibility for any injury to people or property resulting from any ideas, methods, instructions or products referred to in the content.

