Perspective

Gold Production and the Global Energy Transition—A Perspective

1
Centre for Exploration Targeting, School of Earth Sciences, University of Western Australia, Perth, WA 6009, Australia
2
UWA Business School, University of Western Australia, Crawley, WA 6009, Australia
*
Author to whom correspondence should be addressed.
Sustainability 2024, 16(14), 5951; https://doi.org/10.3390/su16145951
Submission received: 23 December 2023 / Revised: 9 July 2024 / Accepted: 10 July 2024 / Published: 12 July 2024

Abstract

:
Gold is neither a critical mineral nor a metal that is central to the global energy transition in terms of demand from new energy production technologies. Yet, gold is unique among mined commodities for its role in financial markets and for its global production footprint including in numerous developing economies. Since the production of gold incurs CO2 emissions and other environmental risks including water pollution and land degradation, gold producers seek to adopt clean production solutions through electrification and renewable energy adoption. Further, gold’s unique role as a store of value creates new potential green business models in gold, such as the digitalisation of in-ground gold inventories, which can further reduce negative environmental externalities from gold mining. A net-zero emissions, future global gold industry, is possible. Major gold producers are targeting net-zero Scope 1 and 2 emissions by 2050, coupled with a lower overall environmental footprint to meet heightened societal expectations for cleaner production. An analysis of emissions data from Australian gold mines shows systematic differences between mining operations. Further clean energy investment in gold production is required to reduce emission levels towards the target of net zero.

1. Introduction

Gold has been mined for thousands of years. It is coveted by society for its unique properties [1] and valued for its intrinsic properties—it does not tarnish and has rarity value and a high density; as such, it has the ideal properties to act as a medium of exchange and store of value.
Gold mining is a sophisticated, sizeable, and global industry. Gold is mined either from the surface, in an open pit, or else from underground. Gold processing takes place at the mine site and commences with crushing, then the treatment of the ore with chemicals occurs to extract the gold, and smelting takes place to produce a doré gold bar. The bar is then transported to a gold refinery to produce pure gold for sale. Since no single country or company controls gold production, gold is not deemed a critical mineral [2], and there is no global imperative to increase gold production. The gold industry has already evolved to a stage where it serves society’s needs well. There is no heightened geopolitical tension over who controls gold reserves, unlike for the various critical minerals deemed essential to the energy transition and contributors to new technologies manufacturing.
Gold can be considered a stable global industry. Its demand growth is incremental, both for investment and fabrication needs. Its supply growth too is incremental. New discoveries of gold deposits replace the mines that are reaching the end of their economic life [3]. Gold mining companies seek new gold production through mine expansions and through exploration activities. Where such organic growth proves challenging, larger gold companies often seek to acquire their smaller counterparts to supplement their gold production.
Gold companies traditionally fall into three broad categories: (i) gold miners who produce gold, (ii) emerging gold development companies who are advancing mining projects towards first production, and (iii) exploration companies who are in the process of discovering significant inventories of gold-in-ground and whose primary purpose is to actively search for new deposits. In recent decades, a further significant category of companies exposed to the gold price has emerged in gold royalty and streaming companies [4].
We contribute to the research literature by identifying the potential roles for the gold industry in advancing the energy transition globally, notwithstanding the fact that new clean energy production technologies do not create significant new gold demand. We present new empirical emissions data from the Australian gold sector to illustrate the quantum of emissions and the variation between gold mines. We hope that by drawing attention to the role of the gold industry in the energy transition, further research will be undertaken, including research on the future potential for establishing “Green Gold” as a tradeable gold asset.
The rest of this paper is organised as follows: Section 2 presents a synthesis of global gold production volumes and costs. Section 3 examines the environmental and economic impacts of gold mining, explaining both the positive and negative externalities of gold production. Section 4 examines the current and future role of gold mining in the energy transition with a discussion of the potential for carbon emission reduction in gold production. Section 5 introduces recent and planned interventions by gold mining companies to lower their collective emissions, principally focused on Scope 1 and Scope 2 emission abatement. Section 6 introduces and analyses new empirical emissions data, compiled from the Australian gold industry, to illustrate the pathway towards net-zero gold mining. Section 7 discusses the new concept of “Green Gold” [5] as a potential future pathway towards net-zero-emission gold price exposure for those gold investors who do not require physical gold delivery. Finally, Section 8 summarises the paper and concludes.

2. Global Gold Production and Costs

In 2022, global gold production was 3627.7 tonnes or 128.0 million troy ounces (Moz) with China (375 tonnes), Russia (325 tonnes), and Australia (314 tonnes) as the leading producers [6]. A further contribution to global production, both from the informal mining of gold in China and across several African countries, remains difficult to estimate with accuracy.
Gold mining companies are numerous, with the largest producers in 2021—Newmont Corporation (5.95 Moz) and Barrick Gold Corporation (4.46 Moz) [7]—representing only 4.7% and 3.5% of global annual production, respectively [7]. The largest 20 gold producers collectively comprise about 32% (40.33 Moz) of the market [6]. Using the average 2021 gold price of USD 1799/oz, the value of global gold mine production was approximately USD 227 billion in 2021 [8].
Gold production costs vary between mines. Differences in costs between mines reflect variations in geological quality and the type of gold deposit (e.g., [9]), including gold grade, ore and host rock physical and chemical properties, orebody geometry, the presence or absence of by-product metals such as silver and copper, and the type of mining being undertaken (e.g., open-pit versus underground). Further variables include the relative cost of key production factors such as the cost of capital, labour, energy provision, and processing reagents.
Research into the cost economics of gold production is limited, in part due to the historical lack of available and reliable cost information [10]. The introduction of the All-in Sustaining Cost (AISC) approach, initiated by the World Gold Council [11], has in part solved this information gap [12].
Production costs vary over time, with gold producers typically reporting on their production and costs each quarter. Using Australian gold producers as an example, the average All-in Sustaining Cost (AISC) for Australian and New Zealander gold producers was AUD 1871/oz in the March quarter of 2023 (~USD 1225/oz) versus the average gold spot price for that quarter of AUD 2765/oz (USD 1889/oz), representing a 48 per cent operating margin [13].
In terms of average gold grade, for those Australian and New Zealander gold mines that report AISC, the overall reported mill head/feed grade was 2.31 g/t. Open-pit mine grades at 1.06 g/t are lower than the average underground grades at 3.38 g/t, with those mines that source gold from both open-pit and underground sources averaging 1.95 g/t [13].
Maintaining competitive production costs is a key focus for miners, but the drivers of costs are rather complex. Grade is clearly a key factor, with the phrase “grade is king” a gold industry mantra in terms of relative cost performance between mines. Whilst higher gold grades are indeed typically associated with lower production costs [14], both the scale and the mining method are also key factors. As such, a large-scale, low-grade, open-pit mine can have lower costs of production than a small, high-grade, underground gold operation.

3. Environmental Impacts from Gold Mining

Gold mining is invasive, with mining either conducted from the surface in an open pit or else underground via the construction of either a decline or a shaft to access the gold ore at depth.
Similarly, the processing of mined gold ore requires surface infrastructure, typically a gold recovery plant, with further land requirements to store both waste rock and the processed tailings from which the gold has been extracted.
Negative environmental externalities from gold mining [14], and indeed from mining generally, can include acid mine drainage from tailings storage facilities [15], deforestation [16], greenhouse gas emissions [14,17,18], hazardous waste [19], water and air quality deterioration [20], and chemical spillage [21].
Gold mining also carries health and safety risks for workers [22].
Furthermore, environmental costs vary between gold mines, with carbon emission intensity as one clear example, along with operational footprints impacting land disturbance, water usage, and waste storage.
With respect to environmental costs, underground gold mines usually have lower carbon emission intensities, incur less surface disturbance, and require less water and power than open-pit mines, largely due to the typically higher-grade ore mined and consequently the lower ore tonnages processed [14].
Positive economic, social, and environmental externalities can also occur from gold mining [23,24]. These positive benefits include the provision of power and other local infrastructure around mine sites, community support initiatives delivered by mining companies, and the creation of jobs both directly in the mining and processing of ores and through the creation of mining service businesses. Such benefits represent critical linkages between gold mining and the broader economy [25]. State and government royalties and company taxes related to gold production also add economic benefits [26] with the potential for reinvestment at the local, regional, and state levels. The overall balance between positive and negative economic impacts from gold mining will vary between individual mines and between jurisdictions.
There is limited academic literature explicitly relating to GHG emissions and energy consumption in gold mining. Previous studies are summarised in Ulrich et al. [27] and are either based on company-reported data or based on life cycle assessment (LCA) studies. The LCA studies provide an understanding of the relative contribution of production inputs to energy and carbon footprints and seek to assess the cumulative environmental impacts inclusive of water, land use, and waste production.

4. Gold Mining and the Energy Transition

The World Gold Council [28] notes a range of industrial applications for gold that can help reduce emissions. These include using gold catalysts to help convert carbon dioxide into other types of useful fuels [29]; using gold nanoparticles to enhance hydrogen fuel cell performance [30]; and using gold to improve photovoltaics in solar panels [31].
Additional gold demand from such emissions-related end uses remains modest, however, and not material to overall gold demand growth. This contrasts with other metals that are more closely associated with the energy transition, such as lithium [32], cobalt [33], vanadium [34], and nickel [35], in batteries and selected rare earths in high-strength magnets used in wind power [36]. The relative demand-side impact of the energy transition on total metal demand is far greater in the case of all these metals than in the case of gold.
Gold does, however, have a role to play in the energy transition. Specifically, the global footprint of gold mining and the desire of gold producers to lower their emissions can be viewed as a demand-pull from a globally significant ~USD 200 billion industry towards timely renewable energy adoption.
The roles of government-led environmental regulation and incentives, and of industry-led renewable energy adoption, are both complex and case-dependent.
One way to assess the sensitivity of gold mining to the energy transition is to assess the impact of a future carbon price on gold miners. The introduction of a carbon price is considered the most efficient mechanism to curb emissions [37]. If such a carbon price is affordable, then current gold mining practices, and the interventions by miners to lower their environmental impacts, will be sustainable. In contrast, if a carbon price destroys industry profitability, then new methods of gold production, or perhaps new gold business models, will be required to restore profitability and sustainability.
Empirical analyses have identified that global greenhouse gas emissions from gold mining exceed 100 Mt CO2-equivalent annually, with country emission intensities varying by more than an order of magnitude from 129 to 2754 kg CO2-e/oz [38].
The cost impact on global gold miners from the introduction of an assumed USD 100/t CO2-equivalent carbon price similarly varies markedly between countries.
A key driver in determining the relative cost impact is the electricity generation mix in a specific mining region. Those jurisdictions where energy sources are cleaner, utilising a high proportion of renewable energy to power gold mines, incur a lesser cost impact from the introduction of a carbon price. For example, a USD 100/t CO2-equivalent price increases gold production costs on average by only USD 13 per ounce in Finland [38], due to their low reliance on fossil fuels [39], but up to USD 275/oz in South Africa [38], where power is derived mostly from thermal coal production [40].
Overall, given the prevailing operating margins at most mines, the impact of a USD 100/t CO2-equivalent carbon price would clearly be affordable to the global gold industry, albeit no consistent global carbon price has yet emerged.
A shift towards a greater proportion of lower-emission underground gold mining, as orebodies deepen [4], together with interventions to reduce the emission intensity of mining—such as the implementation of renewable energy sources—holds significant potential to deliver a cleaner, profitable global gold industry.

5. The Potential for Greenhouse Gas Abatement in Gold Mining

There is clear potential for greenhouse gas abatement in gold mining globally, both at existing gold mines and across new gold mining projects (e.g., [38]).
New mines can more easily take advantage of a greater proportion of renewable energy in their total energy mix than existing mines, due to the enhanced technical challenges of retrofitting renewable energy power generation to existing mining infrastructure.
The key areas for potential abatement include energy efficiency, energy substitution, and the adoption of new mining technologies, such as the deployment of electric mining fleets.
Emission reduction opportunities are significant. For example, the reduction in emissions from the energy substitution of the mine’s primary energy source is up to 46%, whereas the reduction in emissions from energy efficiencies in underground mines from ventilation and cooling can be up to 24% [38].
The global gold sector has embraced the challenge of transitioning towards net-zero carbon emissions (Table 1).
Greenhouse gas emissions are classified as direct or indirect and divided into three scopes [41]:
  • Scope 1—direct GHG emissions from sources that are owned or controlled by the company.
  • Scope 2—indirect GHG emissions from the generation of purchased electricity, steam, and heat/cooling consumed by the company.
  • Scope 3—other indirect GHG emissions are a consequence of the activities of the company but occur from sources not owned or controlled by the company, i.e., along the value chain.
A review of the sustainability and climate action reporting of the largest ten global producers identifies the following common themes:
-
All producers have publicly-reported their emission reduction plans.
-
Emission reduction targets are typically to abate Scope 1 and Scope 2 emissions by ~30% by 2030, and net-zero Scope 1 and 2 emissions by 2050.
-
Industry-wide emission reduction reporting metrics remain inconsistent. Baseline emission reduction metrics vary between companies, with one or more emissions per tonne of processed ore, emissions per ounce produced, and emissions per ounce of gold-equivalent produced cited with respect to Scope 1 and 2 emissions.
-
Moves towards the analysis of, reporting on, and reduction in Scope 3 emissions are now emerging across the major gold producers but are less advanced than the focus on Scope 1 and 2 emissions.
-
Companies do not report on the benchmarking of their emission intensity relative to other gold producers.
-
Overall, we consider the climate action and reporting of the gold industry to be broadly aligned with that of global miners of other commodities.
Table 1. Emission reduction actions of major global gold mining companies.
Gold Producer
[Source]
2021 Production (Moz)Selected Emission Reduction Actions
Newmont Corp. [42]5.95
  • Renewable energy projects at Yanacocha (Peru), Boddington, and Tanami (Australia) mines.
  • Strategic alliance with Caterpillar to deploy zero-emission battery electric autonomous haulage systems.
  • Research on carbon sequestration in mine tailings.
  • Emission targets of a reduction of 32 per cent for Scope 1 and 2 emissions (2018 baseline year) and a reduction of 30 per cent for Scope 3 by 2030 (2019 baseline year). Committed to achieving net-zero carbon emissions by 2050.
Barrick Gold Corp. [43]4.46
  • Emission targets of a reduction of at least 30% for Scope 1 and 2 emissions (2018 baseline year) by 2030.
  • Long-term vision to achieve net-zero emissions by 2050.
Navoi Mining & Metallurgical [44]2.83
  • 33% reduction in atmospheric emissions in 2021 (from 2020). Total emissions comprise Nitrogen Oxides (NOx), Sulphur Oxides (Sox), CO2, particulate matter, and Volatile Organic Compounds (VOCs).
PJSC Polyus [45]2.68
  • By 2032, aim to reduce (Scopes 1 and 2) specific emissions per tonne of processed ore to 40–50% rebased to the 2020 base year by switching to 100% renewable electricity consumption.
  • Target of carbon neutrality by 2050.
AngloGold Ashanti Ltd. [46]2.47
  • 30% reduction in carbon emissions (2021 base year, Scope 1 and 2) from energy use by 2030.
  • Committed to minimising current and future climate risks and to charting a pathway to net-zero Scope 1 and Scope 2 emissions by 2050.
Gold Fields Ltd. [47]2.19
  • Reducing net Scope 1 and 2 emissions by 30% by 2030 (2016 baseline) and 100% diesel elimination by 2040.
  • Instigation in 2023 of sustainability-linked debt financing.
  • Renewable energy and battery storage projects at Australian, South African, and Peruvian gold mines.
  • Net-zero emissions by 2050.
Agnico Eagle Mines Ltd. [48]2.09
  • Carbon reduction target of 30% by 2030 (Scopes 1 and 2, 2021 base year).
  • Projects in energy efficiency, technology transition (e.g., Battery Electric Vehicles), grid renewables, and site-based renewables.
  • Net-zero by 2050 emissions target.
Kinross Gold Corp. [49]2.06
  • 30% reduction in Scope 1 and 2 emissions by 2030 (per gold-equivalent ounce) versus 2021 baseline.
  • Green energy and energy efficiency projects, including the Tasiast gold mine (Mauritania) solar plant, expected online in the second half of 2023 and 100% renewable power at La Coipa gold mine (Chile)
  • 2023 first full formal assessment of Scope 3 emission levels across all purchased goods and services, capital goods, and fuel and energy-related activities not included in Scope 1 or 2.
  • Commitment to net-zero emissions by 2050.
Newcrest Mining Ltd. [50]1.75
  • 30% reduction in greenhouse gas emission intensity per tonne of ore milled by 2030 (2018 full-year baseline).
  • Electric vehicle pilot programmes (Cadia, Australia), electric road train trial (Telfer, Australia), Hybrid Load Haul Dump trials, and battery electric truck fleet implementation at Brucejack gold mine (Canada).
  • Net-zero carbon emissions by 2050 (Scope 1 and Scope 2).
  • Scope 3 emission reporting both upstream (travel, purchased goods, upstream fuel) and downstream (smelting/refining/shipping).
  • Carbon offsets to be considered for hard-to-abate emissions.
Harmony Gold Mining Co. Ltd. [51]1.57
  • Increase in renewable energy consumption as a percentage of the total energy mix from 0% in 2021 to 20% by 2025.
  • Intent to achieve net-zero emissions by 2045.
  • Engagement with top 20 suppliers on Scope 3 emissions.

6. Empirical Analysis of Australian Gold Mining Greenhouse Gas Emissions

Gold miners continue to emit greenhouse gas emissions; however, the level of emissions is highly variable between mines (Figure 1, Table 2), with factors such as the type of mine, energy source, and grade all significant [27,38]. Underground gold mines exhibit lower emission intensity than open-pit mines (Figure 1) due to lower overall material movement [27]. Cleaner energy sources, including renewables such as solar power, drive lower relative emission intensities than mines powered by predominantly fossil fuels [27,38]. Higher-grade gold mines are associated with lower emission intensities per ounce, reflecting the mining and processing of fewer ore tonnes [38].
In Figure 1, we compile annual Scope 1 and 2 empirical emissions intensity data and production volumes from 35 Australian gold mining centres (tabulated in Table 2). Scope 3 emissions data are not included as they have not yet been routinely reported by gold mining companies.
Emissions from the Australian gold industry in 2022–2023 totalled 6.43 million tonnes, representing less than 10 per cent of the global gold industry’s annual emissions, which is estimated to exceed 100 Mt CO2-e [38]. Emission intensities cover a sixfold range from a minimum of 0.264 t CO2-e/oz at Agnew to a maximum of 1.708 t CO2-e/oz at Mt Rawdon.
Individual gold mines in Figure 1, ordered from lowest emission intensity to highest, based on the 2022–2023 emissions data, are as follows: 1. Agnew, 2. Fosterville, 3. Tanami, 4. Granny Smith, 5. St Ives, 6. Ernest Henry, 7. Jundee, 8. Mt Magnet, 9. Kalgoorlie Operations, 10. Deflector, Rothsay & Mt Monger, 11. Meekatharra Gold Operations, 12. Carosue Dam, 13. Gruyere, 14. Fortnum Gold Operations, 15. Peak, Hera & Dargues, 16. Karlawinda, 17. Gwalia, 18. Beta Hunt & Higginsville, 19. Edna May, 20. Boddington, 21. Mungari, 22. Duketon, 23. Tropicana, 24. Sunrise Dam, 25. Cue Gold Operations, 26. Tomingley, 27. Cadia, 28. King of the Hills & Darlot, 29. Cracow, 30. Thunderbox, 31. KCGM, 32. Telfer, 33. Cowal, 34. Norseman & Nicolsons, 35. Mt Rawdon. UG—underground gold mine; OP—open-pit gold mine; OP/UG—concurrent open-pit and underground mines working at the same mine site.
The width of the data bar for each mine reflects the total gold production for 2022–2023, with cumulative production (in troy ounces) of over 9 Moz per annum. The height of the data bar for each mine represents the average emission intensity for each mine. The lowest quartile (25%) by production is 0.463 t CO2-e/oz, the median (50%) by production is 0.690 t CO2-e/oz, and the third quartile (75%) by production is 0.844 t CO2-e/oz.

7. New Business Models in Gold—In-Ground Storage as Green Gold?

Societal focus on the energy transition has led to metal producers, including gold miners, reporting more extensively on the environmental footprint of their production, including greenhouse gas emission intensity per unit of production (e.g., [16]). One implicit goal is to present their businesses as taking direct action on climate change to give investors comfort that the businesses are sustainable through, and beyond, the energy transition.
Where the production of a commodity can be achieved using new production technologies and physicochemical processes that have less environmental impact than for typical industry-wide production, then the new, lower-environmental-impact, production output is often referred to as “green production”.
There is, however, generally no formal definition of what qualifies as constituting such “green production” for most commodities. Exceptions include the case of hydrogen, where the term green hydrogen is clearly defined as being obtained through the electrolysis of water, with the production process powered entirely by renewable energy [52]. Similarly, green ammonia has a clear definition [53], where combining nitrogen and hydrogen together via ammonia synthesis requires the use of entirely renewable energy.
At present, in other commodities, terms such as “green production” are more permissively used by project proponents and technology developers in marketing their environmental credentials but they nevertheless refer to those production processes that incur lower emissions than standard production technologies. Green production is also used as a broad term when recycling is the principal production process. For example, a product is deemed to be “green” if it is made from industrial waste, is non-hazardous, and is recyclable [54].
“Green production” technologies with lower emission intensities and environmental benefits over standard production processes are reported for alumina [55], aluminium [56], ammonia [53], hydrogen [52], lithium [57], nickel [58], steel [59], and tin oxide [60].
The term green gold is also now being applied to gold production that incurs a lower emission intensity. The use of the term green gold in this environmental context is not to be confused with naturally occurring, coloured gold alloys, which also include an alloy known as green gold [61].
Baur et al. [4] use the term green gold to propose an alternative business model for gold investment to mitigate the negative externalities of gold mining. Instead of digging out gold for investment purposes, the green gold business model proposes that it be left in the ground, thereby securitising the gold ounces as an in-ground asset and letting nature act as a natural vault and custodian legally protected by gold firms and the government. However, the drilling of the in-ground gold inventory to estimate the total quantity of gold present would still be required. As such, the environmental impacts of drilling are still incurred.
The green gold business model solves the gold sector paradox raised by Warren Buffett, who observed that “Gold gets dug out of the ground in Africa, or someplace. Then we melt it down, dig another hole, bury it again and pay people to stand around guarding it”. Green gold offers one solution to this paradox, albeit the details of the practical implementation of green gold as an investment product remain to be resolved.
A similar observation was made of gold mining and its role as backing for financial assets by Robin Adams [62]. Specifically, Adams opines, “Moreover, it is hard to make the case that mankind is achieving a great deal by digging up gold in places such as Africa and Latin America and then burying it in bank vaults in Dubai, London, New York, and Zurich so that it can be used as backing for investment products. (p. 13)”.
Whilst the in-ground gold asset proposed in the green gold business model clearly cannot support gold’s industrial and jewellery demand, it may have a future role to play in gold’s investment demand, facilitating zero-emission gold investments.
The following table maps the risk exposure of green gold versus other gold-linked assets, namely gold mining companies, gold exploration companies, physical gold holdings, gold-backed exchange-traded funds (ETFs) and gold royalty companies.
All gold-linked assets deliver exposure to gold prices (Table 3).
Gold mining equities are exposed to capital cost escalation risks in developing mining projects and to production risk, including the potential for escalating operating costs. As noted earlier, physical gold mining also carries environmental (and safety) risks. Gold miners also incur material corporate costs.
Gold exploration companies have no capital or operating cost exposure as they do not produce gold. However, gold exploration companies do have exposure to the gold price, rising and falling in equity value as the gold price fluctuates, and gold exploration companies also incur significant corporate costs to pursue their ongoing exploration activities. Gold explorers have no significant environmental impact apart from their drilling activities, as they do not undertake gold mining.
In the case of physical gold holdings, whilst the fact that the gold has already been mined mitigates both capital cost and operating cost exposure, as a mined product, physical gold still carries a legacy environmental impact. The same holds true for exchange-traded funds (ETFs) backed by physical gold. Gold ETFs are based on securely stored physical gold and provide investors with financial claims, i.e., shares, in the gold.
Gold royalty equities, which provide development funding to gold miners in return for a production royalty, carry different risk exposures than gold mining companies (e.g., [3]). Whilst holding a royalty asset—such as a net smelter return royalty [63]—over an operating gold mine mitigates both capital cost and operating cost exposure, there remains the “see-through” environmental impacts from mining to the royalty company, for example from the (Scope 3) greenhouse gas emissions of the mine operator. Royalty companies also incur corporate costs.
Green gold, as an in-ground sustainable asset, retains exposure to the gold price [5] but does not incur any capital cost, operating cost, or environmental cost (Table 3). As a potential new asset class, therefore, green gold is differentiated from existing gold-related investments. Suitably ring-fenced as a fixed asset, green gold would also not incur a significant risk of corporate cost escalation (Table 3).

8. Summary, Conclusions and Future Research

Gold is likely to remain a key commodity because of its industrial and fabrication uses and for its investment uses as a risk diversifier and safe-haven asset. However, the gold industry is rapidly changing, aiming to reduce its environmental impact as the energy transition progresses. Key takeaways as to the emerging changes to the gold sector are as follows:
-
Gold only has a minor role to play in terms of new uses in emerging technologies linked to the energy transition.
-
Gold is mined in many countries, including many developing countries, placing the gold industry in a situation where the energy transition will inevitably affect the gold industry, and gold mining companies are embracing the energy transition.
-
The provision of renewable energy infrastructure to power gold mining and processing operations may act to bring forward the broader adoption of green energy solutions in those regions in which gold mining is undertaken. Gold, thus, has a unique but indirect role to play in facilitating the transition to net-zero emissions.
-
Considerable potential exists to lower the environmental footprint of gold mining, including the reduction in carbon emissions from energy consumption and in mining and processing, for example through fleet electrification.
-
Gold mining companies are already responding to the opportunity to lower their emissions. The major global gold miners have all committed to emission reduction plans and have commenced emission abatements. Typical targets include a 30% reduction in Scope 1 and 2 emissions by 2030 and net-zero emissions, again across Scopes 1 and 2, by 2050.
-
“Green production” is an emerging trend across many metals; however, in many cases, it lacks a formal definition.
-
New zero-emission business models may emerge whereby “green gold”, as a new class of investment asset, is not actually mined but stored in the ground in perpetuity in a natural “vault”.
-
The market value of such green gold, using in-ground unmined gold resources owned by exploration companies, has been shown to track the gold price. Investors in gold who are conscious of the negative environmental externalities of gold mining can, thus, potentially gain exposure to the gold price without the need for the gold mining of the in-ground assets to take place.
Future research could track the progress of the global gold industry in lowering emission intensities and document the efficacy of clean production interventions by gold mining companies.

Author Contributions

Conceptualization, A.T.; Formal analysis, A.T. and S.U.; Writing—original draft, A.T.; Writing—review & editing, D.B., S.U. and J.P.S. All authors have read and agreed to the published version of the manuscript.

Funding

This research received no external funding.

Informed Consent Statement

Not applicable.

Conflicts of Interest

The authors declare no conflict of interest.

References

  1. Bernstein, P.L. The Power of Gold: The History of an Obsession; John Wiley & Sons: Hoboken, NJ, USA, 2012; 448p. [Google Scholar]
  2. International Energy Authority (IEA). Final List of Critical Minerals. 2022. Available online: https://www.iea.org/policies/15271-final-list-of-critical-minerals-2022 (accessed on 24 March 2024).
  3. Schodde, R.C. Long term trends in gold exploration. In Proceedings of the NewGenGold Conference, Perth, Australia, 12–13 November 2019. [Google Scholar]
  4. Silver, D. Rise of Mining Royalty Companies; Society for Mining, Metallurgy & Exploration: Englewood, CO, USA, 2023; 232p. [Google Scholar]
  5. Baur, D.G.; Trench, A.; Ulrich, S. Green gold. J. Sustain. Financ. Invest. 2021, 13, 1200–1227. [Google Scholar] [CrossRef]
  6. World Gold Council. Global Mine Production. 2023. Available online: https://www.gold.org/goldhub/data/gold-production-by-country (accessed on 24 March 2024).
  7. S&P Global. Top Producing Companies: Gold. 2023. Available online: https://www.capitaliq.spglobal.com/web/client?auth=inherit#industry/topProducingCompanies (accessed on 24 March 2024).
  8. S&P Global. Gold Prices. 2023. Available online: https://www.capitaliq.spglobal.com/web/client?auth=inherit#industry/priceChart (accessed on 24 March 2024).
  9. Phillips, G.N.; Powell, R. A practical classification of gold deposits, with a theoretical basis. Ore Geol. Rev. 2015, 65, 568–573. [Google Scholar] [CrossRef]
  10. Ulrich, S.; Kanakis, M.; Groves, D.; Hagemann, S.; Sykes, J.; Trench, A. Is grade king in gold? A preliminary analysis of gold production costs at Australian and New Zealand mines. In Proceedings of the 49th New Zealand Branch Annual Conference on Exploration, Mining and New Zealand’s Mineral Resources, Wellington, New Zealand, 3–6 September 2016; Australian Institute of Mining & Metallurgy (AusIMM): Auckland, New Zealand, 2017; pp. 438–453. [Google Scholar]
  11. World Gold Council. Publication of the World Gold Council’s Guidance Note on Non-GAAP Metrics—All-In Sustaining Costs and All-In Costs. World Gold Council, 2013. 4p. Available online: https://www.gold.org/download/file/3180/guidance_on_all_in_costs_pr.pdf (accessed on 24 March 2024).
  12. Gianfrate, G. All that glitters: Gold mining companies’ market reaction at the issuance of the “All-in Sustaining Costs” guidance. J. Account. Public Policy 2017, 36, 468–476. [Google Scholar] [CrossRef]
  13. Ulrich, S. Australian & New Zealand Gold Operations. March Quarter 2023. 6p. Available online: https://www.aurumanalytics.com.au/pdf/2023_Q1_Aurum_Analytics_Quarterly_Gold_Report_Final.pdf (accessed on 24 March 2024).
  14. Ulrich, S.; Trench, A.; Hagemann, S. Grade-cost relationships within Australian underground gold mines—A 2014–2017 empirical study and potential value implications. Resour. Policy 2019, 61, 29–48. [Google Scholar] [CrossRef]
  15. Laker, M.C. Environmental Impacts of Gold Mining—With Special Reference to South Africa. Mining 2023, 3, 205–220. [Google Scholar] [CrossRef]
  16. Kumah, A. Sustainability and gold mining in the developing world. J. Clean. Prod. 2006, 14, 315–323. [Google Scholar] [CrossRef]
  17. Mudd, G.M. Global trends in gold mining: Towards quantifying environmental and resource sustainability. Resour. Policy 2007, 32, 42–56. [Google Scholar] [CrossRef]
  18. Mudd, G.M. The Environmental sustainability of mining in Australia: Key megatrends and looming constraints. Resour. Policy 2010, 35, 98–115. [Google Scholar] [CrossRef]
  19. Finnie, B.; Stuart, J.; Gibson, L.; Zabriskie, F. Balancing environmental and industry sustainability: A case study of the US gold mining industry. J. Environ. Manag. 2009, 90, 3690–3699. [Google Scholar] [CrossRef]
  20. Ouoba, Y. Economic sustainability of the gold mining industry in Burkina Faso. Resour. Policy 2017, 51, 194–203. [Google Scholar] [CrossRef]
  21. Amegbey, N.A.; Adimado, A.A. Incidents of cyanide spillage in Ghana. Miner. Process. Extr. Metall. 2003, 112, 126–130. [Google Scholar] [CrossRef]
  22. Eisler, R. Health risks of gold miners: A synoptic review. Environ. Geochem. Health 2003, 25, 325–345. [Google Scholar] [CrossRef] [PubMed]
  23. Aragon, F.M.; Rud, J.P. Natural Resources and Local Communities: Evidence from a Peruvian Gold Mine. Am. Econ. J. Econ. Policy 2013, 5, 1–25. [Google Scholar] [CrossRef]
  24. Pereira, V.; Tuffour, J.; Patnaik, S.; Temouri, Y.; Malik, A.; Singh, S.K. The quest for CSR: Mapping responsible and irresponsible practices in an intra-organizational context in Ghana’s gold mining industry. J. Bus. Res. 2021, 135, 268–281. [Google Scholar] [CrossRef]
  25. Bloch, R.; Owusu, G. Linkages in Ghana’s gold mining industry: Challenging the enclave thesis. Resour. Policy 2012, 37, 434–442. [Google Scholar] [CrossRef]
  26. Tuokuu, F.X.D.; Gruber, J.S.; Idemudia, U.; Kayira, J. Challenges and opportunities of environmental policy implementation: Empirical evidence from Ghana’s gold mining sector. Resour. Policy 2018, 59, 435–445. [Google Scholar] [CrossRef]
  27. Ulrich, S.; Trench, A.; Hagemann, S. Greenhouse Gas Emissions and Production Cost Footprints in Australian Gold Mines. J. Clean. Prod. 2020, 267, 122118. [Google Scholar] [CrossRef]
  28. World Gold Council. Gold’s Role in a Low-Carbon Economy. 2019. Available online: https://www.gold.org/goldhub/research/gold-investor/gold-investor-february-2019/13644 (accessed on 24 March 2024).
  29. Cameron, D.; Holliday, R.; Thompson, D. Gold’s future role in fuel cell systems. J. Power Sources 2003, 118, 298–303. [Google Scholar] [CrossRef]
  30. Qwabe, L.Q.; Dasireddy, V.; Singh, S.; Friedrich, H.B. Preferential CO oxidation in a hydrogen-rich stream over gold supported on Ni–Fe mixed metal oxides for fuel cell applications. Int. J. Hydrogen Energy 2016, 41, 2144–2153. [Google Scholar] [CrossRef]
  31. Bagherzadeh-Khajehmarjan, E.; Shakouri, S.M.; Nikniazi, A.; Ahmadi-Kandjani, S. Boosting the efficiency of luminescent solar concentrator devices based on CH3NH3PbBr3 perovskite quantum dots via geometrical parameter engineering and plasmonic coupling. Org. Electron. 2022, 109, 106629. [Google Scholar] [CrossRef]
  32. Evarts, E.C. Lithium batteries: To the limits of lithium. Nature 2015, 526, 93–95. [Google Scholar] [CrossRef] [PubMed]
  33. Graedel, T.E.; Miatto, A.U.S. Cobalt: A Cycle of Diverse and Important Uses. Resour. Conserv. Recycl. 2022, 184, 106441. [Google Scholar] [CrossRef]
  34. Lu, W.; Li, X.; Zhang, H. The next generation vanadium flow batteries with high power density—A perspective. Phys. Chem. Chem. Phys. 2018, 20, 23–35. [Google Scholar] [CrossRef] [PubMed]
  35. Heijlen, W.; Franceschi, G.; Duhayon, C.; Van Nijen, K. Assessing the adequacy of the global land-based mine development pipeline in the light of future high-demand scenarios: The case of the battery-metals nickel (Ni) and cobalt (Co). Resour. Policy 2021, 73, 102202. [Google Scholar] [CrossRef]
  36. Trench, A.; Sykes, J.P. Rare Earth Permanent Magnets and Their Place in the Future Economy. Engineering 2020, 6, 115–118. [Google Scholar] [CrossRef]
  37. Fremstad, A.; Paul, M. The impact of a carbon tax on inequality. Ecol. Econ. 2019, 163, 88–97. [Google Scholar] [CrossRef]
  38. Ulrich, S.; Trench, A.; Hagemann, S. Gold mining greenhouse gas emissions, abatement measures, and the impact of a carbon price. J. Clean. Prod. 2022, 340, 130851. [Google Scholar] [CrossRef]
  39. Elberry, A.M.; Thakur, J.; Veysey, J. Seasonal hydrogen storage for sustainable renewable energy integration in the electricity sector: A case study of Finland. J. Energy Storage 2021, 44, 103474. [Google Scholar] [CrossRef]
  40. Akinbami, O.M.; Oke, S.R.; Bodunrin, M.O. The state of renewable energy development in South Africa: An overview. Alex. Eng. J. 2021, 60, 5077–5093. [Google Scholar] [CrossRef]
  41. World Resources Institute (WRI); World Business Council for Sustainable Development (WBCSD). The Greenhouse Gas Protocol: A Corporate Accounting and Reporting Standard (Revised Edition). World Resources Institute and World Business Council for Sustainable Development, 2004. 116p. Available online: https://ghgprotocol.org/sites/default/files/standards/ghg-protocol-revised.pdf (accessed on 24 March 2024).
  42. Newmont Corporation. Climate Report. 2022. 69p. Available online: https://s24.q4cdn.com/382246808/files/doc_downloads/2023/05/Newmont-2022-Climate-Report.pdf (accessed on 24 March 2024).
  43. Barrick Sustainability Report. 2022. 116p. Available online: https://s25.q4cdn.com/322814910/files/doc_downloads/sustainability/Barrick_Sustainability_Report_2022.pdf (accessed on 24 March 2024).
  44. Navoi Mining and Metallurgical Combinat JSC. Sustainability Report. 2021. 97p. Available online: https://www.ngmk.uz/uploads/photo/about-ngmk/infos/2021%20GRI%20en.pdf (accessed on 24 March 2024).
  45. Polyus Climate Strategy. 2022. 16p. Available online: https://polyus.com/en/investors/presentations/ (accessed on 24 March 2024).
  46. AngloGoldAshanti. Roadmap to Net Zero. Our Strategy to Reduce Carbon Emissions—2030 Targets. 12 October 2022. 17p. Available online: https://www.anglogoldashanti.com/sustainability/environment/energy-climate-change/ (accessed on 24 March 2024).
  47. Gold Fields Limited. Climate Change Report. 2022. 36p. Available online: https://www.goldfields.com/pdf/investors/integrated-annual-reports/2022/ccr-2022-report.pdf (accessed on 24 March 2024).
  48. Agnico Eagle. Climate Action Report. 2022. 31p. Available online: https://s21.q4cdn.com/374334112/files/doc_downloads/Sustainability/Climate-Action-/AgnicoEagle_ClimateChangeActionReport_Final.pdf (accessed on 24 March 2024).
  49. Kinross Gold Corporation. Sustainability and ESG Report. 2022. 173p. Available online: https://s2.q4cdn.com/496390694/files/doc_downloads/2023/ESG/updated/Kinross-2022-Sustainability-and-ESG-Report.pdf (accessed on 24 March 2024).
  50. Newcrest Mining Limited. 2022 Sustainability Report. November 2022. 108p. Available online: https://www.newcrest.com/sites/default/files/2022-11/221107_Newcrest%202022%20Sustainability%20Report_0.pdf (accessed on 24 March 2024).
  51. Harmony Gold Mining. ESG Report. 2022. 95p. Available online: https://www.har.co.za/22/download/HAR-ESG22.pdf (accessed on 24 March 2024).
  52. Wappler, M.; Unguder, D.; Lu, X.; Ohlmeyer, H.; Teschke, H.; Lueke, W. Building the green hydrogen market—Current state and outlook on green hydrogen demand and electrolyzer manufacturing. Int. J. Hydrogen Energy 2022, 47, 33551–33570. [Google Scholar] [CrossRef]
  53. Smart, K. Review of Recent Progress in Green Ammonia Synthesis: Decarbonisation of fertiliser and fuels via green synthesis. Johns. Matthey Technol. Rev. 2022, 66, 230–244. [Google Scholar] [CrossRef]
  54. Gabaldón-Estevan, D.; Criado, E.; Monfort, E. The green factor in European manufacturing: A case study of the Spanish ceramic tile industry. J. Clean. Prod. 2014, 70, 242–250. [Google Scholar] [CrossRef]
  55. Zhou, G.-T.; Wang, Y.-L.; Qi, T.-G.; Zhou, Q.-S.; Liu, G.-H.; Peng, Z.-H.; Li, X.-B. Toward sustainable green alumina production: A critical review on process discharge reduction from gibbsitic bauxite and large-scale applications of red mud. J. Environ. Chem. Eng. 2023, 11, 109433. [Google Scholar] [CrossRef]
  56. Mahmood, A.A.; Hossain, R.; Sahajwalla, V. Investigation of the effect of laminated polymers in the metallic packaging materials on the recycling of aluminum by thermal disengagement technology (TDT). J. Clean. Prod. 2020, 274, 122541. [Google Scholar] [CrossRef]
  57. Jin, C.; Nai, J.; Sheng, O.; Yuan, H.; Zhang, W.; Tao, W.; Lou, X.W. Biomass-based materials for green lithium secondary batteries. Energy Environ. Sci. 2021, 14, 1326–1379. [Google Scholar] [CrossRef]
  58. Tang, D.; Yin, H.; Cheng, X.; Xiao, W.; Wang, D. Green production of nickel powder by electroreduction of NiO in molten Na2CO3-K2CO3. Int. J. Hydrogen Energy 2016, 41, 18699–18705. [Google Scholar] [CrossRef]
  59. Muslemani, H.; Liang, X.; Kaesehage, K.; Ascui, F.; Wilson, J. Opportunities and challenges for decarbonizing steel production by creating markets for ‘green steel’ products. J. Clean. Prod. 2021, 315, 128127. [Google Scholar] [CrossRef]
  60. Elango, G.; Kumaran, S.M.; Kumar, S.S.; Muthuraja, S.; Roopan, S.M. Green synthesis of SnO2 nanoparticles and its photocatalytic activity of phenolsulfonphthalein dye. Spectrochim. Acta Part A Mol. Biomol. Spectrosc. 2015, 145, 176–180. [Google Scholar] [CrossRef] [PubMed]
  61. Crasto, D.; Dass, A. Green Gold: Au30(S-t-C4H9)18 Molecules. J. Phys. Chem. 2013, 117, 22094–22097. [Google Scholar] [CrossRef]
  62. Adams, R.G. Modern Management in the Global Mining Industry, 1st ed.; Emerald Publishing Limited: Bingley, UK, 2019. [Google Scholar]
  63. Harries, K.J.C. Mining Royalty Agreements Between Private Parties: The Relationship Between Payor and Recipient. J. Energy Nat. Resour. Law 1996, 14, 354–381. [Google Scholar] [CrossRef]
Figure 1. Emission intensity from gold mines in 2022–2023.
Sustainability 16 05951 g001
Table 2. Emission intensity and annual gold production of Australian gold mines. UG—underground gold mine; OP—open-pit gold mine; OP/UG—concurrent open-pit and underground mines working at the same mine site. All production and emissions data are sourced from company reports (data current as of 29 February 2024).
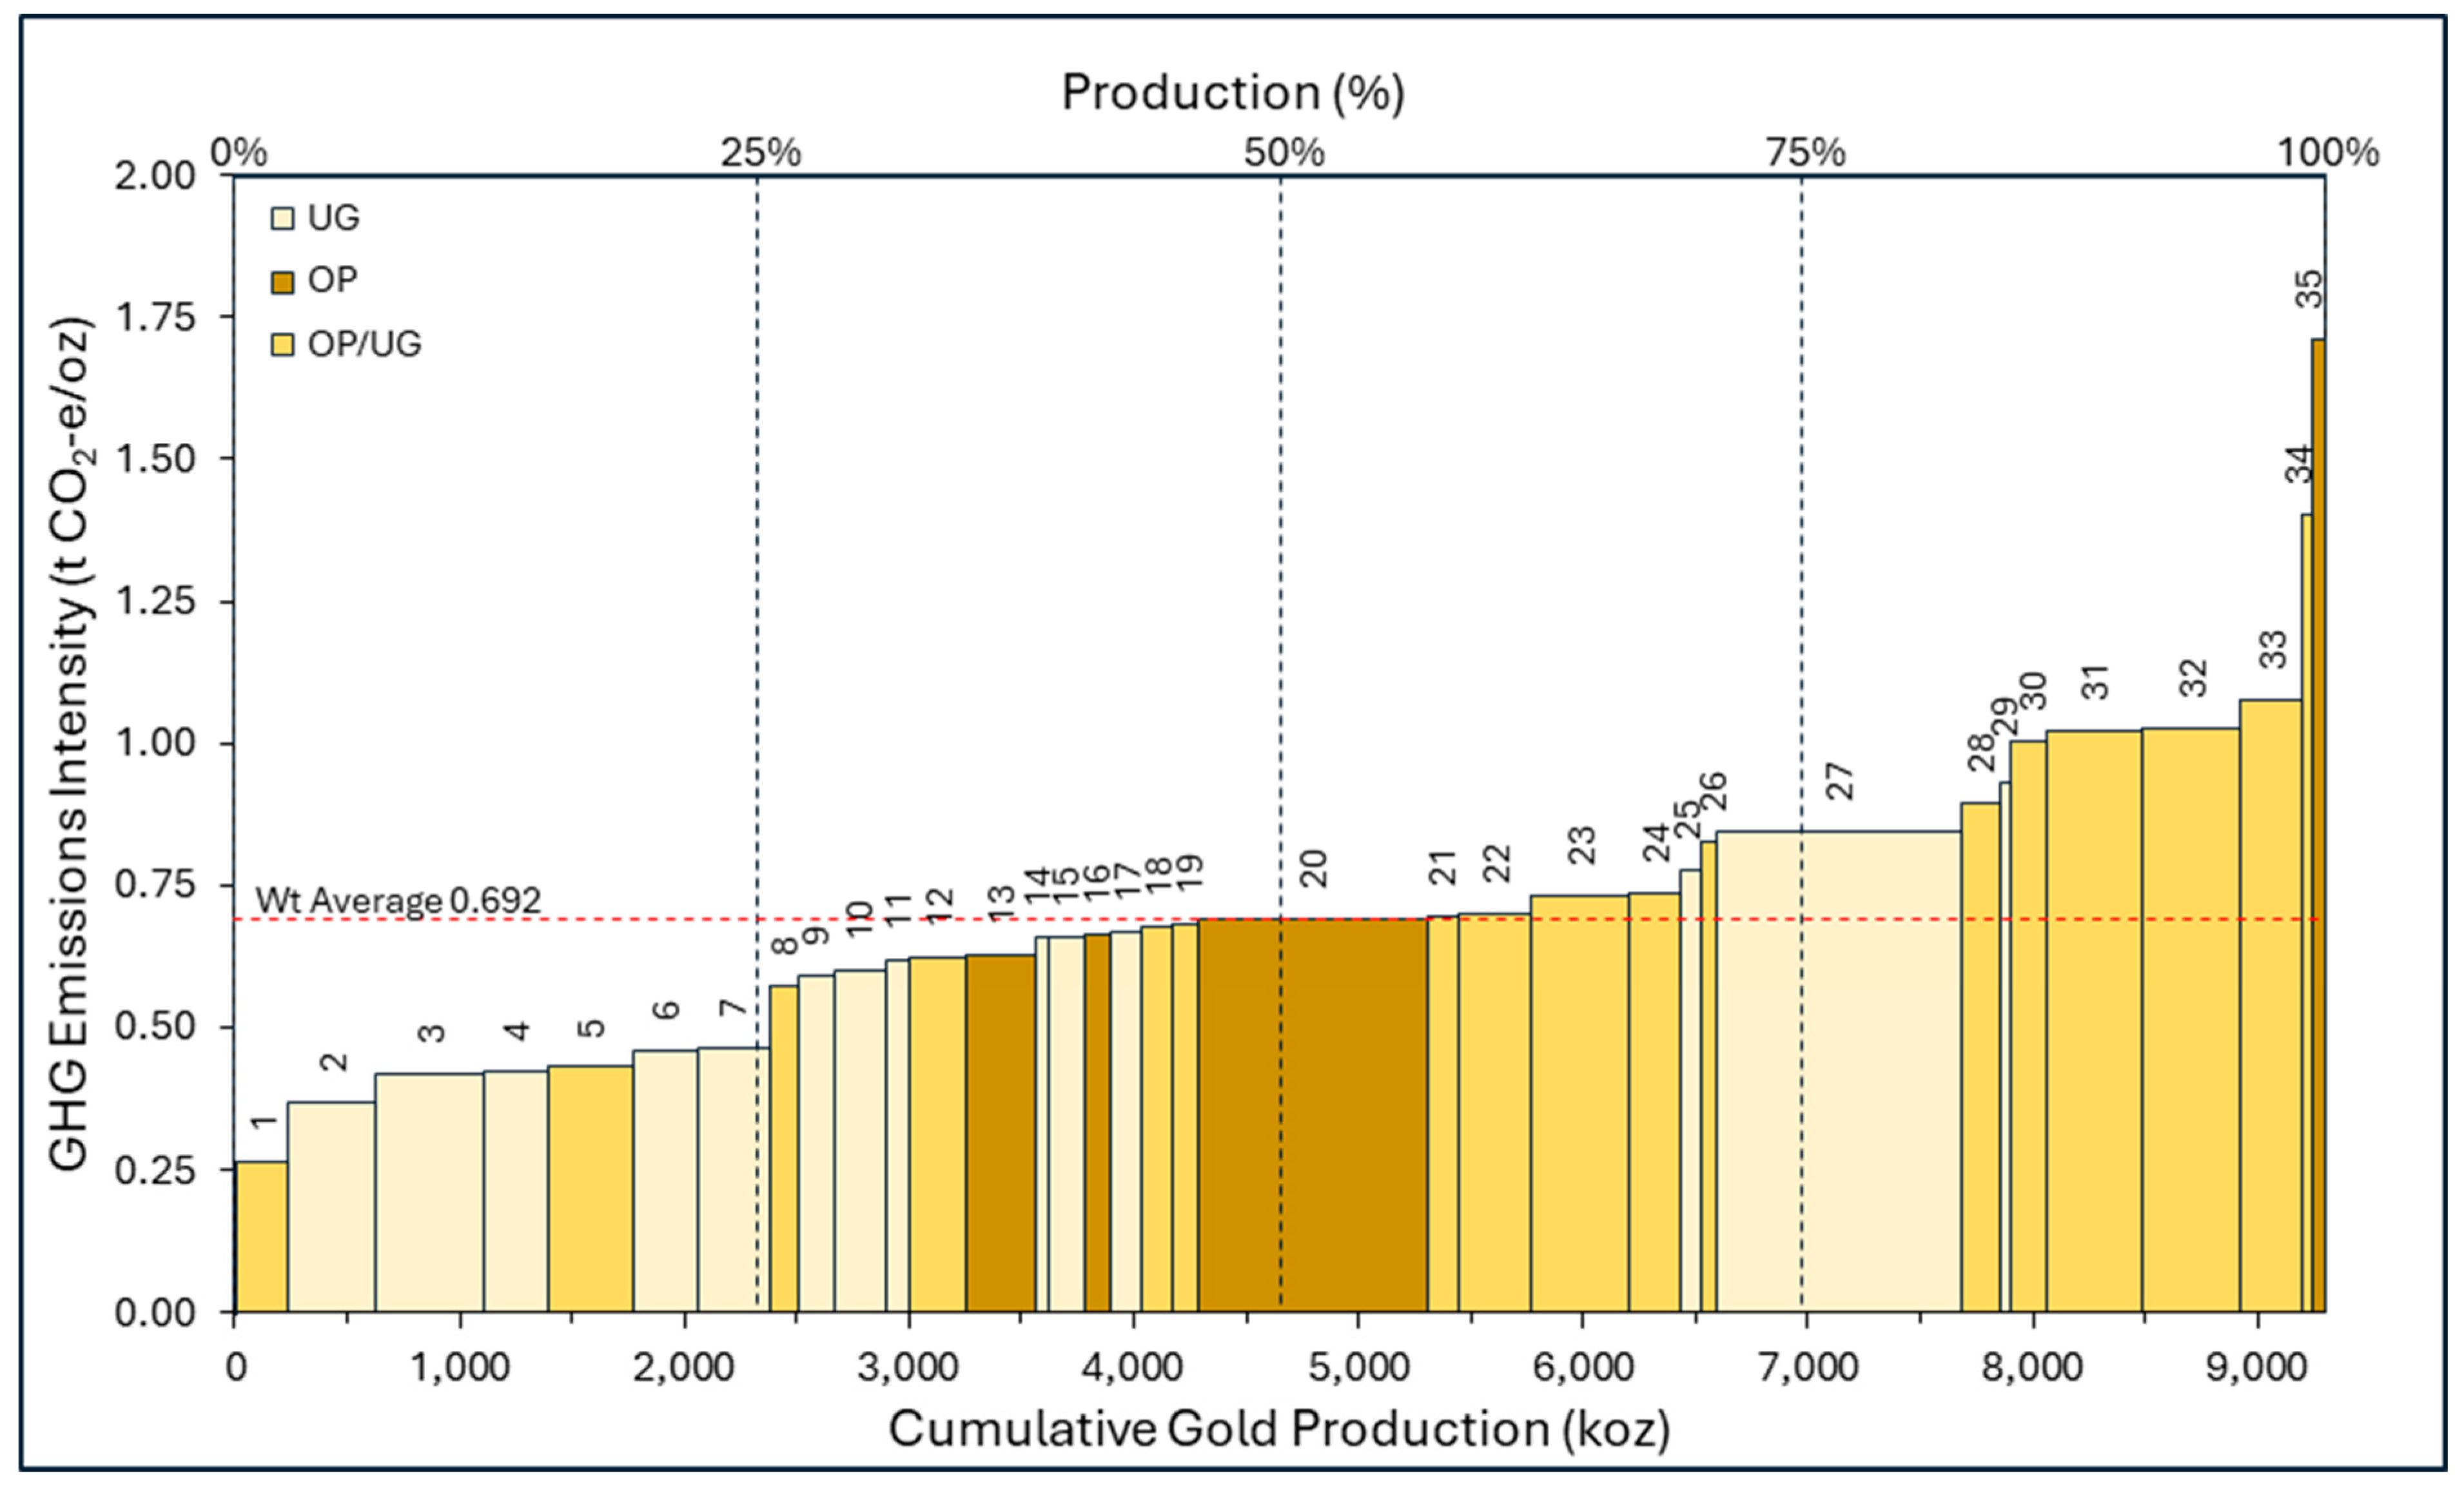
Rank
(Lowest to Highest Emissions Intensity)
Gold Mining CentreGHG Emissions Intensity
(CO2-e/oz)
Au Produced koz Mine Type
1Agnew0.26 239.0 OP/UG
2Fosterville0.37 384.7 UG
3Tanami0.42 484.0 UG
4Granny Smith0.42 288.0 UG
5St Ives0.43 377.0 OP/UG
6Ernest Henry0.46 283.6 UG
7Jundee0.46 320.2 UG
8Mt Magnet0.57 127.9 OP/UG
9Kalgoorlie Operations0.59 161.2 UG
10Deflector, Rothsay & Mt Monger0.60 228.5 UG
11Meekatharra Gold Operations0.62 112.6 UG
12Carosue Dam0.62 243.2 OP/UG
13Gruyere0.63 315.0 OP
14Fortnum Gold Operations0.66 53.7 UG
15Peak, Hera & Dargues0.66 158.3 UG
16Karlawinda0.66 120.0 OP
17Gwalia0.67 138.1 UG
18Beta Hunt & Higginsville0.67 133.9 OP/UG
19Edna May0.68 113.1 OP/UG
20Boddington0.69 1025.0 OP
21Mungari0.70 135.6 OP/UG
22Duketon0.70 327.3 OP/UG
23Tropicana0.73 437.0 OP/UG
24Sunrise Dam0.74 232.0 OP/UG
25Cue Gold Operations0.78 82.7 UG
26Tomingley0.83 70.3 OP/UG
27Cadia0.84 1096.4 UG
28King of the Hills & Darlot0.90 162.9 OP/UG
29Cracow0.93 48.2 UG
30Thunderbox1.00 159.8 OP/UG
31KCGM1.02 432.2 OP/UG
32Telfer1.03 433.6 OP/UG
33Cowal1.08 276.3 OP/UG
34Norseman & Nicolsons1.40 47.9 OP/UG
35Mt Rawdon1.71 53.7 OP
Table 3. Risk exposures of gold assets.
ExposureGold Mining Gold Exploration Physical
Gold
Gold ETFsGold Royalty Green Gold
Gold price
Capital costsXXXXX
Operating costsXXXXX
Corporate costsXXX
Environmental impactXX
Disclaimer/Publisher’s Note: The statements, opinions and data contained in all publications are solely those of the individual author(s) and contributor(s) and not of MDPI and/or the editor(s). MDPI and/or the editor(s) disclaim responsibility for any injury to people or property resulting from any ideas, methods, instructions or products referred to in the content.

