Abstract
Road–rail intermodal transportation (RRIT) leverages the advantages of multiple transport modes and is crucial for addressing the current issue of imbalanced development in the transportation sector. However, passengers’ behavior in choosing RRIT remains unclear, and it is necessary to optimize travel service quality through analyzing RRIT choice behavior based on user perceptions. This study designed a stated preference experiment that included both direct and multi-modal travel options. A hybrid choice model considering attitude variables was constructed, and four latent attitude variables—convenience, economy, comfort, and riskiness—were extracted to analyze their impact on intercity travel mode choice behavior under conditions of ticket booking uncertainty. The results revealed that the ticket booking success rate is a critical factor in travelers’ decision-making. Passengers tend to choose travel options with higher ticket booking success rates, even if it entails a slight increase in the ticket prices for the high-speed rail to high-speed rail transfer option. The attitude variables significantly influence intercity travel mode choice behavior, with travelers generally exhibiting a preference for risk avoidance in their travel options. Moreover, there are differences among various groups of travelers in their preferences and demands for the convenience, economy, and comfort aspects of travel options. These research findings can enhance our understanding of the key factors influencing the selection of RRIT services, thereby supporting RRIT designers and planners in improving service quality and facilitating the future growth of RRIT.
1. Introduction
The integration of intercity bus transportation with railway transportation in intercity travel, known as road–rail intermodal transportation (RRIT), leverages the advantages of both modes to optimize the utilization of transportation resources, enhance transportation efficiency, reduce congestion, and lower energy consumption, thereby achieving transportation sustainability [1,2]. However, due to the complexity of RRIT, passengers often face various risks and uncertainties during travel, such as the uncertainty of ticket availability, the feasibility and comfort of their travel options, and other factors [1,3]. Analyzing their travel mode choice behavior with a consideration of attitude variables under uncertainty conditions can provide a more comprehensive understanding of passengers’ decision-making behaviors and attitude preferences, which is instrumental in improving road–rail intermodal services and promoting sustainability in transportation development.
With the rapid development of high-speed rails (HSRs), traditional intercity bus transportation has faced significant competition and experienced a substantial decline in passenger ridership [4,5]. Many studies have utilized ridership data to analyze users’ travel preferences [6,7,8]. However, during weekends and holidays, especially in peak periods of intercity travel, the demand for direct travel does not align with the transportation capacity of direct travel options, leading to the problem of “ticket scarcity” for passengers [9]. RRIT, due to its flexibility and the convenience of booking for intercity bus travel, becomes an optimal alternative to direct travel [10,11]. Currently, research on public-road–rail combined travel focuses more on network-based path planning, while the factors influencing passengers’ choices of different combined travel options remain unclear [12,13].
Additionally, during peak travel periods, direct travel options often run out of tickets, and it is not clear whether this uncertainty in ticket availability is a key reason for users to choose combined travel. Therefore, uncertainty scenarios have been a significant focus in the research on multi-modal transportation systems [14,15,16]. For instance, Yang et al. addressed the problem of fuzzy public road–rail combined path planning by adopting a risk value criterion in formulating an anti-optimization function for travel time [17]. However, most existing studies analyze the impact of time or cost uncertainty on combined travel options from a network vulnerability perspective, with limited research from the perspective of passengers’ perception and choice behavior [18].
Moreover, numerous studies have confirmed that attitude plays a crucial role in influencing travel behavior [19,20,21]. Some research has incorporated attitudes to study the impact of environmental awareness and sustainable development issues [22,23]. Furthermore, attitudes have been widely used to investigate the effects of certain policy measures or infrastructure implementations, considering both intention and its relationship to behavior. However, the influence of attitude variables on mode choice behavior in multi-modal transportation is still relatively underexplored.
In this study, we focus on the influence of passenger attitudes on intercity travel mode choice behavior under uncertain ticket availability conditions. By constructing an HCM that considers latent attitude variables, we analyze how passengers’ attitudes towards different aspects of combined travel influence their mode choice behavior for intercity travel.
The rest of this paper is structured as follows: Section 2 describes the experimental design and data collection. Section 3 introduces the applied methods, including K-Means clustering and an HCM. Section 4 presents the model results and discussion. Section 5 concludes this study and presents future prospects.
2. Literature Review
RRIT refers to a single transport chain that combines road transport (typically long-distance buses) with rail transport (such as trains or high-speed rail) [24]. This integration leverages the strengths of both transportation modes to offer an efficient and convenient intercity travel service that provides seamless “door-to-door” connectivity, which is difficult to achieve with a single mode of transport. By utilizing the advantages of both road and rail transportation, RRIT achieves more efficient and convenient intercity travel [24,25,26].
Existing research on RRIT primarily focuses on policy support, intermodal service network design, and intermodal route planning [27]. Bruno analyzed the impact of transportation policies on rail–road intermodal freight competitiveness and on environmental and economic performance [28]. Cathy analyzed the impact of transport policies on road congestion, environmental concerns, and traffic safety during multimodal travel [29]. Wang proposed a global optimization algorithm and a nonlinear optimization algorithm to study the discrete intermodal network design problem of freight transportation [30]. Liu proposed an intermodal transportation network considering freight consolidation through freight forwarders’ cooperation using a hybrid genetic algorithm (GA) and particle swarm optimization (PSO) [31]. Sun established a fuzzy mixed-integer nonlinear programming model and utilized sensitivity analysis and fuzzy simulation to analyze the impact of time uncertainty on road–rail intermodal routing optimization [32]. However, these studies mainly focus on the freight sector, with relatively few addressing passenger transport in RRIT.
Road–rail intermodal passenger transport is commonly applied in the following scenarios (a) cities with high demand and low supply, (b) holidays and peak periods, and (c) new mobility models. In urban settings characterized by limited transportation options or significant disparities between modal choices, the ticket booking success rate aids travelers in making informed decisions, thereby optimizing their utilization of the available transport resources [33,34,35,36]. During peak travel periods such as holidays, the demand for advance ticket reservations escalates. The ticket booking success rate informs travelers of their likelihood of securing tickets, facilitating more effective travel planning [37,38]. In emerging mobility paradigms like Mobility as a Service (MaaS)-integrated platforms, the ticket booking success rate serves as a service feature enhancing user experience and satisfaction [39,40]. Users can select optimal travel options based on the probability of securing tickets successfully.
Meanwhile, in uncertain scenarios such as ticket scarcity in direct travel, the probability of users opting for multimodal travel may increase, making uncertainty scenarios a focal point in the study of multimodal transportation systems [41,42,43]. The ticket booking success rate serves as a crucial indicator reflecting uncertainty scenarios. The ticket booking success rate refers to the proportion of passengers successfully purchasing tickets for their desired mode of travel (such as train tickets or long-distance bus tickets) within a specific time period. This indicator reflects the current ticket purchasing status of users through the prediction of historical data. However, it does not reflect the waiting time required to successfully purchase tickets. Two approaches are typically used to estimate this rate: (a) Estimating the probability of purchasing tickets based on historical data on refunds and ticket changes when tickets are already sold out. (b) Estimating the probability of purchasing tickets when ticket sales have not yet begun based on historical ticket purchase patterns during the same period. However, research on combined ticketing primarily focuses on the impact of ticketing values on sustainable travel [44,45]; there is currently a lack of relevant research on the impact of ticket booking success rates on choice behaviors towards RRIT.
The reviews of studies on RRIT indicate that the literature is relatively limited and primarily focuses on freight research. Thus, we identify the research gap considered in this study as follows: (1) There is currently limited research on intermodal passenger transport combining rail and public transit, necessitating a further analysis of choice behavior to optimize transport services. (2) Uncertainty scenarios have become a significant focus in the study of multimodal transportation systems, where factors such as ticket booking success rates may influence users’ decisions to choose intermodal options; however, relevant research in this area is currently lacking.
3. Data Collection
3.1. Experimental Design
The objective of this study is to analyze travelers’ choice behavior regarding RRIT under conditions of risk. To achieve this goal, we initially utilized historical booking data from the “Bus Butler” https://www.chebada.com/ (accessed on 10 July 2024) ticket platform for the third quarter of 2020 to calculate travelers’ selection ratios for RRIT, as detailed in Table 1. Based on these statistical findings, we identified six intercity travel options for investigation, comprising three direct routes (direct high-speed rail, direct intercity bus, and direct train) and three intermodal routes (high-speed rail transfer to high-speed rail, high-speed rail transfer to bus, and train transfer to bus).

Table 1.
Traveler’s selection ratio for RRIT from “Bus Butler”.
This study specifically focuses on intercity travel scenarios characterized by uncertain ticket booking success rates. To explore the impact of risk attitudes on travelers’ choice behavior among these intercity travel modes under ticketing uncertainty, we conducted stated preference (SP) experiments for each of the six travel options. The SP experiments were designed to incorporate relevant attitude-related questions into the questionnaire. Additionally, data collection encompassed users’ historical travel behavior, socio-demographic profiles, and their risk approach. The web-based questionnaire was structured into three main sections: historical travel behavior, SP experiments on intercity travel mode choices, and personal information and risk attitudes.
The attributes of these travel options represent the factors directly considered by travelers when making decisions. These attributes include ticket price, travel duration, and risk factors, among others. For travel options involving transfers, the convenience and duration of transfers also significantly influence travelers’ decisions. Therefore, this study selected travel duration, transfer time, ticket price, and ticket booking success rate as the attribute variables of the travel options. The levels of each attribute were determined based on the specific characteristics of the different travel modes, as shown in Table 2.
Table 2.
Attributes and attribute level considered in the choice experiment.
The final selection for this study comprises a design that includes 18 scenarios. The D-efficient design was generated using Ngene 1.3, a software tool for creating experimental designs. The D-error value is 0.675. Figure 1 illustrates an example choice task presented to a respondent.
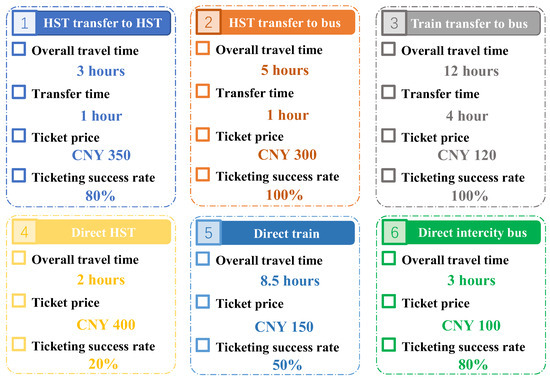
Figure 1.
Screenshot of a stated choice experiment.
3.2. Data Collection and Sample Characteristics
The survey was administered in the form of an online questionnaire through a web-based platform, facilitated by the “Bus Butler 8.0.0” mobile application, a ticketing service software, during the period from January to February 2023 in China. A total of 600 online questionnaires were distributed, and after excluding surveys with invalid data, 541 valid samples remained. Each respondent answered six scenarios, resulting in a total of 3246 valid responses. Table 3 provides an overview of the socio-economic characteristics of the respondents.
Table 3.
The socio-economic characteristics of the respondents (N = 541).
In this survey, a Likert scale was utilized to assess travelers’ attitude variables. Each respondent rated attitude-related questions on a scale ranging from 1 (not at all concerned) to 5 (extremely concerned). The statistical analysis of the survey results for the attitude variables is presented in Table 4.
Table 4.
Attitude indicators and their distributions in the sample (N = 541).
4. Methodology
In order to study the travel mode choice behavior of travelers with different travel characteristics regarding RRIT, we first employed clustering methods to classify the survey participants. Subsequently, we utilized a hybrid choice model that takes into account attitude variables to analyze the influence of latent attitude factors on mode choice behavior.
4.1. Classifying Travelers Based on K-Means
In this study, based on the survey results, we selected basic personal information features such as age, monthly income, and employment nature, along with travel experience features including travel frequency, primary travel purposes, common travel modes, primary cost-sharing methods, and primary travel time periods as input indicators for K-means clustering. K-means clustering, a convenient and efficient classic clustering method, was employed to analyze traveler samples. The main steps of K-means clustering are as follows:
(1) Determine initial cluster centers based on a given number of clusters .
(2) Iterate through all samples, calculate their Euclidean distance from each initial cluster center, and assign each sample to the cluster center with the minimum distance, completing one classification process.
(3) Calculate the mean of the samples within each cluster based on the classification to generate new cluster centers.
(4) Repeat steps (2) and (3) until adjusting the cluster centers results in minimal change in the sum of distances between samples and their respective cluster centers, indicating model convergence. At this stage, iteration ceases, and the final cluster centers and clustering results are produced.
The determination of the number of clusters, denoted as , can be accomplished using various methods. One common and effective approach is the silhouette coefficient method, which evaluates the cohesion of samples within cluster centers and provides values within the range of [−1, 1]. A higher silhouette coefficient indicates better sample cohesion and clearer boundaries between clusters, and it is calculated using the following formula:
In the equation, represents the silhouette coefficient of the model, where denotes the average distance among samples within the same cluster and signifies the average distance between samples of one cluster and samples of other clusters.
4.2. Hybrid Choice Model (HCM)
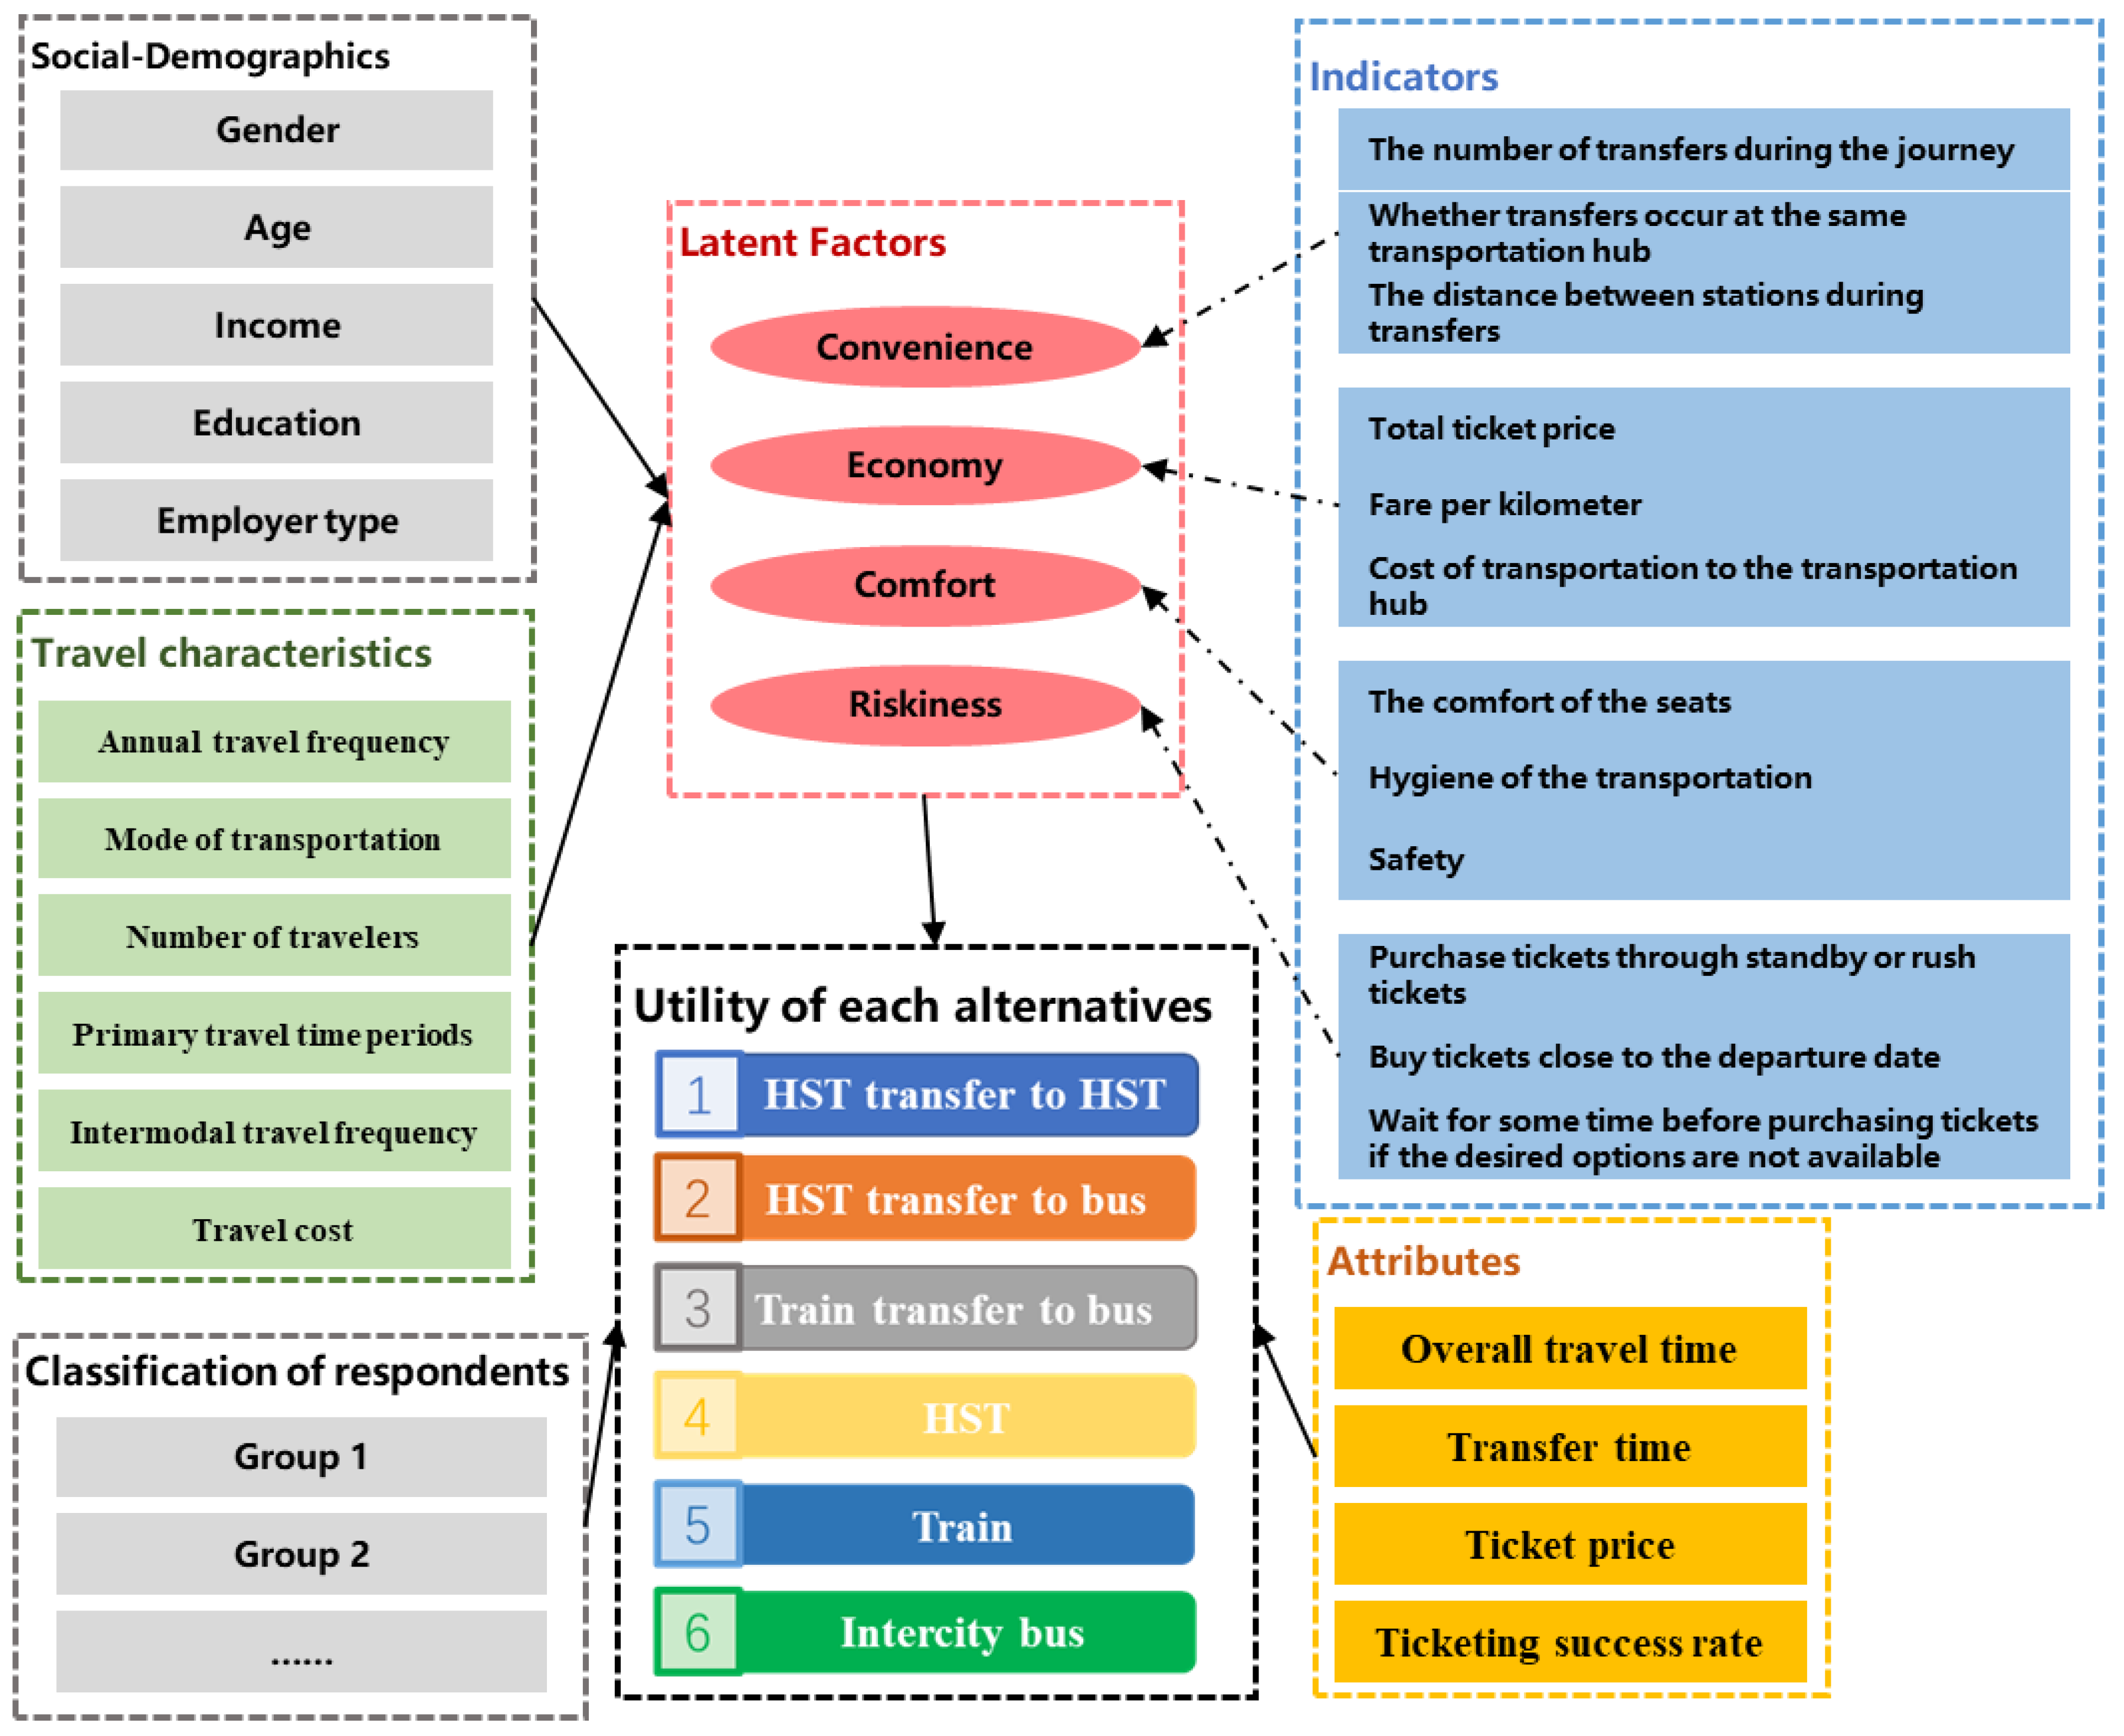
To analyze travel mode choice behaviors regarding RRIT while considering attitude variables, we used an HCM that includes alternative-specific attributes and individual latent attitude factors [46]. The HCM is essentially an extension of classical discrete choice models, incorporating attitude variables into its utility function to improve the explanatory power of the classical choice model. The HCM effectively addresses the issue of Likert scale scores not being directly usable as random utility function variables. In this study, a multiple indicator multiple cause (MIMIC) model was employed to measure the relationship between exogenous variables and latent factors. The proposed HCM framework is illustrated in Figure 2.
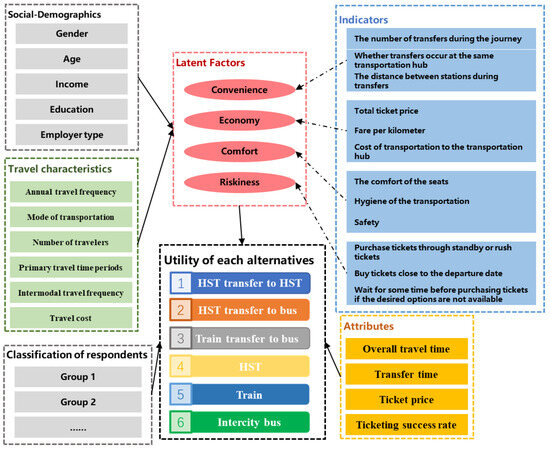
Figure 2.
The modeling framework for the proposed HCM.
Based on the framework of Random Utility Theory, the utility of transportation choices is represented by their alternative-specific attributes and individual latent attitude factors, which can be expressed as follows:
where represents the utility of respondent selecting alternative . represents the vectors of the alternative attributes. is a vector of the latent attitude factors. and are parameters that need to be estimated. is an alternative specific constant.
We hypothesize the estimated latent factors are associated with the selected respondent attribute variables and can be represented as follows:
where represents the th latent factor of respondent . is the socio-demographics and travel characteristics of respondent . is a vector of unknown parameters connecting the socio-demographics and travel characteristics with the th latent factor. indicates a random disturbance term assumed to be normally distributed, with mean and standard deviation . [46,47,48].
We assume that each indicator is represented by an ordinal measurement scale. The MIMIC model is used to estimate the measurement relationships between the latent factors and their corresponding indicators. Its mathematical expression is defined as follows:
where is the latent variable in terms of the th observed and ordinal indicator . It includes latent attitudes and unknown parameters and , along with a normally distributed error term . The vector is ( × 1), where the th component of is set to 0 if the th latent factor is irrelevant to the th indicator, otherwise it is 1. Equation (5) specifies that is an integer from 1 to , where individual selects the th scale value for the th indicator if falls within the range of and . In the study, we use a Likert scale with levels; four cutoff parameters are estimated using the likelihood estimation of ordered probabilities, as shown in Equation (8).
Finally, the model parameters are estimated using the maximum likelihood estimation method. The joint likelihood function for respondent can be defined as follows:
where is the likelihood function of the part of the choice model that considers the alternatives, represents the likelihood function of the measurement relationships part of the latent variable model, and represents the likelihood function of the structural relationships part of the latent variable model.
where takes the value one if respondent chooses alternative , or zero otherwise. takes the value one if respondent selects the th scale value for the th indicator. represents the cumulative density function of the standardized normal distribution.
Lastly, assuming that the random error terms are independent across different transportation options and choice situations, the probability that alternative j is chosen is equal to
Due to the involvement of integrals, Equation (10) does not have a closed-form solution. Consequently, this paper employs the maximum simulated likelihood method to estimate the parameters. This approach uses simulated probabilities to approximate the likelihood function, averaging the results rather than relying on exact probabilities (for more details, refer to [49]). Thus, the simulated likelihood function for the proposed model can be expressed as follows:
where represents the total number of samples drawn from the standard normal density function. and refer to the simulated latent factors and panel effects of the th draw, respectively.
5. Results and Discussion
5.1. Passenger Clustering
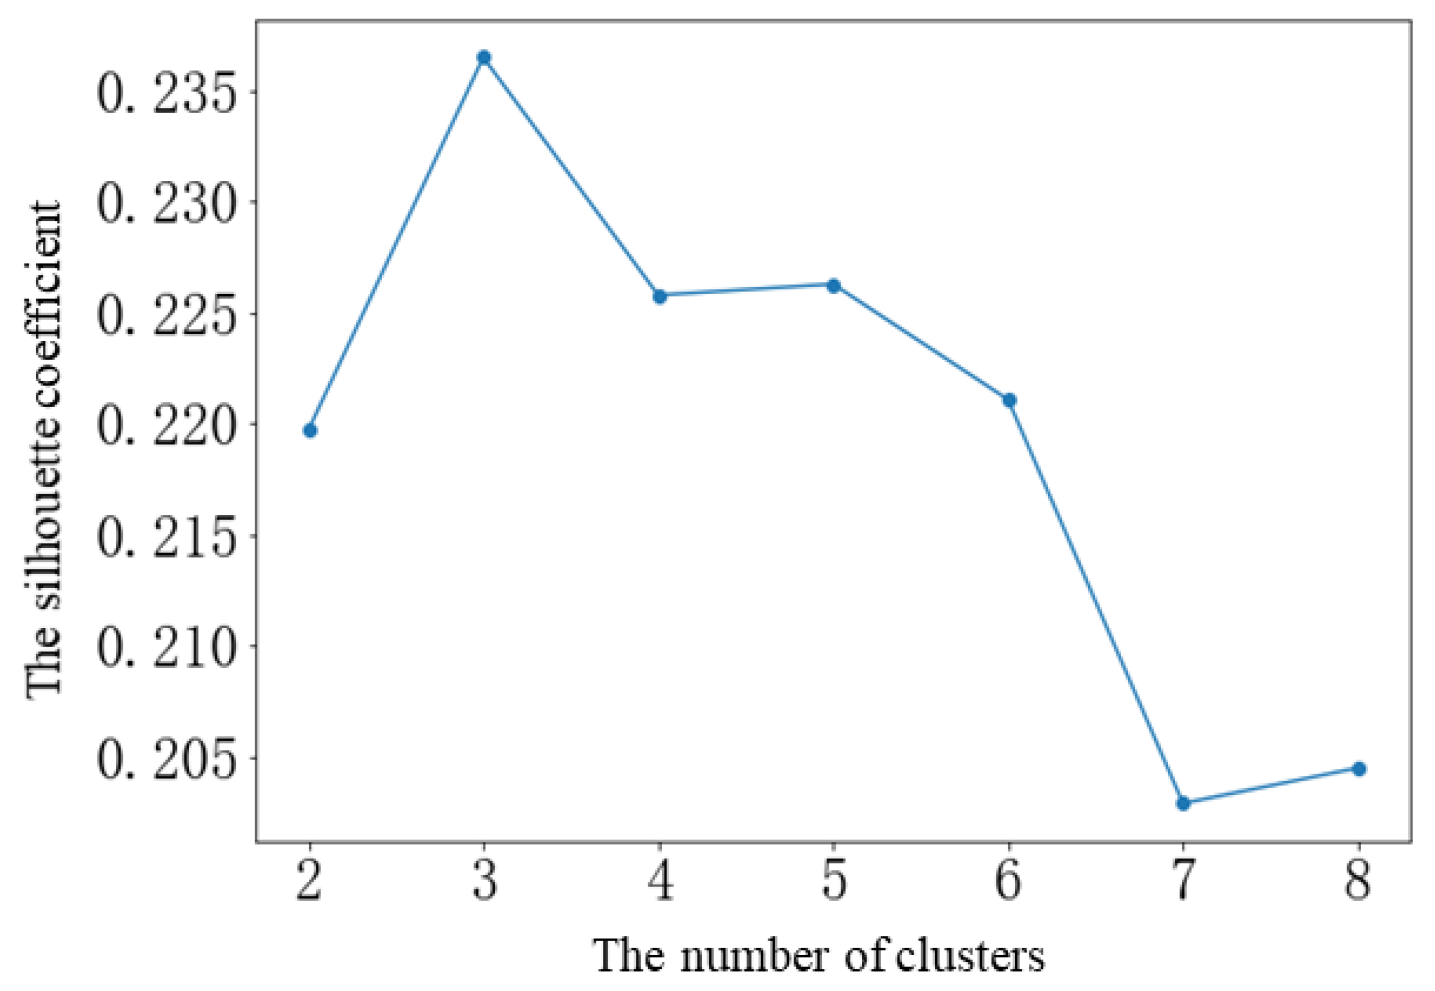
To analyze the choice behavior of different passenger groups based on their characteristics, we employed socio-demographic attributes and travel characteristics as clustering indicators. Figure 3 displays the silhouette coefficients for clustering models ranging from n = 2 to n = 9. It is evident that the silhouette coefficient peaks when n = 3. Therefore, this study categorizes passengers into three groups.
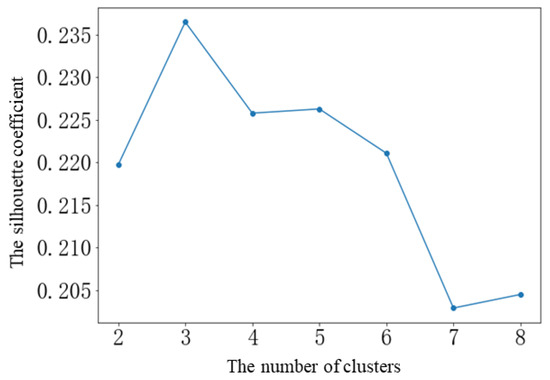
Figure 3.
Silhouette coefficients for different numbers of clusters.
Specifically, passengers were grouped into three categories comprising 178, 229, and 134 individuals, respectively. Table 5 provides the statistical analysis results of the travel characteristics of each group.
Table 5.
The travel characteristics of each group.
Group 1 passengers predominantly fall within the medium income range (50.56%), with the majority aged between 30 and 49 years old (52.25%). Their primary travel purpose is work-related (44.38%), and they do not include any students. Direct intercity bus travel is the preferred mode for this group (56.74%), and approximately 84.83% of them travel distances up to 400 km. Therefore, Group 1 is defined as “middle-income intercity travelers for work-related trips”.
Group 2 consists mainly of middle-aged and elderly individuals (89.08%), primarily corporate employees (75.98%), with a majority earning above CNY 8000 per month (53.28%). Their primary travel purpose is business trips (45.85%), and they predominantly opt for direct high-speed rail (HSR) or train travel (96.94%). Group 2 is identified as “high-income intercity travelers for business”.
Group 3 is characterized by individuals mostly aged 30 years or younger (96.27%), with a significant portion holding postgraduate degrees or higher (47.01%), and primarily composed of students (76.87%). The income level of this group is relatively low, and their main travel purpose is educational (64.93%). Approximately 30.60% of them travel distances exceeding 800 km. Therefore, Group 3 is labeled as “low-income young intercity travelers for study”.
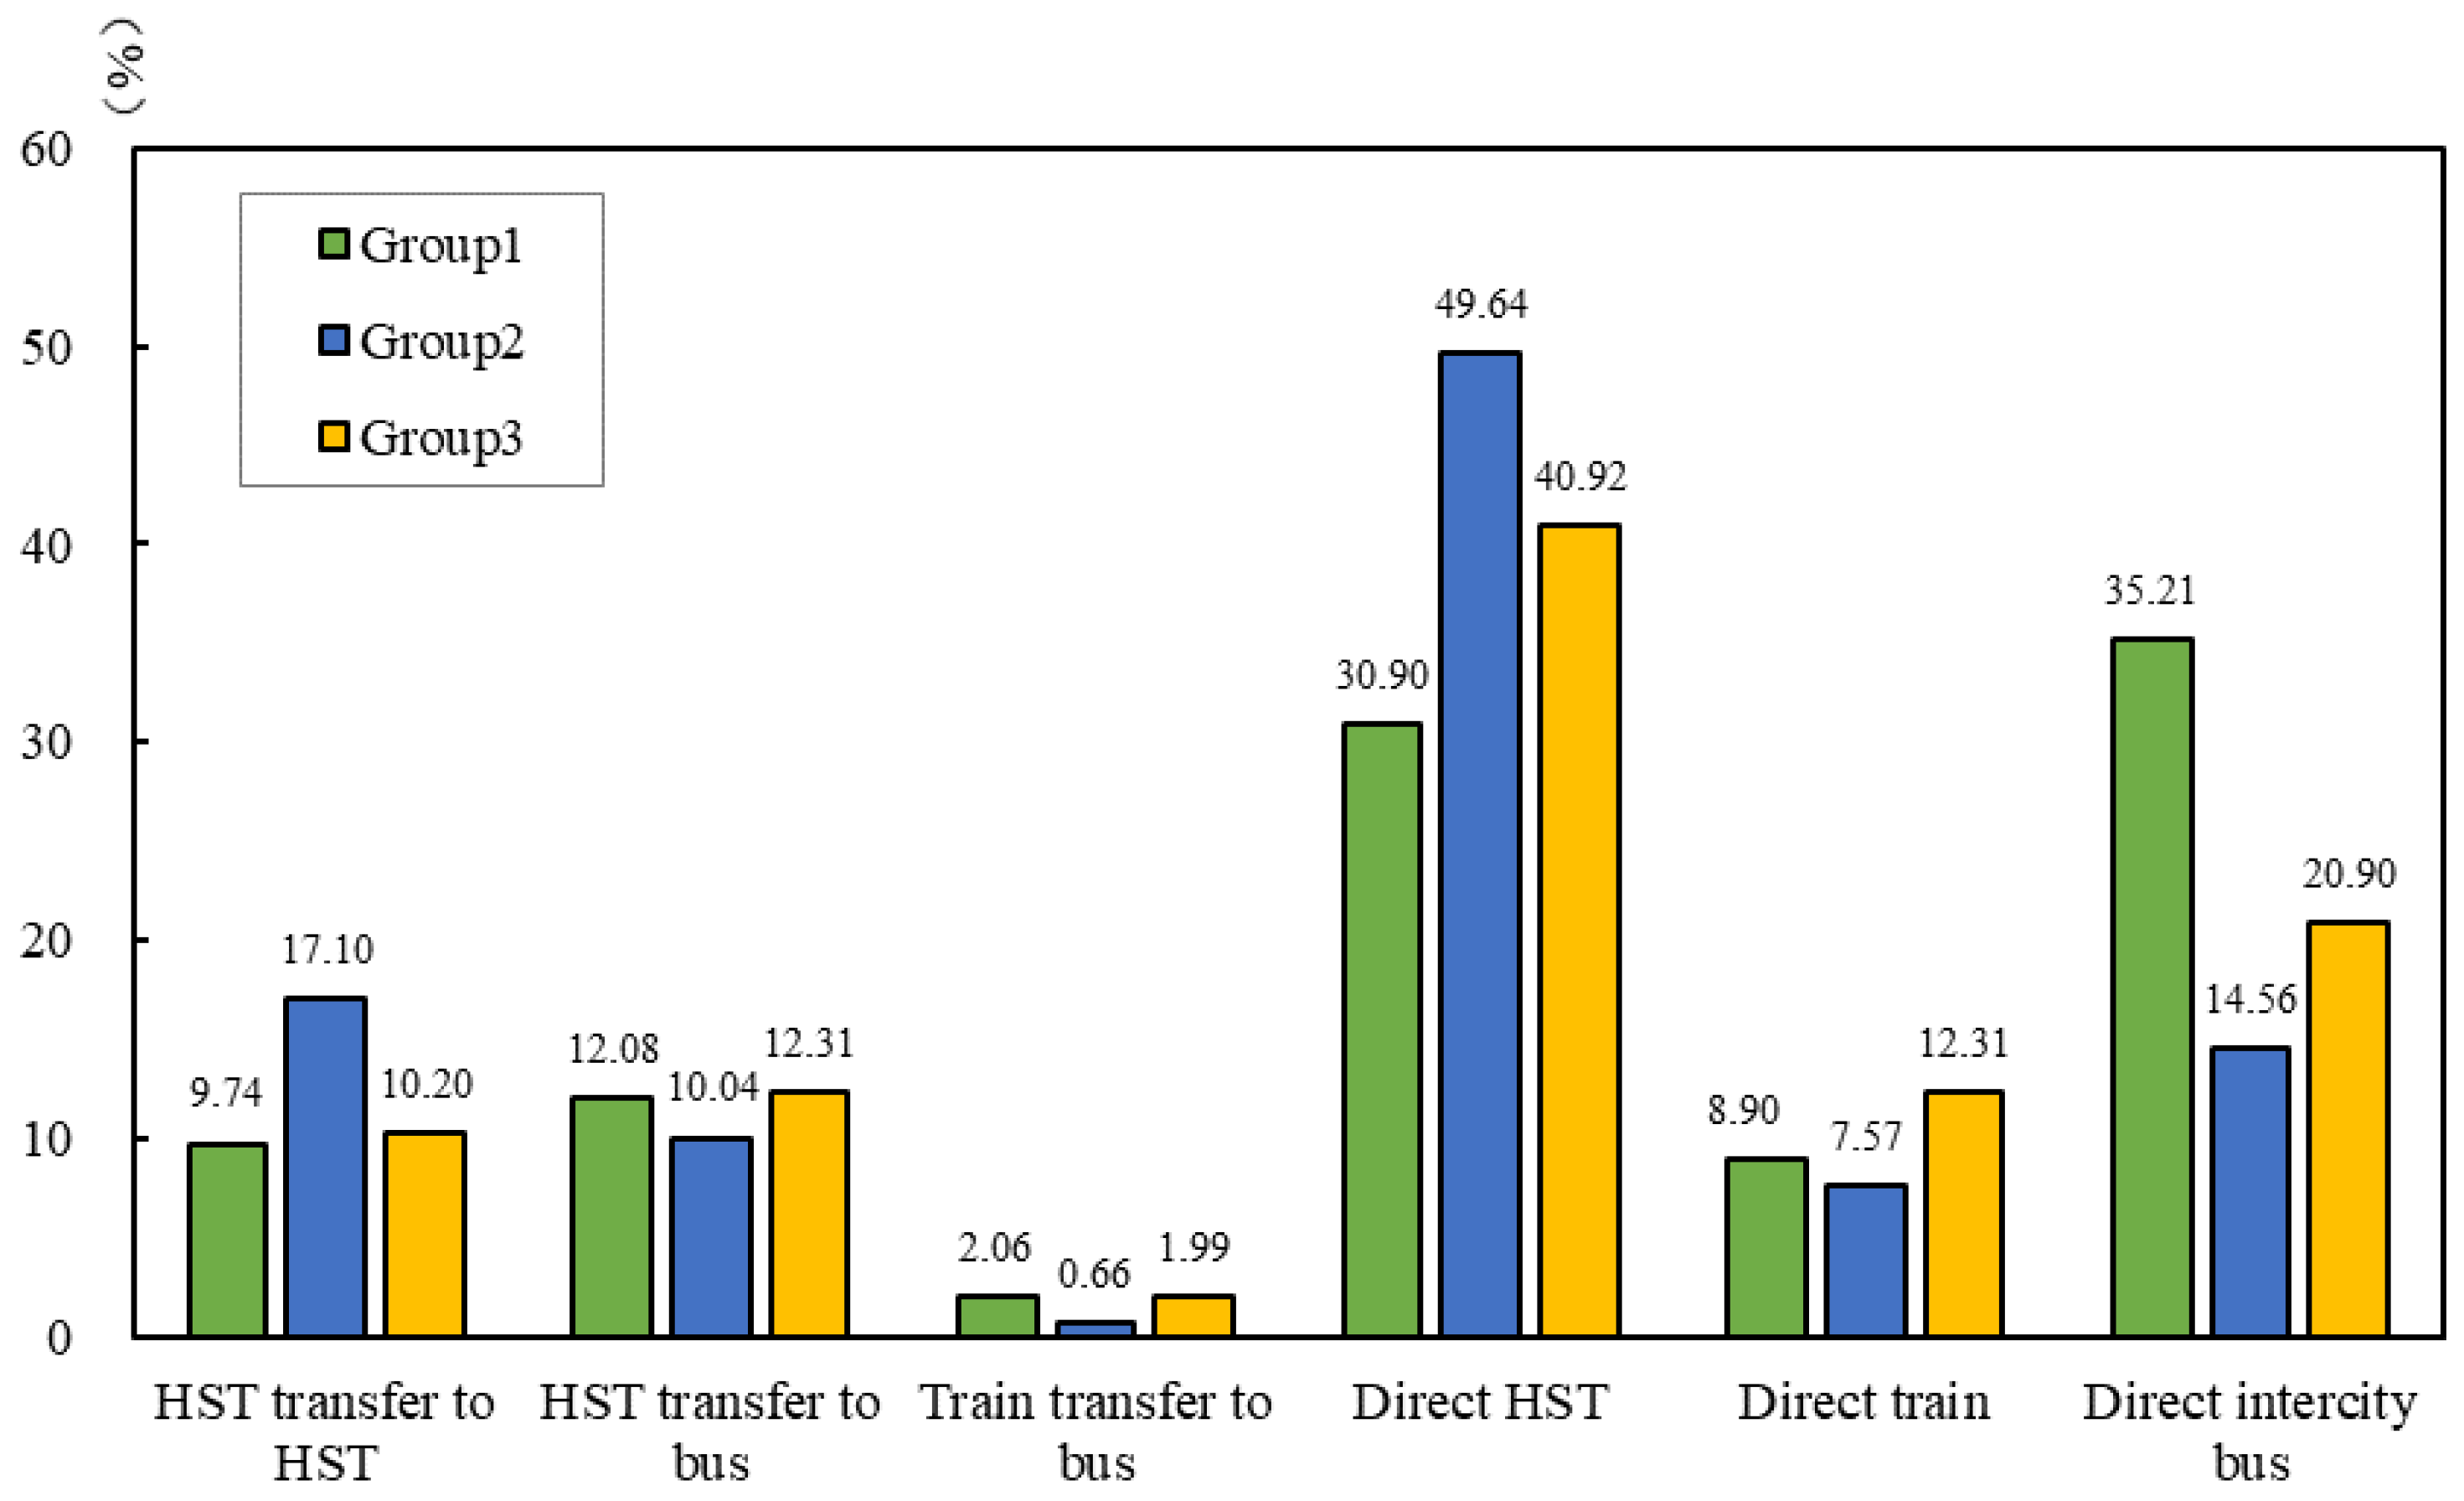
The experimental results allow for the analysis of mode choice variations under different ticket booking success rates, as outlined in Section 2. A total of 541 samples and 3246 observations were collected. Figure 4 illustrates the proportion of different intercity travel mode choices made among different traveler groups.
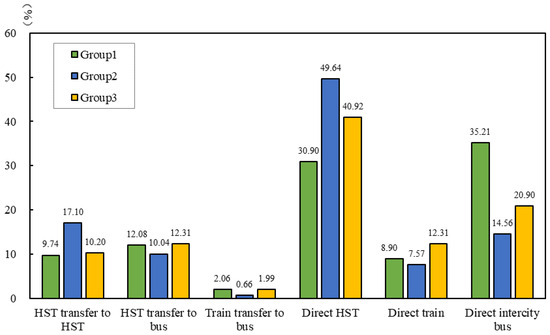
Figure 4.
The proportion of intercity travel mode choices made by different traveler groups.
Figure 4 presents the decision-making statistics for various traveler categories. In scenarios where the intercity ticket booking success rate is known, Group 1 travelers predominantly favor direct car travel options, accounting for 35.21%, which aligns with their survey-reported travel preferences. Their second choice is direct high-speed rail travel at 30.90%, possibly due to economic considerations favoring car travel over high-speed rail within the budget constraints of middle-income workers.
Group 2 travelers exhibit a strong preference for direct high-speed rail travel, with 49.64% opting for this mode over others. Their second choice is the high-speed rail transfer option, indicating a continued preference for high-speed-rail-related travel even when direct options are unavailable. The affordability and efficiency of high-speed rail travel align well with the preferences of high-income business travelers seeking comfort and reliability.
On the other hand, Group 3 travelers show a preference for the direct high-speed rail travel option, which comprised 40.92% of their choices. An analysis of travel distances for Group 3 indicates that, despite being a low-income and young demographic, there is a notable demand for medium- and long-distance travel. However, since this study’s experimental design mainly focuses on short-distance routes, more suitable air travel options for longer distances were not considered. Therefore, balancing comfort and efficiency, the low-income young population tends to favor direct high-speed rail travel. Their second choice is the direct car travel option, accounting for 20.90%, which may be preferred by students whose primary travel routes are relatively short. Compared to rail travel, car travel offers greater economy and convenience.
5.2. Analysis of Latent Variables
The initial step in constructing the HCM involves identifying latent factors. The existing literature commonly identifies these relationships using an Exploratory Factor Analysis (EFA). Therefore, in this study, we begin by employing an EFA to identify potential latent factors from a set of indicators. These identified latent constructs serve as the measurement model for the latent variable component of the HCM. By integrating the discrete choice model with the latent variable model, we can then estimate the influence of latent factors and other observed attributes on the utility function of choice alternatives.
Table 6 presents the results of the EFA, indicating that 12 attitude indicators can be consolidated into four latent factors. Importantly, these four factors collectively explain approximately 62% of the variance among the 12 indicators listed in Table 4. Table 7 further summarizes their corresponding factor loadings, revealing the strength and direction of each indicator’s association with its respective factor.
Table 6.
Results of the factor analysis: total explained variance.
Table 7.
Factor loadings of the latent variables.
Additionally, based on the results in Table 7, it is observed that the extracted factors do not exhibit multicollinearity issues with the indicators. Therefore, the selection of these four latent factors is deemed appropriate for this study. As depicted in Figure 2, Factor 1 represents attitudes towards travel convenience, encompassing three relevant indicators. Factor 2 comprises three indicators reflecting attitudes towards economy. Factor 3 is associated with three indicators expressing attitudes towards travel attributes. Finally, Factor 4 includes three indicators concerning attitudes towards travel risk. Thus, this study identifies four distinct latent factors: “Convenience”, “Economy”, “Comfort”, and “Riskiness”.
5.3. Results of HCM
After establishing the relationship between the 12 indicators and the four latent variables, the MIMIC model is employed to compute the latent variable scores. The results of the structural relationship part of the latent variable model are presented in Table 8.
Table 8.
Estimation results of the structural relationship part of the latent variable model.
Using a sample of 3246 choice sets, the HCM was estimated separately for the three traveler groups. Prior to estimating the models, effect coding was applied to all categorical attributes, with the last category of each attribute serving as the reference category. Overall, the three models exhibited good fit, as indicated by pseudo R2 values of 0.307, 0.103, and 0.283 for the respective groups. Parameter estimates are detailed in Table 9.
Table 9.
Estimation results of HCM.
The results indicate that attitude variables significantly influence the travel mode choice behavior of the first group of travelers, whereas the second group’s choice behavior is largely unaffected by attitude variables.
For the first group of travelers, psychological preferences play a crucial role in their decision-making. At a 99% confidence level, their preference for convenience shows a strong positive impact on all travel options, particularly on “HSR transfer to HSR” (normally distributed as N(34.965 ***, 10.056 ***)), “HSR transfer to bus” (N(35.691 ***, 8.299 ***)), and “Direct train travel” (N(33.733 ***, 6.971 ***)). This indicates that travelers in the first group, who prioritize convenience, tend to choose these travel options, demonstrating significant heterogeneity in their convenience preferences. This variance could be influenced by their travel experiences in regions with less developed HSR services, where conventional trains and buses remain the primary means of transportation, leading to varied assessments of convenience among individuals.
The preference for economy exhibits a strong negative impact on all travel options, notably affecting “HSR transfer to bus” (N(−26.015 ***, 6.597 ***)). This suggests that, among the first group of travelers, those with higher preferences for economy show diverse preferences when selecting this travel option. Similarly, the preference for comfort negatively impacts all travel options, especially “Direct car travel” (N(−25.563 ***, 7.755 ***)), indicating that travelers prioritizing comfort also exhibit heterogeneity in their preferences for this travel option. Conversely, their preference for risk shows a strong positive impact across all travel options, suggesting that risk-averse attitudes among travelers in the first group influence their decision-making process.
In contrast, the psychological preferences of the second group of travelers exert a weaker influence on their choice behavior. This indicates that high-income business travelers have robust travel preferences for intercity travel and are less swayed by other factors. Notably, the constant term significantly impacts “Direct HSR travel” (6.535 ***), “Direct train travel” (8.935 ***), and “Direct intercity bus travel” (8.369 ***), indicating that this group tends to favor direct travel options without a substantial consideration of other factors.
Regarding attitude preferences, only the preference for comfort significantly influences the choice behavior of the third group of travelers, showing a strong negative impact on all travel options, particularly on “Direct intercity bus travel” (N(−13.952 ***, 2.412 *)). This suggests that travelers in this group, who prioritize comfort, also exhibit variability in their comfort preferences when selecting travel options.
6. Conclusions
This study investigates the mode choice behavior of various traveler groups within the context of intermodal rail and road travel. Utilizing travel survey data, we employ an HCM framework that incorporates latent variables to examine the influence of attitude factors on choice behavior.
Addressing the capacity–demand mismatch issue during peak intercity travel periods, we specifically analyze current passenger preferences towards direct travel and intermodal options involving railways and highways. Through an HCM analysis of attitude effects on choice behavior, we identify four latent attitude variables: convenience, economy, comfort, and perceived risk. These findings underscore the significant impact of attitude variables on travel choices.
To explore heterogeneity in the choice behavior among different traveler groups, we utilized K-Means clustering to classify travelers into three groups. For each group, we developed an HCM incorporating latent attitude variables. The findings indicate that all three groups prioritize high ticket booking success rates when evaluating options such as HSR and intercity bus travel. However, they differ in their levels of concern regarding factors like ticket price and travel time when assessing other travel alternatives. Furthermore, all groups exhibit risk-averse attitudes towards travel choices, yet they vary in their preferences and demands for convenience, economy, and comfort in their travel decisions.
This analysis underscores the influence of ticket booking success rates on the choice of RRIT. Governments and transportation service providers can enhance RRIT service uptake by improving booking systems and providing real-time information accessibility. Additionally, this study highlights that travelers’ attitudes towards convenience, economy, comfort, and risk significantly impact their decision-making processes. Enhancing RRIT services can enhance the competitiveness of intermodal transportation by (a) implementing differentiated pricing strategies tailored to diverse traveler needs and preferences and (b) optimizing service facilities such as carriage layouts, seat designs, and convenience amenities.
In conclusion, this study not only unveils travelers’ preferences for RRIT choices under scenarios of uncertain ticket booking success rates but also highlights the significant impact of latent user attitude variables on mode choice behavior. These findings contribute to understanding the critical factors influencing RRIT service selection, thereby assisting RRIT designers and planners in enhancing service quality and fostering future RRIT growth and sustainability in transportation.
However, this study is subject to certain limitations. It focuses primarily on intermodal rail and road travel scenarios with uncertain ticket availability, which may be particularly relevant during holiday periods and peak travel times when direct travel options may not adequately meet demand. Future research could broaden this scope by extensively gathering multimodal travel data and employing geographic information technology to analyze RRIT ridership patterns. For instance, investigating how household dynamics influence decisions to opt for RRIT. Additionally, this paper utilizes an HCM to elucidate the impact of attitudinal variables on decision-making under uncertainty. Future research avenues could explore the application of prospect theory and regret theory from social psychology to further explicate decision-making processes in uncertain environments.
Author Contributions
Conceptualization, B.W. and J.L.; methodology, B.W. and J.L.; software, B.W. and J.L.; validation, B.W., J.L. and F.J.; formal analysis, B.W., J.L. and F.J.; investigation, B.W. and J.L.; resources, B.W. and F.J.; data curation, B.W. and J.L.; writing—original draft preparation, B.W. and J.L.; writing—review and editing, B.W. and F.J.; visualization, B.W., J.L. and F.J.; supervision, B.W. and F.J.; project administration, B.W. and F.J.; funding acquisition, B.W. All authors have read and agreed to the published version of the manuscript.
Funding
This research is funded by the Key Laboratory of Transport Industry of Comprehensive Transportation Theory (Nanjing Modern Multimodal Transportation Laboratory) (MTF2023006) and the Major Science and Technology Demonstration Projects in Jiangsu Province (BE2022860).
Institutional Review Board Statement
Not applicable.
Informed Consent Statement
Not applicable.
Data Availability Statement
The raw data supporting the conclusions of this article will be made available by the authors on request.
Conflicts of Interest
The authors declare no conflicts of interest.
References
- Wang, R.; Yang, K.; Yang, L.; Gao, Z. Modeling and Optimization of a Road–Rail Intermodal Transport System under Uncertain Information. Eng. Appl. Artif. Intell. 2018, 72, 423–436. [Google Scholar] [CrossRef]
- Uddin, M.M.; Huynh, N. Freight Traffic Assignment Methodology for Large-Scale Road–Rail Intermodal Networks. Transp. Res. Rec. 2015, 2477, 50–57. [Google Scholar] [CrossRef]
- Uddin, M.; Huynh, N. Reliable Routing of Road-Rail Intermodal Freight under Uncertainty. Netw. Spat. Econ. 2019, 19, 929–952. [Google Scholar] [CrossRef]
- Chen, Z. Impacts of High-Speed Rail on Domestic Air Transportation in China. J. Transp. Geogr. 2017, 62, 184–196. [Google Scholar] [CrossRef] [PubMed]
- Huang, Y.; Zong, H. The Intercity Railway Connections in China: A Comparative Analysis of High-Speed Train and Conventional Train Services. Transp. Policy 2022, 120, 89–103. [Google Scholar] [CrossRef]
- Hak Lee, E.; Kim, K.; Kho, S.-Y.; Kim, D.-K.; Cho, S.-H. Estimating Express Train Preference of Urban Railway Passengers Based on Extreme Gradient Boosting (XGBoost) Using Smart Card Data. Transp. Res. Rec. 2021, 2675, 64–76. [Google Scholar] [CrossRef]
- Lee, E.H. Exploring Transit Use during COVID-19 Based on XGB and SHAP Using Smart Card Data. J. Adv. Transp. 2022, 2022, 6458371. [Google Scholar] [CrossRef]
- Lee, E.H.; Kim, K.; Kho, S.-Y.; Kim, D.-K.; Cho, S.-H. Exploring for Route Preferences of Subway Passengers Using Smart Card and Train Log Data. J. Adv. Transp. 2022, 2022, 6657486. [Google Scholar] [CrossRef]
- Losada-Rojas, L.L.; Gkartzonikas, C.; Pyrialakou, V.D.; Gkritza, K. Exploring Intercity Passengers’ Attitudes and Loyalty to Intercity Passenger Rail: Evidence from an on-Board Survey. Transp. Policy 2019, 73, 71–83. [Google Scholar] [CrossRef]
- Huang, Y.; Zong, H. Has High-Speed Railway Promoted Spatial Equity at Different Levels? A Case Study of Inland Mountainous Area of China. Cities 2021, 110, 103076. [Google Scholar] [CrossRef]
- Intermodal Connection of High-Speed Rail with Interregional Bus Services in Japan Ryosuke Yashiro, Hironori Kato. 2020. Available online: https://journals.sagepub.com/doi/10.1177/0361198120949877 (accessed on 2 August 2023).
- Chou, C.-C.; Shen, C.-W. An Exploration of the Competitive Relationship between Intercity Transport Systems. Transp. Plan. Technol. 2018, 41, 186–197. [Google Scholar] [CrossRef]
- Albalate, D.; Fageda, X. High Speed Rail and Tourism: Empirical Evidence from Spain. Transp. Res. Part A Policy Pract. 2016, 85, 174–185. [Google Scholar] [CrossRef]
- Poudel, S.R.; Marufuzzaman, M.; Bian, L. A Hybrid Decomposition Algorithm for Designing a Multi-Modal Transportation Network under Biomass Supply Uncertainty. Transp. Res. Part E Logist. Transp. Rev. 2016, 94, 1–25. [Google Scholar] [CrossRef]
- Ziaei, Z.; Jabbarzadeh, A. A Multi-Objective Robust Optimization Approach for Green Location-Routing Planning of Multi-Modal Transportation Systems under Uncertainty. J. Clean. Prod. 2021, 291, 125293. [Google Scholar] [CrossRef]
- Fu, X.; Lam, W.H. A Network Equilibrium Approach for Modelling Activity-Travel Pattern Scheduling Problems in Multi-Modal Transit Networks with Uncertainty. Transportation 2014, 41, 37–55. [Google Scholar] [CrossRef]
- Yang, K.; Liu, Y.-K.; Yang, G.-Q. Solving Fuzzy P-Hub Center Problem by Genetic Algorithm Incorporating Local Search. Appl. Soft Comput. 2013, 13, 2624–2632. [Google Scholar] [CrossRef]
- Arroyo, R.; Ruiz, T.; Mars, L.; Rasouli, S.; Timmermans, H. Influence of Values, Attitudes towards Transport Modes and Companions on Travel Behavior. Transp. Res. Part F Traffic Psychol. Behav. 2020, 71, 8–22. [Google Scholar] [CrossRef]
- Hunecke, M.; Haustein, S.; Böhler, S.; Grischkat, S. Attitude-Based Target Groups to Reduce the Ecological Impact of Daily Mobility Behavior. Environ. Behav. 2010, 42, 3–43. [Google Scholar] [CrossRef]
- Ye, R.; Titheridge, H. Satisfaction with the Commute: The Role of Travel Mode Choice, Built Environment and Attitudes. Transp. Res. Part D Transp. Environ. 2017, 52, 535–547. [Google Scholar] [CrossRef]
- Wang, Y.; Gao, Y. Travel Satisfaction and Travel Well-Being: Which Is More Related to Travel Choice Behaviour in the Post COVID-19 Pandemic? Evidence from Public Transport Travellers in Xi’an, China. Transp. Res. Part A Policy Pract. 2022, 166, 218–233. [Google Scholar] [CrossRef]
- Alemi, F.; Circella, C.; Handy, S. Measuring Environmental and Transportation-Related Attitudes in the California Millennials’ Study. In Proceedings of the 11th International Conferences on Transport Survey Methods, Estérel, QC, Canada, 24–29 September 2017. [Google Scholar]
- Liu, D.; Du, H.; Southworth, F.; Ma, S. The Influence of Social-Psychological Factors on the Intention to Choose Low-Carbon Travel Modes in Tianjin, China. Transp. Res. Part A Policy Pract. 2017, 105, 42–53. [Google Scholar] [CrossRef]
- Behrends, S. Burden or Opportunity for Modal Shift? Embracing the Urban Dimension of Intermodal Road-Rail Transport. Transp. Policy 2017, 59, 10–16. [Google Scholar] [CrossRef]
- Woxenius, J.; Bärthel, F. Intermodal Road-Rail Transport in the European Union. In The Future of Intermodal Freight Transport; Edward Elgar: Cheltenham, UK, 2008; pp. 13–33. [Google Scholar]
- Bergqvist, R. Evaluating Road–Rail Intermodal Transport Services–a Heuristic Approach. Int. J. Logist. Res. Appl. 2008, 11, 179–199. [Google Scholar] [CrossRef]
- Allard, R.F.; Moura, F. The Incorporation of Passenger Connectivity and Intermodal Considerations in Intercity Transport Planning. Transp. Rev. 2016, 36, 251–277. [Google Scholar] [CrossRef]
- Santos, B.F.; Limbourg, S.; Carreira, J.S. The Impact of Transport Policies on Railroad Intermodal Freight Competitiveness—The Case of Belgium. Transp. Res. Part D Transp. Environ. 2015, 34, 230–244. [Google Scholar] [CrossRef]
- Macharis, C.; Caris, A.; Jourquin, B.; Pekin, E. A Decision Support Framework for Intermodal Transport Policy. Eur. Transp. Res. Rev. 2011, 3, 167–178. [Google Scholar] [CrossRef]
- Wang, X.; Meng, Q. Discrete Intermodal Freight Transportation Network Design with Route Choice Behavior of Intermodal Operators. Transp. Res. Part B Methodol. 2017, 95, 76–104. [Google Scholar] [CrossRef]
- Liu, D.; Deng, Z.; Sun, Q.; Wang, Y.; Wang, Y. Design and Freight Corridor-Fleet Size Choice in Collaborative Intermodal Transportation Network Considering Economies of Scale. Sustainability 2019, 11, 990. [Google Scholar] [CrossRef]
- Sun, Y.; Li, X. Fuzzy Programming Approaches for Modeling a Customer-Centred Freight Routing Problem in the Road-Rail Intermodal Hub-and-Spoke Network with Fuzzy Soft Time Windows and Multiple Sources of Time Uncertainty. Mathematics 2019, 7, 739. [Google Scholar] [CrossRef]
- Li, Z.-C.; Lam, W.H.K.; Wong, S.C. Modeling Intermodal Equilibrium for Bimodal Transportation System Design Problems in a Linear Monocentric City. Transp. Res. Part B Methodol. 2012, 46, 30–49. [Google Scholar] [CrossRef]
- Oostendorp, R.; Krajzewicz, D.; Gebhardt, L.; Heinrichs, D. Intermodal Mobility in Cities and Its Contribution to Accessibility. Appl. Mobilities 2019, 4, 183–199. [Google Scholar] [CrossRef]
- Zhu, Z.; Zhang, A.; Zhang, Y. Connectivity of Intercity Passenger Transportation in China: A Multi-Modal and Network Approach. J. Transp. Geogr. 2018, 71, 263–276. [Google Scholar] [CrossRef]
- Qin, B.; Yang, M.; Ling, X.; Chen, E.; Chen, J.; Guo, Y. Integrated Generalized Cost Model Considering the Whole Trip for Urban Rail Transit Station Choices. Transp. Res. Rec. 2024, 2678, 288–304. [Google Scholar] [CrossRef]
- Liu, Y.; Zhang, Q.; Li, X.; Shi, Y. Optimizing Multimodal Timetable Synchronization of Intercity Railway and Metro for the First Service Period during Holidays. In International Journal of Transportation Science and Technology; In Press: Shanghai, China, 2024. [Google Scholar] [CrossRef]
- Wang, B.; Shao, C.; Li, J.; Weng, J.; Ji, X. Holiday Travel Behavior Analysis and Empirical Study under Integrated Multimodal Travel Information Service. Transp. Policy 2015, 39, 21–36. [Google Scholar] [CrossRef]
- Wang, B.; Yang, M.; Feng, T.; Yang, Y.; Yuan, Y. Heterogeneous Choice of Personalized Mobility-as-a-Service Bundles and Its Impact on Sustainable Transportation. Transp. Res. Part D Transp. Environ. 2024, 131, 104224. [Google Scholar] [CrossRef]
- Kim, Y.; Kim, E.-J.; Jang, S.; Kim, D.-K. A Comparative Analysis of the Users of Private Cars and Public Transportation for Intermodal Options under Mobility-as-a-Service in Seoul. Travel Behav. Soc. 2021, 24, 68–80. [Google Scholar] [CrossRef]
- Collins, M.; Etzioni, S.; Ben-Elia, E. Travel Behavior and System Dynamics in a Simple Gamified Automated Multimodal Network. Transp. Res. Part A Policy Pract. 2024, 183, 104060. [Google Scholar] [CrossRef]
- An, Z.; Heinen, E.; Watling, D. The Level and Determinants of Multimodal Travel Behavior: Does Trip Purpose Make a Difference? Int. J. Sustain. Transp. 2023, 17, 103–117. [Google Scholar] [CrossRef]
- Chorus, C.G.; Arentze, T.A.; Timmermans, H.J.P. Information Impact on Quality of Multimodal Travel Choices: Conceptualizations and Empirical Analyses. Transportation 2007, 34, 625–645. [Google Scholar] [CrossRef]
- Tian, S.; Liu, C.; Tian, S.; Liu, C.; Jiang, F. Evaluation of Customer Value-Based Pricing Strategies in Hainan’s Travel Agencies under a Free Trade Port Framework. Oppor. Chall. Sustain. 2023, 1, 198–213. [Google Scholar] [CrossRef]
- Solekah, N.A.; Handriana, T.; Solekah, N.A.; Handriana, T.; Usman, I. Environmental Sustainability in Muslim-Friendly Tourism: Evaluating the Influence of Schwartz’s Basic Value Theory on Tourist Behaviour in Indonesia. Oppor. Chall. Sustain. 2023, 2, 172–183. [Google Scholar] [CrossRef]
- Yan, Q.; Feng, T.; Timmermans, H. Investigating Private Parking Space Owners’ Propensity to Engage in Shared Parking Schemes under Conditions of Uncertainty Using a Hybrid Random-Parameter Logit-Cumulative Prospect Theoretic Model. Transp. Res. Part C Emerg. Technol. 2020, 120, 102776. [Google Scholar] [CrossRef]
- Chen, C.; Feng, T.; Gu, X. Role of Latent Factors and Public Policies in Travel Decisions under COVID-19 Pandemic: Findings of a Hybrid Choice Model. Sustain. Cities Soc. 2022, 78, 103601. [Google Scholar] [CrossRef] [PubMed]
- Salak, B.; Lindberg, K.; Kienast, F.; Hunziker, M. How Landscape-Technology Fit Affects Public Evaluations of Renewable Energy Infrastructure Scenarios. A Hybrid Choice Model. Renew. Sustain. Energy Rev. 2021, 143, 110896. [Google Scholar] [CrossRef]
- Train, K.E. Discrete Choice Methods with Simulation; Cambridge University Press: Cambridge, UK, 2009. [Google Scholar]

Disclaimer/Publisher’s Note: The statements, opinions and data contained in all publications are solely those of the individual author(s) and contributor(s) and not of MDPI and/or the editor(s). MDPI and/or the editor(s) disclaim responsibility for any injury to people or property resulting from any ideas, methods, instructions or products referred to in the content. |
© 2024 by the authors. Licensee MDPI, Basel, Switzerland. This article is an open access article distributed under the terms and conditions of the Creative Commons Attribution (CC BY) license (https://creativecommons.org/licenses/by/4.0/).