
Urban Disparity Analytics Using GIS: A Systematic Review


Abstract
:1. Introduction
2. Material and Methods
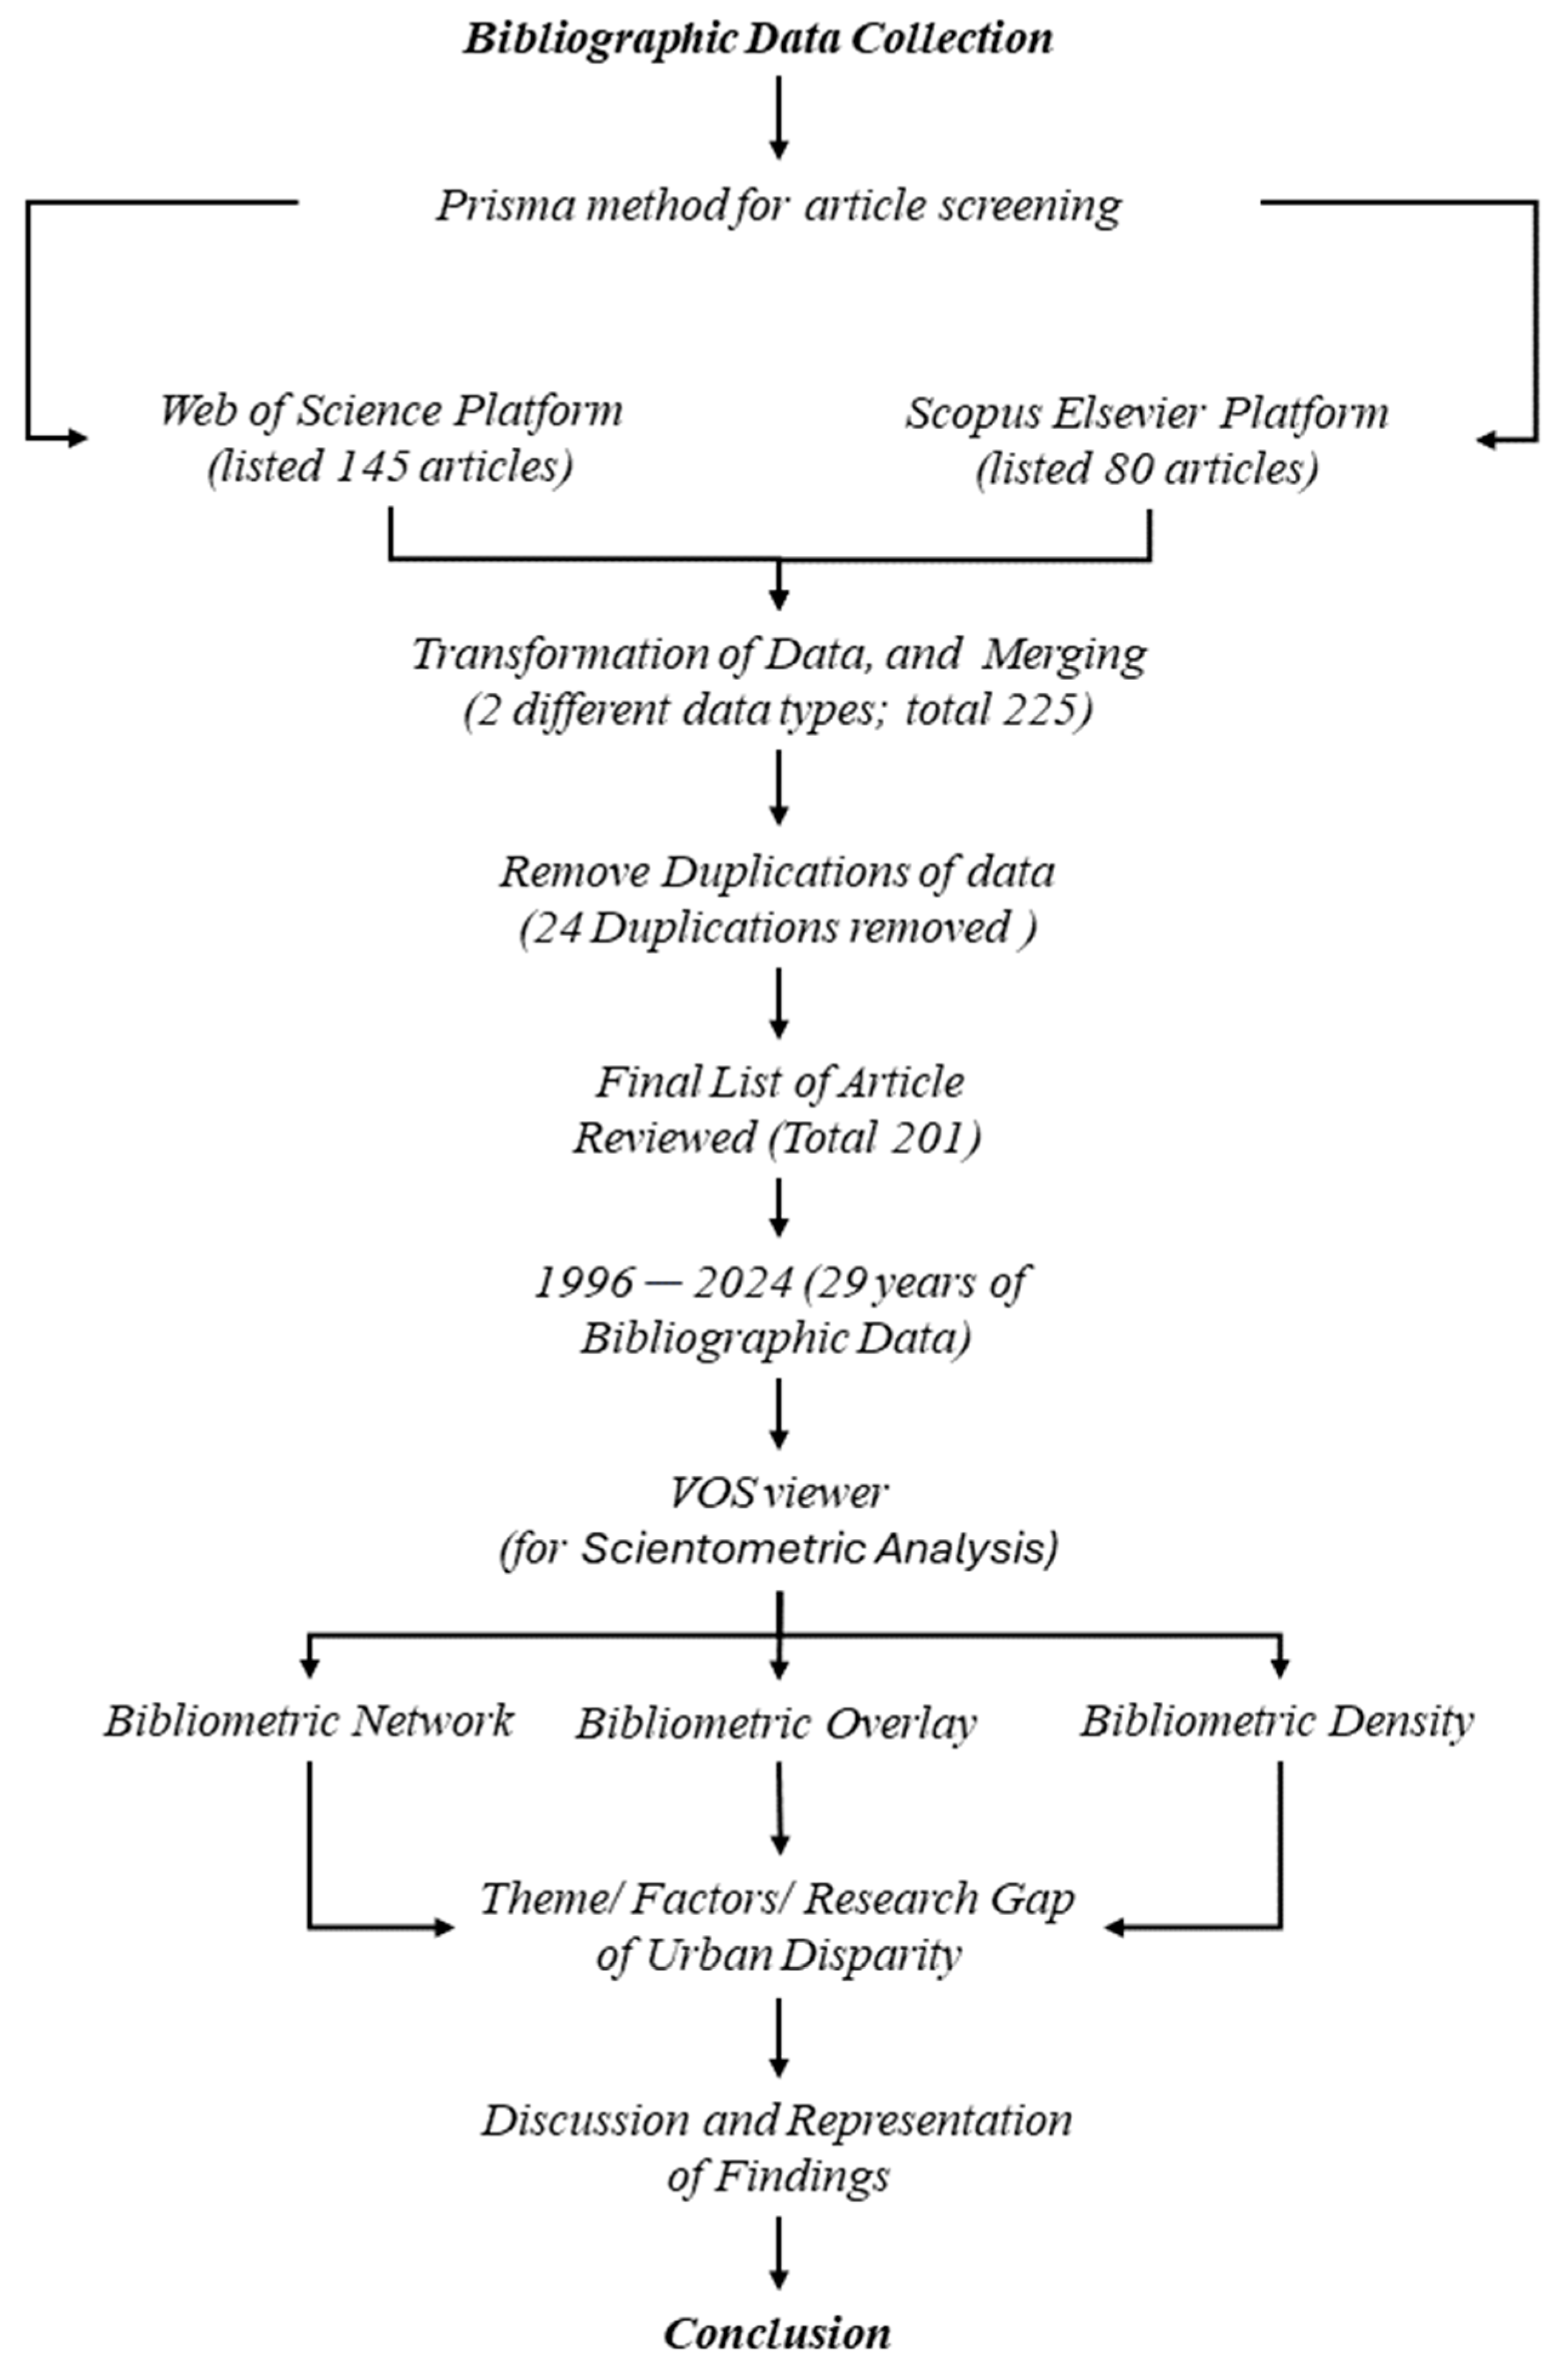
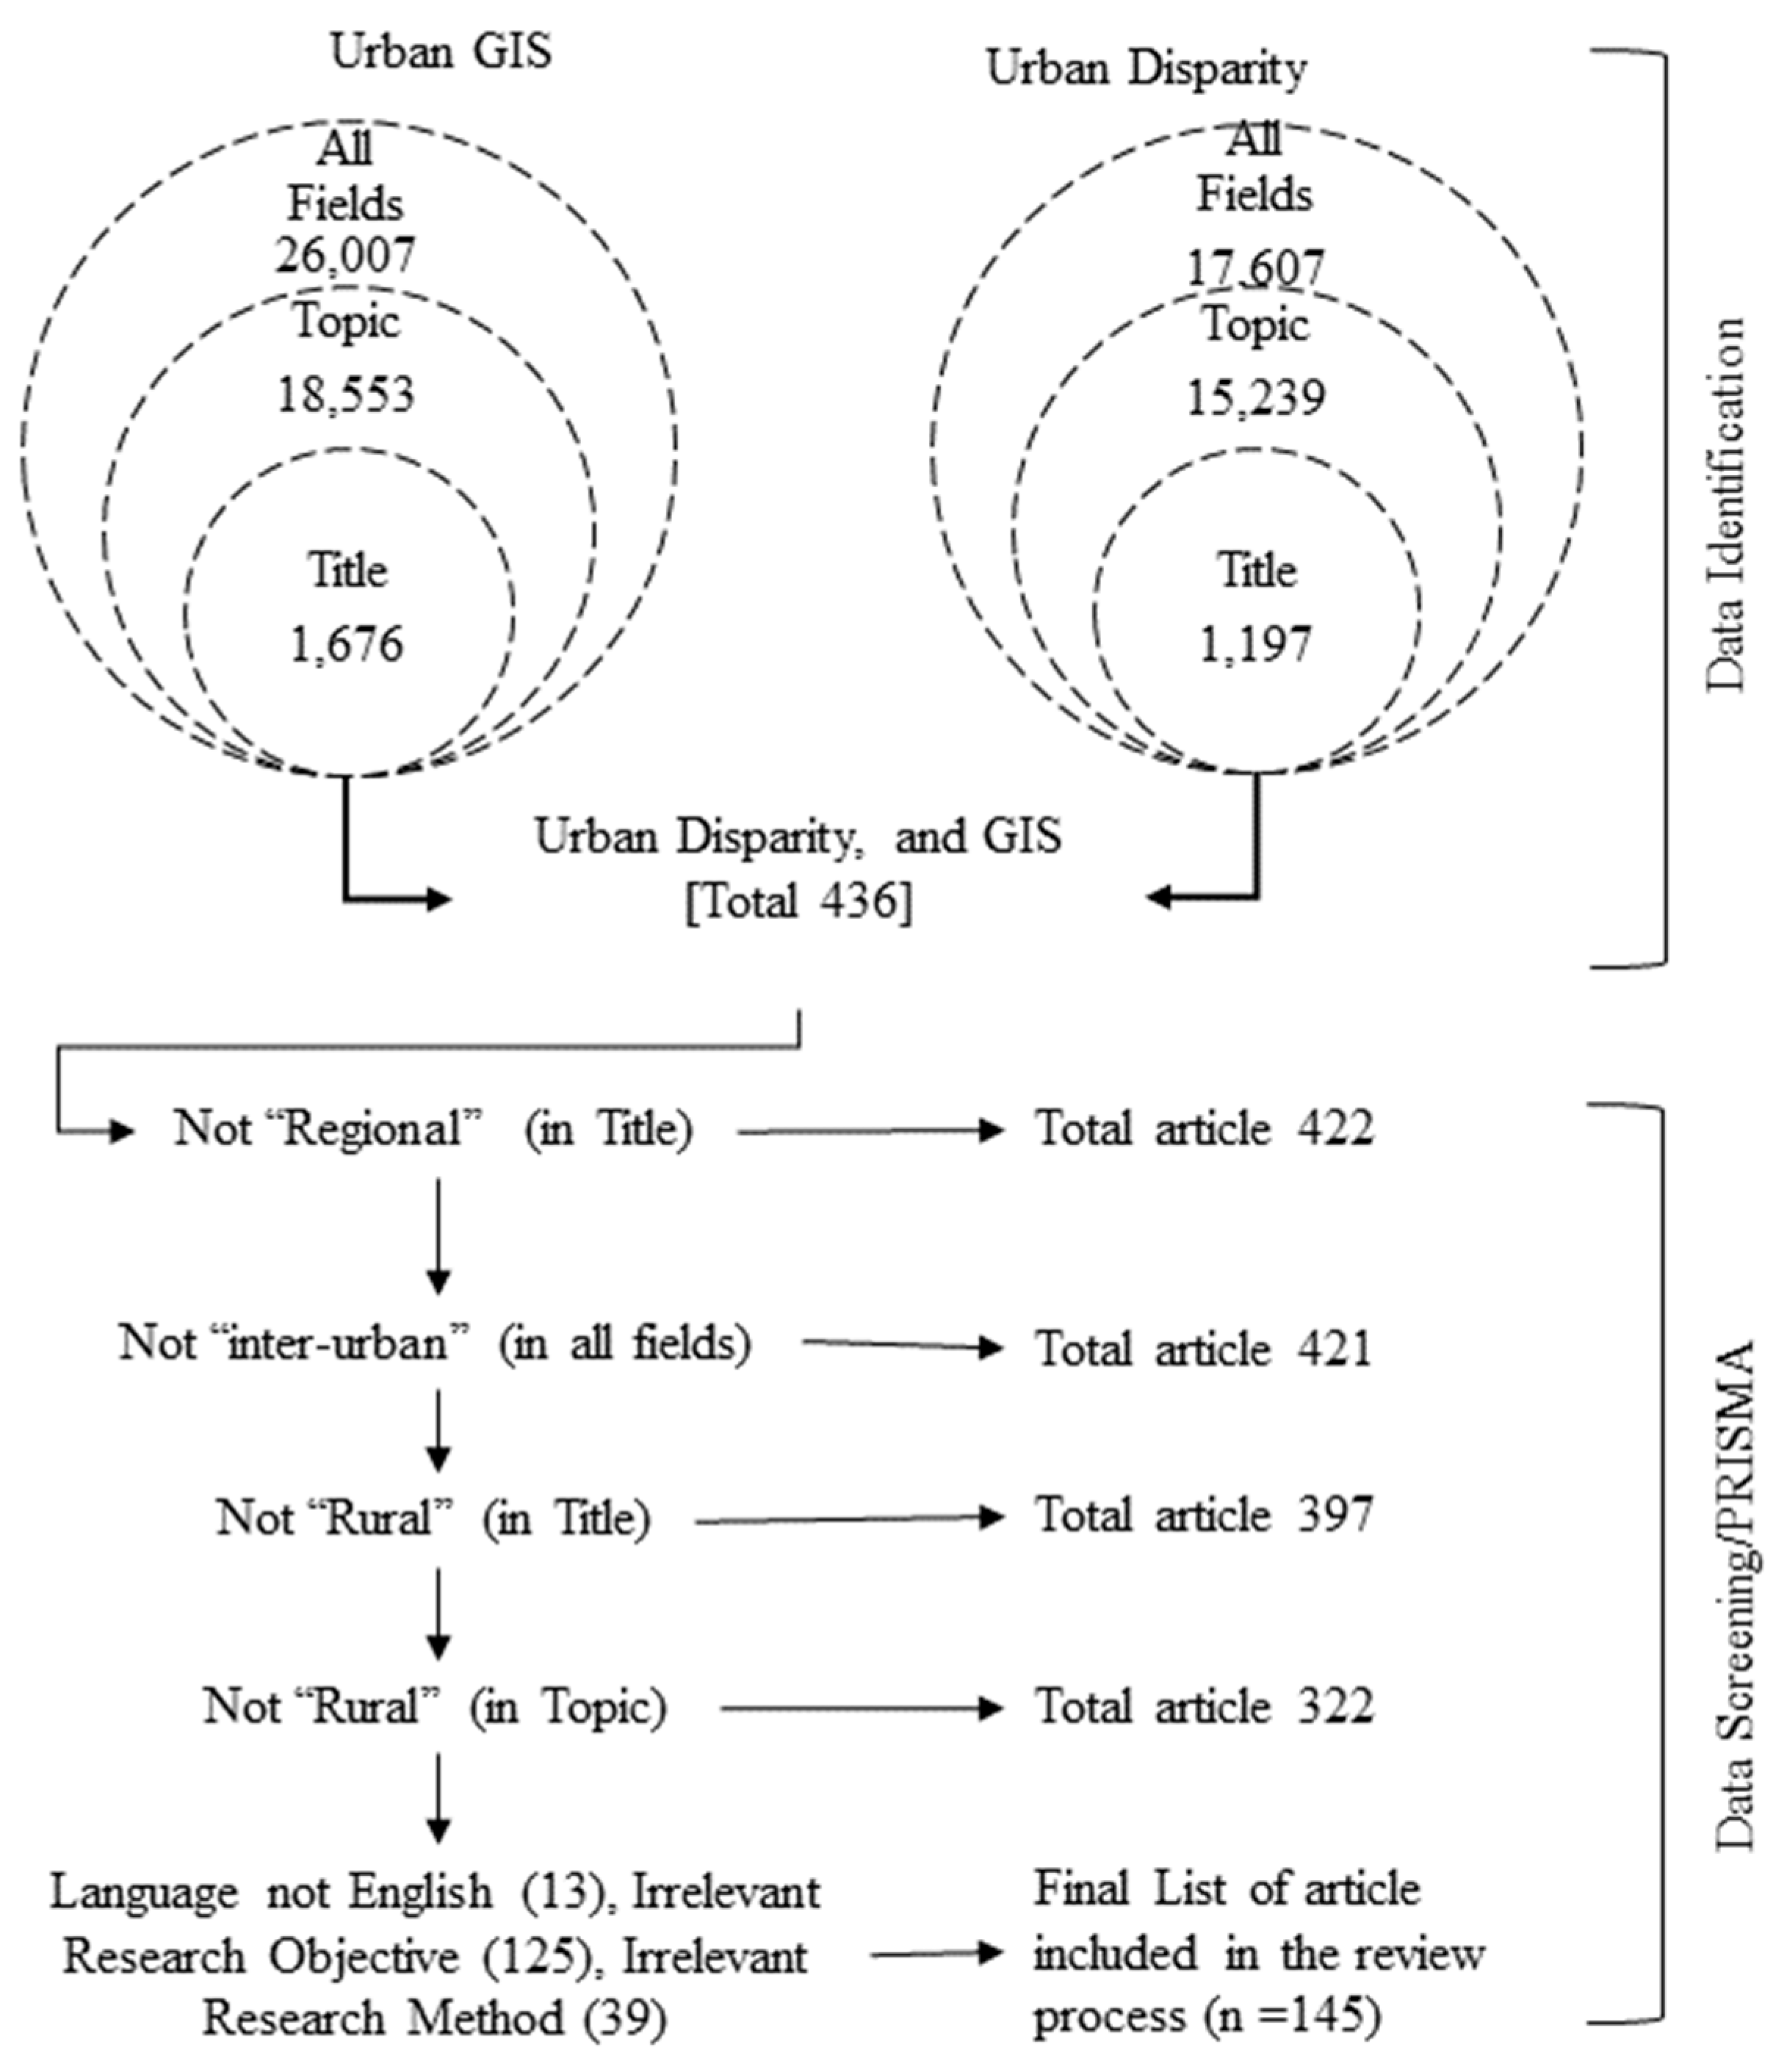
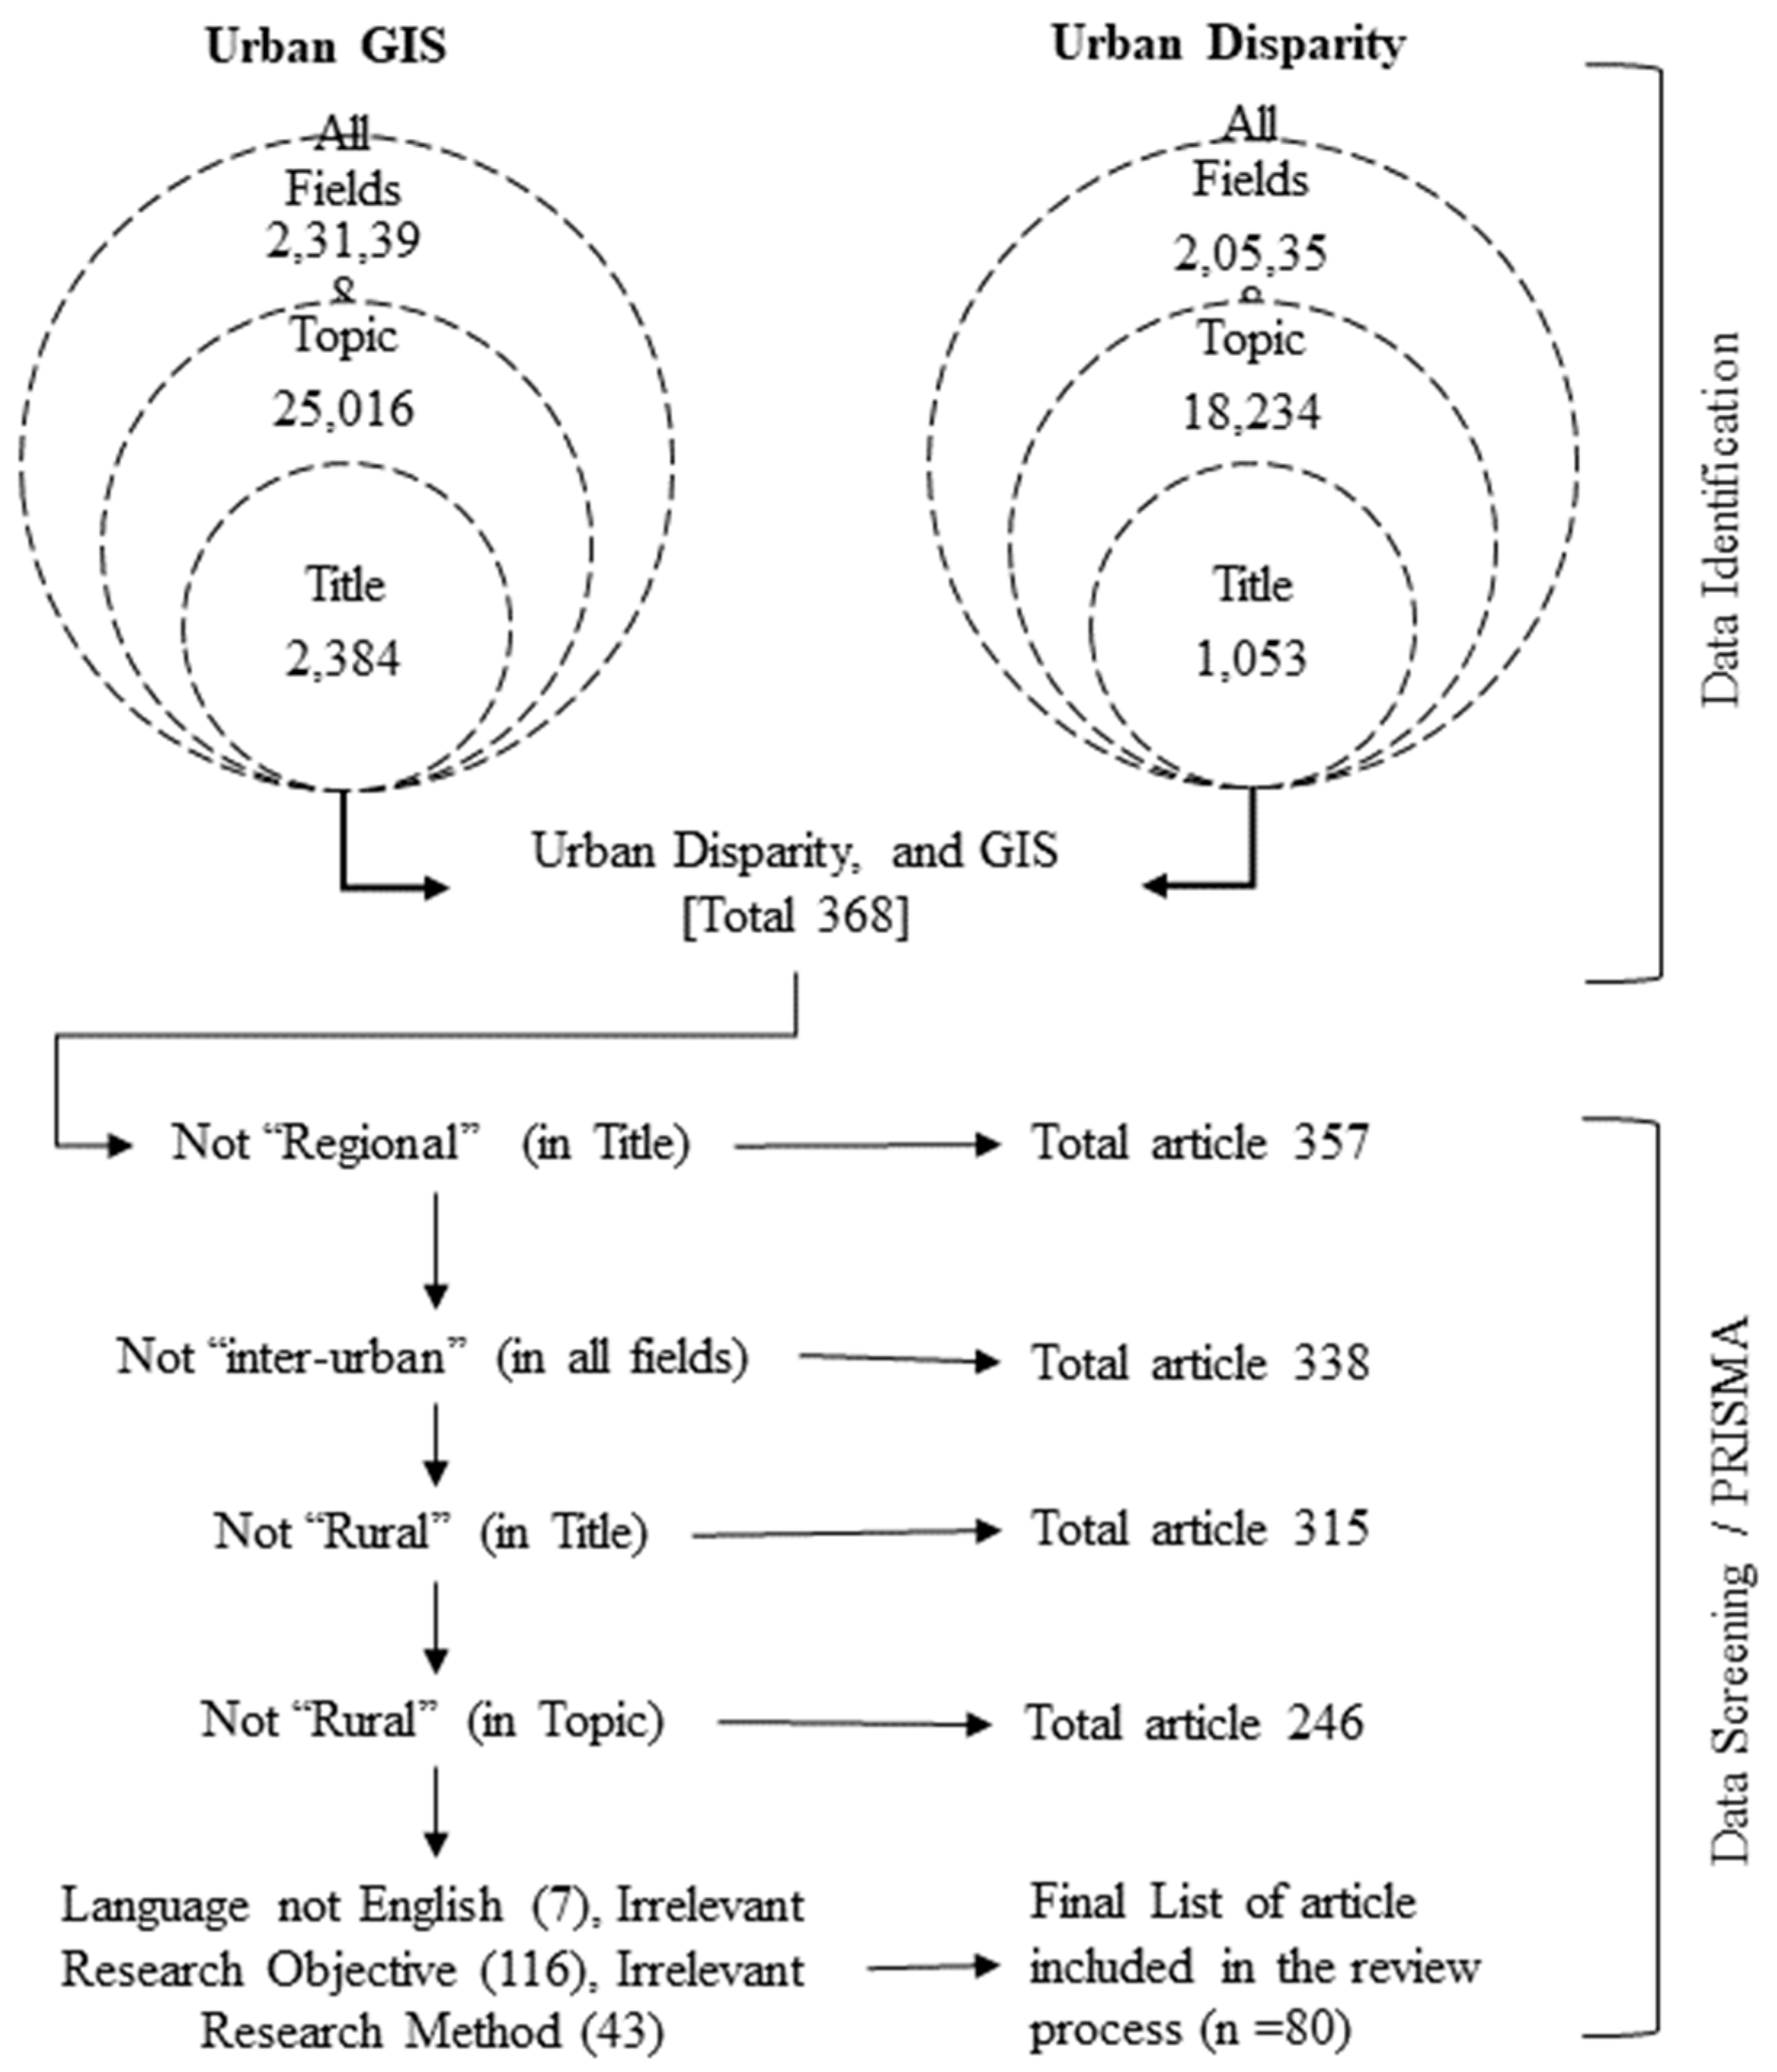
2.1. Data Collection
2.2. VOSviewer as a Bibliometric Tool
3. Results
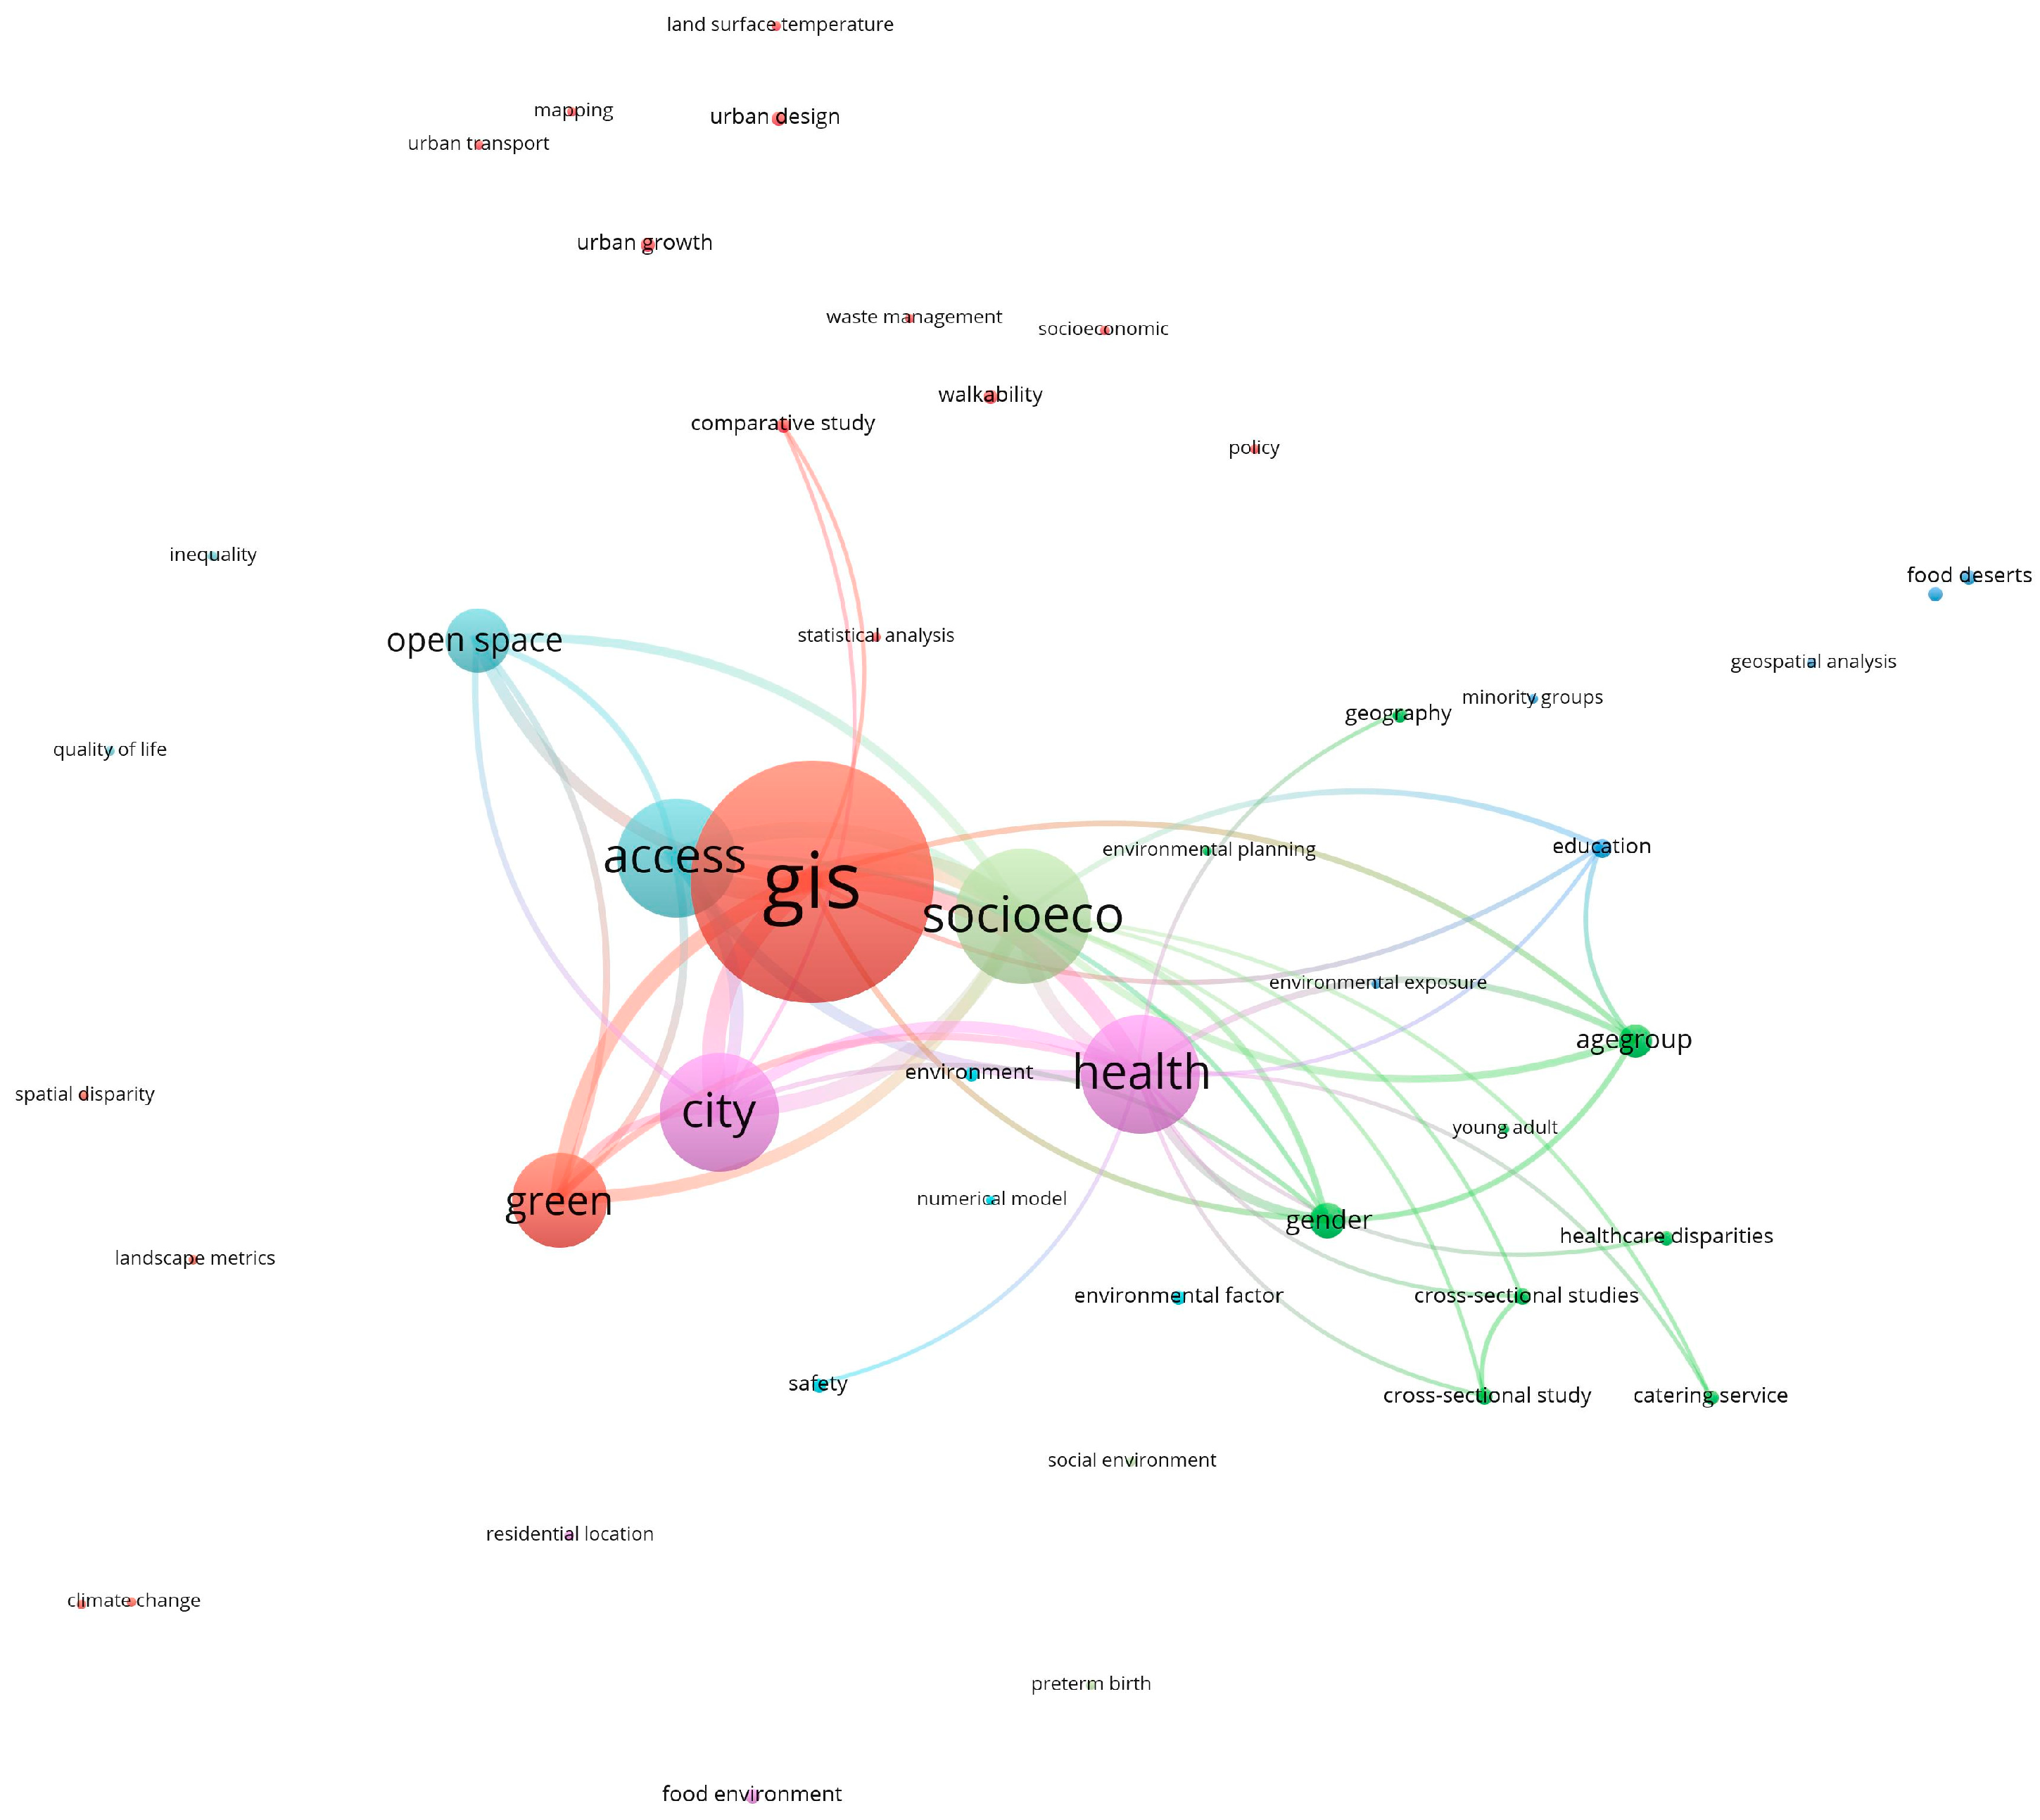
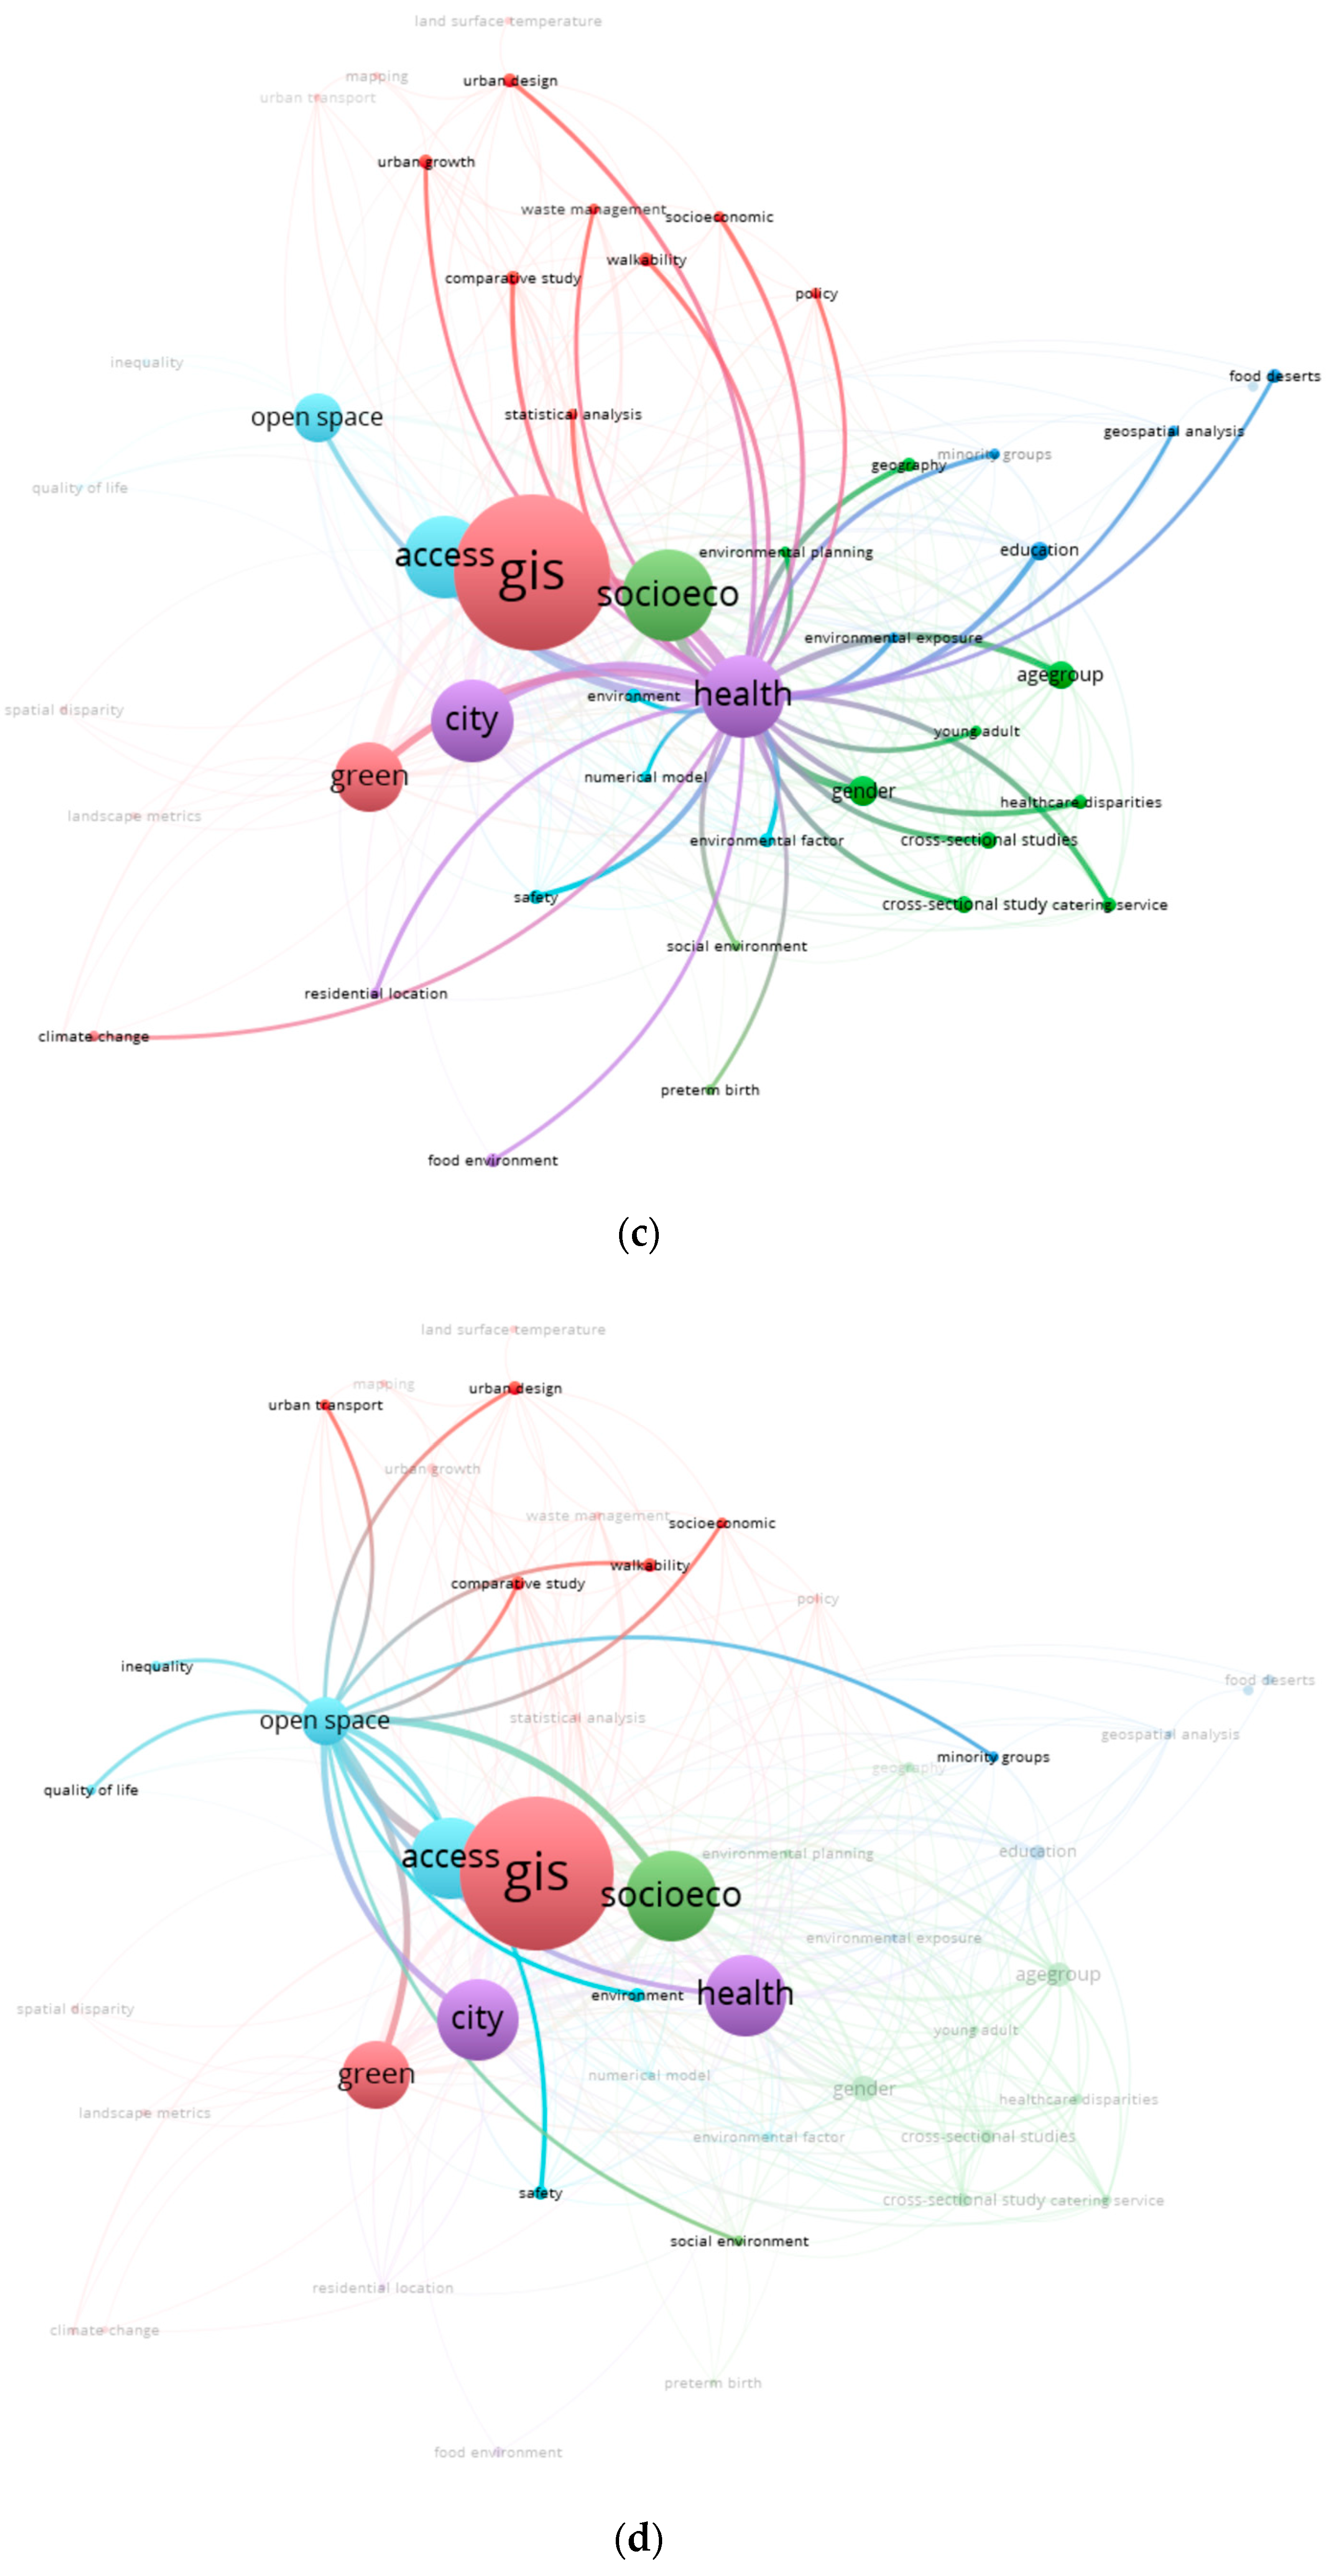
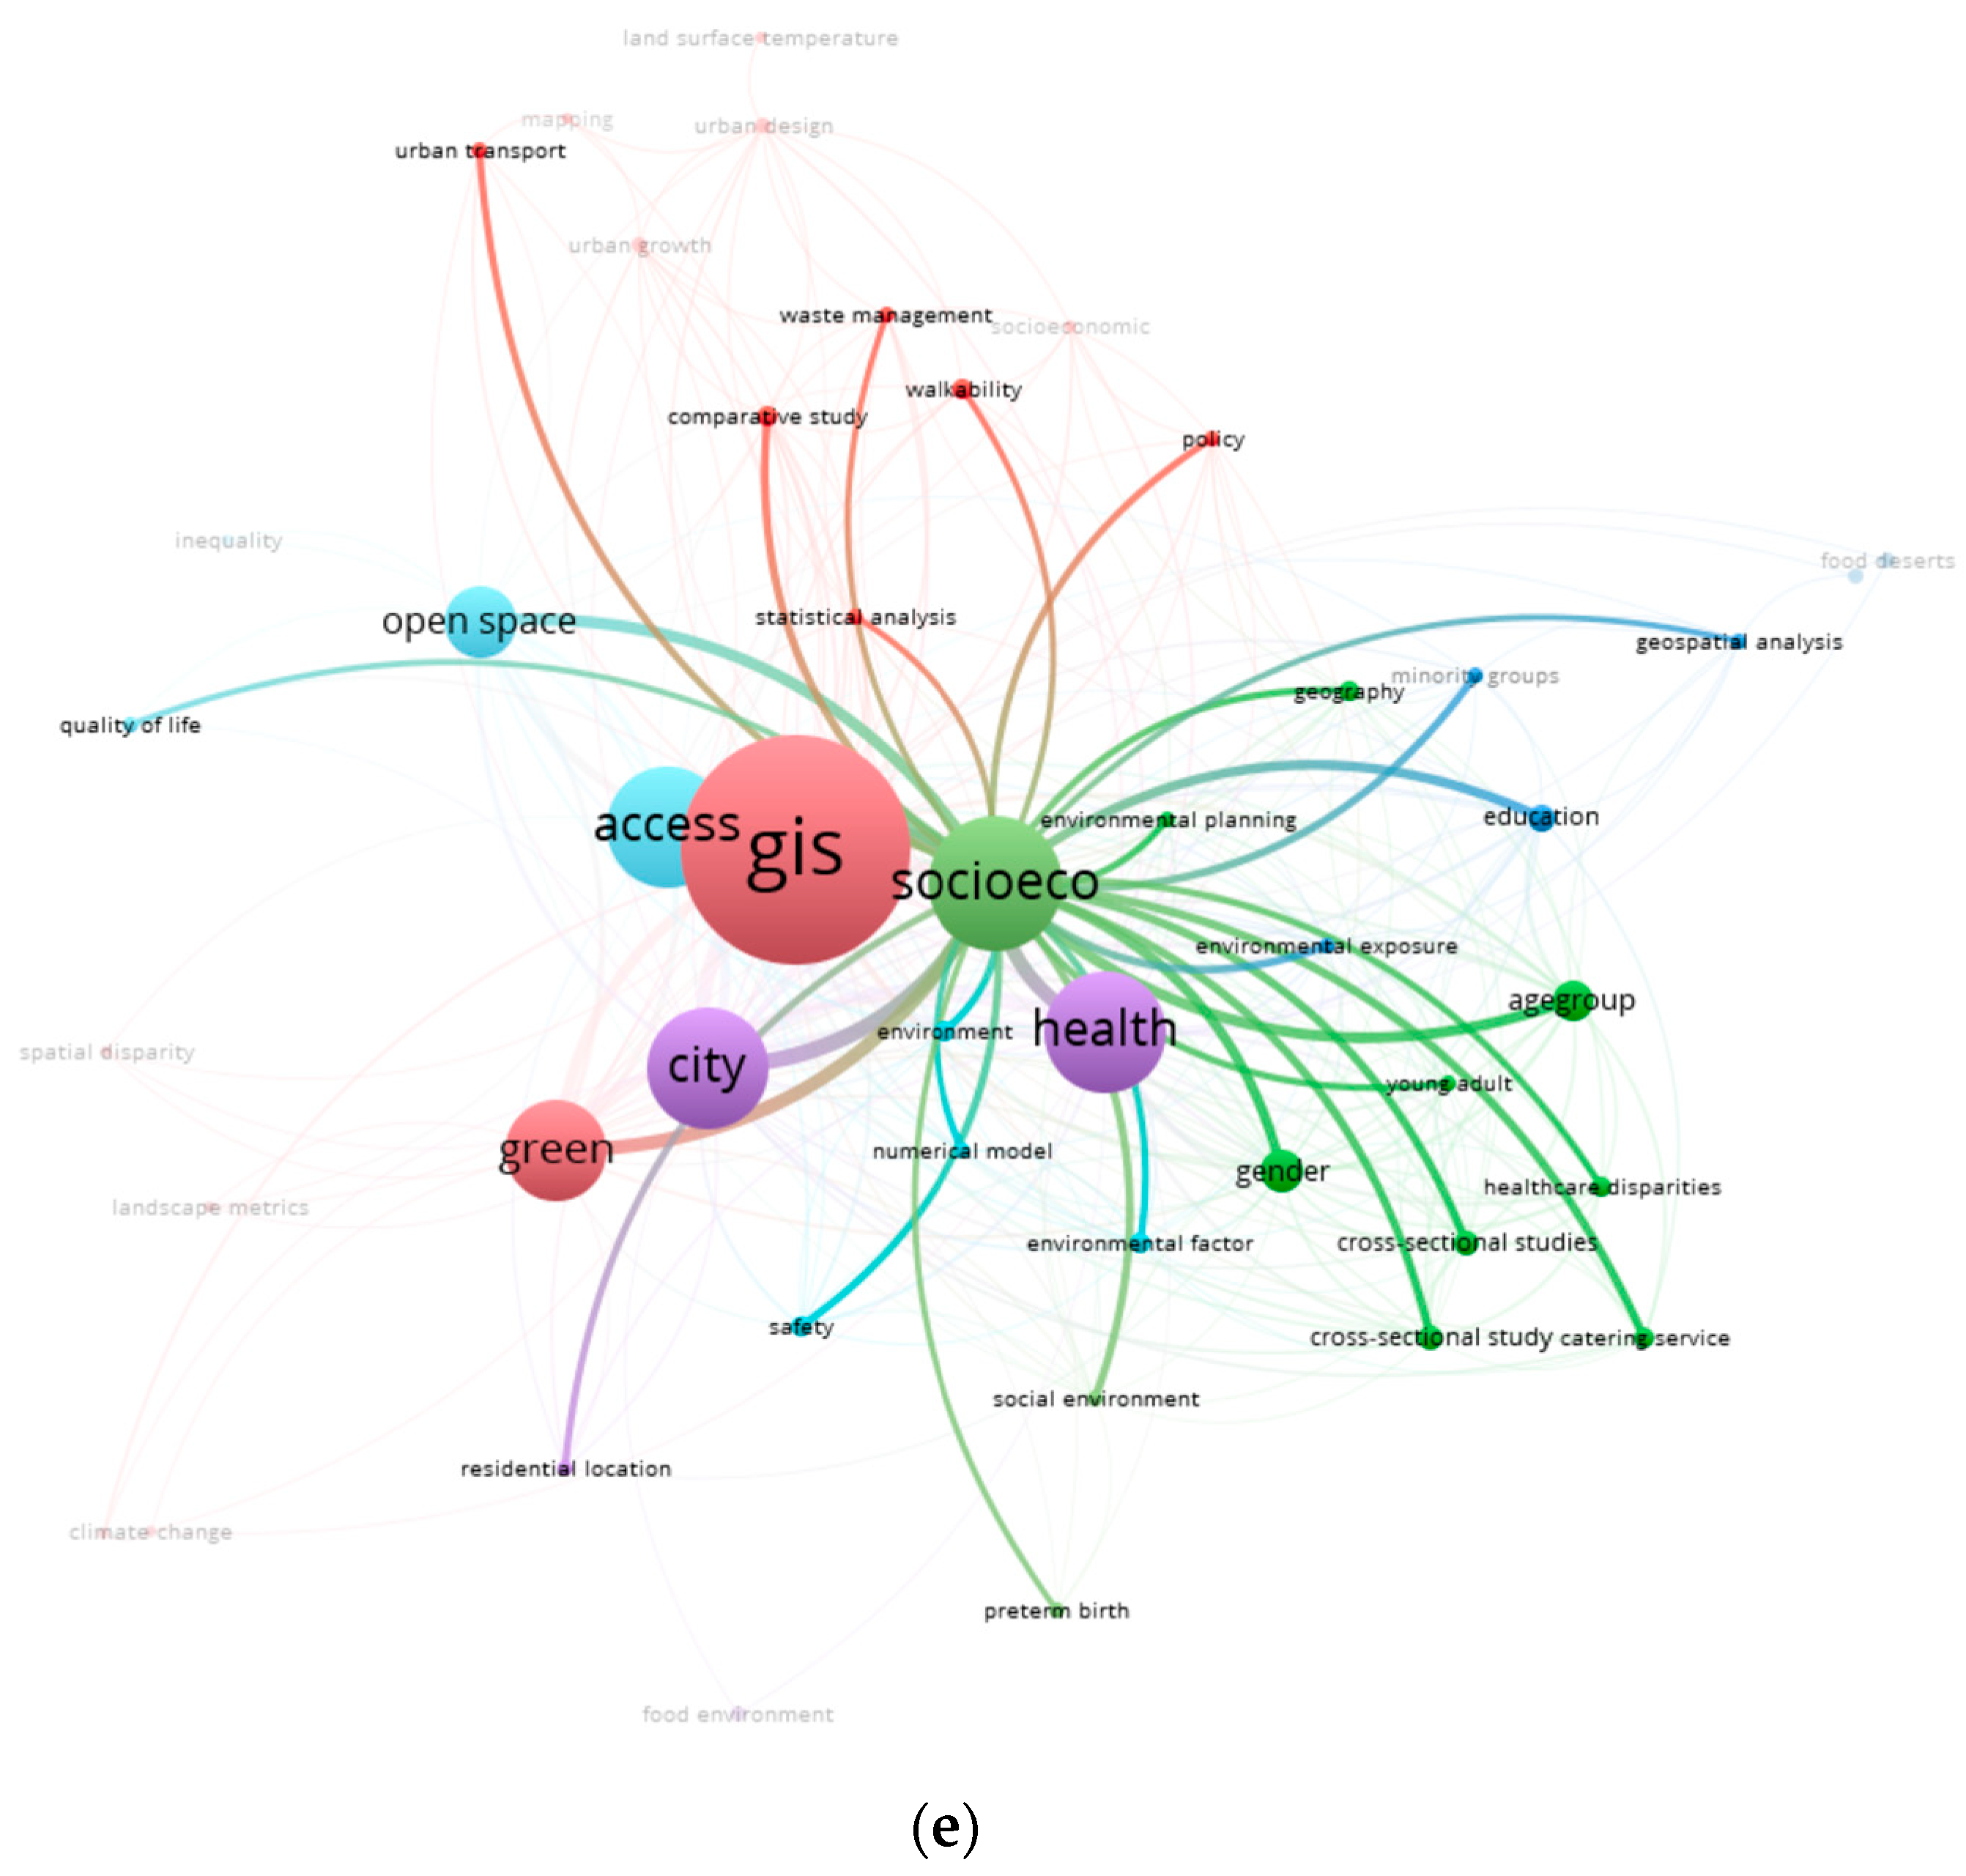
3.1. Five Main Research Clusters Using GIS
3.2. Urban Disparity and Major Bibliographic Clutters
4. Discussion
5. Conclusions
Supplementary Materials
Author Contributions
Funding
Data Availability Statement
Conflicts of Interest
References
- Benati, G.; Calcagni, F.; Matellozzo, F.; Ghermandi, A.; Langemeyer, J. Unequal Access to Cultural Ecosystem Services of Green Spaces within the City of Rome—A Spatial Social Media-Based Analysis. Ecosyst. Serv. 2024, 66, 101594. [Google Scholar] [CrossRef]
- Xu, X.; Zheng, M. High-Speed Rail Construction and Urban Innovation Disparity in China: The Role of Internet Development. Econ. Chang. Restruct. 2023, 56, 3567–3599. [Google Scholar] [CrossRef]
- Dashkevych, O.; Portnov, B.A. Does City Smartness Improve Urban Environment and Reduce Income Disparity? Evidence from an Empirical Analysis of Major Cities Worldwide. Sustain. Cities Soc. 2023, 96, 104711. [Google Scholar] [CrossRef]
- Hoelzl, C.; Schmiz, A.; Hölzl, C.; Schmiz, A. Urban Differences. Disparities within and between Cities. ERDE 2014, 145, 111–112. [Google Scholar]
- Naumann, M. Urban Differences. Disparities within and between Cities. ERDKUNDE 2011, 65, 219–220. [Google Scholar]
- Massey, D.S.; Denton, N.A. Segregation and the Making of the Underclass. Urban Sociol. Read. 1993, 2, 191–201. [Google Scholar]
- Demetillo, M.A.G.; Navarro, A.; Knowles, K.K.; Fields, K.P.; Geddes, J.A.; Nowlan, C.R.; Janz, S.J.; Judd, L.M.; Al-Saadi, J.; Sun, K.; et al. Observing Nitrogen Dioxide Air Pollution Inequality Using High-Spatial-Resolution Remote Sensing Measurements in Houston, Texas. Environ. Sci. Technol. 2020, 54, 9882–9895. [Google Scholar] [CrossRef] [PubMed]
- Bullard, R.D.; Johnson, G.S. Environmentalism and Public Policy: Environmental Justice: Grassroots Activism and Its Impact on Public Policy Decision Making. J. Soc. Issues 2000, 56, 555–578. [Google Scholar] [CrossRef]
- Williams, D.R.; Collins, C. Racial Residential Segregation: A Fundamental Cause of Racial Disparities in Health. Public Health Rep. 2001, 116, 404–416. [Google Scholar] [CrossRef]
- Sampson, R.J. Great American City: Chicago and the Enduring Neighborhood Effect; University of Chicago Press: Chicago, IL, USA, 2012; ISBN 0-226-73456-0. [Google Scholar]
- Urban Development. Available online: https://www.worldbank.org/en/topic/urbandevelopment (accessed on 10 May 2024).
- Calderón-Argelich, A.; Benetti, S.; Anguelovski, I.; Connolly, J.J.; Langemeyer, J.; Baró, F. Tracing and Building up Environmental Justice Considerations in the Urban Ecosystem Service Literature: A Systematic Review. Landsc. Urban Plan. 2021, 214, 104130. [Google Scholar] [CrossRef]
- Endsley, K.A.; Brown, D.G.; Bruch, E. Housing Market Activity Is Associated with Disparities in Urban and Metropolitan Vegetation. Ecosystems 2018, 21, 1593–1607. [Google Scholar] [CrossRef]
- Maheshwari, A.; Jain, Y.; Chopra, S.S. Spatial Inequity Index for Essential Facility Access at Building-Level in Highly Dense Urban Areas. Cities 2024, 149, 104926. [Google Scholar] [CrossRef]
- Mansour, S.; Al Nasiri, N.; Abulibdeh, A.; Ramadan, E. Spatial Disparity Patterns of Green Spaces and Buildings in Arid Urban Areas. Build. Environ. 2022, 208, 108588. [Google Scholar] [CrossRef]
- Sadler, R.C.; Wojciechowski, T.W.; Trangenstein, P.; Harris, A.; Buchalski, Z.; Furr-Holden, D. Linking Historical Discriminatory Housing Patterns to the Contemporary Alcohol Environment. Appl. Spat. Anal. Policy 2023, 16, 561–581. [Google Scholar] [CrossRef] [PubMed]
- Zhou, L.; Xiao, W.; Li, H.; Wang, C.; Wang, X.; Zheng, Z. Identify Social and Job Disparities in the Relationship between Job-Housing Balance and Urban Commuting Using Baidu Trajectory Big Data. Trans. GIS 2024, 28, 258–277. [Google Scholar] [CrossRef]
- Smiley, K.T.; Hakkenberg, C.R. Race and Affluence Shape Spatio-Temporal Urbanization Trends in Greater Houston, 1997 to 2016. Land Use Policy 2020, 99, 105093. [Google Scholar] [CrossRef]
- Yoon, E.-S.; Marmureanu, C.; Brown, R.S. School Choice and the Polarization of Public Schools in A Global City: A Bourdieusian GIS Approach. Peabody J. Educ. 2020, 95, 229–247. [Google Scholar] [CrossRef]
- Pak, S.S.; Ratoza, M.; Cheuy, V. Examining Rehabilitation Access Disparities: An Integrated Analysis of Electronic Health Record Data and Population Characteristics through Bivariate Choropleth Mapping. BMC Health Serv. Res. 2024, 24, 170. [Google Scholar] [CrossRef] [PubMed]
- Mao, K.; Li, J.; Yan, H. Measuring the Spatial Accessibility of Parks in Wuhan, China, Using a Comprehensive Multimodal 2SFCA Method. ISPRS Int. J. Geo-Inf. 2023, 12, 357. [Google Scholar] [CrossRef]
- Dai, D. Racial/Ethnic and Socioeconomic Disparities in Urban Green Space Accessibility: Where to Intervene? Landsc. Urban Plan. 2011, 102, 234–244. [Google Scholar] [CrossRef]
- Lardier, D.T.T.; Blackwell, M.A.A.; Beene, D.; Lin, Y. Social Vulnerabilities and Spatial Access to Primary Healthcare through Car and Public Transportation System in the Albuquerque, NM, Metropolitan Area: Assessing Disparities through GIS and Multilevel Modeling. J. Urban Health-Bull. N. Y. Acad. Med. 2023, 100, 88–102. [Google Scholar] [CrossRef]
- Farber, S.; Bartholomew, K.; Li, X.; Paez, A.; Habib, K.M.N. Assessing Social Equity in Distance Based Transit Fares Using a Model of Travel Behavior. Transp. Res. Part-Policy Pract. 2014, 67, 291–303. [Google Scholar] [CrossRef]
- Attard, M.; Guzman, L.A.; Oviedo, D. Urban Space Distribution: The Case for a More Equitable Mobility System. Case Stud. Transp. Policy 2023, 14, 101096. [Google Scholar] [CrossRef]
- Huynh, H.N. Analysis of Public Transport (in) Accessibility and Land-Use Pattern in Different Areas in Singapore. In International Conference on Computational Science; Springer International Publishing: Cham, Switzerland, 2022; pp. 154–161. [Google Scholar]
- Kerr, J.; Frank, L.; Sallis, J.F.; Saelens, B.; Glanz, K.; Chapman, J. Predictors of Trips to Food Destinations. Int. J. Behav. Nutr. Phys. Act. 2012, 9, 58. [Google Scholar] [CrossRef]
- Li, J.; Zhan, W.; Hong, F.; Lai, J.; Dong, P.; Liu, Z.; Wang, C.; Huang, F.; Li, L.; Wang, C.; et al. Similarities and Disparities in Urban Local Heat Islands Responsive to Regular-, Stable-, and Counter-Urbanization: A Case Study of Guangzhou, China. Build. Environ. 2021, 199, 107935. [Google Scholar] [CrossRef]
- Chakraborty, T.; Hsu, A.; Manya, D.; Sheriff, G. A Spatially Explicit Surface Urban Heat Island Database for the United States: Characterization, Uncertainties, and Possible Applications. ISPRS J. Photogramm. Remote Sens. 2020, 168, 74–88. [Google Scholar] [CrossRef]
- Casey, R.; Chaix, B.; Weber, C.; Schweitzer, B.; Charreire, H.; Salze, P.; Badariotti, D.; Banos, A.; Oppert, J.-M.; Simon, C. Spatial Accessibility to Physical Activity Facilities and to Food Outlets and Overweight in French Youth. Int. J. Obes. 2012, 36, 914–919. [Google Scholar] [CrossRef] [PubMed]
- Csomós, G.; Farkas, J.Z.; Kovács, Z. A GIS-Based Assessment of Different Income Groups’ Access to Multiple Types of Green Areas in Budapest, Hungary. Habitat Int. 2024, 146, 103054. [Google Scholar] [CrossRef]
- Semenzato, P.; Costa, A.; Campagnaro, T. Accessibility to Urban Parks: Comparing GIS Based Measures in the City of Padova (Italy). Urban For. Urban Green. 2023, 82, 127896. [Google Scholar] [CrossRef]
- Pica, A.; Lämmle, L.; Burnelli, M.; Del Monte, M.; Donadio, C.; Faccini, F.; Lazzari, M.; Mandarino, A.; Melelli, L.; Perez Filho, A.; et al. Urban Geomorphology Methods and Applications as a Guideline for Understanding the City Environment. Land 2024, 13, 907. [Google Scholar] [CrossRef]
- Pala, Ö.N.; Acar, S. Assessing a Greening Tool through the Lens of Green Gentrification: Socio-Spatial Change around the Nation’s Gardens of Istanbul. Cities 2024, 150, 105023. [Google Scholar] [CrossRef]
- Neckerman, K.M.; Lovasi, G.S.; Davies, S.; Purciel, M.; Quinn, J.; Feder, E.; Raghunath, N.; Wasserman, B.; Rundle, A. Disparities in Urban Neighborhood Conditions: Evidence from GIS Measures and Field Observation in New York City. J. Public Health Policy 2009, 30, S264–S285. [Google Scholar] [CrossRef] [PubMed]
- Bosisio, A.; Moreno-Jiménez, A. Spatially Disaggregated Assessment of Environmental Inequalities among Vulnerable Groups Due to Urban Rainstorm Flooding. Appl. Spat. Anal. Policy 2022, 15, 1263–1285. [Google Scholar] [CrossRef]
- Stromberg, P.M.; Öhrner, E.; Brockwell, E.; Liu, Z. Valuing Urban Green Amenities with an Inequality Lens. Ecol. Econ. 2021, 186, 107067. [Google Scholar] [CrossRef]
- Zhang, L.; Zhou, T.; Mao, C. Does the Difference in Urban Public Facility Allocation Cause Spatial Inequality in Housing Prices? Evidence from Chongqing, China. Sustainability 2019, 11, 6096. [Google Scholar] [CrossRef]
- Roldán-Valcarce, A.; Jato-Espino, D.; Manchado, C.; Bach, P.M.; Kuller, M. Vulnerability to Urban Flooding Assessed Based on Spatial Demographic, Socio-Economic and Infrastructure Inequalities. Int. J. Disaster Risk Reduct. 2023, 95, 103894. [Google Scholar] [CrossRef]
- Graham, S.; Lewis, B.; Flanagan, B.; Watson, M.; Peipins, L. Travel by Public Transit to Mammography Facilities in 6 US Urban Areas. J. Transp. Health 2015, 2, 602–609. [Google Scholar] [CrossRef] [PubMed]
- Beach, S.R.; Kinnee, E.; Schulz, R. Caregiving and Place: Combining Geographic Information System (GIS) and Survey Methods to Examine Neighborhood Context and Caregiver Outcomes. Innov. Aging 2019, 3, igz025. [Google Scholar] [CrossRef]
- Pallathadka, A.; Pallathadka, L.; Rao, S.; Chang, H.; Van Dommelen, D. Using GIS-Based Spatial Analysis to Determine Urban Greenspace Accessibility for Different Racial Groups in the Backdrop of COVID-19: A Case Study of Four US Cities. Geojournal 2022, 87, 4879–4899. [Google Scholar] [CrossRef]
- La Rosa, D. Accessibility to Greenspaces: GIS Based Indicators for Sustainable Planning in a Dense Urban Context. Ecol. Indic. 2014, 42, 122–134. [Google Scholar] [CrossRef]
- Gomes, A.; Burdett, R. Spatial and Visual Comparison Analysis of Health Disparities in London Neighbourhoods: The Case of Southwark and Lambeth. J. Hosp. Manag. Health Policy 2024, 8. [Google Scholar] [CrossRef]
- Biljecki, F.; Zhao, T.; Liang, X.; Hou, Y. Sensitivity of Measuring the Urban Form and Greenery Using Street-Level Imagery: A Comparative Study of Approaches and Visual Perspectives. Int. J. Appl. Earth Obs. Geoinf. 2023, 122, 103385. [Google Scholar] [CrossRef]
- Korah, P.I.; Akaateba, M.A.; Akanbang, B.A.A. Spatio-Temporal Patterns and Accessibility of Green Spaces in Kumasi, Ghana. Habitat Int. 2024, 144, 103010. [Google Scholar] [CrossRef]
- Guo, Y.; Zhao, S.; Zhao, X.; Wang, H.; Shi, W.; Song, C.; Li, J.; Lin, T.; Ye, H.; Zhan, G. Evaluation of the Spatiotemporal Change of Ecological Quality under the Context of Urban Expansion-A Case Study of Typical Urban Agglomerations in China. Remote Sens. 2024, 16, 45. [Google Scholar] [CrossRef]
- Lian, J.; Nijhuis, S.; Bracken, G.; Wu, X.; Wu, X.; Chen, D. Conservation and Development of the Historic Garden in a Landscape Context: A Systematic Literature Review. Landsc. Urban Plan. 2024, 246, 105027. [Google Scholar] [CrossRef]
- Page, M.J.; McKenzie, J.E.; Bossuyt, P.M.; Boutron, I.; Hoffmann, T.C.; Mulrow, C.D.; Shamseer, L.; Tetzlaff, J.M.; Akl, E.A.; Brennan, S.E. The PRISMA 2020 Statement: An Updated Guideline for Reporting Systematic Reviews. BMJ 2021, 372, n71. [Google Scholar] [CrossRef]
- Miller, E.B.; Seyfried, A.P.; Pender, S.E.; Heard, K.; Meindl, G.A. Racial Disparities in Access to Public Green Spaces: Using Geographic Information Systems to Identify Underserved Populations in a Small American City. Environ. Justice 2022, 15, 246–256. [Google Scholar] [CrossRef]
- Bloch, J.R.; Cordivano, S.; Gardner, M.; Barkin, J. Beyond Bus Fare: Deconstructing Prenatal Care Travel among Low-Income Urban Mothers through a Mix Methods GIS Study. Contemp. Nurse 2018, 54, 233–245. [Google Scholar] [CrossRef]
- Braun, L.M.; Rodriguez, D.A.; Gordon-Larsen, P. Social (in)Equity in Access to Cycling Infrastructure: Cross-Sectional Associations between Bike Lanes and Area-Level Sociodemographic Characteristics in 22 Large US Cities. J. Transp. Geogr. 2019, 80, 102544. [Google Scholar] [CrossRef]
- Chavehpour, Y.; Rashidian, A.; Woldemichael, A.; Takian, A. Inequality in Geographical Distribution of Hospitals and Hospital Beds in Densely Populated Metropolitan Cities of Iran. BMC Health Serv. Res. 2019, 19, 614. [Google Scholar] [CrossRef]
- Costa, C.; Tenedorio, J.A.; Santana, P. Disparities in Geographical Access to Hospitals in Portugal. ISPRS Int. J. Geo-Inf. 2020, 9, 567. [Google Scholar] [CrossRef]
- Fasihi, H. Urban Parks and Their Accessibility in Tehran, Iran. Environ. Justice 2019, 12, 242–249. [Google Scholar] [CrossRef]
- Gao, Q.-L.; Yue, Y.; Tu, W.; Cao, J.; Li, Q.-Q. Segregation or Integration? Exploring Activity Disparities between Migrants and Settled Urban Residents Using Human Mobility Data. Trans. GIS 2021, 25, 2791–2820. [Google Scholar] [CrossRef]
- Ghasemi, K.; Behzadfar, M.; Borhani, K. Spatial Analysis of Leisure Land Uses in Tehran: Assessing Inequity Using the MARCOS Method within a GIS Framework. Heliyon 2023, 9, e19691. [Google Scholar] [CrossRef] [PubMed]
- Guan, J.; Wang, R.; Van Berkel, D.; Liang, Z. How Spatial Patterns Affect Urban Green Space Equity at Different Equity Levels: A Bayesian Quantile Regression Approach. Landsc. Urban Plan. 2023, 233, 104709. [Google Scholar] [CrossRef]
- Ha, H.J.; Lee, J.; Kim, J.; Kim, Y. Uncovering Inequalities in Food Accessibility between Koreans and Japanese in 1930s Colonial Seoul Using GIS and Open-Source Transport Analytics Tools. Sustainability 2022, 14, 11852. [Google Scholar] [CrossRef]
- Hoffimann, E.; Barros, H.; Ribeiro, A.I. Socioeconomic Inequalities in Green Space Quality and Accessibility—Evidence from a Southern European City. Int. J. Environ. Res. Public Health 2017, 14, 916. [Google Scholar] [CrossRef] [PubMed]
- Houston, D.; Ong, P. Arts Accessibility to Major Museums and Cultural/Ethnic Institutions in Los Angeles: Can School Tours Overcome Neighborhood Disparities? Environ. Plan. -Econ. Space 2013, 45, 728–748. [Google Scholar] [CrossRef]
- Kestens, Y.; Daniel, M. Social Inequalities in Food Exposure Around Schools in an Urban Area. Am. J. Prev. Med. 2010, 39, 33–40. [Google Scholar] [CrossRef] [PubMed]
- Khashoggi, B.F.; Murad, A. Use of 2SFCA Method to Identify and Analyze Spatial Access Disparities to Healthcare in Jeddah, Saudi Arabia. Appl. Sci. 2021, 11, 9537. [Google Scholar] [CrossRef]
- Larsen, K.; Gilliland, J. Mapping the Evolution of “food Deserts” in a Canadian City: Supermarket Accessibility in London, Ontario, 1961–2005. Int. J. Health Geogr. 2008, 7, 16. [Google Scholar] [CrossRef] [PubMed]
- Li, L.; Du, Q.; Ren, F.; Ma, X. Assessing Spatial Accessibility to Hierarchical Urban Parks by Multi-Types of Travel Distance in Shenzhen, China. Int. J. Environ. Res. Public Health 2019, 16, 1038. [Google Scholar] [CrossRef]
- Liu, M.; Luo, S.; Du, X. Exploring Equity in Healthcare Services: Spatial Accessibility Changes during Subway Expansion. ISPRS Int. J. GEO-Inf. 2021, 10, 439. [Google Scholar] [CrossRef]
- Liu, M.; Zhang, Z.-M.; Yang, M.-Y.; Geng, Y.-P.; Ou, X.-K. Analysis of Urban Public Greenspace Pattern Based on Landscape Metrics in Kunming. In Proceedings of the Civil Engineering and Urban Planning IV: Proceedings of the 4th International Conference on Civil Engineering and Urban Planning, Beijing, China, 25–27 July 2015; Liu, Y.-M., Tang, B., Tong, Z.X., Bao, Z.Q., Fu, D., Eds.; CRC Press: Boca Raton, FL, USA, 2016; pp. 127–131. [Google Scholar]
- Lofti, S.; Koohsari, M.J. Measuring Objective Accessibility to Neighborhood Facilities in the City (A Case Study: Zone 6 in Tehran, Iran). Cities 2009, 26, 133–140. [Google Scholar] [CrossRef]
- Maroko, A.R.; Maantay, J.A.; Sohler, N.L.; Grady, K.L.; Arno, P.S. The Complexities of Measuring Access to Parks and Physical Activity Sites in New York City: A Quantitative and Qualitative Approach. Int. J. Health Geogr. 2009, 8, 34. [Google Scholar] [CrossRef] [PubMed]
- Moos, N.; Juergens, C.; Redecker, A.P. Combined Small- and Large-Scale Geo-Spatial Analysis of the Ruhr Area for an Environmental Justice Assessment. Sustainability 2022, 14, 3447. [Google Scholar] [CrossRef]
- Mosammam, H.M.; Sarrafi, M.; Nia, J.T.; Mosammam, A.M. Measuring Food Deserts via GIS-Based Multicriteria Decision Making: The Case of Tehran. Prof. Geogr. 2017, 69, 455–471. [Google Scholar] [CrossRef]
- Ohri-Vachaspati, P.; DeWeese, R.S.; Acciai, F.; DeLia, D.; Tulloch, D.; Tong, D.; Lorts, C.; Yedidia, M.J. Healthy Food Access in Low-Income High-Minority Communities: A Longitudinal Assessment-2009–2017. Int. J. Environ. Res. Public Health 2019, 16, 2354. [Google Scholar] [CrossRef] [PubMed]
- Park, C.; Chang, J.S. Spatial Equity of Excess Commuting by Transit in Seoul. Transp. Plan. Technol. 2020, 43, 101–112. [Google Scholar] [CrossRef]
- Patino, J.E. Analyzing Long-Term Availability of Urban Green Space by Socioeconomic Status in Medellin, Colombia, Using Open Data and Toolst. In Proceedings of the 2020 IEEE Latin American GRSS & ISPRS Remote Sensing Conference (LAGIRS), Santiago, Chile, 22–26 March 2020; pp. 87–92. [Google Scholar]
- Pipitone, J.M.; Jovic, S. Urban Green Equity and COVID-19: Effects on Park Use and Sense of Belonging in New York City. Urban For. Urban Green. 2021, 65, 127338. [Google Scholar] [CrossRef]
- Salehabadi, A.M.; Ghoddusifar, S.H.; Mohammadpor, A. Creation of an Urban Park New ASD Index with a Spatial Distribution Coefficient (Case Study: Region 1 of Tehran). Inf. Construccion 2023, 75, e512. [Google Scholar] [CrossRef]
- Schensul, J.J.; Nair, S.; Bilgi, S.; Cromley, E.; Kadam, V.; Mello, S.D.; Donta, B. Availability, Accessibility and Promotion of Smokeless Tobacco in a Low-Income Area of Mumbai. Tob. Control 2013, 22, 324–330. [Google Scholar] [CrossRef]
- Simelius, S. Networks of Inequality: Access to Water in Roman Pompeii. J. Comput. Appl. Archaeol. 2024, 7, 54–74. [Google Scholar] [CrossRef]
- Stepniak, M.; Goliszek, S. Spatio-Temporal Variation of Accessibility by Public Transport-The Equity Perspective. In The Rise of Big Spatial Data; Springer: Cham, Switzerland, 2017; pp. 241–261. [Google Scholar]
- Xiao, Y.; Wang, D.; Fang, J. Exploring the Disparities in Park Access through Mobile Phone Data: Evidence from Shanghai, China. Landsc. Urban Plan. 2019, 181, 80–91. [Google Scholar] [CrossRef]
- Zhou, X.; Kim, J. Social Disparities in Tree Canopy and Park Accessibility: A Case Study of Six Cities in Illinois Using GIS and Remote Sensing. Urban For. Urban Green. 2013, 12, 88–97. [Google Scholar] [CrossRef]
- Bruton, C.M.; Floyd, M.F. Disparities in Built and Natural Features of Urban Parks: Comparisons by Neighborhood Level Race/Ethnicity and Income. J. Urban Health-Bull. N. Y. Acad. Med. 2014, 91, 894–907. [Google Scholar] [CrossRef]
- Dai, D. Black Residential Segregation, Disparities in Spatial Access to Health Care Facilities, and Late-Stage Breast Cancer Diagnosis in Metropolitan Detroit. Health Place 2010, 16, 1038–1052. [Google Scholar] [CrossRef]
- Eckert, J.; Shetty, S. Food Systems, Planning and Quantifying Access: Using GIS to Plan for Food Retail. Appl. Geogr. 2011, 31, 1216–1223. [Google Scholar] [CrossRef]
- Fulcher, C.; Kaukinen, C. Mapping and Visualizing the Location HIV Service Providers: An Exploratory Spatial Analysis of Toronto Neighborhoods. AIDS Care—Psychol. Socio-Med. Asp. AIDSHIV 2005, 17, 386–396. [Google Scholar] [CrossRef]
- Guerrero, E.G.; Kao, D. Racial/Ethnic Minority and Low-Income Hotspots and Their Geographic Proximity to Integrated Care Providers. Subst. Abuse Treat. Prev. Policy 2013, 8, 34. [Google Scholar] [CrossRef]
- Koc, B.C.; Osmond, P.; Peters, A.; Irger, M. Mapping Local Climate Zones for Urban Morphology Classification Based on Airborne Remote Sensing Data. In Proceedings of the 2017 Joint Urban Remote Sensing Event (JURSE), Dubai, United Arab Emirates, 6–8 March 2017. [Google Scholar]
- Koohsari, M.J. Access to Public Open Space: Is Distribution Equitable across Different Socio-Economic Areas. J. Urban Environ. Eng. 2011, 5, 67–72. [Google Scholar] [CrossRef]
- Mullachery, P.H.; Li, R.; Melly, S.; Kolker, J.; Barber, S.; Roux, A.V.D.; Bilal, U. Inequities in Spatial Accessibility to COVID-19 Testing in 30 Large US Cities. Soc. Sci. Med. 2022, 310, 115307. [Google Scholar] [CrossRef] [PubMed]
- Oh, K.; Jeong, S. Assessing the Spatial Distribution of Urban Parks Using GIS. Landsc. Urban Plan. 2007, 82, 25–32. [Google Scholar] [CrossRef]
- Radwan, F.; Alazba, A.A.; Mossad, A. Analyzing Urban Watersheds Morphometric in Arid and Semiarid Regions Using the Complementarity of RST and GIS. Arab. J. Geosci. 2020, 13, 1237. [Google Scholar] [CrossRef]
- Reames, T.G. Targeting Energy Justice: Exploring Spatial, Racial/Ethnic and Socioeconomic Disparities in Urban Residential Heating Energy Efficiency. Energy Policy 2016, 97, 549–558. [Google Scholar] [CrossRef]
- Sikorska, D.; Laszkiewicz, E.; Krauze, K.; Sikorski, P. The Role of Informal Green Spaces in Reducing Inequalities in Urban Green Space Availability to Children and Seniors. Environ. Sci. Policy 2020, 108, 144–154. [Google Scholar] [CrossRef]
- Suhong, Z.; Lifang, D.; Meiyu, H. Spatial Analysis of Commuting Mode Choice in Guangzhou, China. Chin. Geogr. Sci. 2013, 23, 353–364. [Google Scholar]
- Xing, L.; Liu, Y.; Wang, B.; Wang, Y.; Liu, H. An Environmental Justice Study on Spatial Access to Parks for Youth by Using an Improved 2SFCA Method in Wuhan, China. Cities 2020, 96, 102405. [Google Scholar] [CrossRef]
- Baro, F.; Camacho, D.A.; Perez Del Pulgar, C.; Triguero-Mas, M.; Anguelovski, I. School Greening: Right or Privilege? Examining Urban Nature within and around Primary Schools through an Equity Lens. Landsc. Urban Plan. 2021, 208, 104019. [Google Scholar] [CrossRef]
- Burford, K.; Ganzar, L.A.; Lanza, K.; Kohl, H.W., III; Hoelscher, D.M. School-Level Economic Disparities in Police-Reported Crimes and Active Commuting to School. Int. J. Environ. Res. Public Health 2021, 18, 10885. [Google Scholar] [CrossRef]
- Clarke, M.J.; Maantay, J.A. Optimizing Recycling in All of New York City’s Neighborhoods: Using GIS to Develop the REAP Index for Improved Recycling Education, Awareness, and Participation. Resour. Conserv. Recycl. 2006, 46, 128–148. [Google Scholar] [CrossRef]
- Laszkiewicz, E.; Sikorska, D. Children’s Green Walk to School: An Evaluation of Welfare-Related Disparities in the Visibility of Greenery among Children. Environ. Sci. Policy 2020, 110, 1–13. [Google Scholar] [CrossRef]
- McGrath, K.; Bonuck, K.; Mann, M. Exploratory Spatial Analysis of Autism Rates in New York School Districts: Role of Sociodemographic and Language Differences. J. Neurodev. Disord. 2020, 12, 35. [Google Scholar] [CrossRef] [PubMed]
- McLoughlin, G.M.; McCarthy, J.A.; McGuirt, J.T.; Singleton, C.R.; Dunn, C.G.; Gadhoke, P. Addressing Food Insecurity through a Health Equity Lens: A Case Study of Large Urban School Districts during the COVID-19 Pandemic. J. Urban Health-Bull. N. Y. Acad. Med. 2020, 97, 759–775. [Google Scholar] [CrossRef] [PubMed]
- Abutaleb, K.; Mudede, M.F.; Nkongolo, N.; Newete, S.W. Estimating Urban Greenness Index Using Remote Sensing Data: A Case Study of an Affluent vs Poor Suburbs in the City of Johannesburg. Egypt. J. Remote Sens. Space Sci. 2021, 24, 343–351. [Google Scholar] [CrossRef]
- Anwar, M.M.; Hashim, M.; Aziz, A.; Stocco, A.; Abdo, H.G.; Almohamad, H.; Al Dughairi, A.A.; Al-Mutiry, M. Urban Green Spaces Distribution and Disparities in Congested Populated Areas: A Geographical Assessment from Pakistan. Sustainability 2023, 15, 8059. [Google Scholar] [CrossRef]
- Bikomeye, J.C.; Namin, S.; Anyanwu, C.; Rublee, C.S.; Ferschinger, J.; Leinbach, K.; Lindquist, P.; Hoppe, A.; Hoffman, L.; Hegarty, J.; et al. Resilience and Equity in a Time of Crises: Investing in Public Urban Greenspace Is Now More Essential than Ever in the US and Beyond. Int. J. Environ. Res. Public Health 2021, 18, 8420. [Google Scholar] [CrossRef]
- Buckland, M.; Pojani, D. Green Space Accessibility in Europe: A Comparative Study of Five Major Cities. Eur. Plan. Stud. 2022, 31, 146–167. [Google Scholar] [CrossRef]
- Chen, Z.; Huang, G. Greenspace to Meet People’s Demand: A Case Study of Beijing in 2005 and 2015. Remote Sens. 2021, 13, 4310. [Google Scholar] [CrossRef]
- Coutts, C.; Miles, R. Greenways as Green Magnets: The Relationship between the Race of Greenway Users and Race in Proximal Neighborhoods. J. Leis. Res. 2011, 43, 317–333. [Google Scholar] [CrossRef]
- Csomós, G.; Farkas, J.Z.; Kovács, Z. Access to Urban Green Spaces and Environmental Inequality in Post-Socialist Cities. Hung. Geogr. Bull. 2020, 69, 191–207. [Google Scholar] [CrossRef]
- Gargiulo, I.; Garcia, X.; Benages-Albert, M.; Martinez, J.; Pfeffer, K.; Vall-Casas, P. Women’s Safety Perception Assessment in an Urban Stream Corridor: Developing a Safety Map Based on Qualitative GIS. Landsc. Urban Plan. 2020, 198, 103779. [Google Scholar] [CrossRef]
- Ghanem, A.; Edirisinghe, R. Socio-Economic Disparities in Greenspace Quality: Insights from the City of Melbourne. Smart Sustain. Built Environ. 2024, 13, 309–329. [Google Scholar] [CrossRef]
- Iraegui, E.; Augusto, G.; Cabral, P. Assessing Equity in the Accessibility to Urban Green Spaces According to Different Functional Levels. ISPRS Int. J. Geo-Inf. 2020, 9, 308. [Google Scholar] [CrossRef]
- Kuang, W.; Dou, Y. Investigating the Patterns and Dynamics of Urban Green Space in China’s 70 Major Cities Using Satellite Remote Sensing. Remote Sens. 2020, 12, 1929. [Google Scholar] [CrossRef]
- Leng, S.; Sun, R.; Yan, M.; Chen, L. Prevalent Underestimation of Tree Cooling Efficiency Attributed to Urban Intrinsic Heterogeneity. Sustain. Cities Soc. 2024, 103, 105277. [Google Scholar] [CrossRef]
- Matthew McConnachie, M.; Shackleton, C.M. Public Green Space Inequality in Small Towns in South Africa. Habitat Int. 2010, 34, 244–248. [Google Scholar] [CrossRef]
- Mudede, M.F.; Newete, S.W.; Abutaleb, K.; Nkongolo, N. Monitoring the Urban Environment Quality in the City of Johannesburg Using Remote Sensing Data. J. Afr. Earth Sci. 2020, 171, 103969. [Google Scholar] [CrossRef]
- Park, Y.; Guldmann, J.-M. Understanding Disparities in Community Green Accessibility under Alternative Green Measures: A Metropolitan-Wide Analysis of Columbus, Ohio, and Atlanta, Georgia. Landsc. Urban Plan. 2020, 200, 103806. [Google Scholar] [CrossRef]
- Pham, T.-T.-H.; Apparicio, P.; Seguin, A.-M.; Landry, S.; Gagnon, M. Spatial Distribution of Vegetation in Montreal: An Uneven Distribution or Environmental Inequity? Landsc. Urban Plan. 2012, 107, 214–224. [Google Scholar] [CrossRef]
- Phillips, A.; Plastara, D.; Khan, A.Z.; Canters, F. Integrating Public Perceptions of Proximity and Quality in the Modelling of Urban Green Space Access. Landsc. Urban Plan. 2023, 240, 104875. [Google Scholar] [CrossRef]
- Sathyakumar, V.; Ramsankaran, R.A.A.J.; Bardhan, R. Linking Remotely Sensed Urban Green Space (UGS) Distribution Patterns and Socio-Economic Status (SES)-A Multi-Scale Probabilistic Analysis Based in Mumbai, India. Gisci. Remote Sens. 2019, 56, 645–669. [Google Scholar] [CrossRef]
- Shargo, I.; Hall, J.; Deng, A.; Khanjar, N.; Edwards, C.; Berman, I.; Galarraga, J.; Wilson, S. Proximity of Urban Farms to Contaminated Sites in Baltimore, Maryland. Landsc. J. 2021, 40, 17–33. [Google Scholar] [CrossRef]
- Wuestemann, H.; Kalisch, D.; Kolbe, J. Access to Urban Green Space and Environmental Inequalities in Germany. Landsc. Urban Plan. 2017, 164, 124–131. [Google Scholar] [CrossRef]
- Yang, B. Assessing Spatial Disparities and Spatial-Temporal Dynamic of Urban Green Spaces: A Case Study of City of Chicago. J. Korean Soc. Surv. Geod. Photogramm. Cartogr. 2020, 38, 487–496. [Google Scholar] [CrossRef]
- Zangiabadi, A.; Rakhshaninasab, H.R. The statistical-spatial analysis of urban green space development indices (Case study: Isfahan urban zones). J. Environ. Stud. 2009, 35, 105–116. [Google Scholar]
- Zhang, X.; Zhou, S.; Lin, R.; Su, L. Relationship between Long-Term Residential Green Exposure and Individuals’ Mental Health: Moderated by Income Differences and Residential Location in Urban China. Int. J. Environ. Res. Public Health 2020, 17, 8955. [Google Scholar] [CrossRef]
- Zhong, C.; Yin, X.; Fallah-Shorshani, M.; Islam, T.; McConnell, R.; Fruin, S.; Franklin, M. Disparities in Greenspace Associated with Sleep Duration among Adolescent Children in Southern California. Environ. Epidemiol. 2023, 7, e264. [Google Scholar] [CrossRef] [PubMed]
- Zong, W.; Qin, L.; Jiao, S.; Chen, H.; Zhang, R. An Innovative Approach for Equitable Urban Green Space Allocation through Population Demand and Accessibility Modeling. Ecol. Indic. 2024, 160, 111861. [Google Scholar] [CrossRef]
- Kolosna, C.; Spurlock, D. Uniting Geospatial Assessment of Neighborhood Urban Tree Canopy with Plan and Ordinance Evaluation for Environmental Justice. Urban For. Urban Green. 2019, 40, 215–223. [Google Scholar] [CrossRef]
- Williams, G.E.; Diven, D.G. Seeking Shade Equity: Tree Canopy Coverage in Public Schools in Austin, TX. Pediatr. Dermatol. 2024, 41, 433–437. [Google Scholar] [CrossRef]
- Bauer, S.R.; Monuteaux, M.C.; Fleegler, E.W. Geographic Disparities in Access to Agencies Providing Income-Related Social Services. J. Urban Health-Bull. N. Y. Acad. Med. 2015, 92, 853–863. [Google Scholar] [CrossRef]
- Bloch, J.R. Using Geographical Information Systems to Explore Disparities in Preterm Birth Rates Among Foreign-Born and US-Born Black Mothers. Jognn-J. Obstet. Gynecol. Neonatal Nurs. 2011, 40, 544–554. [Google Scholar] [CrossRef]
- Borrell, L.; Northridge, M.; Miller, D.; Golembeski, C.; Spielman, S.; Sclar, E.; Lamster, I. Oral Health and Health Care for Older Adults: A Spatial Approach for Addressing Disparities and Planning Services. Spec. Care Dentist. 2006, 26, 252–256. [Google Scholar] [CrossRef]
- Chen, Y.; Wang, B.; Liu, X.; Li, X. Mapping the Spatial Disparities in Urban Health Care Services Using Taxi Trajectories Data. Trans. GIS 2018, 22, 602–615. [Google Scholar] [CrossRef]
- Choi, K.; Lee, Y.; Basrak, Z. Identifying Communities of Concern for Older Adults Using Spatial Analysis: Focusing on Accessibility to Health, Social, and Daily Services. J. Appl. Gerontol. 2021, 40, 1527–1532. [Google Scholar] [CrossRef] [PubMed]
- Dai, D.; Rothenberg, R.; Luo, R.; Weaver, S.R.; Stauber, C.E. Improvement of Geographic Disparities: Amelioration or Displacement? J. Urban Health-Bull. N. Y. Acad. Med. 2017, 94, 417–428. [Google Scholar] [CrossRef]
- Foroutan, E.; Hu, T.; Zhang, F.; Yu, H. Assessing Heat Vulnerability in Philadelphia Using Geographically Weighted Principal Component Analysis (GWPCA): A Geospatial Big Data-Driven Approach. Int. J. Appl. Earth Obs. Geoinf. 2024, 127, 103653. [Google Scholar] [CrossRef]
- Ge, Y.; He, Z. Assessing the Health Impacts of the Urban Expansion of Small Cities in China: A Case Study of Jiawang. PLoS ONE 2022, 17, e0279470. [Google Scholar] [CrossRef] [PubMed]
- Grazuleviciene, R.; Andrusaityte, S.; Grazulevicius, T.; Dedele, A. Neighborhood Social and Built Environment and Disparities in the Risk of Hypertension: A Cross-Sectional Study. Int. J. Environ. Res. Public Health 2020, 17, 7696. [Google Scholar] [CrossRef] [PubMed]
- Habermann, M.; Marcílio, I.; Lopes, M.; Prado, R.; Souza, M.; Gouveia, N. Social Inequality and Exposure to Magnetic Fields in the Metropolitan Region of São Paulo, Southeastern Brazil. Rev. Saude Publica 2010, 44, 703–709. [Google Scholar] [CrossRef] [PubMed]
- Harris, K.M. Mapping Inequality: Childhood Asthma and Environmental Injustice, a Case Study of St. Louis, Missouri. Soc. Sci. Med. 2019, 230, 91–110. [Google Scholar] [CrossRef] [PubMed]
- Kassie, D.; Roudot, A.; Dessay, N.; Piermay, J.-L.; Salem, G.; Fournet, F. Development of a Spatial Sampling Protocol Using GIS to Measure Health Disparities in Bobo-Dioulasso, Burkina Faso, a Medium-Sized African City. Int. J. Health Geogr. 2017, 16, 14. [Google Scholar] [CrossRef] [PubMed]
- Kim, H.; Kim, D.; Paul, C.; Lee, C.K. The Spatial Allocation of Hospitals With Negative Pressure Isolation Rooms in Korea: Are We Prepared for New Outbreaks? Int. J. Health Policy Manag. 2020, 9, 475–483. [Google Scholar] [CrossRef] [PubMed]
- Krieger, N. A Century of Census Tracts: Health & the Body Politic (1906–2006). J. Urban Health-Bull. N. Y. Acad. Med. 2006, 83, 355–361. [Google Scholar]
- Lee, J.; Vojnovic, I.; Grady, S.C. What Lies beyond the Built Environment? Exploring “Walkability” across the Detroit Region. Appl. Geogr. 2022, 141, 102670. [Google Scholar] [CrossRef]
- Lee, J.; Ramirez, I.J. Geography of Disparity: Connecting COVID-19 Vulnerability and Social Determinants of Health in Colorado. Behav. Med. 2022, 48, 72–84. [Google Scholar] [CrossRef] [PubMed]
- Li, X. Investigating the Spatial Distribution of Resident’s Outdoor Heat Exposure across Neighborhoods of Philadelphia, Pennsylvania Using Urban Microclimate Modeling. Sustain. Cities Soc. 2021, 72, 103066. [Google Scholar] [CrossRef]
- Martínez, J. The Use of GIS and Indicators to Monitor Intra-Urban Inequalities. A Case Study in Rosario, Argentina. Habitat Int. 2009, 33, 387–396. [Google Scholar] [CrossRef]
- Morshed, N.; Haskard-Zolnierek, K.; Zhan, F.B. Geographic Variations of Racial/Ethnic Disparities in Late-Stage Diagnosis of Childhood Cancer in Texas. South. Med. J. 2020, 113, 224–231. [Google Scholar] [CrossRef]
- Olyaeemanesh, A.; Woldemichael, A.; Takian, A.; Sari, A.A. Availability and Inequality in Accessibility of Health Centre-Based Primary Healthcare in Ethiopia. PLoS ONE 2019, 14, e0213896. [Google Scholar] [CrossRef]
- Padilla, C.M.; Kihal-Talantikit, W.; Perez, S.; Deguen, S. Use of Geographic Indicators of Healthcare, Environment and Socioeconomic Factors to Characterize Environmental Health Disparities. Environ. Health 2016, 15, 79. [Google Scholar] [CrossRef] [PubMed]
- Planey, A.M.; Grady, S.C.; Fetaw, R.; McLafferty, S.L. Spaces of Segregation and Health: Complex Associations for Black Immigrant and US-Born Mothers in New York City. J. Urban Health-Bull. N. Y. Acad. Med. 2022, 99, 469–481. [Google Scholar] [CrossRef] [PubMed]
- Saunders, M.R.; Lee, H.; Maene, C.; Schuble, T.; Cagney, K.A. Proximity Does Not Equal Access: Racial Disparities in Access to High Quality Dialysis Facilities. J. Racial Ethn. Health Disparities 2014, 1, 291–299. [Google Scholar] [CrossRef] [PubMed]
- Smiley, K.T. Racial and Environmental Inequalities in Spatial Patterns in Asthma Prevalence in the US South. Southeast. Geogr. 2019, 59, 389–402. [Google Scholar] [CrossRef]
- Suplee, P.D.; Bloch, J.R.; Hillier, A.; Herbert, T. Using Geographic Information Systems to Visualize Relationships Between Perinatal Outcomes and Neighborhood Characteristics When Planning Community Interventions. Jognn-J. Obstet. Gynecol. Neonatal Nurs. 2018, 47, 158–172. [Google Scholar] [CrossRef] [PubMed]
- Witten, K.; Pearce, J.; Day, P. Neighbourhood Destination Accessibility Index: A GIS Tool for Measuring Infrastructure Support for Neighbourhood Physical Activity. Environ. Plan.-Econ. Space 2011, 43, 205–223. [Google Scholar] [CrossRef]
- Zandieh, R.; Martinez, J.; Flacke, J. Older Adults’ Outdoor Walking and Inequalities in Neighbourhood Green Spaces Characteristics. Int. J. Environ. Res. Public Health 2019, 16, 4379. [Google Scholar] [CrossRef] [PubMed]
- Mavoa, S.; Koohsari, M.J.; Badland, H.M.; Davern, M.; Feng, X.; Astell-Burt, T.; Giles-Corti, B. Area-Level Disparities of Public Open Space: A Geographic Information Systems Analysis in Metropolitan Melbourne. Urban Policy Res. 2015, 33, 306–323. [Google Scholar] [CrossRef]
- Alberich, J.; Perez-Albert, Y.; Muro Morales, J.I.; Bustamante Picon, E. Environmental Justice and Urban Parks. A Case Study Applied to Tarragona (Spain). Urban Sci. 2021, 5, 62. [Google Scholar] [CrossRef]
- Brainard, J.; Jones, A.; Bateman, I.J.; Lovett, A.A. Equal Access for All? Ethnicity and Public Park Availability in Birmingham (UK). Work. Pap.—Cent. Soc. Econ. Res. Glob. Environ. 2006, 1–38. Available online: https://www.researchgate.net/publication/290179715_Equal_access_for_all_Ethnicity_and_public_park_Availability_in_Birmingham_UK (accessed on 25 February 2024).
- Feng, S.; Chen, L.; Sun, R.; Feng, Z.; Li, J.; Khan, M.S.; Jing, Y. The Distribution and Accessibility of Urban Parks in Beijing, China: Implications of Social Equity. Int. J. Environ. Res. Public Health 2019, 16, 4894. [Google Scholar] [CrossRef] [PubMed]
- Kong, X.; Sun, Y.; Xu, C. Effects of Urbanization on the Dynamics and Equity of Access to Urban Parks from 2000 to 2015 in Beijing, China. Forests 2021, 12, 1796. [Google Scholar] [CrossRef]
- Kweon, B.-S.; Marans, R.W.; Yi, C.-W. Parks and Quality of Life: Differences among African American and White Residents. Landsc. J. 2016, 35, 97–108. [Google Scholar] [CrossRef]
- Rigolon, A. Parks and Young People: An Environmental Justice Study of Park Proximity, Acreage, and Quality in Denver, Colorado. Landsc. Urban Plan. 2017, 165, 73–83. [Google Scholar] [CrossRef]
- Senol, F.; Kaya, I.A. GIS-Based Mappings of Park Accessibility at Multiple Spatial Scales: A Research Framework with the Case of Izmir (Turkey). Local Environ. 2021, 26, 1379–1397. [Google Scholar] [CrossRef]
- Tan, P.Y.; Samsudin, R. Effects of Spatial Scale on Assessment of Spatial Equity of Urban Park Provision. Landsc. Urban Plan. 2017, 158, 139–154. [Google Scholar] [CrossRef]
- Willemse, L. A Flowmap-Geographic Information Systems Approach to Determine Community Neighbourhood Park Proximity in Cape Town. S. Afr. Geogr. J. 2013, 95, 149–164. [Google Scholar] [CrossRef]
- Azarderakhsh, M.; Hussain, A.; Metellus, R.; Blake, R. Investigating the Relationship between Urban Heat Island and Socioeconomic Factors in New York City. In Proceedings of the IGARSS 2023—2023 IEEE International Geoscience and Remote Sensing Symposium, Pasadena, CA, USA, 16–21 July 2023; pp. 3594–3595. [Google Scholar]
- Downey, L. Spatial Measurement, Geography, and Urban Racial Inequality. Soc. Forces 2003, 81, 937–952. [Google Scholar] [CrossRef]
- Kim, N.; Lee, H.; Yoon, Y. A Heterogeneous Attention Network Model for Longitudinal Analysis of Socioeconomic and Racial Inequalities in Urban Regions: Evidence from Chicago, IL. In Proceedings of the SIGSPATIAL ‘23: 31st ACM International Conference on Advances in Geographic Information Systems, Hamburg, Germany, 13–16 November 2023; pp. 614–617. [Google Scholar]
- Shelton, T.; Poorthuis, A.; Zook, M. Social Media and the City: Rethinking Urban Socio-Spatial Inequality Using User-Generated Geographic Information. Landsc. Urban Plan. 2015, 142, 198–211. [Google Scholar] [CrossRef]
- Widener, M.J.; Metcalf, S.S.; Bar-Yam, Y. Agent-Based Modeling of Policies to Improve Urban Food Access for Low-Income Populations. Appl. Geogr. 2013, 40, 1–10. [Google Scholar] [CrossRef]
- Anchondo, T.M.; Ford, P.B. Neighborhood Deprivation, Neighborhood Acculturation, and the Retail Food Environment in a US-Mexico Border Urban Area. J. Hunger Environ. Nutr. 2011, 6, 207–219. [Google Scholar] [CrossRef]
- Vaz, E.; Bacao, F.; Damasio, B.; Haynes, M.; Penfound, E. Machine Learning for Analysis of Wealth in Cities: A Spatial-Empirical Examination of Wealth in Toronto. Habitat Int. 2021, 108, 102319. [Google Scholar] [CrossRef]
- Li, M.; Lin, J.; Ji, Z.; Chen, K.; Liu, J. Grid-Scale Poverty Assessment by Integrating High-Resolution Nighttime Light and Spatial Big Data-A Case Study in the Pearl River Delta. Remote Sens. 2023, 15, 4618. [Google Scholar] [CrossRef]
- Saini, S.; Tripathi, V.; Verma, A. Employing Night-Time Light Images for Wealth Assessment in India: A Machine Learning Perspective. Proc. Icetit 2019 Emerg. Trends Inf. Technol. 2020, 605, 613–622. [Google Scholar]
- Wang, H.; Han, H.; Zhang, J.; Zhang, D. Nighttime Light Data-Based Analysis of Spatiotemporal Patterns Evolution and Driving Forces of Economic Development in China at Prefecture Level (1992–2020). Trans. GIS 2023, 27, 564–591. [Google Scholar] [CrossRef]
- Slovic, A.D.; Tomasiello, D.B.; Giannotti, M.; Andrade, M.D.F.; Nardocci, A.C. The Long Road to Achieving Equity: Job Accessibility Restrictions and Overlapping Inequalities in the City of Sao Paulo. J. Transp. Geogr. 2019, 78, 181–193. [Google Scholar] [CrossRef]
- Nadybal, S.M.; Collins, T.W.; Grineski, S.E. Light Pollution Inequities in the Continental United States: A Distributive Environmental Justice Analysis. Environ. Res. 2020, 189, 109959. [Google Scholar] [CrossRef]
- Xiao, Q.; Zhou, M.; Lyu, Y.; Lu, J.; Zhang, K.; Figueiro, M.; Wang, J.; Bauer, C. County-Level Artificial Light at Night (ALAN) in the Contiguous US (2012–2019): Spatial Variations, Temporal Trends, and Environmental Justice Analyses. Environ. Sci. Pollut. Res. 2023, 30, 115870–115881. [Google Scholar] [CrossRef]
- Moreira, A.B.; Nobrega, R.S.; Wanderley, L.S.D.A.; Matzarakis, A. Urban Heat Island Vulnerability in the City of Recife, Pernambuco, Brazil. Weather Clim. Soc. 2024, 16, 105–116. [Google Scholar] [CrossRef]
- Xu, X.; Qiu, W.; Li, W.; Huang, D.; Li, X.; Yang, S. Comparing Satellite Image and GIS Data Classified Local Climate Zones to Assess Urban Heat Island: A Case Study of Guangzhou. Front. Environ. Sci. 2022, 10, 1029445. [Google Scholar] [CrossRef]
- Gong, W.; Huang, X.; White, M.; Langenheim, N. Walkability Perceptions and Gender Differences in Urban Fringe New Towns: A Case Study of Shanghai. Land 2023, 12, 1339. [Google Scholar] [CrossRef]
- Cui, Y.; Wang, Q.; Zha, G.; Dang, Y.; Duan, X.; Wang, L.; Luo, M. Evaluation of the Accessibility of Children’s Spaces at the Community Scale: The Case Study of Hangzhou. ISPRS Int. J. Geo-Inf. 2024, 13, 55. [Google Scholar] [CrossRef]
- Liu, M.; Yan, J.; Dai, T. A Multi-Scale Approach Mapping Spatial Equality of Urban Public Facilities for Urban Design. Heliyon 2023, 9, E18281. [Google Scholar] [CrossRef] [PubMed]
- Ki, D.; Chen, Z.; Lee, S.; Lieu, S. A Novel Walkability Index Using Google Street View and Deep Learning. Sustain. Cities Soc. 2023, 99, 104896. [Google Scholar] [CrossRef]
- Zandieh, R.; Flacke, J.; Martinez, J.; Jones, P.; van Maarseveen, M. Do Inequalities in Neighborhood Walkability Drive Disparities in Older Adults’ Outdoor Walking? Int. J. Environ. Res. Public Health 2017, 14, 740. [Google Scholar] [CrossRef] [PubMed]
- Prakash, K.; Jegankumar, R.; Libina, R.S. Modelling Differential Urban Growth Dynamics for Growth Decentralisation: A Study on Tiruchirappalli Metropolitan and Sub-Tier Towns, India. ASIA-Pac. J. Reg. Sci. 2023, 7, 1191–1221. [Google Scholar] [CrossRef]
- Awawdeh, M.M.; Abuhadba, R.R.; Jamhawi, M.M.; Rawashdeh, A.I.; Jawarneh, R.N.; Awawdeh, M.M. Urban Expansion in Greater Irbid Municipality, Jordan: The Spatial Patterns and the Driving Factors. Geojournal 2024, 89, 43. [Google Scholar] [CrossRef]
- Bidadian, B.; Strager, M.P.; Butler, P.; Ghadimi, H. Flood Risk Impacts from an Unlikely Source: Redlining Efforts of the 1930s in Houston, Texas. Environ. Justice 2024. [Google Scholar] [CrossRef]
- Xu, J.; Qiang, Y. Environmental Justice Implications of Flood Risk in the Contiguous United States—A Spatiotemporal Assessment of Flood Exposure Change from 2001 to 2019. Cartogr. Geogr. Inf. Sci. 2024. [Google Scholar] [CrossRef]
- Zhu, S.; Jiang, Y.; Zhang, J.; Dai, Q.; Yang, X. Evaluating the Effect of Urban Flooding on Spatial Accessibility to Emergency Shelters Based on Social Sensing Data. Trans. GIS 2024, 28, 23–39. [Google Scholar] [CrossRef]
- Riddlesden, D.; Singleton, A.D. Broadband Speed Equity: A New Digital Divide? Appl. Geogr. 2014, 52, 25–33. [Google Scholar] [CrossRef]


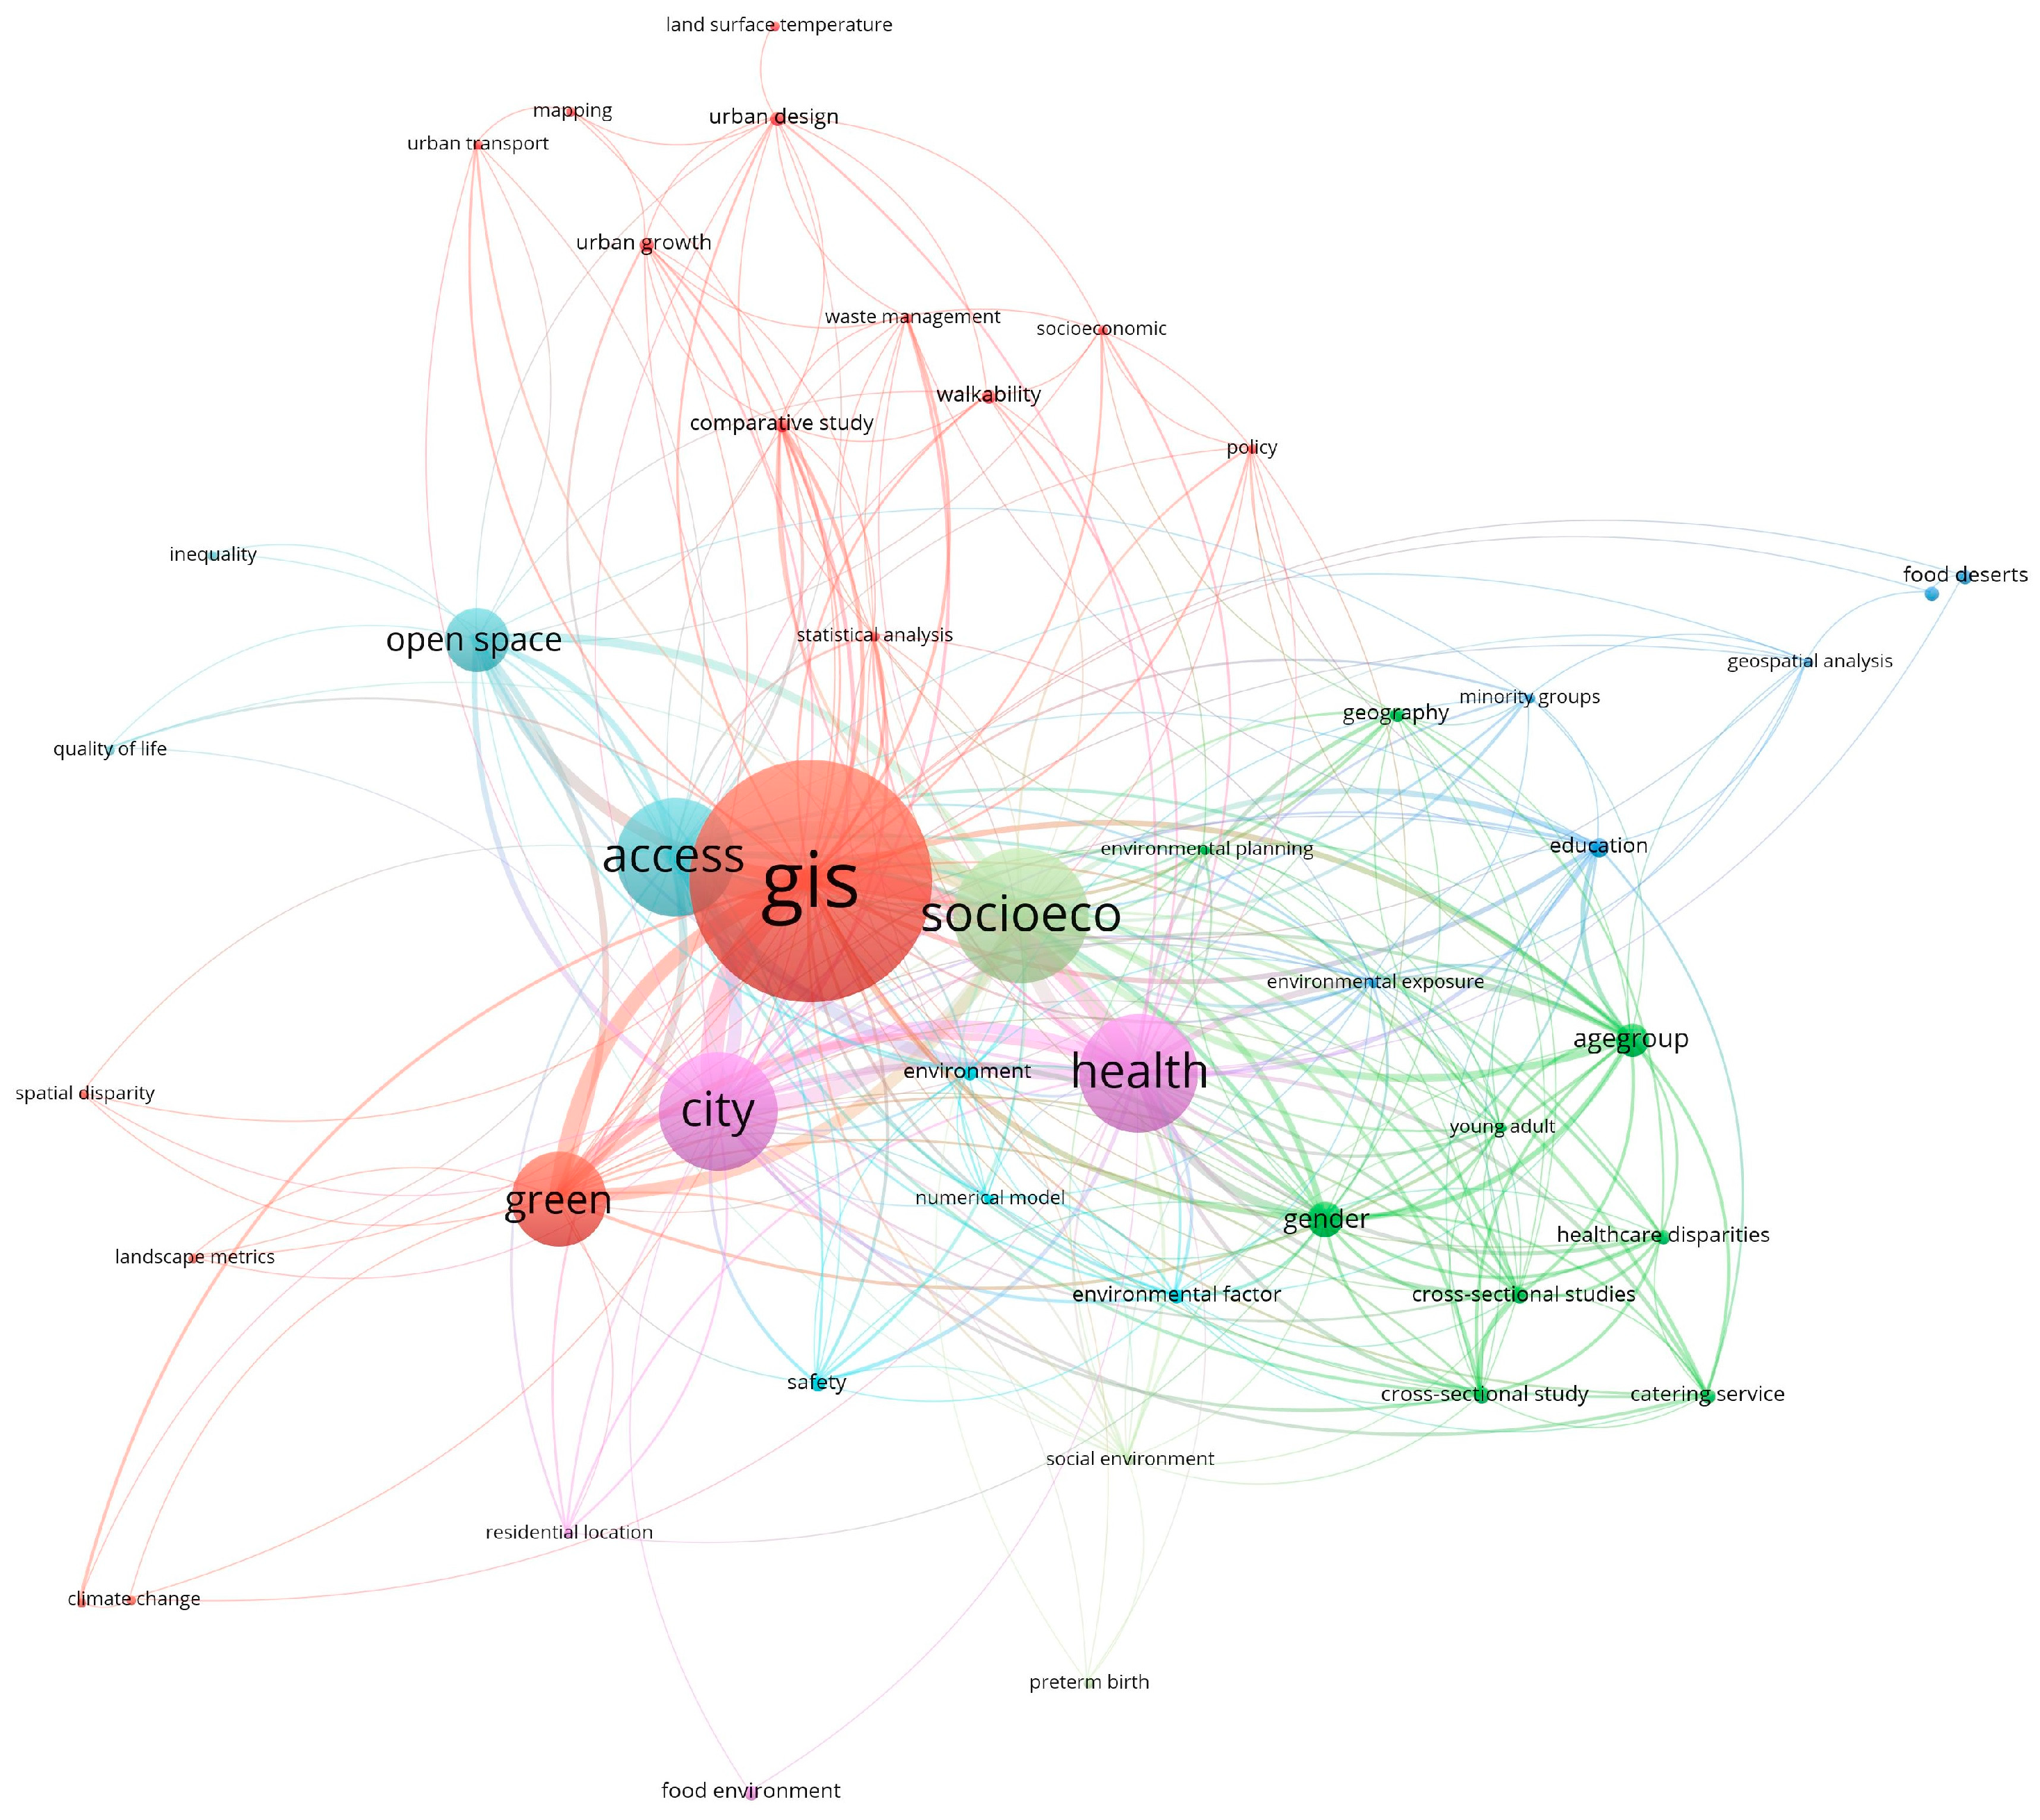
| Keywords | Merged into | Referenced Studies |
|---|---|---|
| accessibility health services accessibility network analysis public transport public access Health care access spatial accessibility | Access | [1,16,17,20,21,22,24,26,32,41,42,46,50,51,52,53,54,55,56,57,58,59,60,61,62,63,64,65,66,67,68,69,70,71,72,73,74,75,76,77,78,79,80,81,82,83,84,85,86,87,88,89,90,91,92,93,94,95] |
| cities city metropolitan area New York City urban area Urban areas | City | All the reviewed article |
| education School Schools | Education | [19,61,62,96,97,98,99,100,101] |
| geographic information system geographic information systems gis spatial analysis geographic information systems (gis) | GIS | All the reviewed article used GIS |
| green green space green spaces greenspace urban green space urban green spaces canopy urban ecosystem services | Green space | [1,13,15,31,42,43,46,50,58,60,67,70,74,75,81,86,87,93,96,99,102,103,104,105,106,107,108,109,110,111,112,113,114,115,116,117,118,119,120,121,122,123,124,125,126,127,128] |
| Health health services COVID-19 epidemiology health care delivery health care disparity health disparities health disparity physical activity public health urban health obesity | Health | [20,29,35,40,41,44,53,54,63,66,77,83,85,86,89,100,129,130,131,132,133,134,135,136,137,138,139,140,141,142,143,144,145,146,147,148,149,150,151,152,153,154,155] |
| Health care health care planning health care policy | Health care | [23,63,66,83,131,132,148] |
| Open Space public space urban parks park parks | Open space | [21,32,55,57,65,76,80,82,88,90,156,157,158,159,160,161,162,163,164,165] |
| economics equity income poverty racial disparity residence characteristics socioeconomic factors socioeconomic status socioeconomics socioeconomic socioeconomic conditions social status minority group ethnic minority | SocioEco (Socioeconomic) | [7,18,22,31,42,50,51,60,72,74,77,82,86,92,102,107,124,129,147,149,151,152,166,167,168,169,170] |
Disclaimer/Publisher’s Note: The statements, opinions and data contained in all publications are solely those of the individual author(s) and contributor(s) and not of MDPI and/or the editor(s). MDPI and/or the editor(s) disclaim responsibility for any injury to people or property resulting from any ideas, methods, instructions or products referred to in the content. |
© 2024 by the authors. Licensee MDPI, Basel, Switzerland. This article is an open access article distributed under the terms and conditions of the Creative Commons Attribution (CC BY) license (https://creativecommons.org/licenses/by/4.0/).
Share and Cite
Malaker, T.; Meng, Q. Urban Disparity Analytics Using GIS: A Systematic Review. Sustainability 2024, 16, 5956. https://doi.org/10.3390/su16145956
Malaker T, Meng Q. Urban Disparity Analytics Using GIS: A Systematic Review. Sustainability. 2024; 16(14):5956. https://doi.org/10.3390/su16145956
Chicago/Turabian StyleMalaker, Tanmoy, and Qingmin Meng. 2024. "Urban Disparity Analytics Using GIS: A Systematic Review" Sustainability 16, no. 14: 5956. https://doi.org/10.3390/su16145956
APA StyleMalaker, T., & Meng, Q. (2024). Urban Disparity Analytics Using GIS: A Systematic Review. Sustainability, 16(14), 5956. https://doi.org/10.3390/su16145956