Article

Effect of the Connectivity of Weak Rock Zones on the Mining-Induced Deformation of Rock Slopes in an Open-Pit Mine

1
Faculty of Engineering, Hokkaido University, Sapporo 060-8628, Japan
2
International Research Organization for Advanced Science and Technology, Kumamoto University, Kumamoto 860-8555, Japan
3
Faculty of Advanced Science and Technology, Kumamoto University, Kumamoto 860-8555, Japan
4
School of Civil Engineering, Henan Polytechnic University, Jiaozuo 454003, China
*
Author to whom correspondence should be addressed.
Sustainability 2024, 16(14), 5974; https://doi.org/10.3390/su16145974
Submission received: 28 April 2024 / Revised: 2 July 2024 / Accepted: 9 July 2024 / Published: 12 July 2024
(This article belongs to the Special Issue Slope Stability Analysis and Landslide Disaster Prevention)

Abstract

:
Geological structures significantly influence mining-induced deformations in open-pit mines, with their variations and interactions adding complexity to the excavation process and introducing uncertainties in deformation outcomes. This study utilized numerical simulations to analyze the impact of weak rock zones in a specific open-pit limestone quarry in Japan on mining-induced deformation. The simulation results were both qualitatively and quantitatively validated against field measurements, enhancing the reliability of the findings. Subsequently, four conceptual models were developed based on the characteristics of the quarry to investigate the mechanisms by which weak rock zones affect rock slope deformations. Our analyses demonstrated that slip deformation occurred exclusively when two weak rock zones were connected. This deformation was associated not only with shear failure in the upper weak rock zone but also with the contraction and bending of the lower weak rock zone. Furthermore, the simulation results were consistent with field data and supported by the conceptual models, confirming that the proposed sliding mechanisms can effectively explain the observed deformation behaviors. The insights gained from these models provide valuable references for managing similar geological challenges in other open-pit mines.

1. Introduction

The stability assessment of rock slopes in open-pit mines is crucial because of the potentially severe consequences of slope failures [1,2]. According to previous studies [3,4], severe instability was recently observed in the rock slopes at Las Cruces, Spain (2019) and Alxa Left Banner, China (2023), resulting in extensive equipment damage and causing several casualties among mine workers. In these cases, the instability of open-pit mines was preceded by long-term deformations, and the annual cumulative displacements reached 7 cm and 14 cm for the mines in Spain and China, respectively. To prevent such disasters, a comprehensive assessment of the rock slope behavior in open-pit mines based on field measurements and numerical simulations is crucial for realizing safe operation and stable production.
Unexplained rock slope deformation has been observed in a large limestone open-cut quarry in Saitama Prefecture, Japan (Figure 1). The rock slope in the west part including the A-A’ section in Figure 1b shows continuous deformation, but little deformation can be seen in the east part including B-B’ and C-C’ sections in Figure 1b. The difference is also found in their discontinuous geological structures. In the west section, the two weak rock zones are connected, whereas they are separated in the east section. The continuous deformation observed in the west section tended to accelerate when the working face just passed the outcrop of one of the weak rock zones in excavation progression. This indicates that both geological conditions and excavation are likely to affect rock slope deformation, but the mechanism of the rock slope deformation is not clarified. For the stability assessment of the rock slope in the quarry, understanding the mechanism is a significant issue.
Typically, excavation leads to stress release in a rock slope, thereby causing elastic recovery displacements [5,6,7,8,9,10,11,12]. The elastic recovery deformation caused by excavation comprises two modes, contraction or extension, depending on factors such as excavation patterns, stress states, and rock elastic properties. Kaneko et al. (1996) investigated the effects of initial stress on the deformation mode of an open-pit mine using two-dimensional (2D) elastic analysis [5]. They reported that the rock slope contracted when the ratio of horizontal-to-vertical stress was small during excavation, yet the slope extended as the ratio increased. Najib et al. (2015) analyzed the mining-induced elastic deformation of mountain-type mines by varying the Poisson’s ratio from 0.1 to 0.4; the Poisson’s effect enhanced the horizontal extension of the rock slope, increased with Poisson’s ratio [9]. Abdellah et al. (2022) simulated the displacements caused by excavation for slope angles in the range of 20° to 70° using a 2D model. A hybrid approach combining deterministic numerical simulations and probabilistic methods was used to represent rock mass heterogeneity. The results indicated that the slope extended forward at slope angles of less than 35° and contracted backwards at more than 35° [11]. Sdvyzhkova et al. (2022) revealed that stress state variations at different mining stages significantly influence slope stability, demonstrating how excavation leads to slope destabilization [12].
The aforementioned mining-induced elastic deformation is important for understanding the displacements observed in quarries. Kodama et al. (2009) investigated the causes of the long-term deformation of a rock slope at the Ikura limestone quarry in Japan using three-dimensional (3D) elastic analysis. They estimated Young’s modulus and Poisson’s ratio of the rock mass using back analysis and concluded that the long-term deformation over more than seven years can be interpreted as elastic deformation caused by excavation at the working face 400 m away from the rock slope [7]. Amagu et al. (2021) investigated the deformation mechanism of the rock slope in the Higashi-Shikagoe limestone quarry based on 2D elastic simulations. They presumed that the displacement on the right-hand side of the rock slope primarily resulted from excavation-induced elastic deformation and concluded that the rock slope was stable [10]. The aforementioned studies demonstrate that the elastic analysis is sufficient to understand mining-induced deformations of homogeneous rock slopes in stable conditions. However, geological structures such as faults, shear zones, and weak rock layers have not been considered, and the knowledge accumulated in these studies is insufficient to explain discontinuous deformations, such as sliding movements.
The deformation and failure of rock slopes are frequently controlled by the orientation and geometry of the discontinuities, including bedding planes, geological boundaries, joint sets, and faults. They can be classified into three types: plane, wedge, and toppling failures [13,14,15,16,17], and their failure mechanisms have been extensively researched [18,19,20]. Recently, several studies [21,22,23,24,25,26,27] have reported that the failure patterns of rock slopes with two or more discontinuous geological structures, such as faults or weak layers, are complex. Li et al. (2019) analyzed the effects of the combination of a vertical fault and weak horizontal layer on slope stability with complex bedding planes using the 3D finite element strength reduction models and reported that vertical faults had less influence on slope stability. Additionally, the interaction of the fault and weak layer developed a substantially large damage zone, rendering the slope highly susceptible to instability [23]. Vick et al. (2020) investigated the mechanism of rock slope instability by incorporating foliation, faults, and rock cracks. Based on a field investigation, they determined that the sliding of the fault led to the formation of tension cracks at the back scarp of the slope, and landslides occurred along the foliation plane because of rainfall [26]. Zerradi et al. (2023) emphasized the importance of slope angle and joint sets in determining the stability of rock slopes, demonstrating that these factors significantly contribute to the complexity of slope failure mechanisms [28]. These studies clarified that the presence of discontinuous geological structures increases the risk of slope failure and that rock slope deformation depends on the geometry of discontinuous geological structure. This suggests that the connectivity of the weak rock zones should be considered for the stability assessment of the rock slope in the quarry in Japan mentioned above.
The aforementioned studies on geological structure-related slope instability were conducted on rock slopes that did not involve mining activities. With respect to geological structures in open-pit mines, Nie et al. (2015) analyzed the mechanism of landslides occurring in an open-pit mine by comparing field monitoring data with the data calculated using the limit equilibrium method. They reported that excavation caused the slope to lose support, thereby increasing the sliding force. The excavation further resulted in the failure of the weak interlayer with low shear strength by reducing the vertical stresses in the slope [29]. Amini et al. (2019) investigated the toppling failure that occurred at an open-pit mine using the finite element technique. The results indicated that the shear strain was significantly concentrated on the alteration of the rock layers and the vertical fault owing to excavation, which caused a slip along the altered rock layer. This slip eventually resulted in the toppling failure of the external anti-dip layered slope [30].
The aforementioned studies highlight the influence of excavation and discontinuous geological structures on slope deformation and instability. They also suggest that impacts of the excavation and discontinuous geological structures strongly depend on their relationship. This indicates that the rock slope deformation in the Japanese limestone quarry mentioned above should be estimated considering the spatial relationship between the weak rock zones and the excavation area.
This study aims to clarify the effects of connectivity of weak rock zones on the mining-induced deformation of the rock slopes for the stability assessment of the rock slope in the limestone quarry in Saitama prefecture, Japan. The specific objectives are as follows: 1. Investigate the distribution of weak rock zones in the case study quarry and characterize the deformation measured in the field. 2. Develop 2D numerical models based on the geological conditions of the quarry and compare the simulation results with the field measurement data to identify similarities and differences. 3. Conduct simplified numerical simulations based on the connectivity of weak rock zones and mining activities to elucidate the deformation mechanisms observed in the case study quarry. 4. Interpret the observed deformation in the quarry based on the results from the previous steps and evaluate the stability of the rock slope. This research provides guidance for the implementation of subsequent safety countermeasures by elucidating the deformation mechanism in the case study quarry. Furthermore, the study facilitates a more detailed elucidation of the factors influencing rock slope stability in mining environments.

2. Geological Conditions and Rock Slope Deformation of the Case Study Quarry

The mine considered for the case study was an open-pit limestone quarry located in Saitama Prefecture, Japan (Figure 1). This mine is one of the largest limestone quarries in Japan, with an annual production of 7 million tons. Since 1915, limestone has been mined from the top of the mountain at an elevation of 1304 m. The working face of the mine extends approximately 2 km from west to east, and the height of the rock slope is approximately 400 m at present. Mining is expected to continue for more than 20 years, with the height of the rock slope reaching more than 700 m at mine closure.

2.1. Geological Conditions Including Weak Rock Zones

Survey tunnels with several hundred meters length were excavated from the surface of the slopes to assess the geological conditions of the quarry. Surface observation of these tunnels and boring exploration revealed the presence of two weak rock zones in the quarry (Figure 2). The first one, referred to as VZ, is composed of a nearly vertical weak rock zone in limestone; the second one, referred to as PZ, is composed of an inclined geological boundary between the limestone and green rock, which is nearly parallel to the slope surface [31]. Certain discrepancies were observed in the geometric characteristics of the cross-sections with respect to the connectivity of the geological structures. Particularly, in the case of A-A’, the PZ was connected to the VZ (Figure 2a) because a part of the VZ developed on the boundary of two rocks. In the case of sections B-B’ and C-C’, no connection was formed between VZ and PZ because the former was located in the limestone body (Figure 2b,c). Accordingly, weak rock zones in the limestone quarry considered in the case study can be classified as (i) connective patterns and (ii) non-connective patterns.

2.2. Measurement of the Rock Slope Displacement Using the Automated Polar System (APS)

In recent years, the global positioning system (GPS) and extensometers have been introduced to assist in the measurement of rock slope deformation [32]. However, since 1998, APS has been used to measure surface displacements of rock slopes to monitor slope deformations. And we analyzed the long-term displacement over 24 years measured using APS in this study.
The change in distance between APS mirrors, installed on the rock slope, and a beam generator, located 4.5 km away from the top of the rock slope, was measured 12 times/day with accuracy of ±0.12 mm. The measurement results from APS are often affected by meteorological conditions, including temperature and humidity [33]. This effect can be reduced by computing relative displacements to a reference mirror point with similar weather conditions. In this quarry, mirror points near section B-B’ were selected as the reference points because the magnitude of displacement in section B-B’ remained negligible over the monitoring period according to the GPS measurements. Therefore, the changes in distance at each mirror point were calibrated using the data derived from the mirror points located at identical elevations near section B-B’.
Figure 3 depicts the changes at mirror points in distance in sections A-A’ and C-C’. In Figure 3a, APS 7-2, 15-9, 28-22, and 42-37 denote the changes in distance in section A-A’ at elevations of 1200 m, 1100 m, 1050 m, and 1000 m, respectively, whereas APS 8-9 and 21-22 (Figure 3b) denote the changes in distance in section C-C’ at elevations of 1100 m and 1050 m, respectively. The first and second numbers in these expressions denote the target and reference mirror points at the same elevation, respectively. Negative quantities corresponded to a decrease in the distance, and the vertical axis was normalized by the maximum change in distance of APS 7-2.
The curves of the two sections indicated that the change in the distance in section A-A’ was significantly different from that in section C-C’. In the case of section C-C’, the distance remained nearly unchanged, whereas the distances in section A-A’ decreased with time, indicating that each point continued to move in the forward and/or downward direction. The changes in distance in section A-A’ can be summarized as follows. Initially, the distance decreased slightly at a nearly constant rate. However, certain stepwise changes occurred after 2006, which accelerated the rate of decrease. These stepwise changes did not occur after 2016, and the rate of decrease decelerated, indicating a convergence trend in all curves. Notably, the period with the accelerating rate of decrease corresponded to the excavation stage in which the working face passed the VZ in the rock slope. The occurrence of stepwise changes, such as those in 2007 and 2011, concurred with heavy rainfall events [34,35].

3. Numerical Modeling for Simulation of the Rock Slope Deformation of the Quarry

In this section, 2D numerical models based on the geological conditions and mining activities of the case study quarry were established. The results from the numerical models were compared with the measurement data for validation.

3.1. Estimation of Mechanical Properties of the Rock Mass

The primary constituent rocks of the quarry were limestone, green rock, and weak rock zones (Figure 2). All rocks were assumed to be elastic, and the geological boundaries among the rocks were modeled as discontinuous planes. The solution was obtained by UDEC [36]. The elastic moduli of the rock mass were estimated from those of intact rocks, considering the geological strength index (GSI) [37].
The Young’s modulus of intact rocks was obtained from the UCS (Uniaxial Compressive Strength) test, with the specific experimental process detailed in paper [38]. Two types of rock, intact limestone and intact green rock, were sampled in the field to prepare rock samples with 60 mm in height and 30 mm in diameter. These dimensions are in accordance with the height-to-diameter ratio standards set by the American Rock Mechanics Association [39]. The results, averaged from several tests, are summarized in Table 1.
The GSI of limestone (Figure 4a,b) and green rock (Figure 4g,h) were estimated to be 70 because limestone with rough discontinuities was strongly interlocked, undisturbed, and almost unweathered. The GSIs of the weak rock zones (Figure 4c–f) were estimated to be 30 as they were formed by multiple intersecting discontinuity sets and highly weathered surfaces. The mechanical properties of the vertical weak rock zones were estimated based on the Young’s modulus of the intact limestone because the VZ was formed in the limestone deposit (Figure 2), whereas the parallel weak rock zone was estimated based on both intact limestone and green rock because the PZ was composed of alternating layers of limestone and green rock. Table 2 lists the estimated Young’s moduli of limestone, green rock, and weak rock zones. The values are calculated by empirical method given by [40] as presented in Equation (1),
E r m = E i 100 10 G S I 20 35
where Erm is Young’s modulus of rock mass and Ei is the laboratory value of Young’s modulus of intact limestone rock.
The mechanical effects of weak rock zones were represented by discontinuous deformation at the boundary between the weak rock zone and rock mass. The boundary was modeled as a discontinuity plane in the discrete element method framework. Based on the Universal Distinct Element Code (UDEC) manual [36] and previous studies (Table 3) [41,42,43,44,45,46,47], numerical methods for discontinuous deformation typically treat these boundaries as rock–rock contact surfaces. Kn and Ks refer to the normal and shear contact stiffness of the contact surface, respectively. Kn and Ks determine the transfer of forces in the normal and shear directions on both sides of the contact surface (Figure 5).
Although Kn and Ks can be measured experimentally at the laboratory scale, determining their values for large-scale natural conditions is quite difficult [48]. Additionally, setting Kn excessively low or excessively high can cause the model to fail to converge. Typically, Kn is close to the Young’s modulus of the rock mass, as suggested in Table 3. To ensure stability in the model, an empirical equation (Equation (2)) provided by UDEC was used for verification. Ultimately, Kn was chosen to match the Young’s modulus of the PZ and VZ, respectively. Moreover, the ratio of Kn to Ks and friction angle were assumed to be 2 and 30° based on Table 3, respectively. Table 4 summarizes the specific values,
K n 10 × m a x K + 4 3 G Z m i n
where K and G are the bulk and shear moduli, respectively, and Zmin is the smallest width of an adjoining zone in the normal direction (about 1 m in weak rock zones and 5 m in limestone and green rock). The max [ ] notation indicates that the maximum value over all zones adjacent to the joint is to be used.

3.2. Numerical Models and Simulation Procedure

The 2D numerical models for sections A-A’, B-B’, and C-C’ were constructed based on the vertical section maps of the quarry (Figure 2). All three models were 2500 m wide and 1100 m high with two weak rock zones each. The dip angle and width of the VZ were set to 75–80° and 8–10 m, respectively. The PZ was an interlayer composed of limestone and green rocks and its distribution in the three sections varied owing to differences in weathering. As depicted in Figure 2a, the PZ was continuously distributed along the geological boundary in section A-A’, and its extension line intersected with the VZ. In contrast, the PZ in section C-C’ was nearly parallel to the VZ and did not extend along the boundary at a higher level than the VZ (Figure 2c). In section B-B’ (Figure 2b), the PZ was nearly absent. Additionally, a homogeneous model for sections A-A’ without weak rock zones was also prepared as a reference group.
For the simulation procedure, a gravitational force was applied to the model while maintaining the normal displacement on the lateral and bottom boundary constant. The elements under the working face were then removed from the model in a stepwise manner to represent excavation. The excavation-induced displacement in the quarry was recorded to calculate the change in distance monitored by the APS.

3.3. Calculation of the Change in Distance

As described in Section 2.2, the changes in distance in sections A-A’ and C-C’ measured using APS were relative to that in section B-B’. In the numerical simulation, the relative distance change was calculated using displacements at locations corresponding to the APS mirror points for comparison between the measurements and simulation results. In the case of model A-A’, the relative displacements between APS 7-2, 15-9, 28-22, and 42-37 were calculated, whereas the relative displacements between APS 8-9 and 21-22 were calculated for model C-C’. Finally, the change in the distance between each APS point and beam generator was evaluated by calculating the change in the displacement component at each point during the simulation.

4. Simulation Results

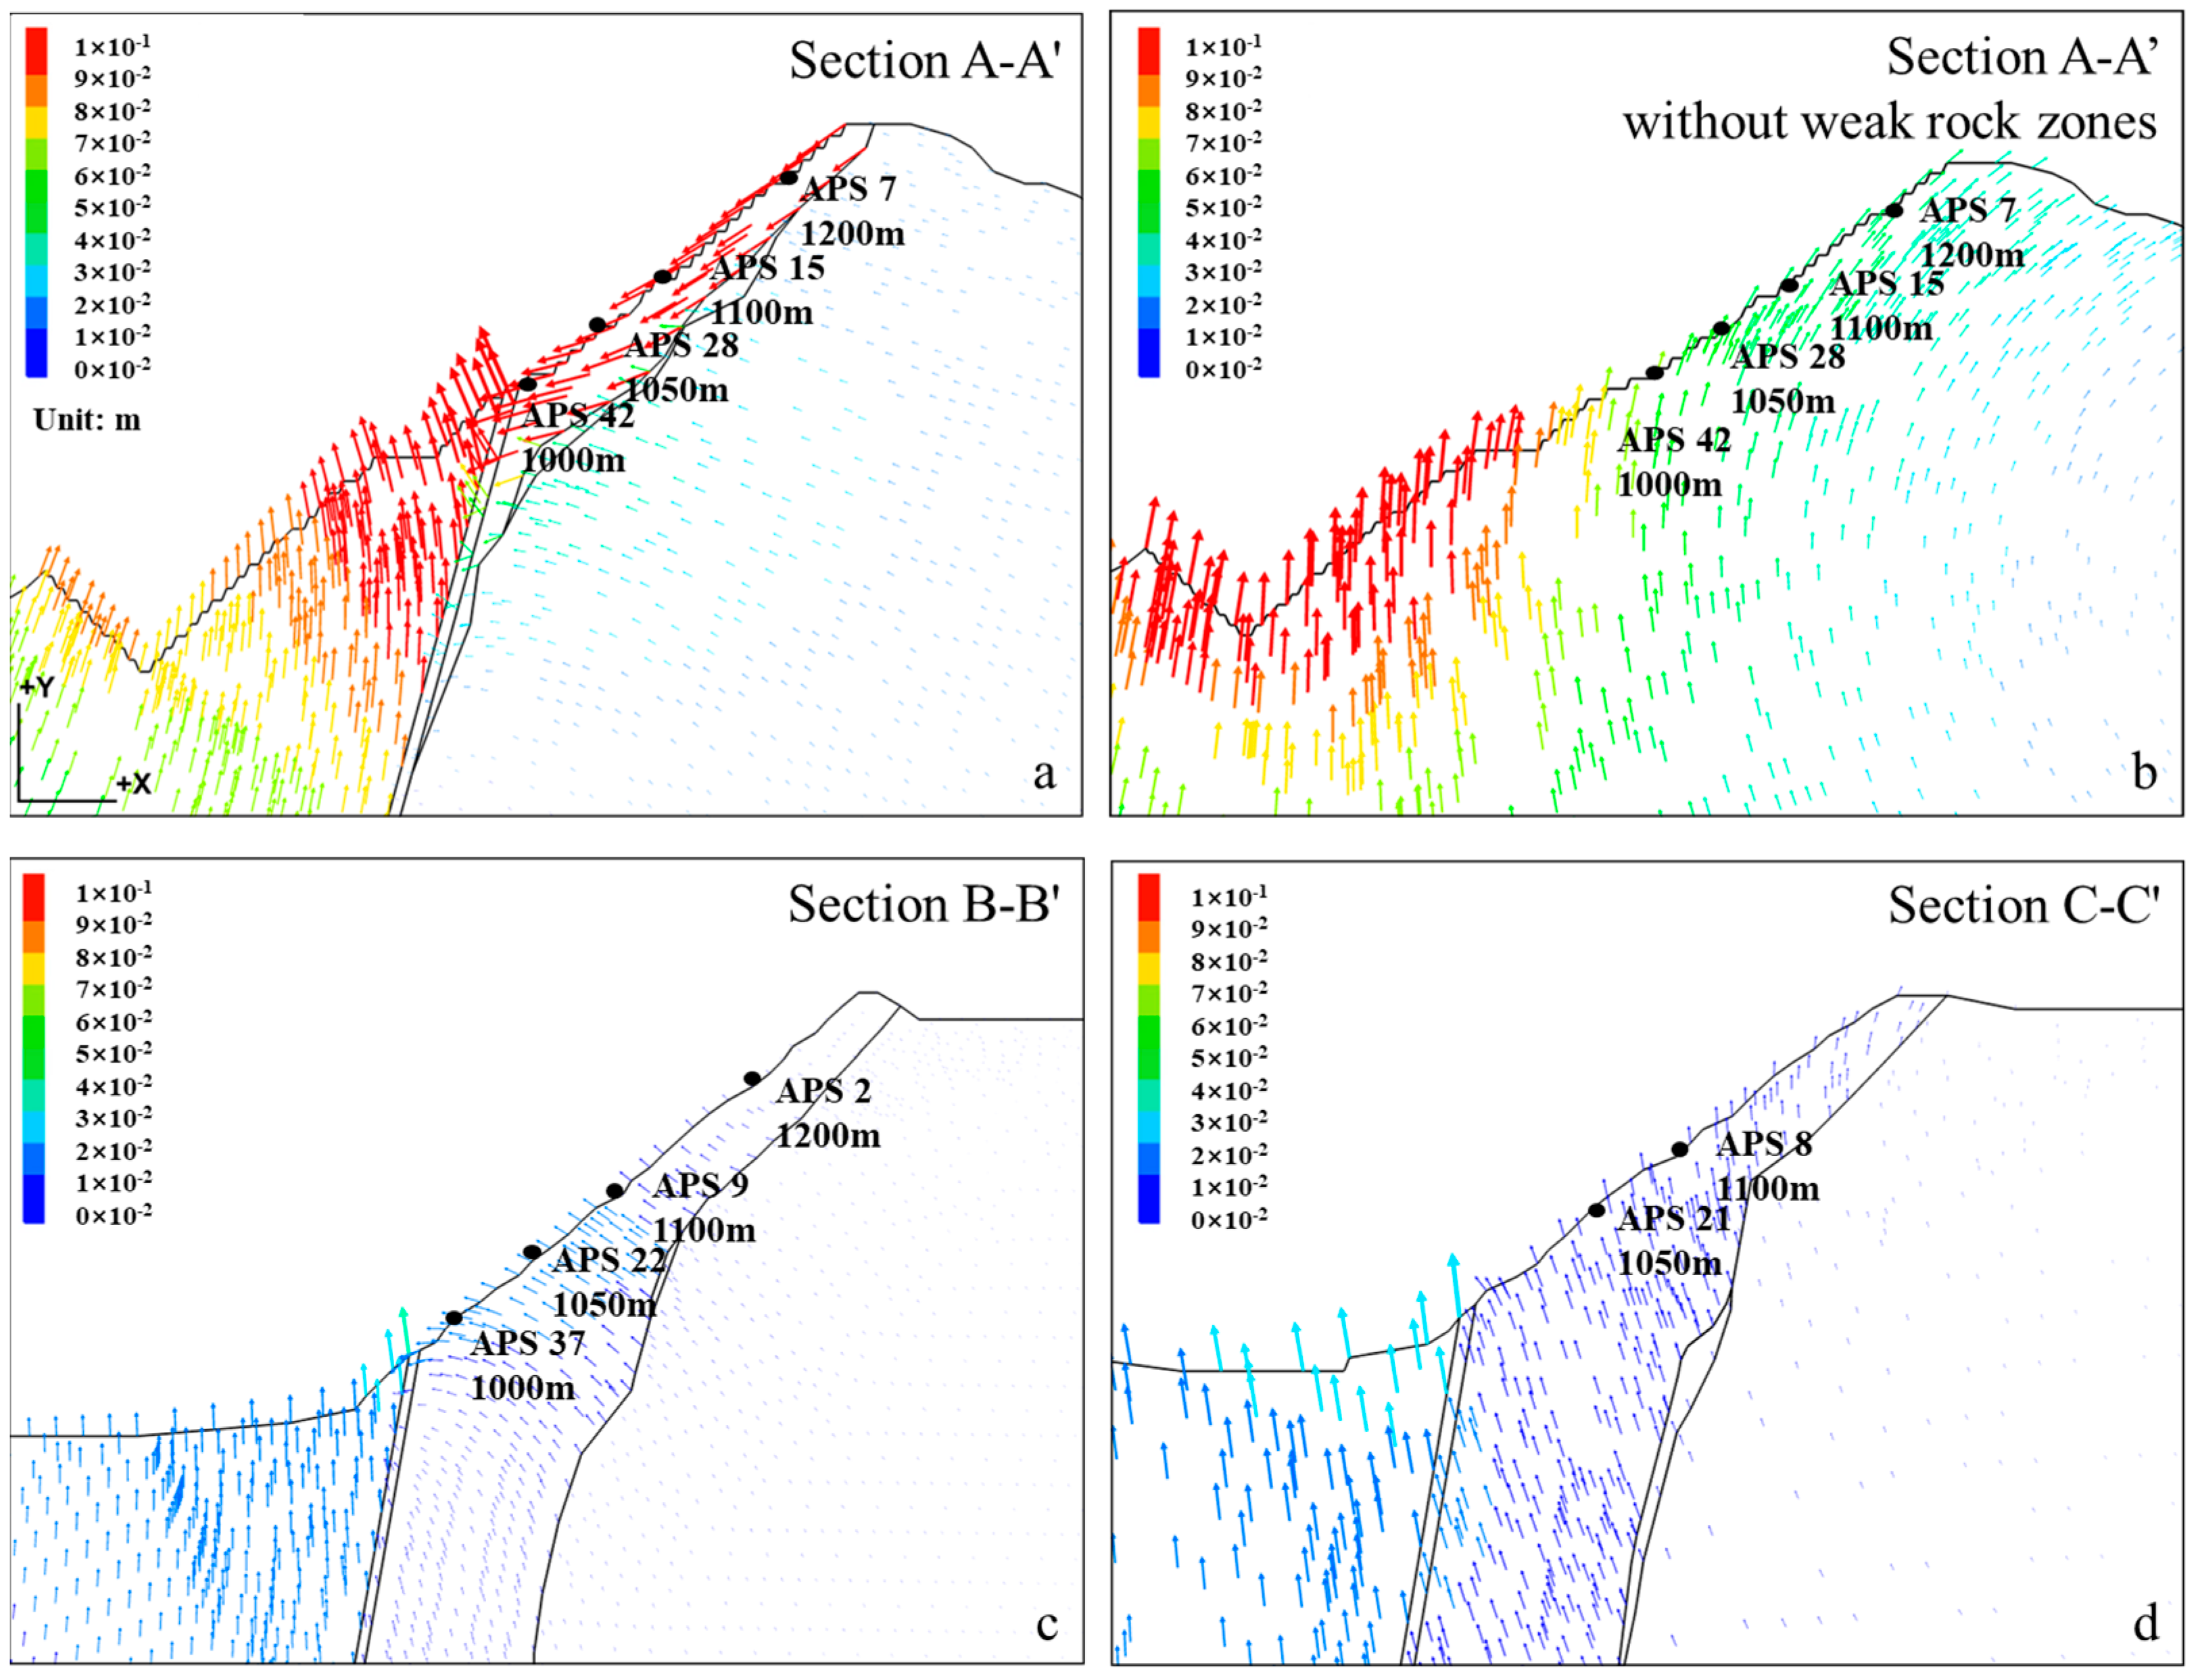
4.1. Change in Distance and Displacement Vector

The open circles on the dashed line in Figure 3 depict the simulation results and the solid lines indicate the measurement results. The date on the horizontal axis in the figure is estimated based on the date of each excavation stage. The simulation and measurement results were normalized to the maximum value of the measurement results of APS 7-2. In the case of section C-C’ (Figure 3b), the calculated distance at APS 8 and 21 exhibited no apparent change, although a slight decrease and increase were observed, respectively, after 2014. For section A-A’ (Figure 3a), the calculated distance was significantly decreased. The distance at APS 7 and 15 began decreasing in 2002 and the decreasing accelerated after 2006 when the excavation face passed the VZ. Subsequently, their decreasing rates gradually reduced with time. These characteristics concurred with those observed in the measurement results. However, the simulation results of the A-A’ model were smaller than the measurement results. For instance, the simulated distance change at APS 7 was approximately 27% of that observed in the measurement results.
To understand this behavior, displacement increment vectors before and after the excavation face passed the VZ were analyzed in all the section models; Figure 6 and Figure 7 depict the vectors in the former and the latter case, respectively. As indicated in Figure 6, the upward displacement was common in the four models before excavation, whereas significant differences were observed after the excavation face passed the VZ (Figure 7). In the case of section A-A’, the rock slope on the right-hand side of the VZ indicated sliding movement in the forward and downward directions. Furthermore, the forward displacement component existed in the triangular part adjacent to the VZ. However, these sliding movement did not occur in section A-A’ without weak rock zones (Figure 7b). In sections B-B’ and C-C’, the rock slope behavior remained unchanged while exhibiting upward movement, although the displacements on the right-hand side of the VZ were extremely small.

4.2. Impacts of Young’s Modulus of the Vertical Weak Rock Zone

In practical engineering problems, the selection of rock parameters often influences the interpretation of the results [49]. In this section, impacts of Young’s modulus of the vertical weak rock zone on simulation results were examined.
As explained in Section 4.1, a quantitative discrepancy existed between the field measurements and simulations in section A-A’. A plausible cause for this difference is the presence of a clay zone. As depicted in Figure 4c,d, a significant amount of clay is trapped in the vertical weak rock zone, which is expected to reduce the rock elastic modulus [50,51]. In this study, the elastic modulus of the vertical weak rock zone was assumed to be 1.5 GPa according to the laboratory test and GSI listed in Table 2; however, the value may be lower. In general, the Young’s modulus of the weak rock zone decreases as the clay volume increases because the Young’s modulus of clay is less than 250 MPa [52]. Additionally, changes in the water content result in variations in the elastic modulus of clay-bearing rocks [53]. Considering the deformability of clay, we investigated the effect of the Young’s modulus of the vertical weak rock zone on the distance change. A numerical simulation for the A-A’ model was conducted with the same conditions as described in Section 3.2 while varying the elastic modulus of the VZ in the range of 0.1 GPa to 1.5 GPa.
Figure 8 depicts the changes in the distance of APS 7-2 for different elastic moduli of the VZ. Similar to Figure 3, the results were normalized to the maximum value of the measurement results of APS 7-2. The results indicated that the distance decreased further as the elastic modulus decreased, causing the simulation results to move closer to the field measurements. The reduction in distance was 30–40% of the measurement when the elastic modulus ranged from 0.3 GPa to 0.5 GPa and even increased to 70% when the elastic modulus decreased to 0.1 GPa. Thus, considering the presence of the clay zone, the elastic modulus of the VZ is expected to be smaller than the estimated value. However, apparent difference is seen between measurement and simulation results even if Young’s modulus of clay is 0.1 GPa. This indicates that another factor is likely to affect rock slope deformation.

5. Discussion

5.1. Effect of the Connectivity of Weak Rock Zones on Mining-Induced Deformations

In Section 3 and Section 4, we performed a numerical analysis for the case study quarry and compared the results with the field monitoring data. The results showed that sliding movement occurred only when the two weak rock zones were connected (Figure 7a), specifically after the excavation face passed the vertical weak rock zone (VZ). To understand the relationship between connectivity and slip deformation as well as the slip mechanism, we developed simplified models that ignore topographic and geometric factors. These models were used to qualitatively discuss the effect of the connectivity of weak rock zones on mining-induced deformation in an open-pit mine.

5.1.1. Model Introduction

Four conceptual models were developed inspired by the case study quarry, including the case of a single weak rock zone and the case of two weak rock zones. Figure 9a–d depict each model: (a) parallel dip model (P model), (b) vertical dip model (V model), (c) connective pattern model (CP model), and (d) non-connective pattern model (N-CP model). (a) and (b) were used to examine the effect of a single weak rock zone. (c) and (d) were used to verify the effect of connectivity of two weak rock zones, which can be considered as simplified models of section A-A’ and section C-C’, respectively. For computational convenience, the conceptual models were scaled down to about 1/3 the size of the case study quarry. The lengths in the vertical and horizontal directions of all models were 500 m and 800 m, respectively, with a slope angle of 45°.
The excavation area was set on the upper left-hand side of the slope. As indicated in Figure 9, 50 m wide and 180 m high zones were sequentially removed from the top of the slope in a step-by-step manner to represent the excavation progression in nine stages. Each excavation zone was 20 m high. At the fifth excavation stage, the excavation face passed the vertical weak rock zone (VZ) in the V, CP, and N-CP models, as depicted in Figure 9b, Figure 9c, and Figure 9d, respectively. Additionally, in the models with a parallel dip (P, CP, and N-CP models), a 10 m thick cover rock was formed as the excavation proceeded (Figure 9a,c,d).
Similar with the section models, the boundary was modeled as a discontinuity plane in the discrete element method framework, whereas both the rock mass and weak rock zone were modeled as elastic materials. For simplification, the values of Young’s moduli for the rock masses and weak rock zones were assumed to be 1 GPa and 0.1 GPa, respectively, because the weak rock zone is expected to be more deformable than the rock mass. The Poisson’s ratio was set to 0.25.
The stiffness and frictional angle of the discontinuities on the surface of the weak rock zones were determined by referring to the values presented in the Universal Distinct Element Code (UDEC) manual [36], and related studies [41,42,43,44,45,46,47] to be consistent with the section models described in previous sections. Table 5 and Table 6 list the specific values.

5.1.2. Simulation Procedure and Monitoring Points

The simulation involved the following three steps: (1) Displacements perpendicular to the bottom and lateral boundaries were maintained constant. (2) The initial iterations were performed under gravity to generate the initial stress state. (3) Iterations were executed while removing the excavation zones and recording the changes in displacement and stress. The model response was monitored during the third step.
Figure 10 depicts the displacement and stress measurement points. Points 1 and 2 were used to observe the surface displacement of the rock slope. Considering the CP model as an example, Points 1 and 2 were located above and below the VZ, respectively. Points A–F were used to monitor the stress changes in the discontinuities along the weak rock zones. Points A–C were set on the weak rock zone parallel to the slope surface (PZ), whereas Points D–F were set on the vertical weak rock zone (VZ).

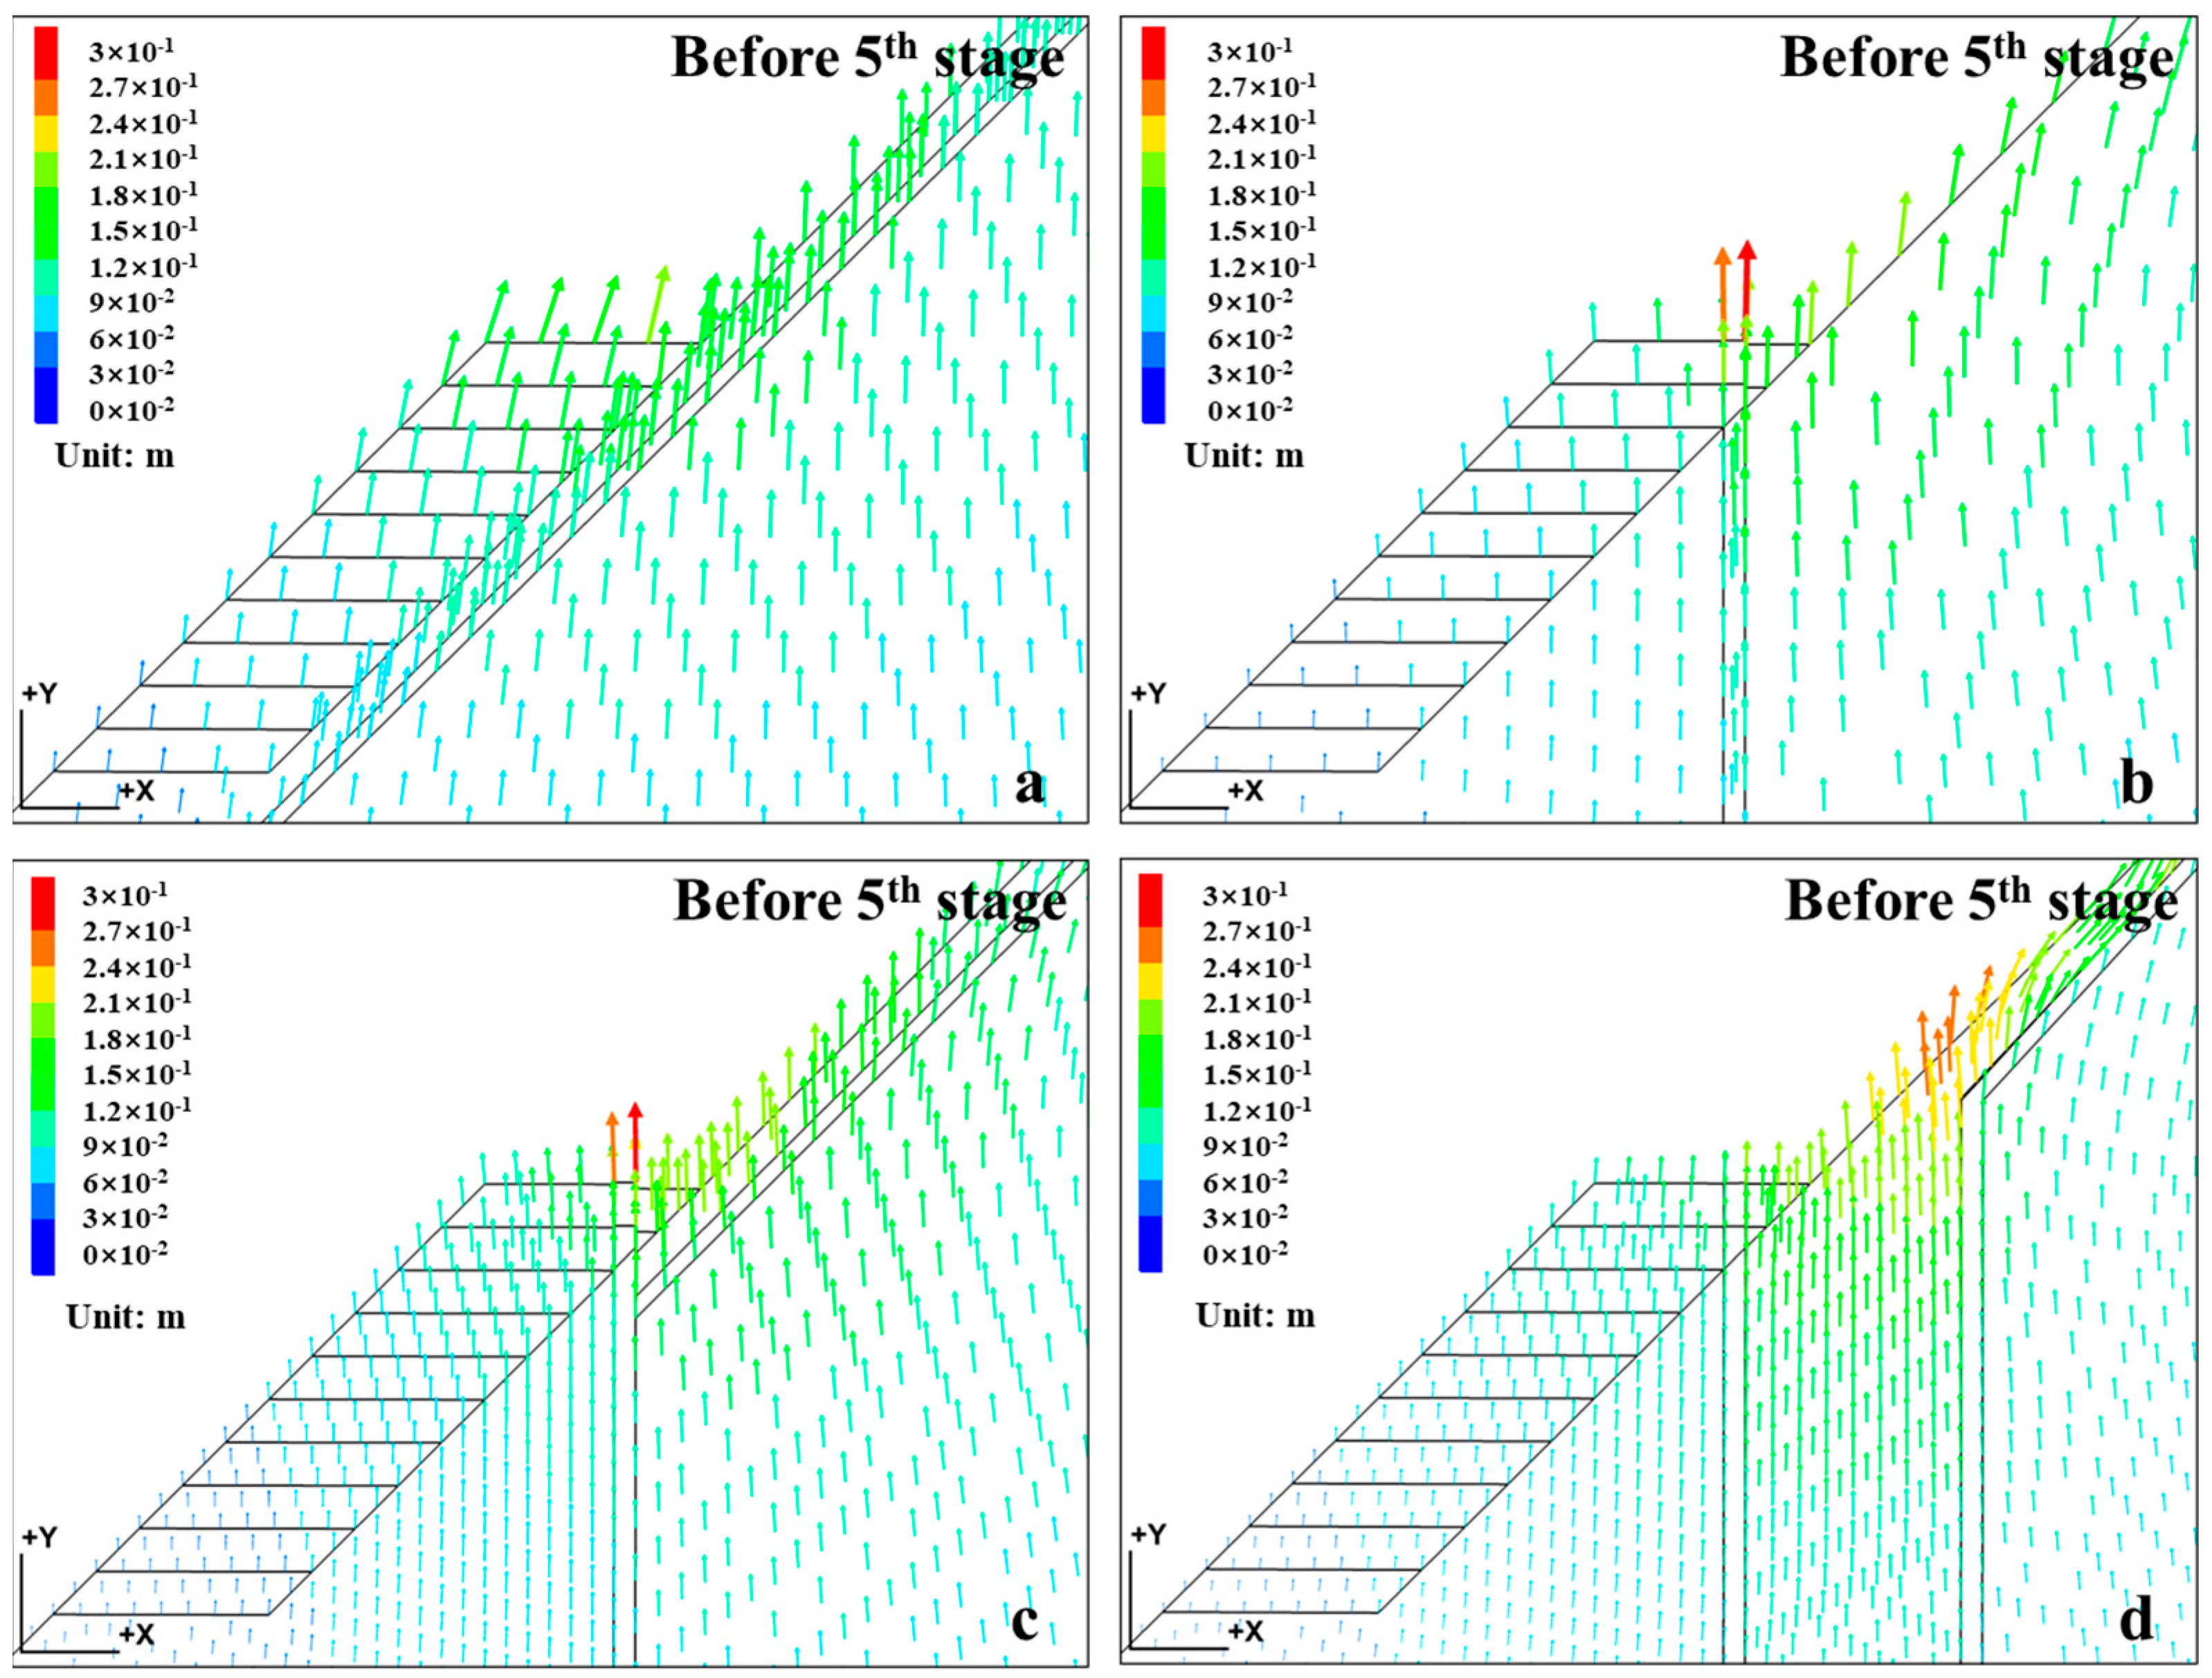
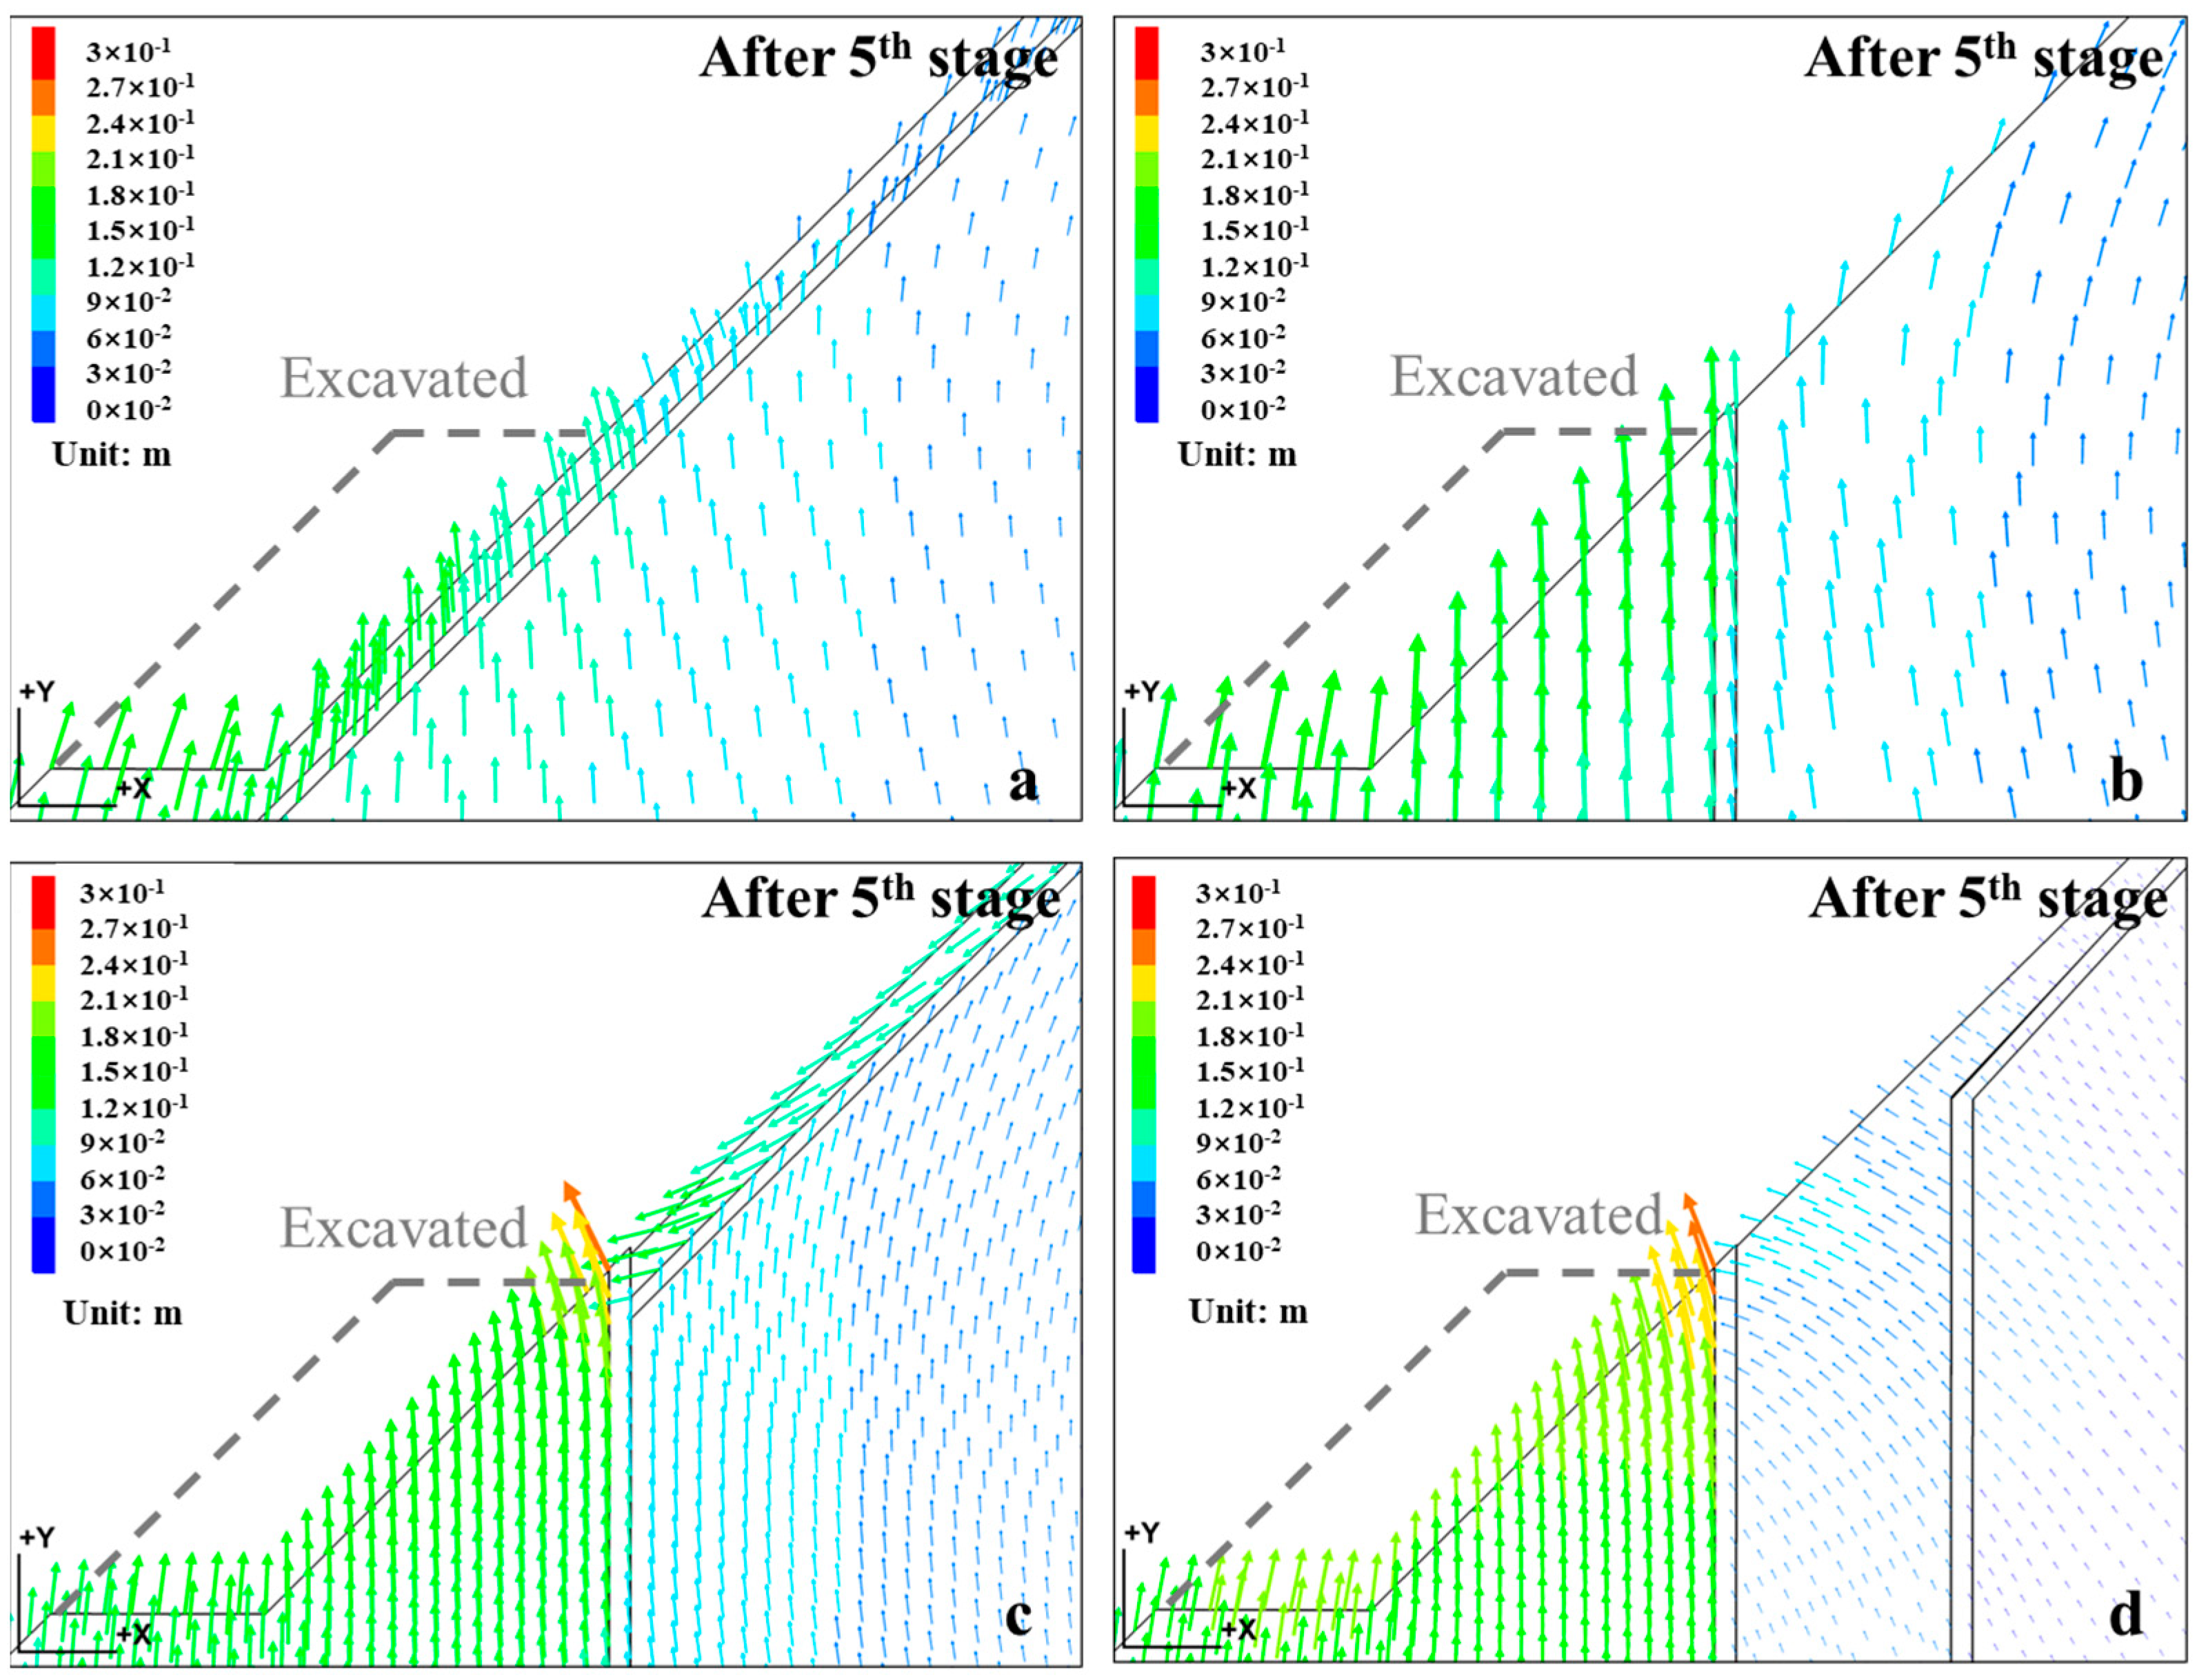
5.1.3. Simulation Results

Figure 11 depicts the horizontal and vertical cumulative displacement increments at Points 1 and 2 caused by excavation, with positive values corresponding to the backward and upward directions in the x and y directions, respectively. The vertical displacements in all models, except the CP model, exhibited an upward trend throughout the nine excavation stages. By contrast, a downward displacement was observed at Point 1 in the CP model after the fifth excavation stage, although an upward displacement occurred at Point 2. The rate of downward displacement tended to decrease during the excavation stages. In the horizontal direction, the mining-induced displacement of all models, except for the CP model, was nearly negligible compared to the vertical displacement. Conversely, the horizontal displacement of the CP model exhibited an apparent increase in the forward direction after the fifth excavation stage. However, the rate of increase gradually decreased as the excavation progressed.
As mentioned previously, the vertical and horizontal displacements of the CP model exhibited a remarkable change after the fifth excavation stage. To understand the mechanism underlying this change, the displacement increment vectors from the initial state to the fifth stage and from the fifth to ninth stages were analyzed. Figure 12 and Figure 13 illustrate the vectors in the fifth and ninth stages, respectively. We observed that the displacement modes of the models with a single weak zone and the N-CP model were similar. Although a slight difference existed in the displacement, the rock slopes in these models exhibited upward displacement in both stages as the upward displacements. The deformation mode of the CP model was different because the vectors continued to remain upward until the fifth stage (Figure 12c); however, the rock slope on the PZ began to exhibit sliding deformations along the upper boundary of the PZ after this stage (Figure 13c).
The aforementioned results indicate that the cover rock on the PZ in the CP model begins to slide along the PZ when the excavation face passes the VZ and that the sliding deformation is reduced in the subsequent excavation stages. Furthermore, the results imply that a single weak rock zone or a non-connective pattern like the N-CP model does not significantly affect mining-induced deformations. The rock slope primarily exhibits upward displacements caused by elastic recovery because of the gravity release [54]. A unique structure, such as the connection of the PZ to the VZ, induces downward and forward displacements owing to sliding.

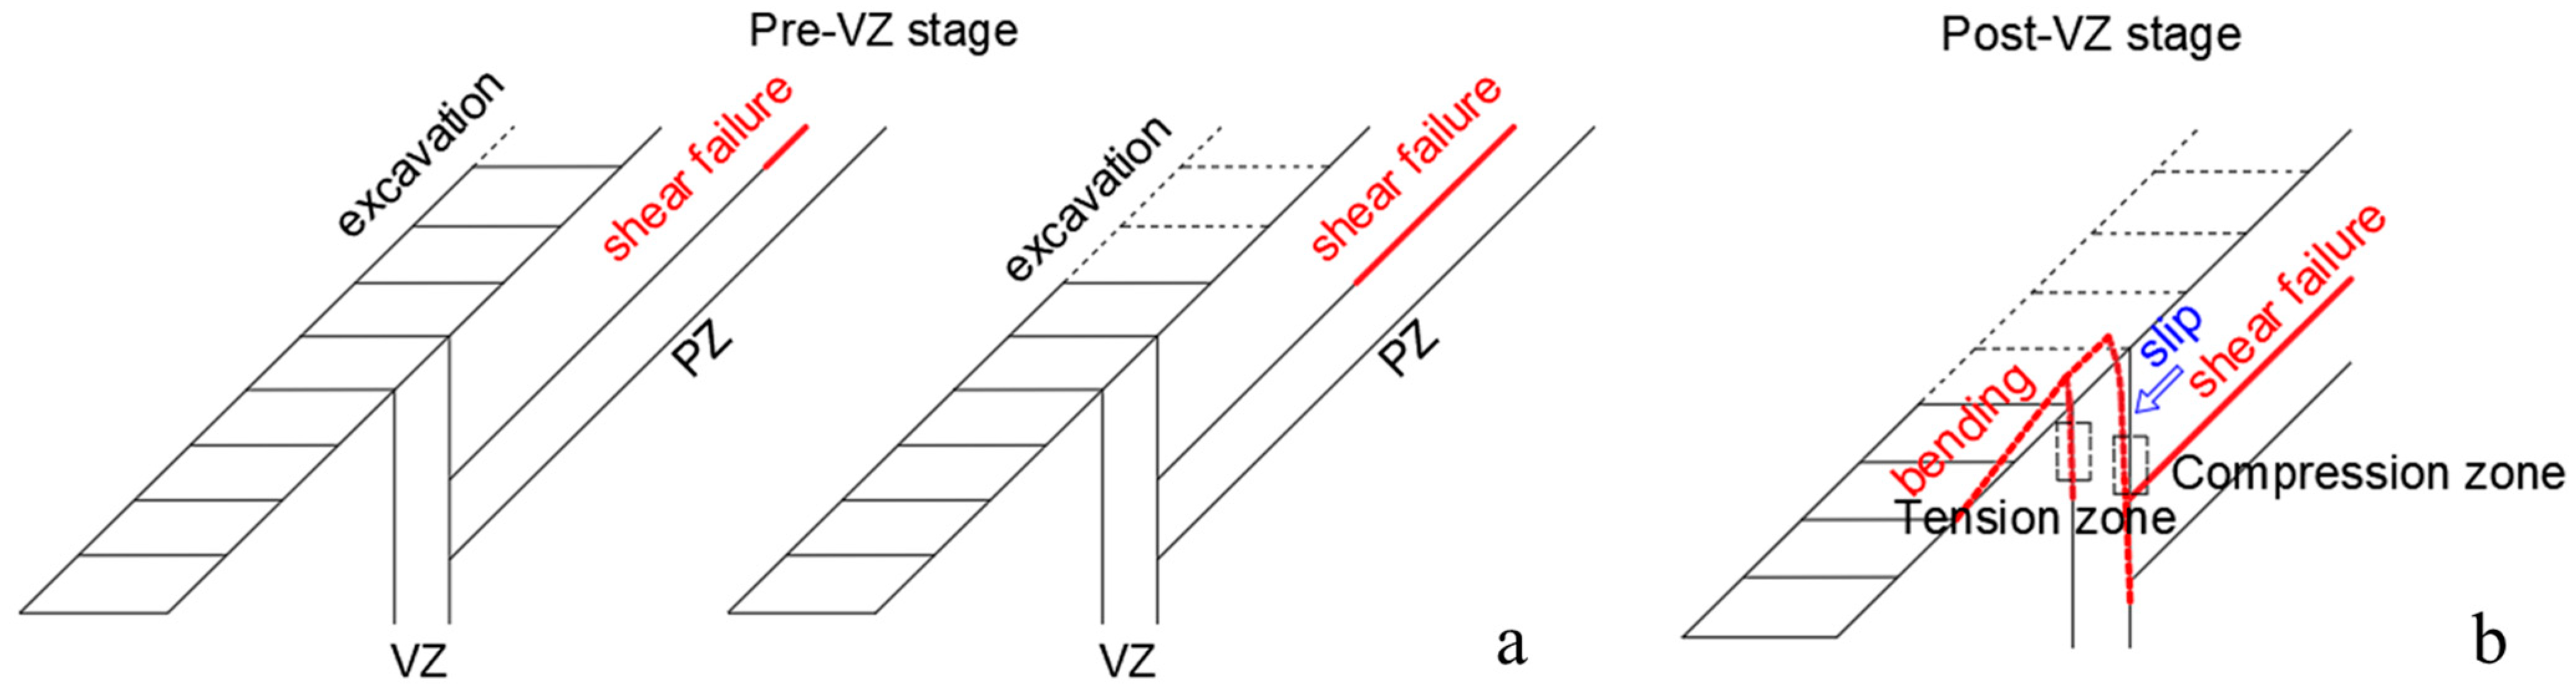
5.1.4. Mechanism of the Sliding Movement

As explained in Section 5.1.3, the rock slope of the CP model begins to slide along the PZ when the excavation face passes the VZ, and the sliding deformation decreases with excavation progression. In this section, the mechanism of the mining-induced deformation in the CP model is examined by analyzing the change in the stress state on PZ and VZ surfaces.
Figure 14 illustrates the change in the shear-to-normal stress ratio at Points A, B, and C on the VZ surface (Figure 10). The ratio at the three points decreased in the early stages and increased subsequently. The ratio finally reached 0.577, which was located on the Mohr–Coulomb failure envelope at a frictional angle of 30°. The three points reached the failure envelope in the following order: A, B, and C. After the fifth excavation stage, the ratios at all points were 0.577, indicating that shear failure occurred sequentially along the boundary between the cover rock and PZ from the top of the rock slope, and the entire boundary eventually failed at the fifth excavation stage.
Figure 15 depicts the normal stress at Points D, E, and F on the discontinuity of the right-hand side of the VZ, with positive values corresponding to compression. Point E was located on the hanging side of the VZ in the vicinity of the intersection point with the PZ, whereas Points D and F were located 10 m above and below Point E, respectively. The normal stress at Points D and F decreased monotonically and reached zero at the sixth excavation stage. The normal stress at Point E decreased in the earlier excavation stages, yet increased in the fifth excavation stage. This increase indicated that the VZ at Point E was gradually compressed by the cover rock sliding downwards on the PZ. The decreases at Points D and F were attributed to the separation of VZ from the rock mass, which can be confirmed if the zone undergoes bending deformation owing to the load applied at the intersection point by the cover rock sliding downwards.
Further investigations were performed to verify this hypothesis. As indicated in Figure 13c, the triangular part adjacent to the VZ (Figure 10) produces a significant forward displacement. The forward displacement was caused by the cover rock located on the PZ sliding toward the VZ. Therefore, the triangular part was bent under a large thrust, generating forward displacement. For verification, another model was constructed by varying the geometry of the VZ in the CP model (Figure 16a). In this model, the VZ did not cross the cover rock. Figure 16b illustrates the displacement increment vectors from the fifth to ninth stages of the new model. The mining-induced displacement was upward in the same manner as that observed in the P and V models (Figure 12a,b). Therefore, the triangular structure formed by the VZ crossing the cover rock in the CP model contributed to slip occurrence.
Based on the aforementioned considerations, we propose the following mechanism of slip movement in the CP model. The normal and shear stresses on the discontinuity of the PZ decrease with excavation, and the decrease in the normal stress is greater than that in the shear stress, which increases the shear-to-normal stress ratio (Figure 14). This change in stress induces shear failure of the discontinuity, which develops from the top of the rock slope and gradually expands (Figure 17a). After the excavation face passes the VZ, shear failure extends throughout the discontinuity in the PZ. The development of shear failure further induces an increase in the contraction of the VZ because the cover rock pushes the VZ from behind, enabling the sliding movement of the cover rock along the PZ. Subsequently, the triangular part beside the VZ undergoes a bending load owing to the large thrust force applied by the cover rock, resulting in elastic deformation and escalation of the cover rock sliding (Figure 17b). Eventually, the slip movement terminates when the elastic resistance force caused by the bending deformation of the VZ and triangular part becomes equal to the sliding force of the cover rock.
Figure 18 illustrates the horizontal displacement corresponding to the sliding force-induced contraction of the VZ along with the horizontal displacement at Point 1; the latter is expected to be the sum of the displacement owing to the VZ contraction and bending deformation of the VZ and rock mass. The contraction-induced displacement on the VZ was computed based on the difference in the horizontal displacements at the points on the left- and right-hand sides of the VZ near the slope surface. The horizontal displacement at Point 1 was greater than the contraction-induced horizontal displacement. This indicated that the forward displacement included both the bending- and contraction-induced deformations of the VZ and triangular parts, generating the deformation vectors depicted in Figure 13c. Therefore, the sliding movement was controlled not only by the contraction of the VZ but also by the bending deformation of both the VZ and the triangular part of the rock mass. The deformability of the weak rock zone and rock mass are expected to affect the amount of sliding.

5.2. Interpretation of the Rock Slope Deformations Observed in the Case Study Quarry

5.2.1. Deformation Mechanism of Eastern and Western Sections

As described in Section 4.1 and Section 5.1, certain common characteristics were observed in the displacements between the CP model and section A-A’ model of the quarry despite the differences in the dimensions and mechanical properties. After the excavation face passed the VZ, slip deformation occurred along the discontinuous geological boundary. Additionally, the displacement characteristics of the B-B’ and C-C’ models were similar to those of the N-CP model. This implied that the deformation mechanisms of the mine considered in the case study can be explained based on the deformation mechanism of the CP model.
In section A-A’, the cover rock began to slip along the discontinuity of the geological boundary after the excavation face passed the VZ owing to an increase in the normal-to-shear stress ratio (Figure 14), which induced significant forward and downward movements after 2006. In the subsequent excavation, as the cover rock thrust through the VZ, the VZ itself contracted while undergoing bending deformation along with the triangular part adjacent to it. According to the slip mechanism depicted in Figure 17, the slip deformation gradually converged, indicated by the convergence of the change-in-distance curve after 2016. The results further demonstrated that the rock slope is stable as long as the rock mass in the triangular part remains in the elastic stage.
By contrast, sections B-B’ and C-C’ exhibited behaviors similar to those of the N-CP model. In these cross-sections, the cover rock between the limestone and green rock did not undergo sliding because the two weak rock zones were unconnected and did not mechanically interact with each other. Both B-B’ and C-C’ sections exhibited similar upward displacements, which can be interpreted as elastic deformation caused by the release of gravity-induced elastic strain owing to excavation, indicating that the rock slope in sections B-B’ and C-C’ remained stable.

5.2.2. Reasons for the Difference in Measurements and Simulation Results

As indicated in Section 4.1, a quantitative discrepancy existed between the field measurements and simulations in section A-A’. One reason for this could be the effect of the clay zone discussed in Section 4.2. Additionally, the presence of rock joints or cracks is expected to induce rock slope deformation in section A-A’. A geological investigation revealed that several cracks with a dip angle of 30° were distributed in the limestone cover rock (Figure 2a). Monitoring results from extensometers indicated that these low-angle cracks gradually slipped with excavation [55]. The effect of such joints or cracks on the mechanical parameters of the rock mass can be further optimized using probabilistic methods [56]. Future studies will investigate how these low-angle cracks contribute to observed displacements and their implications for slope stability.
Additionally, the effects of rainfall and groundwater were not considered in the simulation, which is a significant limitation. Changes in the saturated and unsaturated zones of the slope caused by rainfall typically result in variations in pore pressure, leading to changes in the intensity of slip deformation [57]. Furthermore, heavy rainfall in 2007 and 2011 significantly impacted rock slope deformation, as the frictional resistance of discontinuities is generally reduced by water due to decreases in both the friction angle and effective stress [58,59]. Future research will focus on these factors to better understand their impact on slope stability. Moreover, we will design and evaluate safety countermeasures to restrain sliding deformation and prevent shear failure of the slope. This includes developing more sophisticated models that incorporate hydrological effects and assessing the effectiveness of various engineering interventions.

6. Conclusions

In this study, the effects of the connectivity of weak rock zones on mining-induced deformation in the case study quarry were numerically analyzed. It was found that local deformation in a quarry depends on the local connectivity of the weak rock zones. A rock slope has a high risk of sliding deformation if a parallel weak rock zone is connected to a vertical weak rock zone. Furthermore, the mechanism of sliding deformation was elucidated based on numerical simulations and measurement data.
The main conclusions are follows:
  • In the west section of the quarry, the weak rock zone parallel to the slope surface, developed between the limestone and green rock, connects with the vertical weak rock zone, leading to significant displacement that eventually converges as excavation progresses. In contrast, the east section has less developed parallel weak rock zones with little observed displacement.
  • The displacement observed in the west section can be qualitatively explained by numerical simulation, assuming the geological boundaries as discontinuous. Mining-induced stress changes cause shear failure at these boundaries. As the excavation face passes the vertical weak rock zone, the bending stiffness at the foot of the rock slope decreases, leading to sliding deformation along the parallel weak rock zone. However, the resistance force against bending deformation increases as mining progresses, eventually stopping the sliding deformation when resistance equals sliding force.

Author Contributions

C.Z. conceptualization, methodology, writing—original draft, and editing; A.a.C. writing—reviewing and editing; J.-i.K. conceptualization, methodology, writing—reviewing and supervision; A.S. conceptualization, methodology, writing—reviewing and supervision; Y.F. writing—reviewing and supervision; D.F. writing—reviewing and supervision; S.W. writing—reviewing. All authors have read and agreed to the published version of the manuscript.

Funding

This work was supported by JST SPRING, Grant Number JPMJSP2119.

Institutional Review Board Statement

Not applicable.

Informed Consent Statement

Written informed consent has been obtained from the patient(s) to publish this paper.

Data Availability Statement

The data presented in this study are available on request from the corresponding author.

Acknowledgments

We deeply thank Ryoko Lime Industry Co., Ltd., Chichibu Taiheiyo Cement Co., Ltd., and BUKO Mining Co., Ltd. for the permission to conduct research in the above study area, the kind support and the cooperation in provision of information and monitoring data.

Conflicts of Interest

The authors declare no conflicts of interest.

References

  1. Rose, N.D.; Hungr, O. Forecasting potential rock slope failure in open pit mines using the inverse-velocity method. Int. J. Rock Mech. Min. Sci. 2007, 44, 308–320. [Google Scholar] [CrossRef]
  2. Assefa, S.; Graziani, A.; Lembo-Fazio, A. A slope movement in a complex rock formation: Deformation measurements and DEM modelling. Eng. Geol. 2017, 219, 74–91. [Google Scholar] [CrossRef]
  3. López-Vinielles, J.; Ezquerro, P.; Fernández-Merodo, J.A.; Béjar-Pizarro, M.; Monserrat, O.; Barra, A.; Blanco, P.; García-Robles, J.; Filatov, A.; García-Davalillo, J.C.; et al. Remote analysis of an open-pit slope failure: Las Cruces case study, Spain. Landslides 2020, 17, 2173–2188. [Google Scholar] [CrossRef]
  4. An, B.; Wang, C.; Liu, C.; Li, P. A multi-source remote sensing satellite view of the February 22nd Xinjing landslide in the mining area of Alxa left Banner, China. Landslides 2023, 20, 2517–2523. [Google Scholar] [CrossRef]
  5. Kaneko, K.; Noguchi, Y.; Soda, K.; Hazuku, M. Stability Assesment of Rock Slope by Displacement Measurement. J. Mmij 1996, 112, 915–920. [Google Scholar] [CrossRef]
  6. Obara, Y.; Nakamura, N.; Kang, S.S.; Kaneko, K. Measurement of local stress and estimation of regional stress associated with stability assessment of an open-pit rock slope. Int. J. Rock Mech. Min. Sci. 2000, 37, 1211–1221. [Google Scholar] [CrossRef]
  7. Kodama, J.; Nishiyama, E.; Kaneko, K. Measurement and interpretation of long-term deformation of a rock slope at the Ikura limestone quarry, Japan. Int. J. Rock Mech. Min. Sci. 2009, 46, 148–158. [Google Scholar] [CrossRef]
  8. Kodama, J.; Miyamoto, T.; Kawasaki, S.; Fujii, Y.; Kaneko, K.; Hagan, P. Estimation of regional stress state and Young’s modulus by back analysis of mining-induced deformation. Int. J. Rock Mech. Min. Sci. 2013, 63, 1–11. [Google Scholar] [CrossRef]
  9. Najib; Fukuda, D.; Kodama, J.-I.; Fujii, Y. The Deformation Modes of Rock Slopes due to Excavation in Mountain-Type Mines. Mater. Trans. 2015, 56, 1159–1168. [Google Scholar] [CrossRef]
  10. Amagu, C.A.; Zhang, C.; Kodama, J.-I.; Shioya, K.; Yamaguchi, T.; Sainoki, A.; Fukuda, D.; Fujii, Y.; Sharifzadeh, M. Displacement Measurements and Numerical Analysis of Long-Term Rock Slope Deformation at Higashi-Shikagoe Limestone Quarry, Japan. Adv. Civ. Eng. 2021, 2021, 1316402. [Google Scholar] [CrossRef]
  11. Abdellah, W.R.; Hirohama, C.; Sainoki, A.; Towfeek, A.R.; Ali, M.A.M. Estimating the Optimal Overall Slope Angle of Open-Pit Mines with Probabilistic Analysis. Appl. Sci. 2022, 12, 4746. [Google Scholar] [CrossRef]
  12. Sdvyzhkova, O.; Moldabayev, S.; Bascetin, A.; Babets, D.; Kuldeyev, E.; Sultanbekova, Z.; Amankulov, M.; Issakov, B. Probabilistic assessment of slope stability at ore mining with steep layers in deep open pits. Min. Miner. Depos. 2022, 16, 11–18. [Google Scholar] [CrossRef]
  13. Hocking, G. A method for distinguishing between single and double plane sliding of tetrahedral wedges. Int. J. Rock Mech. Min. Sci. 1976, 13, 225–226. [Google Scholar] [CrossRef]
  14. Hoek, E.; Bray, J.D. Rock Slope Engineering; CRC Press: Boca Raton, FL, USA, 1981. [Google Scholar]
  15. Yoon, W.; Jeong, U.; Kim, J. Kinematic analysis for sliding failure of multi-faced rock slopes. Eng. Geol. 2002, 67, 51–61. [Google Scholar] [CrossRef]
  16. Lee, C.-Y.; Wang, I.-T. Analysis of highway slope failure by an application of the stereographic projection. Int. J. Geol. Environ. Eng. 2011, 5, 122–129. [Google Scholar]
  17. Tang, H.; Yong, R.; Ez Eldin, M. Stability analysis of stratified rock slopes with spatially variable strength parameters: The case of Qianjiangping landslide. B Eng. Geol. Env. 2017, 76, 839–853. [Google Scholar] [CrossRef]
  18. Glastonbury, J.; Fell, R. Report on the Analysis of “Rapid” Natural Rock Slope Failures; School of Civil and Environmental Engineering, University of New South Wales: Sydney, Australia, 2000. [Google Scholar]
  19. MacLaughlin, M.; Sitar, N.; Doolin, D.; Abbot, T. Investigation of slope-stability kinematics using discontinuous deformation analysis. Int. J. Rock Mech. Min. Sci. 2001, 38, 753–762. [Google Scholar] [CrossRef]
  20. Stead, D.; Wolter, A. A critical review of rock slope failure mechanisms: The importance of structural geology. J. Struct. Geol. 2015, 74, 1–23. [Google Scholar] [CrossRef]
  21. Azarfar, B.; Ahmadvand, S.; Sattarvand, J.; Abbasi, B. Stability Analysis of Rock Structure in Large Slopes and Open-Pit Mine: Numerical and Experimental Fault Modeling. Rock Mech. Rock Eng. 2019, 52, 4889–4905. [Google Scholar] [CrossRef]
  22. Kaczmarek, Ł.D.; Popielski, P. Selected components of geological structures and numerical modelling of slope stability. Open Geosci. 2019, 11, 208–218. [Google Scholar] [CrossRef]
  23. Li, Y.; Yu, L.; Song, W.; Yang, T. Three-Dimensional Analysis of Complex Rock Slope Stability Affected by Fault and Weak Layer Based on FESRM. Adv. Civ. Eng. 2019, 2019, 6380815. [Google Scholar] [CrossRef]
  24. Wang, L.-Y.; Chen, W.-Z.; Tan, X.-Y.; Tan, X.-J.; Yuan, J.-Q.; Liu, Q. Evaluation of mountain slope stability considering the impact of geological interfaces using discrete fractures model. J. Mt. Sci. 2019, 16, 2184–2202. [Google Scholar] [CrossRef]
  25. Lemaire, E.; Mreyen, A.-S.; Dufresne, A.; Havenith, H.-B. Analysis of the Influence of Structural Geology on the Massive Seismic Slope Failure Potential Supported by Numerical Modelling. Geosciences 2020, 10, 323. [Google Scholar] [CrossRef]
  26. Vick, L.M.; Böhme, M.; Rouyet, L.; Bergh, S.G.; Corner, G.D.; Lauknes, T.R. Structurally controlled rock slope deformation in northern Norway. Landslides 2020, 17, 1745–1776. [Google Scholar] [CrossRef]
  27. Xie, J.; Yang, G.L.; Qin, Y.G.; Xu, X.T. Deformation Failure Mechanism and Motion Laws of Near-horizontal Thick-layer with Thin-layer Columnar Dangerous Rock Mass in the Chishui Red Bed Area. IOP Conf. Ser. Earth Environ. Sci. 2020, 570, 022045. [Google Scholar] [CrossRef]
  28. Zerradi, Y.; Souissi, M.; Larabi, A. Application of the deterministic block theory to the slope stability design of an open-pit mine in Morocco. Min. Miner. Depos. 2023, 17, 53–60. [Google Scholar] [CrossRef]
  29. Nie, L.; Li, Z.C.; Zhang, M.; Xu, L.N. Deformation characteristics and mechanism of the landslide in West Open-Pit Mine, Fushun, China. Arab. J. Geosci. 2015, 8, 4457–4468. [Google Scholar] [CrossRef]
  30. Amini, M.; Ardestani, A. Stability analysis of the north-eastern slope of Daralou copper open pit mine against a secondary toppling failure. Eng. Geol. 2019, 249, 89–101. [Google Scholar] [CrossRef]
  31. Eang, K.E.; Igarashi, T.; Kondo, M.; Nakatani, T.; Tabelin, C.B.; Fujinaga, R. Groundwater monitoring of an open-pit limestone quarry: Water-rock interaction and mixing estimation within the rock layers by geochemical and statistical analyses. Int. J. Min. Sci. Technol. 2018, 28, 849–857. [Google Scholar] [CrossRef]
  32. Yamatomi, J.; Sugiyama, T.; Mikami, K.; Wakisaka, T.; Yamaguchi, U. Limestone Mining and Slope Management at Mt. Buko. J. MMIJ 2018, 134, 161–169. [Google Scholar] [CrossRef]
  33. Nakatani, T.; Fujimaki, K.; Hirasawa, Y.; Akiyama, F.; Miyayumi, T.; Tanaka, K. Monitoring of the Surface Displacements of the Final Slope at Mt.Buko. J. MMIJ 2018, 134, 170–178. [Google Scholar] [CrossRef]
  34. Ozawa, N. Analyzing the Impacts of Rainfall on Rock Slope Behavior in Une Mine and Evaluating the Effec-Tiveness of Countermeasure Methods. J. MMIJ 2018, 134, 208–221. [Google Scholar] [CrossRef]
  35. Yamaguchi, U. Cooperative Mining of Limestone at Mt. Buko and the Task Group for Research on Rock Slope in Chichibu Area (Chichibu Zanken). J. MMIJ 2018, 134, 67–73. [Google Scholar] [CrossRef]
  36. Itasca. UDEC, Version 7.0; Theory and Background; Itasca Consulting Group Inc.: Minneapolis, MN, USA, 2021.
  37. Marinos, P.; Hoek, E. Gsi: A Geologically Friendly Tool for Rock Mass Strength Estimation. In Proceedings of the ISRM International Symposium, Melbourne, Australia, 19–24 November 2000; p. ISRM-IS-2000-2035. [Google Scholar]
  38. Aboutaleb, S.; Bagherpour, R.; Behnia, M.; Aghababaei, M. Combination of the Physical and Ultrasonic Tests in Estimating the Uniaxial Compressive Strength and Young’s Modulus of Intact Limestone Rocks. Geotech. Geol. Eng. 2017, 35, 3015–3023. [Google Scholar] [CrossRef]
  39. ASTM D2938-95; Standard Test Method for Unconfined Compressive Strength of Intact Rock Core Specimens. ASTM International: West Conshohocken, PA, USA, 2022.
  40. Majdi, A.; Bashari, A.; Beiki, M. Estimation of Rock Mass Deformation Modulus Based on GSI System. In Proceedings of the 12th ISRM Congress, Beijing, China, 8–21 October 2011. [Google Scholar]
  41. Day, J.J.; Diederichs, M.S.; Hutchinson, D.J. New direct shear testing protocols and analyses for fractures and healed intrablock rockmass discontinuities. Eng. Geol. 2017, 229, 53–72. [Google Scholar] [CrossRef]
  42. Bandis, S.C.; Lumsden, A.C.; Barton, N.R. Fundamentals of rock joint deformation. Int. J. Rock Mech. Min. Sci. Geomech. Abstr. 1983, 20, 249–268. [Google Scholar] [CrossRef]
  43. Gu, R.; Ozbay, U. Distinct element analysis of unstable shear failure of rock discontinuities in underground mining conditions. Int. J. Rock Mech. Min. Sci. 2014, 68, 44–54. [Google Scholar] [CrossRef]
  44. Zhu, J.B.; Deng, X.F.; Zhao, X.B.; Zhao, J. A Numerical Study on Wave Transmission Across Multiple Intersecting Joint Sets in Rock Masses with UDEC. Rock Mech. Rock Eng. 2013, 46, 1429–1442. [Google Scholar] [CrossRef]
  45. Peacock, D.C.P.; Xing, Z. Field examples and numerical modelling of oversteps and bends along normal faults in cross-section. Tectonophysics 1994, 234, 147–167. [Google Scholar] [CrossRef]
  46. Jiang, Y.; Yamashita, Y.; Sawada, M.; Li, B.; Etou, Y. Evaluation of Progressive Failure Mechanism in Jointed Rock Slopes by applying Extended Distinct Element Method. J. MMIJ 2008, 124, 771–776. [Google Scholar] [CrossRef]
  47. Kuraoka, S.; Monma, K.; Shuzui, H. Numerical Analysis of Jointed Rock Slope in Practice. J. Jpn. Soc. Eng. Geol. 2000, 41, 24–33. [Google Scholar] [CrossRef]
  48. Bunyu, H.; Higashi, S.; Sainoki, A. Elucidation of Microscopic Stress State within Surface Asperities of a Rock Joint. In Proceedings of the 15th ISRM Congress, Salzburg, Austria, 9–14 October 2023; p. ISRM-15CONGRESS-2023-2405. [Google Scholar]
  49. Cao, J.; Wang, T.; Zhou, G.; Feng, X.; Zhu, C. Parameter estimation of grouting pressure and surface subsidence on the reliability of shield tunnel excavation under incomplete probability information. Comput. Geotech. 2024, 173, 106530. [Google Scholar] [CrossRef]
  50. Mondol, N.H.; Jahren, J.; Bjørlykke, K.; Brevik, I. Elastic properties of clay minerals. Lead. Edge 2008, 27, 758–770. [Google Scholar] [CrossRef]
  51. Rastegarnia, A.; Lashkaripour, G.R.; Sharifi Teshnizi, E.; Ghafoori, M. Evaluation of engineering characteristics and estimation of static properties of clay-bearing rocks. Environ. Earth Sci. 2021, 80, 621. [Google Scholar] [CrossRef]
  52. Kulhawy, F.H.; Mayne, P.W. Manual on Estimating Soil Properties for Foundation Design; Cornell University: Tompkins, NY, USA, 1990; 298p. [Google Scholar]
  53. Erguler, Z.A.; Ulusay, R. Water-induced variations in mechanical properties of clay-bearing rocks. Int. J. Rock Mech. Min. Sci. 2009, 46, 355–370. [Google Scholar] [CrossRef]
  54. Najib. Elastic Deformation of Rock Slopes Due to Excavation in Open Pit Mines. Ph.D. Thesis, Hokkaido University, Sapporo city, Japan, 2015. [Google Scholar]
  55. Kondo, M.; Aoyama, H.; Ozawa, N.; Yano, K. Countermeasures Against Rainfalls: Towards Stabilizing the Slope at the Une Mine. J. MMIJ 2018, 134, 198–207. [Google Scholar] [CrossRef]
  56. Cao, J.; Wang, T.; Sheng, M.; Huang, Y.; Mo, P.; Zhou, G. Assessment of multi-dimensional joint probability distribution for uncertain mechanical strength parameters under small sample test data. Probabilistic Eng. Mech. 2023, 74, 103511. [Google Scholar] [CrossRef]
  57. Pan, Y.; Wu, G.; Zhao, Z.; He, L. Analysis of rock slope stability under rainfall conditions considering the water-induced weakening of rock. Comput. Geotech. 2020, 128, 103806. [Google Scholar] [CrossRef]
  58. Zhang, Z.; Nemcik, J. Friction Factor of Water Flow Through Rough Rock Fractures. Rock Mech. Rock Eng. 2013, 46, 1125–1134. [Google Scholar] [CrossRef]
  59. Zhao, Z.; Guo, T.; Ning, Z.; Dou, Z.; Dai, F.; Yang, Q. Numerical Modeling of Stability of Fractured Reservoir Bank Slopes Subjected to Water–Rock Interactions. Rock Mech. Rock Eng. 2018, 51, 2517–2531. [Google Scholar] [CrossRef]
Figure 1. Location (a) and general view of the case quarry (b). The while circles (i.e., APS 8) represent monitoring points.
Sustainability 16 05974 g001
Figure 2. Geological condition of the case quarry in 3 geological sections. (a) Section A-A’. (b) Section B-B’. (c) Section C-C’.
Sustainability 16 05974 g002
Figure 3. Comparison of observed data (point) on change in distance with simulation results (dot line). (a) The relative displacement in section A-A’ to section B-B’ (left-hand scale for measurements, right-hand scale for simulations). (b) The relative displacement in section C-C’ to section B-B’.
Sustainability 16 05974 g003aSustainability 16 05974 g003b
Figure 4. Rock mass and the weak rock zones in the case study quarry. (a,b) The limestone. (c,d) The vertical weak rock zone. (e,f) The parallel weak rock zone. (g,h) The green rock. The yellow dashed line in Figure 4c shows the distribution clay. The red lines in Figure 4c–f show the boundaries of weak rock zones.
Sustainability 16 05974 g004
Figure 5. Contact surfaces in the PZ and VZ.
Sustainability 16 05974 g005
Figure 6. Cumulative displacement vectors of each section model, before the excavation face passes the VZ, respectively. (a) Section A-A’. (b) Section A-A’ without weak rock zones. (c) Section B-B’. (d) Section C-C’.
Sustainability 16 05974 g006
Figure 7. Cumulative displacement vectors of each section model, after the excavation face passed the VZ, respectively. (a) Section A-A’. (b) Section A-A’ without weak rock zones. (c) Section B-B’. (d) Section C-C’.
Sustainability 16 05974 g007
Figure 8. Variation of change in distance at APS 7-2 under different Young’s moduli of the VZ.
Sustainability 16 05974 g008
Figure 9. The geological condition of conceptual models. (a) Parallel dip model. (b) Vertical dip model. (c) Connective Pattern model. (d) Non-Connective Pattern model.
Sustainability 16 05974 g009
Figure 10. Measurement points in conceptual models.
Sustainability 16 05974 g010
Figure 11. The cumulative displacement curves of each conceptual model. (a) Vertical displacement in P1. (b) Vertical displacement in P2. (c) Horizontal displacement in P1. (d) Horizontal displacement in P2.
Sustainability 16 05974 g011
Figure 12. Cumulative displacement vectors of each conceptual model, before the excavation face passes the vertical weak rock zone (from the initial stage to the 5th stage). (a) P model. (b) V model. (c) CP model. (d) N-CP model.
Sustainability 16 05974 g012
Figure 13. Cumulative displacement vectors of each conceptual model, after the excavation face passed the vertical weak rock zone (from the 5th stage to the 9th stage). (a) P model. (b) V model. (c) CP model. (d) N-CP model.
Sustainability 16 05974 g013
Figure 14. The ratio of shear stress and normal stress change during the excavation stage in the parallel weak rock zone (the dot line in horizontal direction represents the Mohr–Coulomb failure envelope at Φ = 30°, cohesion = 0 MPa; the dot line in vertical direction represents the stage when excavation face passes the vertical weak rock zone (VZ)).
Sustainability 16 05974 g014
Figure 15. The normal stress variation at the points on the right side of VZ discontinuity during the excavation stage (the dot line in vertical direction represents the stage when excavation face passes the vertical weak rock zone (VZ)).
Sustainability 16 05974 g015
Figure 16. (a) Connecting the two weak rock zones (VZ and PZ) in CP model into one. (b) The result of cumulative displacement vectors after the excavation face passed the VZ.
Sustainability 16 05974 g016
Figure 17. Slip generation process based on CP model. (a) Shear failure gradually expands on the PZ at Pre-VZ stage. (b) Bending deformation occurs at Post-VZ stage.
Sustainability 16 05974 g017
Figure 18. The comparison of slip deformation and compression deformation in horizontal direction.
Sustainability 16 05974 g018
Table 1. Elastic Properties of intact host rock in the quarry by laboratory experiment.
PropertiesIntact LimestoneIntact Green Rock
Density (kg·m−3)25482646
Young’s modulus (GPa)58.134.2
Poisson’s ratio0.250.25
Table 2. Mechanical properties of rock mass in section models, assumed by GSI and experimental values.
PropertiesParallel Weak Rock ZoneVertical Weak Rock ZoneLimestoneGreen Rock
Density (kg·m−3)2597254825482646
Young’s modulus (GPa)1.31.520.415.6
Poisson’s ratio0.250.250.250.25
Table 3. Discontinuities parameters of different rock types.
Rock TypeYoung’s Modulus (GPa)Kn
(GPa/m)
Ks
(GPa/m)
Kn/KsFriction
(°)
ScaleResource
Limestone12105243.9meter-scale(Day et al. 2017) [41]
Limestone498.533.0192.82-meter-scale(Bandis et al. 1983) [42]
-200100100130meter-scale(Gu et al. 2014) [43]
Granite93.4128.6250.672.5326meter-scale(Zhu et al. 2013) [44]
Limestone12104.82.0830meter-scale(Peacock et al. 1994) [45]
Sandstone2311.752.3430meter-scale(Jiang et al. 2008) [46]
Shale64.41.52.9325meter-scale
Tuff4.41.681.491.1237meter-scale(Kuraoka et al. 2000) [47]
Tuff2.90.7850.6371.2321meter-scale
Table 4. Mechanical properties of discontinuities in section model.
PropertiesParallel Weak Rock Zone–Rock Mass ContactVertical Weak Rock Zone–Rock Mass Contact
Kn (GPa/m)1.31.5
Ks (GPa/m)0.650.75
Friction angle (°)3030
Table 5. Mechanical properties of rock mass in conceptual models.
PropertiesWeak Rock ZoneLimestone
Density (kg/m3)27002700
Young’s modulus (GPa)0.11
Poisson’s ratio0.250.25
Table 6. Mechanical properties of discontinuities in conceptual models.
PropertiesWeak Rock Zone-Rock Mass Contact
Kn (GPa/m)0.1
Ks (GPa/m)0.05
Friction (°)30
Disclaimer/Publisher’s Note: The statements, opinions and data contained in all publications are solely those of the individual author(s) and contributor(s) and not of MDPI and/or the editor(s). MDPI and/or the editor(s) disclaim responsibility for any injury to people or property resulting from any ideas, methods, instructions or products referred to in the content.

