
Concept of Assessment of Age-Friendly Residential Areas (AFRA): A Case Study of Gdańsk, Poland


Abstract
1. Introduction
2. Materials and Methods
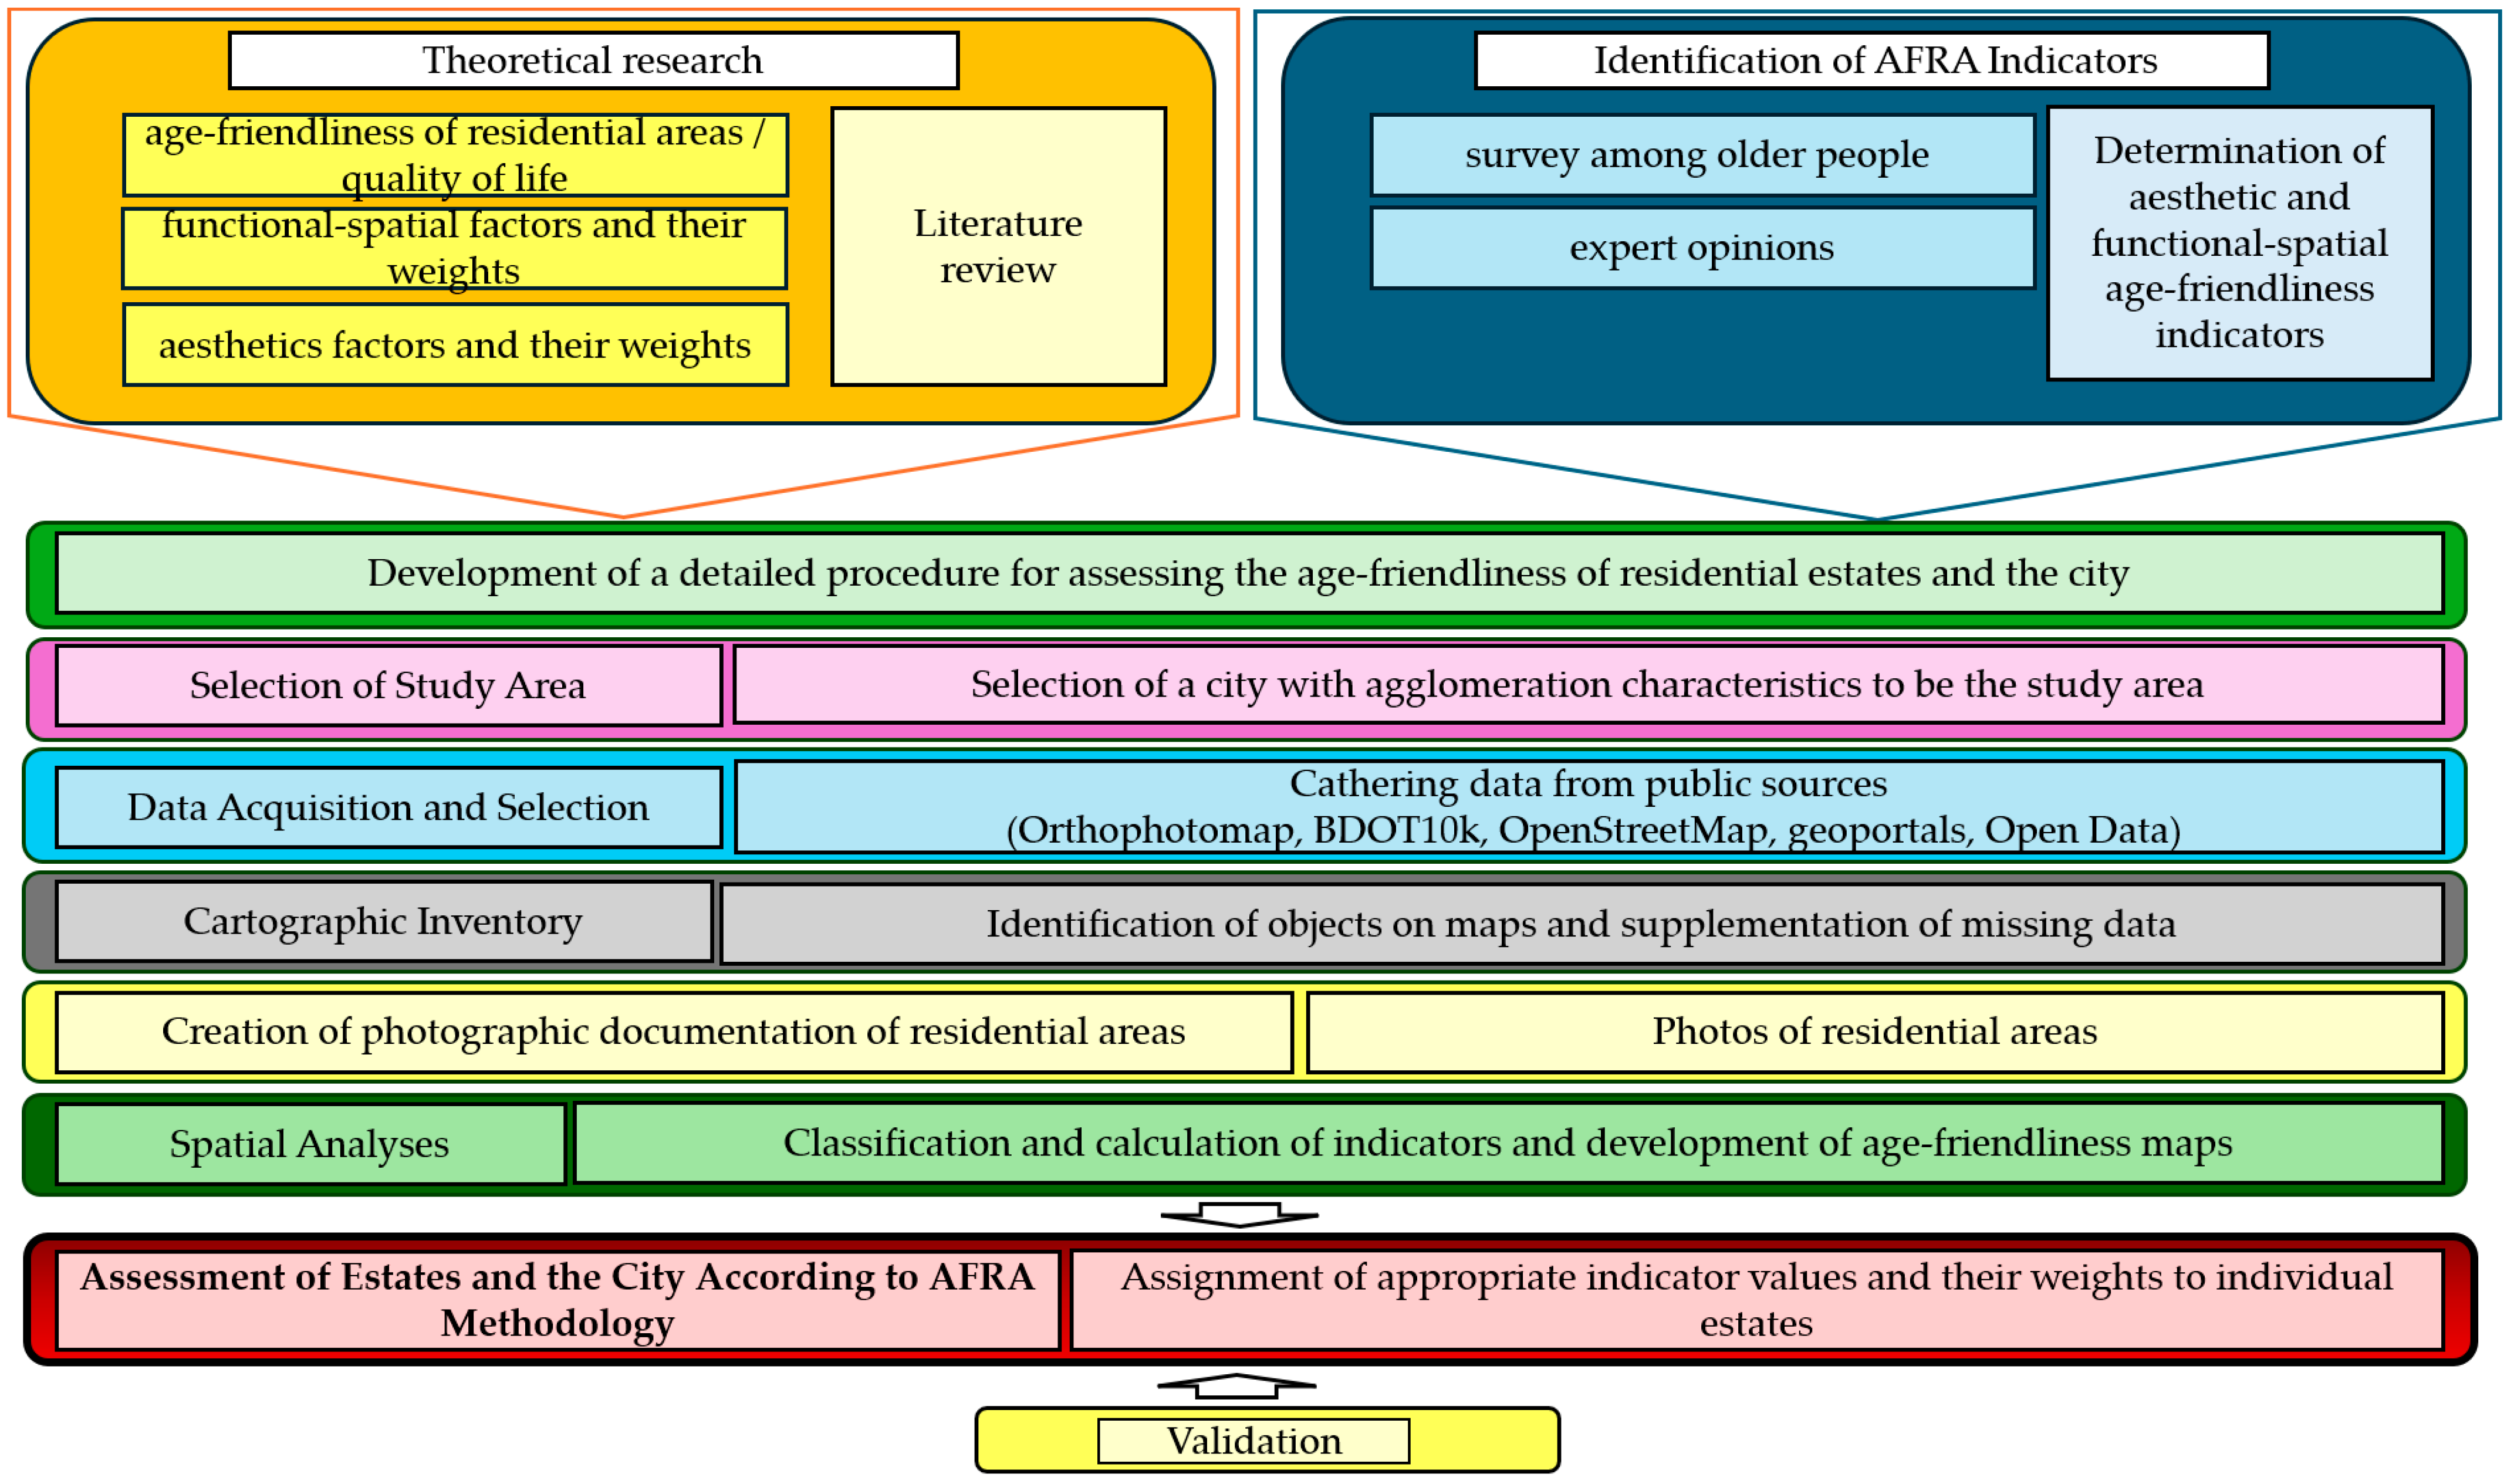
2.1. Research Framework and Assumptions
2.2. AFRA Indicators
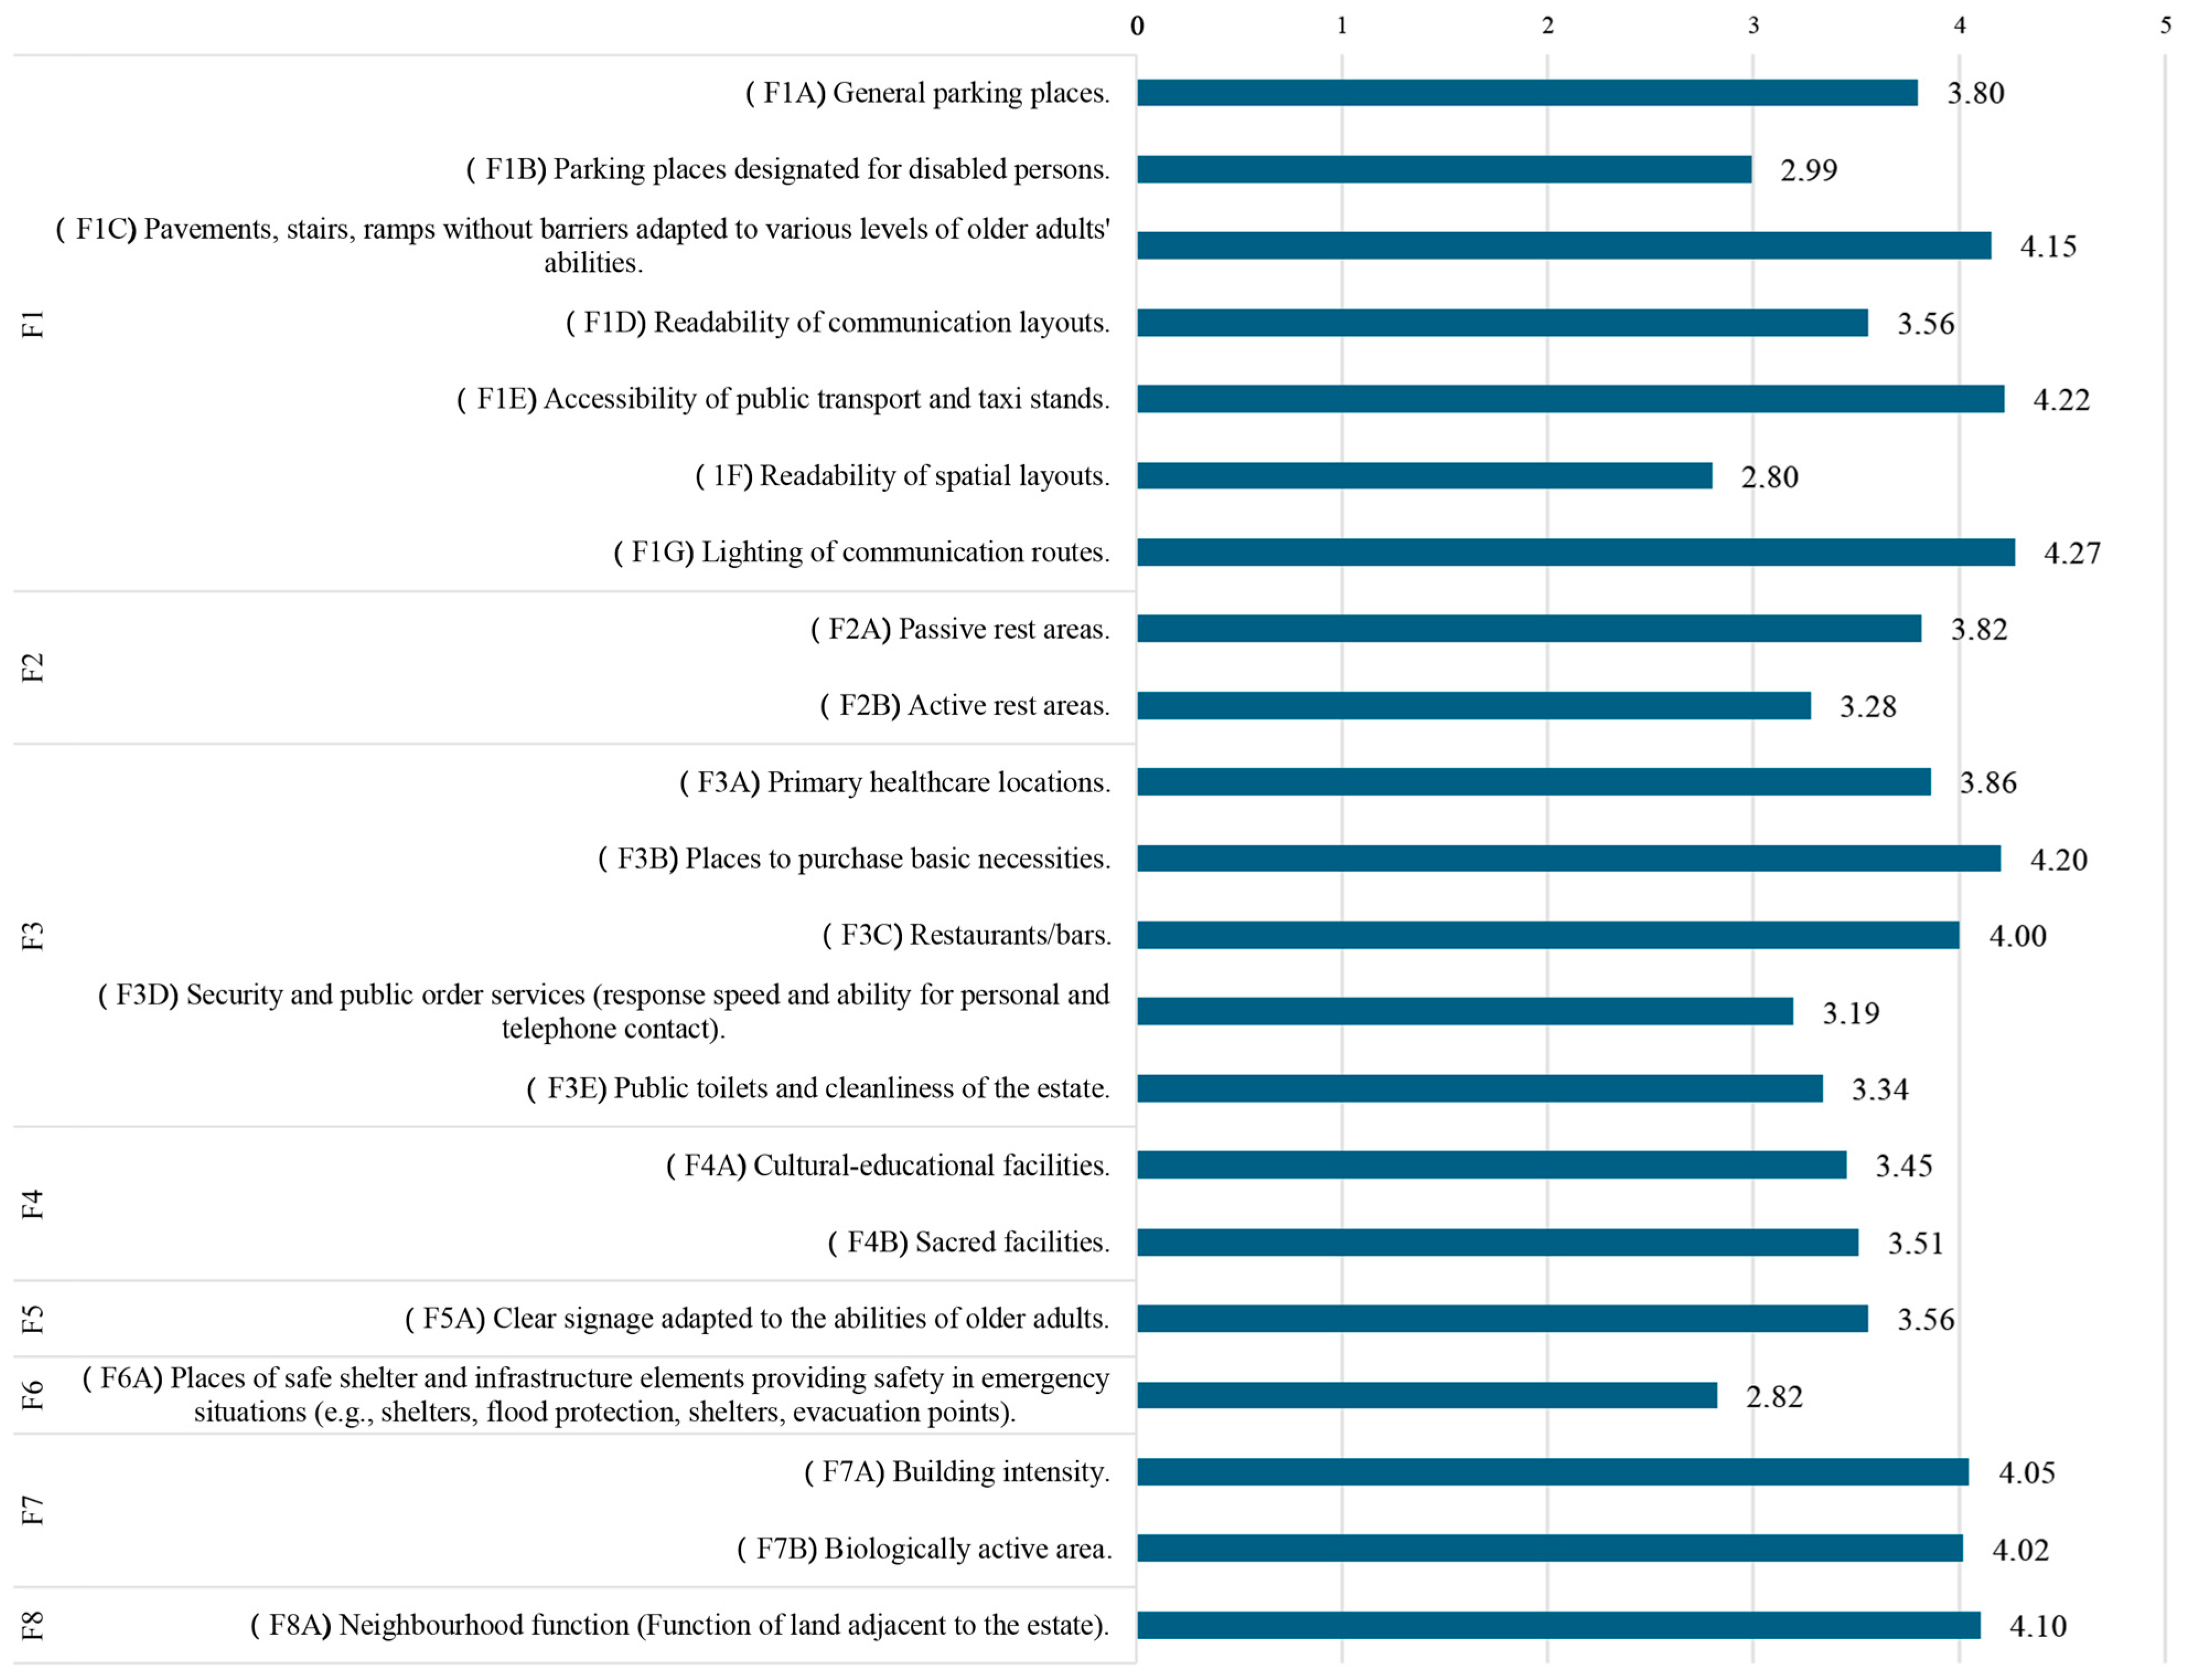
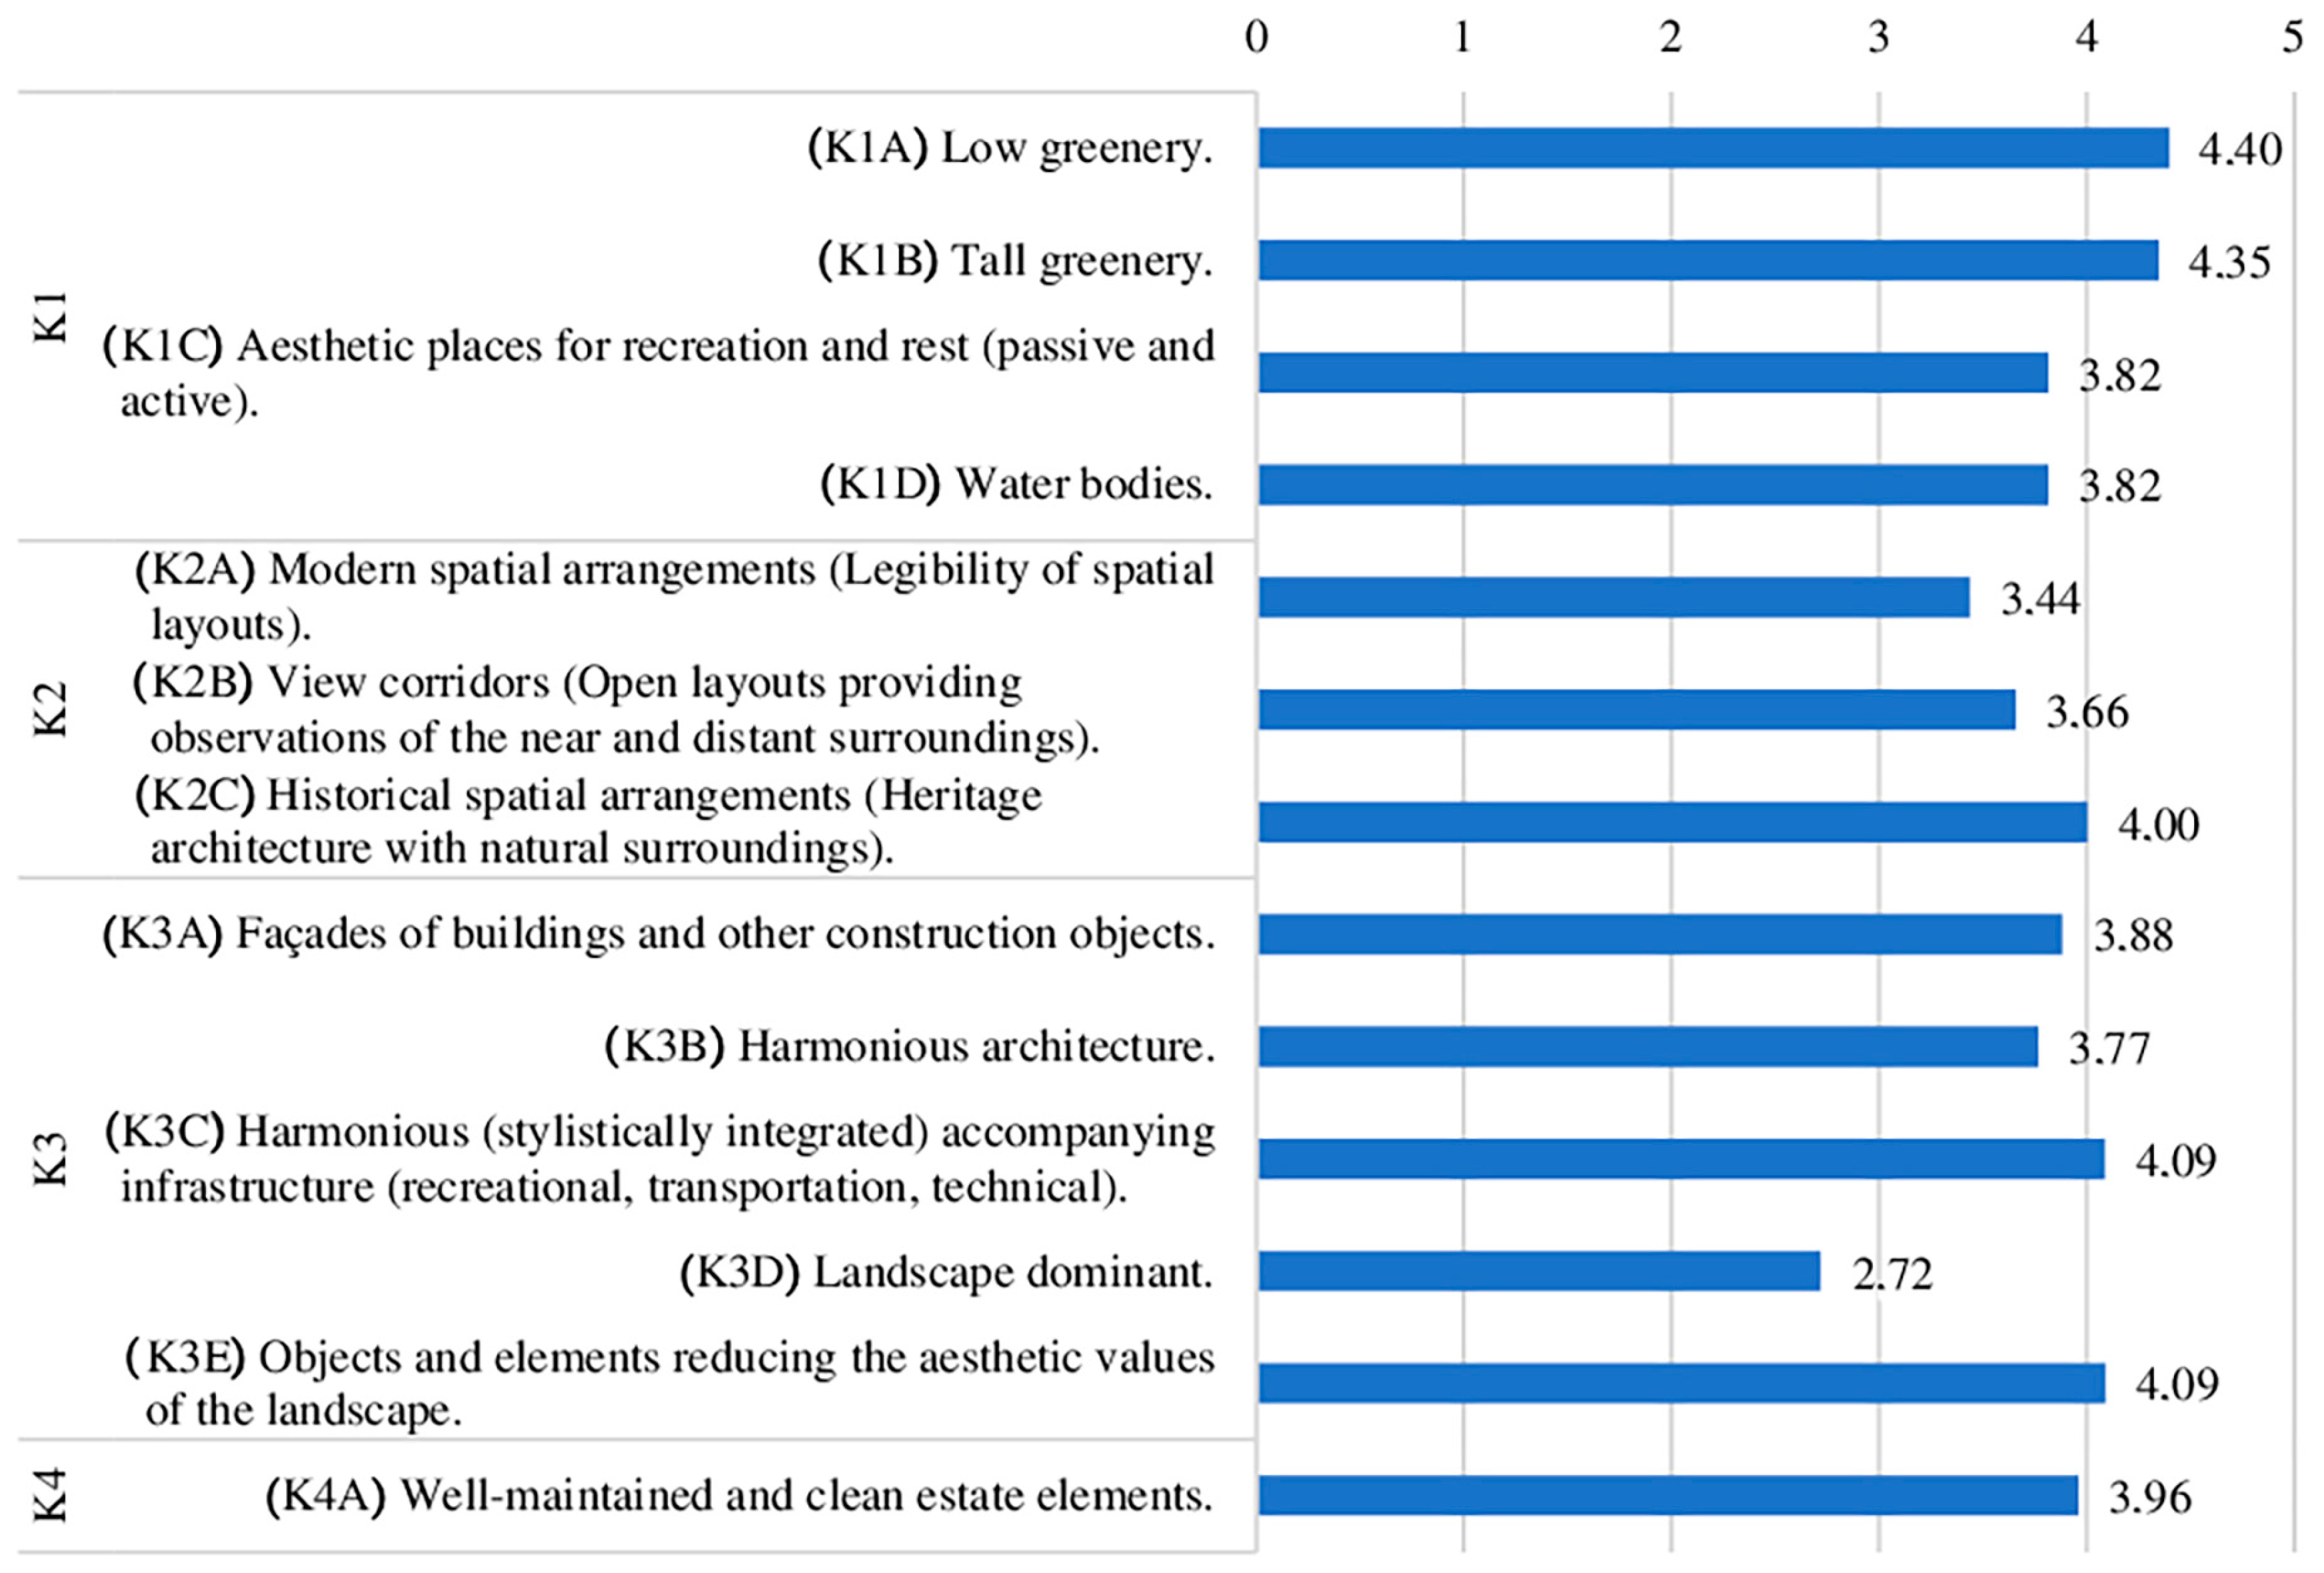
2.2.1. Assessment of AFRA Indicators from the Functional-Spatial and Landscape (Aesthetics) Categories
2.2.2. Data Acquisition, Selection for Analysis, and Cartographic and Field Inventory
2.2.3. Spatial Analyses
2.2.4. Assessment Procedure for the Age-Friendliness of Residential Estates
- (1)
- Identification of residential estates or parts of estates uniform in terms of buildings in the city. Let be the set of estates or their parts.
- (2)
- (3)
- Assessment of the friendliness of the estates:
- (a)
- Calculation of the weighted average of points for the functional-spatial group and the aesthetics group , adopting the estate areas as weights:where
- is the number of points for a given estate for the functional-spatial group;
- is the number of points for a given estate for the aesthetics category;
- is the area of the estate;
- is the number of estates.
- (b)
- Comparison with the standard in each category. Then, comparing the weighted average with the maximum indicator value in each category, thereby obtaining an assessment of the age-friendliness of the entire city in terms of the given group of functional-spatial factors or aesthetics factors :where
- is the maximum number of points for the functional-spatial group;
- is the maximum number of points for the aesthetics group.
- (c)
- (d)
- Comparing the obtained result for each estate (or its part) with the maximum possible score in each group (functional-spatial and aesthetics separately):where
- is the maximum number of points for the functional-spatial group;
- is t the maximum number of points for the aesthetics group.
- (e)
- Determining the overall age-friendliness of a residential estate as the arithmetic mean of friendliness in terms of functionality and aesthetics:
- (4)
- Determining the age-friendliness of the city (separate and overall) as the weighted average of the friendliness of individual estates, with the areas of the respective spatial units as weights:
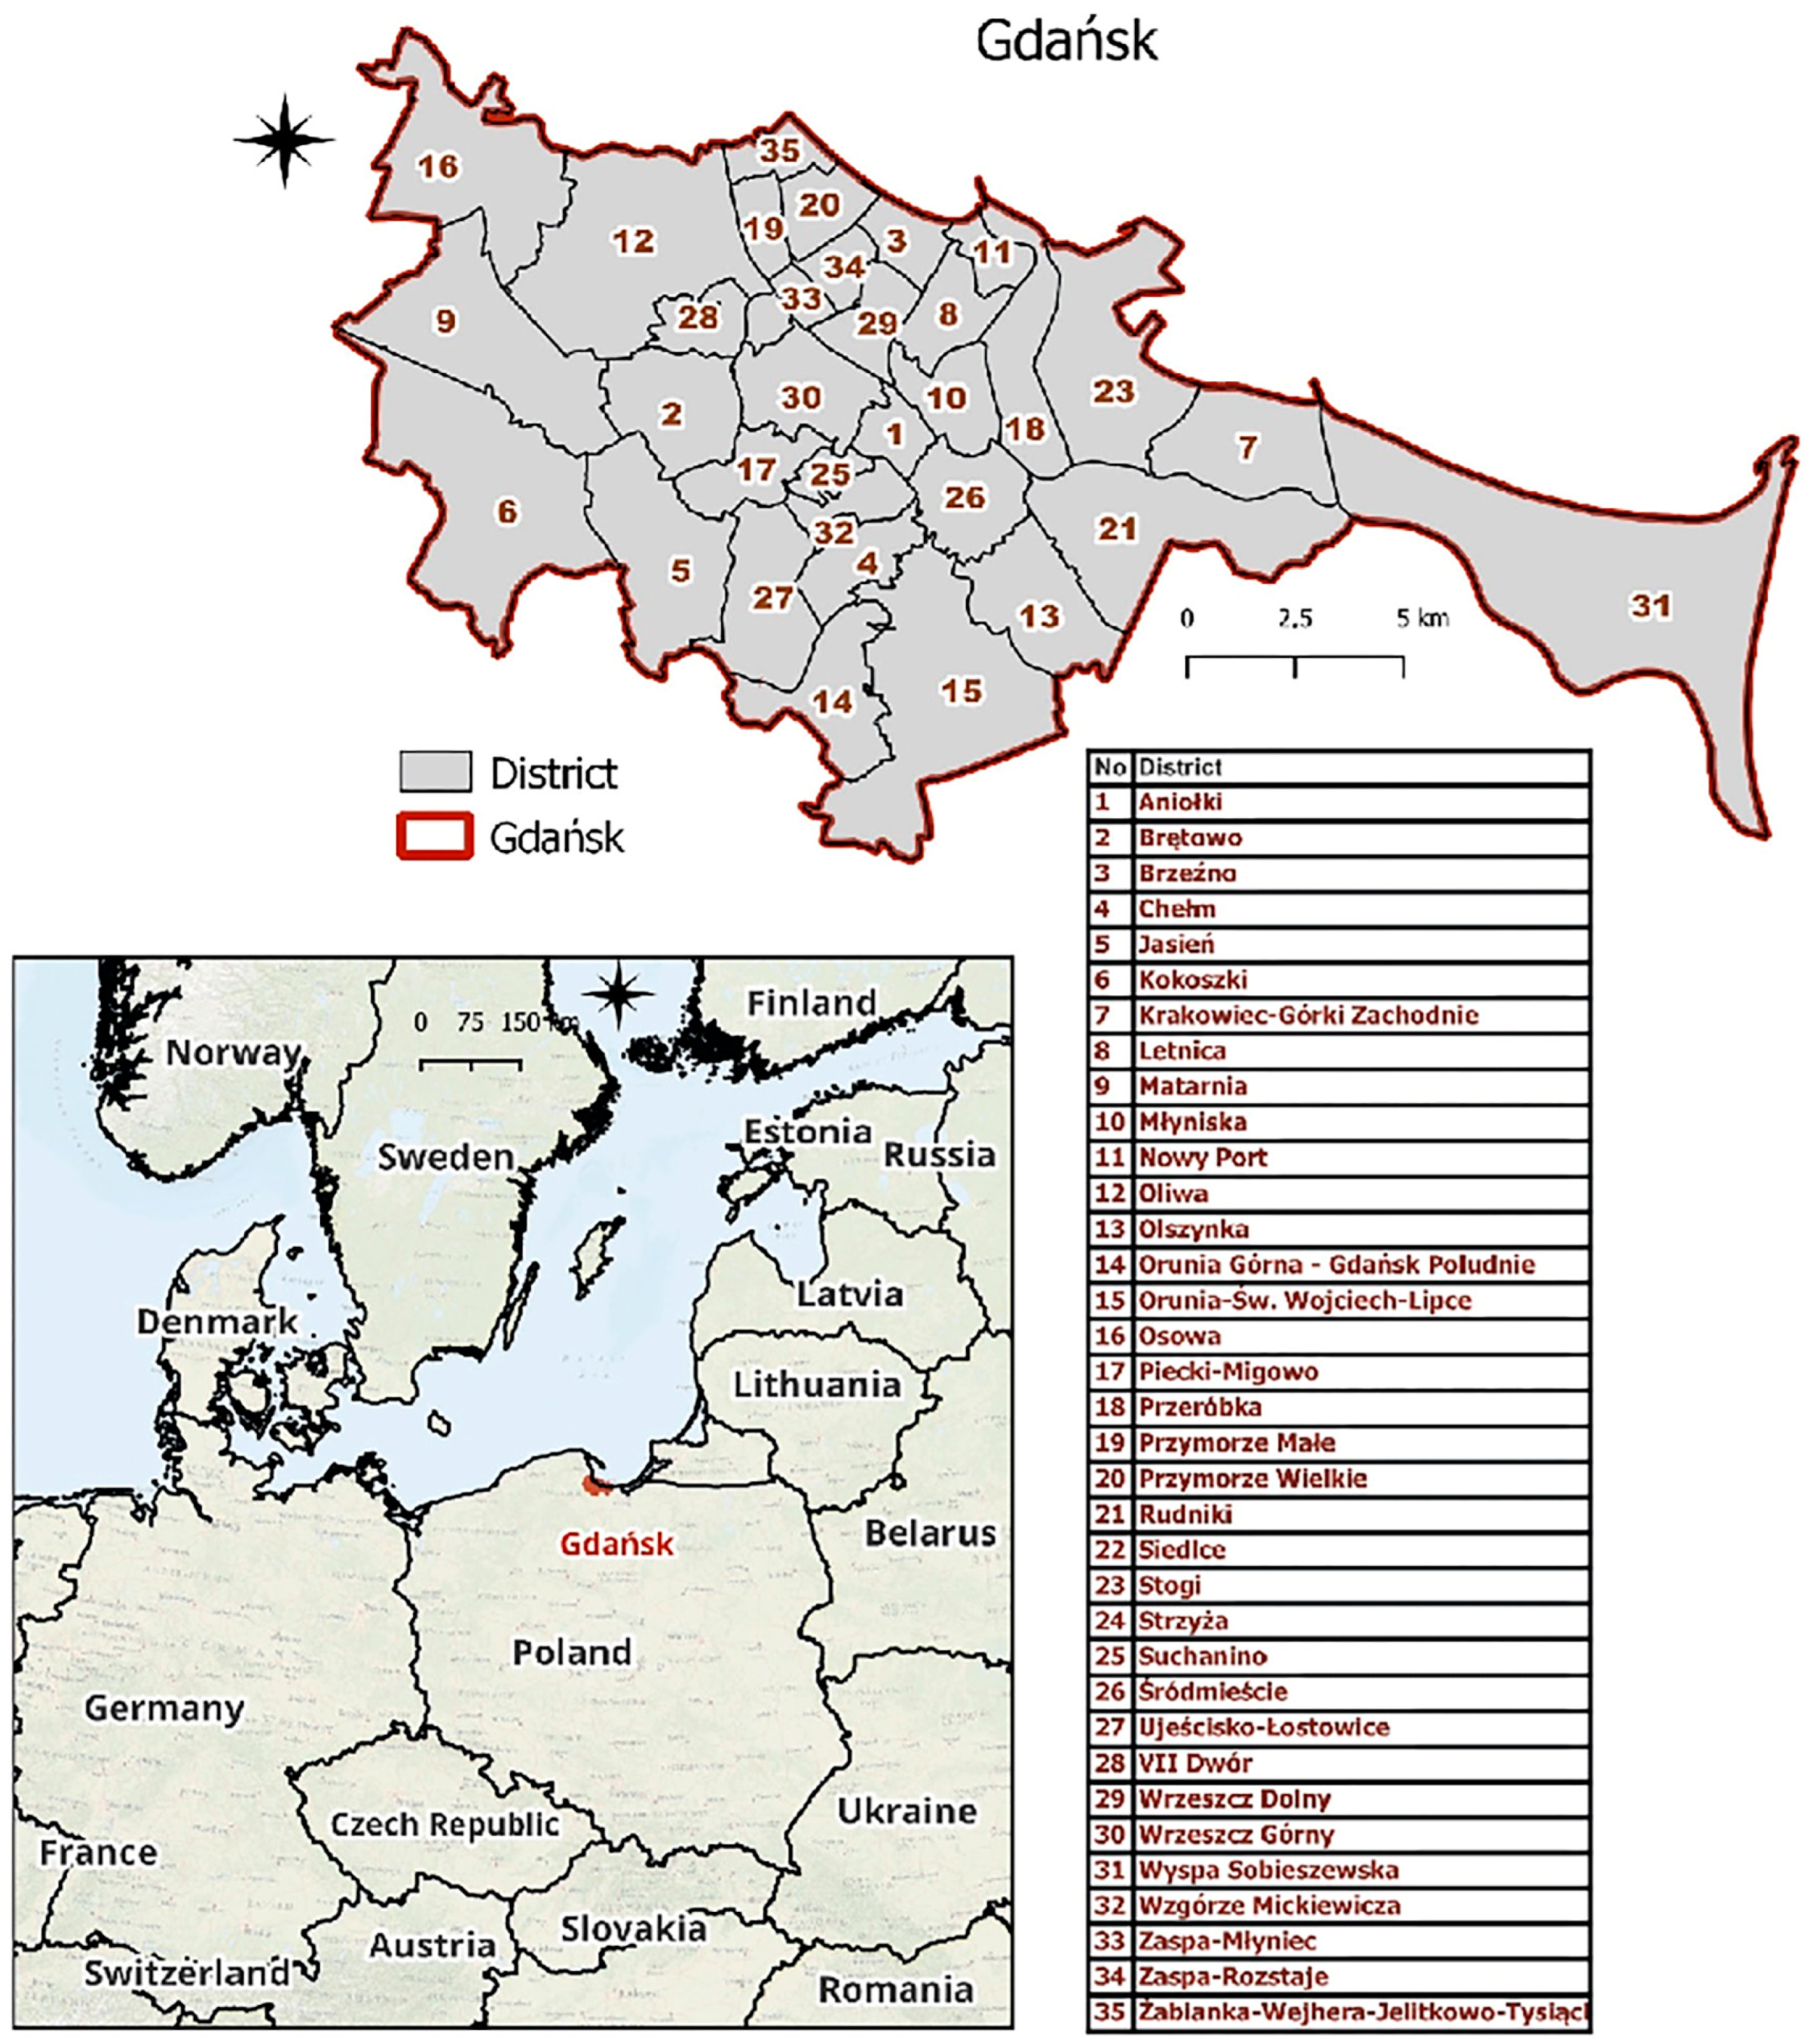
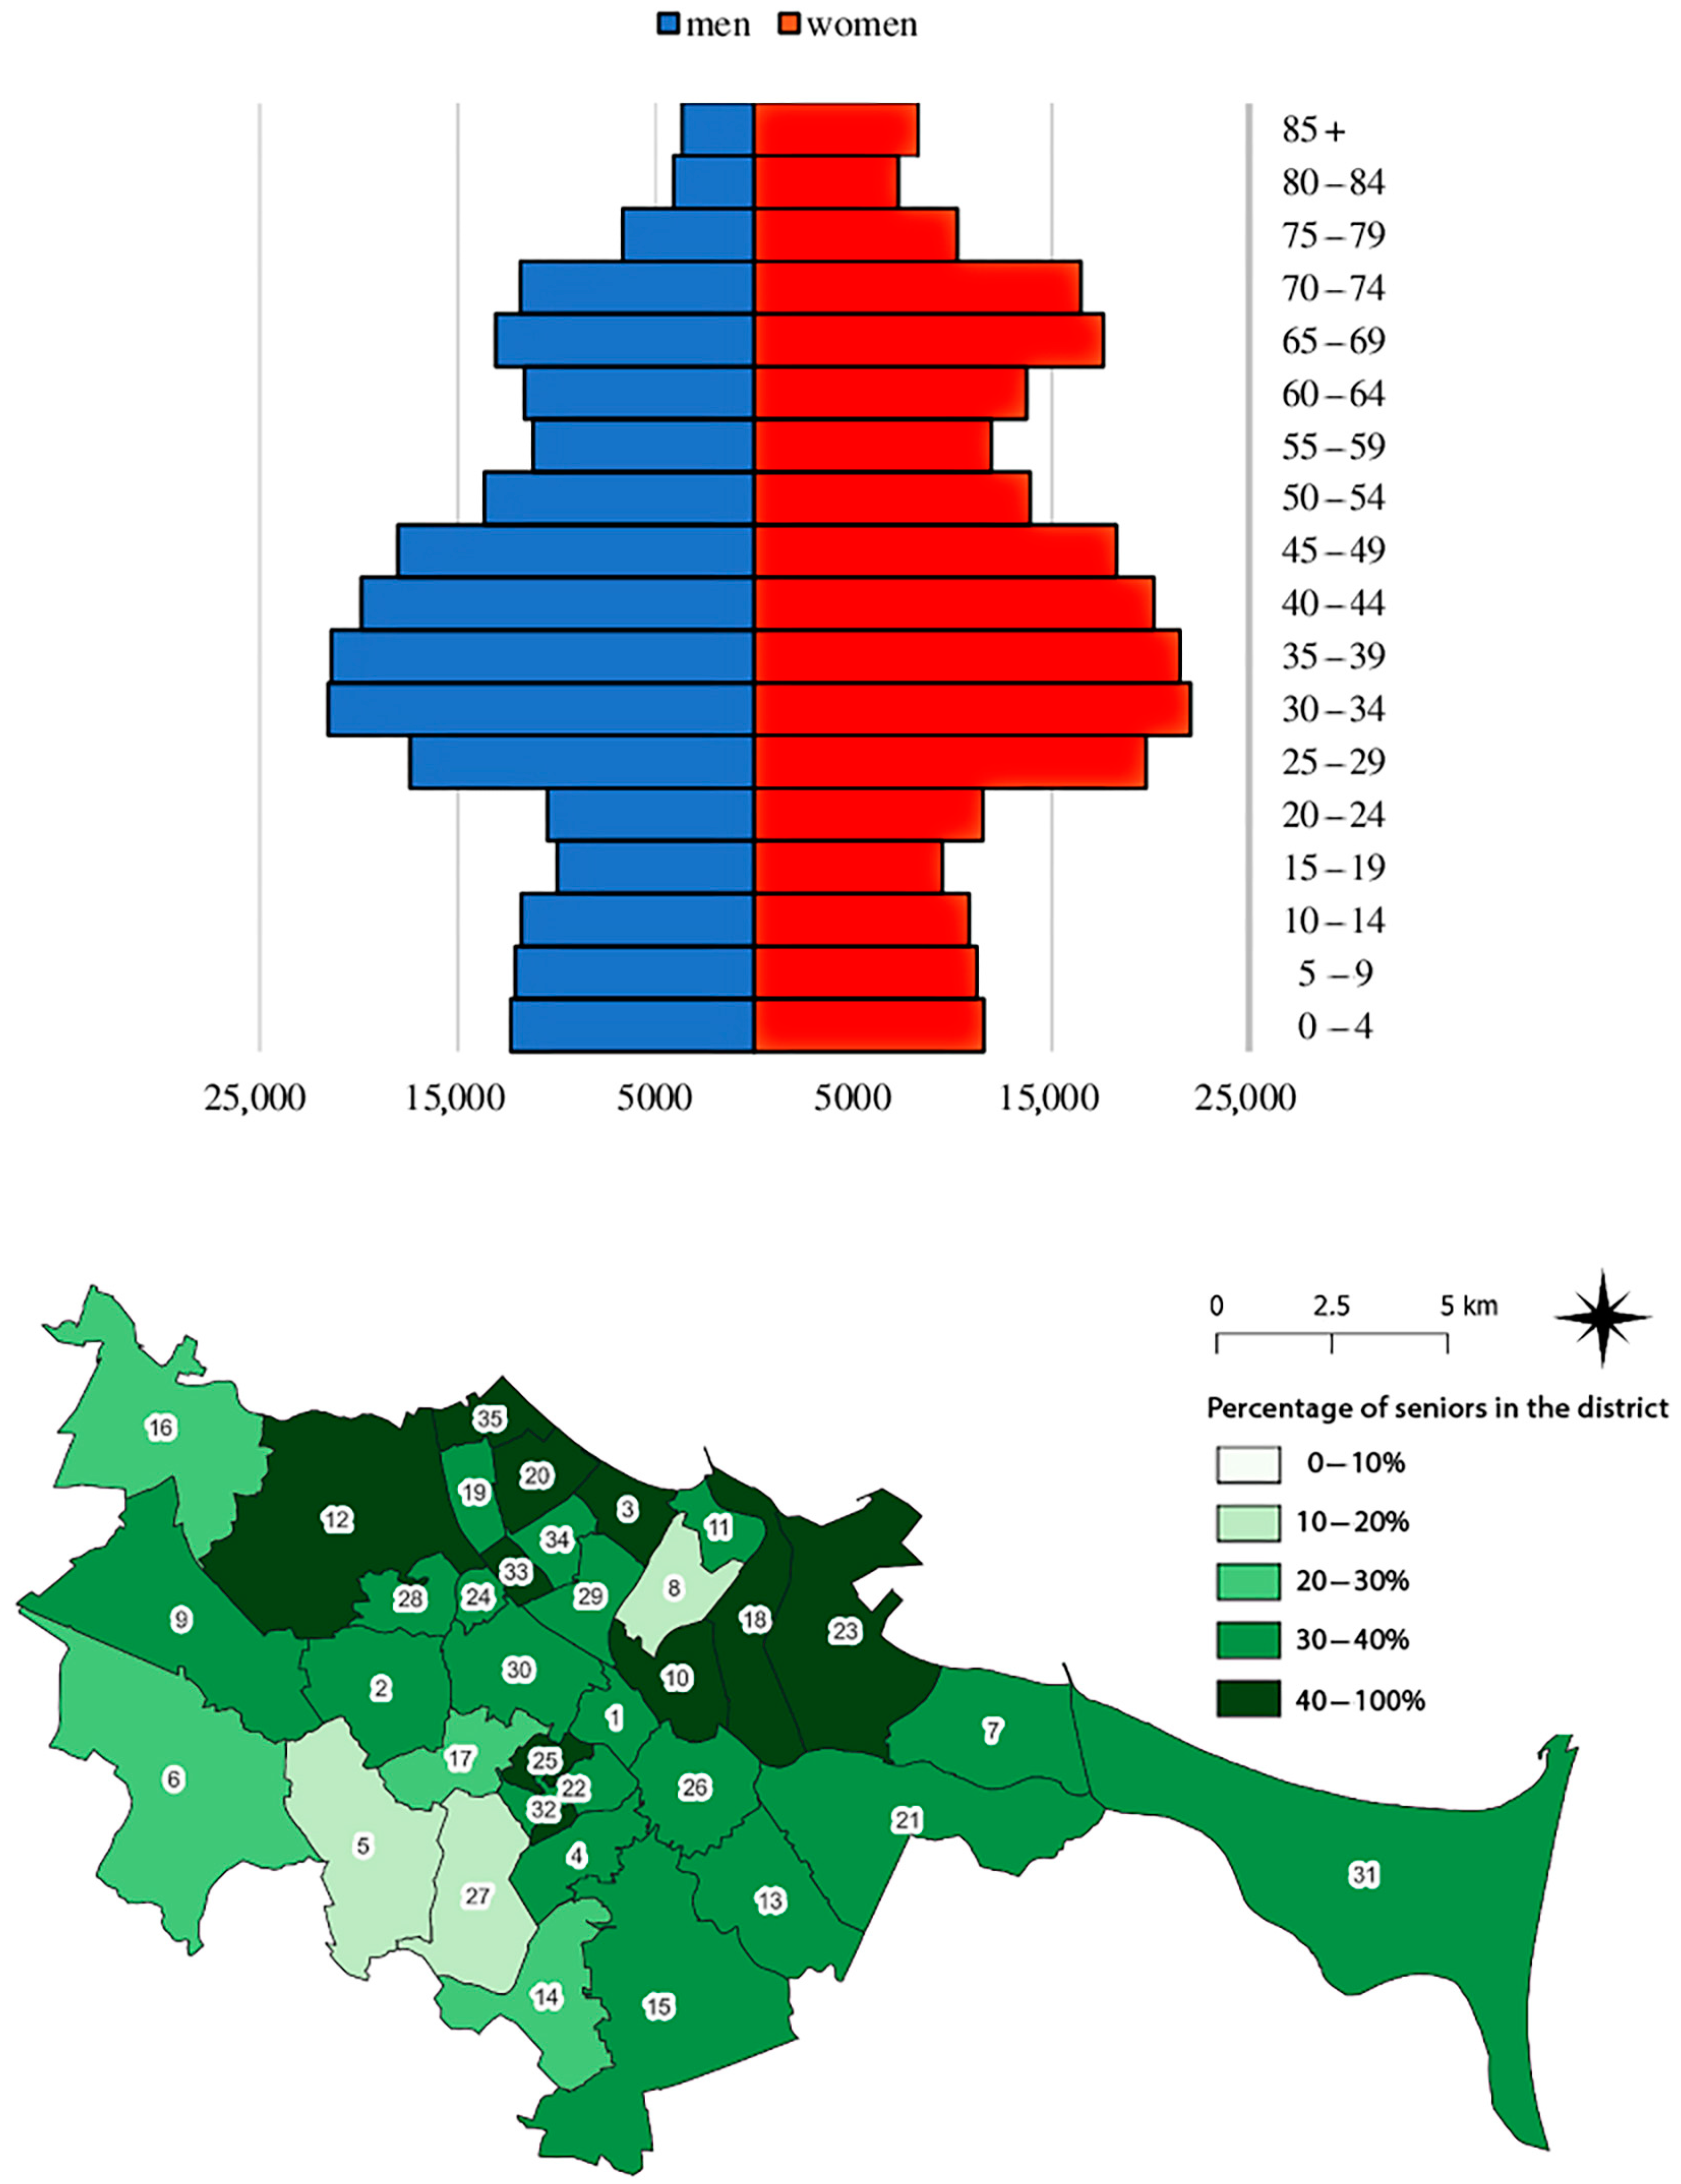
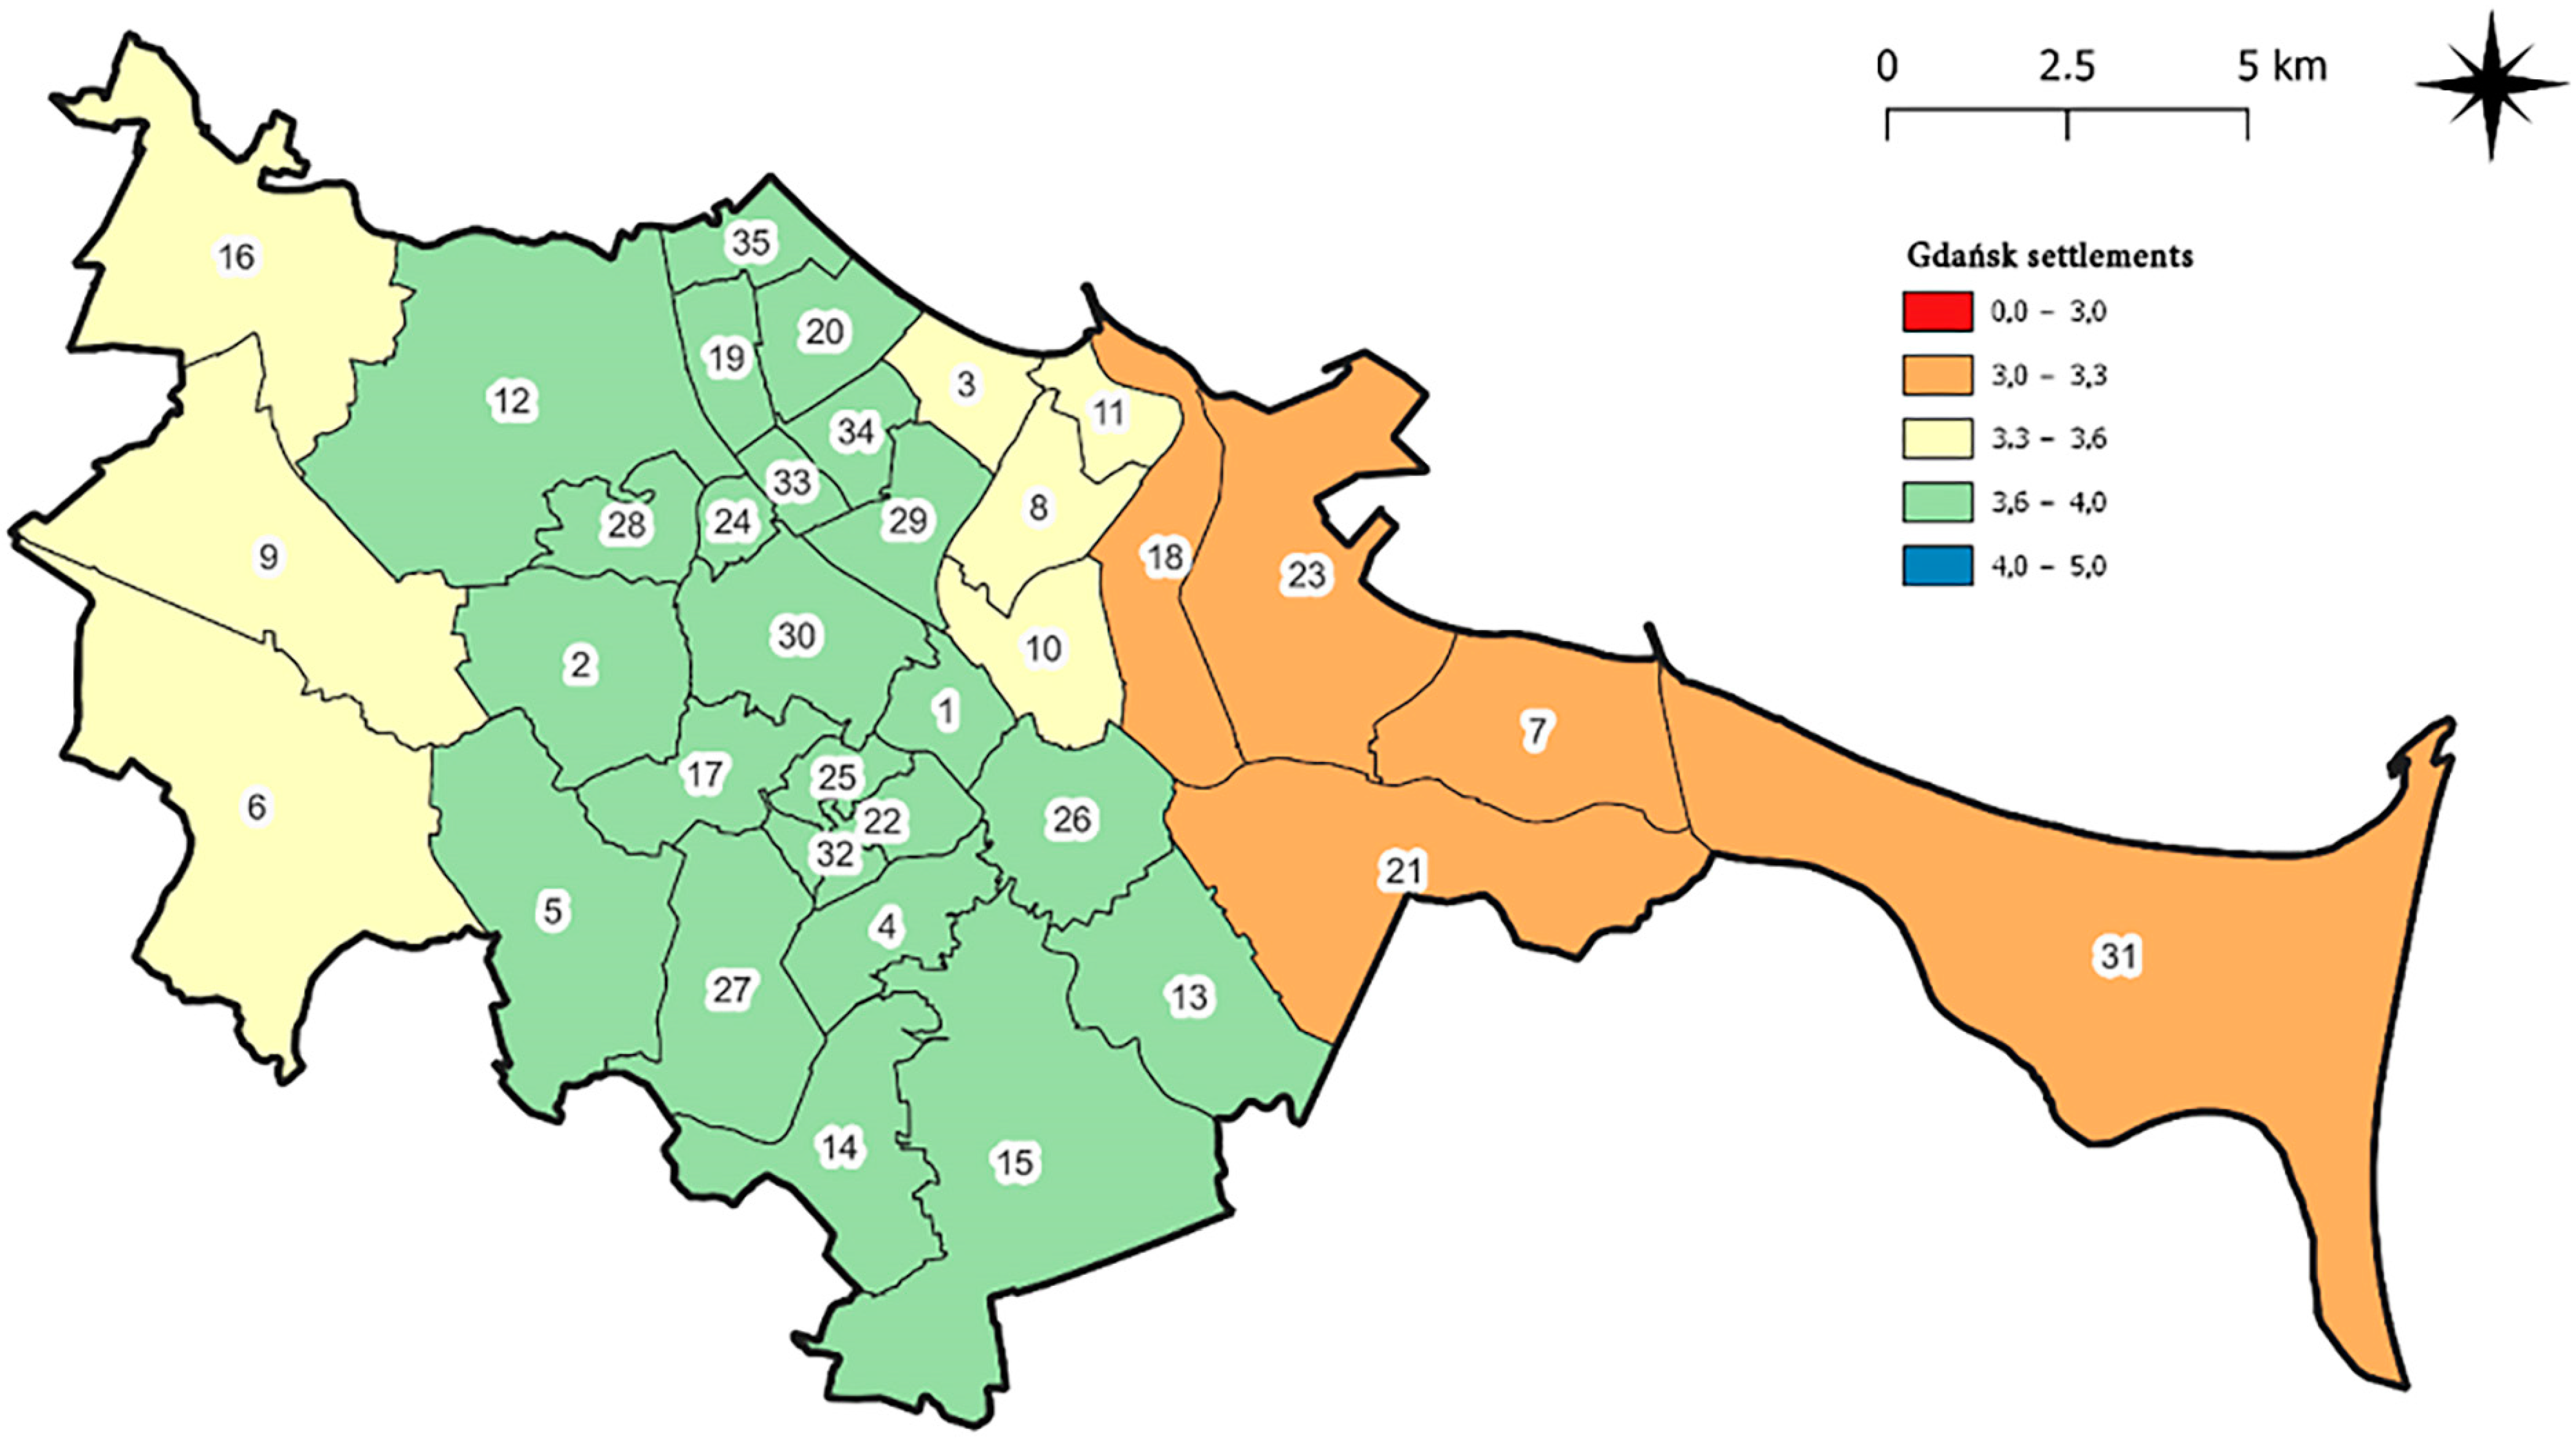
2.3. Study Area
3. Results
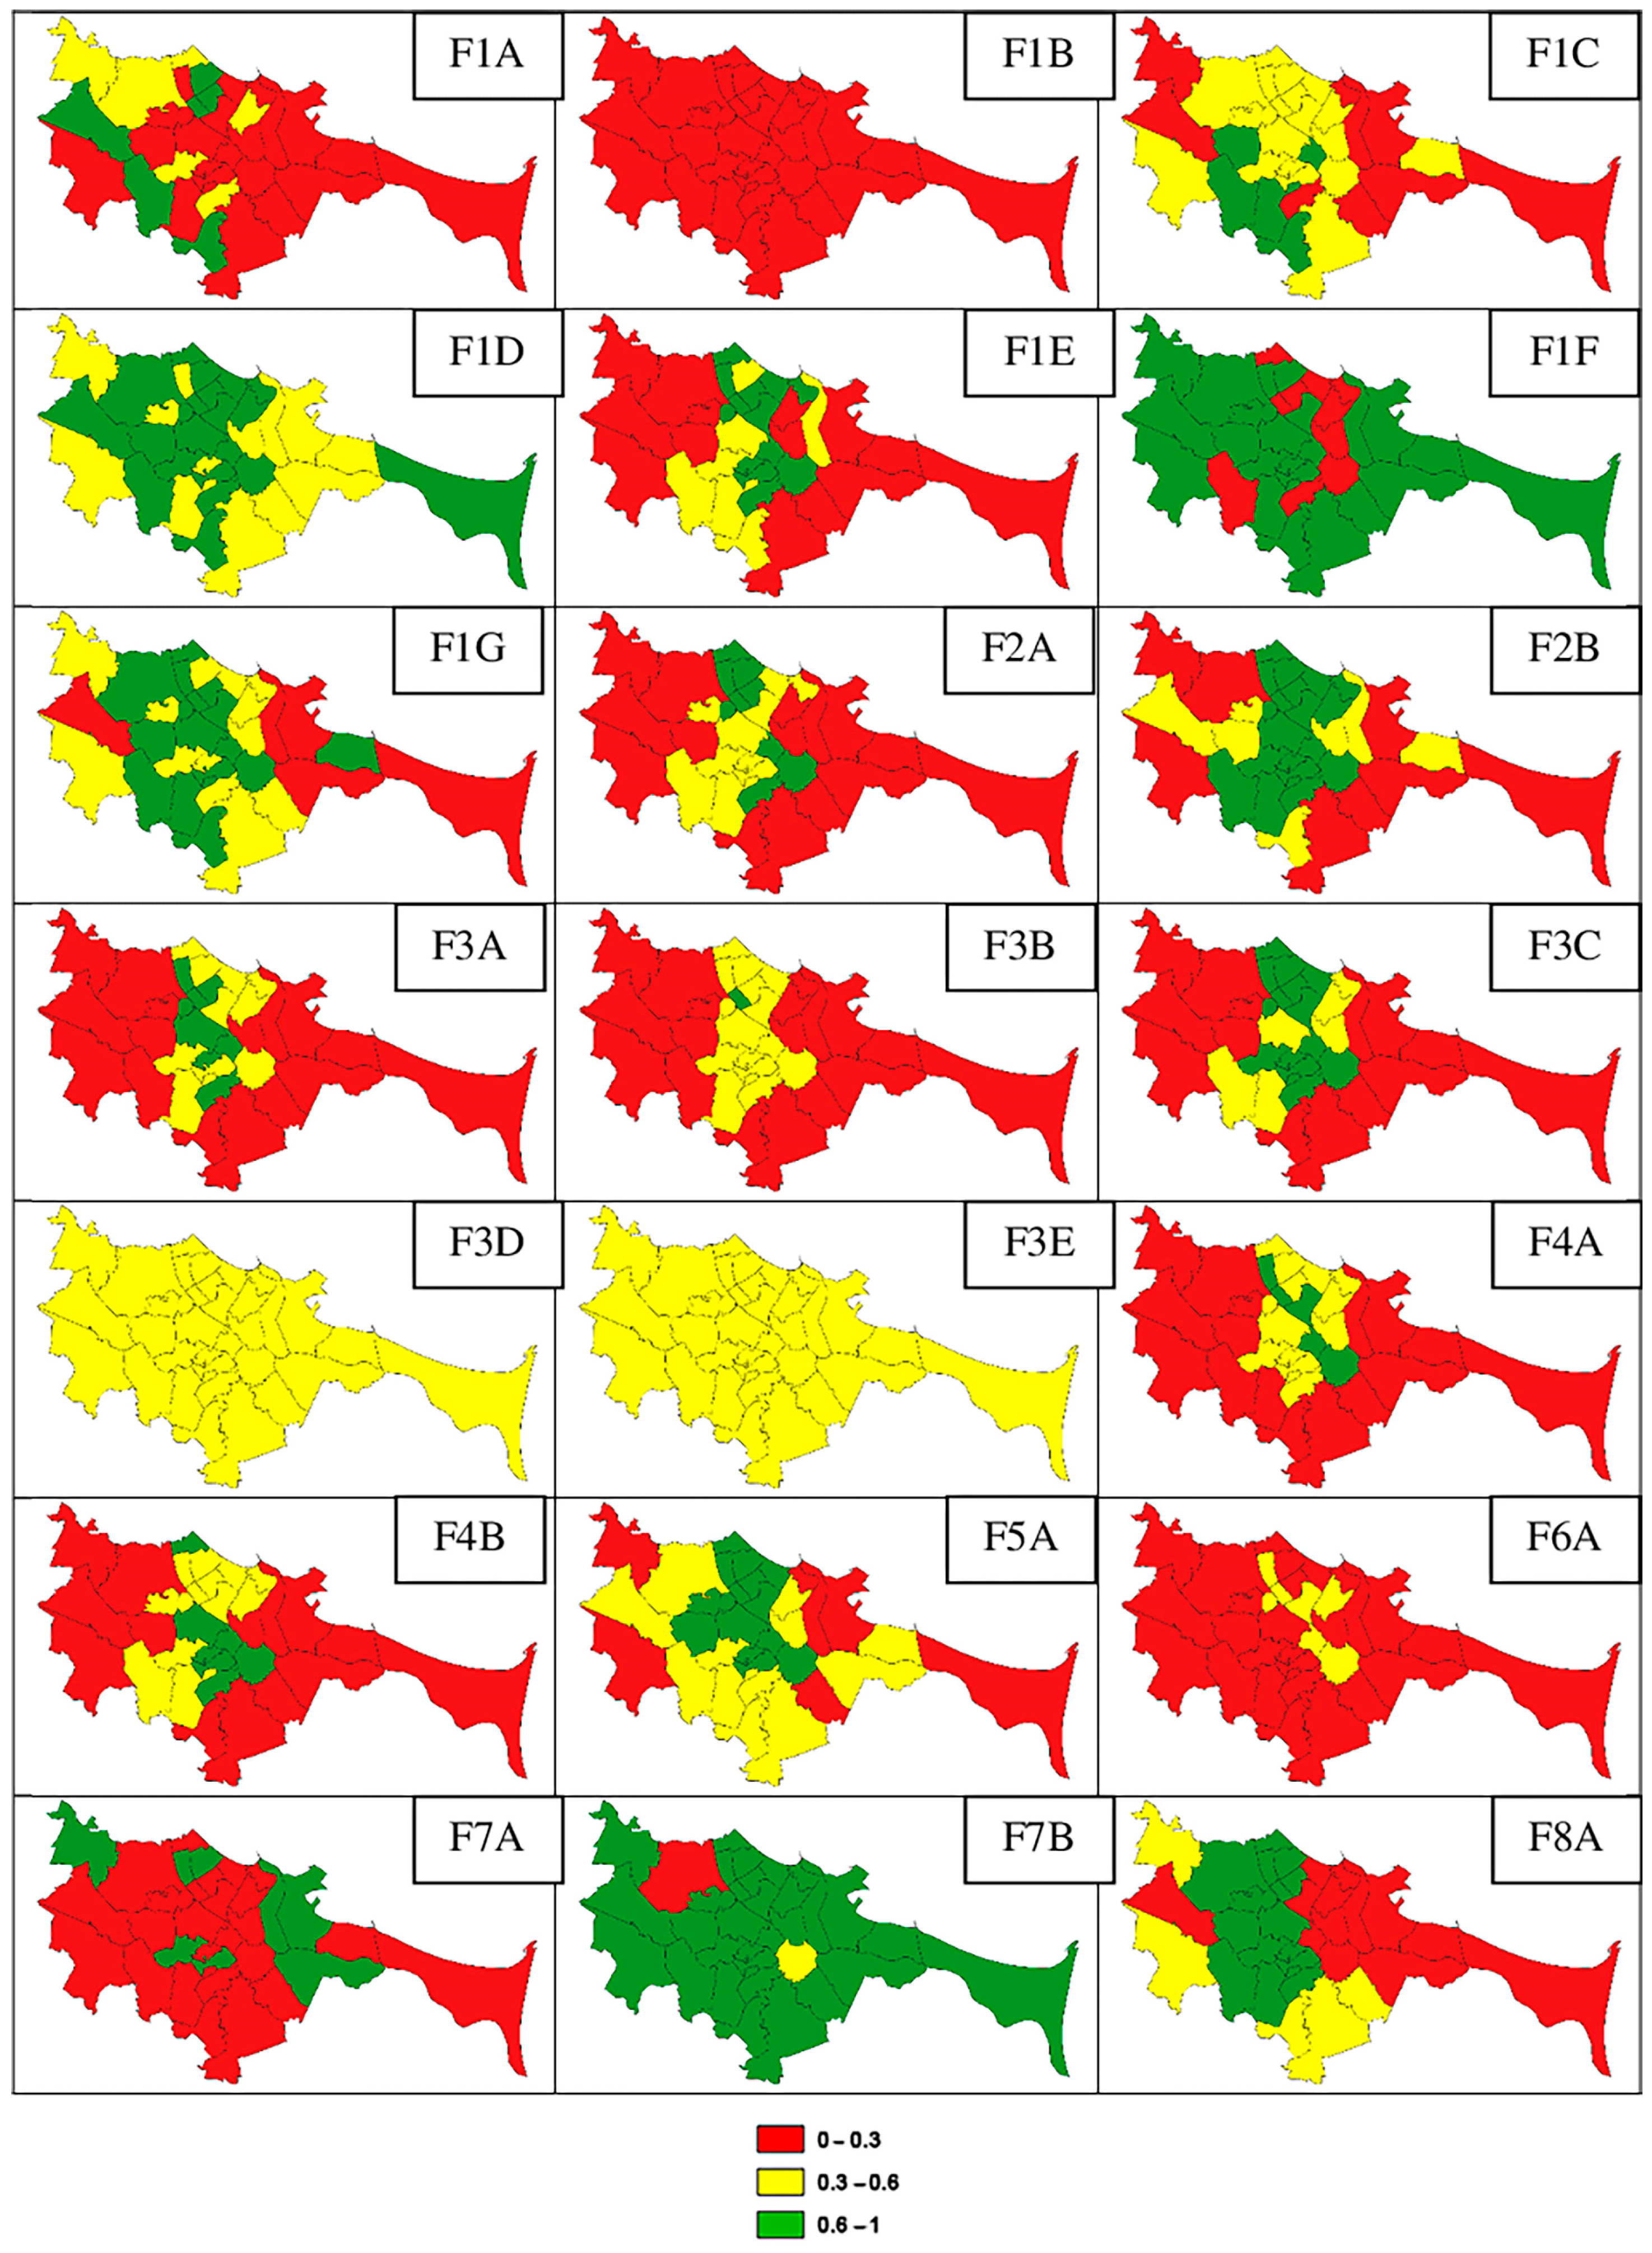
3.1. Assessment of AFRA Functional-Spatial Layouts
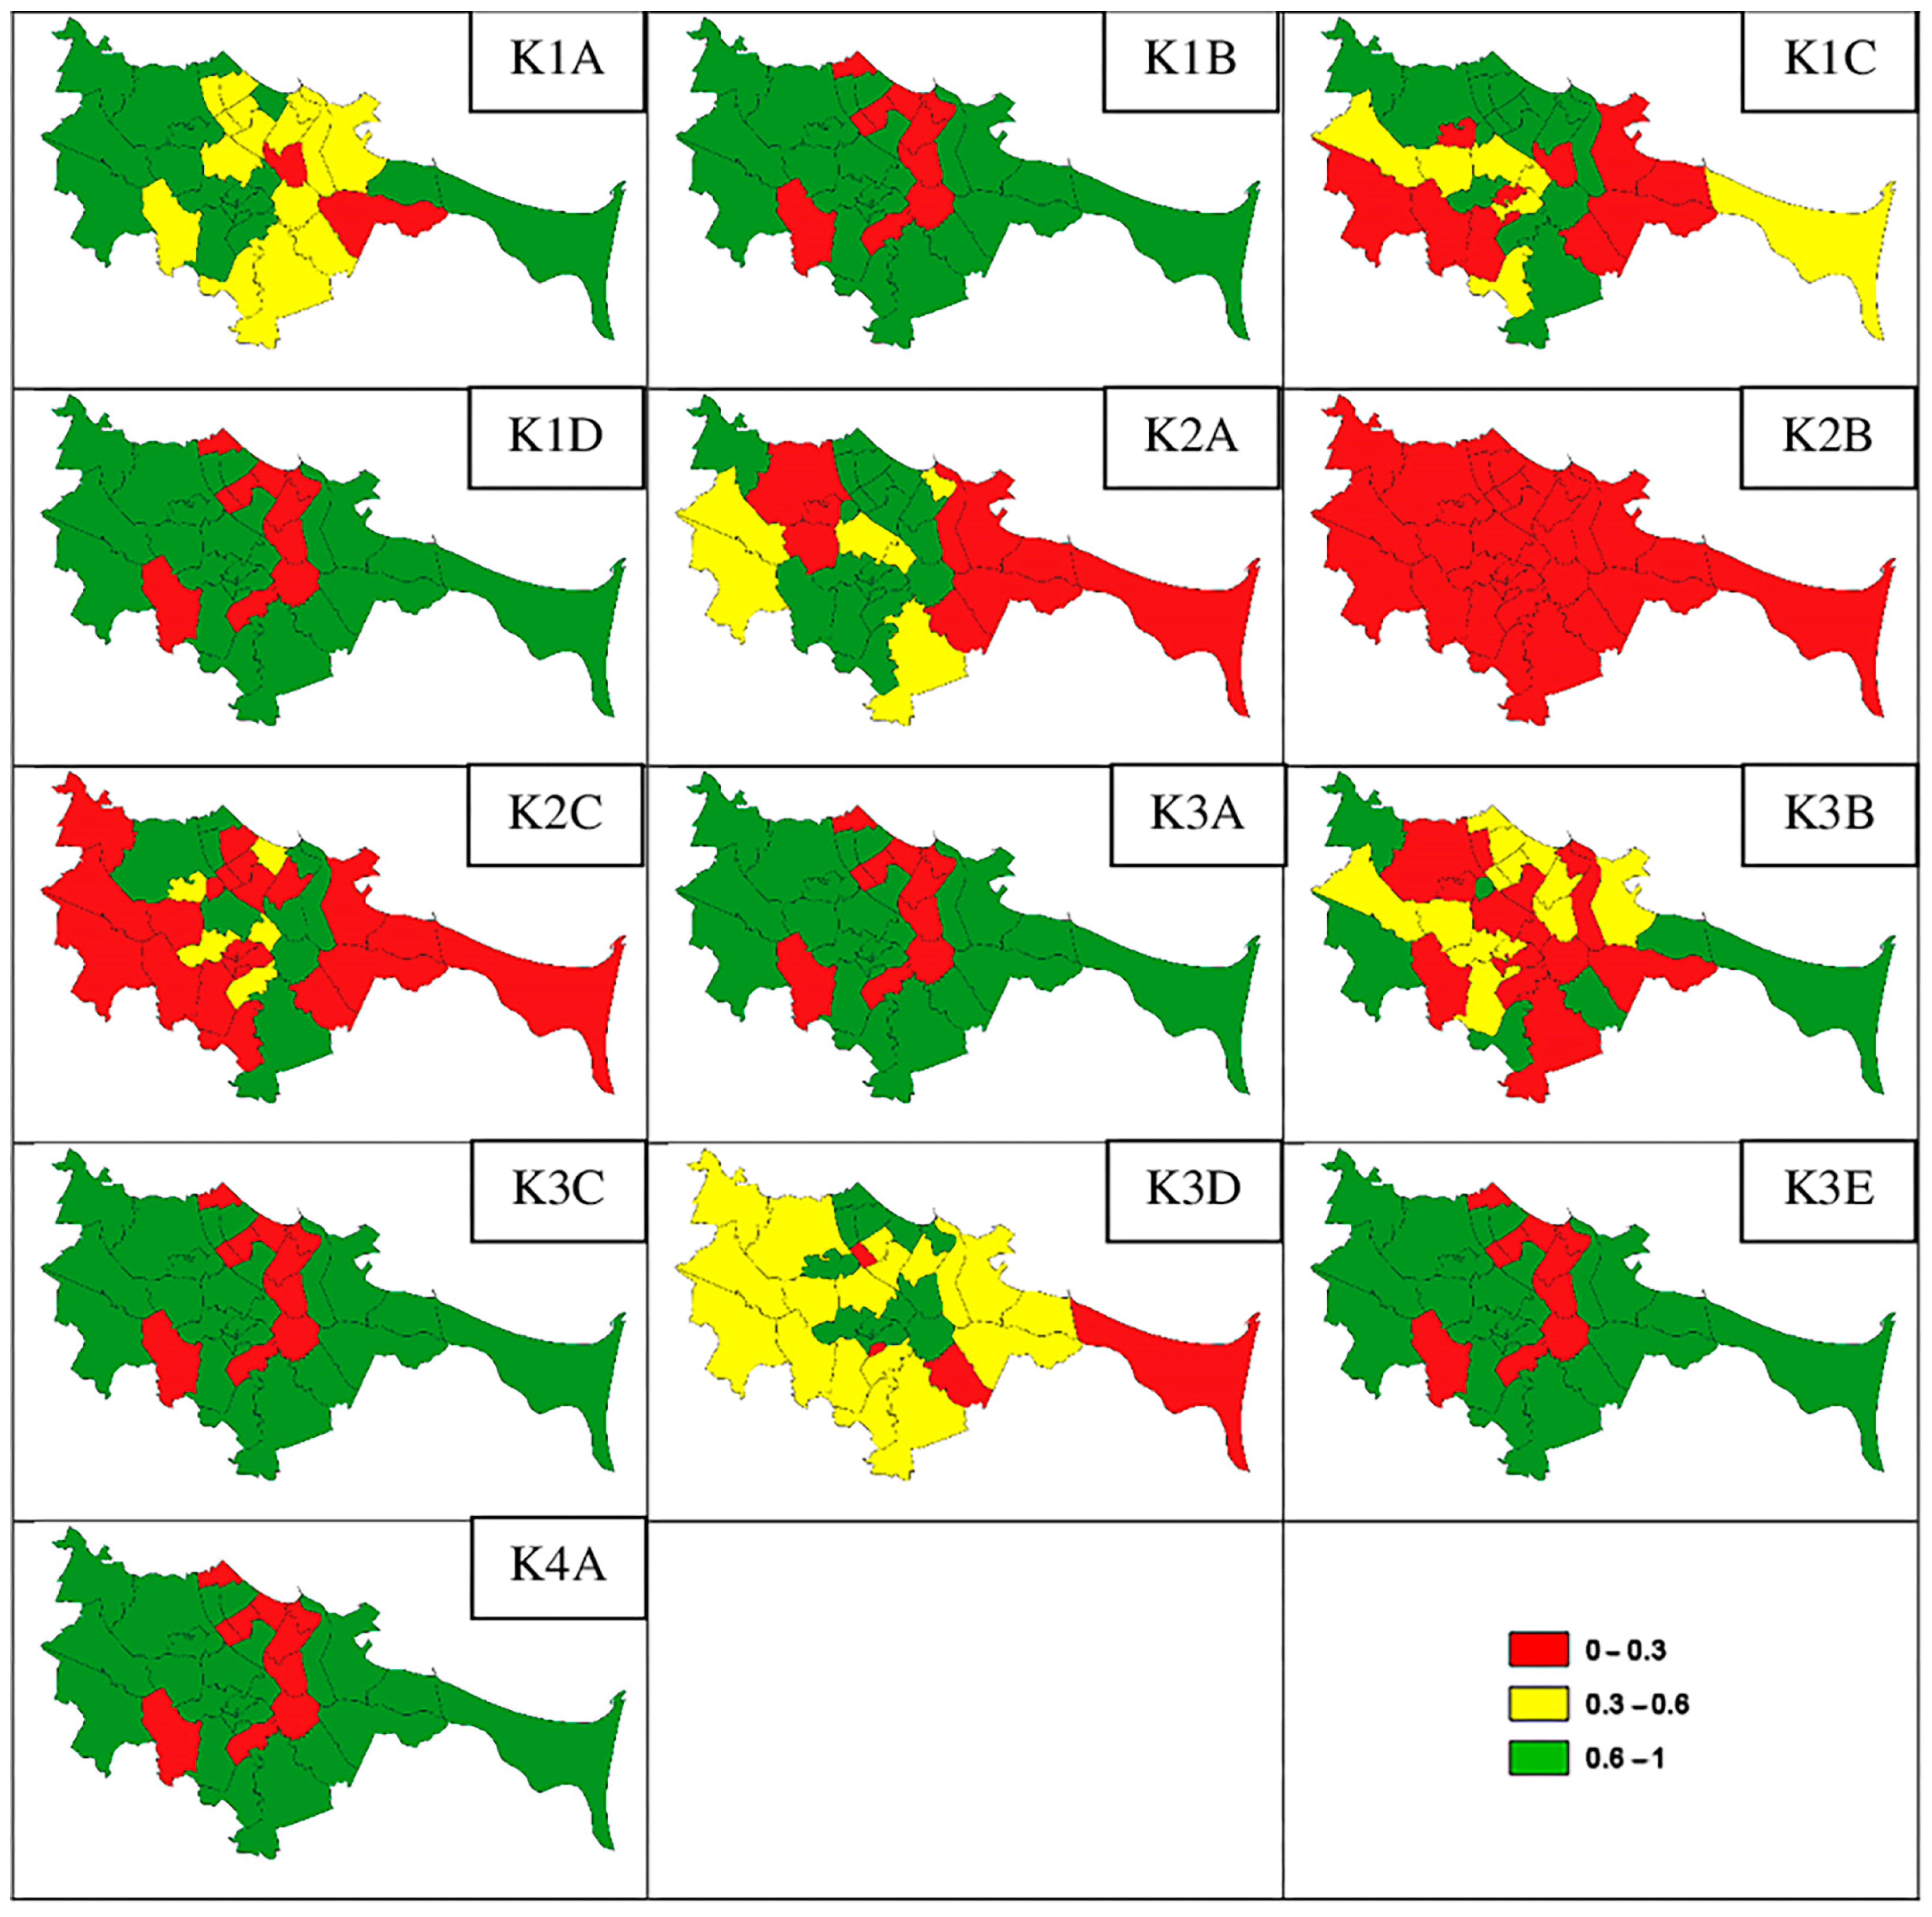
3.2. AFRA Landscape Assessment
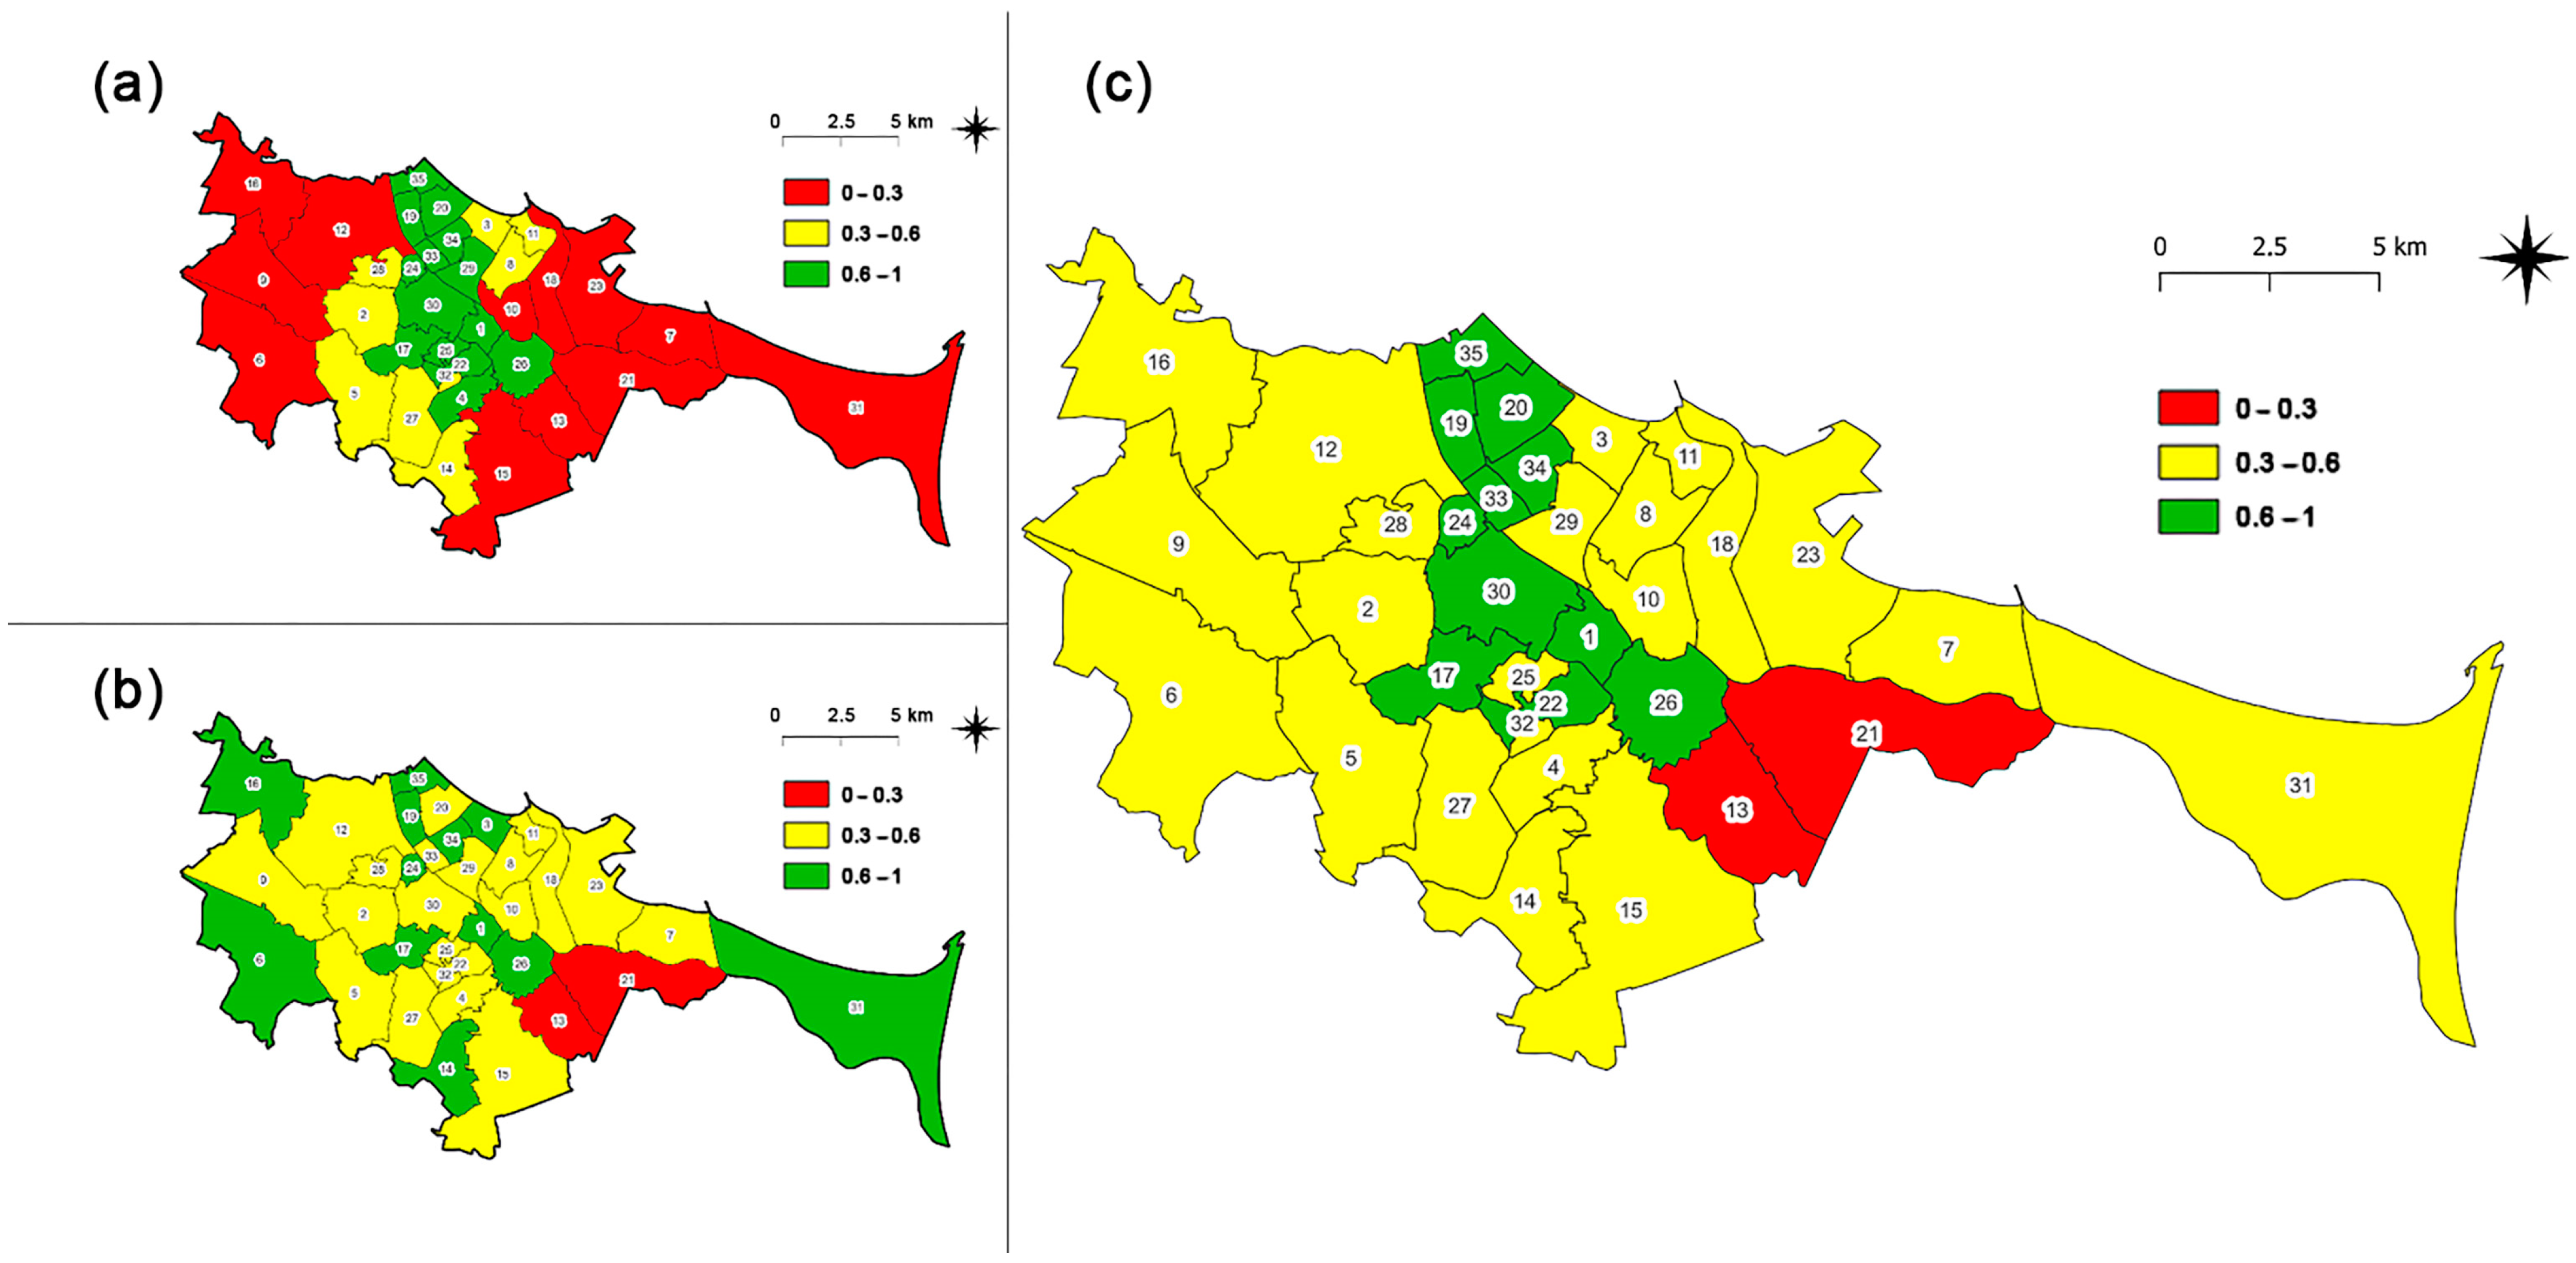
3.3. Assessment of Estate Age-Friendliness
- (a)
- (b)
- Joint parametric AFRA assessment.
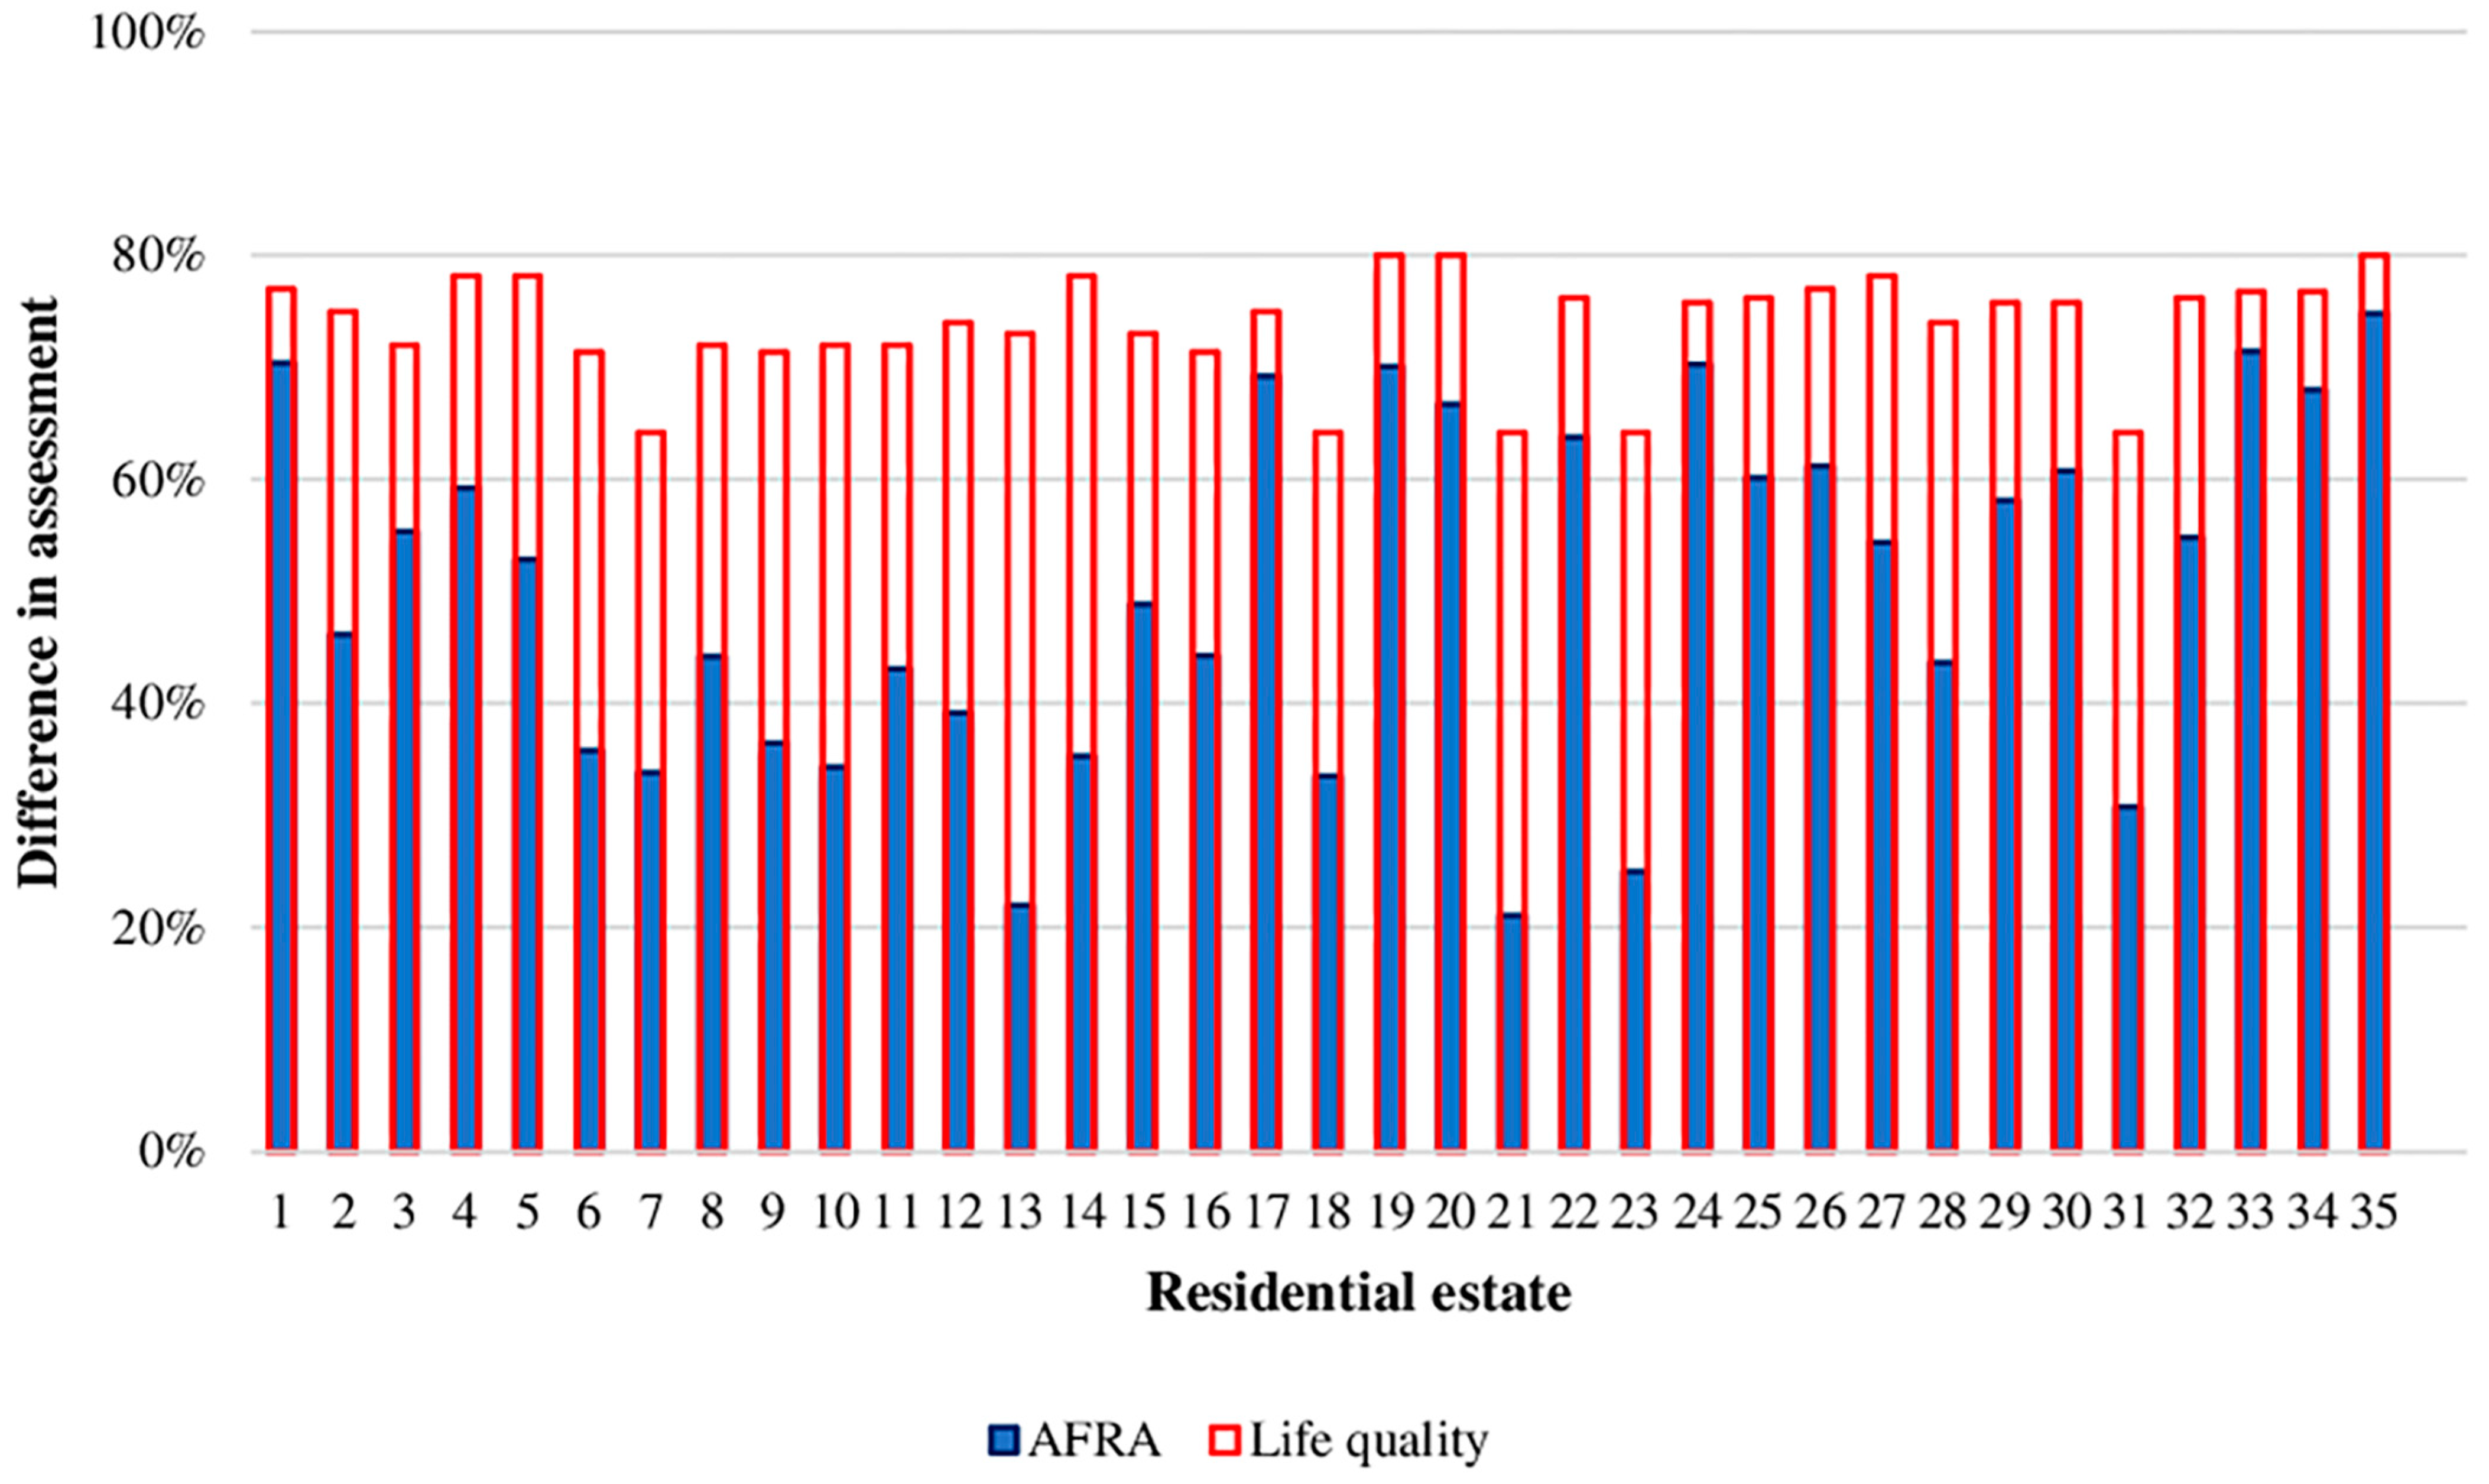
3.4. Validation
4. Discussion and Conclusions
Author Contributions
Funding
Institutional Review Board Statement
Informed Consent Statement
Data Availability Statement
Acknowledgments
Conflicts of Interest
Appendix A

| Category of Factors | Factors | Elements | Indicator | ||||
|---|---|---|---|---|---|---|---|
| 0–2 Scale | 0—Unfavourable | 1—Average | 2—Favourable | ||||
| 0–1 Scale | 0—Unfavourable | - | 1—Favourable | ||||
| (F1) Transportation-communication function | (F1A) General parking places | 1. Availability of parking spaces | <1 parking space per dwelling in the estate | 1–1.5 parking spaces per dwelling in the estate | >1.5 parking spaces per dwelling in the estate | ||
| 2. Proportion of parking area to the total building area | |||||||
| (F1B) Parking places designated for disabled persons | 1. Availability of parking spaces for disabled persons | <4% of the total parking space area designated for disabled people | 4–5% of the total parking space area designated for disabled people | >5% of the total parking space area designated for disabled people | |||
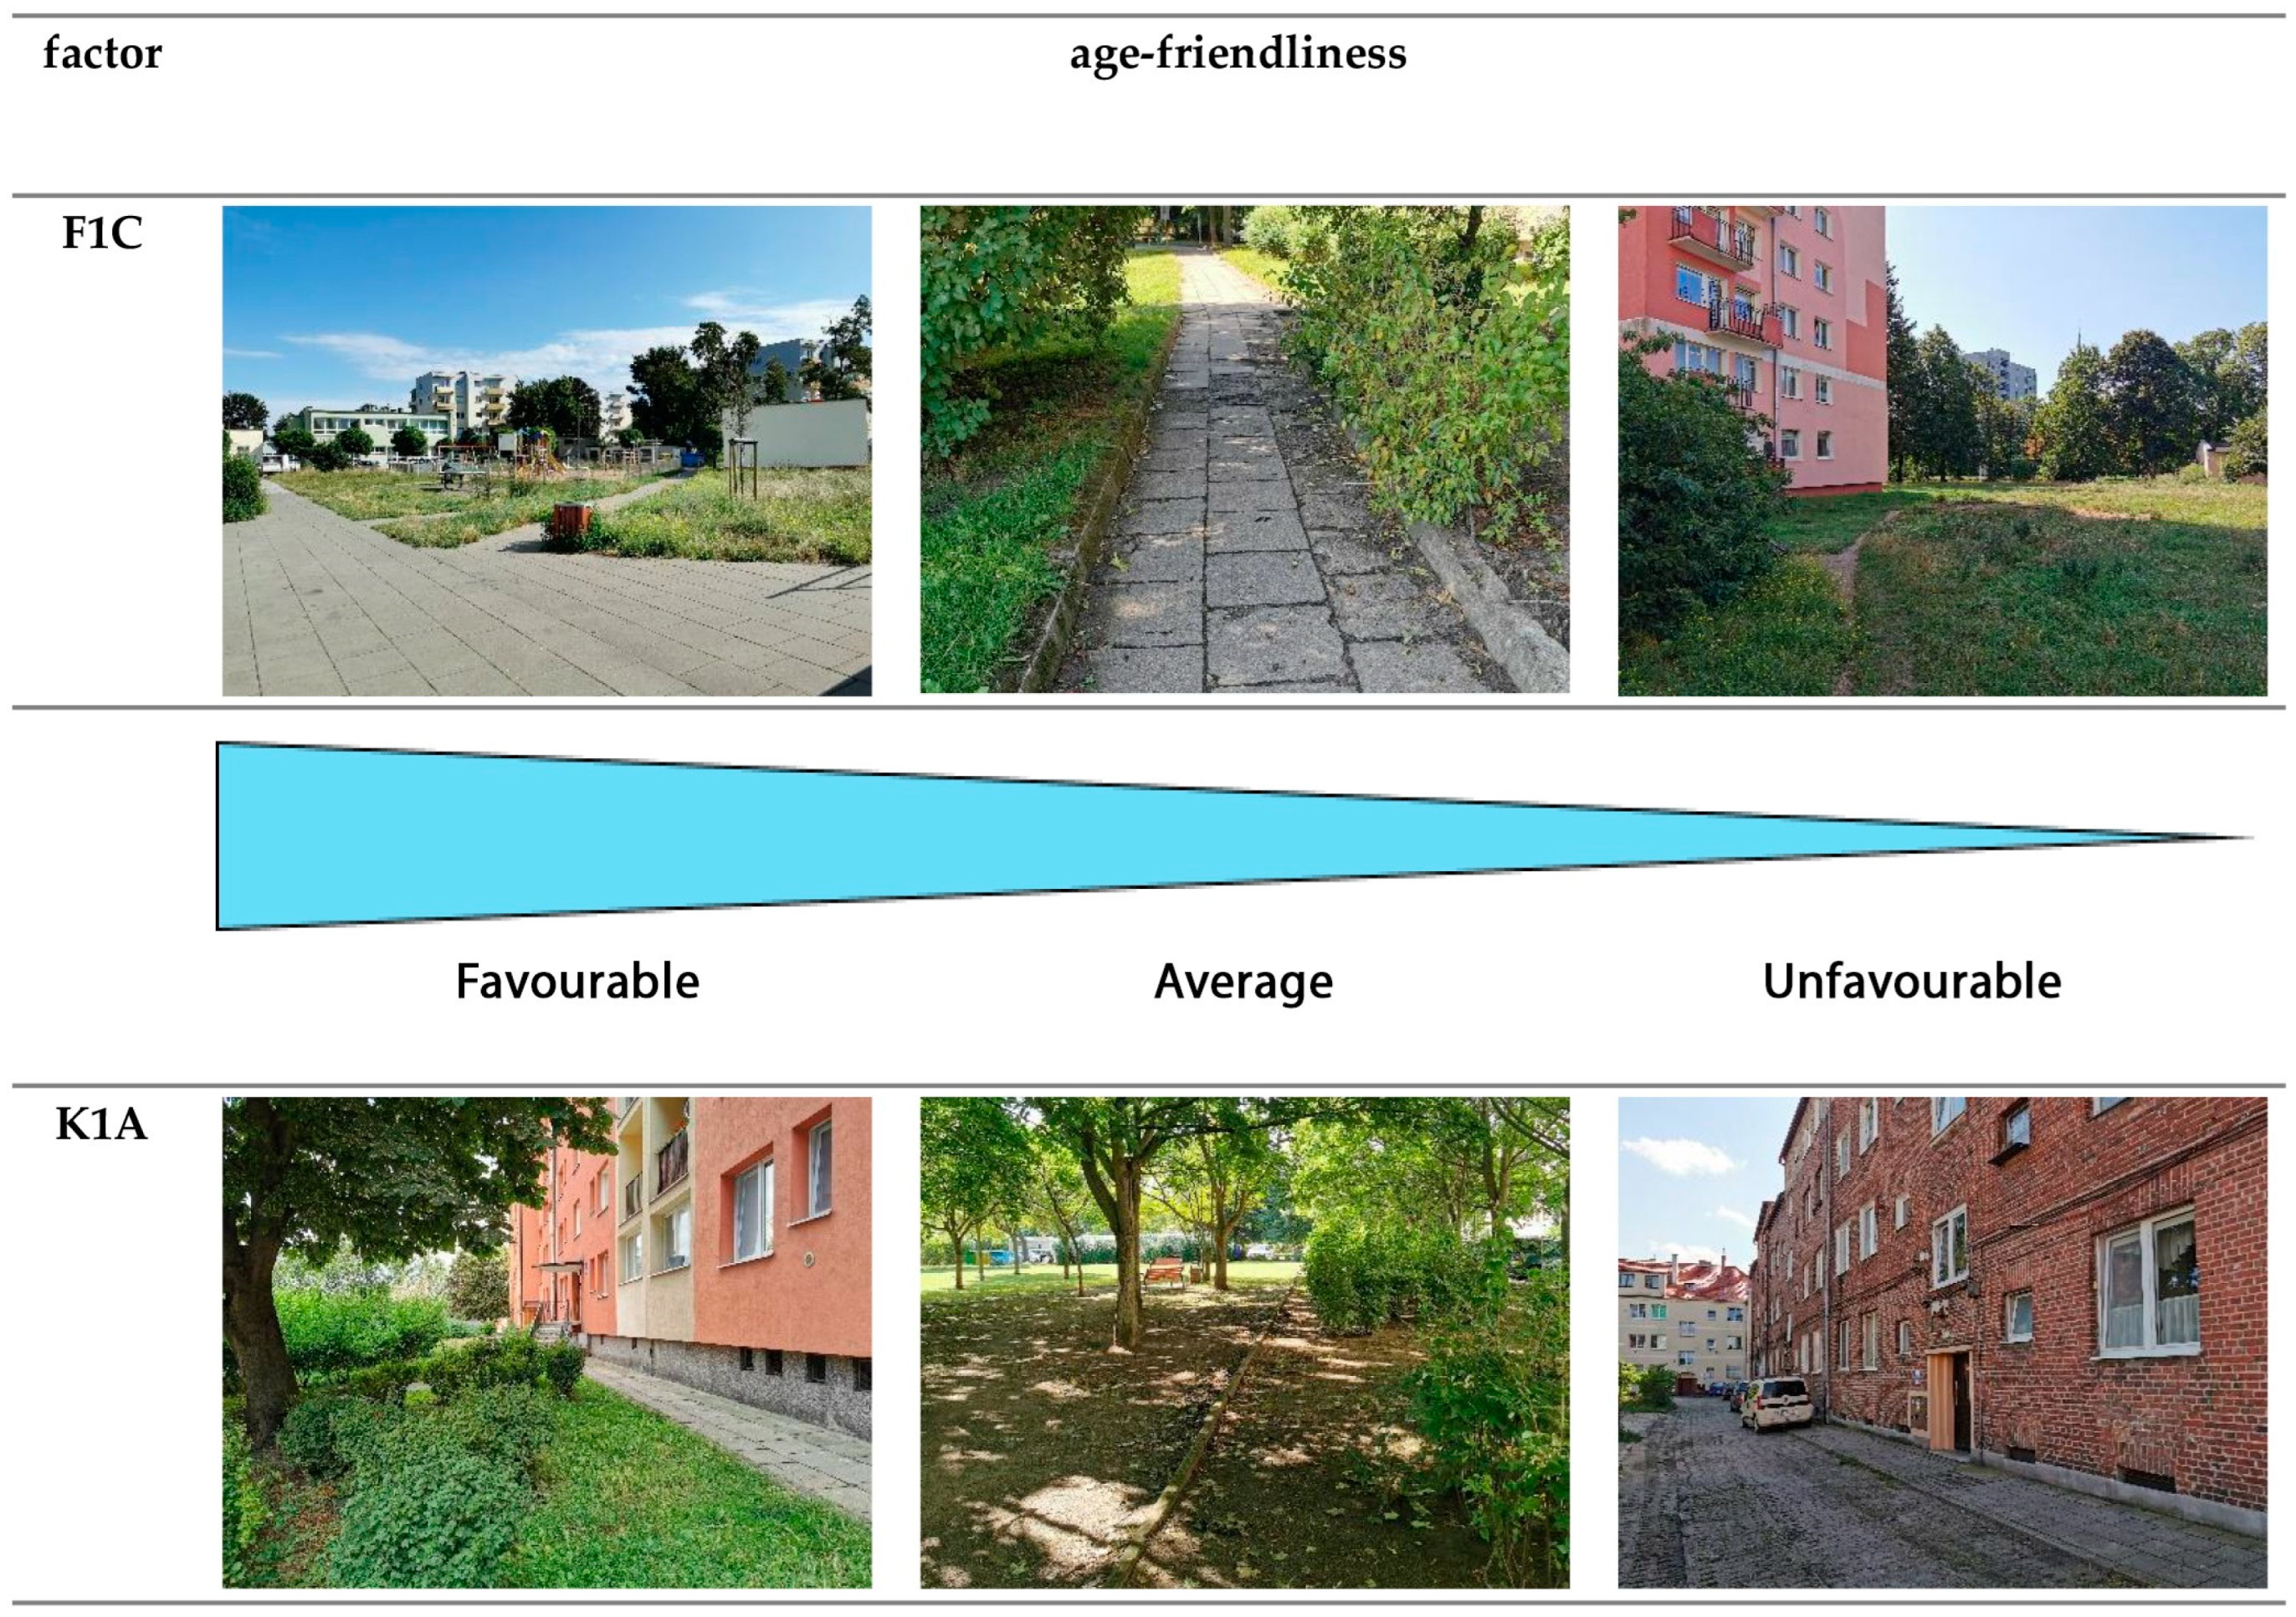
| (F1C) Pavements, stairs, ramps without barriers adapted to various levels of older adults’ abilities | 1. Widths of pedestrian pathways | Neglected pavements and numerous barriers hindering the movement of people with varying degrees of mobility in the case of most pedestrian and mixed-use paths within the estate (max. 50%) | Well-maintained pavements and few barriers hindering the movement of people with varying degrees of mobility in at least half of the pedestrian and mixed-use paths within the estate (50–75%) | No or few barriers hindering the movement of people with varying degrees of mobility in the vast majority of pedestrian and mixed-use paths within the estate (75–100%) | |||
| 2. Barrier-free communication routes (no thresholds, curbs, uneven ground) | |||||||
| 3. Surfaces with anti-slip systems | |||||||
| (F1D) Readability of communication layouts | 1. Separation of communication routes (pedestrian, bicycle, vehicle) | Lack of clear separation of traffic flows | Separated routes for pedestrian and vehicular traffic | Separated and marked routes for pedestrian, bicycle, and car traffic | |||
| (F1E) Accessibility of public transport and taxi stands | 1. Bus stops adapted to various levels of abilities | Access to a stop within a max radius of 300 m on max 50% of the estate’s area. Frequency of service every 60 min during the day | Access to a stop within a max radius of 300 m on 50–75% of the estate’s area. Frequency of service every 30 min during the day | Access to a stop within a max radius of 300 m on at least 75% of the estate’s area. Frequency of service every 15 min during the day | |||
| 2. Taxi stands located in easily accessible places for persons with varying levels of abilities | |||||||
| 3. Clear communication systems | |||||||
| 4. Readable architecture | |||||||
| 5. Lighting of pedestrian crossings | |||||||
| (F1) Transportation-communication function | (1F) Readability of spatial layouts | 1. Easy orientation in space | <50% of the estate area with legible spatial layouts | - | >50% of the estate area with legible spatial layouts | ||
| 2. Clear communication systems | |||||||
| 3. Readable architecture | |||||||
| (F1G) Lighting of communication routes | 1. Lighting systems ensuring good visibility after dark | The number of street lamps and other lighting not providing adequate illumination for most of the estate area or its absence within the estate | The number of street lamps and other lighting providing adequate illumination for at most half of the estate area | The number of street lamps and other lighting providing adequate illumination for the majority of the estate area | |||
| 2. Lighting of pedestrian crossings | |||||||
| (F2) Recreational-rest function | (F2A) Passive rest areas | 1. Dedicated small architectural elements and facilities (benches, gazebos, etc.) | Distance to passive recreation spots above 500 m on >75% of the estate’s area | Distance to passive recreation spots 200–500 m on >75% of the estate’s area | Distance to passive recreation spots below 200 m on >75% of the estate’s area | ||
| 2. Walking areas (squares, parks, green spaces) | |||||||
| (F2B) Active rest areas | 1. Dedicated sports and recreational infrastructure (sports fields, outdoor gyms, walking areas, cycle paths, etc.) | Distance to active recreation spots above 1000 m on >75% of the estate | Distance to active recreation spots 500–1000 m on >75% of the estate | Distance below 500 m on >75% of the estate | |||
| (F3) Commercial-service function | (F3A) Primary healthcare locations | 1. Clinics (outpatient care, primary healthcare, rehabilitation) | Distance above 1000 m on >75% of the estate | Distance 500–1000 m on >75% of the estate | Distance below 500 m on >75% of the estate | ||
| (F3B) Places to purchase basic necessities | 1. Grocery stores | Distance above 500 m on >75% of the estate | Distance 200–500 m on >75% of the estate | Distance below 200 m on >75% of the estate | |||
| 2. Department stores | |||||||
| 3. Pharmacies | |||||||
| (F3C) Restaurants/bars | 1. Eateries with varying price ranges and menus | Distance above 1000 m on >75% of the estate | Distance 500–1000 m on >75% of the estate | Distance below 500 m on >75% of the estate | |||
| (F3) Commercial-service function | (F3D) Security and public order services (response speed and ability for personal and telephone contact) | 1. Police, Municipal Guard | Response time > 30 min. | Response time 15–30 min. | Response time < 15 min. | ||
| 2. Fire Service | |||||||
| 3. Emergency Services | |||||||
| (F3E) Public toilets and cleanliness of the estate | 1. Access to toilets outside the residence | Limited access to public toilets or their absence in the estate. Waste collection less than twice a week | Access to public toilets within the estate. Waste collection at least twice a week | Access to public toilets within the estate. Daily (or every 2 days) waste collection by cleaning companies | |||
| 2. Regular waste collection by cleaning companies | |||||||
| (F4) Cultural-educational function | (F4A) Cultural-educational facilities | 1. Community clubs and cultural centres | Distance above 1000 m on >75% of the estate | Distance 500–1000 m on >75% of the estate | Distance below 500 m on >75% of the estate | ||
| 2. Libraries | |||||||
| 3. Museums, galleries, art and craft studios | |||||||
| 4. Cinemas and theatres | |||||||
| (F4B) Sacred facilities | 1. Temples | Distance above 1000 m on >75% of the estate | Distance 500–1000 m on >75% of the estate | Distance below 500 m on >75% of the estate | |||
| 2. Chapels and other elements of small sacred architecture | |||||||
| 3. Cemeteries | |||||||
| (F5) Information function | (F5A) Clear signage adapted to the abilities of older adults | 1. A uniform system of address markings (street names, building numbers) and building functions (bakery, post office, shop, restaurant, public toilet, library, etc.) and direction signs/indicators | Lack of signage (or only 1 of 3) on main streets | Some signage present (2 of 3) on main streets | Address and directional signs and audible signals present on main streets | ||
| 2. Auditory signals (communication, public utility buildings, residential buildings—intercoms, etc.) and devices for the hearing impaired | |||||||
| 3. Clear messages regarding public transport movement | |||||||
| (F6) Protective function | (F6A) Places of safe shelter and infrastructure elements providing safety in emergency situations (e.g., shelters, flood protection, shelters, evacuation points) | 1. Accessibility of places of safe shelter and infrastructure elements providing safety in emergency situations | Distance above 1000 m on <50% of the estate | Distance 500–1000 m on 50–75% of the estate | Distance below 500 m on >75% of the estate | ||
| (F7) Urban planning parameters | (F7A) Building intensity. | 1. Density of development | Building density > 1.5 | Building density 1.0–1.5 | Building density < 1.0 | ||
| 2. Height of buildings | |||||||
| (F7B) Biologically active area | 1. The percentage of biologically active area in the total area of the estate | <25% biologically active area of the total estate area | 25–35% biologically active area of the total estate area | >35% biologically active area of the total estate area | |||
| (F8) Neighbourhood function | (F8A) Neighbourhood function (function of land adjacent to the estate) | 1. The type of function of lands neighbouring the estate | Industrial function; services and trade causing inconvenience, generating heavy traffic (e.g., station, railway traffic, hypermarkets); mines; gravel pits; wastelands (e.g., marshes, peat bogs, dunes, rubbish dumps, etc.) | Agricultural lands | Residential function; non-intrusive services and trade; forests and wooded areas; recreation (flowing and standing waters); green areas, including allotment gardens | ||
| Category of Factors | Factors | Elements | Indicator | |||
|---|---|---|---|---|---|---|
| 0–2 Scale | 0—Unfavourable | 1—Average | 2—Favourable | |||
| 0–1 Scale | 0—Unfavourable | - | 1—Favourable | |||
| (K1) Green-blue infrastructure (areas with various forms of greenery—isolation greenery, recreational greenery, function-defining greenery, and water bodies) | (K1A) Low greenery | 1. Dominant low greenery (lawns, flower beds, borders, gardens, shrubs) | Within 50 m of the building <30% of the area occupied by low greenery | Within 50 m of the building 30–50% of the area occupied by low greenery | Within 50 m of the building >50% of the area occupied by low greenery | |
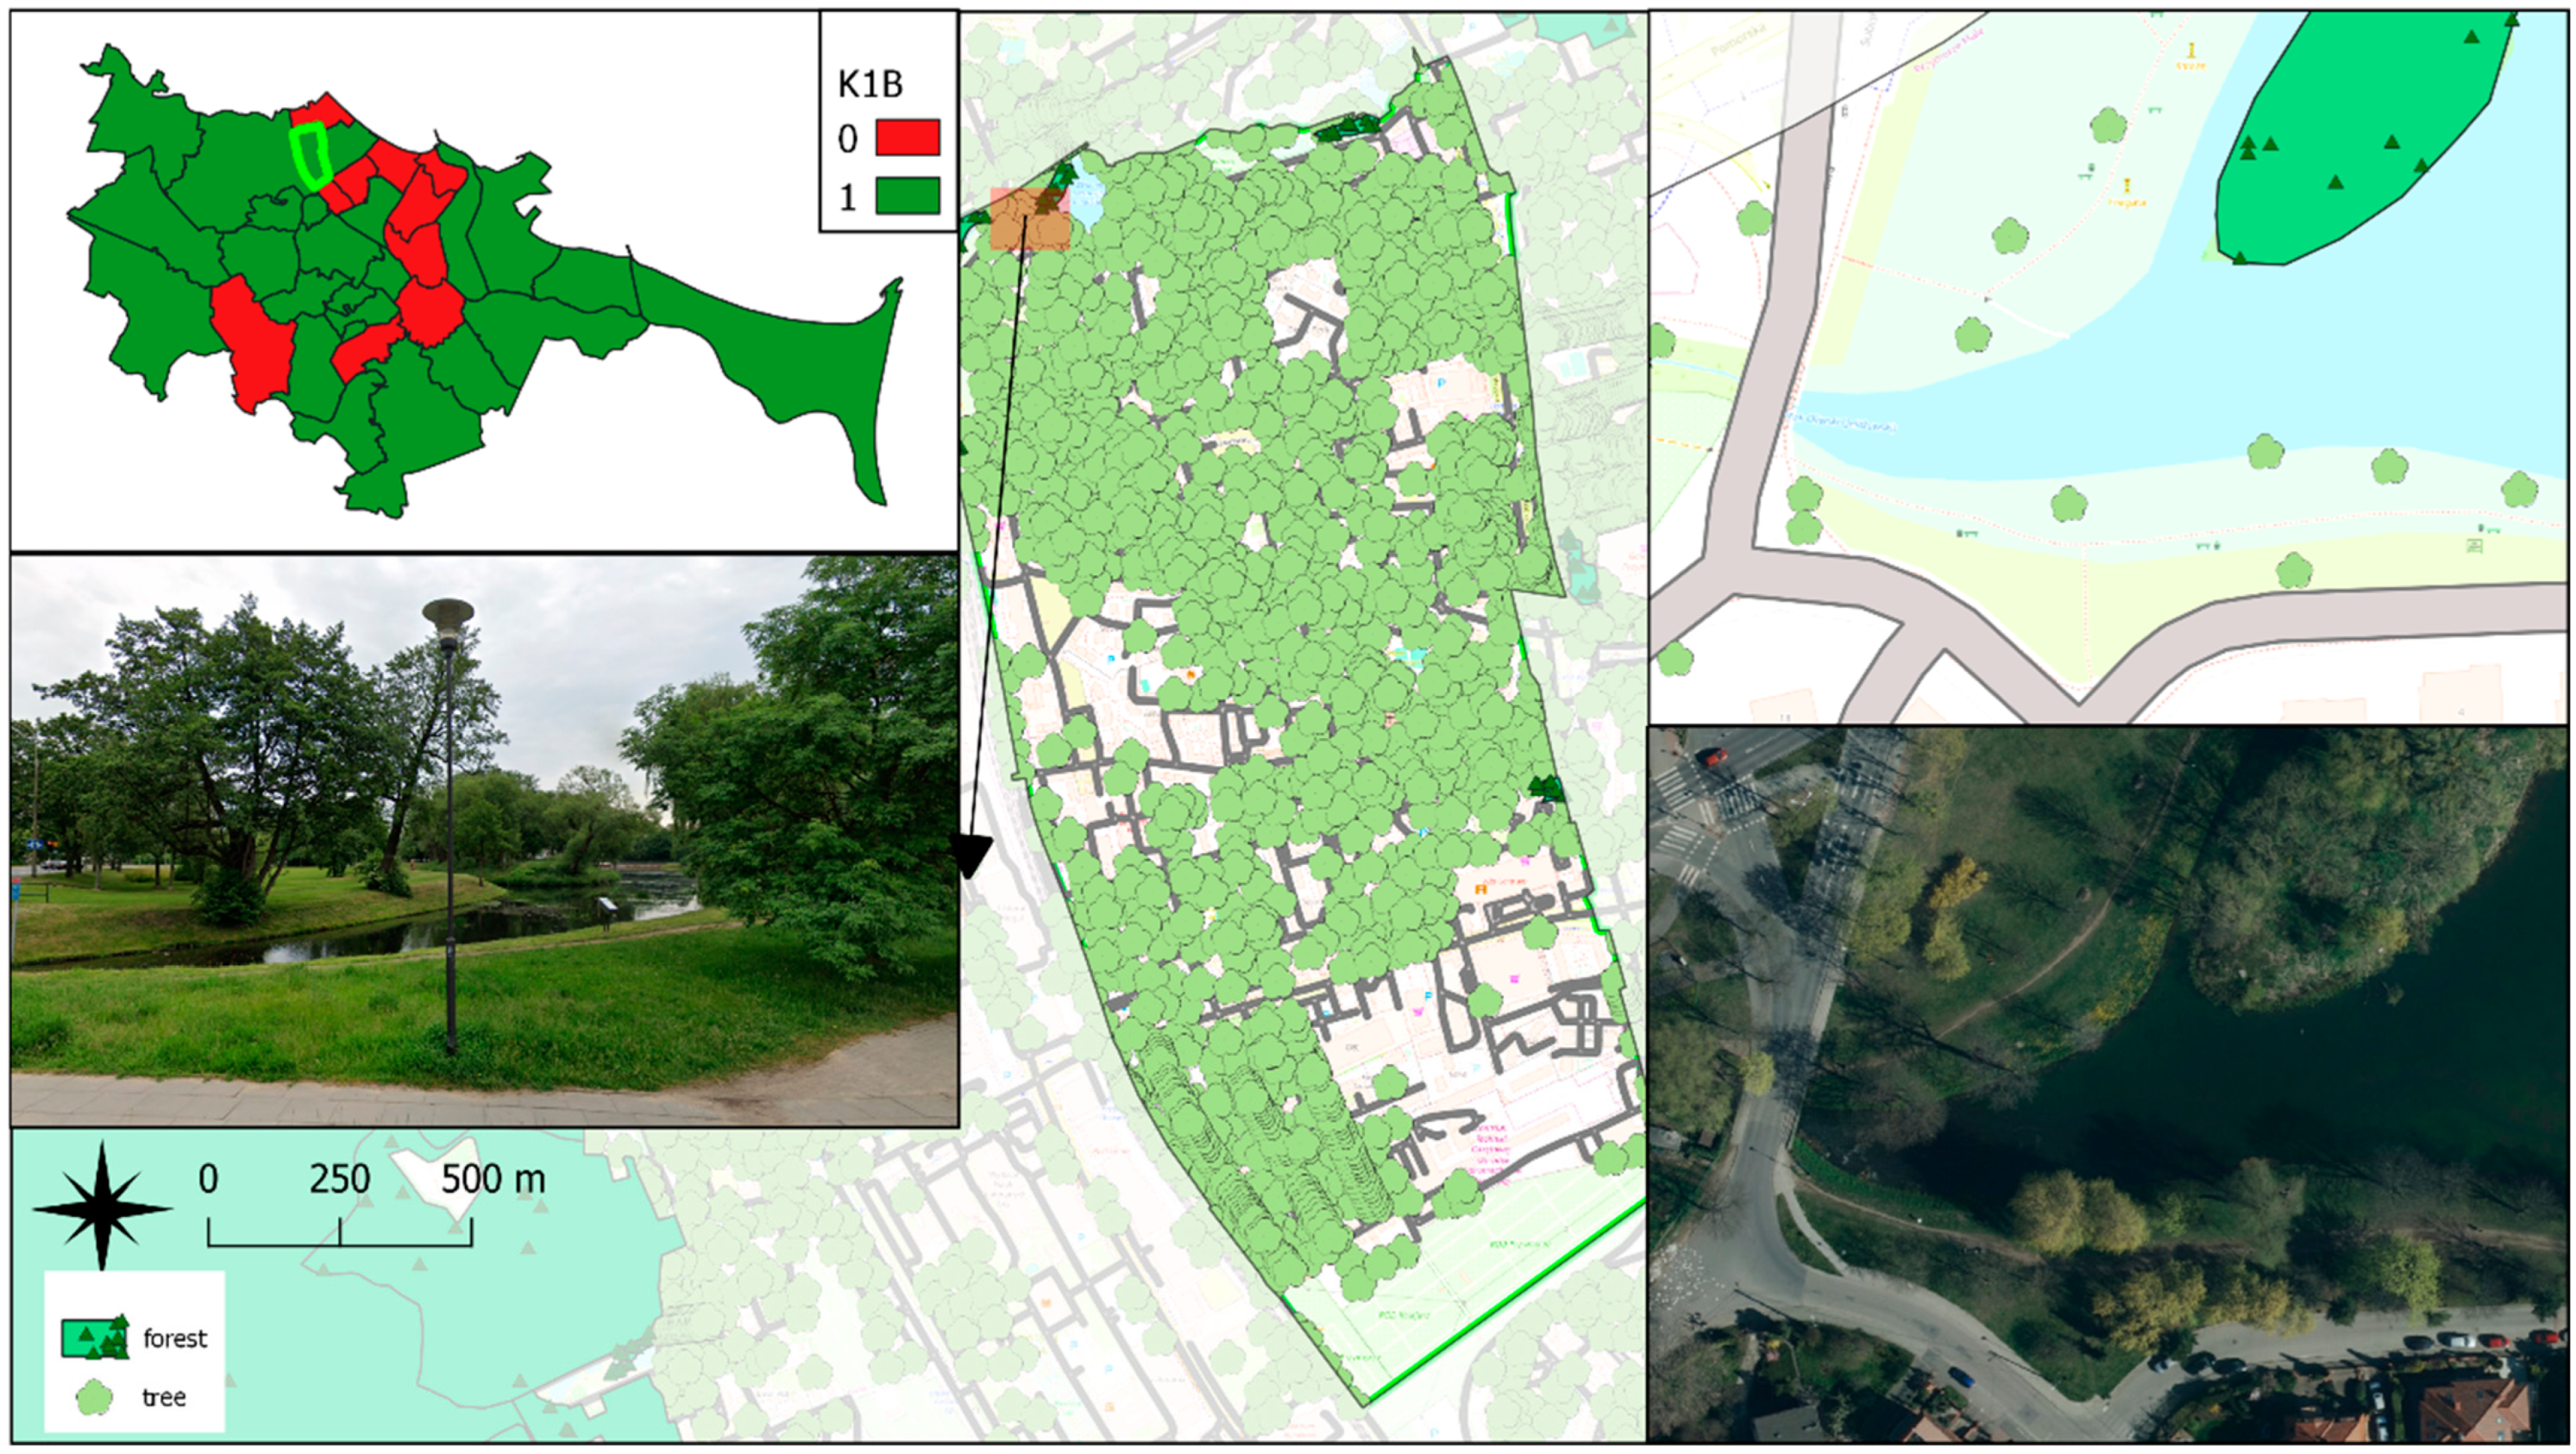
| (K1B) Tall greenery | 1. Composition of tall greenery that does not cast shade on buildings | >0.3 trees per building within <10 m of the building. or <1 tree/building in the estate area | - | Absence of tall greenery or <0.3 trees per building within <10 m of the building. or ≥1 tree per building in the estate area. or Forest on >10% of the estate area | ||
| (K1C) Aesthetic (well-maintained) places for recreation and relaxation (passive and active) (RP) | 1. Benches and resting places | Lack of aesthetically pleasing places for recreation and relaxation | Presence of aesthetically pleasing places for recreation and relaxation (at least 30% of the residential area is dedicated to recreation and relaxation, and up to 50% of these spaces are aesthetically pleasing) | Presence of aesthetically pleasing places for recreation and relaxation (at least 30% of the residential area is dedicated to recreation and relaxation, and more than 50% of these spaces are aesthetically pleasing) | ||
| 2. Walking paths, avenues | ||||||
| 3. Park layouts, green spaces, squares | ||||||
| 4. Sports facilities (sports fields, cycle paths, outdoor gyms, ice rinks) and playgrounds | ||||||
| (K1D) Water bodies | 1. Natural and artificial water bodies (ponds, lakes, rivers, and other streams and reservoirs) | Absence of water bodies within the estate | - | Presence of water bodies within the estate | ||
| (K2) Urban layouts | (K2A) Logic of the layout | 1. Simple and understandable layout of streets and alleys that facilitates navigation | Lack of logic in the layout and legible and uniform address signage in <30% of the estate area | 30–50% of the estate area has logical spatial layouts and legible and uniform address signage | 50% of the estate area has logical spatial layouts and legible and uniform address signage | |
| 2. Legible and uniform address signage | ||||||
| (K2) Urban layouts | (K2B) View corridors (open layouts providing observations of the near and distant surroundings) | 1. View corridors of the immediate surroundings | No visible thoroughfare through the housing estate | There is one visible thoroughfare running through the housing estate | There are multiple visible thoroughfares running through the housing estate | |
| 2. View corridors of the distant perspective | ||||||
| (K2C) Historical spatial arrangements (heritage architecture with natural surroundings) | 1. Architectural monuments | <5% of the estate area occupied by heritage objects | 5–10% of the estate area occupied by heritage objects | >10% of the estate area occupied by heritage objects | ||
| 2. Historic park layouts | ||||||
| 3. Narrow streets with townhouses | ||||||
| (K3) Appearance of spatial objects | (K3A) Façades of buildings and other construction objects | 1. Subdued colour scheme of buildings and condition of façades | Well-maintained, clean, and with subdued colours on <50% of the estate area | - | Well-maintained, clean, and with subdued colours on >50% of the estate area | |
| 2. Traditional architectural forms | ||||||
| 3. Harmony of building compositions | ||||||
| 4. Spacious building entrances | ||||||
| 5. Well-maintained façades and architectural details | ||||||
| (K3B) Harmonious architecture | 1. Uniform stylistic approach of urban spatial units | Mixed architectural styles within the estate | Large-panel building construction within the estate. Uniform style | Modern or heritage buildings within the estate | ||
| (K3C) Harmonious (stylistically integrated) accompanying infrastructure (recreational, transportation, technical) | 1. Small accompanying architecture—benches, shelters, canopies, street lamps, etc. | Non-uniform style of structures within the estate | - | Uniform style of structures within the estate | ||
| 2. Squares, playgrounds, exercise facilities, etc. | ||||||
| (K3) Appearance of spatial objects | (K3D) Landscape dominant | 1. Anthropogenic dominant | Absence of a dominant feature within the neighborhood | Absence of a dominant feature within the neighborhood | ||
| 2. Natural dominant. | ||||||
| 3. Anthropogenic and natural sub-dominants | ||||||
| 4. Landscape accents | ||||||
| (K3E) Objects and elements reducing the aesthetic values of the landscape | 1. Damage (acts of vandalism)—graffiti, physical damage | Presence of damaged and neglected structures within the estate. Presence of inconsistent structures within the estate | - | Absence of damaged and neglected structures within the estate. Absence of inconsistent structures within the estate | ||
| 2. Worn and unrepaired development elements | ||||||
| 3. Objects inconsistent with surrounding anthropogenic and natural elements | ||||||
| (K4) Orderliness and cleanliness of the surroundings | (K4A) Well-maintained and clean estate elements | 1. Maintained proper cleanliness and aesthetics of anthropogenic and natural elements in private and shared (public) areas | Estate cleanliness not maintained | - | Estate cleanliness maintained | |
References
- WHO. World Report on Ageing and Health; WHO: Geneva, Switzerland, 2018. [Google Scholar]
- WHO. Global Age-Friendly Cities: A Guide; WHO: Geneva, Switzerland, 2007. [Google Scholar]
- Lui, C.-W.; Everingham, J.-A.; Warburton, J.; Cuthill, M.; Bartlett, H. What Makes a Community Age-Friendly: A Review of International Literature. Australas. J. Ageing 2009, 28, 116–121. [Google Scholar] [CrossRef] [PubMed]
- UCLG. Global Charter-Agenda for Human Rights in the City; UCLG: Barcelona, Spain, 2016. [Google Scholar]
- Handler, S. An Alternative Age-Friendly Handbook: Featuring New & Emerging Ageinclusive Initiatives with Additional Reflections (& Provocations) on Ageing in the Contemporary City; University of Manchester: Manchester, UK, 2014. [Google Scholar]
- Fitzgerald, K.G.; Caro, F.G. An Overview of Age-Friendly Cities and Communities Around the World. J. Aging Soc. Policy 2014, 26, 1–18. [Google Scholar] [CrossRef] [PubMed]
- Plouffe, L.; Kalache, A. Towards Global Age-Friendly Cities: Determining Urban Features That Promote Active Aging. J. Urban Health 2010, 87, 733–739. [Google Scholar] [CrossRef] [PubMed]
- Gonyea, J.G.; Hudson, R.B. Emerging Models of Age-Friendly Communities: A Framework for Understanding Inclusion. Public Policy Aging Rep. 2015, 25, 9–14. [Google Scholar] [CrossRef]
- Wong, D.W.S.; Shaw, S.-L. Measuring Segregation: An Activity Space Approach. J. Geogr. Syst. 2011, 13, 127–145. [Google Scholar] [CrossRef] [PubMed]
- Feskanich, D.; Willett, W.; Colditz, G. Walking and Leisure-Time Activity and Risk of Hip Fracture in Postmenopausal Women. JAMA 2002, 288, 2300–2306. [Google Scholar] [CrossRef] [PubMed]
- Mollenkopf, H. Outdoor Mobility in Old Age. In The Encyclopedia of Human Ecology; Miller, J.R., Lerner, R.M., Schiamberg, L.B., Anderson, P.M., Eds.; ABC-CLIO: Santa Barbara, CA, USA, 2003; Volume 2, pp. 537–542. [Google Scholar]
- Mollenkopf, H.; Marcellini, F.; Ruoppila, I.; Széman, Z.; Tacken, M.; Kaspar, R.; Wahl, H.-W. The Role of Driving in Maintaining Mobility in Later Life: A European View. Gerontechnology 2002, 1, 231–250. [Google Scholar] [CrossRef]
- Dikken, J.; Kazak, J.K.; Soebarto, V.; van Hoof, J. Views of Older People on Environmental Sustainability: The Development of the SustainABLE-16 Questionnaire. Build. Environ. 2023, 242, 110514. [Google Scholar] [CrossRef]
- Kazak, J.K. Intergenerational Social Housing for Older Adults: Findings from a Central European City. Habitat Int. 2023, 142, 102966. [Google Scholar] [CrossRef]
- Dawidowicz, A.; Zysk, E.; Figurska, M.; Źróbek, S.; Kotnarowska, M. The Methodology of Identifying Active Aging Places in the City—Practical Application. Cities 2020, 98, 102575. [Google Scholar] [CrossRef]
- Figurska, M.; Dawidowicz, A.; Zysk, E. Voronoi Diagrams for Senior-Friendly Cities. Int. J. Environ. Res. Public Health 2022, 19, 7447. [Google Scholar] [CrossRef] [PubMed]
- Czaplicka, M.; Dawidowicz, A.; Dudzińska, M.; Senetra, A. Security Means Age-Friendliness. Analysis of Older People’s Needs Regarding the Safe Infrastructure of Open Residential Spaces. A Case Study of Poland, the EU Member Country. Acta Sci. Pol. Adm. Locorum 2023, 22, 487–510. [Google Scholar] [CrossRef]
- Atkins, M.T. Creating Age-Friendly Cities: Prioritizing Interventions with Q-Methodology. Int. Plan. Stud. 2020, 25, 303–319. [Google Scholar] [CrossRef]
- Yücel, G.F. Street Furniture and Amenities: Designing the User-Oriented Urban Landscape. In Advances in Landscape Architecture; Özyavuz, M., Ed.; IntechOpen: Rijeka, Yugoslavia, 2013; p. 23. [Google Scholar]
- Krishnamurthy, S.; Steenhuis, C.; Reijnders, D.A.H.; Stav, T. Child-Friendly Urban Design: Observations on Public Space from Eindhoven (NL) and Jerusalem (IL); Eindhoven University of Technology: Eindhoven, The Netherlands, 2018. [Google Scholar]
- Voce, A. Cities Alive: Designing for Urban Childhoods. Child. Youth Environ. 2018, 28, 78–81. [Google Scholar] [CrossRef]
- Musselwhite, C.B.A. Designing Public Space for Older People. Gener. Rev. 2014, 327, 25–27. [Google Scholar]
- Musselwhite, C.B.A. Designing Public Space for an Ageing Population. Improving Pedestrian Mobility for Older People; Emerald Publishing Limited: Leeds, UK, 2021. [Google Scholar]
- Brown, G.; Brabyn, L. An Analysis of the Relationships between Multiple Values and Physical Landscapes at a Regional Scale Using Public Participation GIS and Landscape Character Classification. Landsc. Urban Plan. 2012, 107, 317–331. [Google Scholar] [CrossRef]
- Richling, A.; Solon, J. Ekologia krajobrazu; Wyd. 5.; Wydawnictwo Naukowe PWN: Warszawa, Poland, 2011; ISBN 978-83-01-16733-2. [Google Scholar]
- Bajerowski, T.; Biłozor, A.; Cieślak, I.; Senetra, A.; Szczepańska, A. Ocena i Wycena Krajobrazu: Wybrane Problemy Rynkowej Oceny i Wyceny Krajobrazu Wiejskiego, Miejskiego i Stref Przejściowych; Educaterra: Olsztyn, Poland, 2007; ISBN 978-83-88999-02-4. [Google Scholar]
- Sobczyńska, K. Wielofunkcyjna rola zieleni w procesie percepcji oparta na teorii Gibsona. Archit. Artibus 2021, 13, 40–47. [Google Scholar]
- Gibson, J. The Ecological Approach to Visual Perception; eBook: New York, NY, USA, 2014. [Google Scholar] [CrossRef]
- Lin, L.-J.; Hsu, Y.-C.; Scharlach, A.E.; Kuo, H.-W. Examining Stakeholder Perspectives: Process, Performance and Progress of the Age-Friendly Taiwan Program. Int. J. Environ. Res. Public Health 2019, 16, 608. [Google Scholar] [CrossRef] [PubMed]
- Gagliardi, C.; Spazzafumo, L.; Marcellini, F.; Mollenkopf, H.; Ruoppila, I.; Tacken, M.; Szémann, Z. The Outdoor Mobility and Leisure Activities of Older People in Five European Countries. Ageing Soc. 2007, 27, 683–700. [Google Scholar] [CrossRef]
- Lang, F.R.; Rieckmann, N.; Baltes, M.M. Adapting to Aging Losses: Do Resources Facilitate Strategies of Selection, Compensation, and Optimization in Everyday Functioning? J. Gerontol. Ser. B 2002, 57, P501–P509. [Google Scholar] [CrossRef]
- Schönfelder, S.; Axhausen, K.W. On the Variability of Human Activity Spaces. In The Real and Virtual Worlds of Spatial Planning; Koll-Schretzenmayr, M., Keiner, M., Nussbaumer, G., Eds.; Springer: Berlin/Heidelberg, Germany, 2004; pp. 237–262. ISBN 978-3-662-10398-2. [Google Scholar]
- Wiles, J.L.; Allen, R.E.S.; Palmer, A.J.; Hayman, K.J.; Keeling, S.; Kerse, N. Older People and Their Social Spaces: A Study of Well-Being and Attachment to Place in Aotearoa New Zealand. Soc. Sci. Med. 2009, 68, 664–671. [Google Scholar] [CrossRef] [PubMed]
- Van Hoof, J.; Kazak, J.K.; Perek-Białas, J.M.; Peek, S.T.M. The Challenges of Urban Ageing: Making Cities Age-Friendly in Europe. Int. J. Environ. Res. Public Health 2018, 15, 2473. [Google Scholar] [CrossRef] [PubMed]
- Oswald, A.J.; Wu, S. Objective Confirmation of Subjective Measures of Human Well-Being: Evidence from the U.S.A. Science 2010, 327, 576–579. [Google Scholar] [CrossRef] [PubMed]
- World Health Organization. Active ageing: A policy framework. In Vieillir en Restant Actif: Cadre d’ Orientation; World Health Organization: Geneva, Switzerland, 2002. [Google Scholar]
- Senetra, A.; Czaplicka, M.; Dudzińska, M.; Dawidowicz, A. Functionality and Aesthetics as a Condition for Age-Friendly Residential Areas (AFRA) from an International Perspective. Sci. Rep. 2023. in print. [Google Scholar]
- Berthoud, R.; Blekesaune, M.; Hancock, R. Ageing, Income and Living Standards: Evidence from the British Household Panel Survey. Ageing Soc. 2009, 29, 1105–1122. [Google Scholar] [CrossRef]
- Serrat, R.; Villar, F. Lifecourse Transitions and Participation in Political Organisations in Older Spanish Men and Women. Ageing Soc. 2020, 40, 2174–2190. [Google Scholar] [CrossRef]
- Andrews, M. Lifetimes of Commitment: Ageing, Politics, Psychology; Cambridge University Press: Cambridge, UK, 1991; ISBN 978-0-521-42249-9. [Google Scholar]
- Bowling, A. Ageing Well: Quality of Life in Old Age; Bowling, A., Ed.; Open University Press: Maidenhead, UK, 2005; ISBN 0335215092. [Google Scholar]
- Burns, N.; Schlozman, K.L.; Verba, S. The Public Consequences of Private Inequality: Family Life and Citizen Participation. Am. Political Sci. Rev. 1997, 91, 373–389. [Google Scholar] [CrossRef]
- Panagopoulos, T.; González Duque, J.A.; Bostenaru Dan, M. Urban Planning with Respect to Environmental Quality and Human Well-Being. Environ. Pollut. 2016, 208, 137–144. [Google Scholar] [CrossRef]
- Pankina, M. Ecological Aspects of Visual Urban Environment Design. KnE Soc. Sci. 2020, 4, 312–323. [Google Scholar] [CrossRef]
- Wang, R.; Zhao, J.; Meitner, M.J.; Hu, Y.; Xu, X. Characteristics of Urban Green Spaces in Relation to Aesthetic Preference and Stress Recovery. Urban For. Urban Green. 2019, 41, 6–13. [Google Scholar] [CrossRef]
- Jones, R.; Tarter, R.; Ross, A.M. Greenspace Interventions, Stress and Cortisol: A Scoping Review. Int. J. Environ. Res. Public Health 2021, 18, 2802. [Google Scholar] [CrossRef] [PubMed]
- CDC. The ICF: An Overview; CDC: Centers for Disease Control and Prevention: Geneva, Switzerland, 2024. Available online: https://www.cdc.gov/nchs/data/icd/icfoverview_finalforwho10sept.pdf (accessed on 25 June 2024).
- Okabe, A.; Boots, B.; Sugihara, K.; Chiu, S. Spatial Tessellations: Concepts and Applications of Voronoi Diagrams; John Wiley and Sons, Inc.: Hoboken, NJ, USA, 2000; Volume 43, ISBN 978-0-471-98635-5. [Google Scholar]
- Miasto Gdańsk Otwarte Dane w Gdańsku (Open Data in Gdańsk). Available online: https://www.gdansk.pl/otwarte-dane-w-gdansku (accessed on 12 March 2024).
- Miasto Gdańsk Gdańsk w Liczbach [Gdańsk in Numbers]. Available online: https://www.gdansk.pl/gdansk-w-liczbach (accessed on 12 March 2024).
- Raport o Stanie Miasta Gdańska Za 2021 Rok (Report on the State of the City of Gdańsk for 2021). Available online: https://download.cloudgdansk.pl/gdansk-pl/d/202205190151/raport-o-stanie-miasta-gdanska-za-2021-rok.pdf (accessed on 12 March 2024).
- Leonardi, F.; Gagliardi, C.; Marcellini, F. Basic National Conditioning Factors of Mobility among Elderly People. In Ageing and Outdoor Mobility: A European Study; Mollenkopf, H., Marcellini, F., Ruoppila, I., Eds.; IOS Press: Amsterdam, The Netherlands, 2004; pp. 5–26. [Google Scholar]
- Transforming Our World: The 2030 Agenda for Sustainable Development. 2015. Available online: https://sdgs.un.org/2030agenda (accessed on 20 March 2024).
- Yokoya, N.; Nakazawa, S.; Matsuki, T.; Iwasaki, A. Fusion of Hyperspectral and LiDAR Data for Landscape Visual Quality Assessment. IEEE J. Sel. Top. Appl. Earth Obs. Remote Sens. 2014, 7, 2419–2425. [Google Scholar] [CrossRef]
- Wróżyński, R.; Pyszny, K.; Sojka, M. Quantitative Landscape Assessment Using LiDAR and Rendered 360° Panoramic Images. Remote Sens. 2020, 12, 386. [Google Scholar] [CrossRef]
- Li, M.; Xue, F.; Wu, Y.; Yeh, A.G.O. A Room with a View: Automatic Assessment of Window Views for High-Rise High-Density Areas Using City Information Models and Deep Transfer Learning. Landsc. Urban Plan. 2022, 226, 104505. [Google Scholar] [CrossRef]


| Functional-Spatial Factors | Data Sources | ||||||||||
| Orthophotomap | OpenStreetMap | BDOT10k | Google Maps | Situational-Height Map | Planning Documents | Other Spatial Data Registers | Geodetic Registrer of Utility Networks | Cartographic Inventory | Google Street View | Field Inventory | |
| F1A | x | x | x | x | |||||||
| F1B | x | x | x | x | x | ||||||
| F1C | x | x | |||||||||
| F1D | x | x | x | x | x | ||||||
| F1E | x | x | |||||||||
| F1F | x | ||||||||||
| F1G | x | x | x | x | |||||||
| F2A | x | x | x | x | |||||||
| F2B | x | x | x | x | |||||||
| F3A | x | x | x | ||||||||
| F3B | x | x | x | ||||||||
| F3C | x | x | x | ||||||||
| F3D | x | x | |||||||||
| F3E | x | x | x | ||||||||
| F4A | x | x | x | ||||||||
| F4B | x | x | |||||||||
| F5A | x | x | |||||||||
| F6A | x | x | x | x | |||||||
| F7A | x | x | |||||||||
| F7B | x | x | |||||||||
| F8A | x | x | x | x | x | ||||||
| Aesthetics Factors | Data Sources | ||||||||||
| Orthophotomap | OpenStreetMap | BDOT10k | Google Maps | Situational-Height Map | Planning Documents | Other Spatial Data Registers | Geodetic Register of Utility Networks | Cartographic Inventory | Google Street View | Field Inventory | |
| K1A | x | x | x | ||||||||
| K1B | x | x | x | x | |||||||
| K1C | x | x | |||||||||
| K1D | x | x | |||||||||
| K2A | x | x | x | ||||||||
| K2B | x | x | x | ||||||||
| K2C | x | x | x | ||||||||
| K3A | x | x | |||||||||
| K3B | x | x | |||||||||
| K3C | x | x | |||||||||
| K3D | x | x | x | x | x | ||||||
| K3E | x | x | |||||||||
| K4A | x | x | x | ||||||||
| Statistic | F1A | F1B | F1C | F1D | F1E | F1F | F1G | F2A | F2B | F3A | F3B | F3C | F3D | F3E |
|---|---|---|---|---|---|---|---|---|---|---|---|---|---|---|
| Minimum | 0.0 | 0.0 | 0.0 | 1.0 | 0.0 | 0.0 | 0.0 | 0.0 | 0.0 | 0.0 | 0.0 | 0.0 | 1.0 | 1.0 |
| Maximum | 2.0 | 0.0 | 2.0 | 2.0 | 2.0 | 1.0 | 2.0 | 2.0 | 2.0 | 2.0 | 2.0 | 2.0 | 1.0 | 1.0 |
| Median | 0.0 | 0.0 | 1.0 | 2.0 | 1.0 | 1.0 | 1.0 | 1.0 | 2.0 | 1.0 | 0.0 | 1.0 | 1.0 | 1.0 |
| Average | 0.5 | 0.0 | 0.9 | 1.6 | 1.0 | 0.7 | 1.3 | 0.8 | 1.3 | 0.8 | 0.5 | 1.0 | 1.0 | 1.0 |
| Statistic | F4A | F4B | F5A | F6A | F7A | F7B | F8A |
|---|---|---|---|---|---|---|---|
| Minimum | 0.0 | 0.0 | 0.0 | 0.0 | 0.0 | 0.0 | 0.0 |
| Maximum | 2.0 | 2.0 | 2.0 | 1.0 | 2.0 | 2.0 | 2.0 |
| Median | 1.0 | 1.0 | 1.0 | 0.0 | 0.0 | 2.0 | 1.0 |
| Average | 0.7 | 0.8 | 1.2 | 0.2 | 0.5 | 1.9 | 1.1 |
| Statistic | K1A | K1B | K1C | K1D | K2A | K2B | K2C | K3A | K3B | K3C | K3D | K3E | K4A |
|---|---|---|---|---|---|---|---|---|---|---|---|---|---|
| Minimum | 0.0 | 0.0 | 0.0 | 0.0 | 0.0 | 0.0 | 0.0 | 0.0 | 0.0 | 0.0 | 0.0 | 0.0 | 0.0 |
| Maximum | 2.0 | 1.0 | 2.0 | 1.0 | 2.0 | 0.0 | 2.0 | 1.0 | 2.0 | 1.0 | 2.0 | 1.0 | 1.0 |
| Median | 2.0 | 0.0 | 1.0 | 1.0 | 2.0 | 0.0 | 0.0 | 1.0 | 1.0 | 1.0 | 1.0 | 0.0 | 1.0 |
| Average | 1.5 | 0.4 | 1.2 | 0.9 | 1.3 | 0.0 | 0.7 | 0.8 | 0.8 | 0.9 | 1.3 | 0.5 | 0.9 |
Disclaimer/Publisher’s Note: The statements, opinions and data contained in all publications are solely those of the individual author(s) and contributor(s) and not of MDPI and/or the editor(s). MDPI and/or the editor(s) disclaim responsibility for any injury to people or property resulting from any ideas, methods, instructions or products referred to in the content. |
© 2024 by the authors. Licensee MDPI, Basel, Switzerland. This article is an open access article distributed under the terms and conditions of the Creative Commons Attribution (CC BY) license (https://creativecommons.org/licenses/by/4.0/).
Share and Cite
Czaplicka, M.; Dudzińska, M.; Dawidowicz, A.; Senetra, A. Concept of Assessment of Age-Friendly Residential Areas (AFRA): A Case Study of Gdańsk, Poland. Sustainability 2024, 16, 6000. https://doi.org/10.3390/su16146000
Czaplicka M, Dudzińska M, Dawidowicz A, Senetra A. Concept of Assessment of Age-Friendly Residential Areas (AFRA): A Case Study of Gdańsk, Poland. Sustainability. 2024; 16(14):6000. https://doi.org/10.3390/su16146000
Chicago/Turabian StyleCzaplicka, Marta, Małgorzata Dudzińska, Agnieszka Dawidowicz, and Adam Senetra. 2024. "Concept of Assessment of Age-Friendly Residential Areas (AFRA): A Case Study of Gdańsk, Poland" Sustainability 16, no. 14: 6000. https://doi.org/10.3390/su16146000
APA StyleCzaplicka, M., Dudzińska, M., Dawidowicz, A., & Senetra, A. (2024). Concept of Assessment of Age-Friendly Residential Areas (AFRA): A Case Study of Gdańsk, Poland. Sustainability, 16(14), 6000. https://doi.org/10.3390/su16146000