Article

Biomass Pellet Processing from Sugar Industry Byproducts: A Study on Pelletizing Behavior and Energy Usage

by
Pasawat Sanchumpu
1,2,3,4,
Wiriya Suaili
1,2,3,4,
Siwakorn Nonsawang
1,2,3,4,
Chaiyan Junsiri
1,2,3,
Peeranat Ansuree
5 and
Kittipong Laloon
1,2,3,4,*
1
FOOD ENERGY WATER Security Research Institute, Khon Kaen University, Khon Kaen 40002, Thailand
2
Agricultural Engineering Department, Faculty of Engineering, Khon Kaen University, Khon Kaen 40002, Thailand
3
Agricultural Machinery and Postharvest Technology Center, Khon Kaen University, Khon Kaen 40002, Thailand
4
Postharvest Technology Innovation Center, Science, Research and Innovation Promotion and Utilization Division, Office of the Ministry of Higher Education, Science, Research and Innovation, Bangkok 10400, Thailand
5
Agricultural Machinery Engineering Department, Faculty of Engineering and Technology, Rajamangala University of Technology Isan, Nakhon Ratchasima 30000, Thailand
*
Author to whom correspondence should be addressed.
Sustainability 2024, 16(14), 6035; https://doi.org/10.3390/su16146035
Submission received: 3 May 2024 / Revised: 10 July 2024 / Accepted: 11 July 2024 / Published: 15 July 2024
(This article belongs to the Special Issue Biomass Transformation and Sustainability)

Abstract

:
As global energy demand has increased, bioenergy has emerged as a viable option for reducing greenhouse gas emissions. This study focuses on using waste materials from the sugar industry, such as sugarcane straw, bagasse, and filter cake, to compress into pellets to investigate pelletizing behavior and energy usage. Raw material preparation was a critical phase influencing pelletizing efficiency. Biomass pellet quality depended on a uniform particle size distribution and adequate moisture content. A moisture content of 20% (wb) was found to be suitable for biomass pelletization from the sugar sector. Specific energy in the pelletizing process ranged from 144.28 to 197.85 Wh/kg. The suggested mixing ingredients (sugarcane leaves: bagasse: filter cake) of 0% sugarcane leaves, 90% bagasse, 10% filter cake, and 5% sugarcane leaves, 93.5% bagasse, and 1.5% filter cake resulted in pellets with a bulk density of over 600 kg/m3 and a durability of at least 97.5%. All aspects were assessed according to standardized criteria for developing biomass pellet processing technology from sugar industry byproducts. This method could improve efficiency, boost production volume, lower production costs, and promote the efficient and cost-effective use of renewable energy.

1. Introduction

Global energy demand, as measured by total final consumption, is rising at an accelerating rate, driven by advances in energy efficiency. Fossil fuel consumption is predicted to drop from 65% in 2019 to 20–50% in 2050. The reduction in the use of hydrocarbon from approximately 80% to between 20 and 55%, the rapid increase in renewable energy from 10% to 35–65%, the increase in the share of electric power from 20% to 33–50%, and the increase in the use of low-carbon hydrogen to 13–21% are some of the factors influencing the future of global energy [1]. There are serious environmental issues, such as greenhouse gas emissions and global warming, that have detrimental consequences [2]. Many nations have implemented policies in response to the growing issue of carbon emissions. For example, the European Union, a pioneer in the worldwide fight against climate change, suggested implementing a pilot carbon border adjustment mechanism (CBAM) in 2021. The mechanism, intended to impose additional taxes on imported items entering the EU based on their carbon emissions, will be introduced in the period 2023–2026 and formally implemented in 2027 [3]. Increasing agricultural production to support the world’s rapidly growing population has resulted in a significant amount of agricultural waste. Improper or inadequate management necessitates the implementation of cutting-edge utilization and valuation strategies, with effective planning being the most important aspect of current and future agricultural waste management [4,5]. The concept of zero waste, which involves converting agricultural and industrial waste into energy, is a very environmentally friendly approach. It reduces the amount of waste that must be disposed of while increasing farmers’ incomes by allowing them to sell production waste as raw materials for alternative energy production. The biomass energy production process also helps to reduce greenhouse gas emissions because plants absorb carbon dioxide from the atmosphere and store it in plant tissues, resulting in a non-proliferative carbon cycle of greenhouse gases in the atmosphere. Furthermore, the use of biomass energy reduces reliance on fossil fuels, which are the primary source of greenhouse emissions [2,6,7].
The sugar sector is crucial to many countries’ economies, producing around 177 million metric tons of sugar globally in 2022/2023. During this time, Asia was the world’s largest sugar-producing region, producing roughly 60 million metric tons. Thailand is a significant sugar-producing country, ranking fourth globally and second in Asia, with a capacity to produce 11.04 million metric tons of sugar from sugarcane as the primary input [8]. Thailand has approximately 1.76 million hectares of sugarcane cultivation, yielding over 84.92 million metric tons of sugarcane [9]. Sugarcane harvesting is a vital phase, which can be performed manually by cutting the sugarcane or mechanically by simultaneously cutting the cane and removing the leaves. Sugarcane can be harvested without burning the stems, and the clean sugarcane is then transferred to the factory for processing. Other elements include dried leaves, green leaves, and shoots, known as sugarcane straw or sugarcane scraps (SS). The amount of sugarcane straw harvested varies depending on the sugarcane species, weather conditions, and procedures. Harvested SS content typically ranges between 3.94 and 9.44 tons/hectare of dry matter. Currently, the most expensive method of harvesting sugarcane is machine cutting due to the high cost of renting cutting equipment. Furthermore, management issues arise in certain places due to a shortage of cutting equipment. To address these challenges, farmers often choose to burn sugarcane before harvesting, as it is convenient to acquire labor. This practice helps to manage and save costs. Farmers frequently burn sugarcane leaves to get rid of the straw that remains in piles after harvesting using machinery [10,11,12,13]. Burning SS before and after harvest causes air pollution (PM2.5 dust, carbon monoxide, sulfur dioxide, nitrogen dioxide, and ozone), which can lead to a variety of health concerns. It also has a negative impact on soil quality, including microbial populations, resulting in lower soil moisture and total nitrogen and reducing the amount of bacteria beneficial for plants [14,15,16]. Consequently, the sugar factory has adopted a policy of acquiring SS for use as a fuel to generate electricity to limit burning and address the PM2.5 dust problem. Nonetheless, SS is too large to be used directly and must undergo a size reduction process to achieve the proper size. Sudajan et al. [17] investigated the influence of moisture content and blade cutting speed on SS chopping and size distribution for biomass fuel production. They found that the chopping ability, weight percentage, and average particle length decrease as blade speed increases and moisture content decreases. This improves the distribution of small leaves, with a cutting blade speed of 880 rpm and sugarcane leaf moisture of 19.74% (wb). considered suitable. This is consistent with Doungpueng et al. [18], which stated that to improve chopping efficiency and reduce energy consumption, it is recommended to dry leaves for 20–30 days before cutting to reduce the moisture content to 20% (wb).After harvesting, sugarcane stalks are processed to produce sugar through cleaning, sugarcane juice extraction, water clarification, crystallization, and centrifugal separation. This process produces byproducts, including sugarcane bagasse (SCB), filter cake or press mud (PMD), molasses, and liquid waste, which account for 28%, 4%, 3%, and 52% of the sugarcane weight that enters the factory (Figure 1) [19]. When sugarcane juice is extracted, a dry residue known as SCB is produced as a byproduct that can be used to make biofuel [20,21]. Most large plants have power plants built to generate electricity for production. However, in Thailand, only about seven months of power can be produced using the SCB currently available, which is insufficient for the biomass power plant to generate enough electricity. Additional raw materials must be imported to provide electricity for 10 to 12 months of the year. Therefore, a significant issue facing bagasse thermal power plants is the intermittent nature of the fuel supply from bagasse. The factory’s expenses have increased due to the need to purchase additional biomass, such as chopped wood, sugarcane leaves, rice husks, rice straw, and other materials, to supplement or replace the original biomass [22,23,24,25,26]. According to Chunhawong et al. [27], Thailand received 30.68 million tons of bagasse from sugar factories in 2016, producing 3885.34 GWh of electricity. In Pakistan, one ton of bagasse can generate roughly 0.45 MWh of energy using cogeneration technology, with an electrical potential ranging from 1598 to 2894 GWh [28]. Press mud (filter cake) is a brownish-black substance created during the sugarcane juice clarifying process that contains organic matter, sugarcane bagasse, leaf fragments, and other materials. Press mud can also be employed in a variety of ways, including soil enhancement and biological fertilization. Although press mud has been put to good use, considerable quantities of it remain, leading to storage issues and contamination in neighboring areas when accumulated [21,29]. When press mud was pressed into pellets, the calorific value was determined to be greater than 8–12 MJ/kg, depending on the moisture level [30]. However, all three elements (sugarcane straw, sugarcane bagasse, and press mud) must be collected during the harvesting season. Simultaneously, there is a demand for fuel to produce electricity at the power plant throughout the year. Sugar production faces several environmental and social challenges, with sugar growers, processors, and the energy and food industries seeking solutions to production concerns regarding sugar, biofuels, and sustainability [31]. A significant hindrance to their complete utilization for thermal energy applications is the low bulk density of the material, which requires substantial machinery and human labor for collection, handling, transportation, and storage, ultimately leading to increased expenses [32]. Additionally, raw biomass has inherent qualities that limit its potential for usage, such as a higher moisture content and source fragmentation [33].
Recently, biomass pelletization has received much attention in academia. This technology has been shown to produce pellets with uniform size and structure, thereby improving raw material quality, including bulk density and durability, depending on the raw material and moisture content used in pellet production. This trend is supported by the increasing number of publications in the literature over the last ten years. Laloon et al. [32] observed that compressed biomass pellets from eucalyptus bark increased bulk density from 200 kg/m3 to ≥600 kg/m3. According to Kaliyan and Morey [35], wood pellets have a bulk density ranging from 600 to 800 kg/m3, while straw pellets range from 40 to 200 kg/m3. Yancey et al. [36] reported the bulk density of corn stover pellets as 645 kg/m3, switchgrass and lodgepole pine pellets as 700 kg/m3, and eucalyptus pellets as 754 kg/m3. Moisture content has a significant impact on biomass pellet quality, affecting particle density and strength. Higher moisture content can lead to pellets loosening after production, potentially resulting in lower quality. It is, therefore, essential to carefully select the feed material and its moisture content before pelletizing [37]. Additionally, moisture concentration lowers the glass transition temperature of lignin, increasing particle adhesion [38]. Previous research indicates that the ideal moisture content for eucalyptus bark biomass pellets is 17–20% [32]; for sewage sludge, it is 10–15% [39], and for sugarcane bagasse, it is 9% [40]. The typical biomass pelletizing process involves raw material collection, drying, particle size reduction, pretreatment, pelletizing conditions, densification, and storage [33,41]. While many studies have aimed to improve pellet quality by combining materials during pelletizing [39,42,43,44], the combination of SS, SCB, and PMD has not been documented in the previous literature. This study aims to determine the feasibility of SS, SCB, and PMD pellets. Therefore, the objective was to investigate how energy consumption and pelletizing process characteristics (such as bulk density, durability, hardness, and moisture content) affect biomass pellet production. The findings of this study should provide ideal values for each variable’s procedure to generate high-quality biomass pellets from waste biomass sources. Additionally, it will aid in mitigating the emission of PM2.5 due to sugarcane leaf burning and promote effective waste management to reduce waste generation during production.

2. Materials and Methods

2.1. Raw Materials

The biomass starting material utilized for testing in this study is sugarcane straw, also known as sugarcane scraps (SS), from northeastern Thailand (Figure 2a). The substance appeared as brown or yellow threads and was taken from local sugarcane farms. It had an initial moisture content of 23.6% (wb). Sugarcane bagasse (SCB) (Figure 2b) resembled a dark line that resulted from the extraction of juice (Figure 1), and filter cake (or press mud) (Figure 2c) was a dark powder produced by a sugar factory’s vacuum filtration system (Figure 1) in northeastern Thailand, with an initial moisture content of 39.2 and 58.7% (wb), respectively.

2.2. Feedstock Preparation

Because the three raw materials were not yet in a suitable state for direct pellet pressing, they required proper preparation through sun-drying SS and SCB until their moisture contents were equalized, with SS at around 7% (wb) and SCB at about 8% (wb). The initial step in preparing the SS involves chopping it using a four-blade chaff cutter machine (Figure 2d) based on the shear principle, powered by a 1.3 kW electric motor. This machine operated on the principle of machining, with blade speeds between 800 and 900 rpm [17]. They were then further prepared by grinding and reducing the size of both materials using a swinging hammer mill with a 5 mm screen size (Figure 2e) and a drum speed of 1200 rpm powered by a 3.7 kW electric motor [32,45]. SCB, being smaller in size than SS, did not require a chaff cutter machine for shredding and could be reduced in size using a hammer mill. According to preliminary investigations, pressed moist sugarcane dregs (PMD) following the sugarcane juice production process had a very high starting moisture content (58.7% (wb)). Furthermore, using natural methods to remove moisture content could produce odor problems in the surrounding region. As a result, it had to be dried using a rotary dryer, which was a cylindrical tank with a length of 6 m and a diameter of 0.60 m (Figure 2f and Figure 3) (with right-angled flights within) [46]. This was powered by a 2.2 kW electric motor, had an inverter (Jaden inverter) for regulating the rotating speed, and used a 220-volt, 150-amp electric heater as a heat source. A variable-speed air blower, Type AV-A115 (centrifugal fan), with a 1.5 kW capacity, was used to introduce air into the system. Drying employed a drum rotation speed of 5 rpm, an intake air flow of 1 m/s, and a drying air temperature of 150 °C until the material’s moisture content was less than 10% (wb). The moisture content of SS, SCB, and PMD was based on weight loss from samples stored at 105 °C for 24 h [32,47]. This step-by-step method is shown in Figure 2, and all materials were examined at the Agricultural Machinery Research Centre Laboratory and Postharvest Science Agricultural Engineering, Faculty of Engineering, Khon Kaen University.

2.3. Characterization of Raw Materials

The term bulk density (BD) describes the mass of a substance per unit volume of the substance, taking into account both the material’s mass and the mass of the voids between its particles. The test is carried out by freely dropping the material into a cylindrical container with a known volume of 0.001 m3. Next, the material inside the container was weighed to calculate the bulk density using Equation (1) [33,48].
B D = m v
where BD is the bulk density (kg/m3), m is the mass of material inside the container (kg), and v is the volume of the container (m3)
After processing, the particle size distribution of the processed raw materials was determined using a succession of sieves with varying sieve diameters: 4, 8, 16, 30, 50, 100, 200, 400, and pan (sieve size 4.75, 2.36, 1.18, 0.6, 0.3, 0.15, 0.075, 0.036 mm). The sieve numbers were sorted based on the Canadian series sieve Geometric mean diameter (GMD), obtained using Equation (2) [37].
d g w = l o g 1 Σ i = 1 n ( w i l o g d ¯ i ) Σ i = 1 n w i
where dgw is the geometric mean diameter (mm.), wi is the weight fraction on the ith sieve, and di is the geometric mean diameter of particles on the ith sieve [i.e., (di × di+1)½].

2.4. Proximate and Ultimate Analysis

Proximate analysis is the process of analyzing chemical composition in terms of moisture content (MC), volatile matter (VM), Ash, and fixed carbon (fC) utilizing the determination method outlined in ASTM Standard D5142-04 [49]. The technique for approximating analysis is based on steps from property analysis using a thermogravimetric analyzer (TGA), which examines fC, VM, Ash, and MC [50]. The ultimate analysis is the analysis of elemental components such as carbon (C), hydrogen (H), nitrogen (N), and sulfur (S). The proximate and ultimate testing processes follow ASTM Standard D5373 [51] and can be performed using an elemental analyzer. It is evident from the HHVdb values of all three materials that Table 1 displays the findings of the proximate and ultimate analyses. From examining the HHVdb values, it was found that SCB had higher HHV values than SS and PMD, with values of 17.13, 15.16, and 9.73 MJ/kg, respectively. SCB also has a value similar to SCBpellet (18.96 MJ/kg) [41] but is still lower than wood materials such as furfural residue (22.88 MJ/kg) and sawdust (20.60 MJ/kg) [33]. When considering the lower heating value (LHV) estimation according to Scatolino et al. [52], it can be observed that SS, SCB, and PMD have LHV values of 14.14, 15.82, and 8.98 MJ/kg, respectively.

2.5. Pelletization Experiment at the Laboratory Scale

In this study, the most suitable moisture ratio for pelletizing using a D-type mini-pilot-scale flat-die pellet mill (ZLSP200B D-type Small Pellet Mill, Anyang GEMCO Energy Machinery Co., Ltd., Anyang, Henan Province, China) was determined (Figure 2j). This mill features a die with a 6 mm hole and is powered by a 7.5 hp motor that rotates the mold at a speed of approximately 275 rpm. It also employs rollers driven by friction between the raw material, the mold, and the rollers (Figure 4) [32,53]. The rollers and plate were preheated to about 70 °C before the pelletizing process began. The raw materials are then fed into the pellet mill via belt at a feed rate of 25 kg/h. After that, only the pellets were collected and inspected once the mold temperature reached 70 °C. Additionally, at the end of each test cycle, the remaining raw materials are ejected from the pelletizing channel by feeding dry raw materials into the pellet mill, preparing for the subsequent pelletizing cycle. Subsequently, the pellet mill pauses to allow for natural cooling [53]. The mold’s temperature was measured using an infrared thermometer (C.A. 1950 infrared thermal camera, Chauvin Arnoux). The current pelletizing investigation utilized two kilograms of test material, and its initial moisture content was measured. The moisture content of the test material was then increased to 15, 20, 25, 30, and 35% (wb) using the relationship described in Equation (3) [2].
W w = W s × m f m i 100 m f
where Ww is the weight of the water (g), Ws is the weight of the biomass sample (g), mf is the final moisture content of the sample (%), and mi is the initial moisture content of the sample (%).
The material and moisture in this investigation were mixed using a paddle blender. To condition the moisture before pelletizing, each ingredient was combined individually in a paddle blender with a measured amount of water [2]. After production, the pellets were stored under normal room conditions in the Agricultural Machinery and Postharvest Laboratory Technology Center. Three weeks after the start of the pellet production process, the pellets were characterized [53].
Once the appropriate moisture ratio for biomass pellet compression has been determined, the compression process was tested using all three types of raw materials to produce pellets that meet the standard criteria based on the raw material information in Table 1. Compared to the ISO 17225-6 non-woody pellet standard [54], which sets the LHV value at ≥14.5 MJ/kg, the LHV values of SS and PMD are lower. To achieve standard heating, the relationship between the primary raw materials—SS, SCB, and PMD—was determined using the simplex centroid mixture design approach. Appropriate mixture proportions were then constructed in accordance with Table 2, taking into consideration the thermal properties. Due to the low calorific value of SS and PMD, which makes them unsuitable for direct use, they must be combined with raw materials that have a higher calorific value, especially SCB. Mixing low-calorific-value materials with high-calorific-value materials can result in new materials with improved calorific values. This can be achieved by using a simplex centroid mixture design, as described by Boumanchar et al. [55] and Hwangdee et al. [56], to determine the optimal mixing ratio.

2.6. Pellet Quality Characterization

Pellet density, bulk density, compressive strength, and durability tests were used to assess changes in the physical attributes of pellets induced by the raw material. All tests on the pellet’s physical qualities were repeated three times, and the average value was calculated.

2.6.1. Physical Properties Testing

Pellet Density

The weight of each pellet was measured using a digital scale (AdventurerTM AR2140, Ohaus Co., Ltd., Shanghai, China) that reads 0.0001 g to calculate the pellet density. To ensure that the head surface of each pellet was perpendicular to the pellet axis, both ends of each pellet head were removed. The length of each pellet was measured three times to ensure the pellet core would fit through the Vernier caliper’s tip. Six measurements were taken of the diameter, the first two at either end, the next two at the pellet’s center, and the final two with the pellet turned ninety degrees, maintaining a precision of 0.1 mm. Thirty pellets made at a time served as the basis for the calculation [53,57]. The actual density of each pellet was determined by dividing the mass by the volume using Equation (4).
ρ p = m p ( A p ) ( L p )
where ρp is the unit density of individual pellet (kg/m3), mp is the mass of the pellet (kg), Ap is the pellet cross-sectional area (m2), and Lp is the length of the pellet (m), assuming its cylindrical shape.

Bulk Density

The bulk density of a pellet was determined by freely releasing it into a 1 L container until it overflowed. The excess material was then removed by sliding a ruler across the top of the container. The bulk density of the sample was calculated using Equation (1) [53].

Durability

In the durability test, 500 (±1) grams of pellets were placed in a 300 × 300 ×125 mm box with a 50 × 230 mm plate affixed to the inside surface in a vertical and diagonal orientation. After rotating the box at 50 rpm for 10 min, the pellets were extracted and sieved using a 3.15 mm sieve. The durability index was estimated as a percentage based on mass loss by weighing the remaining pellets on the sieve using Equation (5) [58,59].
D U = m A m B × 100
where DU is the pellet durability index (%), mA is the mass of sieved pellets after the test (g), and mB is the mass of pellets before the test (g).

2.6.2. Mechanical Properties Testing

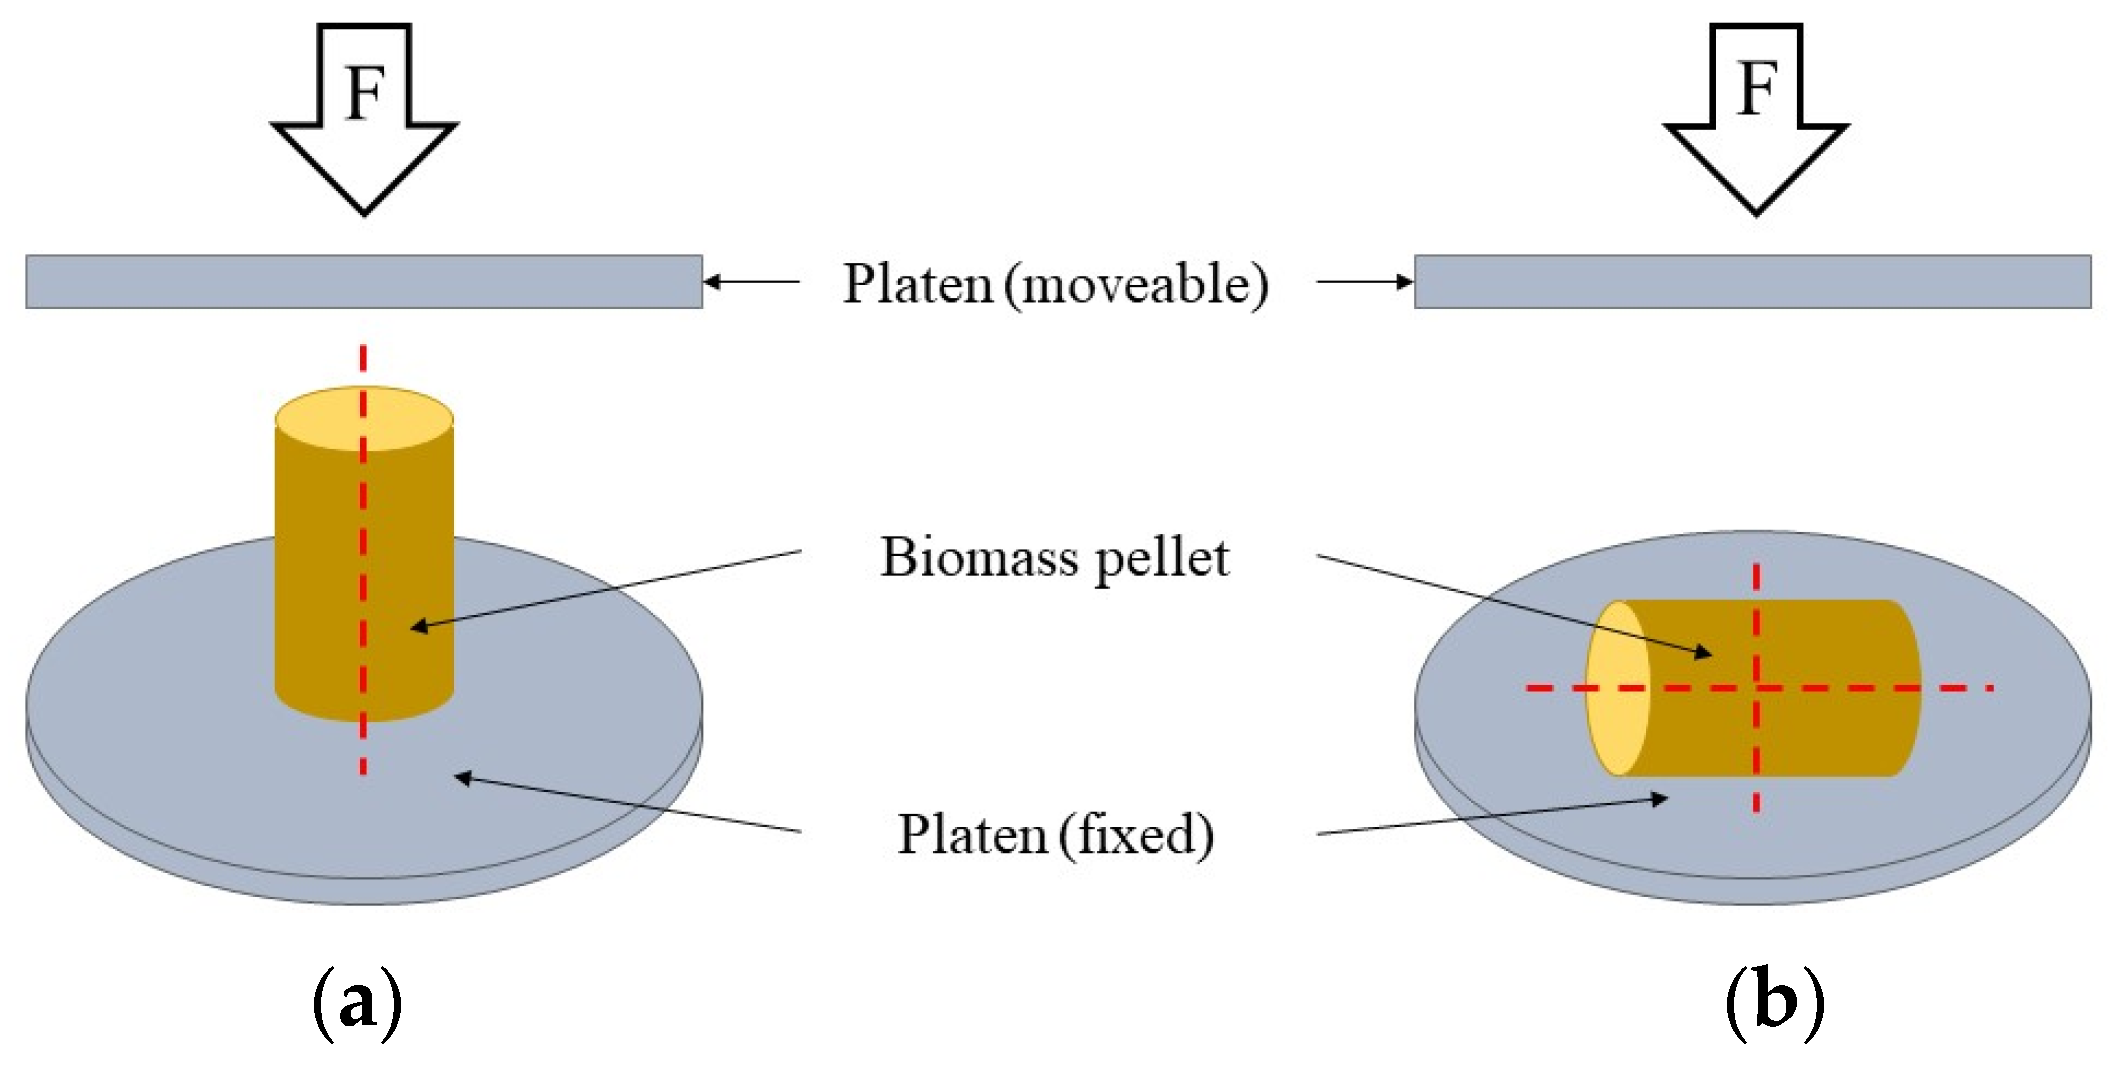
The compressive strength test determined the maximum weight a pellet could support before breaking, indicating its ability to withstand handling, storage, and transportation [60]. Ten pellets of each type were used in this test. Before evaluating compressive strength, the length and diameter of each pellet were measured. The pellet was then placed on a fixed steel plate foundation, and a piston gently descended to crush the pellet positioned axially (Figure 5a) between the two plates at a constant rate of 10 mm/minute. The load at the point of pellet break represented the maximum force acting on the material, causing it to deform (break) with maximum force. The gathered data were used to determine the axial compressive strength in MPa using Equation (6) [59,61].
σ a = 4 P π D 2
where σa is the axial compressive strength of pellets, P is the force at break (N), and D is the pellet diameter (mm)
The diametral compression test (Figure 5b) was an indirect test method for determining the tensile strength of fragile materials. This involved applying pressure to the center along the diameter of a cylindrical material until it deformed. Samples were tested in the same manner as described by Williams et al. [62] and were calculated using Equation (7).
σ d = 2 P π D L
where σd is the diametrical compressive strength of pellets, D is the pellet diameter (mm), L is the pellet length (mm), and P is the force at break (N).

2.6.3. Thermal Properties Test

Net Energy Density

The final powder sample was analyzed for total heating value using an IKA brand model C1 static jacket oxygen bomb calorimeter, following ASTM Standard D5865-04 [63]. After that, its net energy density (NED), which displays the heat of combustion, was determined. Based on the investigations of Yılmaz et al. [59] and de Souza et al. [63], it can be shown that a significant amount of heat was formed by burning pellets on a traditional basis using Equation (8).
N E D = B D × H H V
where BD is the bulk density (kg/m3) of the pellets, and HHV is the high heating value (MJ/kg) on the original basis.
Although the calorific value indicates the quantity of energy in the fuel, ash and moisture content were factors that reduced biofuel efficiency [64]. The fuel value index (FVI) of fuel pellets was computed using Equation (9), taking into account the negative impacts of ash content and moisture [59,64].
F V I = H H V × B D M C d b × A s h C
where HHV is the high heating value (MJ/kg), BD is the bulk density (kg/m3), MCdb is the moisture content of pellets on a dry basis (% (db)), and AshC is the ash content (%).

Specific Energy Consumption and Energy Ratio

The amount of energy required to pelletize a one-unit mass of pellets is known as specific energy in this context. It is helpful for manufacturers to select the most effective pelletizing technique when considering the elements influencing a given energy [53,65]. Equation (10) defines the process’ specific energy consumption.
S E C = Q m
where SEC is the energy consumption of the process (Wh/kg), Q is the total power used that the power recorder has captured (Wh), and m is the mass produced (kg).
The energy consumption of the chaff cutter machine, hammer mill, rotary dryer, and pelletizing machine was measured with a multimeter (AC/DC RMS + W Clamp meter, Chauvin Arnoux). The values were captured on video. After that, the measured electrical energy data were entered and calculated to determine the various parameters.
The energy ratio (ER) is the ratio of energy gained from pellets to energy used to make the pellets, as estimated by Equation (11) [53].
E R = L H V S E C p
where LHV is the lower heating value of the pellets (MJ/kg), and SECp is the specific energy consumption of the process (MJ/kg).

2.7. Statistical Analysis

The initial analysis of the biomass pellet manufacturing characteristics was performed using the analysis of variance (ANOVA) approach. All datasets were checked for normality and variance homogeneity assumptions, and they were processed as required to maintain regularity. The F-value in ANOVA was used to determine the significance level of the null hypothesis. Different superscripts were used to indicate that the parameter’s value was statistically significant, while the same superscript implied that the value was not. In this study, the least significant difference (LSD) test was employed to determine how substantially the dependent variables differed.

3. Results and Discussion

3.1. Raw Material Preparation

The results of the study on SS and SCB material preparation (size reduction) are shown in Table 3. Using a four-blade chaff cutter machine for SS shredding, the specific energy consumption (SEC) was found to be 4.01 Wh/kg. The size reduction in SS (Figure 2g) and SCB (Figure 2h) using a swinging hammer mill with a sieve hole size of 5 mm resulted in SEC values of 36.53 Wh/kg and 25.80 Wh/kg, respectively. The size reduction in both materials is necessary because their initial characteristics are unsuitable for direct pelletizing. The optimal size for pelletizing is a diameter not exceeding 5 mm. However, an excess of material smaller than 0.5 mm in the raw material negatively impacts both friction and pellet quality [66,67].
The SEC was 894.16 Wh/kg after the PMD drying process (Figure 2i), which used a rotary dryer with a drum rotation speed of 5 rpm, an inlet air flow of 1 m/s, and a drying air temperature of 150 °C. Consequently, controlling the size and quality of materials during the preparation and pelletizing process is critical to producing high-quality and stable products that are acceptable for practical usage.
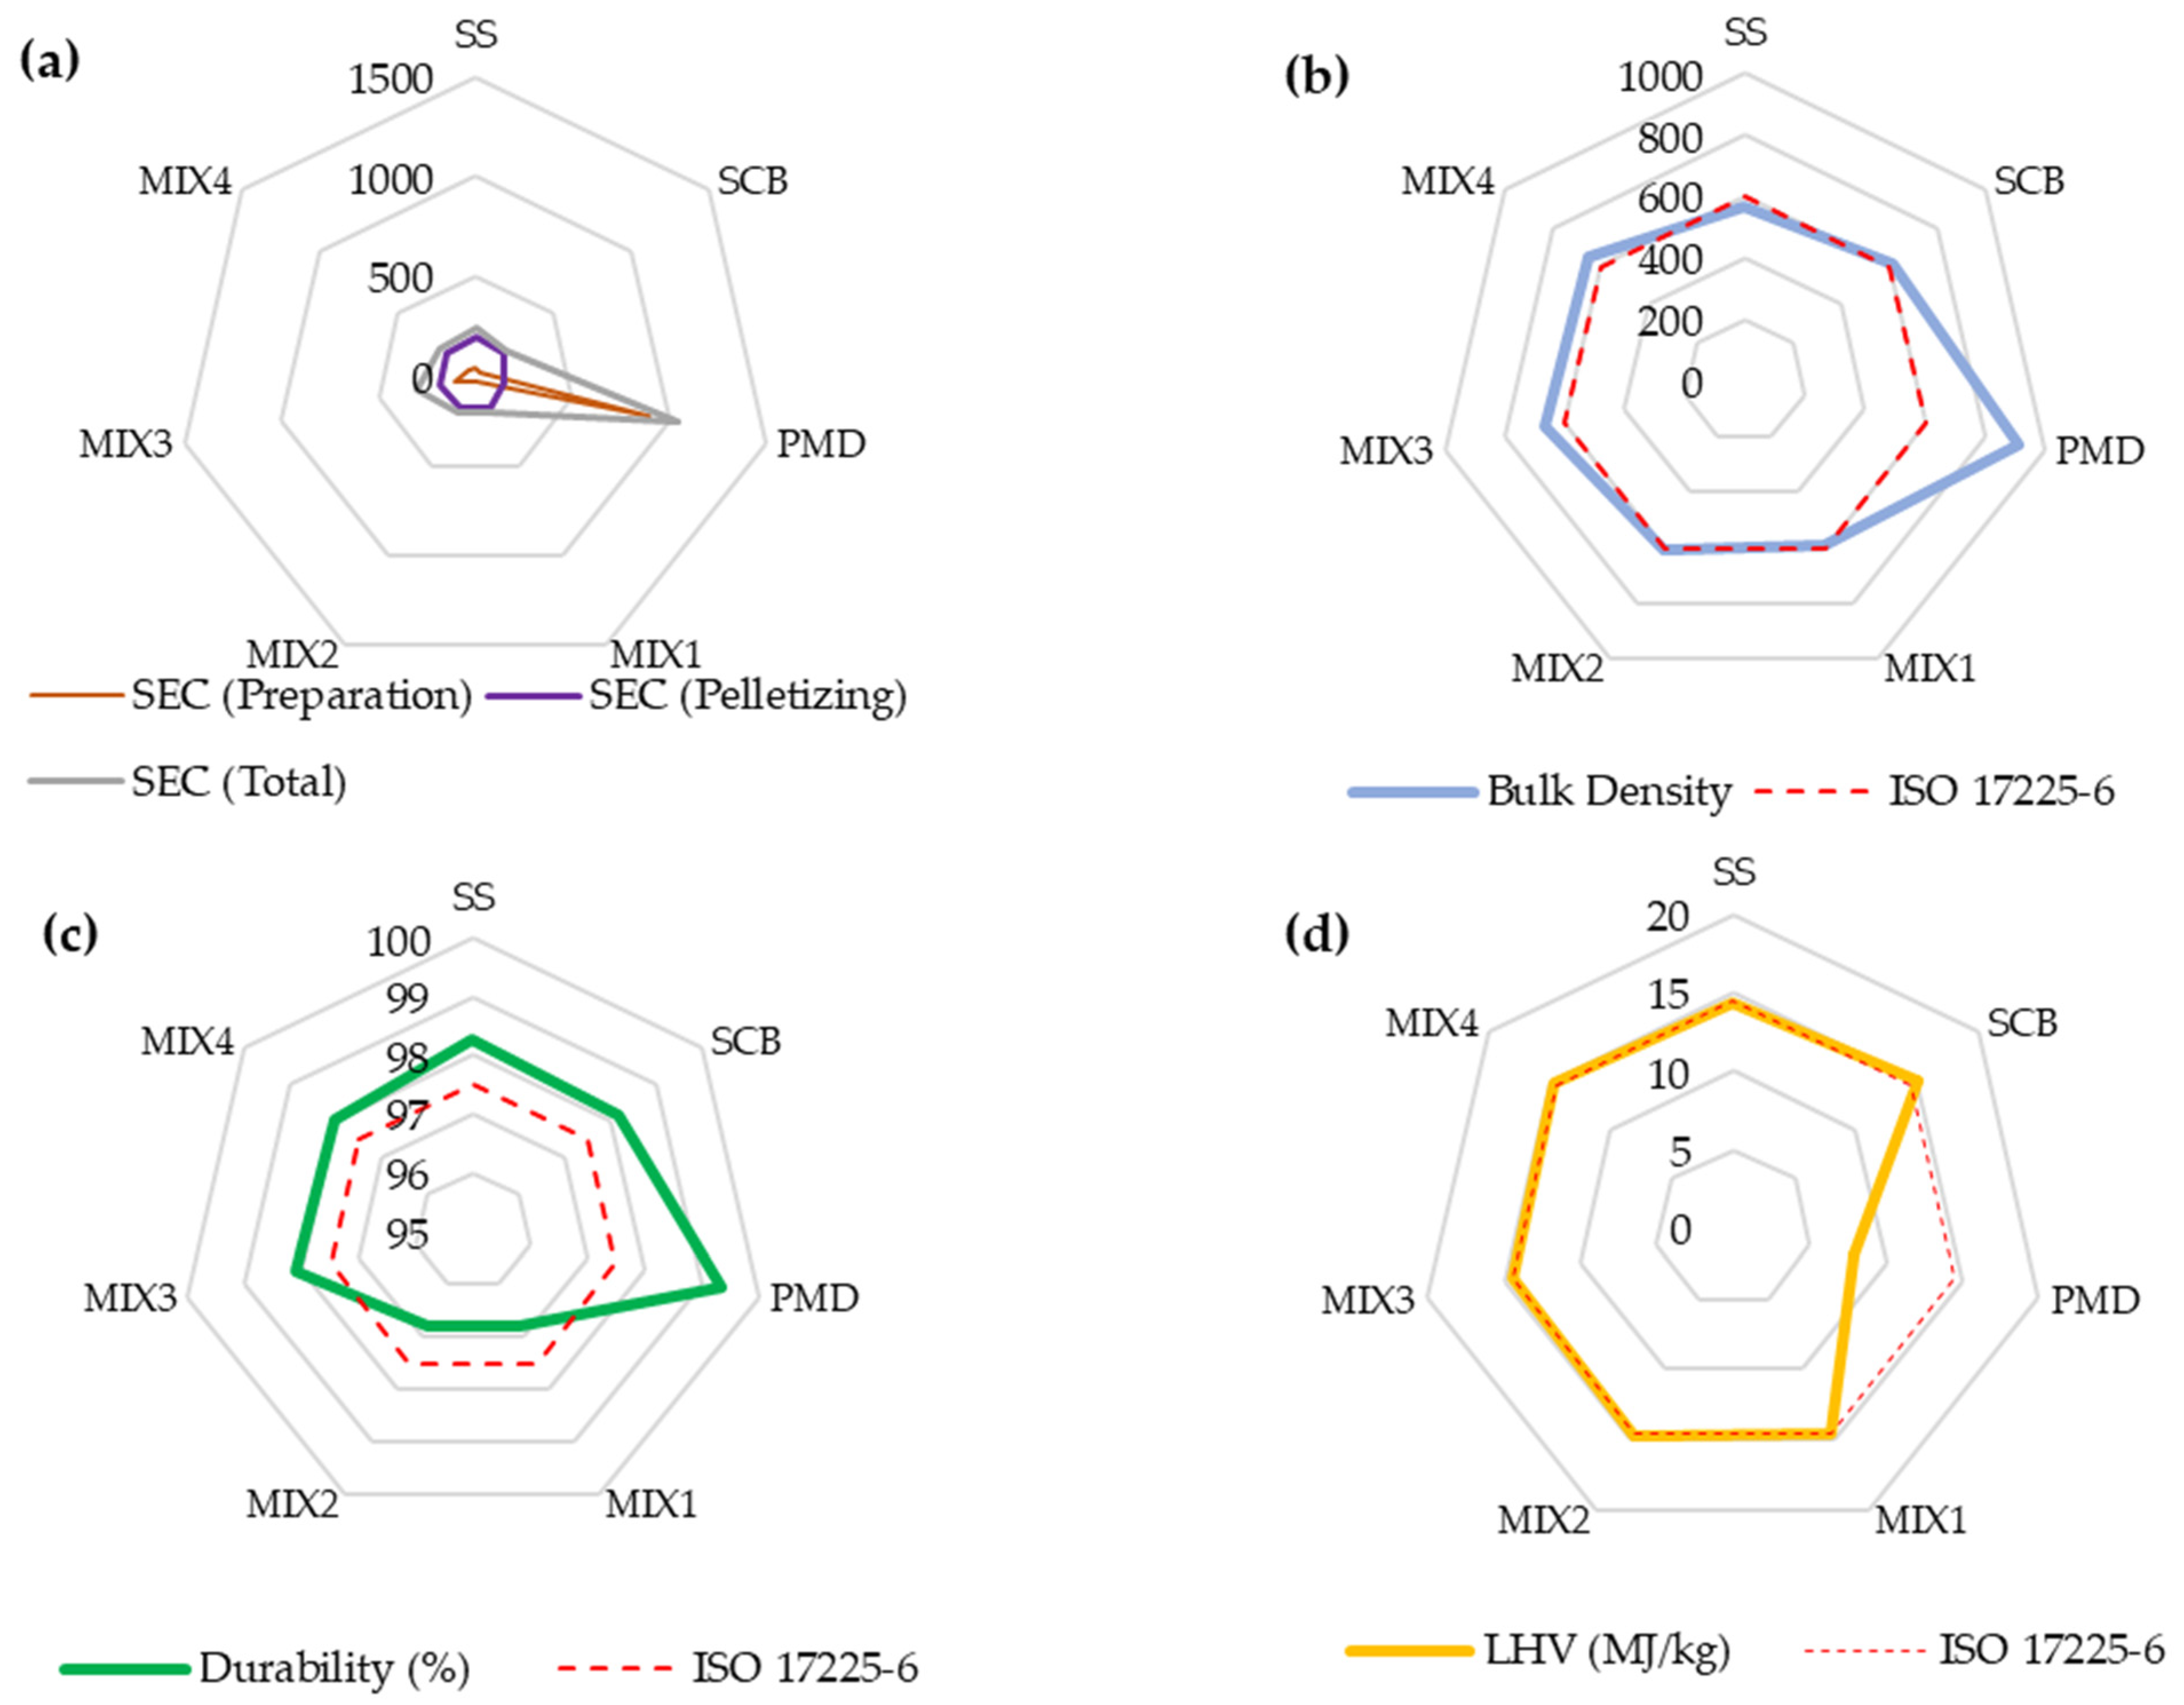
The uniform particle size distribution of the raw material is critical for pelletizing efficiency. Raw material with a uniform particle size is easier to extrude than raw material with an irregular particle size. This is because particles of similar sizes are more tightly packed, resulting in higher density and durability [59,68]. In Figure 6, the bulk density, geometric mean diameter, and particle size distribution of the raw material are displayed. Among all particle sizes, PMD is shown to be the smallest, with 75.86% of all particle fractions smaller than 1.18 mm. Values ranging from 48.41% to 75.08% differed for SS, SCB, and blended materials with diameters less than 1.18 mm. When comparing the GMD values of the raw materials in Figure 6, it was discovered that SS (1.02 mm) had a greater GMD than PMD (0.54 mm) and SCB (0.75 mm), respectively. This agrees with the bulk density figure, which shows that PMD (264.87 kg/m3) has a bulk density that is higher than that of SS (44.07 kg/m3) and SCB (77.88 kg/m3), respectively. The material’s density is lowered because of the increased space between the particles caused by the bigger material size. Conversely, materials with smaller particle sizes have higher bulk densities because they can more easily fill the voids. The bulk density and GMD values are the same for MIX1 (20% SS + 80% SCB) composites, at 0.90 mm and 63.03 kg/m3, respectively. The bulk density and GMD values for the composite material MIX2 (10% SS + 90% SCB) were 0.94 mm and 66.8 kg/m3, respectively. It can be observed that when the mixture has an increased amount of SS, the density will decrease. A possible reason for this situation is that the material’s long, thin, needle-like structure (Figure 2g) affects the passage through the sieve holes during sieve analysis, resulting in large material residues between the sieve layers [59]. PMD mixtures with small particles and high bulk density are MIX3 (90% SCB + 10% PMD) and MIX4 (5% SS + 93.5% SCB + 1.5% PMD). In comparison to MIX1 and MIX2, the bulk density and particle size of MIX3 and MIX4 consequently increased. Therefore, it can be said that the smaller the GMD of the particles, the higher the biomass density. This is because the smaller the particle size, the greater the force of attraction between the particles. This causes the particles to tend to come together and gather in this area, resulting in an increase in biomass density [47,69]. However, a uniform particle size distribution in the raw material is critical for effective compaction properties. The small particles fill the gaps between the larger particles, giving the material its high density and durability. The material has great density and endurance because small particles fill the spaces left by larger particles [59,70]. According to Kaliyan and Morey’s [35] recommendations, the ideal biomass geometric mean for pelletizing should fall between 0.5 and 1.00 mm in diameter.

3.2. Finding the Appropriate Moisture Content for SS, SCB, and PMD Pellets

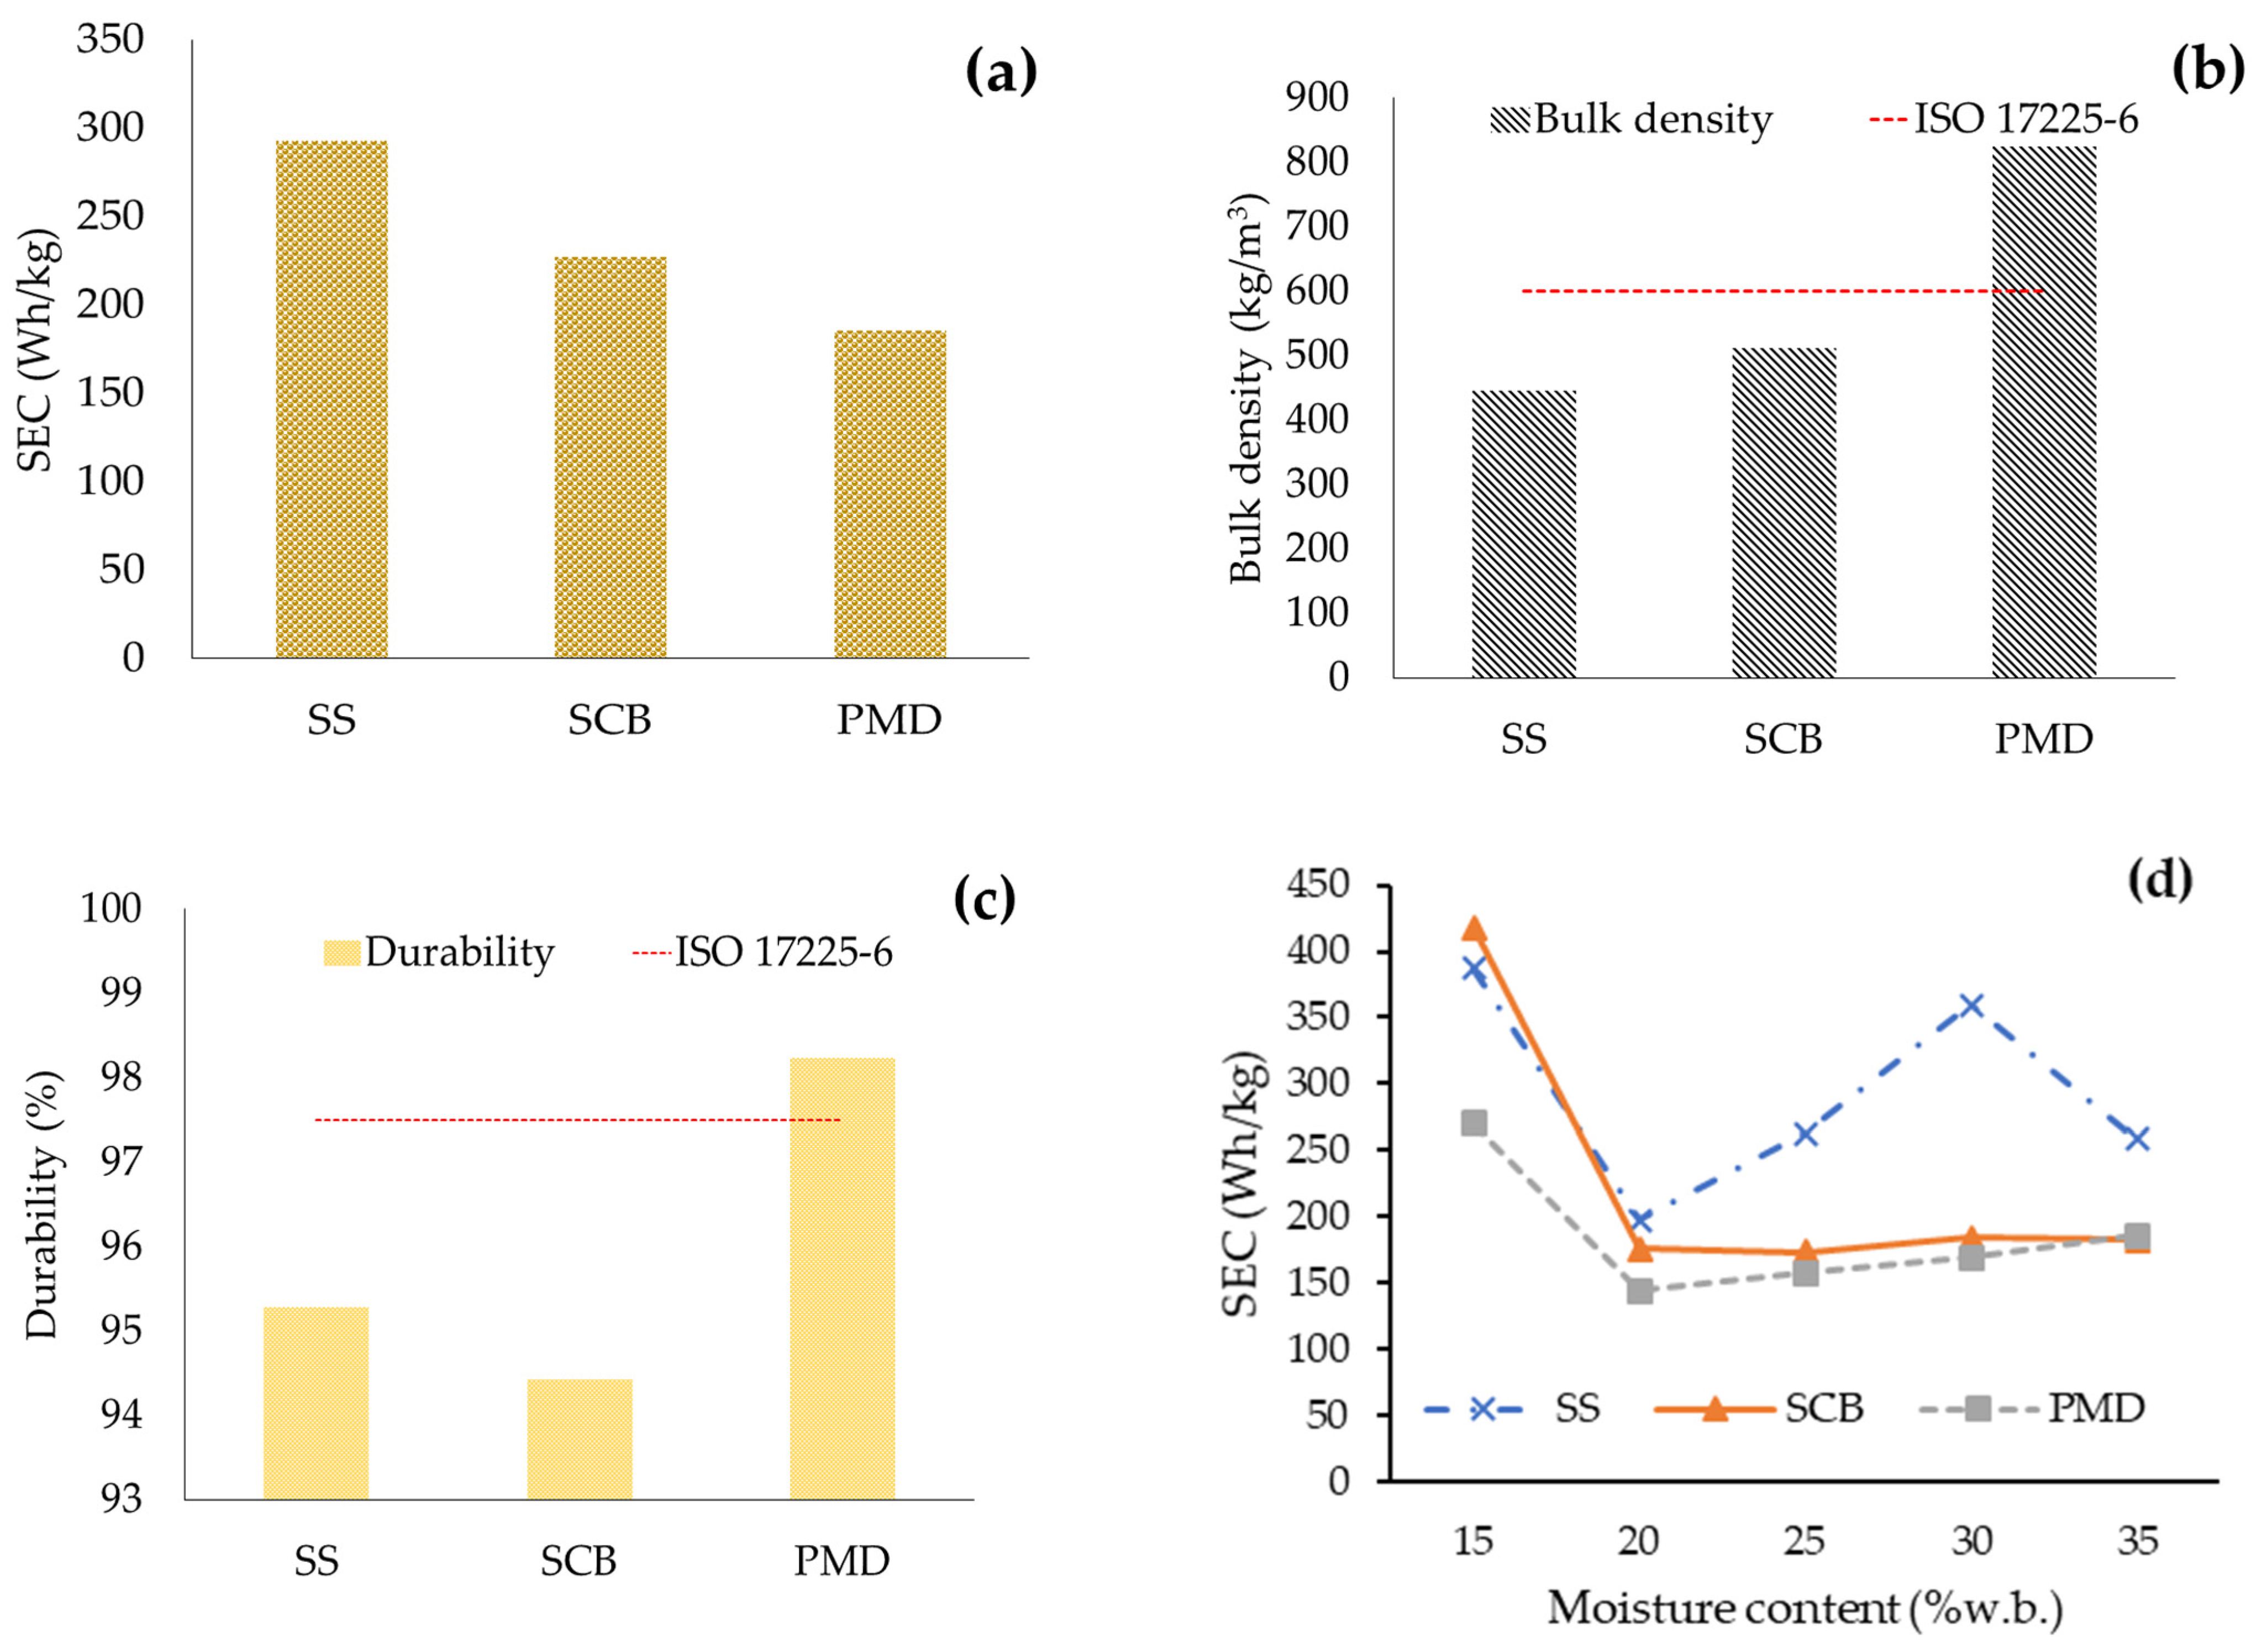
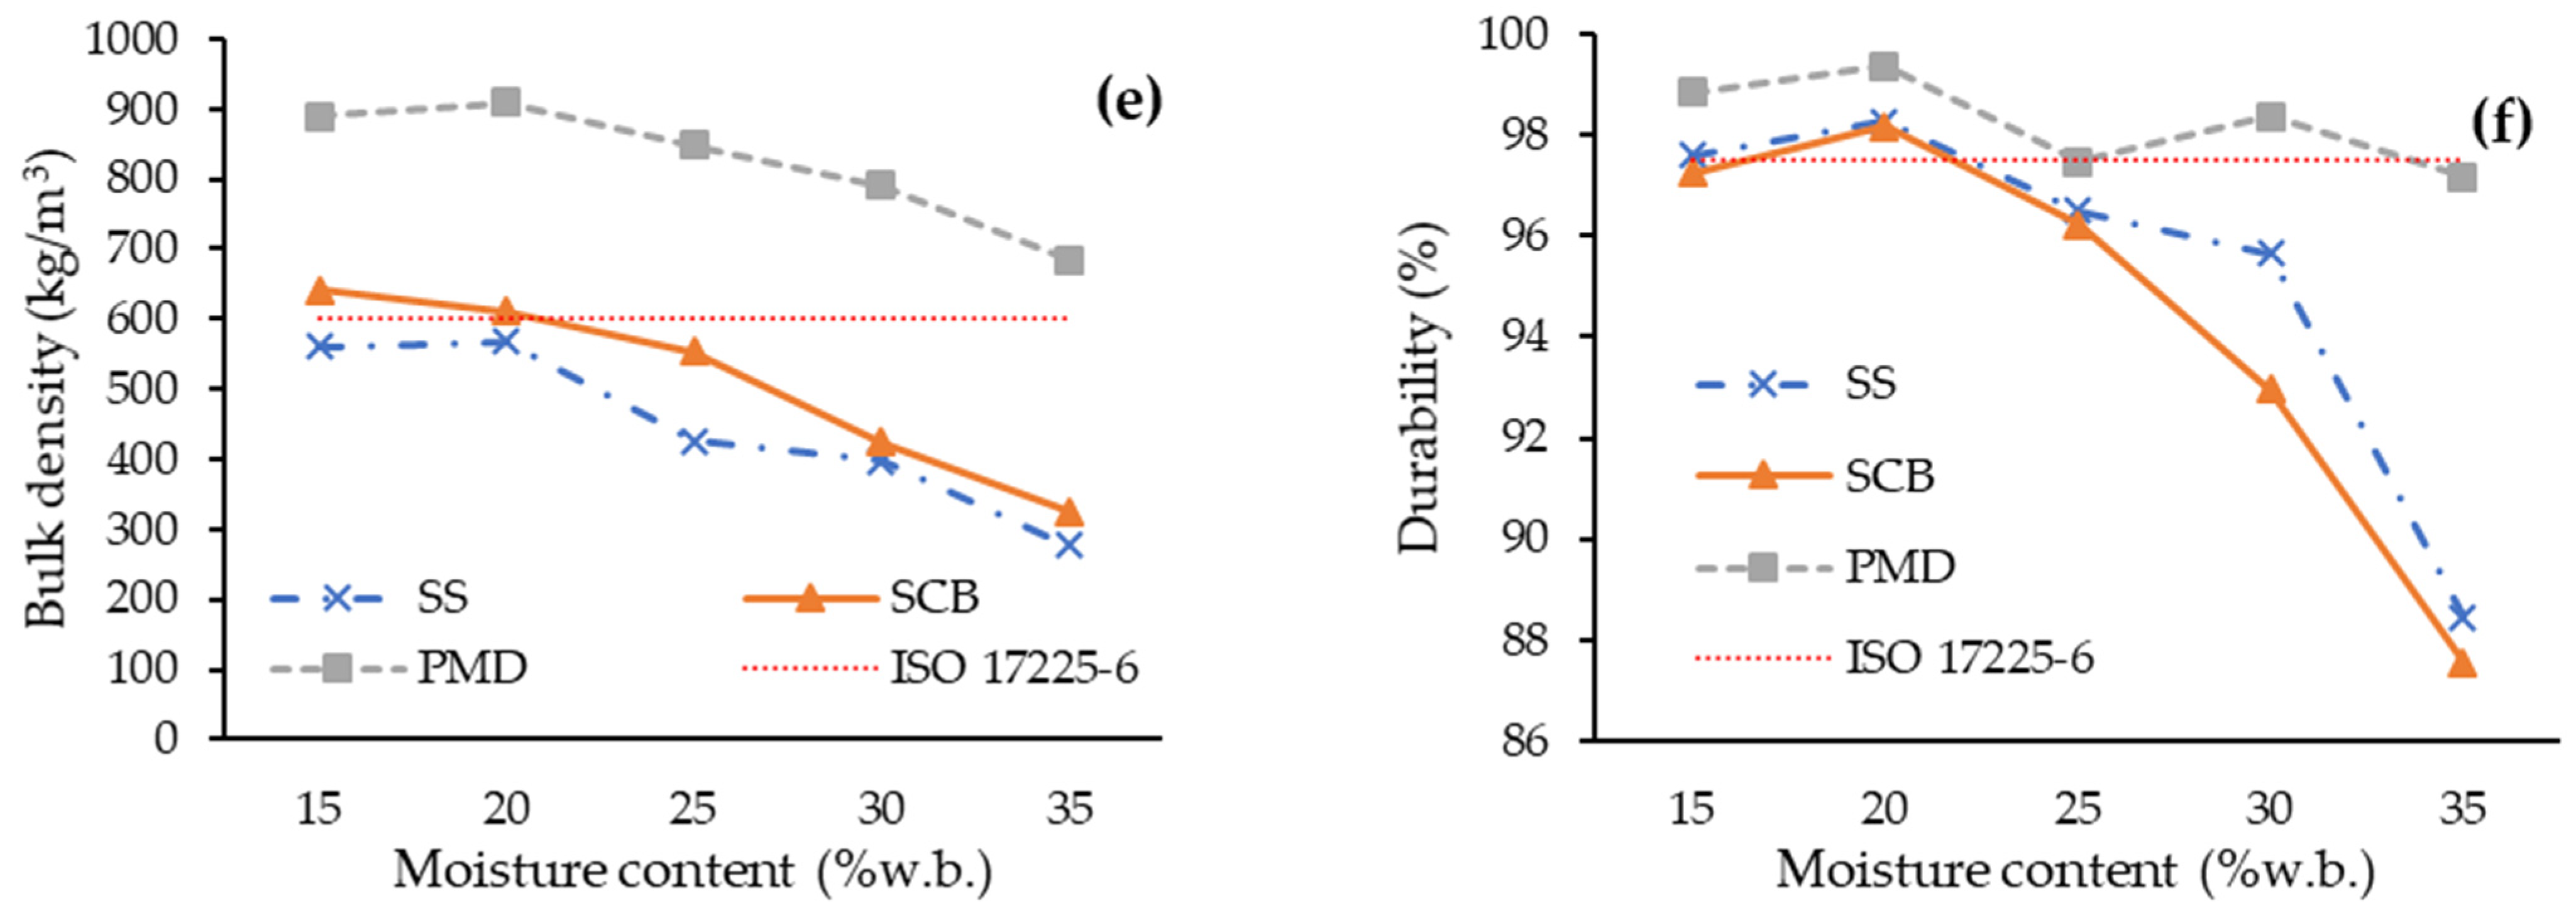
Determining the proper moisture content in pelletizing is an important step in the pellet production process. To produce quality and consistent products that meet the required standards, the impact of material type (ToM) and moisture content on SEC, bulk density, and durability must be investigated. This study considers SS, SCB, and PMD materials with moisture contents ranging from 15, 20, 25, 30, and 35% (wb). This study’s findings revealed that the material type caused all results to be statistically different at the 99% significance level, while the moisture content brought about statistically significant differences in specific energy, bulk density, pellet density, and durability. When investigating the relationship between material type and moisture content, it was discovered that the relative interaction of the two variables had no statistical influence on specific energy. However, at the 99% confidence level, bulk density and durability differed significantly. Based on Table 4, there is a statistically significant difference in the type of material and moisture content that influences the specific energy value. As illustrated in Figure 7a, PMD material has the lowest specific energy consumption at 185.39 Wh/kg, followed by SCB at 226.90 Wh/kg and SS at 293.23 Wh/kg. Furthermore, it is noted that of the three materials adjacent to PMD, SCB and SS have the smallest particle sizes (Figure 8). As stated by Stelte et al. [71], pellet formation is facilitated by larger particles because they provide stronger bonding forces than between smaller particles. Regarding the moisture content component (Figure 7d), it was discovered that the lowest specific energy use, 172.70 Wh/kg, was at 20% (wb). The moisture content at 25% and 35% (wb), which can be split into two phases, was next. From 15% to 20% (wb), the moisture content rose, but the specific energy tended to fall. Additionally, because the specific energy used in pelletizing is correlated with the material’s moisture content, the rate of usage of specific energy increases when the material’s moisture content exceeds 20% (wb). The rate of specific energy in pelletizing will increase as the moisture content of the material is related to the specific energy in pelletizing. When the moisture content increases, the specific energy for pelleting also increases [66]. This is because water increases the bonding force between material particles, making pelleting more difficult. But in cases where the moisture content is appropriate, water will act to reduce friction within the compression hole and result in low specific energy [72]. However, the particular circumstances and characteristics of the material being processed determine the impact of moisture content on a given energy consumption [73]. These outcomes align with the findings of Laloon et al. [32], which revealed that the ideal moisture content range for eucalyptus bark pellets is between 17.69 and 20.21% (wb).
When considering the type of material and some properties of biomass pellets (Figure 7b,c), it was found that the bulk density of PMD (824.49 kg/m3) was the highest. The same is true for durability (PMD has a value of 98.24%), which from the EN ISO 17225-6 standard [54] makes PMD have values within the criteria of both indicators. Meanwhile, SS and SCB must be improved to be more suitable for compression into biomass pellets. From Figure 7e,f, it was found that as the moisture content increased, the pellet bulk density and durability decreased similarly. This is consistent with Table 5, where only moisture ratios of 15% and 20% (wb). have a bulk density of not less than 600 kg/m3 and durability of not less than 97.5%. This is because water can penetrate between the pellet particles, preventing the particles from holding together tightly. Particle packing occurs, resulting in an increase in volume. Moreover, the mass of the material remains the same, resulting in a decrease in bulk density [74]. Similarly, loose adhesion of particles reduces durability, which is consistent with Koullas and Koukios [75], as they found that the water in wheat straw promotes adhesion and strengthens the material. Nonetheless, if the biomass feedstock has an excessive level of moisture, water will function as a lubricant. Subsequently, during the pellet production process, there is less adhesion and more dust generated. In line with Tumuluru [66], non-durable pellet materials have the potential to shatter and release dust, which could result in safety concerns such as fire hazards from spontaneous combustion. The conditions created by this kind of combustion can produce more harmful gases and necessitate frequent cleaning and repair of production machinery and equipment; thus, an ideal environment is not necessary. Along with the possibility of lost revenue for producers, this could result in higher maintenance and repair expenses. Table 6 presents the moisture ratings for biomass pellets in terms of production efficiency and various physical qualities. The optimal moisture content can be determined by referring to the letters in Table 5. Ultimately, the moisture content of the material, 20% (wb), was the highest score in this test. For pelletizing, an ideal moisture content level for the material ranges between 15 and 20% (wb). Elevated moisture content levels will result in an excessive amount of moisture in the pellets, which will lead to their degradation and loss of quality [32,47]. Numerous previous studies do not recommend a starting moisture content of more than 30% since this will lead the pellets to become distorted and more prone to breaking [30,32,33]. Because of this, all of the materials employed in the current study require a starting moisture content of 20% (wb) before they are made into pellets.
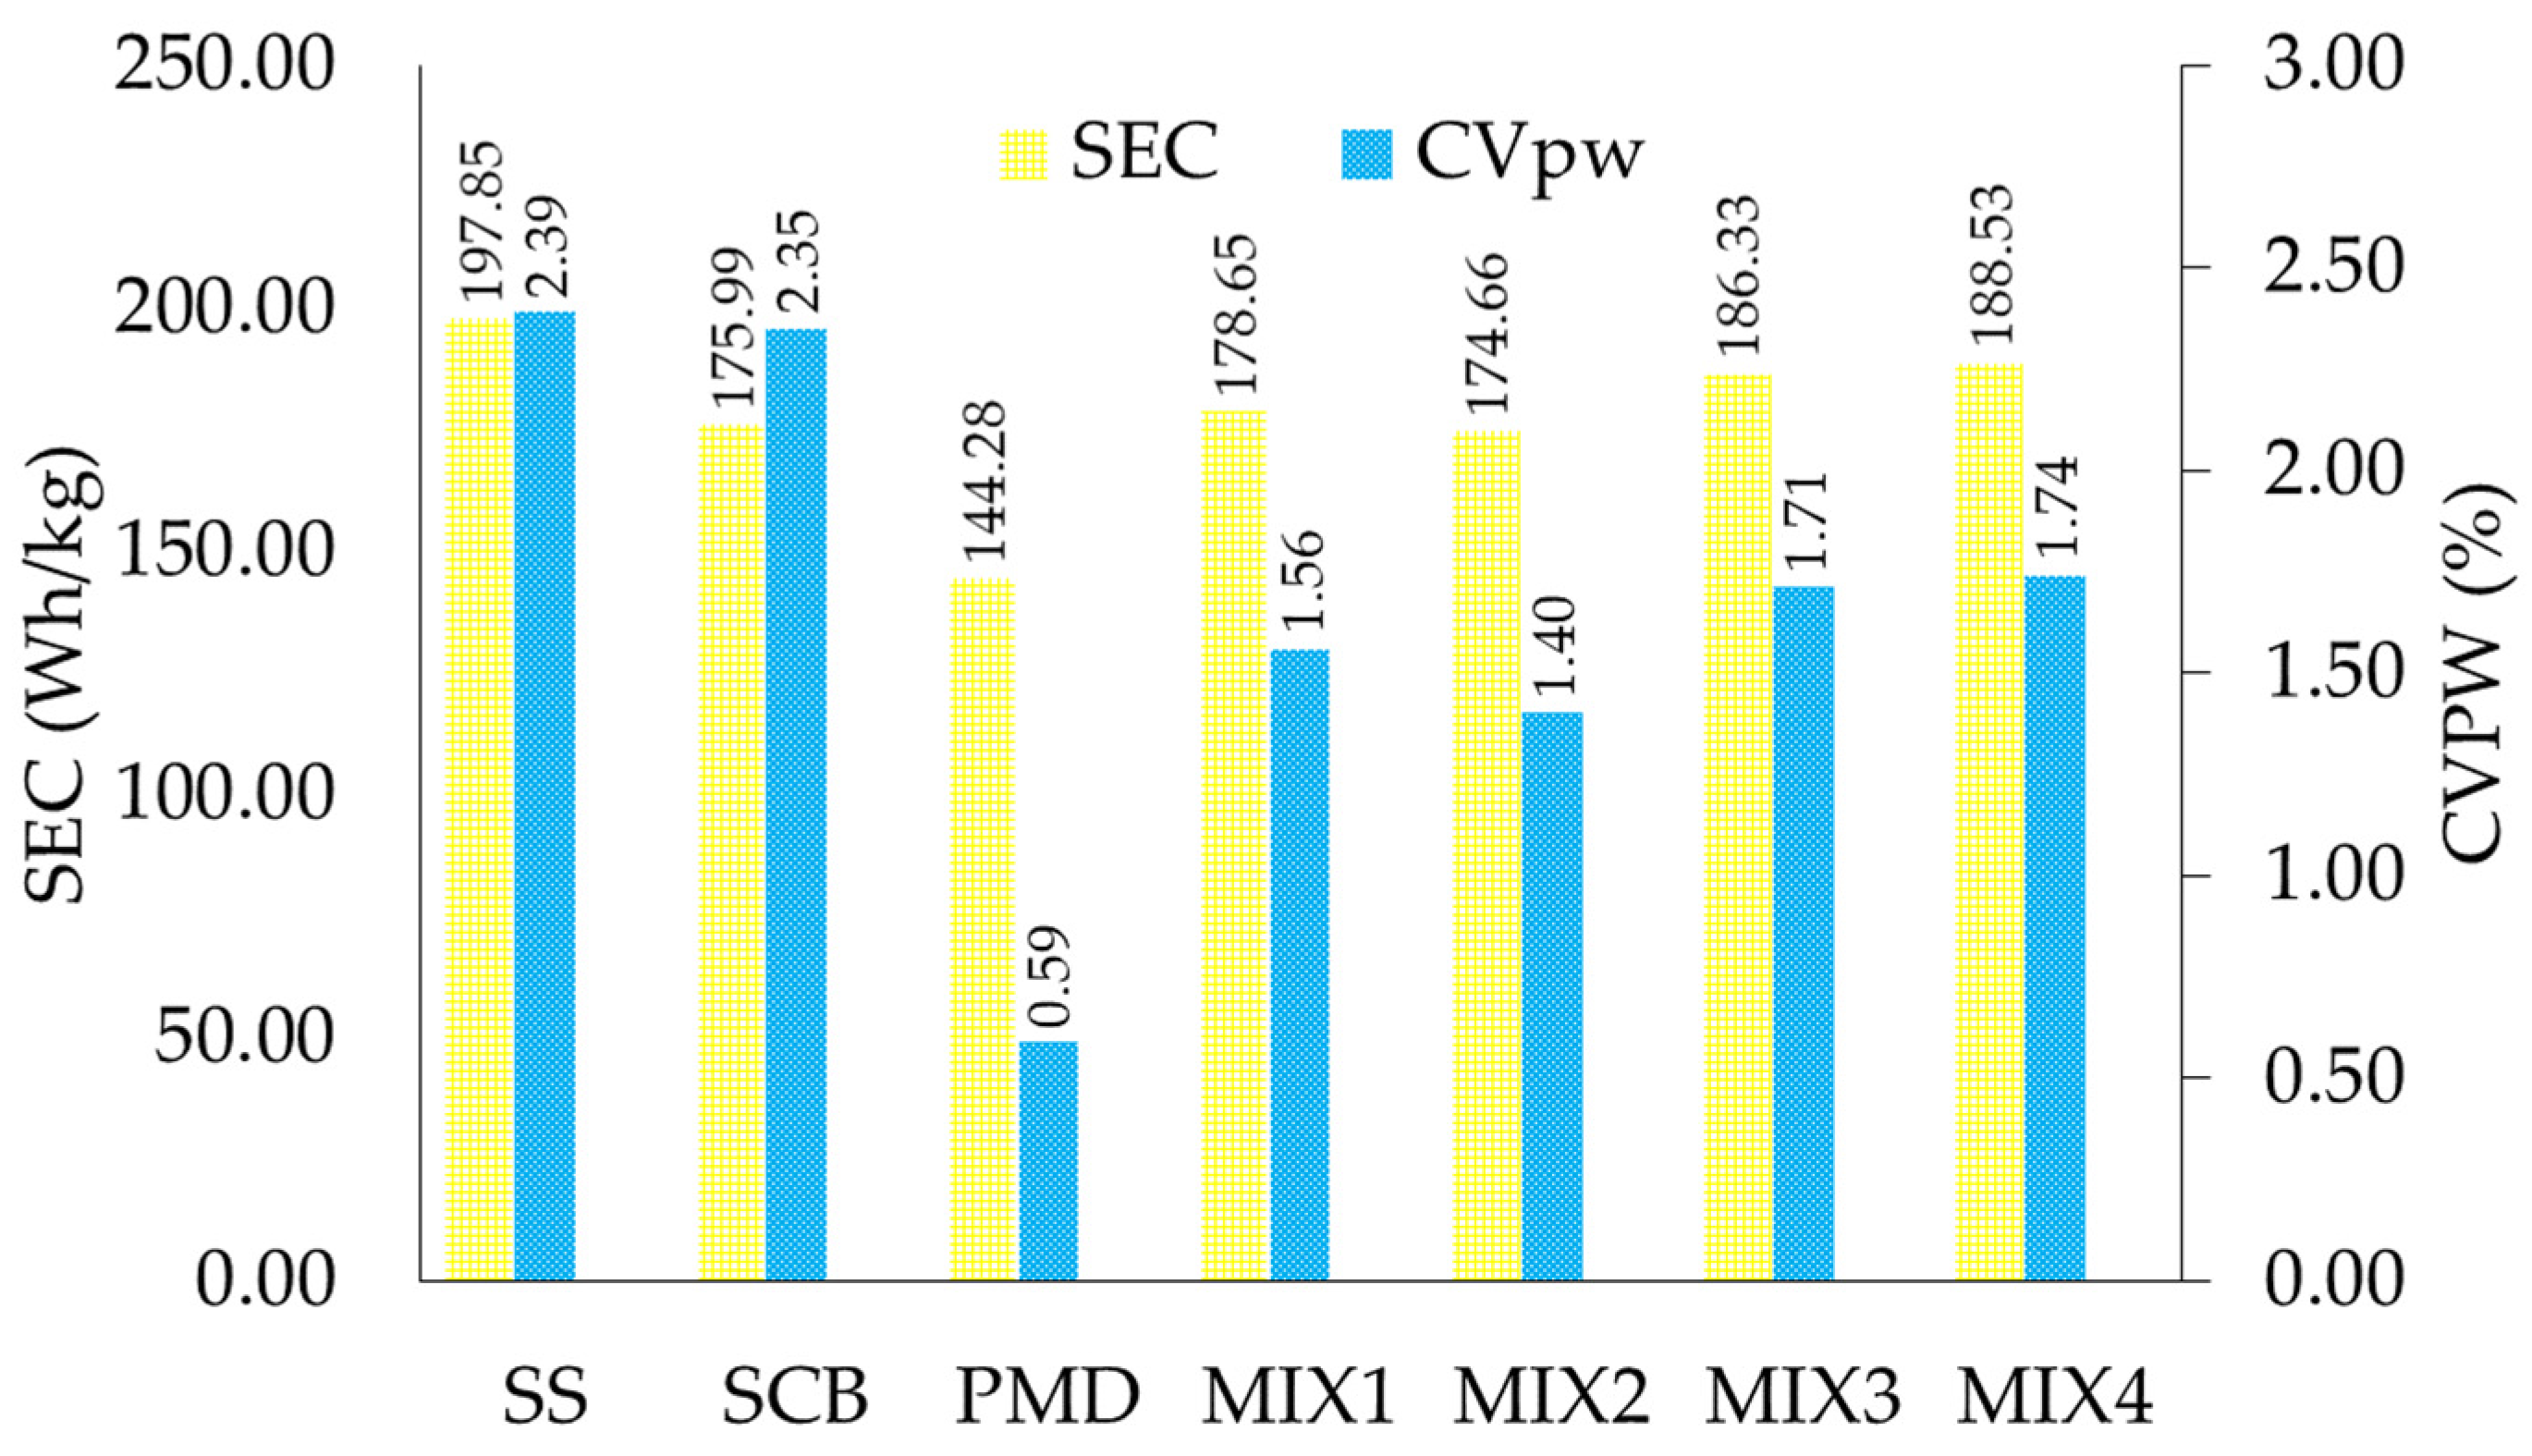
Owing to the findings of the study on the optimal moisture content for biomass pelletizing of SS, SCB, and PMD, the moisture content of the test materials (mixed proportions MIX1, MIX2, MIX3, and MIX4) was increased to around 20% (wb) (Equation (3)). Figure 9 presents an example of biomass pellets obtained by determining the appropriate mixing proportions for developing SS, SCB, and PMD as biomass pellets using the simplex centroid mixture design method. The electrical power consumption during the pelletizing process was measured after the pre-pelletization stage, during continuous material feed into the pellet chamber. This consistent material feed prevented any interruptions in the pelletizing process. The power consumption for the different materials was ranked as follows: SCB (3.28 kW) > SS (3.21 kW) > PMD (3.19 kW) > MIX3 (3.16 kW) > MIX4 (3.12 kW) > MIX1 (3.09 kW) > MIX2 (3.08 kW) (Figure S1 and Table S1). In the biomass pellet production process, although the materials exhibit a wide range of physical properties, the process proceeds smoothly. Materials with high density and irregular sizes require higher compression forces. Smaller particles have a greater total surface area, allowing pressure to distribute evenly and reducing resistance during pelletization. In contrast, larger particles have a smaller surface area, causing uneven pressure distribution and necessitating higher compression forces, which leads to variations in motor energy consumption. For materials with uniform particle size and a soft structure, energy consumption remains consistent, preventing unexpected motor loads [57,74]. In Figure 10, PMD has the lowest specific energy consumption in the pelletizing process (SEC = 144.28 Wh/kg), and the lowest coefficient of variation (CVPW) of the average power during PMD pelletizing is also the lowest at 0.59%. The energy consumption fluctuation and coefficient of variation in energy consumption for MIX1-MIX4, which are composite materials, range between 174.66–188.53 Wh/kg and 1.40–1.74%, respectively. When comparing materials with big and small average particle sizes, materials with a small average particle size are more prone to compaction. There is less friction between microscopic particles since they have a bigger surface area per volume. It is, therefore, simpler to pack the particles together because they move more freely and do not scrape against one another as much. Materials with a small average particle size, therefore, typically require less compressive force during pelleting, resulting in a lower energy consumption [32,76]. The biomass pelletizing pressure also rose as the size of the biomass particles increased, in which the biomass particle size with the smallest particle size had the highest compaction and the lowest pelletizing pressure. These results were consistent with those reported by Gil et al. [77] and Nielsen et al. [78].
The impact of several pellet material types (SS, SCB, PMD, and MIX1-4) on different indicators (Table 7), such as SECpelletization, bulk density, pellet density, diameter, thickness, length, and weight, could be seen. The bulk density, pellet density, diameter, length, and weight were found to be statistically different at up to 99% confidence level, depending on the type of material. Nonetheless, the specific energy required for pelletizing was not considerably impacted by the material type; the coefficient of variation (CV%) for SECpelletization, bulk density, pellet density, diameter, length, and weights were 17.89, 3.08, 0.66, 7.82, 2.51, 15.28, and 17.45%, respectively. The significant rise in the energy consumption variation coefficient in SS and the high specific energy consumption are clearly visible in Figure 10. The material’s rheological characteristics and the distinct behavior of the particles during the compaction process may have deteriorated due to the SS (197.85 Wh/kg) and its larger GMD compared to other samples [79]. A further explanation for the high specific energy used in the pelletizing process is the thin, needle-like shape of the SS left behind from the partial reduction process, which is longer than the holes in the compression plate. In the process of pelletizing long sugarcane leaf powder, greater compression force is required to try to push out the SS with the characteristic length into the hole when the powder is pressed into a compression plate. This leads to higher SEC because the part longer than the diameter of the hole cannot be pressed into the hole immediately [59]. Due to its finer powder structure and greater dispersibility, SCB (175.99 Wh/kg) uses less specific energy than SS, causing swings in energy use and a lower coefficient of variation in energy usage (CVPW) than SS. In comparison to SS, SCB, and PMD, the energy fluctuation and energy conversion coefficient for the composites in samples MIX1–MIX4 are similar. Pelletizing is made easier by a broad range of particle sizes (Figure 8), which includes both big and small particles [59]. Nonetheless, it was discovered from Figure 10 that the fuel pellets manufactured from SS had the highest average specific energy (197.85 Wh/kg), followed by PMD (144.28 Wh/kg) and SCB (175.99 Wh/kg). According to MIX1-4, the average specific energy value between SS and SCB shows that there is no difference in the specific energy required for pelletizing each type of material. This could be because pelletization efficiency is influenced by the raw material’s particle size. Put another way, larger particles disperse and bond more readily than tiny particles, which have a greater surface area in contact with air. Pellets will be uniformly shaped when the particles are evenly distributed and tightly bound together. Hard and coarse biomass particles enhance energy consumption during compression by creating significant friction forces in the pellet mold, according to Tumuluru [2]. Additionally, it has been found that combining different biomass with sludge that has simple pelletizing properties can lower the energy requirements for pelletizing [80]. Based on the impact of particle size on the pelletizing process, it is possible to conclude from the previously mentioned evidence that an extensive particle size distribution improves pelletizing efficiency [35,59,81].

3.3. Physical Properties of Pellets

3.3.1. Diameter, Length, and Weight

Pellet size has an impact on their combustion efficiency, in which it is believed that long pellets burn less efficiently than short pellets because they have a smaller surface area. As a result, there is less airflow, which makes it difficult for the air to fully transmit heat and oxygen to the fuel pellets. This leads to incomplete combustion, a significant amount of waste gas, and a lengthy combustion period. Consequently, incomplete combustion takes longer and produces more waste gases [59,82,83]. When the pellets were examined, it was discovered that the proportions of MIX1 (16.69 mm) were shorter than the other types of pellets, with a statistically significant variation in pellet lengths (Table 7). The length of pellets in different proportions ranged from 20.40 to 23.46 mm (Table 8), with PMD having the longest length of all proportions. The larger particle size of MIX1, which contains 20% SS and 80% SCB, can reduce the pelletization of the material, resulting in an erosion in continuity during the pelletizing process. Furthermore, the length of the pellet rose from 16.69 to 20.91 mm upon witnessing the usage of a lower proportion of SS and a higher amount of SCB (MIX2) in the proportion of SS 10% and SCB 90%. Conversely, decreasing the distance between the blade and compression plate allows the pellet length to be shortened in order to increase efficiency. According to Table 9, the diameter of PMD varies with respect to various material types, measuring less than the compression hole at 6 mm. The smallest size is equivalent to 5.77 mm, which is typically the diameter of biomass pellets. Its size is comparable to the size of the pellet hole, but it could be lower because the biomass raw material has smaller, more uniform particles than other materials, which results in a smaller diameter for the biomass pellet. Upon examining the compression and extrusion procedure, particularly in the context of pelleting, it becomes evident that the biomass feedstock is shredded and pushed via a perforated hole in the machine. The material is broken down as a result, taking on the shape of pellets. The biomass material is ground up by friction and pressure throughout this process, resulting in a decrease in the diameter of the pellet relative to the compression hole [84]. Typically, biomass pellets have a cylindrical shape. When weighing biomass pellets, PMD has the highest average weight per pellet (0.95 g/pellet), whereas the weights of the remaining components range from 0.50 to 0.74 g/pellet. The powdered raw material’s particle size is one element that influences the weight of biomass pellets. Overall, smaller powders have a higher contact surface area compared to bigger powders (PMD). Smaller powders can more easily link together than larger powders since they have the smallest particle size of any material. Due to this factor, incorporating the raw powder’s overall density, the biomass pellets containing smaller powder weigh more than the pellets including larger powder. Thus, according to Picchio et al. [84] and Yılmaz et al. [59], the weight of the biomass pellet grows proportionally to the volume of the powder, depending on the particle size. Because smaller particles can cover gaps better, biomass pellets have a higher density and weight. Large particles, on the other hand, have much space between them, which causes poor compaction, resulting in biomass pellets with a low density and weight.

3.3.2. Pellet Density and Bulk Density

Table 8 shows the average pellet density and bulk density for each test variable. Pellet densities ranged between 925.65–1543.87 kg/m3 and 567.12–908.53 kg/m3. The ANOVA analysis revealed that the type of raw material produced a significant statistical difference between pellet density and bulk density (Table 7), with PMD having the greatest value for both indicators. One possible explanation is that PMD’s small particle size allows it to be more closely packed together, as well as the consistency of particle size distribution in the material, resulting in high-density pellets.

3.3.3. Durability

Biomass material type has a significantly varied effect on durability (Table 7). Table 8 demonstrates that biomass pellets had values ranging from 96.78 to 99.36%, with PMD having the highest durability value (99.36%), while SS, SCB, MIX3, and MIX4 had comparable values (98.04–98.26%). In terms of mixture proportions, MIX2 and MIX1 have the lowest but comparable durability values of 96.78 and 96.80%, respectively. Kirsten et al. [80] found that coarse particles had weak interparticle interactions when pelletizing biomass, which has an undesirable effect on the mechanical properties of the pellets. In addition, Williams et al. [62] discovered that biomass pellets exhibited inadequate mechanical durability. It is unsuitable for both transportation and shrinking. To comply with ISO 17225-6 [54], the durability value must be more than or equal to 97.5%. SS, SCB, MIX3, and MIX4 fall inside that range.

3.3.4. Compressive Strength

The pellets’ maximum axial strength, as indicated by Figure 11, is roughly 10.23–10.71 MPa, based on their compressive strength. The pellets have a diametric compressive strength of around 10.23–10.71 MPa and are composed of PMD, MIX3, and MIX4 in that order. The material in MIX3 and MIX4 proportions has the maximum pressure, which is between 9.30 and 9.69 MPa. SS (axial) = 2.89 MPa and MIX1 (diametral) = 2.43 MPa, representing the proportion with the lowest compressive strength. Compressive strength appears to diminish as the proportion of SS increases, based on the test results mentioned above. The pellet’s structure becomes more unstructured as the amount of sugarcane leaf powder increases. When SS is compared to smaller materials, its bigger particle size makes it less adherent. This leads to an uneven distribution of pressure acting on the pellet, which makes damage possibly occur. Nevertheless, since the smaller particles were able to fit into the spaces left by the bigger particles, the compressive strengths rose when the amount of PMD in MIX3 (10% PMD) and MIX4 (1.5% PMD) increased. The density of the biomass pellets increases with the addition of other materials, resulting in a tighter structure that distributes the compressive stress evenly over the pellet. As stated by Ahmed et al. [33] and Lai et al. [61], the biomass pellets are stronger as a result.

3.3.5. Overall Comparison of Physical Qualities and Fuel

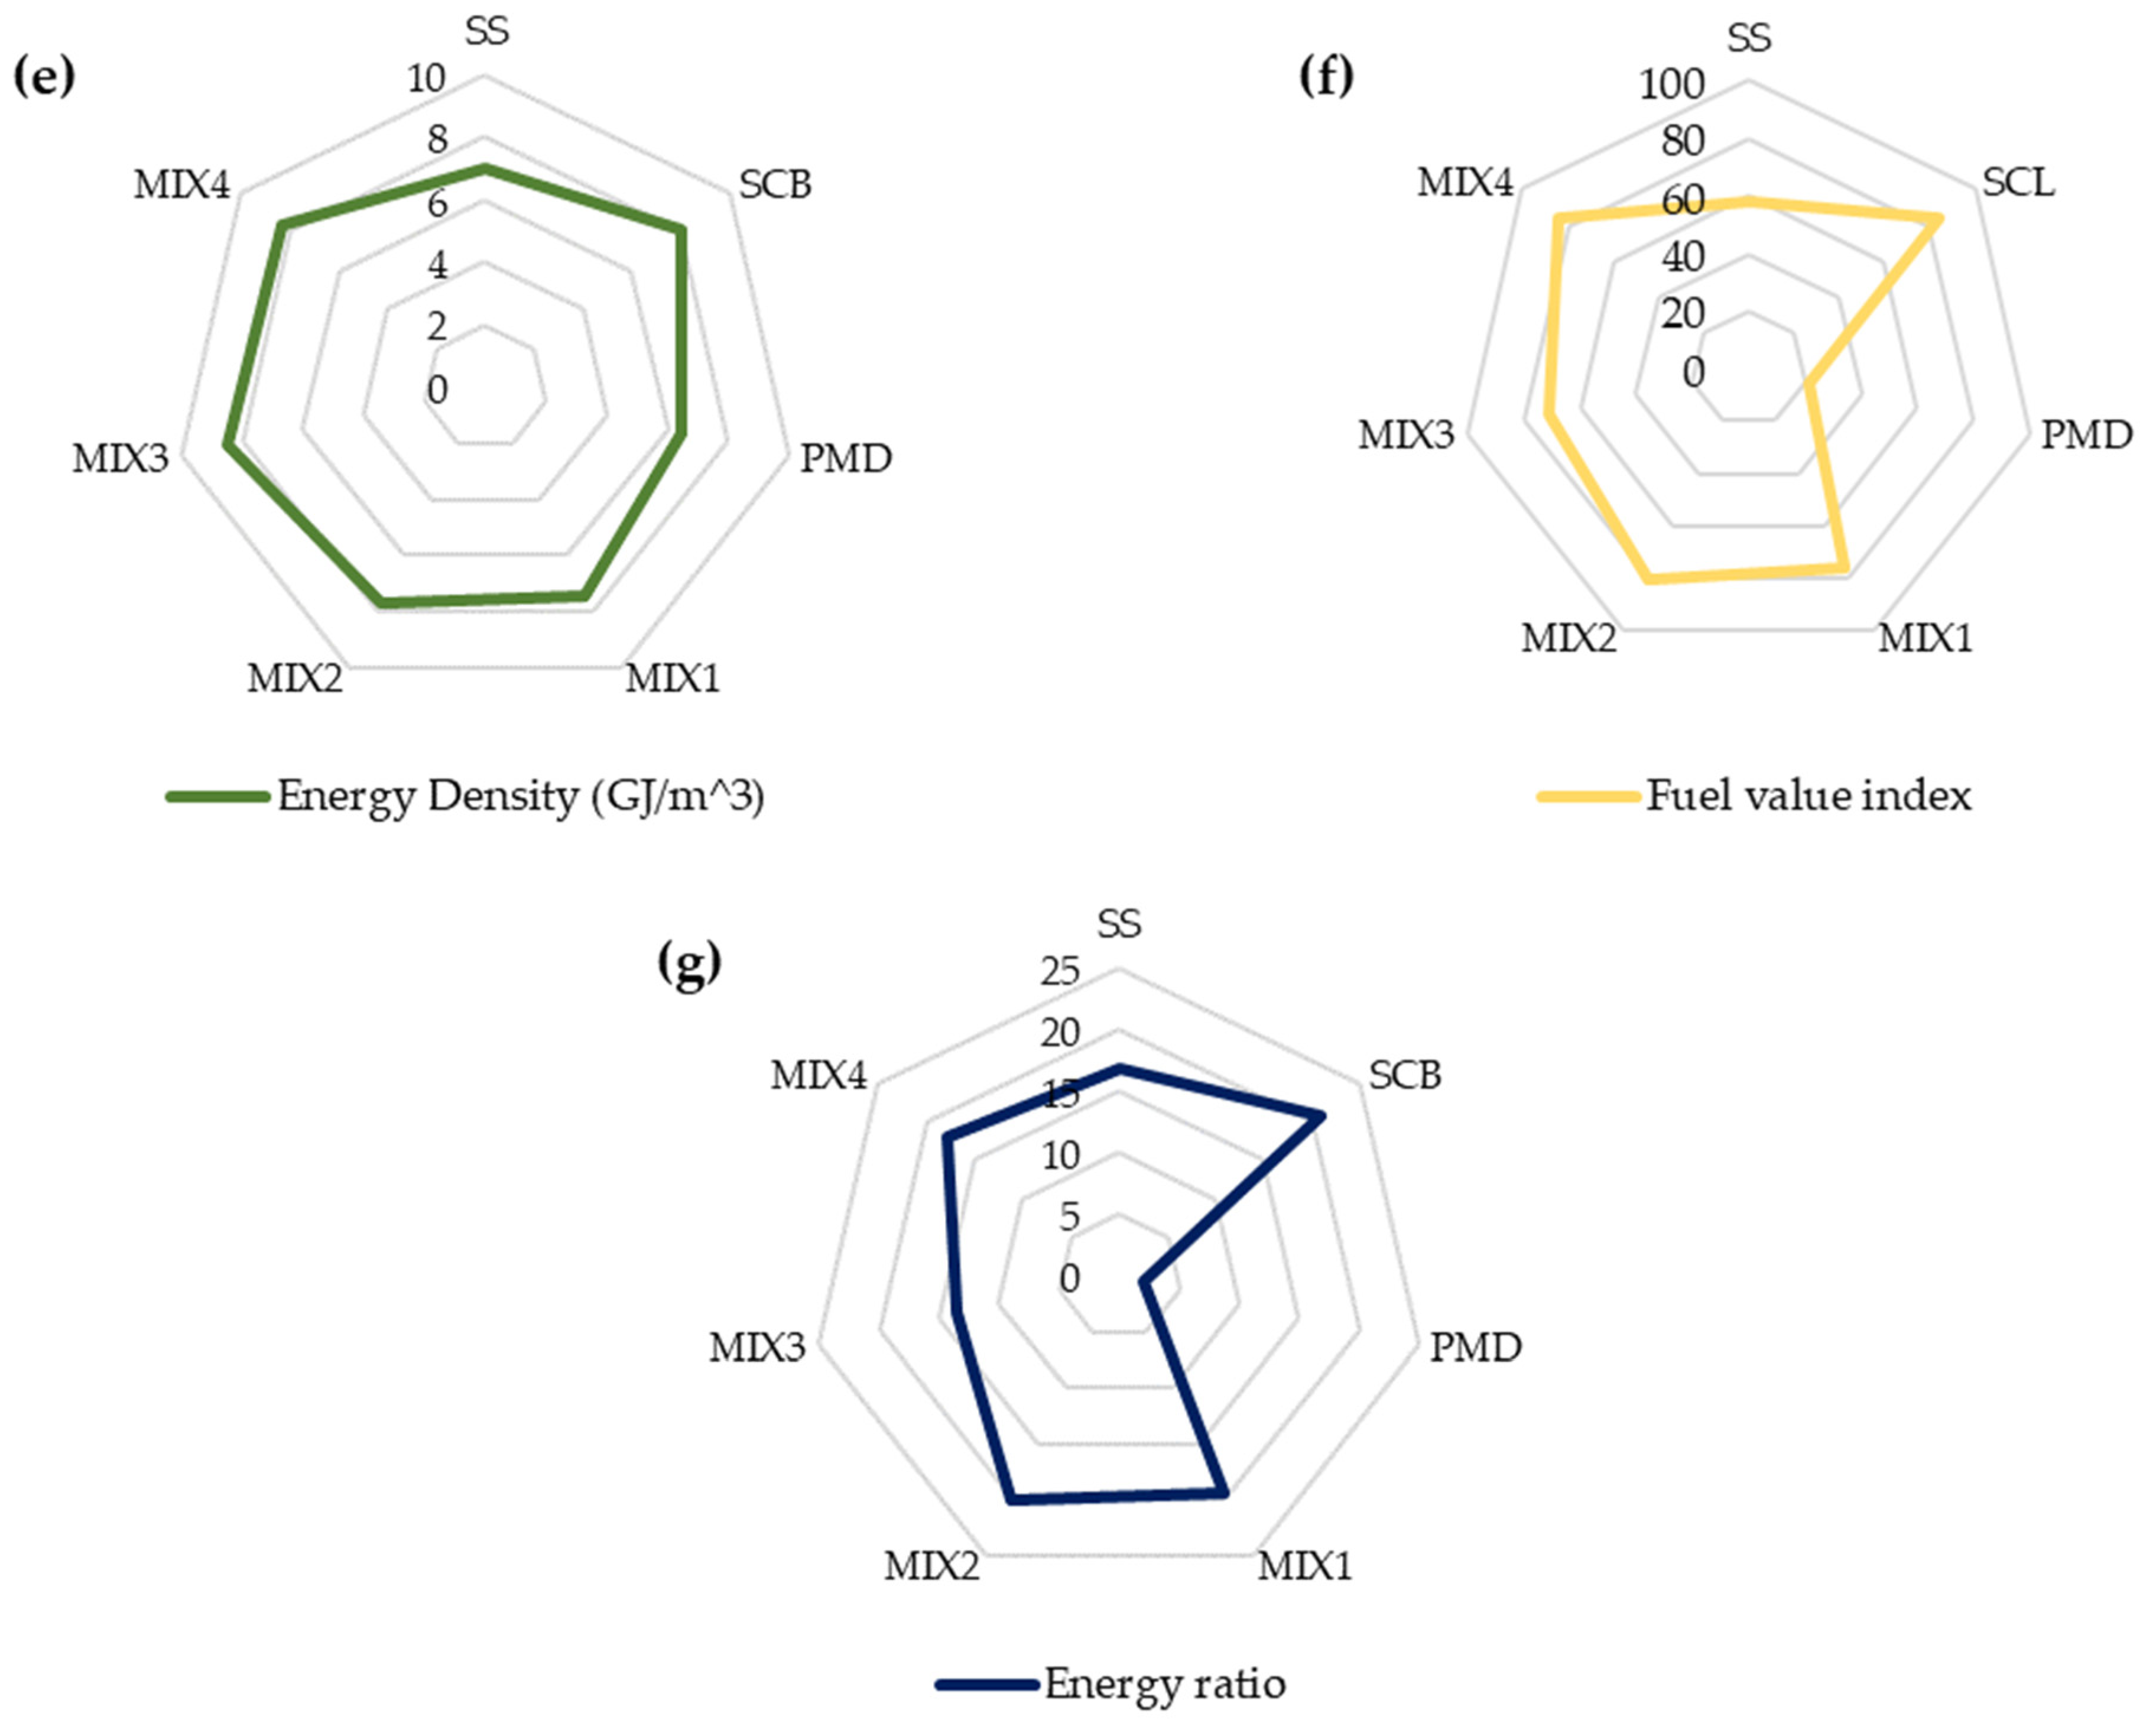
Pellet production efficiency is based on raw materials collected from the sugar sector. Figure 12 shows a comparison of fuel economy with fundamental physical indications that are compliant with ISO 17225-6 [54]. To determine the quality of biomass materials after the pelletizing process, they are tested and left for two weeks (Figure 7) before analyzing various indicators and waiting until the pellet material has a moisture content of 9.88–11.14% (wb), with SCB having the highest moisture content (11.14% (wb)) and PMD having the lowest moisture content (9.88% (wb)). The economic value of biomass pellets with low moisture content is greater than those with high moisture content. This is due to the fact that low moisture biomass pellets have a higher density, which permits more volume loading and lowers the danger of spoilage. Additionally, low moisture content biomass pellets burn more completely, producing more thermal energy and fewer emissions into the atmosphere [59,85]. This is in compliance with ISO 17225-6 [54], which states that the relative moisture content must be at least 10% (wb). After that, the standard reference bulk density limit is set to be greater than or equal to 10% (wb), or 600 kg/m3. This can be seen in Figure 8 as follows: SS < MIX1 < MIX2 < SCB < MIX4 < MIX3 < PMD, where the reference bulk densities for the SS and MIX1 materials are less than the given criteria. Consequently, high-density applications might not be appropriate for these two materials. Nonetheless, there can be additional benefits to SS and MIX1, such as their low cost and wide availability. The standard’s pellet durability is another drawback. It was discovered that, with MIX2 and MIX1 having lower durability values than the norm, MIX2 < MIX1 < MIX4 < MIX3 < SCB < SS < PMD. When choosing materials for biomass pellet manufacture, the durability of the finished product should be considered. This is due to the great durability of biomass pellets, which guarantees high quality and minimizes pellet loss during handling and transportation [32,44]. The following order is for heat energy, which presents the LHV of the pellets in each pelletizing ratio: With values ranging from 7.83 to 15.15 MJ/kg, SCB > MIX4 > MIX2 > MIX1 > MIX3 > SS > PMD, with the highest LHV and lowest PMD going to SCB. Moreover, other materials, such as MIX1 (20% SS + 80% SCB), MIX2 (10% SS + 90% SCB), MIX3 (10% PMD + 90% SCB), and MIX4 (5% SS + 93.5% SCB + 1.5% PMD), can be taken into consideration in combination with SCB to increase the production volume of biomass pellets and lower production costs while maintaining a level of heat energy at an appropriate level (LHV not less than 14.5 MJ/kg). Energy density is another key characteristic to consider when selecting materials for biomass pellet manufacturing because it can affect the cost-effectiveness of shipping and storing biomass pellets. Furthermore, the compressed energy value is useful for comparing the combustion efficiency of biomass fuel pellets. Compared to biomass fuel pellets with a low compressed energy value, those with a high compressed energy value facilitate more efficient combustion. This means that they can produce more energy from the same quantity of material [32,53,59]. The biomass pellets’ fuel value index (FVI) is an assessment of how well they burn. High FVI biomass pellets burn more heat, which improves combustion efficiency, saves more fuel, and may also help reduce pollution [86]. Lastly, the energy ratio is a measure of the quality of biomass fuel pellets, which is the ratio of the thermal energy extracted from the fuel to the electrical energy generated. Figure 12 illustrates how biomass fuel pellets with a high energy ratio tend to be superior quality and yield greater electrical energy production.
Table 9 shows the fuel quality rating, production efficiency, and durability of pellets made from sugar industry byproducts. The biomass pellet values can be arranged in the following order: SCB > MIX2 > MIX4 > MIX3 > MIX1 > PMD > SS. According to the statistics, PMD has superior manufacturing features (specific energy consumption for pelletizing and durability), but it performs poorly in material preparation (moisture content reduction) due to the high energy requirements for reducing the moisture content of PMD. This can be addressed by the operator or industrial factory by accounting for heat from the boiler exhaust (in the case that the factory has a power plant within the factory). Even after considering the qualities of a fuel, it is still deemed inappropriate. However, due to its coarse particle structure, it has drawbacks in terms of energy consumption and pellet production capacity. Mixing biomass materials with PMD has the potential to improve both production efficiency and energy consumption.

4. Conclusions

Byproducts from the sugar industry are numerous in the area, and pelleting is one of the processing methods assisting in the reduction of various struggles. The material can be compacted into pellets at a moisture content of 20% (wb). The mixture of sugarcane leaves, bagasse, and filter cake boosts the material’s efficiency, with a specific energy of 202.00 to 277.98 kWh/ton, resulting in increased energy consumption. This is difficult to avoid because the overall electricity usage for biomass pellet production is mostly determined by the type of biomass raw material relied on (fine or coarse) and its moisture level. It is well understood that fluctuations in energy consumption in the pelletizing process induce instability and may result in anomalies. It can also be said that the particle size of the material is the main cause of energy fluctuations during pelleting because the structure and flow properties of the related materials may need to determine material handling characteristics such as friction coefficient, static, pile angle, material flow properties, and the material’s density. In other words, the conduct of the raw materials utilized in the pelletizing process directly impacts the physical characteristics and process of making biomass pellets. The conclusion drawn from the parameter analysis is that higher-quality pellets can be produced by combining low-quality ingredients in the proper proportion with high-quality ingredients. Pellets made from various raw materials can contribute to the industry’s increased sustainability and efficiency. Furthermore, the expense of long-term storage and transportation of raw materials is decreased by pelletizing at the point of origin or manufacture. Both cost and efficiency can be increased by looking at the same factory that produces pellets. Consequently, increasing production volumes, cutting costs, and improving the sector’s resource and energy usage efficiency can all be achieved by creating technologies for the processing of biomass pellets from byproducts in the sugar business. Additionally, it can be utilized as a more worthwhile and efficient alternative energy source.

Supplementary Materials

The following supporting information can be downloaded at https://www.mdpi.com/article/10.3390/su16146035/s1, Figure S1: Variations in energy consumption patterns in pelletizing processes; Table S1: Electrical energy used for pelletization (kW).

Author Contributions

Conceptualization, P.S., C.J. and K.L.; methodology, P.S., W.S., S.N. and K.L.; validation, P.S., W.S., C.J., P.A. and K.L.; formal analysis, P.S. and K.L.; investigation, P.S.; resources, P.S., W.S. and S.N.; data curation, P.S. and K.L.; writing—original draft preparation, P.S.; writing—review and editing, P.S., W.S., S.N., C.J., P.A. and K.L.; visualization, P.S.; supervision, P.S., W.S., P.A. and K.L.; project administration, P.S. and K.L. All authors have read and agreed to the published version of the manuscript.

Funding

This research received no external funding.

Institutional Review Board Statement

Not applicable.

Informed Consent Statement

Not applicable.

Data Availability Statement

The data presented in this study are available on request from the corresponding author.

Acknowledgments

In this research study, many thanks are due to the following institutions for the provision of research equipment and tools: The Agricultural Machinery and Postharvest Technology Center, Khon Kaen University, Khon Kean Province 40002, Thailand. FOOD ENERGY WATER Security Research Institute (FEWs), Khon Kaen University, Khon Kean Province 40002, Thailand. The Postharvest Technology Innovation Center, Science, Research and Innovation Promotion and Utilization Division, Office of the Ministry of Higher Education, Science, Research and Innovation 10400, Thailand. Agricultural Machinery Engineering Department, Faculty of Engineering and Technology, and Rajamangala University of Technology Isan, Nakhon Ratchasima, 30000 Thailand.

Conflicts of Interest

The authors declare no conflicts of interest.

References

  1. bp Energy Outlook 2023 Edition. Available online: https://www.bp.com/content/dam/bp/business-sites/en/global/corporate/pdfs/energy-economics/energy-outlook/bp-energy-outlook-2023.pdf (accessed on 27 June 2023).
  2. Tumuluru, J.S. Effect of pellet die diameter on density and durability of pellets made from high moisture woody and herbaceous biomass. Carbon Resour. Convers. 2018, 1, 44–54. [Google Scholar] [CrossRef]
  3. Chen, G. Impact of carbon border adjustment mechanism on China’s manufacturing sector: A dynamic recursive CGE model based on an evolutionary game. J. Environ. Manag. 2023, 347, 119029. [Google Scholar] [CrossRef] [PubMed]
  4. Singh, A.K.; Pal, P.; Rathore, S.S.; Sahoo, U.K.; Sarangi, P.K.; Prus, P.; Dziekański, P. Sustainable utilization of biowaste resources for biogas production to meet rural bioenergy requirements. Energies 2023, 16, 5409. [Google Scholar] [CrossRef]
  5. Koul, B.; Yakoob, M.; Shah, M.P. Agricultural waste management strategies for environmental sustainability. Environ. Res. 2022, 206, 112285. [Google Scholar] [CrossRef] [PubMed]
  6. Change, I.C. Mitigation of climate change. In Contribution of Working Group III to the Fifth Assessment Report of the Intergovernmental Panel on Climate Change; UN. ECA: Addis Ababa, Ethiopia, 2014; p. 147. [Google Scholar]
  7. Cherubini, F.; Bird, N.D.; Cowie, A.; Jungmeier, G.; Schlamadinger, B.; Woess-Gallasch, S. Energy-and greenhouse gas-based LCA of biofuel and bioenergy systems: Key issues, ranges and recommendations. Resour. Conserv. Recycl. 2009, 53, 434–447. [Google Scholar] [CrossRef]
  8. Sugar Production Worldwide 2010/11-2023/24. Available online: https://www.statista.com/statistics/249679/total-production-of-sugar-worldwide (accessed on 28 June 2023).
  9. Report on Sugarcane Planting Situation, Production Year 2021/22. Available online: https://old.ocsb.go.th/upload/journal/fileupload/13813-1585.pdf (accessed on 18 June 2023).
  10. Rasche, L.; Sos Del Diego, R. Pros and cons of sugarcane straw recovery in São Paulo. BioEnergy Res. 2020, 13, 147–156. [Google Scholar] [CrossRef]
  11. De Almeida, M.A.; Colombo, R. Production chain of first-generation sugarcane bioethanol: Characterization and value-added application of wastes. BioEnergy Res. 2023, 16, 924–939. [Google Scholar] [CrossRef]
  12. Bridhikitti, A.; Kaewsuk, J.; Karaket, N.; Friend, R.; Sallach, B.; Chong, J.P.; Redeker, K.R. Balancing Agriculture and Industry through Waste Utilization for Sugarcane Sustainability. Sustainability 2023, 15, 14711. [Google Scholar] [CrossRef]
  13. Pongpat, P.; Gheewala, S.H.; Silalertruksa, T. An assessment of harvesting practices of sugarcane in the central region of Thailand. J. Clean. Prod. 2017, 142, 1138–1147. [Google Scholar] [CrossRef]
  14. Chokesawatanakit, N.; Jutakridsada, P.; Kamwilaisak, K. Sustainable valorization of sugarcane leaves for succinic acid and biochar production. J. Met. Mater. Miner. 2021, 31, 46–53. [Google Scholar] [CrossRef]
  15. Chungopast, S.; Phankamolsil, N.; Thaymuang, W.; Phommuangkhuk, A.; Karuna, S.; Inboonchuay, T. Correlation of Soil Physiochemical Properties, Microorganism Numbers, and Bacterial Communities Following Unburned and Burned Sugarcane Harvest. Appl. Environ. Soil Sci. 2023, 2023, 9618349. [Google Scholar] [CrossRef]
  16. Banerjee, S.; Ghosh, S.; Bhowmick, G.D.; Pandey, D.; Pandey, B.K.; Dadheech, P. Biofuels and Health Hazards: An Overview. In Handbook of Research on Safe Disposal Methods of Municipal Solid Wastes for a Sustainable Environment; IGI Global: Hershey, PA, USA, 2023; pp. 324–344. [Google Scholar]
  17. Charee, S.; Sudajan, S.; Junsiri, C.; Laloon, K.; Oupathum, C. Effects of moisture content and blade cutting speed on the chopping and size distribution of sugarcane leaves for the production of fuel biomass. Agric. Eng. Int. CIGR J. 2021, 23, 152–161. [Google Scholar]
  18. Doungpueng, K.; Charee, S.; Oupathum, C.; Premprayoon, K.; Pachanawan, A. Optimizing Shearing Characteristics of Sugarcane Leaves for Efficient Biomass Utilization and Machinery Design in the Sugar Industry. Eng. J. 2024, 28, 1–11. [Google Scholar]
  19. Makul, N.; Sua-iam, G. Characteristics and utilization of sugarcane filter cake waste in the production of lightweight foamed concrete. J. Clean. Prod. 2016, 126, 118–133. [Google Scholar] [CrossRef]
  20. De Moraes Rocha, G.J.; Martin, C.; Soares, I.B.; Maior, A.M.S.; Baudel, H.M.; De Abreu, C.A.M. Dilute mixed-acid pretreatment of sugarcane bagasse for ethanol production. Biomass Bioenergy 2011, 35, 663–670. [Google Scholar] [CrossRef]
  21. Dotaniya, M.L.; Datta, S.C.; Biswas, D.R.; Dotaniya, C.K.; Meena, B.L.; Rajendiran, S.; Regar, K.L.; Lata, M. Use of sugarcane industrial by-products for improving sugarcane productivity and soil health. Int. J. Recycl. Org. Waste Agric. 2016, 5, 185–194. [Google Scholar] [CrossRef]
  22. Kabeyi, M.J.B.; Olanrewaju, O.A. Preliminary design of a bagasse based firm power plant for a sugar factory. In Proceedings of the Southern African Universities Power Engineering Conference/Robotics and Mechatronics/Pattern Recognition Association of South Africa (SAUPEC/RobMech/PRASA), Potchefstroom, South Africa, 27–29 January 2021. [Google Scholar]
  23. Sarker, T.C.; Azam, S.M.G.G.; Bonanomi, G. Recent advances in sugarcane industry solid by-products valorization. Waste Biomass Valoriz. 2017, 8, 241–266. [Google Scholar] [CrossRef]
  24. Ministry of Energy. Document on the Renewable Energy Development Plan (AEDP); Ministry of Energy: Bangkok, Thailand, 2015. [Google Scholar]
  25. Cecelja, F.; Yang, A.; Solda, M. Utilization of Biomass Feedstocks: A Case Study Based on Rice and Sugar Mills in Thailand. Comput. Aided Chem. Eng. 2012, 30, 217–221. [Google Scholar]
  26. Assawamartbunlue, K.; Kunrapeegayson, N.; Limwattana, P. Specific energy consumption of sugar cane mills in Thailand. Chem. Eng. Trans. 2018, 70, 625–630. [Google Scholar]
  27. Chunhawong, K.; Chaisan, T.; Rungmekarat, S.; Khotavivattana, S. Sugar industry and utilization of its by-products in Thailand: An overview. Sugar Tech 2018, 20, 111–115. [Google Scholar] [CrossRef]
  28. Arshad, M.; Ahmed, S. Cogeneration through bagasse: A renewable strategy to meet the future energy needs. Renew. Sustain. Energy Rev. 2016, 54, 732–737. [Google Scholar] [CrossRef]
  29. Gupta, N.; Tripathi, S.; Balomajumder, C. Characterization of pressmud: A sugar industry waste. Fuel 2011, 90, 389–394. [Google Scholar] [CrossRef]
  30. Pajampa, K.; Laloon, K.; Suksri, A.; Phadungton, S.; Ratpukdi, T.; Posom, J.; Wongwuttanasatian, T. A way towards zero-waste campaign and sustainability in sugar industries; filter cake valorisation as energy pellets. Ain Shams Eng. J. 2024, 15, 102459. [Google Scholar] [CrossRef]
  31. The Sugar Market. Available online: https://www.isosugar.org/sugarsector/sugar (accessed on 28 June 2023).
  32. Laloon, K.; Junsiri, C.; Sanchumpu, P.; Ansuree, P. Factors affecting the biomass pellet using industrial eucalyptus bark residue. Biomass Convers. Biorefinery 2024, 14, 10101–10113. [Google Scholar] [CrossRef] [PubMed]
  33. Ahmed, I.; Ali, A.; Ali, B.; Hassan, M.; Hussain, S.; Hashmi, H.; Ali, Z.; Soomro, A.; Mukwana, K. Production of pellets from furfural residue and sawdust biomass: Effect of moisture content, particle size and a binder on pellet quality and energy consumption. BioEnergy Res. 2022, 15, 1292–1303. [Google Scholar] [CrossRef]
  34. Meghana, M.; Shastri, Y. Sustainable valorization of sugar industry waste: Status, opportunities, and challenges. Bioresour. Technol. 2020, 303, 122929. [Google Scholar] [CrossRef] [PubMed]
  35. Kaliyan, N.; Morey, R.V. Factors affecting strength and durability of densified biomass products. Biomass Bioenergy 2009, 33, 337–359. [Google Scholar] [CrossRef]
  36. Yancey, N.A.; Tumuluru, J.S.; Wright, C.T. Drying, grinding and pelletization studies on raw and formulated biomass feedstock’s for bioenergy applications. J. Biobased Mater. Bioenergy 2013, 7, 549–558. [Google Scholar] [CrossRef]
  37. Adapa, P.; Tabil, L.; Schoenau, G. Grinding performance and physical properties of non-treated and steam exploded barley, canola, oat and wheat straw. Biomass Bioenergy 2011, 35, 549–561. [Google Scholar] [CrossRef]
  38. Stelte, W.; Holm, J.K.; Sanadi, A.R.; Barsberg, S.; Ahrenfeldt, J.; Henriksen, U.B. Fuel pellets from biomass: The importance of the pelletizing pressure and its dependency on the processing conditions. Fuel 2011, 90, 3285–3290. [Google Scholar] [CrossRef]
  39. Jiang, L.; Liang, J.; Yuan, X.; Li, H.; Li, C.; Xiao, Z.; Huang, H.; Wang, H.; Zeng, G. Co-pelletization of sewage sludge and biomass: The density and hardness of pellet. Bioresour. Technol. 2014, 166, 435–443. [Google Scholar] [CrossRef]
  40. Chen, X.; Liang, J.; Liao, P.; Huang, W.; He, J.; Chen, J. Effect of process parameters and raw material characteristics on the physical and mechanical quality of sugarcane bagasse pellets. Biomass Bioenergy 2021, 154, 106242. [Google Scholar] [CrossRef]
  41. Sarker, T.R.; Nanda, S.; Meda, V.; Dalai, A.K. Densification of waste biomass for manufacturing solid biofuel pellets: A review. Environ. Chem. Lett. 2023, 21, 231–264. [Google Scholar] [CrossRef]
  42. Tumuluru, J.S. Pelleting of pine and switchgrass blends: Effect of process variables and blend ratio on the pellet quality and energy consumption. Energies 2019, 12, 1198. [Google Scholar] [CrossRef]
  43. Jiang, L.B.; Yuan, X.Z.; Li, H.; Chen, X.H.; Xiao, Z.H.; Liang, J.; Leng, L.J.; Guo, Z.; Zeng, G.M. Co-pelletization of sewage sludge and biomass: Thermogravimetric analysis and ash deposits. Fuel Process. Technol. 2016, 145, 109–115. [Google Scholar] [CrossRef]
  44. Siyal, A.A.; Yang, L.; Ali, B.; Hassan, M.; Zhou, C.; Li, X.; Ahmed, I.; Soomro, A.; Liu, G.; Dai, J. Characterization and quality analysis of biomass pellets prepared from furfural residue, sawdust, corn stalk and sewage sludge. Fuel Process. Technol. 2023, 241, 107620. [Google Scholar] [CrossRef]
  45. Sanchumpu, P.; Laloon, K.; Champana, S.; Junsiri, C. A Study on Size Reduction of Eucalyptus Bark from the Processing Industry for Producing Biomass Pellets. Int. J. Technol. 2016, 7, 1222–1231. [Google Scholar] [CrossRef]
  46. Krokida, M.; Marinos-Kouris, D.; Mujumdar, A.S. Rotary drying. Handb. Ind. Dry. 2007, 1, 151–172. [Google Scholar]
  47. Yılmaz, H.; Çanakcı, M.; Topakcı, M.; Karayel, D. The effect of raw material moisture and particle size on agri-pellet production parameters and physical properties: A case study for greenhouse melon residues. Biomass Bioenergy 2021, 150, 106125. [Google Scholar] [CrossRef]
  48. ASTM Standards E873-82; Standard Test Method for Bulk Density of Densified Particulate Biomass Fuels. ASTM: West Conshohocken, PA, USA, 2019.
  49. ASTM Standards D5142-04; Standard Test Methods for Proximate Analysis of the Analysis Sample of Coal and Coke by Instrumental Procedures. ASTM: West Conshohocken, PA, USA, 2002.
  50. Khangwichian, W.; Pattamasewe, S.; Leesing, R.; Knijnenburg, J.T.; Ngernyen, Y. Adsorption of cationic dye on activated carbon from hydrolyzed Dipterocarpus alatus leaves: Waste from biodiesel production. Eng. Appl. Sci. Res. 2022, 49, 531–544. [Google Scholar]
  51. ASTM Standard D5373; Standard Test Methods for Instrumental Determination of Carbon, Hydrogen, and Nitrogen in Laboratory Samples of Coal. ASTM: West Conshohocken, PA, USA, 2008.
  52. Scatolino, M.V.; Neto, L.F.C.; Protásio, T.D.P.; Carneiro, A.D.C.O.; Andrade, C.R.; Guimarães Júnior, J.B.; Mendes, L.M. Options for generation of sustainable energy: Production of pellets based on combinations between lignocellulosic biomasses. Waste Biomass Valoriz. 2018, 9, 479–489. [Google Scholar] [CrossRef]
  53. Dao, C.N.; Salam, A.; Oanh, N.T.K.; Tabil, L.G. Effects of length-to-diameter ratio, pinewood sawdust, and sodium lignosulfonate on quality of rice straw pellets produced via a flat die pellet mill. Renew. Energy 2022, 181, 1140–1154. [Google Scholar] [CrossRef]
  54. ISO 17225-6:2014; Solid Biofuels d Fuel Specifications and Classes d Part6: Graded Non-Woody Pellets. ISO: London, UK, 2014.
  55. Boumanchar, I.; Chhiti, Y.; Alaoui, F.E.M.H.; El Ouinani, A.; Sahibed-Dine, A.; Bentiss, F.; Jama, C.; Bensitel, M. Effect of materials mixture on the higher heating value: Case of biomass, biochar and municipal solid waste. Waste Manag. 2017, 61, 78–86. [Google Scholar] [CrossRef] [PubMed]
  56. Hwangdee, P.; Charee, S.; Kheowkrai, W.; Junsiri, C.; Laloon, K. Application of the Simplex-Centroid Mixture Design to Biomass Charcoal Powder Formulation Ratio for Biomass Charcoal Briquettes. Sustainability 2022, 14, 3940. [Google Scholar] [CrossRef]
  57. Rabier, F.; Temmerman, M.; Böhm, T.; Hartmann, H.; Jensen, P.D.; Rathbauer, J.; Carrasco, J.; Fernández, M. Particle density determination of pellets and briquettes. Biomass Bioenergy 2006, 30, 954–963. [Google Scholar] [CrossRef]
  58. Asae, C. Pellets and Crumbles–Definitions and methods for determining density, durability and moisture content. Am. Soc. Agric. Eng. 2001, 41, 449–451. [Google Scholar]
  59. Yılmaz, H.; Çanakcı, M.; Topakcı, M.; Karayel, D.; Yiğit, M.; Ortaçeşme, D. In-situ pelletization of campus biomass residues: Case study for Akdeniz University. Renew. Energy 2023, 212, 972–983. [Google Scholar] [CrossRef]
  60. Kumar, P.; Subbarao, P.M.V.; Kala, L.; Vijay, V.K. Influence of physical, mechanical, and thermal properties of biomass pellets from agriculture residue: Pearl millet cob and mix. Bioresour. Technol. Rep. 2022, 20, 101278. [Google Scholar] [CrossRef]
  61. Lai, Z.Y.; Chua, H.B.; Goh, S.M. Influence of process parameters on the strength of oil palm kernel shell pellets. J. Mater. Sci. 2013, 48, 1448–1456. [Google Scholar] [CrossRef]
  62. Williams, O.; Taylor, S.; Lester, E.; Kingman, S.; Giddings, D.; Eastwick, C. Applicability of mechanical tests for biomass pellet characterisation for bioenergy applications. Materials 2018, 11, 1329. [Google Scholar] [CrossRef]
  63. ASTM Standard D5865-04; Standard Test Method for Gross Calorific Value of Coal and Coke. ASTM: West Conshohocken, PA, USA, 2017.
  64. De Souza, H.J.P.L.; Muñoz, F.; Mendonça, R.T.; Sáez, K.; Olave, R.; Segura, C.; De Souza, D.P.; De Paula Protásio, T.; Rodríguez-Soalleiro, R. Influence of lignin distribution, physicochemical characteristics and microstructure on the quality of biofuel pellets made from four different types of biomass. Renew. Energy 2021, 163, 1802–1816. [Google Scholar] [CrossRef]
  65. Purohit, A.N.; Nautiyal, A.R. Fuelwood value index of Indian mountain tree species. Int. Tree Crops J. 1987, 4, 177–182. [Google Scholar] [CrossRef]
  66. Tumuluru, J.S. High moisture corn stover pelleting in a flat die pellet mill fitted with a 6 mm die: Physical properties and specific energy consumption. Energy Sci. Eng. 2015, 3, 327–341. [Google Scholar] [CrossRef]
  67. Matkowski, P.; Lisowski, A.; Świętochowski, A. Effect of compacted dose of pure straw and blends of straw with calcium carbonate or cassava starch on pelletising process and pellet quality. J. Clean. Prod. 2020, 277, 124006. [Google Scholar] [CrossRef]
  68. Grover, P.D.; Mishra, S.K. Biomass Briquetting: Technology and Practices; Food and Agriculture Organization of the United Nations: Bangkok, Thailand, 1996. [Google Scholar]
  69. Anukam, A.; Berghel, J.; Henrikson, G.; Frodeson, S.; Ståhl, M. A review of the mechanism of bonding in densified biomass pellets. Renew. Sustain. Energy Rev. 2021, 148, 111249. [Google Scholar] [CrossRef]
  70. Duque, J.; Fuentes, W.; Rey, S.; Molina, E. Effect of grain size distribution on california bearing ratio (CBR) and modified proctor parameters for granular materials. Arab. J. Sci. Eng. 2020, 45, 8231–8239. [Google Scholar] [CrossRef]
  71. Stelte, W.; Holm, J.K.; Sanadi, A.R.; Barsberg, S.; Ahrenfeldt, J.; Henriksen, U.B. A study of bonding and failure mechanisms in fuel pellets from different biomass resources. Biomass Bioenergy 2011, 35, 910–918. [Google Scholar] [CrossRef]
  72. Vego, I.; Tengattini, A.; Andò, E.; Lenoir, N.; Viggiani, G. The effect of high relative humidity on a network of water-sensitive particles (couscous) as revealed by in situ X-ray tomography. Soft Matter 2022, 18, 4747–4755. [Google Scholar] [CrossRef] [PubMed]
  73. Styks, J.; Wróbel, M.; Frączek, J.; Knapczyk, A. Effect of compaction pressure and moisture content on quality parameters of perennial biomass pellets. Energies 2020, 13, 1859. [Google Scholar] [CrossRef]
  74. Lee, J.S.; Sokhansanj, S.; Lau, A.K.; Lim, C.J. Physical properties of wood pellets exposed to liquid water. Biomass Bioenergy 2020, 142, 105748. [Google Scholar] [CrossRef]
  75. Koullas, D.; Koukios, E. Hot briquetting of wheat straw. In Handlingand Processing of Biomass for Energy; Keller, P., Ed.; FAO: Rome, Italy, 1987; pp. 53–60. [Google Scholar]
  76. Nielsen, S.K.; Mandø, M.; Rosenørn, A.B. Review of die design and process parameters in the biomass pelleting process. Powder Technol. 2020, 364, 971–985. [Google Scholar] [CrossRef]
  77. Gil, M.; Schott, D.; Arauzo, I.; Teruel, E. Handling behavior of two milled biomass: SRF poplar and corn stover. Fuel Process. Technol. 2013, 112, 76–85. [Google Scholar] [CrossRef]
  78. Nielsen, S.K.; Rezaei, H.; Mandø, M.; Sokhansanj, S. Constitutive modelling of compression and stress relaxation in pine pellets. Biomass Bioenergy 2019, 130, 105370. [Google Scholar] [CrossRef]
  79. Mostafa, M.E.; Hu, S.; Wang, Y.; Su, S.; Hu, X.; Elsayed, S.A.; Xiang, J. The significance of pelletization operating conditions: An analysis of physical and mechanical characteristics as well as energy consumption of biomass pellets. Renew. Sustain. Energy Rev. 2019, 105, 332–348. [Google Scholar] [CrossRef]
  80. Jiang, L.; Yuan, X.; Xiao, Z.; Liang, J.; Li, H.; Cao, L.; Wang, H.; Chen, X.; Zeng, G. A comparative study of biomass pellet and biomass-sludge mixed pellet: Energy input and pellet properties. Energy Convers. Manag. 2016, 126, 509–515. [Google Scholar] [CrossRef]
  81. Kirsten, C.; Lenz, V.; Schröder, H.W.; Repke, J.U. Hay pellets—The influence of particle size reduction on their physical–mechanical quality and energy demand during production. Fuel Process. Technol. 2016, 148, 163–174. [Google Scholar] [CrossRef]
  82. Sikanen, L.; Vilppo, T. Small scale pilot combustion experiments with wood pellets–the effect of pellet length. Open Renew. Energy J. 2012, 5, 1–6. [Google Scholar] [CrossRef]
  83. Tarasov, D.; Shahi, C.; Leitch, M. Effect of additives on wood pellet physical and thermal characteristics: A review. Int. Sch. Res. Not. 2013, 2013, 876939. [Google Scholar] [CrossRef]
  84. Zhang, J.; De, X.; Yu, Z.; Guo, W.; Ge, Y.; Chen, X. Effectiveness of Biomass Pellet Parameters on Their Fractal Dimension. Appl. Sci. 2022, 12, 9841. [Google Scholar] [CrossRef]
  85. Picchio, R.; Latterini, F.; Venanzi, R.; Stefanoni, W.; Suardi, A.; Tocci, D.; Pari, L. Pellet production from woody and non-woody feedstocks: A review on biomass quality evaluation. Energies 2020, 13, 2937. [Google Scholar] [CrossRef]
  86. Ozdemir, S.; Şimşek, A.; Ozdemir, S.; Dede, C. Investigation of poultry slaughterhouse waste stream to produce bio-fuel for internal utilization. Renew. Energy 2022, 190, 274–282. [Google Scholar] [CrossRef]
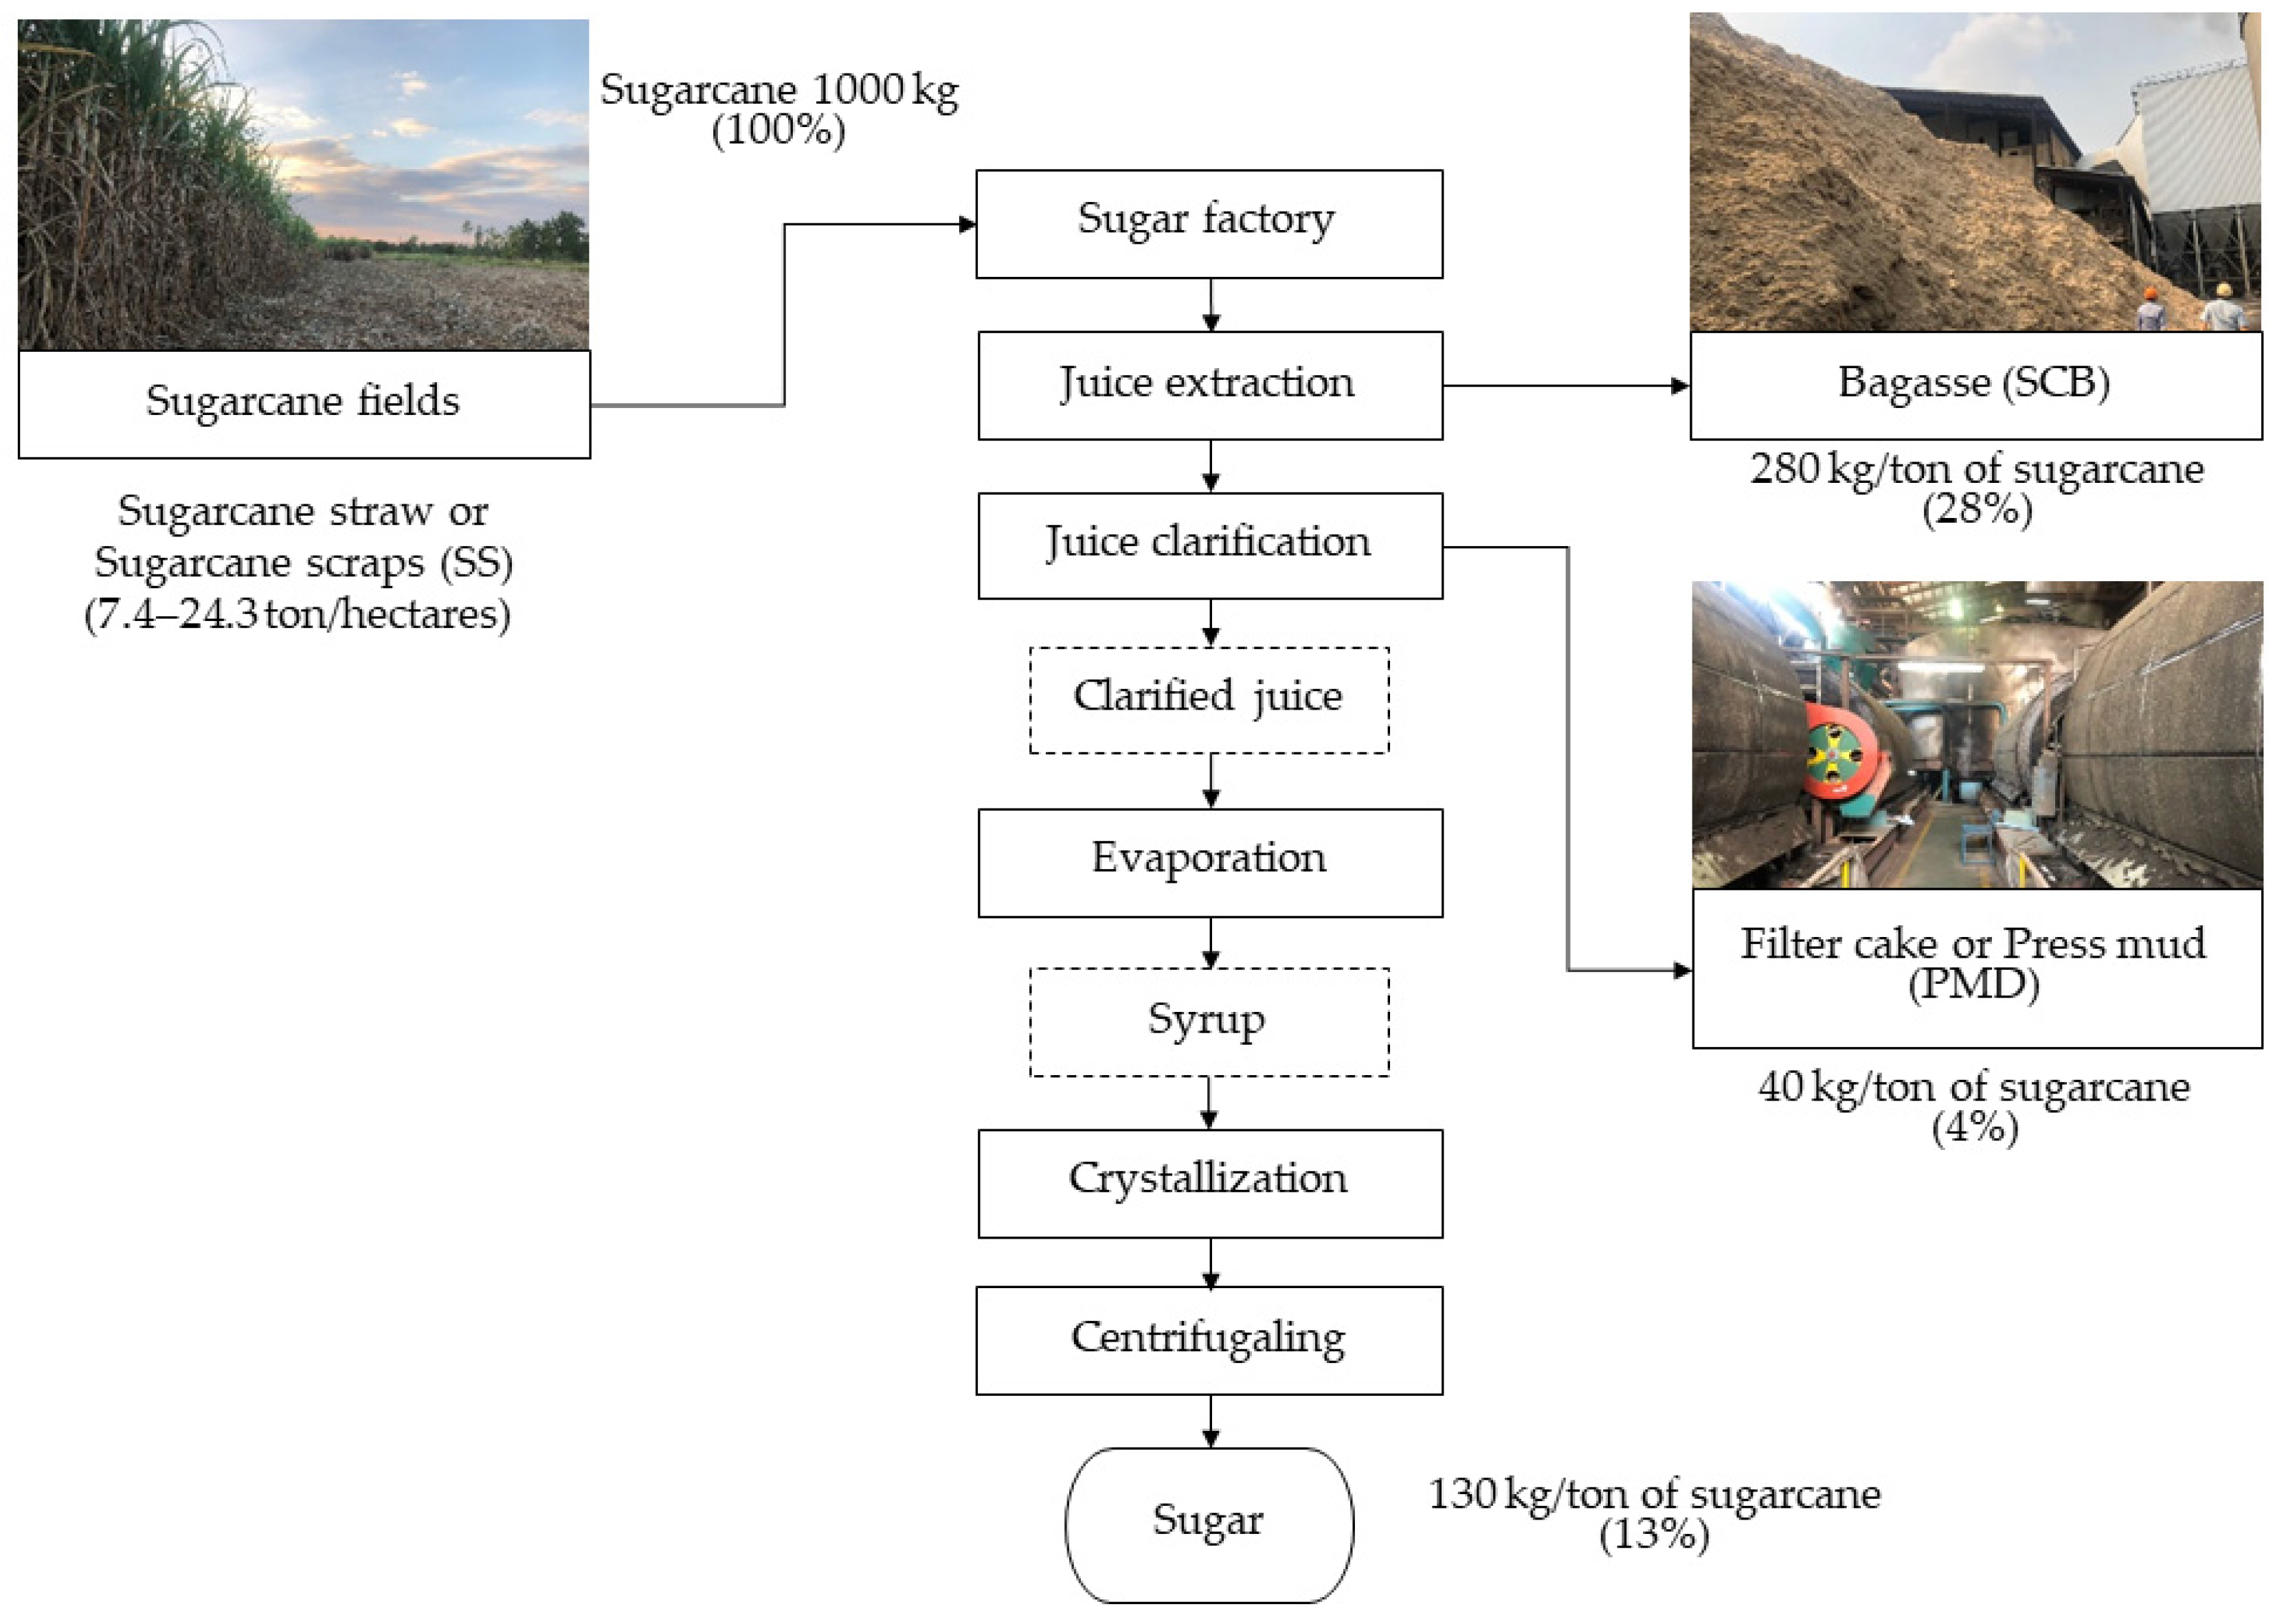
Figure 1. The process of producing sugar and the amount of waste produced were adapted from Makul and Sua-iam [19] and Meghana and Shastri [34].
Sustainability 16 06035 g001
Figure 2. A detailed experimental procedure: (a) sugarcane straw, (b) sugarcane bagasse, (c) press mud, (d) chaff cutter machine, (e) swinging hammer mill, (f) rotary dryer, (g) sugarcane straw grind, (h) sugarcane bagasse grind, (i) press mud dried, (j) D-type pellet mill, (k) biomass pellet.
Sustainability 16 06035 g002
Figure 3. Diagram of the drying process with a rotary dryer.
Sustainability 16 06035 g003
Figure 4. The functions of a flat-die pellet mill for biomass pellets.
Sustainability 16 06035 g004
Figure 5. The position of the pellets during testing: (a) axial and (b) diametral compression test.
Sustainability 16 06035 g005
Figure 6. Particle size distribution.
Sustainability 16 06035 g006
Figure 7. Moisture relationship for biomass pelletizing in terms of production efficiency and raw material physical properties [54]: (a) specific energy consumption for pelletizing raw materials, (b) bulk density of pelletized raw materials, (c) durability of pelletized raw materials, (d) specific energy consumption for pelletizing at varying moisture contents, (e) bulk density of pelletized materials at varying moisture contents, (f) durability of pelletized materials at varying moisture contents.
Sustainability 16 06035 g007aSustainability 16 06035 g007b
Figure 8. Bulk density and geometric mean diameter of sample.
Sustainability 16 06035 g008
Figure 9. Biomass pellets made from leftovers in the sugar industry.
Sustainability 16 06035 g009
Figure 10. Specific energy consumption of pellet production (SECpelletization) and coefficient of variation of power fluctuation during pelletizing (CVPW).
Sustainability 16 06035 g010
Figure 11. The axial and diametric compressive strength of each type of pellet material.
Sustainability 16 06035 g011
Figure 12. Comparison of production efficiency and overall pellet quality indicators for each material and mix proportion: (a) SEC of pelletizing process, (b) bulk density, (c) durability, (d) LHV, (e) energy density, (f) fuel value index, and (g) energy ratio.
Sustainability 16 06035 g012aSustainability 16 06035 g012b
Table 1. The results of proximate and ultimate analysis of raw materials.
Raw MaterialsProximate AnalysisUltimate AnalysisLHVdb
(MJ/kg)
HHVdb
(MJ/kg)
Ref.
MCdb
(%)
Ashdb
(%)
VMdb
(%)
fCdb
(%)
Cdb
(%)
Hdb
(%)
Ndb
(%)
Sdb
(%)
SS6.5023.8863.1412.9842.936.10N.D.0.2214.1415.16This study
SCB7.5318.2868.4913.2346.226.59N.D.0.0315.8217.13This study
PMD9.0556.7635.897.3523.723.401.060.128.989.73This study
Furfural residue6.2010.6059.3023.9050.784.980.571.26N/A22.88[33]
Sawdust4.853.1075.4016.7048.665.503.190.53N/A20.60[33]
SCBpellet4.622.4181.8915.7049.826.030.020.0316.8018.96[41]
N.D.: denotes not detected. db: represents moisture content on a dry basis. N/A: not available.
Table 2. Proportions of materials for biomass palletization.
SampleProportion of Material (wt.%)
SSSCBPMD
SCB01000
MIX120800
MIX210900
MIX309010
MIX4593.51.5
Table 3. Preparing materials for pelleting with the use of SEC chaff cutter machine, hammer mill, and rotary dryer.
Processes [Machine]Raw Materials
SSSCBPMD
Shredding [Chaff cutter machine]4.01XX
Fine grinding [Hammer mill]36.5325.80X
Drying to reduce moisture content [Rotary dryer]XX 894.16
Note: The X symbol means not processed.
Table 4. The results of a statistical investigation of the type of materials and moisture content that influence various outcomes.
SourcedfF-Value
SECBulk DensityDurability
ToM (A)214.74 **2739.59 **76.82 **
Moisture content (B)415.85 **513.73 **101.98 **
AB82.06 ns12.91 **16.43 **
Error30
Total44
CVPMC (%) 23.342.520.92
ns non-significant, and ** highly significant at 1% level.
Table 5. Moisture content affects the average SEC value, bulk density, and durability.
Moisture ContentSEC (Wh/kg)Bulk Density (kg/m3)Durability (%)
15358.63 c696.98 a97.90 a
20172.70 a695.36 a98.60 a
25197.95 ab609.35 b96.73 b
30237.39 b537.71 c95.66 c
35209.19 ab429.82 d91.62 d
LSD0.0552.9914.470.85
Identical letters in each column indicate that the values are not statistically different, based on LSD values at the 5% significance level.
Table 6. Moisture rating for biomass pellets based on production efficiency and physical quality.
Moisture Content (% (wb))SEC (Wh/kg)Bulk Density (kg/m3)Durability (%)Total Score
1524410
2044412
253.5339.5
303227
353.5115.5
Score rankings are arranged in order of advantage in the same column from Table 5, with the letters a = 4, ab = 3.5, b = 3, bc = 2.5, c = 2, cd = 1.5, d = 1.
Table 7. Statistical analysis of type of materials affecting various indicators.
SourcedfF-ValuedfF-Value
SECBulk DensityDurabilityPellet DensityDiameterLengthWeight
ToM60.85 ns98.60 **5.74 **6144.00 **49.50 **12.60 **35.10 **
Error14 203
Total20 209
CV (%) 17.893.080.66 7.822.5115.2817.45
ns non-significant; ** highly significant at 1% level.
Table 8. Type of materials affecting the average specific energy, average bulk density, average durability, and pellet characteristics.
ToMBulk Density
(kg/m3)
Durability
(%)
Pellet Density
(g/cm3)
Diameter
(mm)
Length
(mm)
Weight
(g)
SS567.12 e98.26 ab1.0564 c6.23 b20.91 b0.67 c
SCB610.43 cd98.17 b1.0672 c6.27 b20.40 b0.67 c
PMD908.53 a99.36 a1.5439 a5.77 e23.46 a0.95 a
MIX1590.43 de96.80 c0.9257 d6.35 a16.69 c0.50 d
MIX2607.37 d96.78 c1.0604 c6.28 ab20.91 b0.69 bc
MIX3663.66 b98.10 b1.1586 b6.12 c21.80 b0.74 b
MIX4645.31 bc98.05 b1.1892 b6.03 d21.36 b0.73 bc
LSD0.0535.401.14 0.0455 0.071.620.06
The same letter indicates non-significant at LSD test (α = 0.05).
Table 9. Rating of sugar industry byproduct biomass pellets based on production efficiency, physical quality, and fuel characteristics.
ToM
(Pellet)
Specific Energy
Consumption
DurabilityLower Heating ValueEnergy DensityEnergy RatioFuel Value IndexTotal
Score
Material PreparationPelletizing
SS205112112
SCB644646535
PMD066000012
MIX1431324320
MIX2550435426
MIX3123261217
MIX4312553625
Points ranked in order of advantage in the same column. The highest value in order of advantage is set to 6, while the lowest value is set to 0.
Disclaimer/Publisher’s Note: The statements, opinions and data contained in all publications are solely those of the individual author(s) and contributor(s) and not of MDPI and/or the editor(s). MDPI and/or the editor(s) disclaim responsibility for any injury to people or property resulting from any ideas, methods, instructions or products referred to in the content.