Abstract
The apparel industry is the second largest source of pollution globally, following only the petrochemical industry in terms of environmental pollution caused by production, sales, and consumption processes. Low-carbon, environmentally friendly, and energy-efficient production and consumption methods are crucial pathways for the apparel industry to achieve carbon neutrality targets. Therefore, considering green investments in apparel products and the recycling of discarded apparel, this paper investigated the inventory and pricing optimization decisions of apparel enterprises within the context of a carbon neutrality target. The results indicated that green investment or recycling can effectively increase the total profits of the apparel brand. Due to the cumulative effect of comprehensive environmental strategies, apparel brands achieve greater profits when simultaneously adopting both green investments and recycling efforts compared to implementing either one alone. Green investments focus on reducing the environmental impact during production by minimizing resource consumption and emissions from the source, while recycling emphasizes product reutilization, effectively extending the utilization cycle of resources. By implementing these two strategies, brands not only reduce the negative environmental impacts during production but also maximize resource reuse throughout the product lifecycle.
1. Introduction
In recent years, in order to respond to the challenge of global climate change and promote green and low-carbon development, countries around the world have implemented the goal of carbon neutrality in the form of legislation and proposed feasible paths to achieve carbon neutrality [1]. On 15 January 2020, the European Commission introduced the European Green Deal, outlining the European Union’s carbon emission reduction target to achieve carbon neutrality by 2050. In September 2020, China explicitly stated its aim to peak carbon emissions before 2030 and strive to achieve carbon neutrality by 2060. The apparel supply chain causes environmental pollution in all aspects of production, sales, and consumption, second only to the petrochemical industry, making it the second largest source of pollution in the world [2,3]. According to data from the United Nations Environment Program (UNEP), the apparel industry is responsible for 10% of annual global carbon emissions, more than all international flights and maritime shipping combined [4]. Predictions indicate that when the world’s population reaches 8.5 billion by 2030, carbon emissions from the apparel and textile industry may surpass the petroleum industry and become the largest source of carbon emissions. Furthermore, by 2050, the apparel industry will consume more than 30% of the global carbon budget [5]. Hence, the green and low-carbon transformation of the apparel industry is urgent, and carbon-neutral apparel will become mainstream in the future.
To actively promote low-carbon technologies and products and collectively advance climate action within the industry, many apparel brands are actively participating in creating sustainable industrial value ecosystems, taking on the social responsibility of achieving carbon peaking and carbon neutrality. In June 2021, the China National Textile and Apparel Council released the “14th Five-Year Plan for the Development of the Textile Industry” and the “Guiding Opinions on Science, Technology, Fashion, and Green Development”, as well as initiated the “China Fashion Brand Climate Innovation Carbon Neutrality Acceleration Plan”, aiming to accelerate the green and low-carbon transformation of the industry and further contribute to the goals of carbon peaking and carbon neutrality. Achieving the dual carbon goals is no easy task, requiring not only macro-policy guidance but also low-carbon practices from the textile and apparel industry. The data indicate that producing 1 ton of textiles emits approximately 17 tons of greenhouse gases. In efforts to reduce carbon emissions, major apparel brands are implementing innovative strategies in both production and recycling processes.
In the production process, most textile and apparel brands invest in manufacturers’ green and low-carbon technology support to alleviate environmental problems [6]. For instance, Uniqlo has developed numerous sustainable technology products through innovative water-saving and recycled fabric technologies [7]. This initiative allows more people to wear green products and experience and support green consumption, thus fostering a green and low-carbon lifestyle. H&M is gradually phasing out non-environmentally friendly coal-based energy and providing financial support to manufacturers to transition to cleaner renewable energy sources such as solar photovoltaic, solar thermal, and agricultural waste heat. Furthermore, many apparel brands are utilizing biodegradable materials to produce their products. For example, the sportswear company Xtep has produced eco-friendly windbreakers with 100% polylactic acid content, using biodegradable environmental materials [8]. Therefore, through green investments in the production process, apparel brands can manufacture green and low-carbon products, thereby implementing their corporate green and sustainable strategies.
Due to its consumable nature, apparel generates a significant amount of waste, with a high rate of apparel being left unused [9]. According to research statistics, the average Chinese household discards approximately 30 kg of unused apparel each year [10]. Therefore, increasing efforts in apparel recycling can reduce resource wastage and environmental pollution. For example, Uniqlo introduced the RE.UNIQLO project in 2020, which involves recycling used down products collected from selected markets to produce new items such as recycled down jackets, thus promoting recycling efforts and reducing waste. Anta prioritizes sustainable packaging for circular products, utilizing recycled or recyclable materials and FSC-certified paper packaging to minimize virgin plastic usage and enhance the sustainability quotient of its product packaging.
Carbon tax, as a crucial environmental policy tool, stands as one of the universal systems employed by various countries to achieve carbon neutrality goals [11,12]. The implementation of carbon taxes plays a positive role in driving the green and low-carbon transformation of the apparel industry [13]. Currently, apparel exported to the European Union (EU) is subject to carbon taxation. As China is a major player in the apparel manufacturing industry, its textile and apparel exports have a carbon emission intensity of 1.54 kg per US dollar. This implies that Chinese textile and apparel exports will face increased carbon taxes and indirect costs in global competition in the future. Therefore, under the carbon neutrality target, exploring how government carbon tax policies can incentivize apparel brands to invest in green products and increase recycling efforts is crucial, as it reduces the additional carbon tax burden and fosters low-carbon sustainable development in the industry.
In addition, inventory has always been a core issue facing the apparel industry [14]. Under carbon neutrality targets, green and sustainable development and inventory optimization have become indispensable and important issues in the apparel industry. The issue of excess inventory not only threatens the economic viability but also poses significant environmental impacts that cannot be overlooked. For example, in 2018, H&M burned 60 tons of clothing, while Burberry burned stock worth 28.6 million pounds. The incineration of large quantities of inventory not only causes financial losses but also exacerbates resource wastage and environmental pollution. Therefore, through effective inventory management and optimization, apparel brands can mitigate the risk of excess inventory, reduce resource wastage, and achieve the goal of sustainable development.
While prior studies have studied the impact of government carbon tax on production decisions in the supply chain (Qi et al. [11]; Meng et al. [15]; Zhou et al. [16]), green investment to reduce carbon emissions (Guo et al. [17]; Xu et al. [6]; Hsu et al. [18]; Chen [19]; Xu and Duan [20]; Zhang et al. [21]) and recycling discarded products(Cai et al. [22]; Xie et al. [10]; Rathinamoorthy [9]; Wiedemann et al. [23]), there is limited research that explores the impact of both green investment and recycling strategies on the pricing and inventory for apparel industry under carbon tax policy. Therefore, this paper mainly aimed to fill the gaps by considering green investment and recycling and analyzing their effects on optimal decisions in apparel brands. Specifically, we aimed to address the following research questions:
RQ1: Under carbon tax policies, how do the adoption of green investment and recycling efforts by apparel brands affect their profits?
RQ2: What are the effects of separate adoption of green investment and recycling efforts on pricing and inventory optimization strategies for apparel brands?
RQ3: Is there a compound effect of concurrently implementing green investment and recycling strategies?
To address the aforementioned questions, this paper studied the pricing and inventory optimization decisions of apparel brands under the government’s carbon tax policy by considering the green investment and recycling efforts of apparel brands. Specifically, we considered the following four scenarios to establish optimization models for the apparel: benchmark, considering green investment, considering recycling efforts, and considering both green investment and recycling efforts. Through numerical simulation, we analyzed the impact of green investment and recycling efforts on the apparel brand’s pricing, order quantities, and profits.
Our study makes three significant contributions to the existing literature. Firstly, we contribute to apparel industry research by investigating how green investment and recycling efforts, within the framework of carbon tax policy, synergistically reduce carbon emissions, providing insights into their effective collaboration towards achieving carbon neutrality goals. Secondly, we extend the presence literature by examining the effects of adopting green investment and recycling initiatives on pricing and inventory decisions for apparel brands. Our findings provide practical guidance for integrating sustainability considerations into business operations. Thirdly, by elucidating the role of green investment and recycling in achieving carbon neutrality, our research provides a roadmap for sustainable practices in the fashion sector. We highlight the importance of proactive environmental management in reducing carbon footprints across the apparel supply chain. In summary, our research conclusions can provide theoretical and practical reference for the green and low-carbon development of the apparel industry.
The rest of this paper is structured as follows. Section 2 provides a literature review of pricing and inventory in apparel supply chains, green investment, recycling, and carbon tax. Section 3 presents the model description and related assumptions. Section 4 establishes four models considering green investment and recycling efforts for the apparel brand. Section 5 provides a numerical analysis to analyze the impact of green investments and recycling efforts on optimal decisions and the sensitivity of key model parameters. Section 6 summarizes the main results and provides some management implications and the area of future research. All proofs are in the appendix (Appendix A).
2. Literature Review
This section summarizes the literature related to our research, mainly including four streams: pricing and inventory in apparel supply chains, green investment, recycling, and carbon tax.
2.1. Pricing and Inventory in Apparel Supply Chains
Inventory planning is crucial in the apparel industry, particularly in supply chain management. Given the short sales cycles and high demand volatility of apparel products, replenishment decisions are necessary, often made at the onset of ordering or after fluctuations in sales seasons, highlighting the essentiality of inventory planning strategies [14,24]. Choi [25] investigated the pre-season inventory and pricing decisions for fashion retailers. Zhou et al. [26] formulated the inventory and pricing jointly optimization model for fashion apparel under deteriorating fashion levels and partial backlogging conditions. They found that the presence of a shortage has had an affirmative effect on the ordering policy of the fashion apparel retailer. Kogan et al. [27] utilized an inventory model integrating time and product pricing to design and determine the optimal price of products, as well as to ascertain the optimal equilibrium production quantity and inventory level. Tsao [28] introduced an innovation by incorporating demand-dependent time-varying pricing into the inventory model, considering payment delays in orders and allowing for stockouts, thus making some modifications. Wang [29] considered the interactive impact of advertising efforts and water-saving on corporate profits and studied optimal pricing strategy in apparel supply chains. In contrast to the aforementioned literature, we have considered the influence of green investments and recycling efforts on pricing and inventory optimization for apparel brands within the context of carbon neutrality.
2.2. Green Investment
With the rapid development of the economy, social and ecological environmental issues are becoming increasingly severe, such as glacier melting, declining biodiversity, soil erosion, global warming, ozone layer depletion, and land resource scarcity [30]. As environmental awareness continues to grow, an increasing number of consumers are opting to purchase green and low-carbon products [20,31]. To meet market demand and environmental requirements, more and more brands and manufacturers are actively investing in green and low-carbon products [6,17]. It is important to study the impact of green innovation on the green and low-carbon transition of enterprises. Zhang et al. [21] used the panel data of Chinese heavy pollution listed enterprises and constructed the negative binomial distribution model to conduct a theoretical mechanism analysis and empirical data validation on businesses’ green innovation. Fang et al. [32] explored the relationship between green innovation and urban carbon emission efficiency. Chen [19] investigated how manufacturers in green supply chains respond to various environmental standards set by governments, as well as the impact of these standards on the investment of green products. In the context of increasing consumer environmental awareness, Hsu et al. [18] explored how brands should innovate in the design of green products to attract consumers’ attention, thereby enhancing demand and maximizing the interests of supply chain members. Xu and Duan [20] examined optimal strategies for pricing and greenness investment for green products with government subsidies and explored the conditions for adopting blockchain technology. In contrast to the aforementioned studies, our research considers not only green investments but also how apparel brands can reduce carbon emissions through recycling and reuse methods within the context of carbon neutrality.
2.3. Recycling and Reuse
With the exacerbation of environmental pollution and emissions, coupled with the improvement of people’s economic status and the continuous updating of apparel demands, the quantity of discarded products has increased accordingly [3,33]. Consequently, the efficient handling and rational utilization of discarded items are issues worthy of discussion. Many researchers have contributed to the topic of recycling and reusing waste apparel [10]. Cai et al. [22] explored the commercial used apparel collection programs and recycled the used apparel from consumers. Wu [34] and Ferrer and Swaminathan [35] studied how remanufacturing through recycling of discarded products enhances product recyclability, not only fostering environmental consciousness and reducing manufacturing costs for enterprises but also potentially enhancing and improving brand reputation to a certain extent. Zhang and Dong [36] defined purchasing second-hand, renting, and swapping apparel as second-hand apparel recycling and took China as an example to explore the residents’ second-hand apparel recycling intention. Rathinamoorthy [9] validated the enterprise benefits of utilizing waste fabric for reproducing apparel fabric, demonstrating that garments developed from recycled fibers are cheaper than those made from conventional raw materials. This approach offers a dual advantage for manufacturers, providing additional revenue from waste while addressing waste management and disposal challenges. Wiedemann et al. [23] analyzed commercial data to gauge the environmental impacts of recycled wool blend garments and their contribution to reducing emissions in the wool sweater market, relative to other garment-related emission reduction strategies. They discovered that boosting recycling rates and curbing environmental impacts hinges on brands and consumers. This can be achieved by ramping up garment donations for recycling and embracing garments made with recycled wool.
2.4. Carbon Tax
Many scholars have made outstanding research contributions in the field of carbon tax policy. Meng et al. [15] investigated how manufacturers choose between in-house production and outsourcing to third-party manufacturers under carbon tax policies. They analyzed production inventory levels, wholesale prices, and carbon tax rates as decision variables, conducting analyses of costs and profits under different tax rates, and found that government tax rates should not remain static but should instead be adjusted in phases based on actual circumstances. Zhou et al. [16] studied the impact of carbon taxes on decision-making across the entire supply chain under both competitive and non-competitive retail environments, with a focus on carbon emissions reduction. Cachon [37] investigated whether carbon tax prices could serve as effective tools for emission reduction from the perspectives of carbon emission intensity and cost. They found that while carbon taxes might not be the most effective means of emission reduction but can improve the manner in which energy consumption is managed. Our study is similar to Shen et al. [13] in considering green investments by apparel brands under government carbon tax policies. Also considering carbon tax policy, Qi et al. [11] studied their impact on a firm’s production decision and revenue and on total social welfare and found that it is possible for a risk-averse firm’s optimal profit, in some cases, to be higher than that of a risk-neutral firm when facing a carbon tax. However, the difference lies in our simultaneous consideration of the impact of recycling efforts on carbon emissions. Lyu et al. [38] investigated whether manufacturers invest in green technologies to reduce emissions and engage in recycling under government regulatory policies including cap-and-trade, strict carbon cap, and carbon tax. They found that whether the manufacturer engages in recycling depends on technological innovation and carbon cap. Similar to Lyu et al. [38], we also considered green investment and recycling, and additionally incorporated inventory and pricing decisions of apparel brands into our analysis.
Compared to the existing literature shown in Table 1, it is evident that previous studies have only examined certain aspects individually, such as green investment (see Hsu et al. [18]; Chen, [19]; Xu and Duan [20]; Zhang et al. [21]), recycling efforts (see Rathinamoorthy [9]; Xie et al. [10]), carbon tax (see Qi et al. [11]; Lyu et al. [38]), pricing, and inventory (see Shen et al. [14]; Chen et al. [24]; Wang [29]). In contrast, our paper comprehensively explores all these topics, which are crucial to the apparel industry in achieving sustainable development. Unlike the existing literature, our research examines the impact of carbon taxes on apparel brands within a carbon-neutral context and investigates how green investments and recycling efforts affect brand pricing, inventory, and profits. Additionally, our study explores joint pricing and inventory optimization strategies for apparel brands. By addressing these aspects, our paper aimed to bridge the gap in the existing literature by highlighting the differences and similarities between our research and related studies in five key aspects: green investment, recycling efforts, the apparel industry, carbon tax, pricing, and inventory, as shown in Table 1.

Table 1.
Position of this study.
3. Model Description
Consider an apparel brand that sells a certain type of apparel and adopts a fixed replenishment strategy. Under government carbon tax policies, carbon tax is one of the costs for the apparel brand. When the apparel brand makes green investments in products, the carbon emissions of the products are reduced, thereby reducing the cost of carbon taxes. The green investments of brands mainly include producing environmentally friendly and low-carbon products, as well as advertising and marketing campaigns promoting “green, low-carbon, and environmentally friendly” products [16]. In the context of carbon neutrality, to achieve green and sustainable development, apparel brands can not only make green investments in their products but also engage in the recycling and reuse of discarded garments. Therefore, this paper primarily investigates the pricing and inventory optimization decisions of the apparel brand under the following four scenarios: benchmark (B), green investment (G), recycling efforts (R), and consider both green investment and recycling efforts (GR).
To clarify the model, this paper presents the following basic assumptions:
- (1)
- Assuming that the apparel brand orders one time in each period, with order quantity . The purchase cost is , the product price is , and the unit quantity storage cost per unit time is . At the end of the cycle, the remaining products are cleared and the inventory will be zero, and those which are out of stock are not considered. The inventory level at time is and the sales cycle of the product is ;
- (2)
- Referring to Shen et al. [13], it is assumed that the cost of carbon tax is a linear function of carbon emissions per unit product, i.e., , where is the carbon emissions per unit product and is the tax rate per unit of carbon emissions;
- (3)
- In the context of green and low-carbon initiatives, the greenness of apparel products will influence the demand for these products in the market. Referring to Cai et al. [39], it is assumed that each apparel product has a logo representing greenness. The greenness of ordinary apparel products is , and the greenness of low-carbon and green apparel is . The higher the greenness level, the more environmentally friendly the product is perceived to be. In practice, the greenness level of apparel products can be reflected through energy labels, tags, information about harmful substance content, recyclability of product components, and other indicators [13];
- (4)
- In the benchmark model, the brand does not engage in green investments. Thus, consumer demand is mainly affected by the overall market size , product prices , and the greenness of general apparel products , that is
- (5)
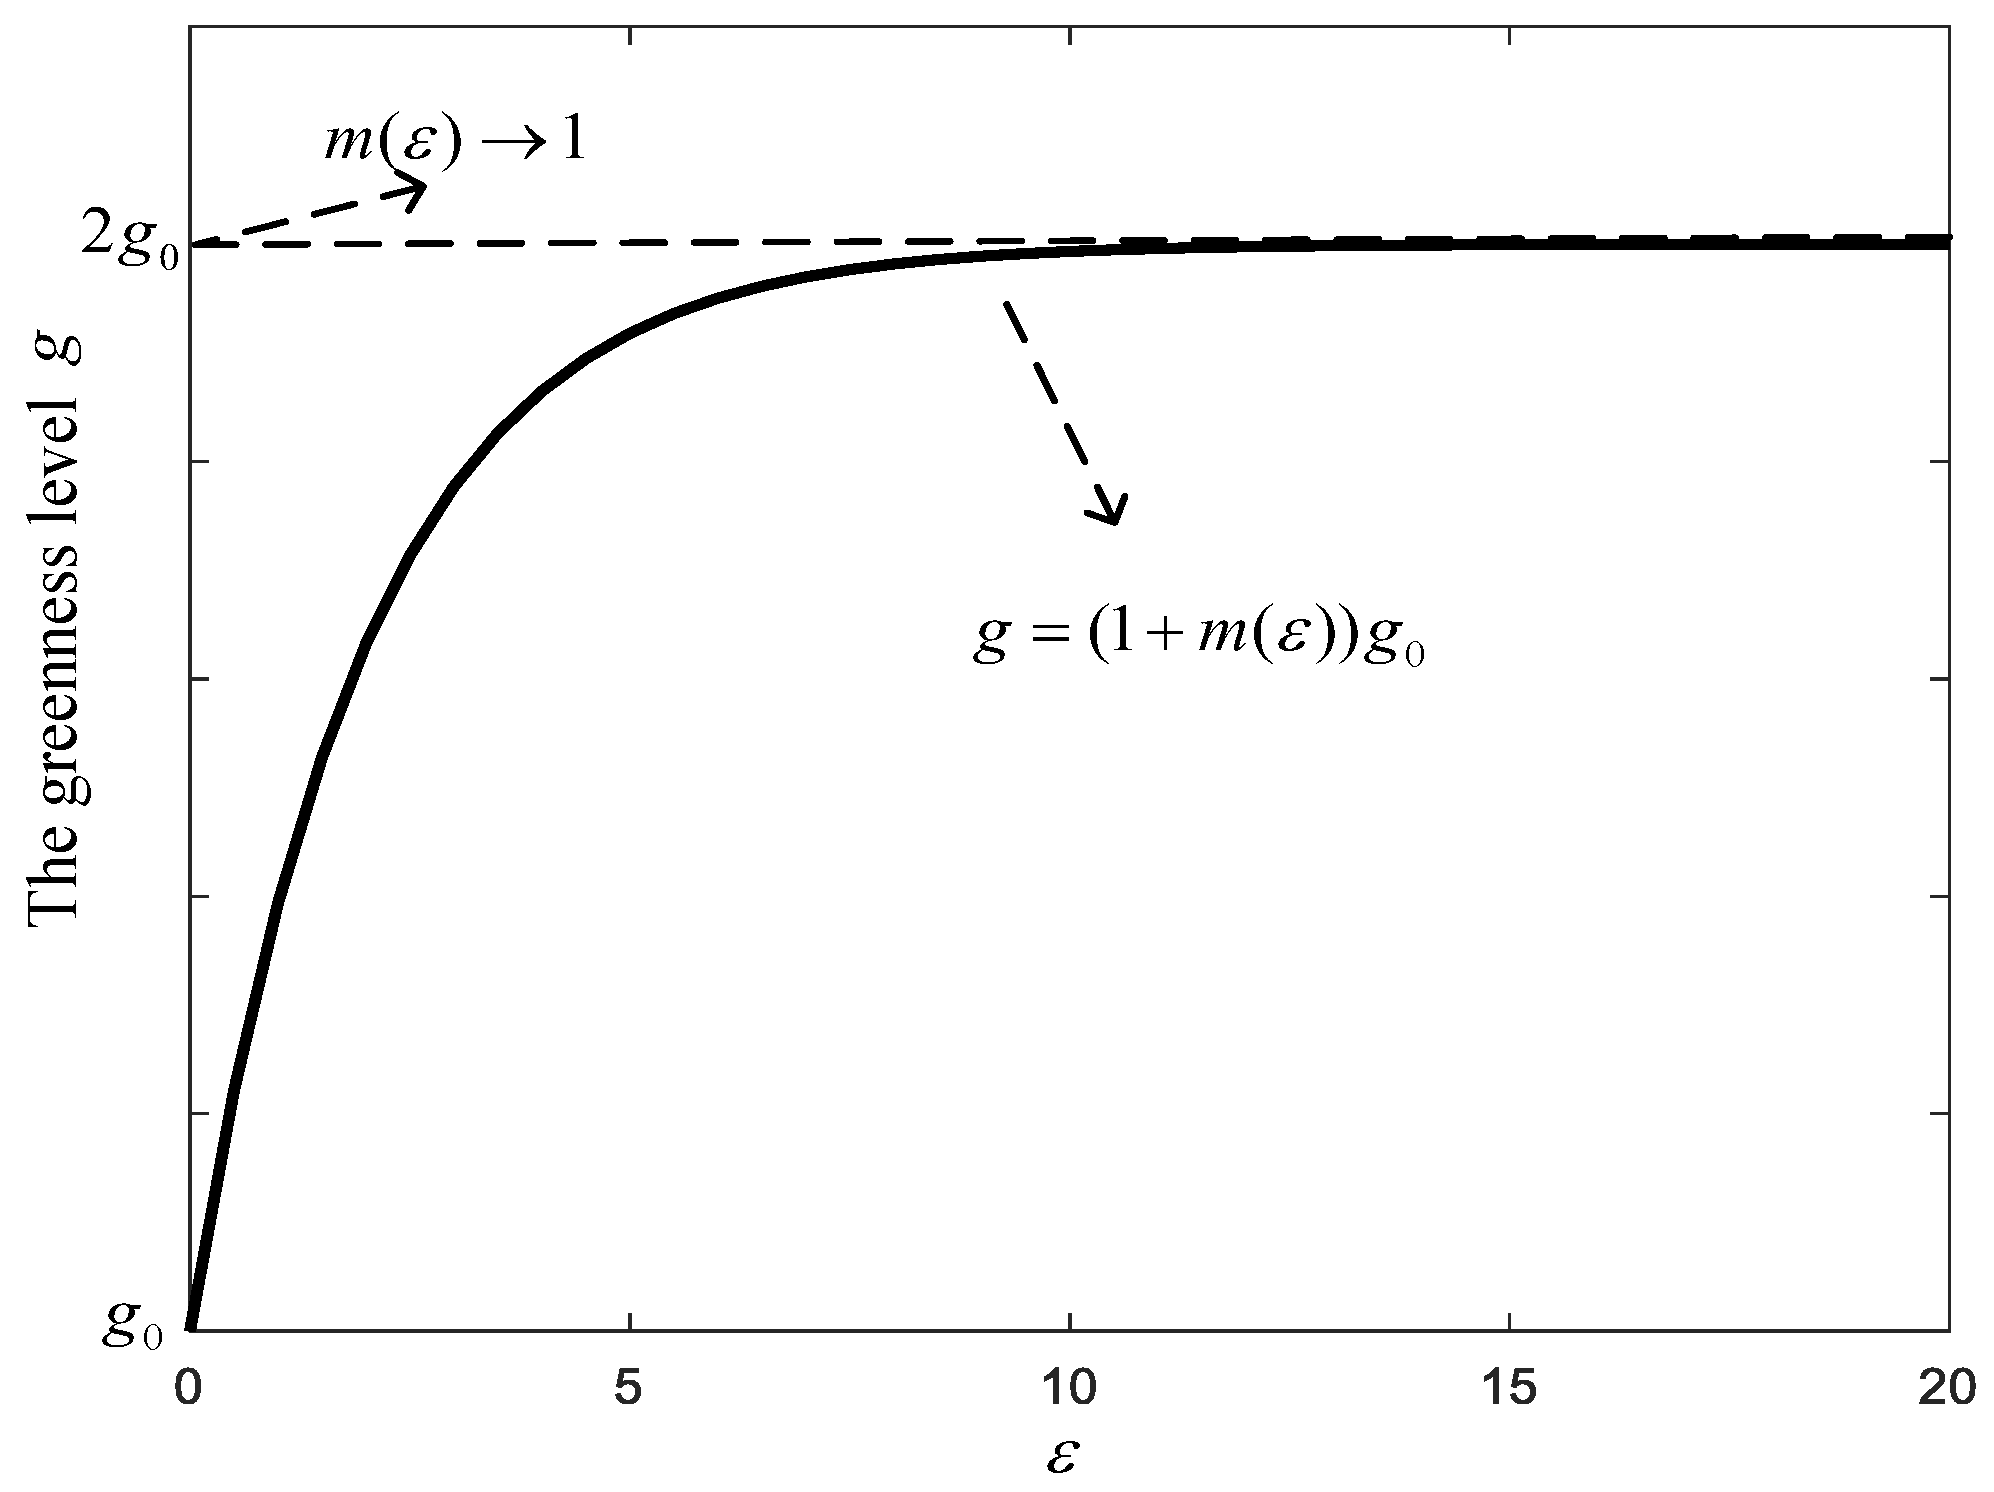
- When the brand considers green investment for environmental protection, the brand primarily engages in two aspects of investment: one is investing in environmentally friendly materials, technologies, and other resources to produce low-carbon green products, and the other is investing in green advertising and marketing to increase consumers’ green awareness. Assuming that the greenness level of apparel products increases nonlinearly with the increase in green investments by brand. Referring to Chen et al. [24], assuming the greenness function is
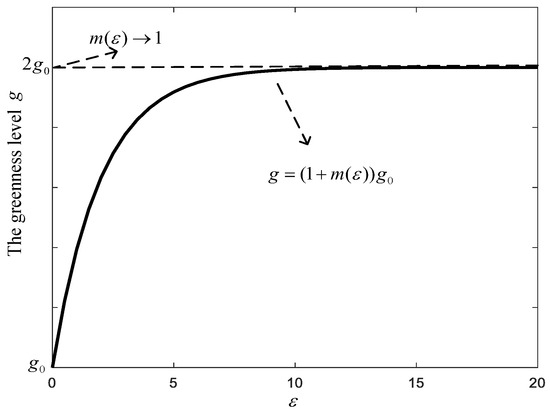
Figure 1.
The impact of green investments on the greenness level.
From Figure 1, it can be observed that as green investments increase, the greenness of apparel products also increases. However, as green investments increase, the magnitude of the increase in greenness becomes smaller and approaches a limit of . The depiction of the greenness of apparel can double consumers’ initial psychological perception of apparel greenness. In other words, the brand can increase consumers’ green awareness and thereby increase demand by making green investments in the early stages. However, when green investments reach a certain level, their impact on demand will diminish.
- (6)
- Assume that the brand’s cost of investing in producing green and low-carbon products during the sales cycle is , where the constant is the green investment cost coefficient, is the low-carbon cost coefficient, and is the green and low-carbon technology investment cost borne by the brand. In addition, the green advertising marketing cost of the brand is , where is marketing expenses;
- (7)
- When the brand considers green investment, the consumer demand function is
Based on the above-shown description and assumptions, whether the brand produces low-carbon apparel or regular apparel, increasing revenue requires improving inventory turnover and addressing the issue of apparel inventory backlog. Resolving inventory issues, reducing inventory costs, and scientifically formulating inventory-pricing strategies are also key focuses of this paper. Therefore, we first constructed a profit model for apparel brands within a single cycle to study pricing and inventory optimization decisions (Scenario B). Then, against the backdrop of carbon taxes, it integrated the brand’s green investments with the greenness of apparel products to establish an optimization model (Scenario G). Subsequently, considering the brand’s recycling efforts, an optimization model was established (Scenario R). Finally, we examined the optimization problem considering both green investments and recycling efforts (Scenario GR). The notations are summarized in Table 2.
Table 2.
Notations.
4. Model Solving and Analysis
4.1. Benchmark Scenario (B)
In the benchmark model, since the inventory level of apparel products changes with the sales time, according to the demand function of Equation (1), it can be deduced that within a sales cycle , the apparel inventory level changes with time as
By deriving on both sides of Equation (4), the differential equation of apparel inventory changes with respect to time level is with . Thus, we have . When , the order quantity for one cycle is the initial inventory .
In scenario B, the relevant costs of the apparel brand include ordering costs, carbon tax costs, and inventory costs, of which the brand’s inventory costs are . Thus, the total profit function of the apparel brand within an ordering cycle is
By solving the optimization problem , Proposition 1 is obtained.
Proposition 1.
In scenario B, the optimal product price of the apparel brand is
; and when the pricing
of the apparel brand reaches the optimal pricing
, the corresponding order quantity
is also the optimal order quantity
, that is
.
Proposition 1 proves the optimal pricing of the apparel brand and its corresponding optimal order quantity. In subsequent scenarios, the order quantity corresponding to the optimal pricing is also the optimal order quantity. Substituting the optimal pricing and order quantity into the profit function in Equation (5), we obtain the optimal profit for the brand in scenario B .
Corollary 1.
In scenario B, the optimal product price is positively related to the tax rate per unit of carbon emissions, while the optimal order quantity and optimal profit are negatively related to the tax rate per unit of carbon emissions.
Corollary 1 indicates that as the tax rate per unit of carbon emissions increases, the optimal price gradually increases. This implies that in practice, as the government’s carbon emission tax rate increases, it results in higher pricing by apparel brands. The pricing by brands is closely tied to the government’s carbon tax policy, as the tax rate has a proportional impact on pricing trends. Additionally, as the tax rate per unit of carbon emissions increases, the optimal order quantity for apparel brands gradually decreases. In reality, an increase in the government’s carbon emission tax rate leads to a decrease in the order quantity. Therefore, apparel brands prefer lower carbon emission tax rates to gradually increase the order quantity as expected. Furthermore, the optimal profit for apparel brands gradually decreases as the tax rate per unit of carbon emissions increases. The impact of the tax rate on brand profits follows a negative proportional growth trend.
4.2. Consider Green Investment (G)
In the context of the carbon neutrality target, to protect the environment and achieve sustainable development, the apparel brand considers green investments to produce and sell environmentally friendly and low-carbon apparel products. After making green investments, apparel products become more environmentally friendly and low-carbon, resulting in a reduction in carbon emissions. Assuming that the emission reduction rate per unit product after green investment is , then the carbon tax cost after green investment is . According to the demand function of Equation (2), it can be deduced that within a sales cycle , the apparel inventory level changes with time as . Deriving the left and right sides of the above equation with respect to time , we obtain the differential equation of apparel inventory with respect to changes as
By deriving on both sides of Equation (6), the differential equation of apparel inventory changes with respect to time level is with . Thus, we obtain . When , the order quantity for one cycle is the initial inventory as . In scenario G, the relevant costs of the apparel brand include ordering costs, green investment costs, carbon tax costs, and inventory costs, of which the inventory cost is . Therefore, the total profit function of the apparel brand in an ordering cycle is
By solving the optimization problem of the apparel brand , Proposition 2 is obtained.
Proposition 2.
In scenario G, the optimal product price and green investments
are given by the following system of equations
By substituting the optimal price and green investment into the order quantity and profit equations, we obtain the optimal order quantity and optimal profit . Since and do not have explicit expressions, we use the Gauss-Newton iteration method to solve the system of two nonlinear Equations (8). For the solution of this system of two nonlinear equations, we design the following algorithm for searching and solving, as shown in Algorithm 1.
| Algorithm 1. A simple algorithm to solve the system of nonlinear equations. | |
| Step 0 | Let and , and let the above-shown system of equations be denoted as , where and . |
| Step 1 | Let the Jacobian matrix of is and is the i-th step approximate solution of , then calculate the Taylor expansion of on , and through matrix operations to obtain . |
| Step 2 | Let = 1 and give the suitable initial value , . |
| Step 3 | Calculate and . |
| Step 4 | If , output the optimal solution ; Else, and return to Step 3. |
Corollary 2.
In scenario G, given a green investment level
, the optimal product price of the apparel brand is positively related to the overall market size, the sensitivity coefficient of consumers to the greenness level, and the green investment coefficient, and negatively related to the price sensitivity coefficient.
Corollary 2 suggests that the product prices of the apparel brand increase with the rise in overall market size, consumer sensitivity to product greenness level, and the green investment coefficient. This is because the increase in the market size changes the supply-demand dynamics, potentially leading to increased costs for the brand which are then reflected in product prices. Secondly, as the sensitivity coefficient of consumers to the greenness level continues to rise, the brand is compelled to increase green investments to meet this demand, opting for more environmentally friendly production processes or materials, thereby increasing product costs and driving price increases. Hence, the increase in prices is influenced not only by changes in market size but also by the growing attention of consumers to product greenness and the corresponding increase in the green investment coefficient. The greater the price sensitivity coefficient of low-carbon products, the more sensitive consumers are to product prices, leading to lower demand for the products and consequently lower selling prices for apparel.
4.3. Consider Recycling Efforts (R)
In the context of the carbon neutrality target, we consider the scenario where the apparel brand implements recycling efforts to reduce energy consumption and resource waste. The greater the recycling efforts invested by the brand in a product, the higher its recyclability rate. Consequently, the pollution caused by apparel to the environment decreases while its utility value increases. The recycling efforts of the brand do not directly affect the product demand function, but recycled products generate certain hidden values. For instance, during the product remanufacturing process, the brand saves a certain amount of costs, thereby impacting the brand’s profit. we assume that in the apparel production process, the unit production cost saved is , where is the recycling efforts and is the recycling effort coefficient of recyclable products. During the product recycling process, there is a certain expenditure of labor and technological resources. Therefore, the brand will incur a certain recycling cost , where represents the coefficient for recycling cost.
Through recycling and reuse, apparel products become more environmentally friendly, resulting in a reduction in carbon emissions. For example, H&M is committed to reducing carbon emissions through its “Conscious Collection” and “Garment Collecting” initiatives, reporting that by using recycled materials, their “Conscious Collection” products reduced their carbon footprint by approximately 16% in 2019. Therefore, assuming that the emission reduction rate per unit product is , the carbon tax cost is . In scenario R, consumer demand, order quantity, inventory level, and inventory cost are as follows: , , and . Therefore, the total profit function of the apparel brand within an ordering cycle is
By solving the optimization problem of the apparel brand , Proposition 3 is obtained.
Proposition 3.
In the scenario R, the optimal product price and recycling efforts
are as follows:
Bringing the optimal price and recycling efforts in Proposition 3 into the order quantity and profit functions, the optimal order quantity and profit of the brand are:
Corollary 3.
In scenario R, the impact of the key parameters (the recycling effort coefficient of recyclable products, the coefficient for recycling cost, and the emission reduction rate per unit product) on the optimal product price, recycling efforts, order quantity, and profit are as follows: (1) , , and ; (2) , , and ; (3) , , and .
Corollary 3 shows that as the recycling effort coefficient of recyclable products and the emission reduction rate per unit product increase, the optimal product price decreases, while recycling efforts, order quantity, and profit increase. This indicates a continuous increase in consumer demand for sustainable products under the current trend of heightened environmental awareness. With the widespread dissemination of environmental consciousness, consumers are more inclined to choose products that can reduce resource waste and environmental pollution, thereby promoting efforts in recycling and emissions reduction. Consequently, brands can adjust their production strategies, lowering product prices to attract more consumers, thereby increasing order quantities and profits. This positive cycle reflects the gradual deepening of the concept of sustainable development in the market, facilitating a mutually beneficial interaction between environmental protection and economic growth. However, as the coefficient for recycling cost increases, the optimal product price increases, while recycling efforts, order quantity, and profit decrease. This is because the increase in production costs necessitates brands to maintain profitability by raising product prices. Simultaneously, the rising costs of recycling may decrease consumer enthusiasm for recycling, thereby reducing recycling efforts. Moreover, the price increase leads to a decrease in order quantity, as consumers may be more inclined to purchase cheaper alternatives or reduce their purchase quantities. Ultimately, this change reduces overall profits.
4.4. Consider Both Green Investment and Recycling Efforts (GR)
In this subsection, we consider the simultaneous green investment and product recycling in the context of the carbon neutrality target. In this scenario, consumer demand, order quantity, inventory level, and inventory cost are , , and respectively. Due to the reduction in carbon emissions resulting from both green investments and recycling, the cost of carbon taxation is . Therefore, the total profits of the apparel brand is
By solving the optimization problem for the apparel brand , we obtain the following proposition.
Proposition 4.
In the scenario GR, the optimal product price
, green investments
and recycling efforts are given by the following system of equations
By substituting the optimal product price, green investments, and recycling efforts into the functions for order quantity and profit, we obtain the optimal order quantity and optimal profit for the apparel brand. Since the analytical expression in Equation (11) cannot be given, we use the algorithm in Table 2 for the numerical solution. The optimal results are presented in Section 5. It is worth noting that since three decision variables are involved in the GR scenario, the algorithm in Table 2 is accordingly changed to three variables, i.e., and . The rest of the solution process is the same as in Table 2.
5. Numerical Simulation and Comparative Analysis
5.1. Comparative Analysis of Optimal Results under Different Scenarios
In this section, we analyze the impact of green investments and recycling efforts on optimal decisions for the brand through numerical examples, further exploring the sensitivity analysis of key model parameters. All numerical examples are implemented using Matlab 2016a software on a computer with a CPU @ 2.27 GHz and 2.00 GB RAM. We set the basic parameters as follows: , , , , , , , , , , , , , , , and .
Table 3 presents the optimal product price, green investment, recycling efforts, order quantity, and profits of the brand in different scenarios. Based on the numerical simulation analysis mentioned above, the following claims can be drawn:
Table 3.
The optimal results in different scenarios.
Claim 1.
The optimal product prices after adopting green investment or recycling efforts are greater than those after not adopting green investment and recycling efforts, that is .
Claim 1 indicates that product prices rise after the adoption of green investment or recycling efforts. This is because the apparel brand allocates additional resources and incurs costs during the production process to implement sustainable measures. Recycling efforts and green investments require funding for improving production processes, utilizing environmentally friendly materials, and engaging in eco-friendly production. Although these measures have positive impacts on the environment and society, they correspondingly increase production costs, leading to an increase in product prices.
Claim 2.
The optimal order quantity after adopting green investment or recycling efforts is smaller than those after not adopting green investment and recycling efforts, that is, .
Claim 2 suggests that after adopting recycling efforts or green investment, the order quantity of the apparel brand is greater than when not adopting these efforts, a phenomenon attributable to the heightened consumer awareness of sustainability and environmental protection. With increasing concern for environmental conservation, consumers are inclined to support a brand that actively undertakes eco-friendly measures. Through recycling efforts and green investment, the brand not only demonstrates its environmental responsibility but also fulfills consumers’ pursuit of sustainability. Consequently, they attract more consumers to choose their products, thereby driving an increase in demand.
Claim 3.
The effort level for the apparel brand to adopt both green investment and recycling is greater than when either is adopted separately, that is , and .
Claim 3 indicates that brands adopting both green investment and recycling efforts exhibit a higher effort level compared to those adopting either effort individually, primarily due to the compounded effects of comprehensive environmental strategies. Green investment focuses on reducing environmental impacts in the production process, thereby reducing resource consumption and emissions at the source, while recycling emphasizes the reuse of products, effectively extending the lifespan of resources. By simultaneously employing these two strategies, the brand can minimize negative environmental impacts during production and maximize resource reuse throughout the product lifecycle, resulting in more significant environmental benefits. Furthermore, this comprehensive approach also enhances brand image, attracting consumers with stronger environmental awareness and subsequently driving market share growth.
Claim 4.
Green investment and recycling can effectively increase the total profits of the brand, that is .
Claim 4 suggests that the apparel brand simultaneously adopts green investment and recycling efforts yield higher profits compared to those adopting either effort individually or neither. This is attributed to the enhancement of brand image through green investment and recycling efforts, which foster consumer trust and support, consequently increasing sales volume and market share. Additionally, by implementing these environmentally friendly measures, the brand can reduce resource wastage and environmental pollution, lower production costs, mitigate legal risks, and ultimately enhance overall profitability.
5.2. Sensitivity Analysis of Key Parameters to Optimal Results
In this subsection, we will analyze the impact of key parameters on optimal decisions and profits of the apparel brand. Since Corollary 1 and Corollary 3 have already provided theoretical proofs of the influence of key parameters on optimal decisions under scenarios B and R, while optimal decisions in scenarios G and GR lack explicit expressions, numerical simulation is adopted in this subsection to analyze the sensitivity of key parameters on optimal decisions. The basic parameter settings remain the same as in Section 5.1.
Table 4 gives the impact of the green investment coefficient on the optimal price, order quantity and profits of the apparel brand under scenario G. Table 3 shows that as the green investment coefficient increases, the optimal price and profit increase, while the order quantity decreases. However, the impact of the green investment coefficient on green investment is not monotonic, but increases first and then decreases. This is because the concavity of the greenness function with respect to the green investment coefficient , where the second derivative , according to the law of diminishing marginal returns in economics, when the green investment coefficient is small (e.g., ), a substantial increase in greenness can be achieved, leading to a significant profit margin expansion. Consequently, the brand is incentivized to increase green investment. Conversely, when the green investment coefficient is large (e.g., ), the profit margin expansion is smaller, and the optimal green investment for the brand is also relatively lower.
Table 4.
The impact of the green investment coefficient on optimal results under scenario G.
Table 5 gives the joint effect of the green investment coefficient and recycling effort coefficient on the optimal price, order quantity, and profits of the apparel brand under scenario GR. Table 5 demonstrates that when the recycling effort coefficient is fixed, the optimal price, green investment, and recycling efforts increase gradually as the green investment coefficient increases. However, the optimal order quantity and profit decrease. Conversely, when the green investment coefficient is fixed, the optimal price decreases as the recycling effort coefficient increases, while the optimal green investment, recycling efforts, order quantity, and profit all increase. This contrasts with the findings in Table 4. The primary reason for this discrepancy lies in the combined effect of green investment and recycling efforts. When the recycling effort coefficient is fixed, increasing the green investment coefficient leads to higher costs, resulting in an increase in the optimal price. At the same time, as green investment increases, the band needs to reduce order quantity to maintain profitability, thus reducing the optimal order quantity and profit. However, when the green investment coefficient is fixed, increasing the recycling effort coefficient encourages more resource recycling, thereby reducing production costs. This ultimately leads to a decrease in the optimal price, while the optimal green investment, recycling efforts, order quantity, and profit all increase. This reflects the complex balance between environmental measures and cost-effectiveness.
Table 5.
The joint effect of the green investment coefficient and recycling effort coefficient on optimal results under scenario GR.
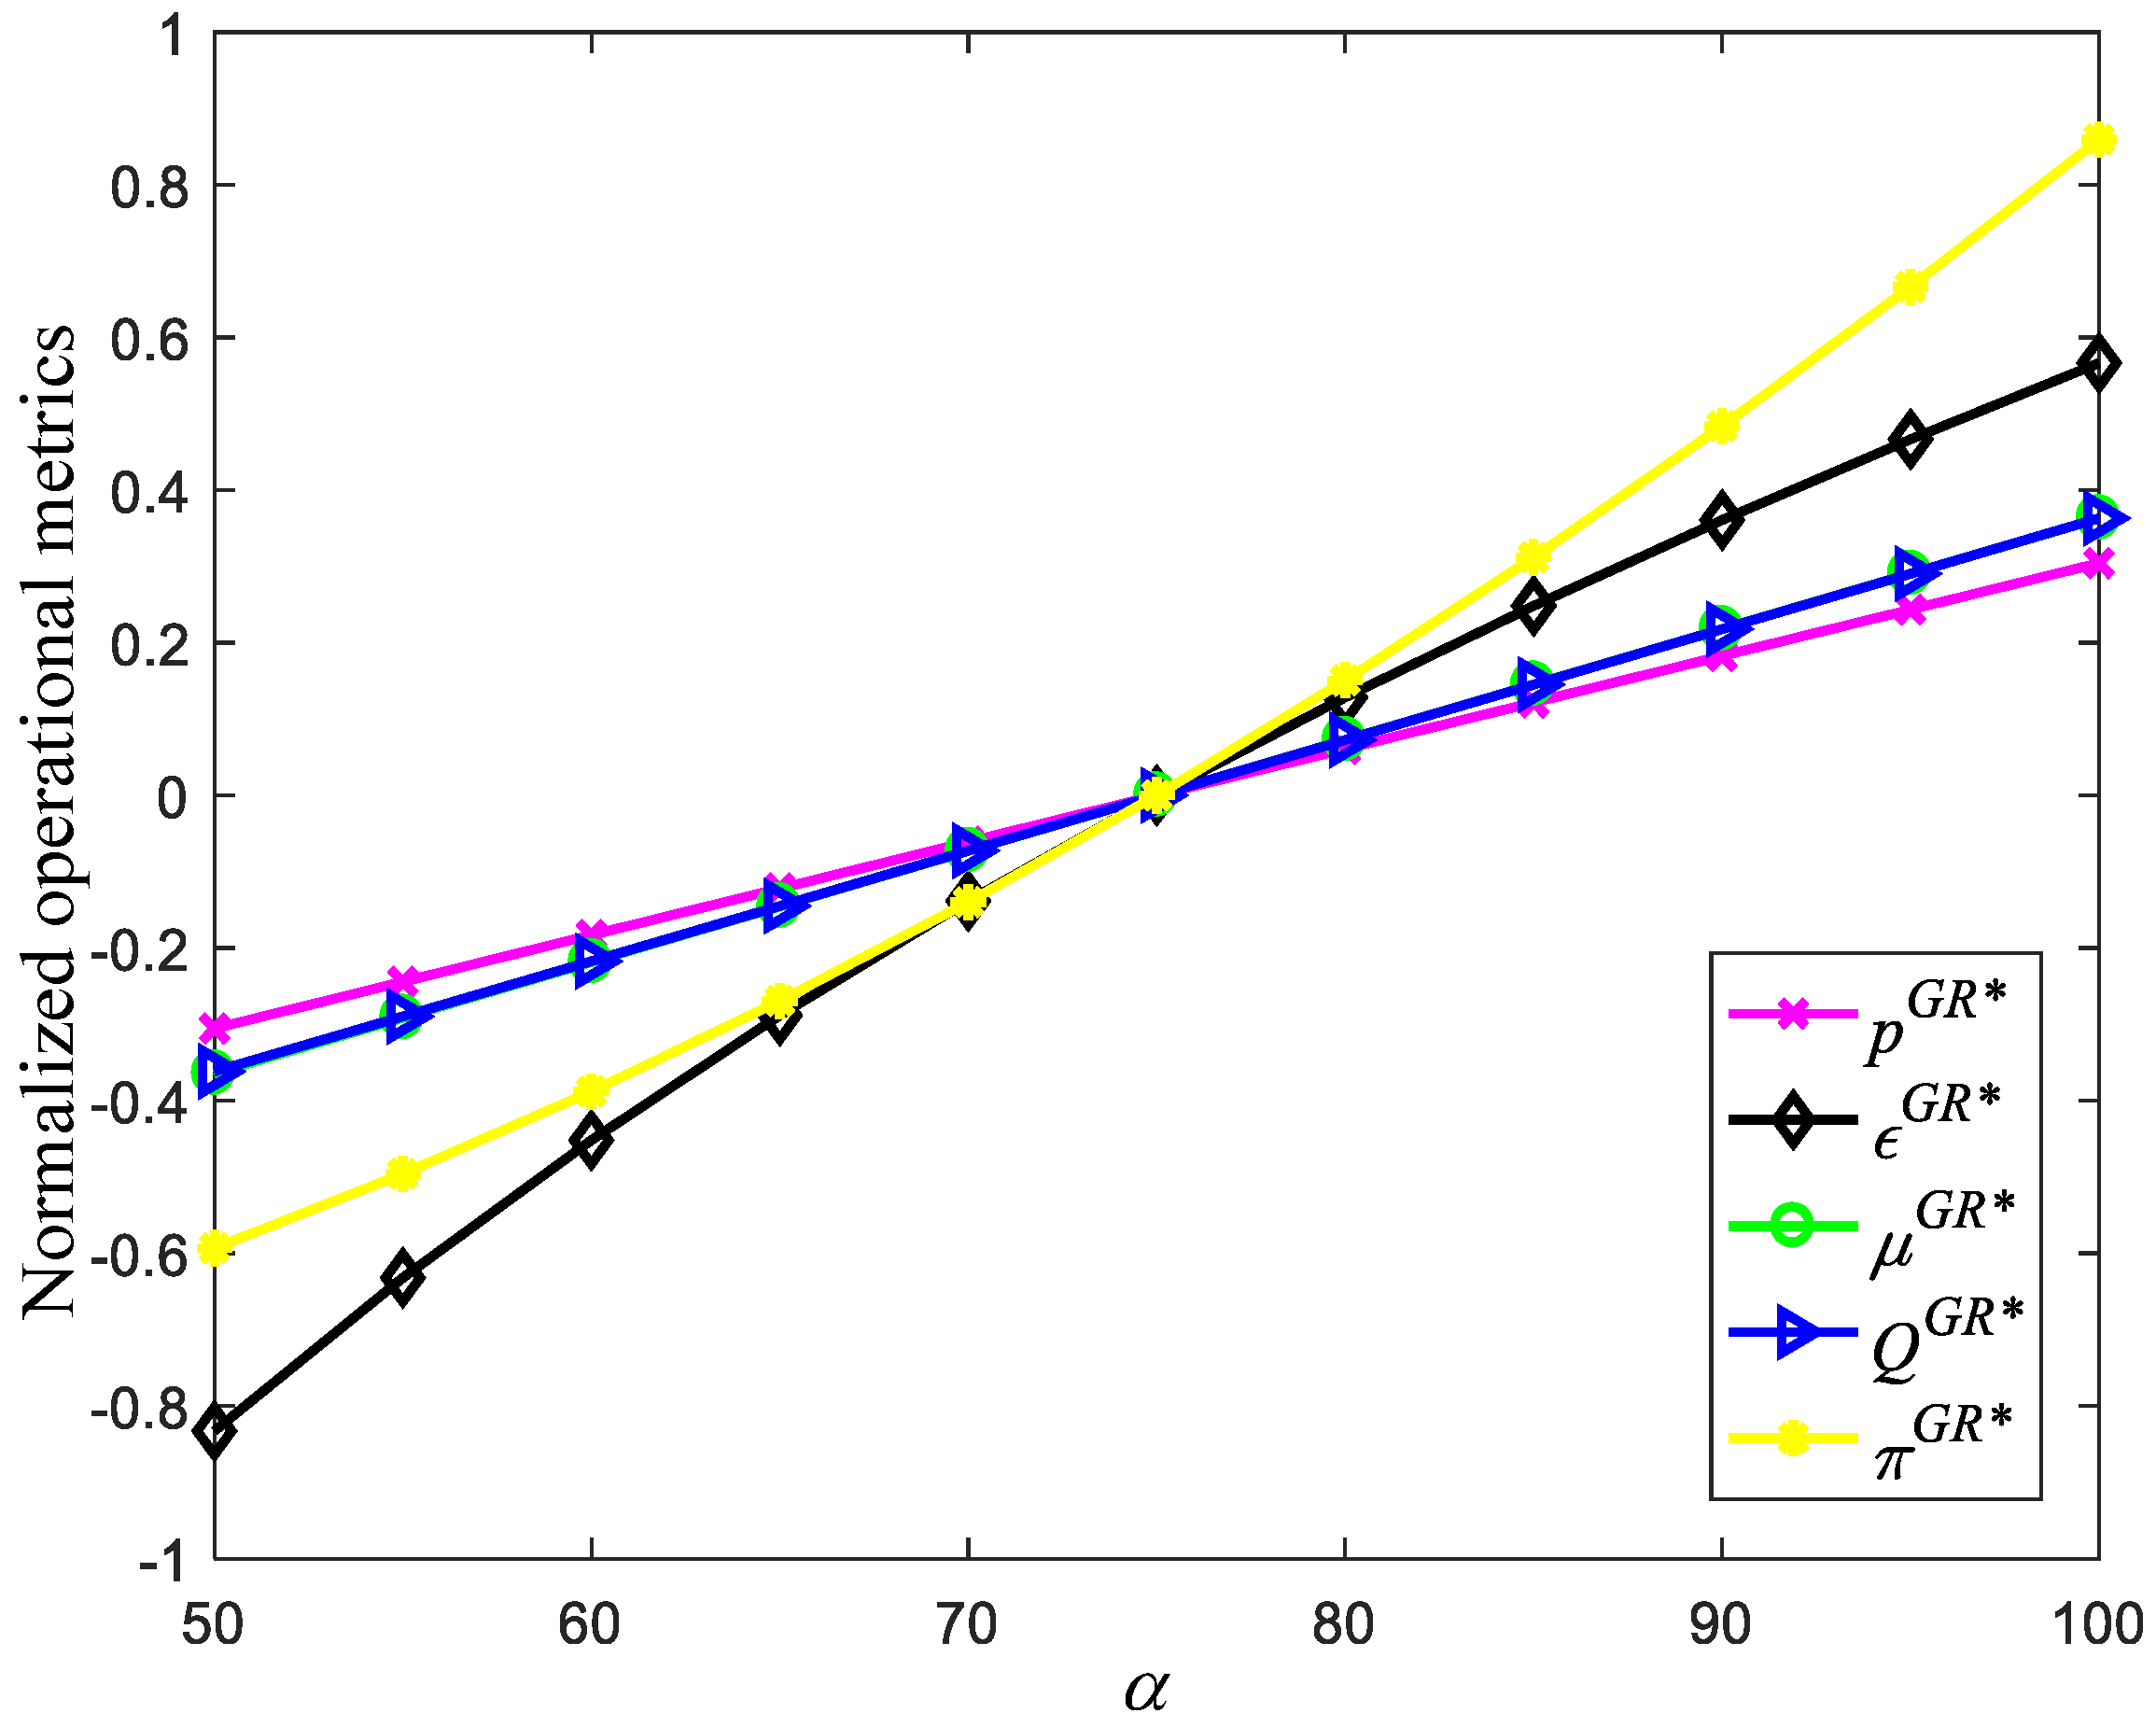
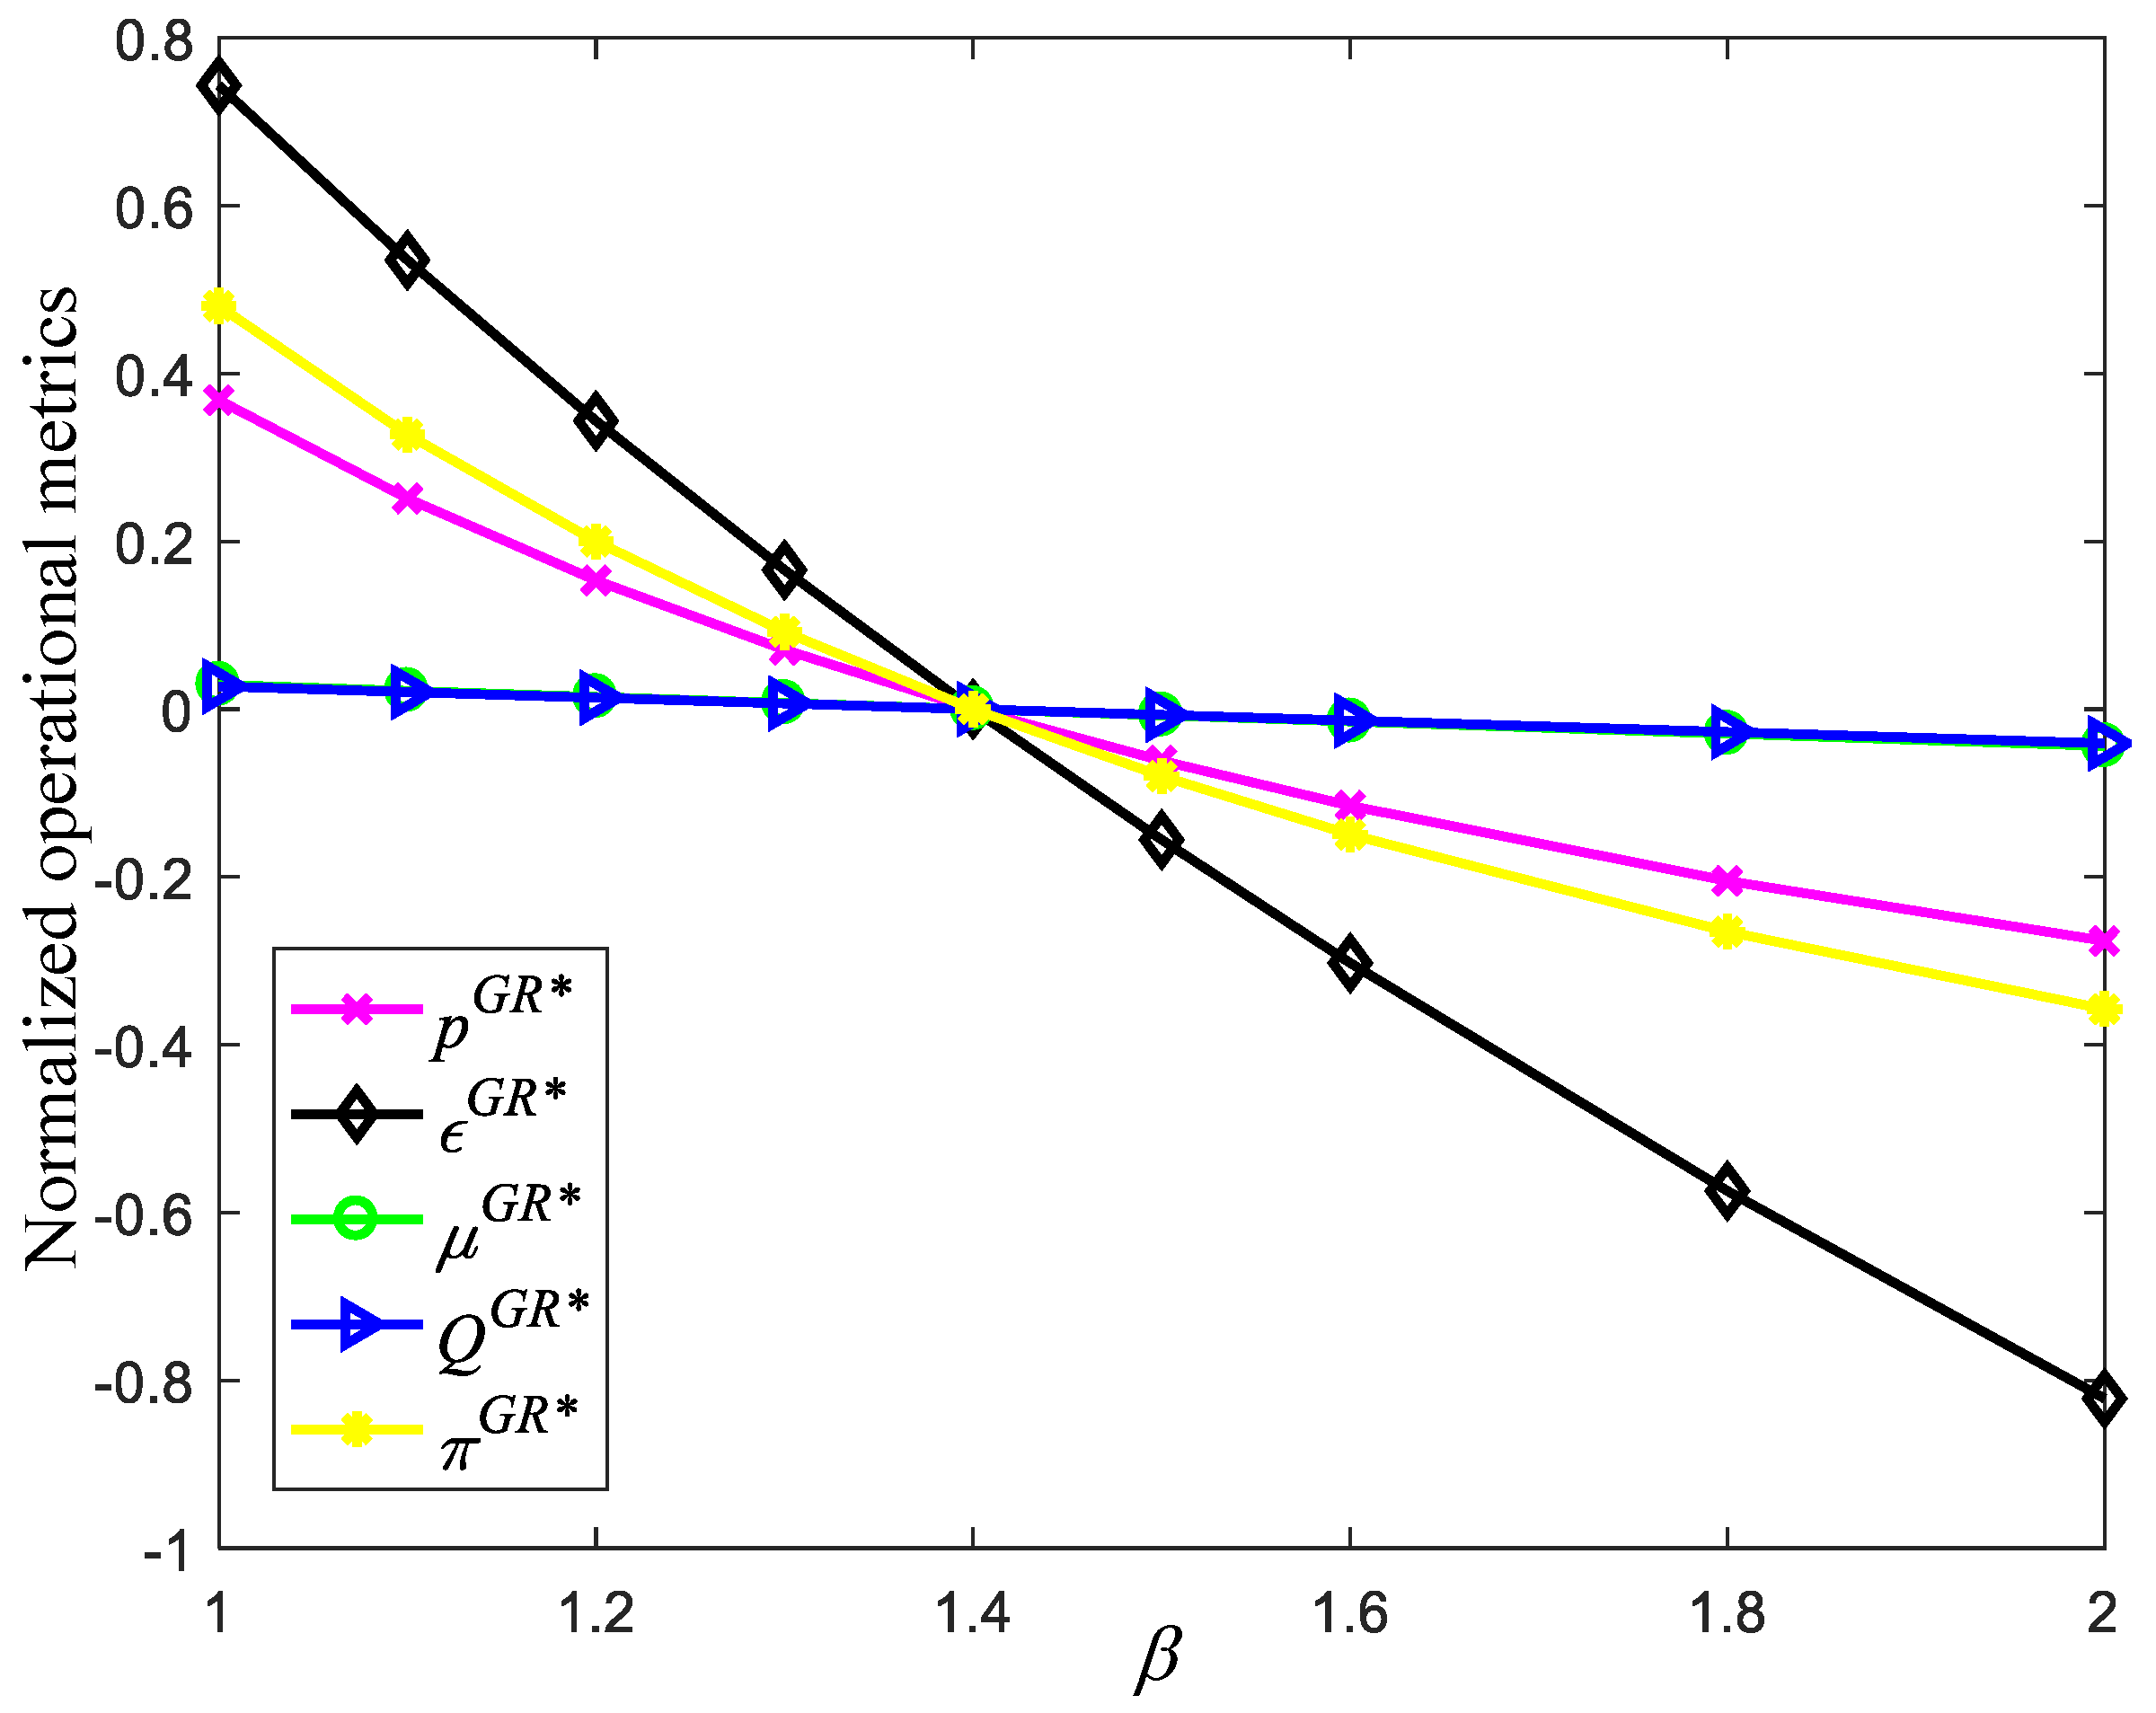
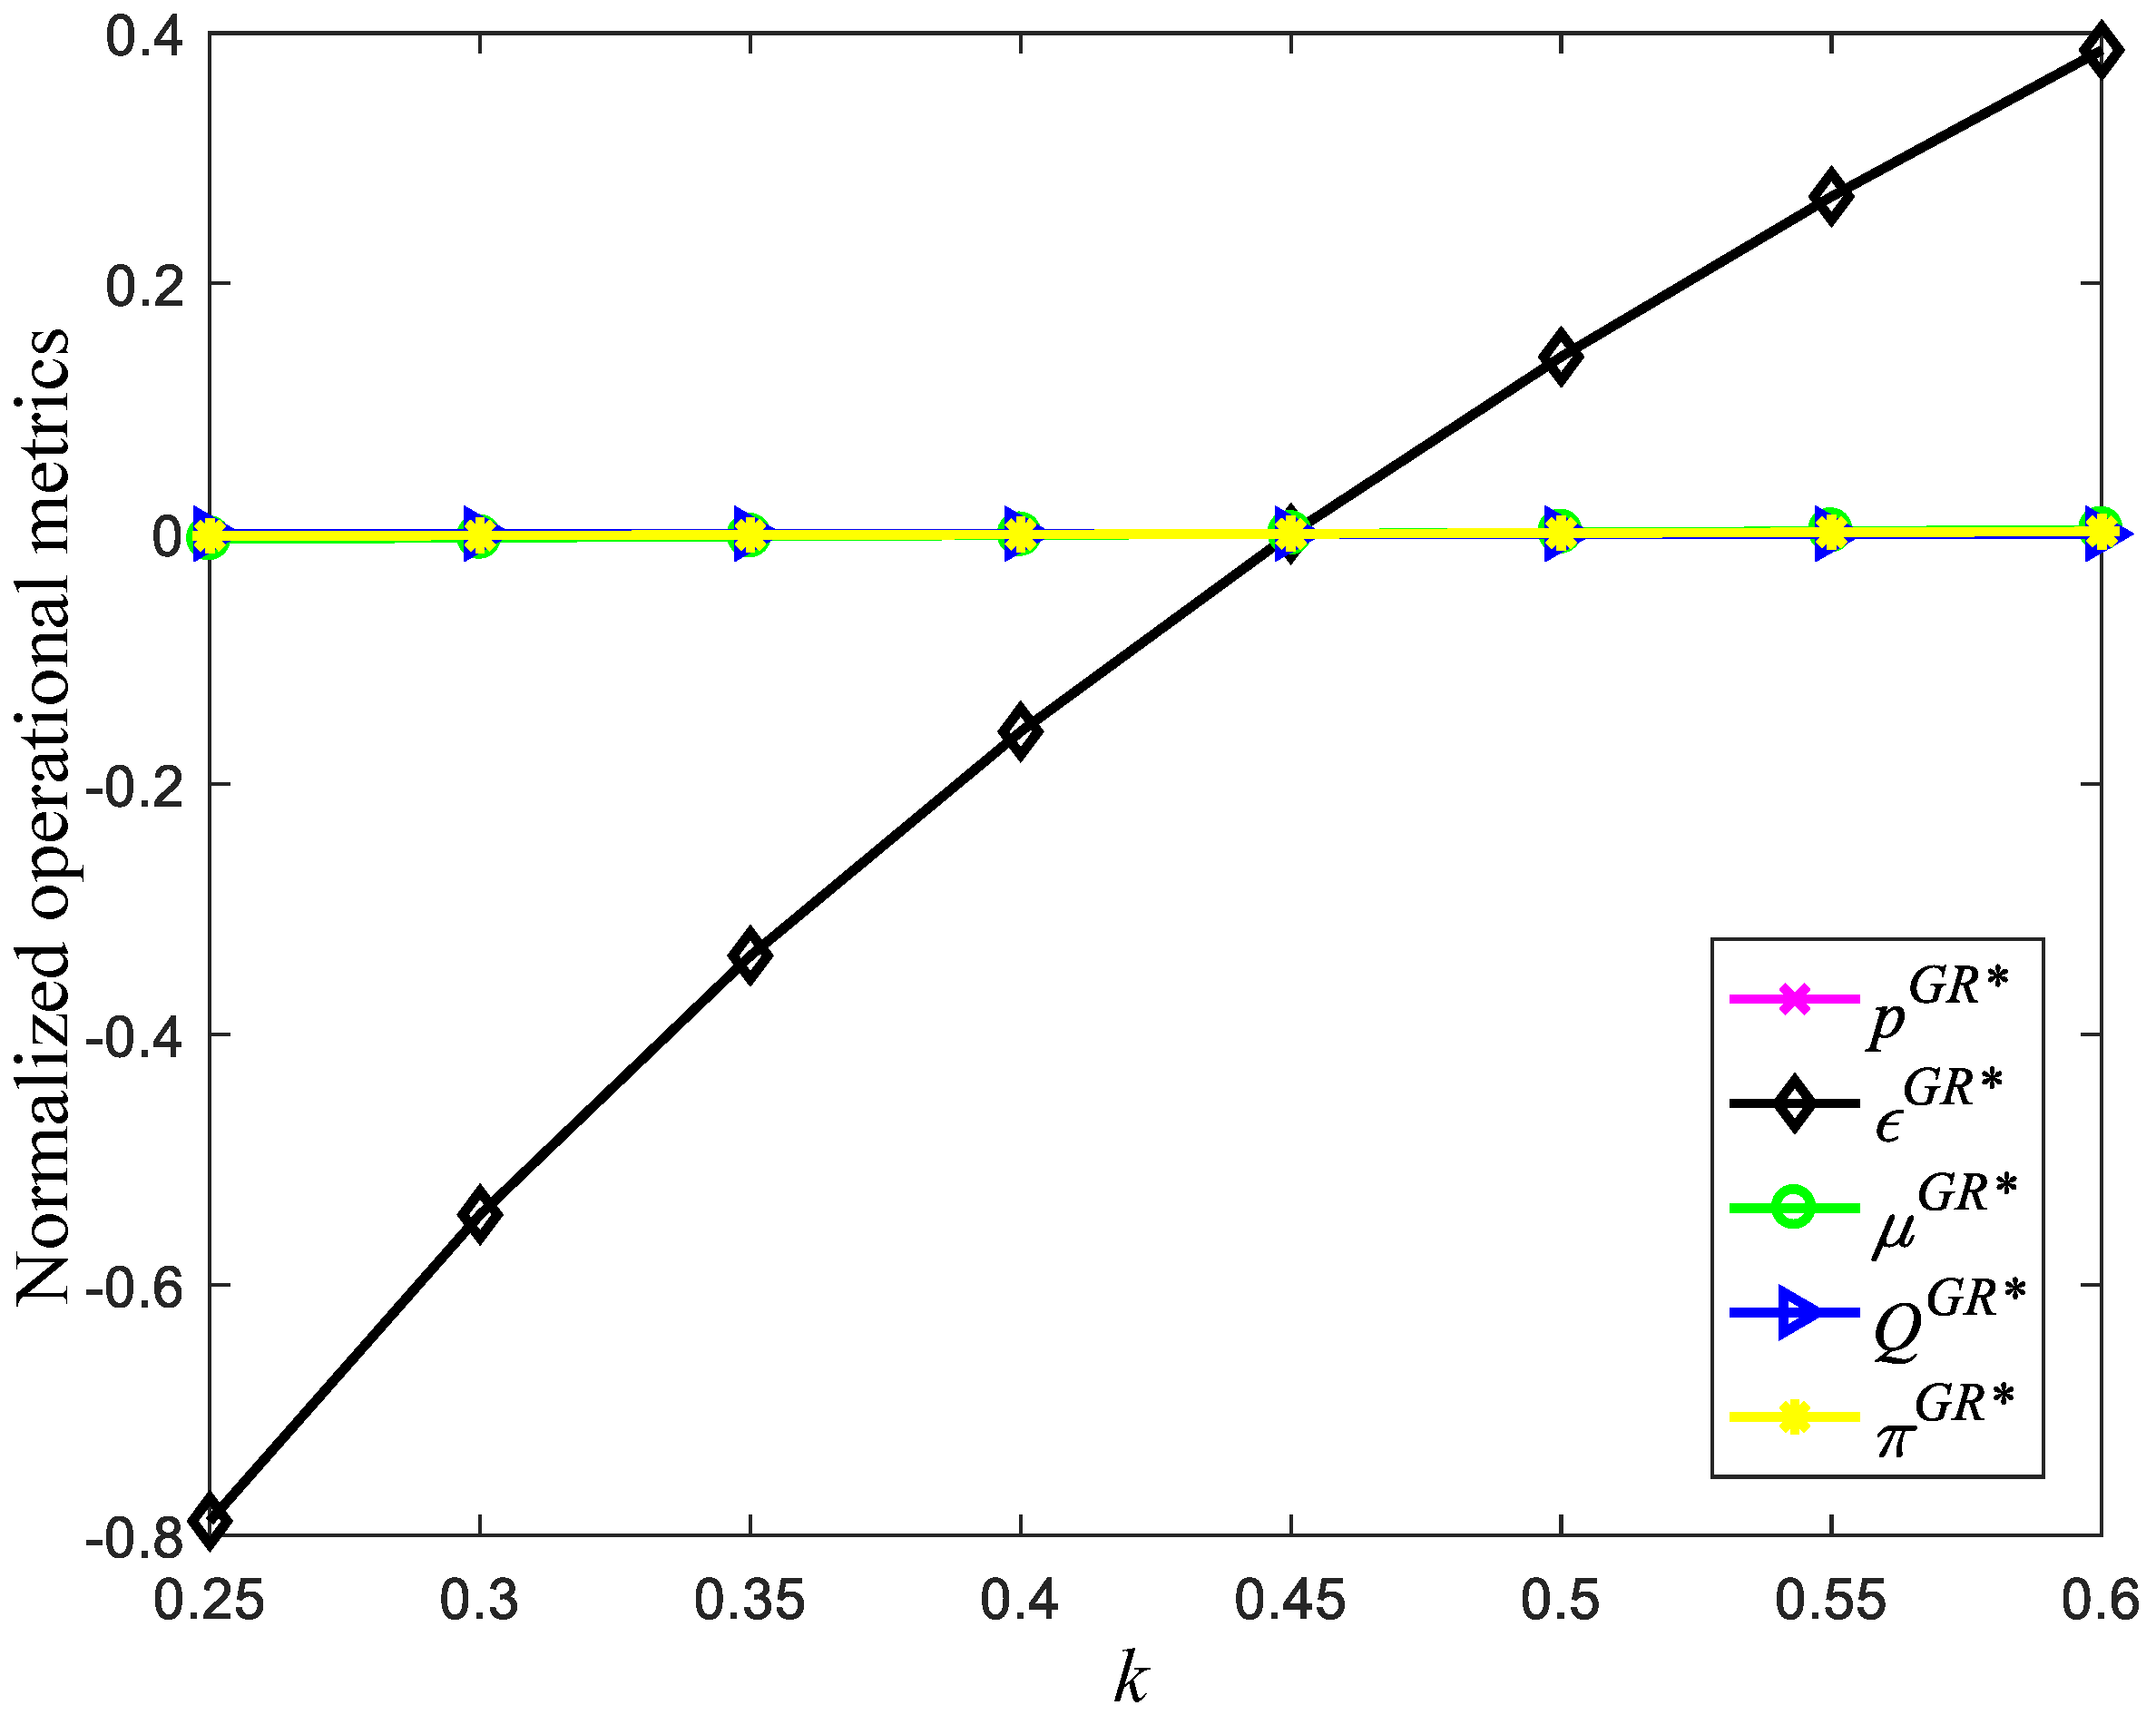
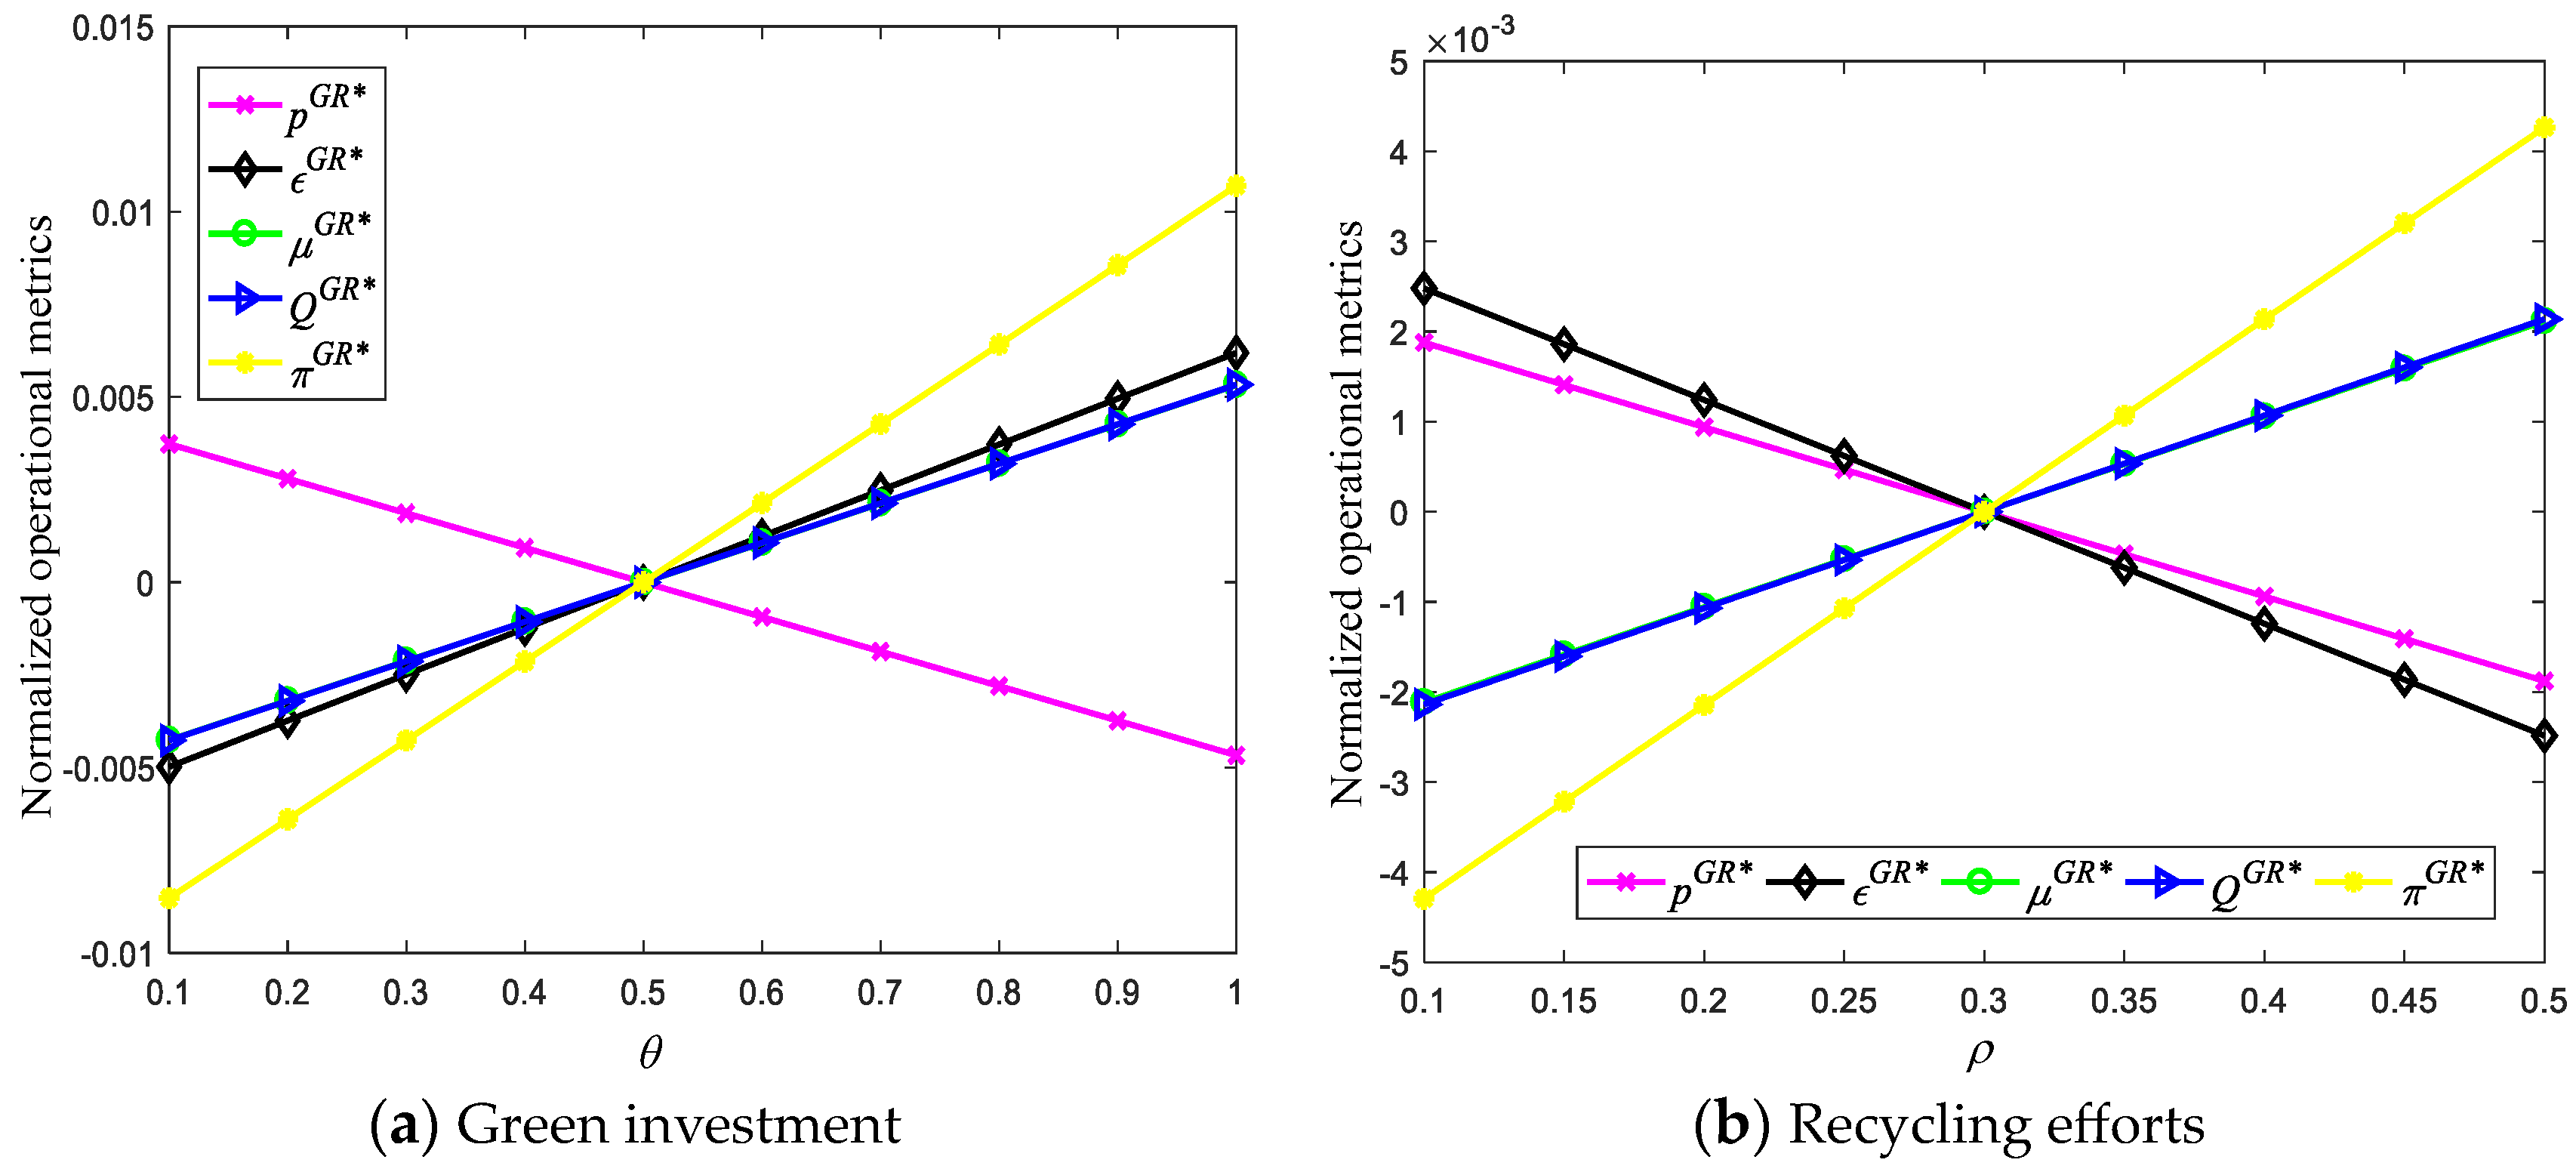
Our research findings within the context of the carbon neutrality target suggest that for apparel brands, the sequence of environmental strategies for maximizing profits is as follows: Simultaneously adopting green investment and recycling efforts Recycling strategy Green investment Not adopting any environmental strategy. Therefore, we primarily analyze the impact of key parameters , , , and on operational metrics such as optimal price, green investment, recycling efforts, order quantity, and total profit for apparel brands when simultaneously adopting green investment and recycling efforts, as illustrated in Figure 2, Figure 3, Figure 4 and Figure 5. It is noted that the values of operational metrics, including optimal price, green investment, recycling efforts, order quantity, and total profit, are normalized in the following figures.
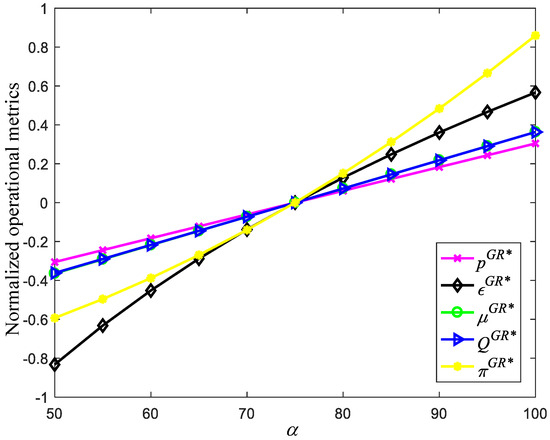
Figure 2.
The impact of the overall market size on operational metrics.
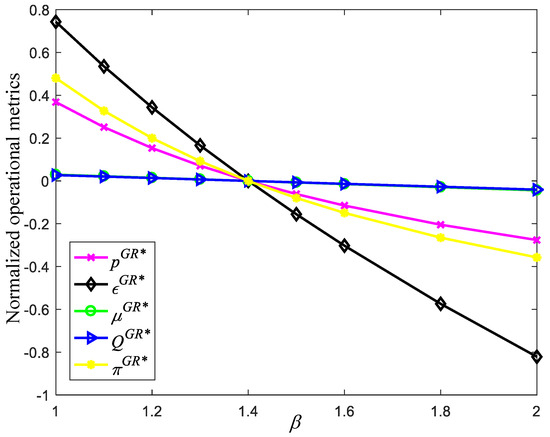
Figure 3.
The impact of the price sensitivity coefficient on operational metrics.
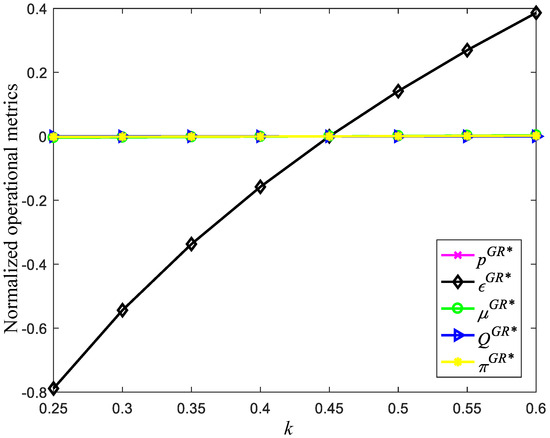
Figure 4.
The impact of the sensitivity coefficient of demand to the greenness level on operational metrics.
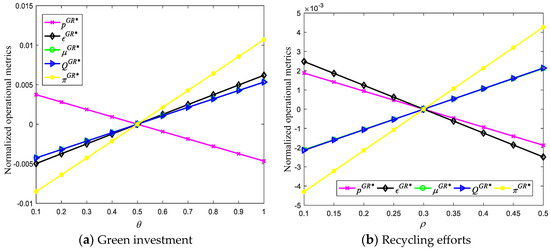
Figure 5.
The impact of the emission reduction rate on operational metrics.
Figure 2 demonstrates that with the increase in overall market size, product prices, green investments, recycling efforts, order quantities, and profits of the apparel brand all increase, albeit to varying degrees. Among these factors, the basic market size has the greatest impact on the profits of the apparel brand. This is because, for the brand, the basic market size represents a certain level of income certainty, while optimal prices, order quantities, and recycling efforts increase gradually. Green investments initially increase rapidly and then gradually. This is because when the basic market size is low, the apparel brand increases green investments to enhance demand and thus increase profits. However, as the basic market size increases, the expected profits for the apparel brand increase, reducing the incentive to increase green investments significantly. Consequently, the increase in green investments slows down.
Figure 3 illustrates that as consumers’ price sensitivity coefficient increases, the product prices, green investments, recycling efforts, order quantities, and profits of the apparel brand all decrease, albeit to varying extents. The significant decrease in prices and profits can be attributed to the necessity for the brand to lower prices to attract more price-sensitive consumers, thereby sacrificing a portion of their profits. Conversely, as consumers become more price-sensitive, the apparel brand is compelled to increase its green investments to appeal to consumers’ growing concerns about environmental protection and sustainability. In contrast, the changes in order quantities and recycling efforts are less pronounced. This is because as consumer price sensitivity increases, brands need to adopt more cautious strategies to ensure supply chain stability and cost-effectiveness.
Figure 4 demonstrates that the sensitivity coefficient of consumers towards the greenness level of apparel products does not significantly affect the product prices, recycling efforts, order quantities, and profits of apparel brands. However, it has a substantial impact on green investments. A higher sensitivity coefficient towards the greenness level of apparel products indicates an increasing consumer concern for environmental protection and sustainability. Consumers are more inclined to choose the apparel brand that actively adopts eco-friendly measures. In order to meet consumers’ needs and expectations, the apparel brand is compelled to increase its investments in green production, material procurement, and environmental technology research and development, among other aspects, to enhance the environmental-friendliness and sustainability of its products, thereby gaining favor and trust from consumers.
Figure 5 illustrates the impact of the emission reduction rate resulting from the adoption of green investments and recycling efforts on operational metrics for apparel brands. Figure 5a,b indicate that as the emission reduction rate increases, the optimal profit, order quantity, and recycling efforts increase, while the optimal product price decreases. However, there is a distinction between the effects observed in Figure 5a,b. Figure 5a suggests that the increase in the emission reduction rate following the adoption of green investments leads to an increase in green investments by apparel brands, whereas an increase in the emission reduction rate resulting from the adoption of recycling strategies leads to a decrease in green investments by apparel brands. This is because the increase in the emission reduction rate following green investments incentivizes brands to increase their green investments, thereby effectively reducing product carbon emissions. Conversely, after an increase in the emission reduction rate resulting from the adoption of recycling strategies, brands perceive that recycling strategies are already effective in reducing carbon emissions. As a result, they reduce the demand for other green investments and focus more on optimizing and improving the efficiency of recycling processes.
6. Discussion and Conclusions
The apparel industry is one of the important sources of global carbon emissions. Under the carbon neutrality target, governments implement carbon taxation as a significant environmental policy tool. Carbon taxation drives the apparel industry to consider green investment and recycling efforts to reduce carbon emissions and respond to carbon neutrality. Therefore, in the context of the carbon neutrality target, this paper considers green investment and recycling strategies to reduce resource waste and protect the environment and studies the pricing and inventory optimization decisions of apparel brands. We established four different models: benchmark without adopting environmental strategies, adopting green investment, adopting recycling efforts, and adopting both green investment and recycling efforts. Numerical analysis was conducted to compare the impact of these different scenarios on the pricing, order quantity, and profits of apparel brands.
6.1. Discussion of Findings
Our study yielded several valuable and meaningful findings.
Firstly, our results indicated that apparel brands that concurrently implement green investment and recycling initiatives generate greater profits compared to those pursuing either initiative individually or abstaining from both. While Shen et al. [13] investigated green investment technologies within the textiles and apparel supply chain under government environmental tax policy and found that increasing environmental tax rates incentivize manufacturers to invest in green technologies, their study did not account for how recycling strategies might mitigate carbon emissions and consequently reduce tax costs. Our research fills this gap by considering environmental strategies aimed at reducing carbon emissions from both the source and the end of the supply chain, revealing the existence of a compound effect. This discovery represents the innovation of our study and constitutes one of the key contributions that distinguishes our research conclusions from others.
Additionally, the increase in the emission reduction rate following the adoption of green investments leads to an increase in green investments by apparel brands, whereas the increase in the emission reduction rate following the implementation of recycling strategies leads to a decrease in green investments by apparel brands. This disparity in findings stands in contrast to the research conducted by Lyu et al. [38], wherein they explored the relationship between investing in green technologies to reduce emissions and found that whether the manufacturer engages in recycling depends on technological innovation and carbon cap. This delineates the principal disparity between our studies: while we focused on the influence of emission reduction rates on green investments, Lyu et al. [38] concentrated on the effects of green technological innovation and carbon quotas on recycling behavior.
Furthermore, the optimal order quantity, which reflects the product price, demonstrated significant variations after the adoption of green investment or recycling efforts compared to scenarios where such initiatives are not pursued. Specifically, following the implementation of green investment initiatives, the optimal order quantity tended to be smaller, indicating a higher product price. Conversely, after the introduction of recycling efforts, the optimal order quantity tended to be greater, suggesting a lower product price. This trend underscores the profound impact of environmental initiatives on supply chain dynamics and consumer behavior, wherein consumers may perceive and value environmentally friendly products differently, thus influencing their purchasing decisions. However, existing studies such as Shen et al. [14], Chen et al. [24], and Wang [29] only examined the joint optimization of pricing and inventory in the apparel industry without considering green investment or recycling strategies. Therefore, our findings differ from theirs, which is a unique contribution of our research. Our results emphasize the importance of incorporating environmental factors into supply chain management strategies to optimize profitability and meet evolving consumer preferences.
6.2. Managerial Implications and Scientific Contributions
Our findings provide managerial implications for the operation practice of apparel brands. Firstly, apparel brands should invest in green technology to reduce carbon emissions and pollution while enhancing their environmental brand image. This approach can attract more environmentally conscious consumers and increase market competitiveness and overall profitability. Secondly, apparel brands should leverage the synergistic effects of green investments and recycling strategies. Initially, they should focus on green technologies to improve sustainability and reduce emissions. Once effective, they should gradually enhance recycling efforts to further lower carbon emissions. Afterward, they should adjust the balance between these strategies based on market feedback and policy changes to optimize environmental performance and profitability. Additionally, our study shows that apparel brands simultaneously implementing green investments and recycling strategies achieve higher profits. Apparel brands should leverage both strategies together to maximize environmental and economic benefits through their synergistic effects, accelerating progress toward carbon neutrality. Finally, under the backdrop of the carbon neutrality target, optimizing inventory is not only to address the industry’s core issues but also to promote environmental development and reduce resource waste. By increasing inventory turnover, apparel brands can reduce unnecessary production and transportation, decrease carbon emissions, and better respond to changes in market demand, thus enhancing the competitiveness of the enterprise.
This study provides the following substantial scientific contributions. Firstly, we offer a novel perspective on the critical role and challenges of the apparel industry in achieving carbon neutrality goals, thereby advancing understanding within this field. By delving into the impacts of green investment and recycling strategies on carbon neutrality objectives, we elucidate their synergistic effects in reducing carbon emissions, offering valuable practical guidance for implementing carbon neutrality. Secondly, we analyzed the influence of carbon tax policies on the apparel industry and discussed how government policies can incentivize apparel brands to invest in green products and enhance recycling efforts, thus promoting low-carbon sustainable development. This analysis provides practical recommendations for policymakers and industry managers. Finally, through a comprehensive analysis of the effects of green investment and recycling on pricing and inventory decisions for apparel brands, we provide practical guidance and theoretical support for formulating sustainable development strategies in the industry. These findings help apparel brands optimize supply chain management, enhance market competitiveness, and increase profitability while meeting environmental requirements. In summary, this study not only enriches the theoretical knowledge of carbon neutrality in the apparel industry but also provides practical guidance for environmental strategies in apparel brands.
6.3. Limitations and Future Research
Our study has several limitations that provide directions for future research. Firstly, this paper is based on research conducted within the context of demand being influenced by price and greenness certainty. However, in reality, consumers’ purchasing decisions may be influenced by many uncontrollable factors, leading to uncertainty in demand. Further research could consider the impact of stochastic environments on demand. Secondly, this paper primarily considers the constraints of government carbon taxation policies within the context of carbon neutrality targets without addressing the relevant factors of carbon trading markets. Further research could explore optimization strategies for apparel brands from the perspective of carbon trading. Finally, our study focuses on pricing and single-ordering strategies for apparel brands within a single sales cycle. Further research could consider multi-period replenishment strategies, including seasonal replenishment strategies.
Author Contributions
Conceptualization, J.Z. and Q.X.; Methodology, J.Z.; Software, J.Z.; Validation, J.Z. and Q.X.; Formal Analysis, J.Z.; Investigation, J.Z.; Resources, Q.X.; Data Curation, J.Z. and Q.X.; Writing—original draft preparation, J.Z.; Writing—review and editing, J.Z.; Visualization, J.Z. and Q.X.; Supervision, Q.X.; Project administration, Q.X.; Funding acquisition, Q.X. All authors have read and agreed to the published version of the manuscript.
Funding
This research received no external funding.
Institutional Review Board Statement
Not applicable.
Informed Consent Statement
Not applicable.
Data Availability Statement
The data used to support the findings of this study are available from the corresponding author upon request.
Conflicts of Interest
Author Jin Zhao was employed by the company Saic Volkswagen Automotive Company Limited. The remaining authors declare that the research was conducted in the absence of any commercial or financial relationships that could be construed as a potential conflict of interest.
Appendix A
Proof of Proposition 1.
In order for the apparel brand to achieve maximum profits within a sales cycle, we solve and obtain the optimal pricing . The optimal order quantity of the apparel brand satisfies and is a function of , and therefore we have . When , there is and . Since , there is . □
Proof of Corollary 1.
According to Proposition 1, solving the first-order partial derivatives of optimal price, order quantity, and profit with respect to the tax rate per unit of carbon emissions, respectively, we have , and . □
Proof of Proposition 2.
Solving the first-order partial derivative of the profit function of Equation (7) with respect to and , we have
Because , the profit function is a concave function with respect to , and there is a unique maximum value point. In a sales period, the necessary conditions for the maximum total profit of the apparel brand are and . □
Proof of Corollary 2.
Give a green investment level , solving the first derivative of the optimal price of the apparel brand with respect to parameters , , and respectively, there are , , (due to ) and . □
Proof of Proposition 3.
Solving the first-order partial derivative of the profit function of Equation (9) with respect to and , we obtain
The Hessian matrix of with respect to and is
Due to , the Hessian matrix is negative definite and is a joint concave function with respect to and . Solve the necessary conditions for maximizing the total profit of the brand and , we obtain the optimal product price and recycling efforts . □
Proof of Corollary 3.
Solving the first-order derivatives of the optimal product price, recycling efforts, order quantity, and profit with respect to the parameters , , and respectively, we have
□
Proof of Proposition 4.
Solving the first-order derivatives of the profit function with respect to the decision variables , and , respectively, we have
In a sales period, the necessary conditions for maximizing the total profit of the apparel brand are , and . Solve the above-shown equation system to obtain Equation (11). □
References
- Wang, Y.; Guo, C.H.; Chen, X.J.; Jia, L.Q.; Guo, X.N.; Chen, R.S.; Zhang, M.S.; Chen, Z.Y.; Wang, H.D. Carbon peak and carbon neutrality in China: Goals, implementation path and prospects. China Geol. 2021, 4, 720–746. [Google Scholar] [CrossRef]
- Deepika, G.; Thennarasu, P.; Ramratan, G. Explores the role of fast fashion in sustainability: Stylish killer for the environment. J. Text. Eng. Fash. Technol. 2022, 8, 59–63. [Google Scholar]
- Chand, S.; Chand, S.; Raula, B. Textile and apparel industries waste and its sustainable management approaches. J. Mater. Cycles Waste Manag. 2023, 25, 3132–3143. [Google Scholar] [CrossRef]
- FEATURE STORY. How Much Do Our Wardrobes Cost to the Environment? 23 September 2019. Available online: https://www.worldbank.org/en/news/feature/2019/09/23/costo-moda-medio-ambiente (accessed on 17 March 2024).
- Leal Filho, W.; Perry, P.; Heim, H.; Dinis, M.A.P.; Moda, H.; Ebhuoma, E.; Paço, A. An overview of the contribution of the textiles sector to climate change. Front. Environ. Sci. 2022, 10, 973102. [Google Scholar] [CrossRef]
- Xu, X.; Cui, X.; Zhang, Y.; Chen, X.; Li, W. Carbon neutrality and green technology innovation efficiency in Chinese textile industry. J. Clean. Prod. 2023, 395, 136453. [Google Scholar] [CrossRef]
- UNIQLO. Sustainability Report. 2021. Available online: https://www.uniqlo.com/jp/en/contents/sustainability/report/2021/reuniqlo/ (accessed on 17 March 2024).
- XTEP. Environmental Protection. 2023. Available online: https://www.xtep.com.hk/en/sustainability/environment.php (accessed on 17 March 2024).
- Rathinamoorthy, R. Sustainable apparel production from recycled fabric waste. In Sustainable Innovations in Recycled Textiles; Springer: Singapore, 2018; pp. 19–52. [Google Scholar]
- Xie, X.; Hong, Y.; Zeng, X.; Dai, X.; Wagner, M. A systematic literature review for the recycling and reuse of wasted clothing. Sustainability 2021, 13, 13732. [Google Scholar] [CrossRef]
- Qi, Q.; Li, S.; Zhang, R.Q. Optimal joint decisions of production and emission reduction considering firms’ risk aversion and carbon tax rate. Int. J. Prod. Res. 2024, 62, 1189–1205. [Google Scholar] [CrossRef]
- Fang, G.; Yang, K.; Tian, L.; Ma, Y. Can environmental tax promote renewable energy consumption?—An empirical study from the typical countries along the Belt and Road. Energy 2022, 260, 125193. [Google Scholar] [CrossRef]
- Shen, B.; Zhu, C.; Li, Q.; Wang, X. Green technology adoption in textiles and apparel supply chains with environmental taxes. Int. J. Prod. Res. 2021, 59, 4157–4174. [Google Scholar] [CrossRef]
- Shen, B.; Chan, H.L.; Chow, P.S.; Thoney-Barletta, K.A. Inventory management research for the fashion industry. Int. J. Inventory Res. 2016, 3, 297–317. [Google Scholar] [CrossRef]
- Meng, X.; Yao, Z.; Nie, J.; Zhao, Y. Make or buy? It is the question: A study in the presence of carbon tax. Int. J. Prod. Econ. 2018, 195, 328–337. [Google Scholar] [CrossRef]
- Zhou, Y.; Hu, F.; Zhou, Z. Pricing decisions and social welfare in a supply chain with multiple competing retailers and carbon tax policy. J. Clean. Prod. 2018, 190, 752–777. [Google Scholar] [CrossRef]
- Guo, S.; Choi, T.M.; Shen, B. Green product development under competition: A study of the fashion apparel industry. Eur. J. Oper. Res. 2020, 280, 523–538. [Google Scholar] [CrossRef]
- Hsu, C.C.; Choon Tan, K.; Hanim Mohamad Zailani, S.; Jayaraman, V. Supply chain drivers that foster the development of green initiatives in an emerging economy. Int. J. Oper. Prod. Manag. 2013, 33, 656–688. [Google Scholar] [CrossRef]
- Chen, C. Design for the environment: A quality-based model for green product development. Manag. Sci. 2001, 47, 250–263. [Google Scholar] [CrossRef]
- Xu, J.; Duan, Y. Pricing and greenness investment for green products with government subsidies: When to apply blockchain technology? Electron. Commer. Res. Appl. 2022, 51, 101108. [Google Scholar] [CrossRef]
- Zhang, X.; Song, Y.; Zhang, M. Exploring the relationship of green investment and green innovation: Evidence from Chinese corporate performance. J. Clean. Prod. 2023, 412, 137444. [Google Scholar] [CrossRef]
- Cai, Y.J.; Choi, T.M.; Zhang, T. Commercial used apparel collection operations in retail supply chains. Eur. J. Oper. Res. 2022, 298, 169–181. [Google Scholar] [CrossRef]
- Wiedemann, S.G.; Biggs, L.; Clarke, S.J.; Russell, S.J. Reducing the environmental impacts of garments through industrially scalable closed-loop recycling: Life cycle assessment of a recycled wool blend sweater. Sustainability 2022, 14, 1081. [Google Scholar] [CrossRef]
- Chen, Q.; Xu, Q.; Wang, W. Optimal policies for the pricing and replenishment of fashion apparel considering the effect of fashion level. Complexity 2019, 2019, 9253605. [Google Scholar] [CrossRef]
- Choi, T.M. Pre-season stocking and pricing decisions for fashion retailers with multiple information updating. Int. J. Prod. Econ. 2007, 106, 146–170. [Google Scholar] [CrossRef]
- Zhou, L.; Chen, Q.; Xu, Q. Joint Pricing and Inventory Control Decisions for Fashion Apparel with Considering Fashion Level and Partial Backlogging. Math. Probl. Eng. 2021, 2021, 7092981. [Google Scholar] [CrossRef]
- Kogan, K.; Spiegel, U. Optimal policies for inventory usage, production and pricing of fashion goods over a selling season. J. Oper. Res. Soc. 2006, 57, 304–315. [Google Scholar] [CrossRef]
- Tsao, Y.C. Two-phase pricing and inventory management for deteriorating and fashion goods under trade credit. Math. Methods Oper. Res. 2010, 72, 107–127. [Google Scholar] [CrossRef]
- Wang, Z. Optimal pricing strategy considering consumer sensitivity to water-saving and advertising in the apparel supply chains. Kybernetes 2024, 53, 1–26. [Google Scholar] [CrossRef]
- Upadhyay, R.K. Markers for global climate change and its impact on social, biological and ecological systems: A review. Am. J. Clim. Chang. 2020, 9, 159. [Google Scholar] [CrossRef]
- Li, Q.; Long, R.; Chen, H. Empirical study of the willingness of consumers to purchase low-carbon products by considering carbon labels: A case study. J. Clean. Prod. 2017, 161, 1237–1250. [Google Scholar] [CrossRef]
- Fang, G.; Gao, Z.; Wang, L.; Tian, L. How does green innovation drive urban carbon emission efficiency?—Evidence from the Yangtze River Economic Belt. J. Clean. Prod. 2022, 375, 134196. [Google Scholar] [CrossRef]
- Niinimäki, K.; Hassi, L. Emerging design strategies in sustainable production and consumption of textiles and clothing. J. Clean. Prod. 2011, 19, 1876–1883. [Google Scholar] [CrossRef]
- Wu, C.H. Product-design and pricing strategies with remanufacturing. Eur. J. Oper. Res. 2012, 222, 204–215. [Google Scholar] [CrossRef]
- Ferrer, G.; Swaminathan, J.M. Managing new and differentiated remanufactured products. Eur. J. Oper. Res. 2010, 203, 370–379. [Google Scholar] [CrossRef]
- Zhang, X.; Dong, F. To participate or not? Research on second-hand apparel recycling intention under the guidance of environmental psychology. Waste Manag. Res. 2023, 41, 1155–1165. [Google Scholar] [CrossRef] [PubMed]
- Cachon, G.P. Retail store density and the cost of greenhouse gas emissions. Manag. Sci. 2014, 60, 1907–1925. [Google Scholar] [CrossRef]
- Lyu, R.; Zhang, C.; Li, Z.; Li, Y. Manufacturers’ integrated strategies for emission reduction and recycling: The role of government regulations. Comput. Ind. Eng. 2022, 163, 107769. [Google Scholar] [CrossRef]
- Cai, J.; Sun, H.; Shang, J.; Hegde, G.G. Information structure selection in a green supply chain: Impacts of wholesale price and greenness level. Eur. J. Oper. Res. 2023, 306, 34–46. [Google Scholar] [CrossRef]
Disclaimer/Publisher’s Note: The statements, opinions and data contained in all publications are solely those of the individual author(s) and contributor(s) and not of MDPI and/or the editor(s). MDPI and/or the editor(s) disclaim responsibility for any injury to people or property resulting from any ideas, methods, instructions or products referred to in the content. |
© 2024 by the authors. Licensee MDPI, Basel, Switzerland. This article is an open access article distributed under the terms and conditions of the Creative Commons Attribution (CC BY) license (https://creativecommons.org/licenses/by/4.0/).