Article

Impacts of Different Epidemic Outbreaks on Broiler Industry Chain Price Fluctuations in China: Implications for Sustainable Food Development

School of Economics and Management, Jiangxi Agricultural University, Nanchang 330045, China
*
Authors to whom correspondence should be addressed.
These authors contributed equally to this work.
Sustainability 2024, 16(14), 6043; https://doi.org/10.3390/su16146043
Submission received: 26 May 2024 / Revised: 2 July 2024 / Accepted: 10 July 2024 / Published: 15 July 2024
(This article belongs to the Special Issue Food, Supply Chains, and Sustainable Development—Second Edition)

Abstract

:
Poultry products are crucial for meeting consumer needs and ensuring food sustainability. Unlike previous studies that examined the effect of only one animal disease on broiler prices, this study utilized a time-varying parametric vector auto-regressive (TVP-VAR) model to analyze the dynamic impacts of poultry and swine epidemics on price fluctuations in the upstream, midstream, and downstream sectors of the broiler industry. The findings revealed the following: (1) Both poultry and swine epidemics significantly affected price dynamics in China’s broiler industry, with varying effects over time. (2) The impact of these epidemics varied across different segments of the broiler industry, with chicken prices most affected, followed by live chicken prices, then broiler chick prices, and lastly, broiler feed prices. (3) Poultry epidemics generally exerted negative impacts on broiler industry prices, whereas swine epidemics predominantly had positive effects. (4) The influence of these epidemics on broiler industry prices gradually weakened over extended periods. (5) Poultry epidemics impact broiler industry prices rapidly but briefly, in contrast to the delayed and more sustained effects of swine epidemics. The results of this study will be an important guide for the prevention and control of animal diseases in developing countries and for the sustainable development of the broiler industry.

1. Introduction

The transition from pork, beef, and mutton to poultry in meat production and consumption is a prevalent trend in global agricultural advancement. Fostering the expansion of the grain-efficient broiler chicken sector is essential for promoting sustainable agricultural practices and securing food safety and meat supply in China [1,2]. Despite China’s self-sufficiency in grain, there remains a significant reliance on imported feed grains like corn and soybeans, particularly soybeans. Broiler chickens exhibit a superior feed conversion ratio, requiring approximately 1.7 kg of feed to yield 1 kg of white feather broiler meat, which is nearly half the feed-to-meat ratio of pork. Additionally, their greenhouse gas emissions are substantially lower than those of pork, beef, and mutton. The broiler industry stands out as a low-carbon, efficient, and eco-friendly option compared to other livestock sectors. In China’s current meat production landscape, grain-efficient poultry meat, characterized by high feed conversion efficiency, constitutes only 33.0% of total meat production, significantly lower than the global average of 43.2%. Consequently, the development of grain-efficient broiler chicken industries holds substantial market potential. Exploiting and harnessing these potentials can effectively reduce China’s dependence on imported feed grains, aligning with the comprehensive food security system’s objectives to fortify national food security and establish a robust agricultural nation.
The transformation of China’s broiler industry towards modernization is currently grappling with the dual challenges of internal supply–demand imbalances and external uncertainties, leading to frequent price fluctuations in the broiler market. These fluctuations are influenced by a range of factors including breeding costs, transportation expenses, the prices of substitutes, household income levels, consumer preferences, financial conditions, and unforeseen external shocks [3,4,5]. Notably, outbreaks of animal epidemics can greatly exacerbate price volatility within the broiler industry chain, impeding the orderly and healthy growth of the sector [6,7,8].
The poultry industry’s distinctive nature has led academic research to concentrate on the effects of avian influenza outbreaks on poultry product prices. Saghaian et al. [9] and Mutlu et al. [10] examined the impact of avian influenza on Turkey’s poultry market prices, observing that price adjustments varied across market segments, with retail prices rebounding to equilibrium faster than production and wholesale prices post-shock. Park et al. [11] reported similar results for the Korean poultry market. Condry et al. [12] and Mu [13] emphasized that avian influenza can have cross-regional effects on poultry product prices in areas not directly affected by the outbreak. Hassouneh et al. [14] explored the price effects of food panic information indices in the Egyptian poultry market under different regimes, demonstrating that under low-regime conditions, an index increase results in a minor decline in chicken prices, while under high-regime conditions, it leads to more substantial price volatility. Research on China’s poultry industry includes Ding et al. [15], who analyzed the broiler market’s switching characteristics during the avian influenza crisis. Zhou and Liu [16], along with Liu et al. [17], found that both human and avian influenza infections significantly influence price fluctuations along the broiler supply chain, albeit with varying impacts on market segments. Zheng and Ma [18] noted that changes in avian influenza outbreaks cause price fluctuations in livestock and poultry products, primarily affecting chicken prices but also inducing some fluctuations in pork prices. Cai and Tao [19] observed that avian influenza exerts a short-term influence on the poultry sector if it remains non-zoonotic, with the majority of broiler product prices rebounding to their pre-outbreak levels within a month. However, when human infections are implicated, the impact on poultry supply chain prices extends to a long-term duration, persisting for more than 13 months.
As a matter of fact, in the broiler industry, swine epidemics may also exert a substantial influence on price dynamics. Previous studies by Shi et al. [20], Li et al. [21], Zhan et al. [22], Li et al. [23], and He et al. [24] have employed various econometric methods to evaluate the impact of African swine fever on the pricing of pork, beef, chicken, and mutton in China. However, a comprehensive examination of how poultry and swine epidemics differently affect price mechanisms in China’s broiler sector is still under-explored. Considering the potential differences in the effects of epidemic disruptions across various temporal and developmental stages, a refined analysis is necessary. Therefore, our research will utilize the Time-Varying Parameter Vector Autoregressive (TVP-VAR) model to compare the magnitude, direction, and duration of the impacts of poultry and swine epidemics on broiler product prices in China. This analysis will reveal how these impacts evolve over time and vary under diverse policy contexts, providing insights into the specific effects and mechanisms of different epidemics on broiler product price volatility in China.
We attempt to make the following two contributions to the literature: (1) Constructing a theoretical framework integrating supply and demand shocks to elucidate the unique impact pathways of different sudden epidemics on price volatility within the poultry industry chain. (2) Implementing the TVP-VAR model to investigate the time-varying characteristics of diverse epidemic shocks on market price dynamics within the Chinese broiler industry chain.
The remainder of this paper is organized as follows. Section 2 introduces a theoretical framework elucidating the shifts in supply and demand within the broiler market due to poultry and swine epidemics. Section 3 elaborates on the econometric techniques and data sources utilized. Section 4 constructs a TVP-VAR model to empirically assess the time-varying effects of poultry and swine epidemics on the market price within the broiler industry chain, and employs a BVAR model for robustness testing. Section 5 outlines the conclusions, policy recommendations, and future research directions.

2. Theoretical Framework

The price volatility of the poultry industry chain is largely dependent on sudden external shocks, such as animal epidemic outbreaks, which are managed by making adjustments to supply and demand dynamics [20]. Overall, this impact process follows a cyclical pattern: elevated chicken prices prompt an expansion in stock, which leads to augmented supply and subsequent price decline; this price drop then prompts a reduction in stock, resulting in decreased supply and, consequently, a rise in chicken prices [25,26]. This cycle reveals how external shocks affect the price dynamics of the poultry industry chain through the inherent regulation of market mechanisms.
Poultry epidemic outbreaks directly influence the behavior and expectations of chicken producers and consumers, thereby affecting the price volatility of the poultry industry chain [19,26,27]. Swine epidemic shocks primarily affect the behavior and expectations of pork producers and consumers [25,28,29]. The strong substitution relationship between chicken and pork can subsequently trigger shifts in the supply and demand of the poultry industry chain, leading to price fluctuations [30]. Figure 1 depicts the impact pathways of different types of sudden epidemics on the price volatility of the poultry industry chain.
From a demand analysis perspective, the widespread use of the internet and the effectiveness of information dissemination have facilitated the fast dissemination of news about sudden epidemics via social media. This has repercussions on the pricing of livestock and poultry products [21,26,31]. Insufficient guidance in the early stages of an epidemic outbreak can result in a “risk amplification effect”, where residents foster negative market expectations, fearing food safety issues. This can lead to consumer panic and a drop in consumer confidence [25,32]. For instance, during the early phase of a poultry epidemic outbreak, the demand for chicken decreases notably. Similarly, in the initial stages of a swine disease outbreak, pork consumption diminishes significantly, leading to a spike in chicken consumption as the main alternative. As the epidemic situation gradually stabilizes, public confidence in consumers will recover, shifting from panic-induced hesitance to rational buying. Consistent positive government directives, alongside improved consumer confidence, will progressively restore corresponding consumer demand levels.
From a supply perspective, the deaths and culling of pigs and poultry during sudden epidemics have a direct impact on current stocks, resulting in significant financial losses for breeders. This may prompt some breeders to scale down production to reduce epidemic prevention costs, potentially forcing smaller enterprises with limited risk capacities to exit the market [25,29,33]. Comparatively, swine epidemics like African swine fever have a more substantial effect on hog production than poultry epidemics such as avian influenza on poultry production. Due to fixed production cycles for both pigs and poultry, exclusive of external trade factors, their supply cannot be quickly increased in the short term [30]. Information related to epidemics influences breeders’ decisions, affecting hog and poultry stock levels as well as slaughter volumes. During poultry and swine epidemic outbreaks, most entities and breeders tend to be cautious, postponing stock replenishment until the epidemic stabilizes [31]. This will result in prolonged supply–demand gaps and subsequent price increases for hogs due to the long production cycle of hogs. Conversely, the shorter production cycle of poultry leads to a rapid increase in supply when positive epidemic control news is disseminated, causing a temporary surge in poultry stocks.

3. Materials and Methods

3.1. Methods

The Time-Varying Parameter Vector Autoregressive (TVP-VAR) model was used in this study for empirical analysis. The TVP-VAR model is derived from a modification of the traditional VAR model. The VAR model, originally developed by Christopher Sims in 1980, serves as a prevalent econometric instrument that incorporates multiple variables into a unified analytical structure [34]. This model assumes that the estimated coefficients and the variance of the disturbance terms are constant over time, which enhances computational efficiency but might obscure the dynamic nature of shock impacts. The TVP-VAR model, pioneered by Primiceri in 2005 and refined by Nakajima in 2011, effectively resolves this issue [35,36]. The implementation of the TVP-VAR model facilitates the exploration of the inherent impact mechanisms and time-varying characteristics of swine and poultry epidemics on the fluctuation of prices in China’s broiler industry chain.
The basic structural VAR model is established as follows.
A y t = F 1 y t 1 + + F s y t s + μ t ,           t = s + 1 , , n
In Equation (1), y t is a k × 1 dimensional vector comprising the observed variables. A , F 1 , , and F s are the k × k dimensional coefficient matrixes. μ t is a k × 1 dimensional structural shock following a normal distribution, namely μ t ~ N ( 0 , ) .
= σ 1 0 0 0 0 0 0 σ k
A = 1 0 0 α 21 0 α k 1 α k , k 1 1
Therefore, Equation (1) can be rewritten as follows:
y t = B 1 y t 1 + + B s y t s + A 1 ε t ,       ε t N 0 , I k
In Equation (4), B i = A 1 F i ,   i = 1 , , s .     T h e   e l e m e n t s   o f   B i are transformed into a ( k 2 s × 1 ) vector β by row expansion. Then, it is assumed that X t = I s [ y t 1 , , y t s ]   w h e r e   is the Kronecker product; thus, Equation (4) can be rewritten as follows:
y t = X t β + A t 1 ε t
The expression of the TVP-VAR model can be derived by permitting the equation coefficient β , parameter A , and ovariance matrix ε t in Equation (5) to vary with time:
y t = X t β t + A 1 t   ε t ,         t = s + 1 , , n
For the specification of the TVP-VAR model, several simplifying assumptions have been made [37]. Firstly, the matrix A t is postulated to be lower-triangular, and the elements in which are denoted by α t = α 21 , α 31 , α 41 , , α k , k 1 . Secondly, it is assumed that the parameters follow a random walk process, as described below:
β t + 1 = β t + μ β t α t + 1 = α t + μ α t h t + 1 = h t + μ h t
Among them, h t = h 1 t , , h k t ,   w h e r e   h j t = log σ j t 2 j = 1,2 , , k ; t = s + 1 , , n ,
β s + 1 N μ β 0 , β 0 , α s + 1 N μ α 0 , α 0 , h s + 1 N μ h 0 , h 0 , and
ε t μ β t μ α t μ h t N 0 ,   1 0 0 0 0 β     0 0 0 0 α   0 0 0 0 h   , t = s + 1 , , n
The shocks associated with the time-varying parameters are postulated to exhibit no correlation. The matrics β , α , and h are all stipulated to be diagonal. The following priors are assumed for the i-th diagonals of the covariance matrices [35]:
Σ β i 2 G a m m a   ( 40 ,   0.02 ) Σ α i 2 G a m m a   ( 4 ,   0.02 ) Σ h i 2 G a m m a   ( 4 ,   0.02 )
The parameters of the TVP-VAR model were estimated using the Markov Chain Monte Carlo (MCMC) method. This approach employs a series of algorithms to sample from a random distribution via a Markov chain, requiring only a predetermined prior probability distribution to infer the posterior probability distribution of the parameters through iterative processes. As iterations progress, the posterior distribution progressively aligns with the true parameter distribution, with the initial prior probability having minimal impact on the outcomes. In this research, the MCMC algorithm was executed with 10,000 sampling iterations, discarding the initial 1000 samples to ensure the independence of the obtained samples from the initial conditions and to enhance the robustness of the estimations [38,39]. OxMetrics 6 software was utilized for this analytical task.

3.2. Data Sources and Descriptive Statistical Analysis

This study utilized monthly price data for broiler feed, broiler chicks, live chickens, and chicken meat in China spanning from January 2009 to September 2021. The price data were sourced from the annual “China Animal Husbandry and Veterinary Yearbook” and adjusted for inflation using the national annual CPI index [40]. The poultry diseases involved in this study included avian influenza, Newcastle disease, avian cholera, duck plague, Marek’s disease, etc., while the swine diseases included African swine fever, classical swine fever, highly pathogenic porcine reproductive and respiratory syndrome, swine cysticercosis, anthrax, erysipelas, porcine pulmonary adenomatosis, brucellosis, foot-and-mouth disease, etc.
To measure the severity of poultry and swine epidemics, we constructed poultry and swine epidemic indices based on the number of confirmed poultry and swine deaths and culls, retrieved from BricBigData. To ensure data consistency and linearization, and to account for heteroscedasticity, natural logarithms of the epidemic indices were employed, denoted as lnchickendisease and lnpigdisease.
The trends in broiler chick, broiler feed, live chicken, and chicken meat prices in China from 2009 to 2021 are depicted in Figure 2. The prices of broiler chicks, live chickens, and chicken meat exhibit notable fluctuations with similar patterns, while broiler feed prices remain relatively stable with minor fluctuations.
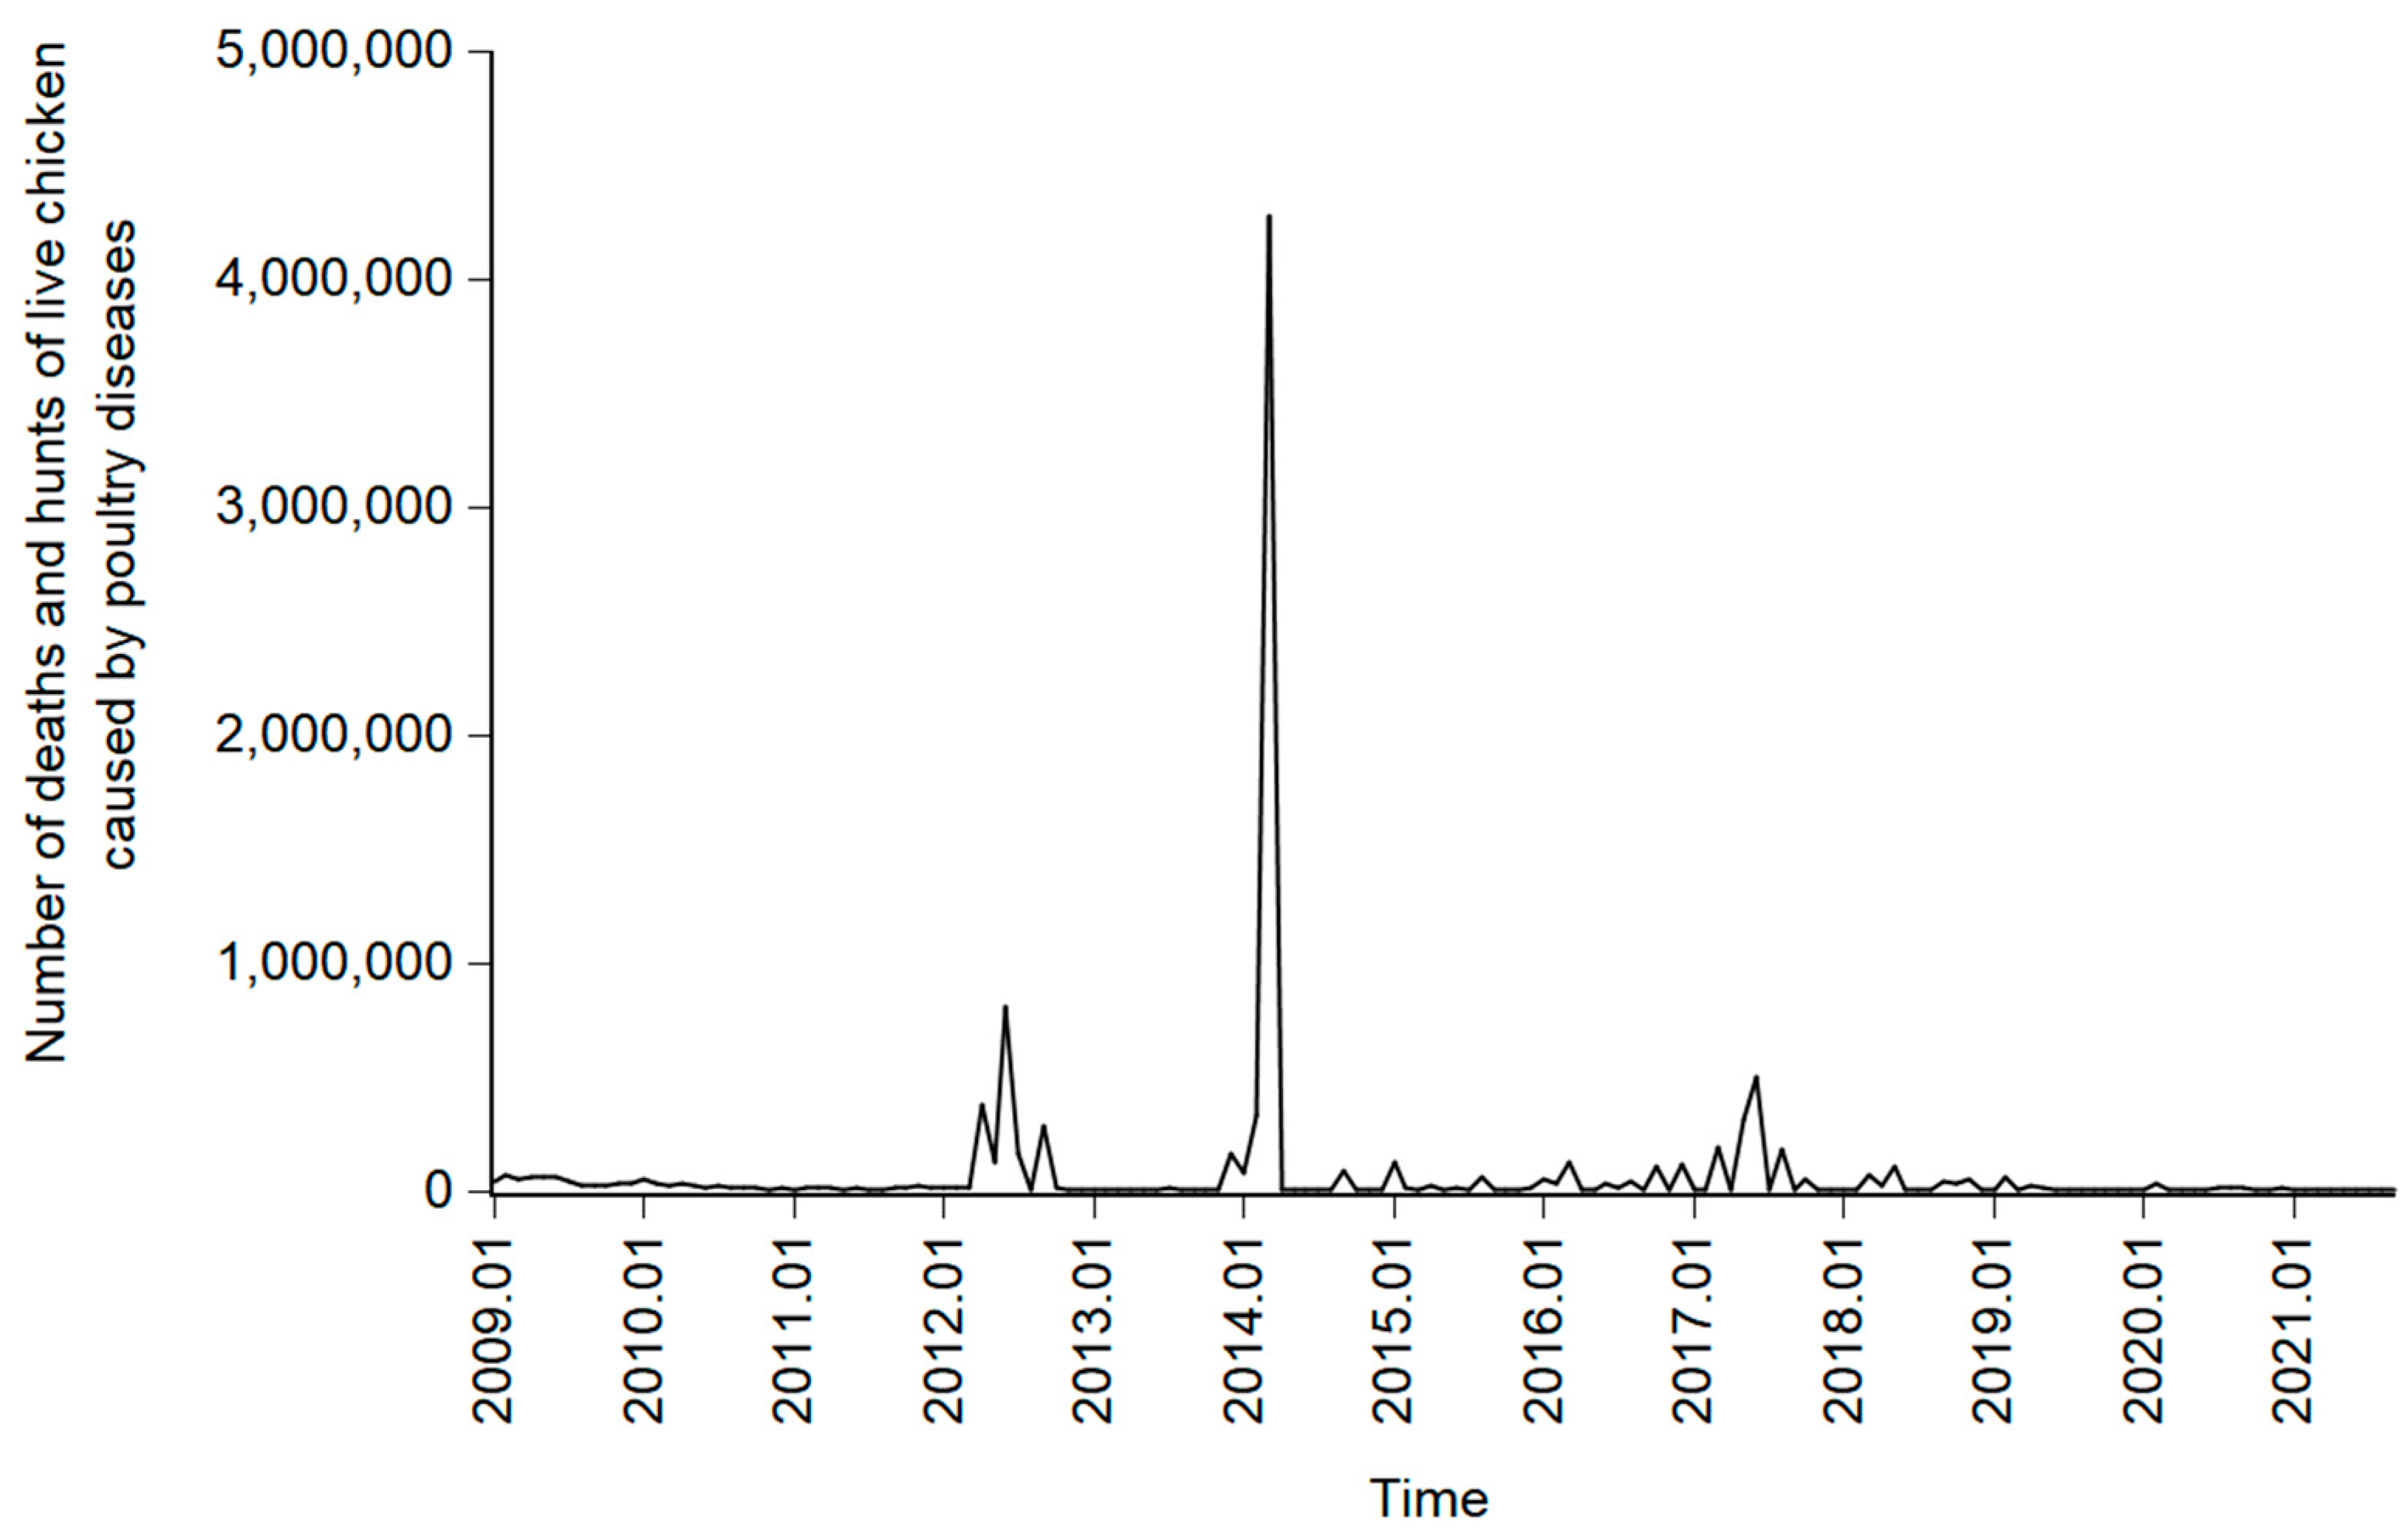
Figure 3 and Figure 4 illustrate the trends of the non-logarithmic poultry and swine epidemic indices, respectively. Both indices show similar trends since 2009, generally maintaining low and stable levels with occasional sharp fluctuations during specific periods. The poultry epidemic index is primarily influenced by avian influenza outbreaks, showing stability with peaks in April to September 2012, March 2014, and March to August 2017. On the other hand, the swine epidemic index, chiefly driven by outbreaks of African swine fever, exhibits stability until a significant rise during the outbreak in 2018, and subsequently returns to a stable state in the latter half of 2019.

4. Results and Discussion

4.1. Model Estimation

4.1.1. Stability Test

To avoid the issue of spurious regression, it is essential to confirm the stationarity of the data before utilizing the dynamic regression model. This study initially employed the Augmented Dickey–Fuller (ADF) unit root test to assess the stationarity of six variables’ time series data spanning from January 2009 to September 2021 [41]. These variables include broiler chick prices, chicken feed prices, live chicken prices, chicken meat prices, the natural logarithm of the poultry epidemic index, and the natural logarithm of the swine epidemic index. The results of the test are detailed in Table 1.
The ADF statistic for the original data of the chicken feed variable exceeds the critical value at a 5% significance level, indicating a non-stationary time series. This non-stationarity suggests that the data contains a unit root, which can lead to misleading regression results if not addressed. To address this issue, the study performs first-order differencing on the data. The first-order differencing process involves subtracting each data point from its preceding value, which helps to remove trends and other non-stationary characteristics from the time series.
After conducting first-order differencing, the first-difference series of all variables exhibits stationarity at a 5% significance level, implying the absence of a unit root phenomenon. Stationarity in the first-difference series means that the mean and variance of the data are constant over time, and the series does not exhibit long-term trends or cycles that could distort the results of a regression analysis.
Consequently, these variables, now confirmed to be stationary after differencing, are deemed suitable for constructing the Time-Varying Parameter Vector Autoregressive (TVP-VAR) model. The TVP-VAR model is particularly useful in capturing the dynamic relationships among variables over time, allowing for more accurate and reliable estimations. By ensuring the stationarity of the data, the study mitigates the risk of spurious regression and enhances the robustness of its empirical findings.

4.1.2. Optimal Lag Order Determination

Various techniques were utilized in this research to determine the most effective lag order of the model. These methods included the log likelihood method (LogL), the likelihood ratio statistic (LR), final prediction error (FPE), the Akaike information criterion (AIC), the Schwarz criterion (SC), and the Hannan–Quinn information criterion (HQ). Each of these criteria has its own methodology for evaluating lag order, contributing to a comprehensive assessment of the model’s performance. The log likelihood (LogL) method evaluates the goodness of fit of the model by maximizing the probability of observing the given sample data. The likelihood ratio statistic (LR) compares the fit of two nested models to determine whether the additional lags improve the model significantly. The final prediction error (FPE) estimates the model’s prediction accuracy by minimizing the prediction error of future values.
The Akaike information criterion (AIC) is a widely used measure that balances the model’s fit with its complexity, penalizing models with more parameters to prevent overfitting [42]. The Schwarz criterion (SC), also known as the Bayesian information criterion (BIC), is similar to the AIC but imposes a harsher penalty for adding more parameters, often leading to more parsimonious models. The Hannan–Quinn information criterion (HQ) provides another balance between model fit and complexity, with a penalty term that grows more slowly than the SC but faster than the AIC [43].
The lag order with the most asterisks (“*”) indicates the optimal choice among these methods, reflecting the consensus of multiple criteria. We resorted to the Stata 17 software to determine the optimal lag order. Table 2 illustrates that the optimal lag order for the model in this study is three. This consensus suggests that a lag order of three balances the trade-off between model complexity and goodness of fit most effectively, ensuring robust and reliable results. By carefully selecting the appropriate lag order, this study enhances the accuracy and predictive power of its dynamic regression model, contributing to more reliable conclusions and insights.

4.1.3. Results of MCMC Estimation

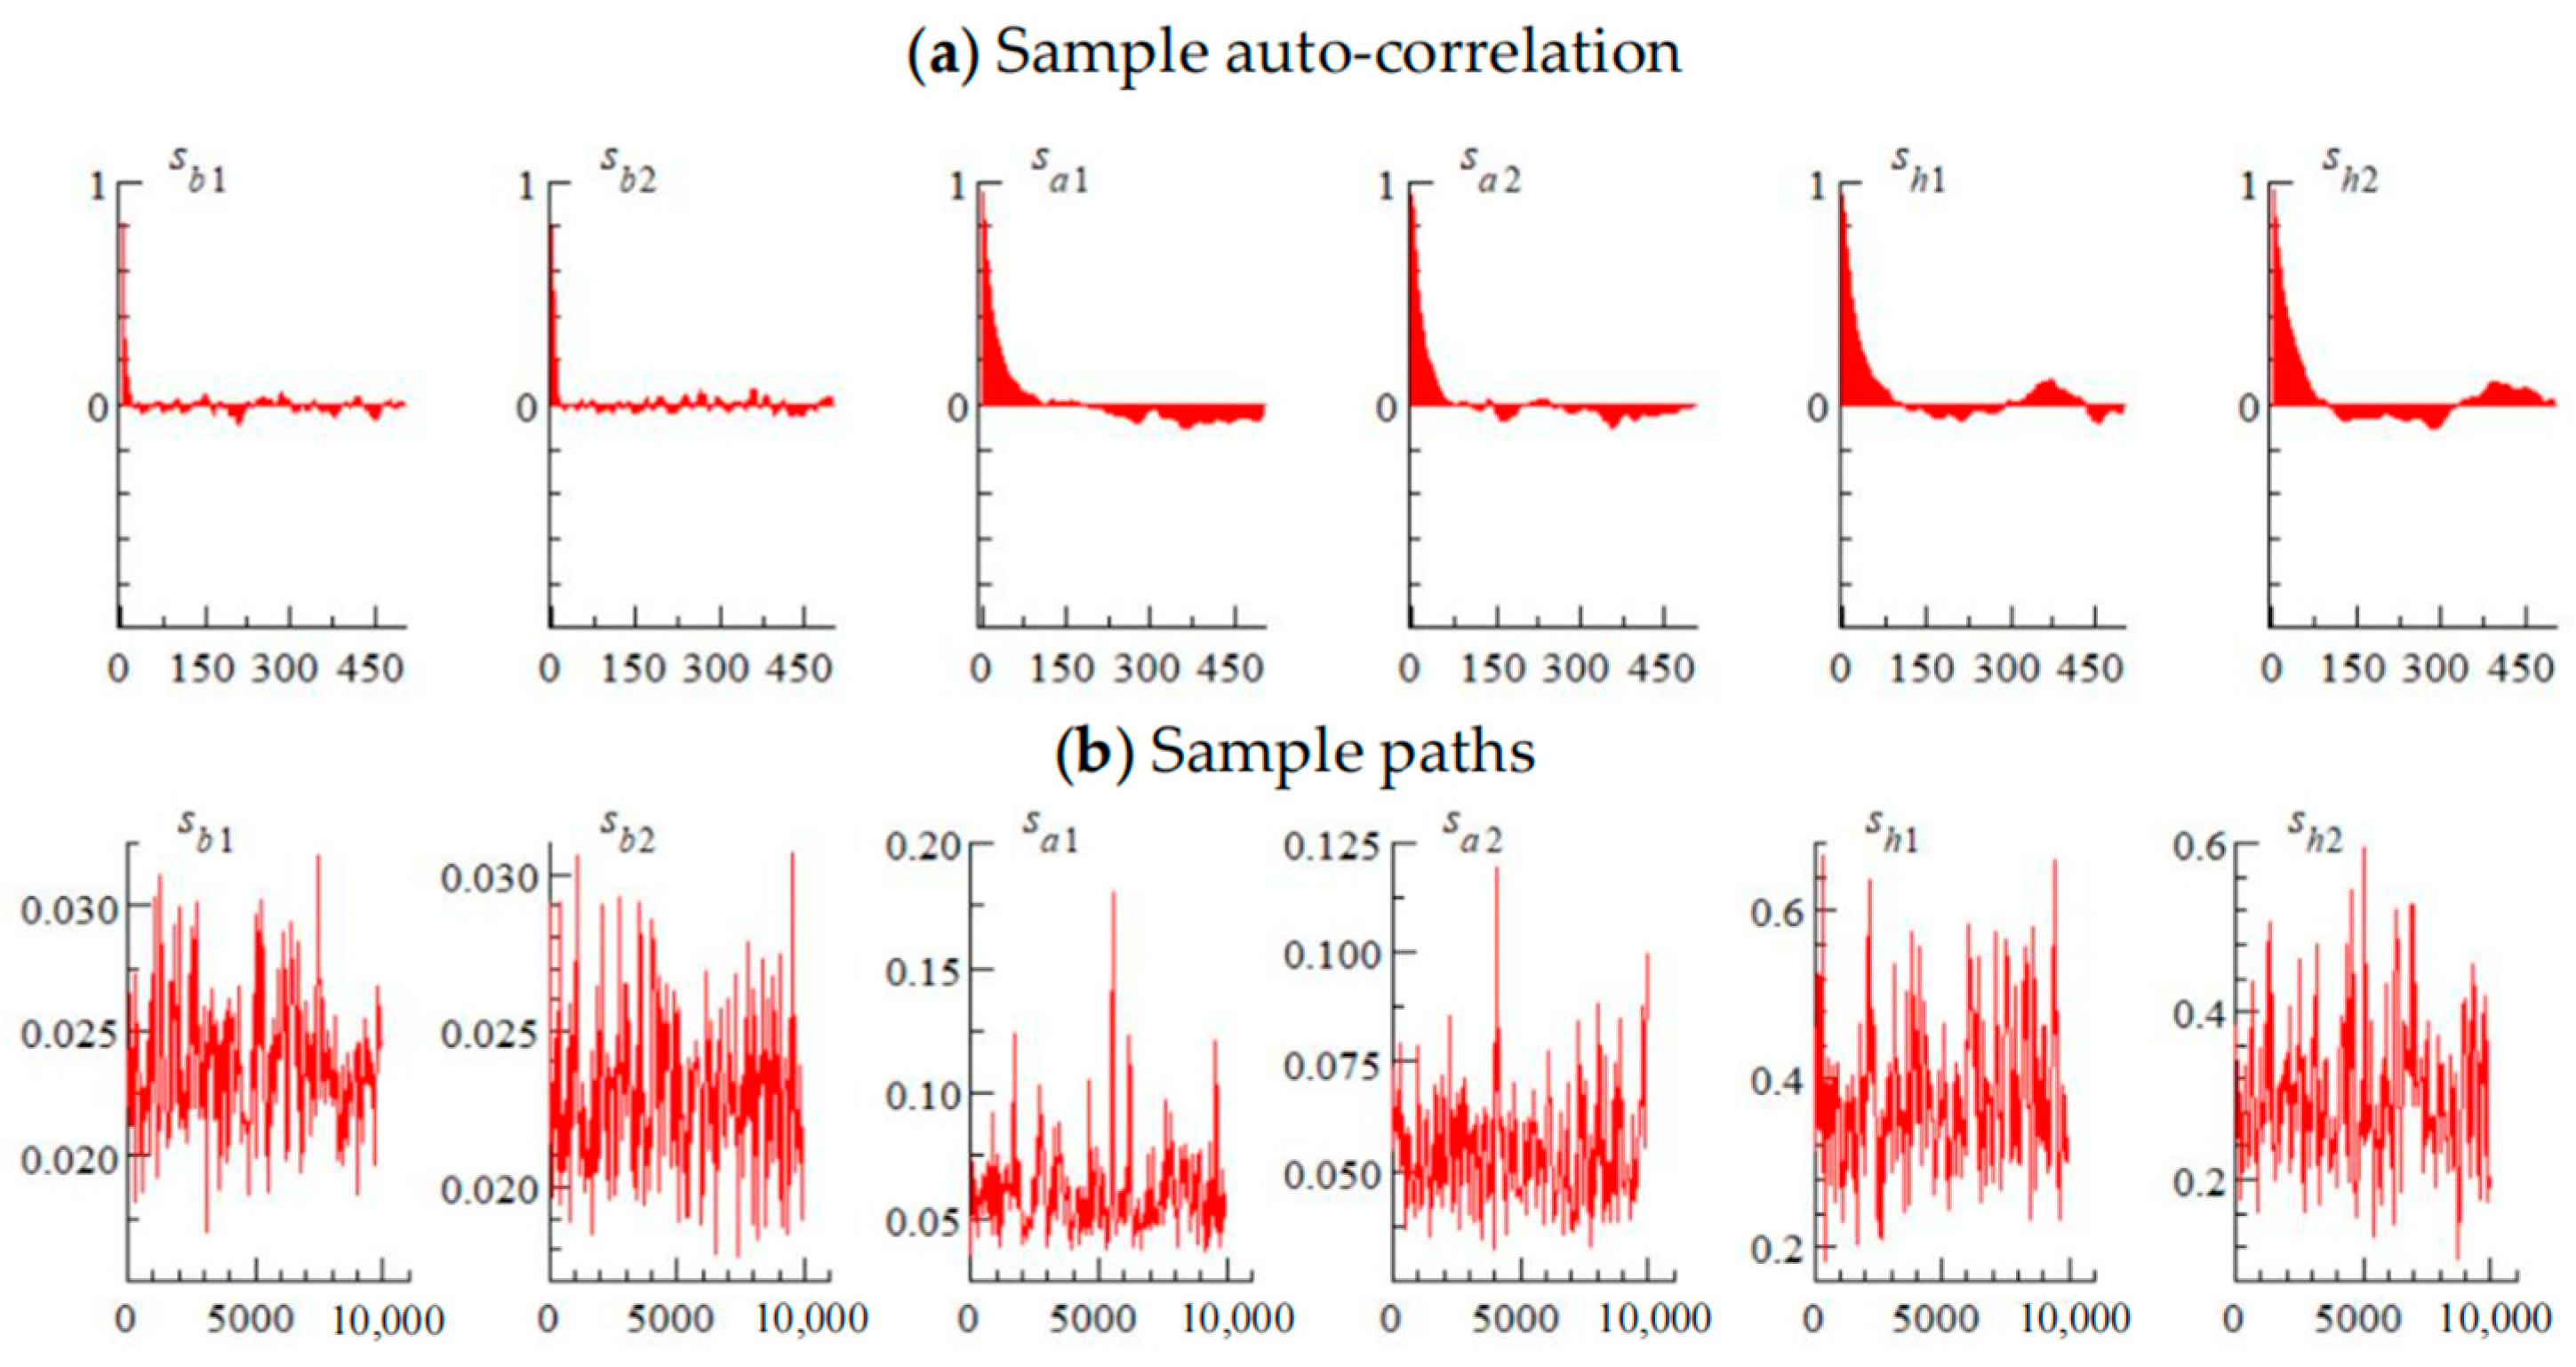
In this study, Nakajima’s research served as the basis for the selection of a reliable sample for the TVP-VAR model. Through the implementation of the Markov Chain Monte Carlo (MCMC) method, 10,000 simulated samples were generated, with the initial 1000 samples being discarded [38,39]. The MCMC estimation outcomes (See Table 3) indicated that the posterior means of all parameter tests fell within the 95% credibility intervals, and the Geweke convergence diagnostic values were notably below the critical value of 1.96 at a significance level of 5%, which meant that the parameters achieved convergence with the posterior distribution; thus, the MCMC sampling exhibited a high level of concentration [35]. In addition, the maximum inefficiency factor was 43.93, well below the sample size, which implies that the number of iterations employed in the estimation was adequate for achieving stable results [44].
Figure 5 illustrates the autocorrelation and sample paths of the samples within the TVP-VAR model. As depicted in Figure 5, it is apparent that with an increase in sample size, the autocorrelation diminished swiftly and converged toward zero. This behavior signifies the proficient management of sequence correlation within the model, indicating that the residuals are not serially correlated, which is a crucial aspect indicating the validity of the model. Autocorrelation diminishing towards zero demonstrates that the dependencies between observations at different time lags are effectively captured by the model, reducing the risk of spurious results and enhancing the model’s reliability. This is critical for dynamic models like the TVP-VAR model, where an accurate representation of time-varying relationships is essential.
Concurrently, the sample paths exhibited fluctuations around a particular value, indicating the stability and convergence of the model parameters. The stability of the sample paths suggests that the model parameters do not drift over time but instead oscillate around a steady state. This is an important feature, as it implies that the model can reliably capture the underlying dynamics of the time series data without being influenced by transient shocks or structural breaks.
These outcomes reinforce the robust fitting capabilities of the TVP-VAR model, establishing a reliable basis for further analysis and forecasts. The ability of the model to handle autocorrelation effectively and maintain parameter stability ensures that it can provide accurate and consistent predictions. This reliability is crucial for any subsequent analysis, as it means that the results derived from the model are based on a sound statistical foundation. As a result, the TVP-VAR model proves to be a powerful tool for understanding and forecasting the dynamic relationships among the variables under study, providing valuable insights for decision-making and strategic planning.

4.2. Time-Varying Impulse and Response

4.2.1. Equidistant Impulse Responses

Figure 6 demonstrates the equidistant pulse responses of different broiler product prices to outbreaks of poultry and swine epidemics at lag periods of 4, 8, and 12. In Figure 6, the labels on the “x” axes represent the specific time and the numbers on the “y” axes represent the impulse responses. The fluctuations induced by these epidemics led to notable time-dependent variations in market prices within the broiler industry. This underscores the dynamic influence of such diseases on market prices across different timelines. Hence, it is imperative to consider the evolving dynamics of poultry and swine epidemics and their diverse impacts across various time intervals when analyzing and predicting the market prices of broiler products.
In terms of the intensity of impulse responses, chicken prices were most influenced by poultry and swine epidemics, with live chicken and broiler chick prices also significantly affected. Conversely, chicken feed prices were comparatively less impacted by sudden disease outbreaks. The notable influence on chicken prices could be attributed to retail chicken products being at the final stage of the broiler industry chain, making them highly sensitive to shifts in consumer preferences and prompt to respond to unexpected external shocks. On the other hand, the effect on chicken feed prices, whether linked to poultry or swine epidemics, was minimal. This minimal impact was primarily because the amount of feed is a crucial element in ensuring livelihood security. The supply of policy-regulated feed had shown a high degree of stability in the face of sudden epidemics, remaining largely unaffected by epidemic fluctuations.
In terms of the direction of impulse responses, the responses of chick prices, live chicken prices, and chicken prices remained consistent. Poultry epidemics primarily exerted a negative impact on prices within the broiler industry chain, whereas swine epidemics tended to have a positive impact on the prices of broiler products. This positive impact arose because swine diseases diminished pork supply, causing a decline in pork production capacity and triggering significant price hikes. The insufficient pork supply created an imbalance in the pork market, leading to higher pork prices and subsequently increasing the demand for chicken meat as a substitute. In comparison, the effect of poultry and swine epidemics on broiler feed prices exhibited intermittent fluctuations, with diverse patterns of both positive and negative influences.
Regarding the impulse responses over different lags, it was observed that the strongest response occurs at lag 4. As the lag period extended, the impact of both poultry and swine epidemics on broiler product prices gradually diminished, with the response at lag 12 being the weakest. This diminishing effect over longer lags suggested that the immediate shock of an epidemic had a more pronounced impact on prices, which then tapered off over time as markets adjusted and alternative supplies or substitutes were sourced. The ability to identify these lagged responses is crucial for understanding the temporal dynamics of price adjustments and for developing strategies to mitigate the adverse effects of such shocks on the broiler industry.

4.2.2. Point-in-Time Impulse Responses

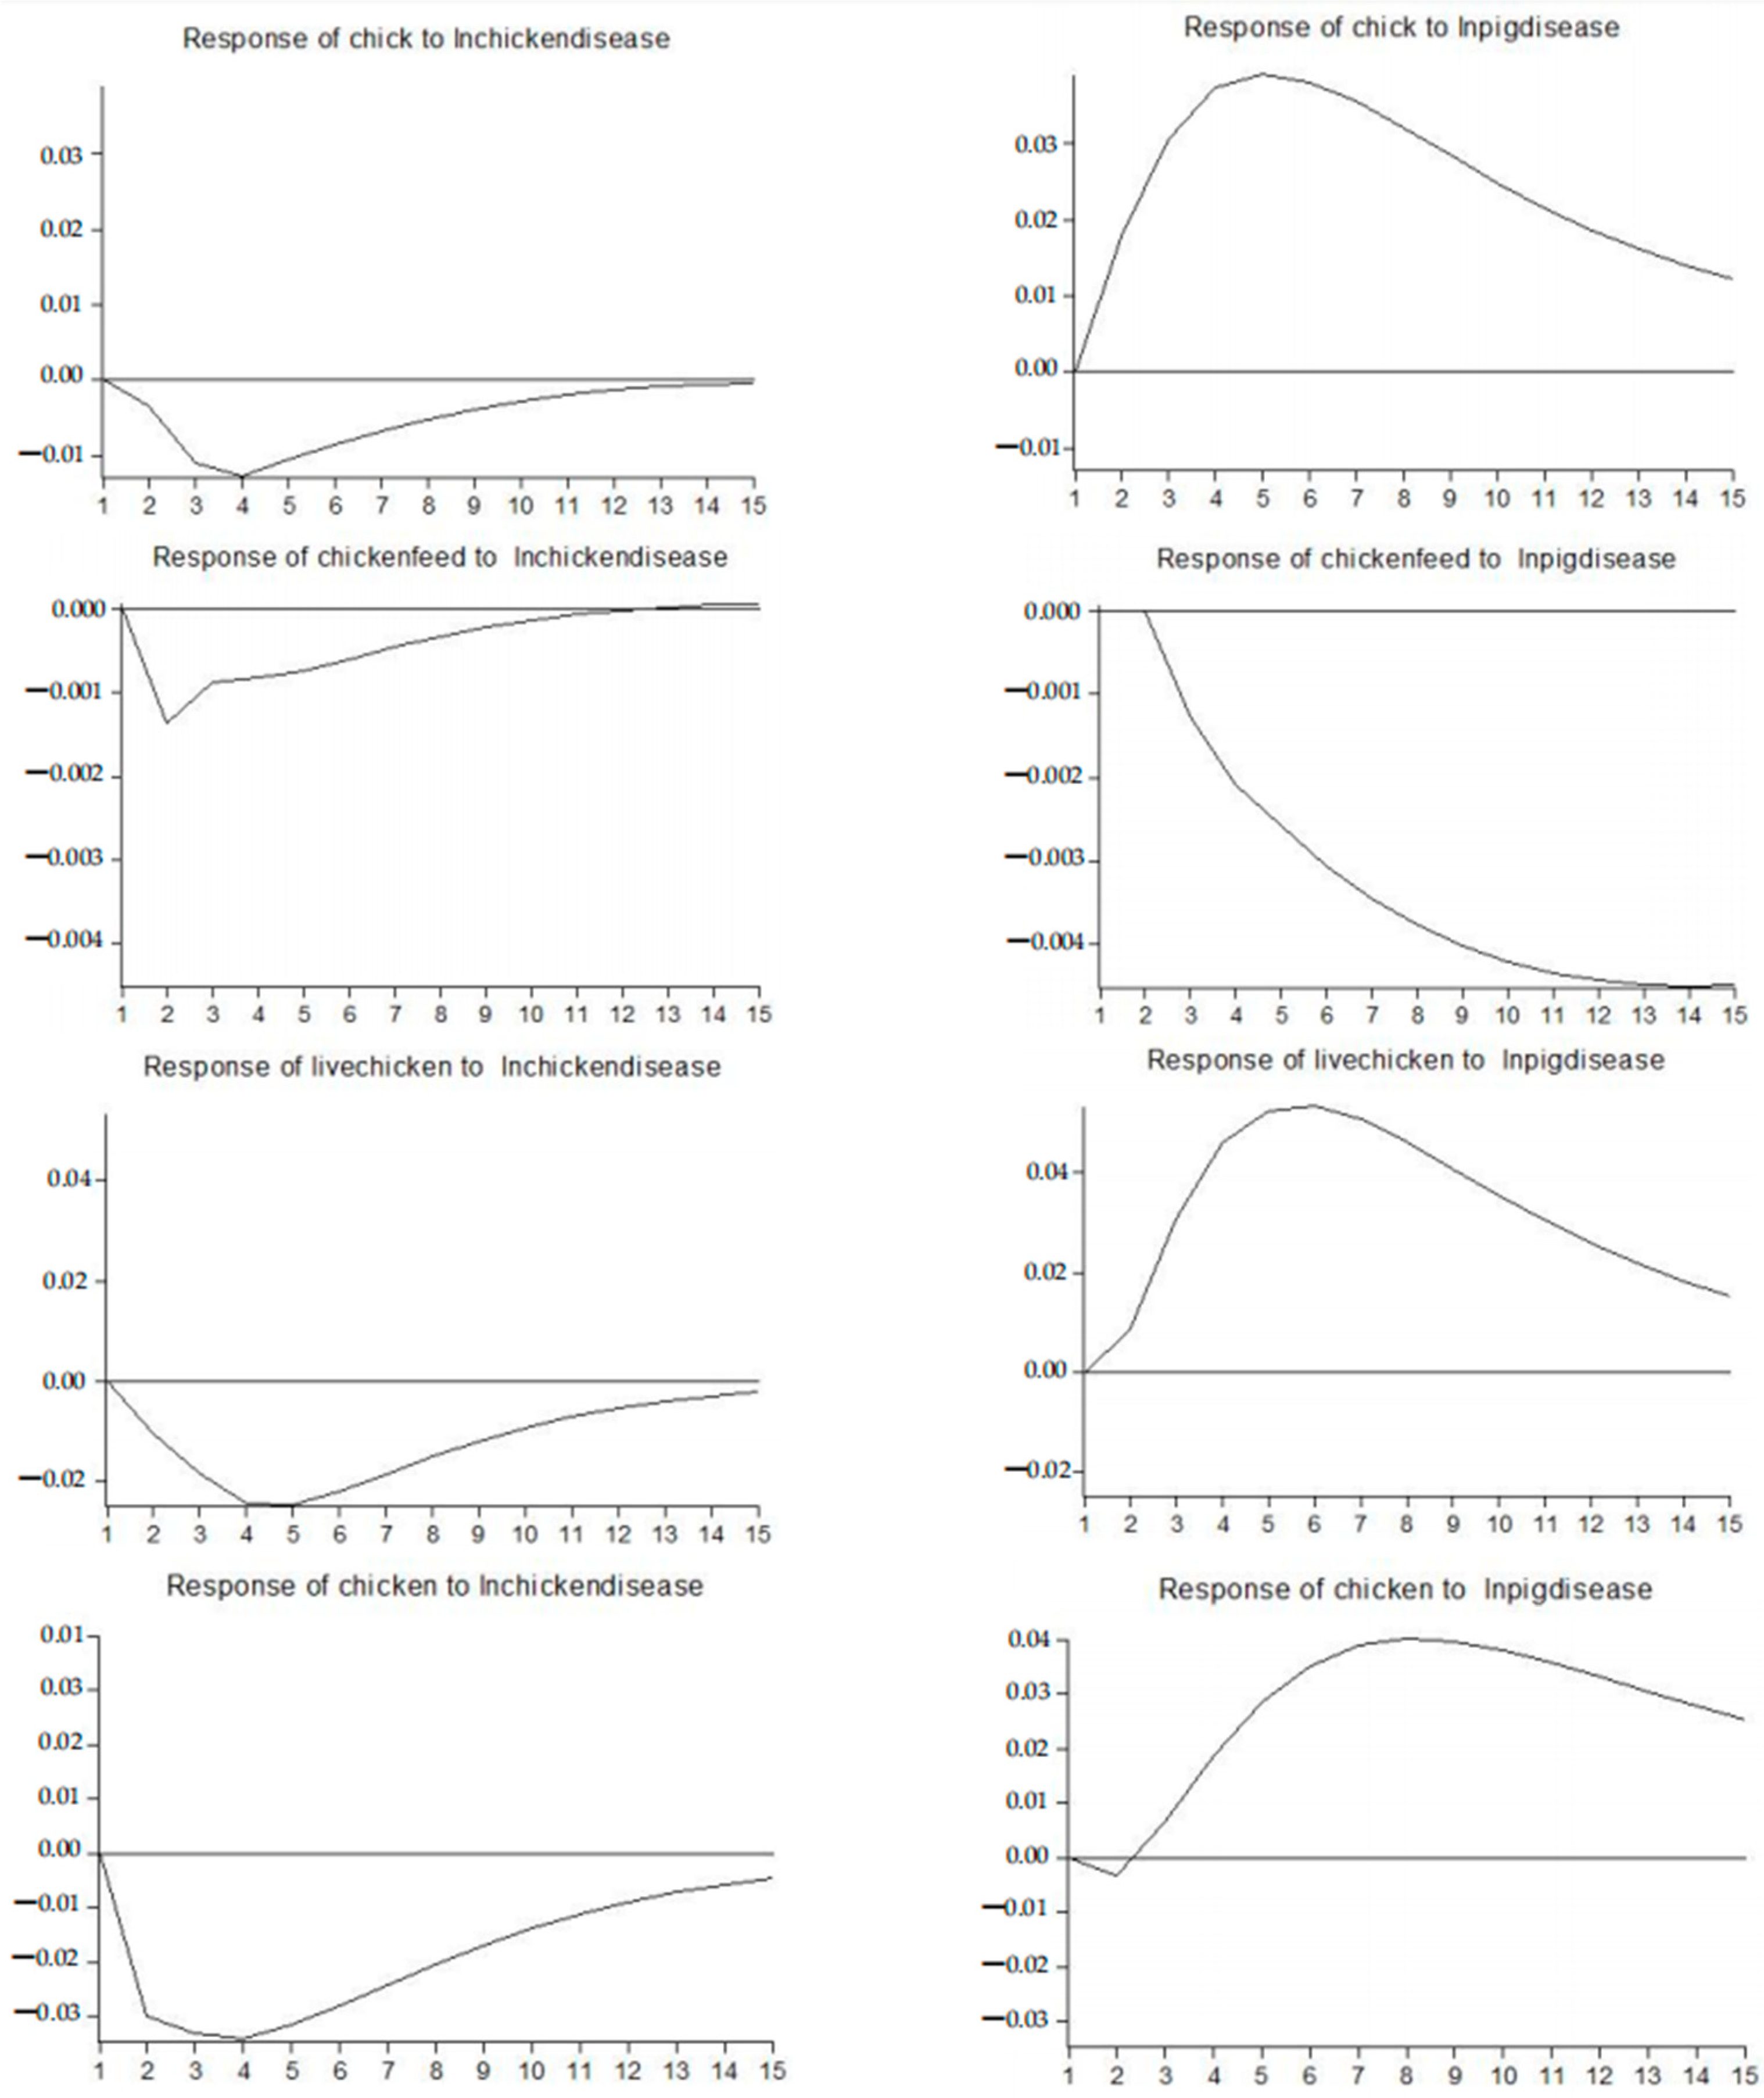
Figure 7 depicts the point-in-time impulse responses of various broiler product prices in March 2014 and September 2018, corresponding to the peak periods of the poultry epidemic index and swine epidemic index, respectively. In Figure 7, the labels on the “x” axes represent the lag periods and the numbers on the “y” axes represent the impulse responses. The results are generally consistent with the previous equidistant impulse responses, indicating a predominantly negative influence of poultry diseases and a primarily positive effect of swine diseases on the broiler industry chain. Notably, outbreaks of poultry and swine epidemics exerted the greatest influence on chicken meat prices, followed by live chicken prices. Broiler feed prices, on the other hand, showed the least vulnerability to sudden epidemics. Given the minimal impact of unexpected epidemics on broiler feed prices, further analysis regarding the directional effects of broiler feed prices at different time points is excluded.
In addition, the influence of poultry diseases on prices of broiler chicks initially displayed a negative trend, turning positive starting from lag 2, and eventually reaching stability around zero by lag 9. This differed from the consistently negative effect of poultry outbreaks on live chicken and chicken prices, reaching a peak at lag 1 and decreasing thereafter. Conversely, the impact of swine diseases on prices of the broiler industry chain showed a minor negative effect initially, followed by a prolonged positive impact peaking around lag 7 before gradually subsiding. The results indicate that the market prices within the broiler industry responded quickly to outbreaks of poultry epidemics, but the effects were temporary. In contrast, the impact of swine epidemic outbreaks was delayed but long-lasting. The findings suggested that market prices in the broiler industry swiftly respond to poultry epidemic outbreaks, but only temporarily. In contrast, the consequences of swine epidemic outbreaks exhibited a delayed yet enduring impact on the market.
When price variations remained within a typical and acceptable range, the market’s inherent regulatory mechanisms could efficiently mitigate the effects on both supply and demand. However, significant fluctuations in broiler product prices, whether sharp increases or decreases, severely hinder the high-quality growth of China’s poultry sector. From a production standpoint, severe price volatility might disrupt the operational strategies of breeding companies and farmers, increasing their business risks, eroding their confidence, and discouraging investment. Banks, seeking to avoid risk, might curtail lending or prematurely call in loans, intensifying financial pressures and potentially causing a collapse in capital flow. This chain of consequences could force many small farmers, including experienced and skilled breeders, to exit the market, causing substantial damage to the poultry industry. From a consumption perspective, dramatic shifts in chicken prices would directly affect daily food expenditures and the financial status of the population. Price instability in a vital commodity not only impacts the quality of life and well-being of people but also has a profound and significant influence on social stability.

4.3. Robustness Test

To strengthen the validity of our empirical results, we employed the Bayes vector auto-regression (BVAR) model to examine the effects of poultry and swine diseases on the broiler industry chain. Figure 8 illustrates that variations in live chicken and chicken meat prices were notably affected by abrupt epidemic outbreaks, with broiler chick prices following behind. Conversely, the impact on chicken feed prices was negligible. Apart from feed prices, prices within the broiler industry exhibited a negative response to poultry epidemics, eventually plateauing at zero. Conversely, responses to swine epidemics generally displayed a predominantly positive trend, also stabilizing at zero. We found that the results using the BVAR model and the TVP-VAR model are essentially the same. These findings also demonstrate the robustness of the results in the article.

5. Conclusions and Policy Recommendations

5.1. Conclusions

Unlike previous studies that examined the effect of only one animal disease on broiler prices, this study employed the natural logarithm of confirmed poultry and swine deaths and culls to assess the severity of these different type of epidemics during the research period. A TVP-VAR model was utilized to analyze the impact of these two epidemics on the monthly prices of broiler feed, broiler chicks, live chickens, and chicken meat in China between January 2009 and September 2021. The key findings include the following: (1) Poultry and swine epidemics exerted substantial impacts on the market prices within the broiler industry chain, with discernible variations in the effects across different periods and categories. (2) The influence of abrupt epidemics on the prices of various segments within the broiler industry chain intensified as one moved from the initial to the terminal stages of the chain. Specifically, chicken meat prices were the most affected, followed by live chicken and broiler chick prices, while chicken feed prices were relatively less affected. (3) With longer lag periods, the impulse response of both poultry and swine epidemics to broiler product prices gradually weakened. (4) Given the consistent consumption of livestock and poultry products, the emergence of poultry or swine epidemics leads to a reduction in the supply and demand for the affected products, while simultaneously increasing the supply and demand for their substitutes. Typically, poultry epidemics primarily influenced the demand side, whereas swine epidemics predominantly affected the supply side. (5) Due to the distinct production cycle lengths of broilers and pigs, the impact of poultry diseases on broiler product prices was immediate yet short-lived; on the contrary, the impact of swine diseases was delayed but longer-lasting in nature.

5.2. Policy Recommendations

To mitigate the effects of unexpected epidemics on broiler production, stabilize prices, secure farmers’ income, and uphold the growth of the broiler sector, the government must prioritize animal epidemic prevention and enhance monitoring, early warning, and emergency response systems. Firstly, integrating biological epidemic prevention tools into requirements for safe feed production permits can curb disease transmission during feed manufacturing. Secondly, strengthening epidemic prevention, supervision, and control measures is vital for the prompt detection, reporting, treatment, and control of outbreaks, thus minimizing their impact on the broiler industry. Thirdly, establishing a national database for animal epidemics and pricing information can enhance transparency, enabling stakeholders to access timely updates and make informed decisions to mitigate losses from epidemics. Moreover, enhancing compensation post-major outbreaks is crucial to restoring market confidence and ensuring the industry’s sustainability.

5.3. Research Limitations and Future Research Directions

Although we used the TVP-VAR model for our empirical analysis, we are limited by the complexity of the model’s premise assumptions and overfitting risk, and we need to use a more cutting-edge model for future analysis. In addition, future research needs to extend the analysis to other regions or countries to examine whether similar patterns exist and to understand the global impact of poultry and swine outbreaks on broiler product prices. Finally, future research needs to include the impact of other factors, such as climate change, trade policies, and technological innovations, on broiler product prices in order to provide a more complete picture of price dynamics.

Author Contributions

Conceptualization, F.Y. and N.X.; methodology, N.X.; software, N.X. and Y.Z.; validation, N.X. and F.Y.; formal analysis, N.X. and H.L.; investigation, N.X. and H.L.; resources, N.X. and Y.Z.; data curation, N.X. and X.L.; writing—original draft preparation, N.X. and H.L.; writing—review and editing, F.Y. and N.X.; visualization, N.X. and H.L.; supervision, F.Y. and X.L.; funding acquisition, N.X. and X.L. All authors have read and agreed to the published version of the manuscript.

Funding

This research was funded by The Jiangxi University Humanities and Social Sciences Research Project, grant number GL22233; The Social Science “14th Five-Year Plan” Youth Fund of Jiangxi Province, grant number 23YJ22; and The Expert Project of The Jiangxi Modern Agricultural Industry Technology System Industrial Economy Post, grant number JXARS-09.

Institutional Review Board Statement

Not applicable.

Informed Consent Statement

Informed consent was obtained from all subjects involved in the study.

Data Availability Statement

The data can be found according to the corresponding data source. Scholars requesting more specific data may email the corresponding author or the first author.

Acknowledgments

The authors are thankful to the anonymous reviewers and the editor for their valuable comments.

Conflicts of Interest

The authors declare no conflicts of interest.

References

  1. Che, Q.; Saatkamp, H.W.; Cortenbach, J.; Jin, W. Comparison of Chinese broiler production systems in economic performance and animal welfare. Animals 2020, 10, 491. [Google Scholar] [CrossRef] [PubMed]
  2. Tang, S.; Zheng, Y.; Li, T.; Zhou, L. The hold-up problem in China’s broiler industry: Empirical evidence from Jiangsu Province. Can. J. Agric. Econ. Rev. Can. D’agroecon. 2021, 69, 539–554. [Google Scholar] [CrossRef]
  3. Guo, J.; Wu, L. Analysis of the characteristics of fluctuations and influencing factors of poultry prices in China. Price Theory Pract. 2014, 2, 82–84. [Google Scholar] [CrossRef]
  4. Zhai, X.; Han, Y. Investigation on the broiler product pricing industrial chain cost structure and distribution of profits. Issues Agric. Econ. 2008, 11, 20–25. [Google Scholar] [CrossRef]
  5. Gale, F.; Arnade, C. Effects of rising feed and labor costs on China’s chicken price. Int. Food Agribus. Manag. Rev. 2015, 18, 137–150. [Google Scholar] [CrossRef]
  6. Davison, S.; Benson, C.E.; Ziegler, A.F.; Eckroade, R.J. Evaluation of disinfectants with the addition of antifreezing compounds against nonpathogenic H7N2 avian influenza virus. Avian Dis. 1999, 43, 533–537. [Google Scholar] [CrossRef] [PubMed]
  7. Brown, S.; Madison, D.; Goodwin, H.L.; Clark, F.D. The potential effects on United States agriculture of an avian influenza outbreak. J. Agric. Appl. Econ. 2007, 39, 335–343. [Google Scholar] [CrossRef]
  8. You, L.; Diao, X. Assessing the potential impact of avian influenza on poultry in West Africa: A spatial equilibrium analysis. J. Agric. Econ. 2007, 58, 348–367. [Google Scholar] [CrossRef]
  9. Saghaian, S.H.; Ozertan, G.; Spaulding, A.D. Dynamics of price transmission in the presence of a major food safety shock: Impact of H5N1 avian influenza on the Turkish poultry sector. J. Agric. Appl. Econ. 2008, 40, 1015–1031. [Google Scholar] [CrossRef]
  10. Mutlu Çamoğlu, S.; Serra, T.; Gil, J.M. Vertical price transmission in the Turkish poultry market: The avian influenza crisis. Appl. Econ. 2015, 47, 1106–1117. [Google Scholar] [CrossRef]
  11. Park, M.; Jin, Y.H.; Bessler, D.A. The impacts of animal disease crises on the Korean meat market. Agric. Econ. 2008, 39, 183–195. [Google Scholar] [CrossRef]
  12. Condry, S.C.; Hallman, W.K.; Vata, M. Avian Influenza in Poultry: Americans’ Knowledge, Perceptions, and Responses; Food Policy Institute, Rutgers University: New Brunswick, NJ, USA, 2007. [Google Scholar]
  13. Mu, J.E.; McCarl, B.A.; Hagerman, A. Impacts of bovine spongiform encephalopathy and avian influenza on US meat demand. J. Integr. Agric. 2015, 14, 1130–1141. [Google Scholar] [CrossRef]
  14. Hassouneh, I.; Radwan, A.; Serra, T.; Gil, J.M. Food scare crises and developing countries: The impact of avian influenza on vertical price transmission in the Egyptian poultry sector. Food Policy 2012, 37, 264–274. [Google Scholar] [CrossRef]
  15. Ding, C.Z.; Zheng, Y.; Xiao, H.F. Reserach on market status of the broiler industry under avian influenza crisis*—Based on internet big data and MS-VAR model. Chin. J. Agric. Resour. Reg. Plan. 2019, 40, 92–100. [Google Scholar] [CrossRef]
  16. Zhou, L.; Liu, C.Y. Study on the Vertical and Horizontal Transmission of Prices in the Broiler Industry under the Risk of Avian Influenza. Stat. Decis. Mak. 2016, 17, 93–96. [Google Scholar] [CrossRef]
  17. Liu, T.; Zhou, L.; Ying, R. Study on the current and lagging effects of highly pathogenic avian influenza on the segmentation of poultry market in China*—Based on China’s inter probincial panel data. Chin. J. Agric. Resour. Reg. Plan. 2021, 42, 244–253. [Google Scholar] [CrossRef]
  18. Zheng, Y.; Ma, J. The analysis of the dynamic impacts of avian influenza on livestock and poultry prices: Based on the TVP-VAR model. Res. Agric. Mod. 2018, 39, 751–760. [Google Scholar] [CrossRef]
  19. Cai, X.; Tao, J.P. The price fluctuation and its dynamic relations of the poultry industry chain under the influence of avian influenza. Res. Agric. Mod. 2017, 38, 267–274. [Google Scholar] [CrossRef]
  20. Shi, Z.; Zhou, H.; Hu, X. The impacts of disease shocks on the price volatility of China’s livestock products. Res. Agric. Mod. 2020, 41, 863–871. [Google Scholar] [CrossRef]
  21. Li, H.S.; Hu, C.P.; Zheng, L.Ü.; Li, M.Q.; Guo, X.Z. African swine fever and meat prices fluctuation: An empirical study in China based on TVP-VAR model. J. Integr. Agric. 2021, 20, 2289–2301. [Google Scholar] [CrossRef]
  22. Zhan, Z.; Li, M.; Ji, Y. Study on the influence of African swine fever on the fluctuation of meat prices in China: Empirical an alysis based on PVAR model. Res. Chin. Agric. Mech. 2021, 42, 173–178. [Google Scholar] [CrossRef]
  23. Li, M.; Ji, Y.; Hu, C. Study on regional heterogeneity of the impacts form African swine fever on meat prices in China*. Chin. J. Agric. Resour. Reg. Plan. 2022, 43, 104–114. [Google Scholar] [CrossRef]
  24. He, W.; Xiong, T.; Shang, Y. The impacts of major animal diseases on the prices of China’s meat and poultry markets: Evidence from the African swine fever. Res. Agric. Mod. 2022, 43, 318–327. [Google Scholar] [CrossRef]
  25. Chen, Y.; Hua, J.; Zhang, J. Study on impulsive and spillover effects of pig epidemics on pork price. J. Agric. Econ. 2022, 7, 48–63. [Google Scholar] [CrossRef]
  26. Zheng, Y.; Ma, J. Research on the state transition of broiler industry and asymmetric transmission of industrial Chain price—Based on MS-VAR model. J. Huazhong Agric. Univ. (Soc. Sci. Ed.) 2018, 1, 73–80+159–160. [Google Scholar] [CrossRef]
  27. Zheng, Y.; Ding, C.; Ma, J. Impact of Avian Influenza Epidemic on Price Fluctuation of Livestock and Poultry Products in China. Agric. Econ. Manag. 2018, 2, 69–76. [Google Scholar]
  28. Su, G.; Hua, J.; Sun, W. The Formation Mechanism and Test of the Non-linear Impact of Pig Epidemics on Pork Prices. Chin. Rural. Econ. 2021, 11, 107–124. [Google Scholar]
  29. Li, J.; Shi, Z.; Hu, X. Analysis of the Impact of Epidemic Shock on China’s Hog Market Volatility. J. Agro-For. Econ. Manag. 2022, 21, 453–462. [Google Scholar] [CrossRef]
  30. Wang, Q.; Li, Q. Disfigurement and Countermeasures of Market Mechanism on Pig Industry in China. Res. Agric. Mod. 2009, 30, 293–297. [Google Scholar]
  31. Nie, Y.; Gao, X.; Li, B.; Qiao, J. Farmers’ production decision under the background of African swine flu: Thoughts on the recovery and development of hog production. Res. Agric. Mod. 2020, 41, 1031–1039. [Google Scholar] [CrossRef]
  32. Min, S.; Zhang, X.; Li, G. A snapshot of food supply chain in Wuhan under the COVID-19 pandemic. China Agric. Econ. Rev. 2020, 12, 689–704. [Google Scholar] [CrossRef]
  33. Shi, Z.; Li, J.; Hu, X. The Impact of Pig Epidemics on China’s Pork Supply and Demands. J. Agric. Econ. 2023, 3, 4–17. [Google Scholar] [CrossRef]
  34. Sims, C.A. Macroeconomics and reality. Econometrica 1980, 48, 1–48. [Google Scholar] [CrossRef]
  35. Nakajima, J.; Kasuya, M.; Watanabe, T. Bayesian analysis of time-varying parameter vector autoregressive model for the Japanese economy and monetary policy. J. Jpn. Int. Econ. 2011, 25, 225–245. [Google Scholar] [CrossRef]
  36. Primiceri, G.E. Time varying structural vector autoregressions and monetary policy. Rev. Econ. Stud. 2005, 72, 821–852. [Google Scholar] [CrossRef]
  37. Roşoiu, A. Monetary policy and time varying parameter vector autoregression model. Procedia Econ. Financ. 2015, 32, 496–502. [Google Scholar] [CrossRef]
  38. Gong, X.; Lin, B. Time-varying effects of oil supply and demand shocks on China’s macro-economy. Energy 2018, 149, 424–437. [Google Scholar] [CrossRef]
  39. Chen, J.; Zhu, X.; Li, H. The pass-through effects of oil price shocks on China’s inflation: A time-varying analysis. Energy Econ. 2020, 86, 104695. [Google Scholar] [CrossRef]
  40. China Animal Husbandry and Veterinary Yearbook Editorial Committee. China Animal Husbandry and Veterinary Yearbook (2009–2021); China Animal Husbandry and Veterinary Yearbook Editorial Committee: Beijing, China, 2021. [Google Scholar]
  41. Dickey, D.A.; Fuller, W.A. Likelihood ratio statistics for autoregressive time series with a unit root. Econometrica 1981, 49, 1057–1072. [Google Scholar] [CrossRef]
  42. Adekoya, O.B.; Oliyide, J.A. How COVID-19 drives connectedness among commodity and financial markets: Evidence from TVP-VAR and causality-in-quantiles techniques. Resour. Policy 2021, 70, 101898. [Google Scholar] [CrossRef]
  43. He, Z. Geopolitical risks and investor sentiment: Causality and TVP-VAR analysis. N. Am. J. Econ. Financ. 2023, 67, 101947. [Google Scholar] [CrossRef]
  44. Yang, H.; Cao, Y.; Shi, Y.; Wu, Y.; Guo, W.; Fu, H.; Li, Y. The Dynamic Impacts of Weather Changes on Vegetable Price Fluctuations in Shandong Province, China: An Analysis Based on VAR and TVP-VAR Models. Agronomy 2022, 12, 2680. [Google Scholar] [CrossRef]
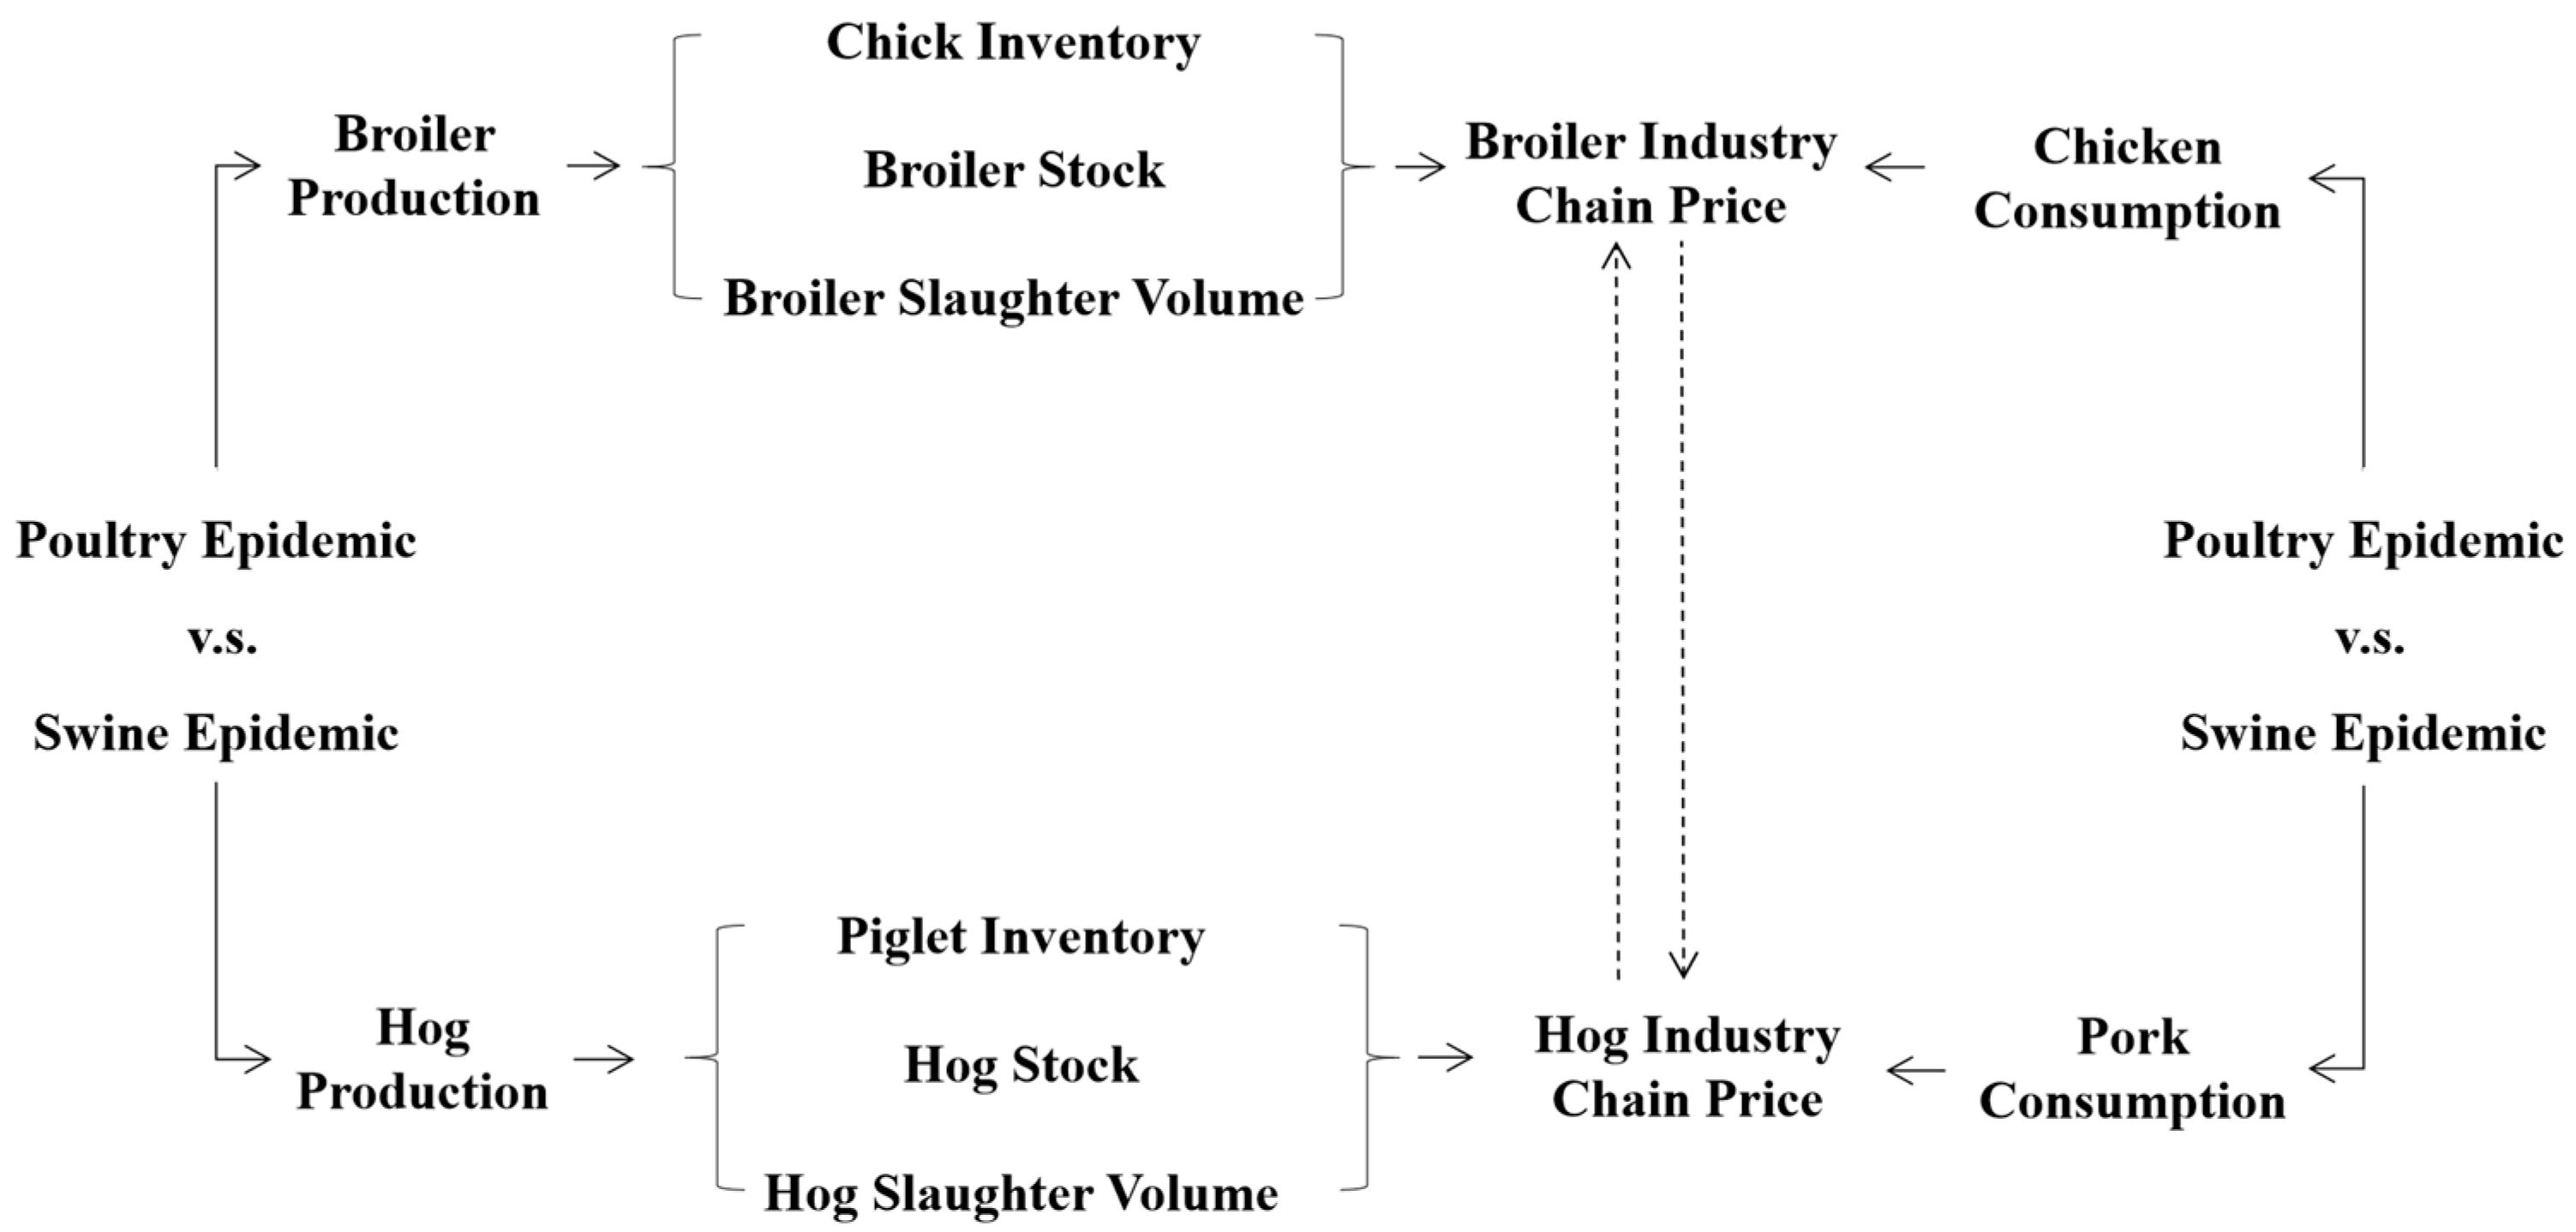
Figure 1. The impact paths of swine and poultry epidemics on price fluctuations in the broiler industry chain.
Sustainability 16 06043 g001
Figure 2. The price trend of chicks, chicken feed, live chickens, and chicken meat in China from January 2009 to September 2021. Source: the China Animal Husbandry and Veterinary Yearbook (2009–2021) [40].
Sustainability 16 06043 g002
Figure 3. The monthly number of deaths and hunts of live chickens caused by poultry diseases from 2009 to 2021 in China. Source: BricBigData (https://www.agdata.cn, accessed on 28 February 2024).
Sustainability 16 06043 g003
Figure 4. The monthly number of deaths and hunts of pigs caused by swine diseases from 2009 to 2021 in China. Source: BricBigData (https://www.agdata.cn).
Sustainability 16 06043 g004
Figure 5. The sample autocorrelation and sample paths.
Sustainability 16 06043 g005
Figure 6. Equidistant impulse responses of poultry and swine epidemics to different broiler product prices.
Sustainability 16 06043 g006
Figure 7. Point-in-Time impulse responses of poultry and swine epidemics to different broiler product prices.
Sustainability 16 06043 g007
Figure 8. Impulse responses of poultry and swine epidemics to different broiler product prices by BVAR model.
Sustainability 16 06043 g008
Table 1. ADF unit root test results.
VariableADF Statistic(C, T, K)5% Threshold ValueConclusion
chick−2.633(1, 0, 2)−2.881Stable
∆chick−11.459(0, 0, 1)−1.943Stable
chickenfeed−1.812(1, 0, 13)−2.882Unstable
∆chickenfeed−1.633(0, 0, 13)−1.943Stable
livechicken−4.476(1, 0, 1)−2.881Stable
∆livechicken−7.585(0, 0, 0)−1.943Stable
chicken−4.476(1, 1, 1)−3.440Stable
∆chicken−7.131(0, 0, 0)−1.943Stable
lnchickendisease−6.342(1, 1, 1)−3.440Stable
∆lnchickendisease−9.169(0, 0, 4)−1.943Stable
lnpigdisease−3.314(1, 0, 1)−1.881Stable
∆lnpigdisease−16.995(0, 0, 0)−1.943Stable
Note: in Table 1, C denotes the constant term, T denotes the trend term, K denotes the lag order, and ∆( ) indicates the first-order difference of each sequence variable.
Table 2. Determination of the model lag.
Lag PeriodLogLLRFPEAICSCHQ
0−820.567NA0.00311.24611.36811.295
1−16.9431607.28.99 × 10−80.8021.656 *1.149
261.704157.295.04 × 10−80.2221.8080.866 *
3103.49483.584.69 × 10−8 *0.143 *2.4621.085
4133.11859.2485.17 × 10−80.233.2811.47
5171.97477.712 *5.07 × 10−80.1913.9751.728
6194.63345.3186.25 × 10−80.3724.8892.207
Note: an asterisk (*) denotes the most suitable lag order based on the respective criteria.
Table 3. MCMC parameter estimation results.
ParameterMeanSD95%U95%LGewekeInefficiency
( β ) 1 0.0240.0030.0190.0300.6667.08
( β ) 2 0.0230.0030.0190.0290.1857.05
( α ) 1 0.0590.0170.0370.1040.37542.98
( α ) 2 0.0550.0140.0350.0880.76130.93
( h ) 1 0.3760.0920.2220.5870.77943.18
( h ) 2 0.2970.0900.1580.5120.06643.93
Note: in Table 3, mean indicates the posterior means. SD indicates the standard deviations. A result of 95%L means a lower credible interval limit, 95%U means an upper credible interval limit, and Gewe indicates convergence diagnostics.
Disclaimer/Publisher’s Note: The statements, opinions and data contained in all publications are solely those of the individual author(s) and contributor(s) and not of MDPI and/or the editor(s). MDPI and/or the editor(s) disclaim responsibility for any injury to people or property resulting from any ideas, methods, instructions or products referred to in the content.