Article

Carbon Footprint for Jeans’ Circular Economy Model Using Bagasse

1
Graduate School of Environmental and Information Studies, Tokyo City University, Yokohama 224-0015, Japan
2
Department of General Education, National Institute of Technology, Tokyo College, Tokyo 193-0997, Japan
3
Faculty of Environmental Studies, Graduate School of Environmental and Information Studies, Tokyo City University, Yokohama 224-0015, Japan
4
Faculty of Science and Engineering, Waseda University, Tokyo 169-8555, Japan
*
Author to whom correspondence should be addressed.
Sustainability 2024, 16(14), 6044; https://doi.org/10.3390/su16146044
Submission received: 20 May 2024 / Revised: 28 June 2024 / Accepted: 5 July 2024 / Published: 15 July 2024

Abstract

:
To date, clothing has been produced and disposed of in large quantities. It is also known that each process, from the procurement of raw materials to production, transportation, sales, laundry, and disposal, has a significant environmental impact. According to the Global Fashion Agenda, greenhouse gas (GHG) emissions from the fashion industry account for 4% of the global total. Therefore, apparel makers are shifting from a linear economy to a circular economy. For example, the Japanese start-up Curelabo Co., Ltd. (Okinawa, Japan) developed jeans (bagasse washi jeans) made from bagasse, which is a residual material derived from sugarcane after the extraction of cane juice. Furthermore, the use of improved dyeing reduces boiler fuel consumption and eliminates the need for detergents and acid. For disposal, the used jeans and their production waste are processed into biochar for carbon sequestration. In this study, we attempted to calculate GHG emissions using life cycle assessment (LCA) for the circular economy model developed by Curelabo Co., Ltd. GHG emissions from the production of bagasse washi jeans were 1.09 × 101 kg-CO2e. Dyeing, bleaching, and fabric finishing, known as the wet processes, were found to contribute a large proportion of GHG emissions due to their high energy consumption. Furthermore, the entire lifecycle of GHG emissions from bagasse washi jeans, including transport, sales, laundry, and disposal, were 1.53 × 101 kg-CO2e. First, the use of bagasse washi yarn for the weft reduced by 2.99 × 10⁻¹ kg-CO2e compared with the use of conventional 100% bleached cotton yarn. Second, compared with conventional dyeing, GHG emissions from the improved dyeing process were reduced by 2.78 kg-CO2e. Third, the disposal of the used jeans and their production waste into biochar reduced GHG emissions by 9.01 × 10⁻¹ kg-CO2e. Additionally, GHG emissions can be reduced by re-inputting waste in the paper-making process and by using liquefied natural gas as boiler fuel in the dyeing process.

1. Introduction

1.1. Research Background

Clothing is an essential component of life. According to the Ellen MacArthur Foundation [1], global clothing sales nearly doubled from 50 billion to 100 billion items from 2000 to 2015 due to the growth of the world population and the expanding middle class. Additionally, in Japan, the popularity of fast fashion has led to the market distribution of affordable and less durable clothing. According to The Japan Textiles Importers Association [2], the annual domestic apparel supply increased from 2 billion to 3.98 billion items between 1990 and 2019. In the exit disposal phase, according to Sun et al. [3], 92 million tons of textile waste are generated annually worldwide, 85% of which are landfilled or incinerated. In Japan, on the other hand, according to the Ministry of the Environment [4], 64% of all clothing discarded by households is incinerated. Furthermore, according to the Global Fashion Agenda [5], the global fashion industry produced approximately 2.1 billion tons of greenhouse gas (GHG) emissions in 2018, accounting for 4% of the global total. Therefore, apparel makers are attempting to shift from a past linear economy to a circular economy that circulates resources. For example, the H&M Group (Stockholm, Sweden) considers the entire lifespan of clothing and designs them according to their purpose, carrying their repairs, reselling, and repurposing before the end of their life [6]. Additionally, they aim to use 100% recycled or sustainably sourced materials by 2030 [6]. Patagonia Inc. (Ventura, CA, USA) offers closed recycling of T-shirts, product durability, and repair services [7].
On the other hand, the Japanese start-up Curelabo Co., Ltd. (Okinawa, Japan) [8] designed and produced environmentally friendly jeans (hereinafter referred to as bagasse washi jeans). These jeans were partly made from bagasse, a residual material derived from sugarcane, after the extraction of cane juice. Improved dyeing is used in the dyeing process, which consumes less energy than conventional dyeing and does not require detergents and acids. For disposal, carbon sequestration is achieved by processing used clothing and their production waste into biochar.
Life cycle assessment (LCA) is a systematic scientific approach developed to study the environmental impacts of products and services during their life cycle (ISO 14040, 14044 [9,10]). LCA can also provide quantitative data for the circular economy approach, which is complementary. Several LCA studies have been conducted on apparel. For clothing production, there are reports of T-shirts by Baydar et al. [11] in Turkey and Zhang et al. [12] in China. For jeans, there are many reports from companies and institutions (LEVI STRAUS & CO. (San Francisco, CA, USA) [13]; Mistra Future Fashion [14]; Hedman [15]). Additionally, many of these studies cite secondary data from databases, such as Ecoinvent [16] or the literature, and few have primary data.
Cotton fiber is widely used in clothing because of its good texture, moisture absorption, and warmth retention properties. According to Cotton Incorporated [17], global cotton production in 2021/22 was 2.53 × 10⁴ kt, with China, India, and the United States accounting for 23.2%, 21.1%, and 15.1%, respectively, in order of production volume. Several LCA studies of cotton cultivation have been conducted in different regions. In China, Liu et al. [18], var der Velden et al. [19], and Günther et al. [20]; in India, Thinkstep [21]; in the USA, Nalley et al. [22]; in Australia, Khabbaz et al. [23] and Visser et al. [24]; in Brazil, Morita et al. [25]; in Africa, Avadi et al. [26], and Aid by Trade Foundation [27]; in the global average, Cotton Incorporated [28,29], and Textile Exchange [30]. As reported by Cotton Incorporated [29], the Global warming potential (GWP) for producing 1.0 × 10³ kg of cotton fiber from cultivation to ginning and transportation is 1.326 × 10³ kg-CO2e, and water consumption is 1.559 × 10³ m3. This indicates that the environmental impact of cotton cultivation is very significant. Due to this substantial environmental impact, alternative materials such as kapok fiber and Japanese traditional paper (hereinafter referred to as washi) are being considered.
The dyeing process has a significant environmental impact on the various phases of clothing production. According to Munasinghe et al. [31], fabric dyeing has the second-largest environmental impact after material extraction among the stages of clothing production. Baydar et al. [11] reported that wet processing, including dyeing, had the largest GWP percentage in the production process of T-shirts in Turkey. Zhang et al. [32] also studied wet processing in China. They reported that the GWP of the dyeing unit was significantly affected by a large amount of energy consumption (electricity and steam), hard coal mine operations, and the large production of dye auxiliaries. Kazan et al. [33] also reported that greenhouse gas emissions could be reduced by 11% by using natural dyes instead of synthetic dyes.
As mentioned above, most waste is landfilled or incinerated during disposal. Regarding GHG emissions from disposal, Salemdeeb et al. [34] reported that textile waste accounted for the largest GHG emissions among household waste in Scotland. Regarding recycling and reuse, Farrant et al. [35] reported 14% reductions in GHG emissions when 100% cotton shirts were reused in Sweden. Zamani et al. [36] reported that combining three recycling technologies (material reuse, cotton, and polyester separation using N-methylmorpholine-N-oxide and polyester recycling) could reduce 10 t of CO2 per ton of textile waste (50% cotton and 50% polyester). Semba et al. [37] reported the largest GHG emission reductions of 3.20 × 101 kg-CO2e/kg-used clothing when used clothing was reused overseas, compared with each recycling method for used clothing discarded by Japanese households. Although clothing reuse is more effective in reducing GHG emissions because it does not require further processing, only a portion of clothing is reused because of the product’s characteristics.
As described above, the environmental impacts associated with the production of materials, dyeing, and the disposal of clothing are significant. Few studies have focused on these processes and quantitatively discussed improvement measures and their effects.

1.2. Purpose

The purpose of this study is to obtain as much primary data as possible on the supply chain employed by Curelabo Co., Ltd., and to calculate the GHG emissions over the entire life cycle of bagasse washi jeans. In particular, we focused on the processes with the largest environmental impact: raw material production, dyeing, and disposal.

1.2.1. Raw Material Production Process: Use of Bagasse as Raw Material

Cotton, used as the jeans material, is widely used because of its excellent heat retention, moisture, and water absorption properties. However, cotton has various environmental impacts [19], and alternative materials are being sought. These alternative materials include recycled cotton fiber, kapok fiber, banana fiber, and washi. Challenges with recycled cotton fiber include limited use due to dyeing and low strength. Washi yarn is unique to Japan and has been used since ancient times. It is light and exhibits excellent moisture and water absorption properties. Therefore, in recent years, washi yarn has again attracted attention as a substitute for cotton yarn; however, its production is small, and LCA studies have not yet been conducted. In this study, we sought to determine the GHG emission reductions when bagasse-mixed washi yarn (hereinafter referred to as bagasse washi yarn) was used instead of cotton yarn.

1.2.2. Dyeing Process: Environmentally Friendly Rope Dyeing (Improved Dyeing)

Dyeing is known to have a high environmental impact during the life cycle of jeans [14]. The denim fabric warp is dyed by reducing the indigo dye in a process known as vat dyeing. There are two dyeing methods: rope dyeing and slasher dyeing. Rope dyeing is a more complex process but allows for uniform dyeing. In this study, we conducted an interview with a company that implements environmentally friendly rope dyeing (improved dyeing) and obtained primary data. LCA studies on indigo dye production include Pattanaik et al. [38] for natural indigo, and Saling et al. [39] for BASF. Regarding dyeing auxiliaries, Fidan et al. [40] found that GHG emissions from the dyeing process could be reduced by 8.1% using safer and more sustainable chemicals compared to conventional rope dyeing. Kurashiki and Fukuyama are Japan’s leading jeans-producing areas known for their high worldwide reputation. Although many LCA studies [13,14,15,25,41,42,43,44] have been conducted on jeans made by overseas manufacturers, there are no reported cases in Japan that will be clarified in this study.

1.2.3. Disposal Process: Carbon Sequestration of Used Jeans and Waste Generated in the Production Process

Currently, the majority of used clothing is generated as household waste and incinerated or landfilled. There are several ways to recycle used clothing: reuse, material recycling, chemical recycling, and thermal recovery. Reuse in its original form as used clothing has the lowest environmental impact [37]. However, since clothing is a highly desirable product, only a portion of it is reused. Other methods include material recycling into automotive felts, chemical recycling of polyester, and thermal recovery at incineration plants. However, biochar has been attracting attention in recent years. Processing used clothing and its production waste into biochar can sequester carbon and reduce its release into the atmosphere. This study identified the reduction effect of carbonizing jeans by using a charcoal-making furnace.

2. Research Methods

2.1. Evaluation Target and System Boundary

The target of the evaluation in this study was a pair of bagasse washi jeans (0.750 kg). The impact category is climate change. IDEA Ver. 3.3.0 [45] was used for GHG emissions intensity. Process data were obtained through interviews and on-site surveys at mills and other facilities. Figure 1 shows the entire life cycle flow of bagasse washi jeans.
After the sugarcane is harvested in Okinawa Prefecture, it is extracted to obtain cane juice and bagasse. The bagasse was milled into a powder called bagasse powder. It was mixed with Manila hemp pulp at a paper mill in Gifu Prefecture to produce bagasse washi. It was then slit and twisted to produce bagasse washi yarn. Cotton yarn, on the other hand, is made by ginning cotton fiber from cotton flowers and twisting it. After dyeing the cotton yarn in Hiroshima Prefecture, it was woven into warp, and the bagasse washi yarn was woven into weft. After cutting and sewing, bagasse washi jeans are completed. After the jeans are purchased by consumers, they are worn and laundered repeatedly. At the end of their life, they are processed into biochar and applied to sugarcane fields. A comparison was made with 100% cotton jeans (dyeing method: conventional dyeing; disposal: incineration).

2.2. Data Collection

Since there is only one mill or facility for each process in the supply chain of bagasse washi jeans production, interviews and on-site surveys were conducted at each of them. Previous reports were cited for those for which primary data could not be obtained.

2.2.1. Sugarcane Cultivation

From interviews and reports (Department of Agriculture, Forestry and Fisheries, Okinawa Prefecture [46]), the 2020 sugarcane harvest in Okinawa Prefecture was 8.14 × 10⁵ t with 1.18 × 10⁴ t waste. Sugarcane cultivation uses 1.13 × 10³ t of pesticides, 4.80 × 10⁴ t of fertilizer, 1.81 × 10³ kL of diesel oil, and rainwater inputs. Table 1 shows the process data per kg of sugarcane cultivation. Primary data on diesel oil used by farm machinery were unavailable; therefore, they were calculated based on sugarcane cultivation on Miyako Island, Okinawa Prefecture, by Kikuchi et al. [47]. N2O emissions from composting inorganic nitrogen fertilizer and plowing crop residues into the soil were calculated based on a report (National Institute of Environmental Studies, Japan [48]). The resulting GHG emissions per kg of sugarcane were 1.37 × 10⁻¹ kg.

2.2.2. Bagasse and Bagasse Powder Production

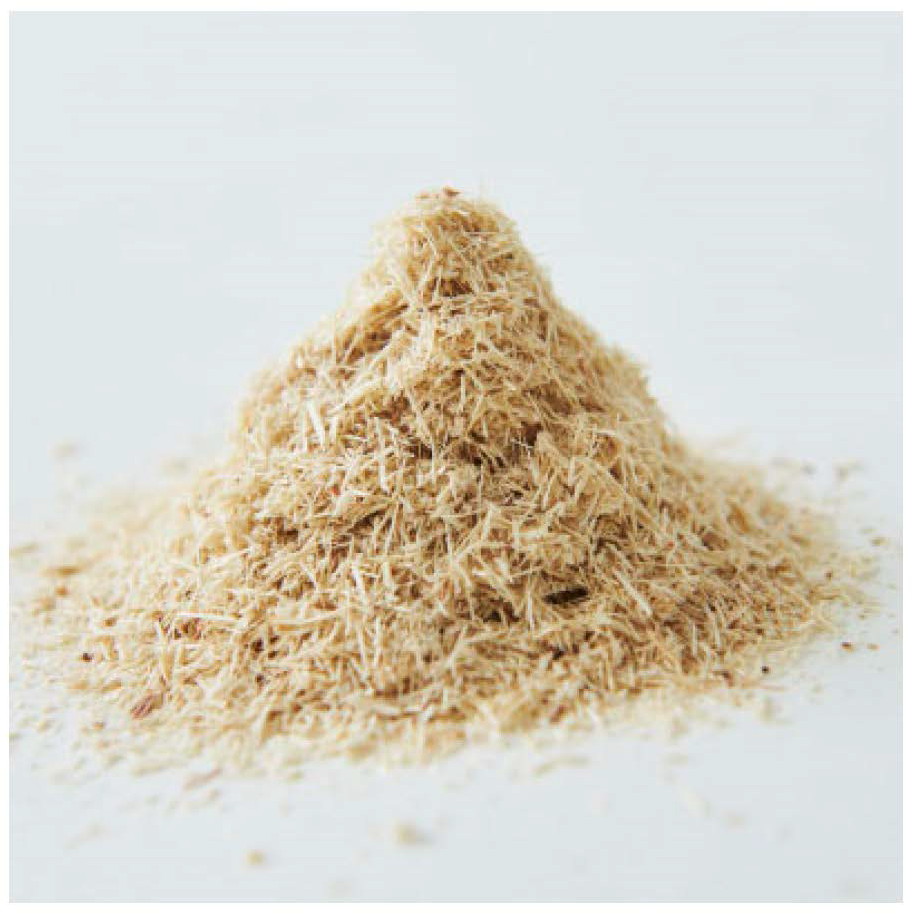
Figure 2 shows bagasse. Most bagasse is used as fuel for sugar mills, but some are used as compost, feed, and bedding for cattle barns. Process data for bagasse production were obtained from Company A’s brown sugar mill in Okinawa Prefecture from December 2020 to March 2021. These data included sugarcane extraction and sugar production processes. The inputs are sugarcane: 3.01 × 10⁴ t, electricity: 1.76 × 10⁵ kWh, heavy oil A: 3.41 × 101 kL, cooling water (circulation): 5.76 × 10⁵ t, outputs are bagasse: 6.87 × 10³ t, non-centrifugal sugar: 4.02 × 10³ t, filter cake: 7.93 × 10² t, trash: 3.66 × 10³ t, and wastewater: 1.47 × 10⁴ t. The components of the filter cake are organic matter from sugarcane and lime, most of which are used as compost. Trash, such as leaves and roots, is a component of sugarcane that is not used as raw material. The water contained in sugarcane was treated with wastewater. Based on the Agriculture & Livestock Industries Corporation [49] and interviews with sugar mills, GHG emissions from the sugar manufacturing process were allocated economically to 98.3% molasses sugar and 1.7% bagasse. The resulting GHG emissions per kg of bagasse produced was 1.09 × 10⁻² kg-CO2e. Filter cakes and trash were excluded from the allocation because they were free of charge.
Bagasse was then ground to powder using a mill at Company B in Okinawa Prefecture, Japan. This material is known as bagasse powder. The bagasse was considered to be 50% water (Hayakawa et al. [50]). The electricity consumption per kg of bagasse powder is 1.40 × 10⁻² kWh.

2.2.3. Bagasse Washi Yarn Production

(1)
Cultivation and Pulping of Manila Hemp
Manila hemp is grown in the Philippines, pulped, and exported to Japan. GHG emissions from plantation establishment to baling/storage were cited as 4.77 × 10⁻² kg-CO2e/kg-baled fiber [51]. Manila hemp was pulped using the kraft method [52]. Because primary pulping data were unavailable, GHG emissions were calculated based on the process data for the IDEA (141112200pGLO, kraft pulp, hardwood, bleached, GLO) [45]. The resulting GHG emissions per kg of Manila hemp pulp were 7.92 × 10⁻¹ kg-CO2e.
(2)
Paper Production
The main materials for bagasse washi are bagasse powder and Manila hemp pulp. Bagasse washi is produced at Company C in the Gifu Prefecture using machine-made washi production equipment. The production volume per unit was approximately 6.00 × 10² kg; in this interview, the volume was 6.05 × 10² kg. A total of 28.5% of material inputs were generated as waste. Table 2 shows the process data per kg of bagasse washi production. Liquefied petroleum as (LPG) is used as boiler fuel, and the steam generated is mainly used for drying. The resulting GHG emissions per kg of bagasse washi were 3.69 kg-CO2e.
In wastewater treatment, chemicals, sodium hydroxide, poly aluminum chloride, organic polymer coagulant, and sodium hypochlorite are used, and electricity is the only utility used.
(3)
Slitting and Twisting
Bagasse washi is slit and twisted at Company D in Hiroshima Prefecture. The utility of slitting was 2.42 × 10⁻¹ kWh/kg for slit bagasse washi, with a yield of 92.1%. Compared to spinning, twisting involves fewer processes. Additionally, the yarn produced has fewer twists. Because the primary data could not be obtained, the electricity consumption for spinning recycled felt (9.09 × 10⁻¹ kWh per kg of yarn) from the Ministry of Economy, Trade and Industry [53] was used instead, and the yield was assumed to be 100%. The resulting GHG emissions per kg of bagasse washi yarn were 4.85 kg-CO2e.

2.2.4. Cotton Yarn Production

Data for cotton fiber production were cited from Cotton Incorporated [29]. The global average (including the United States, India, China, and Australia) was 1.33 kg-CO2e per kg of cotton fiber. This includes N2O from fertilizer decomposition. The system boundary ranged from cotton cultivation to cotton ginning and transport. It is important to note that the warp is spinning only, while the weft is bleached after spinning. The process data for spinning and bleaching were obtained from Mistra Future Fashion [14]. The resulting GHG emissions per kg of cotton yarn were 2.57 kg-CO2e for warp and 5.61 kg-CO2e for weft.

2.2.5. Dyeing of Cotton Yarn

Company E primarily conducts indigo dyeing for jeans in Hiroshima Prefecture, with a monthly production volume of approximately 6.30 × 10⁴ kg. Only the warp yarn is dyed for the denim fabric, while the weft’s bagasse washi yarn is not dyed. Compared with other dyeing methods, vat dyeing is characterized by a short dyeing time at room temperature. There are two dyeing methods: rope dyeing and slasher dyeing. Rope dyeing is less prone to color irregularities and has a superior dye fastness. Company E uses rope dyeing, which involves warping, washing, rope dyeing, washing, drying, separating, gluing, and winding onto a weaving beam. In slasher dyeing, there is no separating.
There are two differences between conventional dyeing and improved dyeing. The first is the use of electrolyzed water. In conventional dyeing, the yarn is washed with warm water and detergent before and after dyeing, and it is neutralized with acid after dyeing. However, in improved dyeing, the yarn is washed with alkaline electrolyzed water before dyeing and acidic electrolyzed water after dyeing, eliminating the need for warm water, detergent, and acid. The second is the introduction of six once-through boilers (2 t) with better handling capabilities. These replaced the three previously used furnace-tube smoke-tube boilers (6 t), making it easier to manage start-up and shut-down operations. Consequently, energy losses were reduced, and the monthly consumption of heavy oil A was reduced from 200 kL to 100 kL.
Table 3 shows the process data of improved dyeing per kg of cotton yarn. Steam was used to heat the dye solution to 25–27 °C, dissolve the glue in winter, and dry the yarn in cylinders after dyeing or gluing. The GHG emissions from indigo dye production were cited by Fidan et al. [40]. Therefore, GHG emissions per kg of dyed cotton yarn were 8.99 kg-CO2e.

2.2.6. Weaving

Weaving was performed by Company F in Hiroshima Prefecture. The bagasse washi denim fabric was composed of 56% cotton and 44% bagasse washi yarn, with a warp of 984 dtex indigo-dyed yarn (dyed from unbleached cotton yarn) and a weft of 537 dtex bagasse washi yarn. The fabric structure is a twill weave, and its mass per unit area is 491 g/m2. For the 100% cotton denim fabric for comparison, a warp uses unbleached cotton yarn, and a weft uses bleached cotton yarn. The utility was electricity only, at 1.21 kWh per kg of bagasse washi denim fabric. The yield was 98.7%, citing Mistra Future Fashion [14]. Cotton yarn for a warp is glued after dyeing and shipped, so it is not glued before weaving.

2.2.7. Fabric Finishing

Fabric finishing was performed by an affiliate of Company F in Hiroshima Prefecture. This process comprises singing, washing, skewing (skew processing), drying, shrinkage prevention (sanforizing), and drying. Table 4 shows the finishing process data per kg of bagasse washi denim fabric. Steam is used for drying processes, such as cylinder dryers and palmers, while LPG is used as fuel for burning the fluff and ping (skewing and sanforizing) of fabric surfaces.

2.2.8. Cutting and Sewing

Cutting and sewing were performed at Company G in Hiroshima Prefecture. A person cuts with scissors, and the waste from cutting to sewing is 20%. Bagasse washi jeans had a mass of 0.750 kg per pair of jeans, with the following mass percentages: bagasse washi jeans parts 95%, pocket fabric 1.5%, buttons 2%, rivets 1%, sewing yarn 0.01%, care label 0.04%, and leather patches 0.45%. The buttons and rivets were made of a copper–zinc alloy. Electricity consumption for utility includes sewing machines, spreading machines, irons, and needle inspectors. It takes 2.70 kWh of electricity to produce one pair of jeans. The relatively large amount of electricity is thought to be due to the use of sewing machines for thicker fabrics, such as denim, and the amount of standby electricity used by the irons.

2.2.9. Transportation

We considered each transportation route within the system boundary shown in Figure 1. The transportation from raw material procurement to jeans production and delivery to the shop uses ships and trucks. Although the routes for collecting production waste and used jeans from each mill are not established, we assumed they would be transported to Okinawa Prefecture using ships and trucks in the same manner. For product purchases, consumers either visit the shop in Okinawa Prefecture or use online shopping, with respective proportions of 38% and 62%. For the former, we excluded consumer trips to the shop from the system boundary as they are likely to coincide with personal travel. For the latter, we assumed that products are shipped from the shop in Okinawa Prefecture to Tokyo, the main consumption area, using airplanes and trucks. The distances for these routes were calculated using the NX-GREEN Calculator [54] and Google Maps [55]. Truck transportation distances of 30 km or less were cut off.

2.2.10. Sales

Bagasse washi jeans are sold at a shop in Urasoe City, Okinawa Prefecture, and through online shopping. The shop also serves as a warehouse. The company’s products include bagasse washi jeans, kariyushi wear, T-shirts, and hats. The utility is mainly electricity, with a monthly consumption of 1.13 × 10² kWh. This was allocated by store floor space, hours of operation, and sales amount to calculate GHG emissions from electricity.

2.2.11. Laundry

The bagasse washi jeans were laundered in a drum-type laundering machine and naturally dried. The GHG emissions per kg of laundry were cited as 9.33 × 10⁻² kg-CO2e reported by Yamaguchi et al. [56]. The laundry cycles per lifetime were cited by Fidan et al. [44] as 45.5 cycles. In that study, laundry cycles were calculated based on the lifetime of jeans, the number of times they were worn, and the frequency of laundry.

2.2.12. Biochar Processing

Biochar is a solid product obtained by pyrolyzing biomass at temperatures above 350 °C under controlled oxygen concentrations to prevent complete combustion (Ministry of Agriculture, Forestry, and Fisheries [57]). Feedstocks for biochar include cotton stalk (Lehmann et al. [58,59]), food and wood waste (Gupta et al. [60]), agricultural waste (Mohammadi et al. [61]), and wastewater sludge (Li et al. [62]). However, no case of processing used clothing into biochar has been reported.
The used jeans and their production waste are collected and processed into biochar in a charcoal-making furnace in Okinawa Prefecture. Charcoal-making furnaces do not use electricity or fossil fuels. Through biochar processing, the amount of sequestered carbon was calculated as follows: according to Lehmann et al. [63], the yield of processing used jeans and their production waste into biochar was 30.6% and the carbon sequestration rate of the biochar was 75.7%. The carbon remaining in the biochar after 100 years was assumed to be 89% (National Institute for Environmental Studies, Japan [64]). The carbon sequestration of used bagasse washi jeans and their production waste was 9.01 × 10⁻¹ kg/pair of jeans.

3. Results

First, the GHG emissions from jeans production were calculated and compared with those in previous reports. Next, GHG emissions for the entire life cycle, including transportation, sales, laundry, and disposal, were calculated and compared between bagasse washi jeans and 100% cotton jeans.

3.1. Calculation of GHG Emissions up to Bagasse Washi Jeans Production

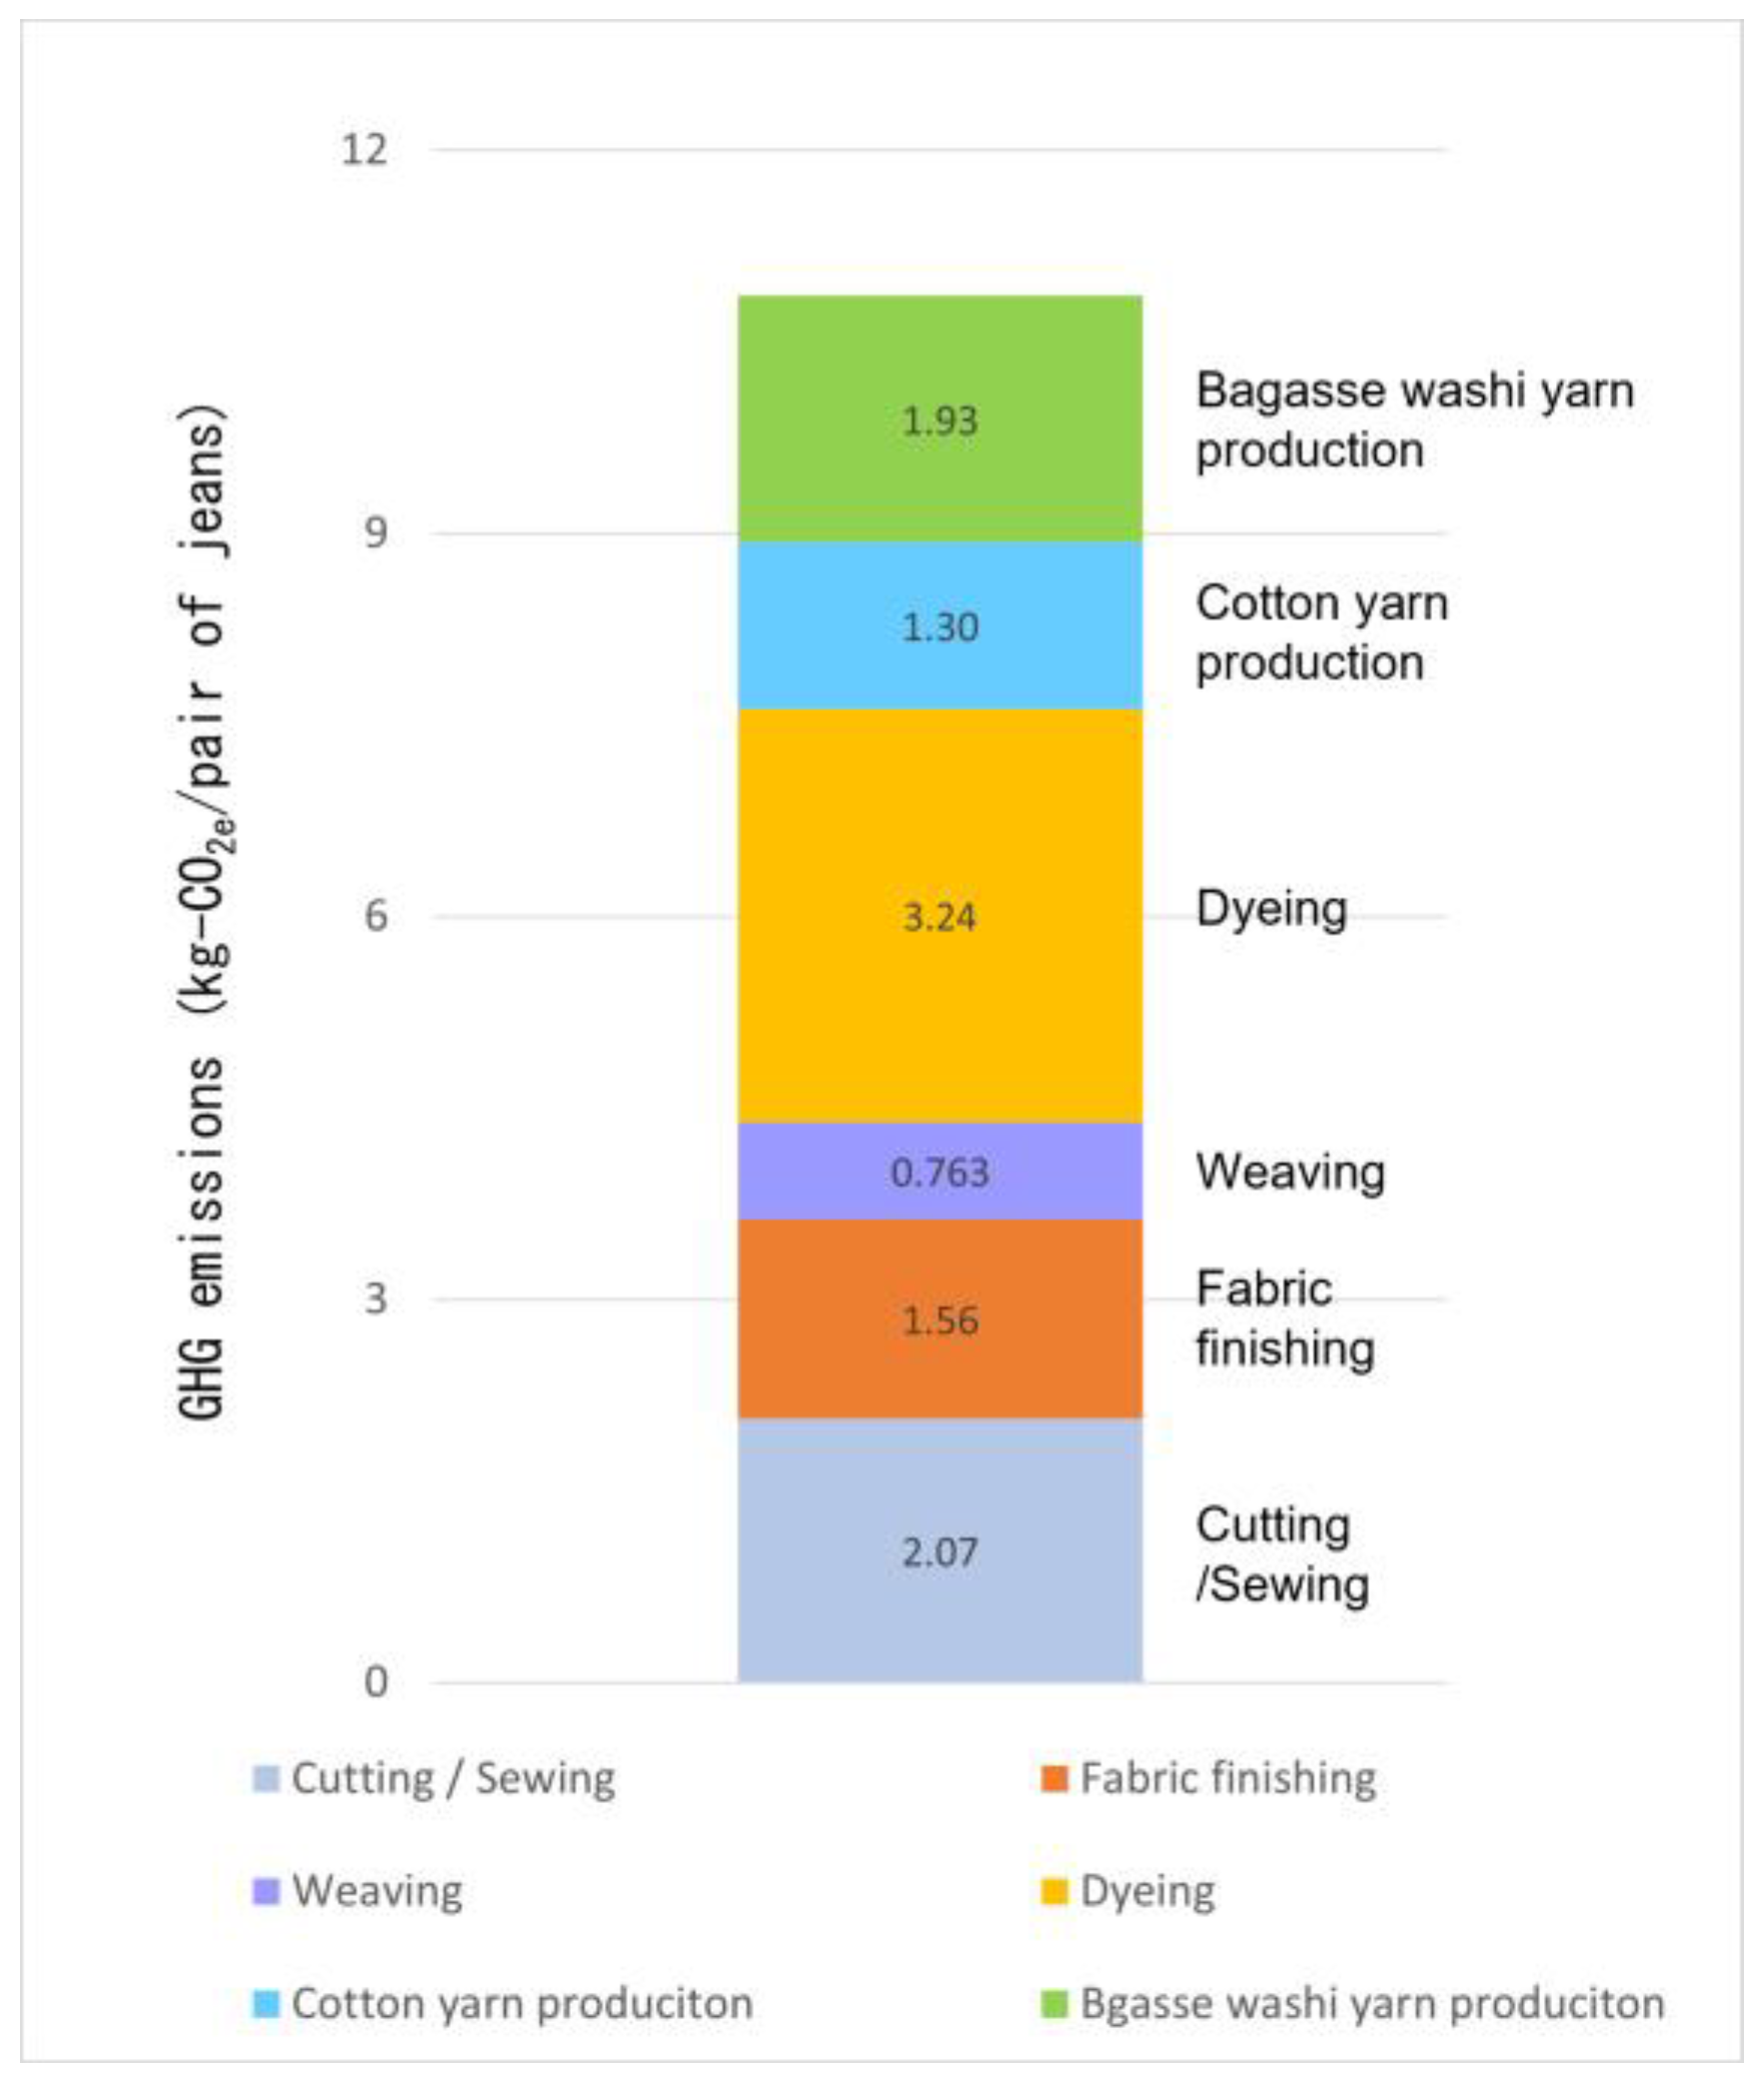
The GHG emissions from raw materials to the production of bagasse washi jeans amounted to 1.09 × 101 kg-CO2e (Figure 3). The dyeing process accounted for the highest percentage (approximately 30%), which was similar to the study in Mistra Future Fashion [14] (Table 5). Company E dyes a large variety of products in small lots, which may be related to its low production volume, low energy efficiency, and rope dyeing. The reduction in GHG emissions by using electrolyzed water instead of detergent and acid was found to be minimal.
The GHG emissions for 1 kg of unbleached cotton yarn production were 2.57 kg-CO2e, while the GHG emissions for 1 kg of bagasse washi yarn production were 4.85 kg-CO2e. This is because Company C produces specialty papers, such as sanitary paper, which has low production efficiency per lot and does not re-input waste from the papermaking process.
As shown in Table 5, previous reports indicate a GHG emissions range of 5.53 to 90.2 kg-CO2e per pair of jeans produced. The results of this study are close to the median. The minimum value of 5.53 kg-CO2e is reported by Fidan et al. [44] for the case in Turkey. The production data include mill interviews, literature, and Ecoinvent [16], but the factors contributing to the low GHG emissions are not stated. In contrast, Luo et al. [43] reported the largest GHG emissions. The reasons for the significant GHG emissions of 90.2 kg-CO2e include the high use of steam in processes other than spinning, the fact that the production method is not new, and the use of coal as a fuel for production in China. Another factor is that the jeans evaluated by Luo et al. [43] underwent denim washing, and those jeans weigh 1 kg per pair of jeans, which is heavier compared to others.
Next, the percentage of GHG emissions by process was compared with those in previous reports. The level of data disclosure varied across the reports, and reports with precise details were limited. Comparing the available reports on the percentage per process, it was found that 47.3 to 83.3% of the GHG emissions were accounted for up to the fabric production. In this study, the GHG emissions up to fabric production were 80.9%, similar to a previous report. On the other hand, Morita et al. [25] showed the highest percentage of jeans production (cutting/sewing/finishing). This factor is attributed to the thermal energy derived from natural gas (19.7 MJ per pair of jeans) and the electricity consumption (5.36 kWh per pair of jeans) during the production of the jeans. Additionally, the percentage for jeans production reported by Luo et al. [43] was 43.1% because it included denim washing, which was the second-largest process in jeans production. Focusing on the dyeing process, conventional dyeing accounted for 43.2%, improved dyeing for 29.8%, and Mistra Future Fashion [14] for 32.5%. The Mistra Future Fashion [14] dyeing report used higher numbers and quantities of chemicals for dyeing than this study.

3.2. Calculation of GHG Emissions over the Entire Life Cycle

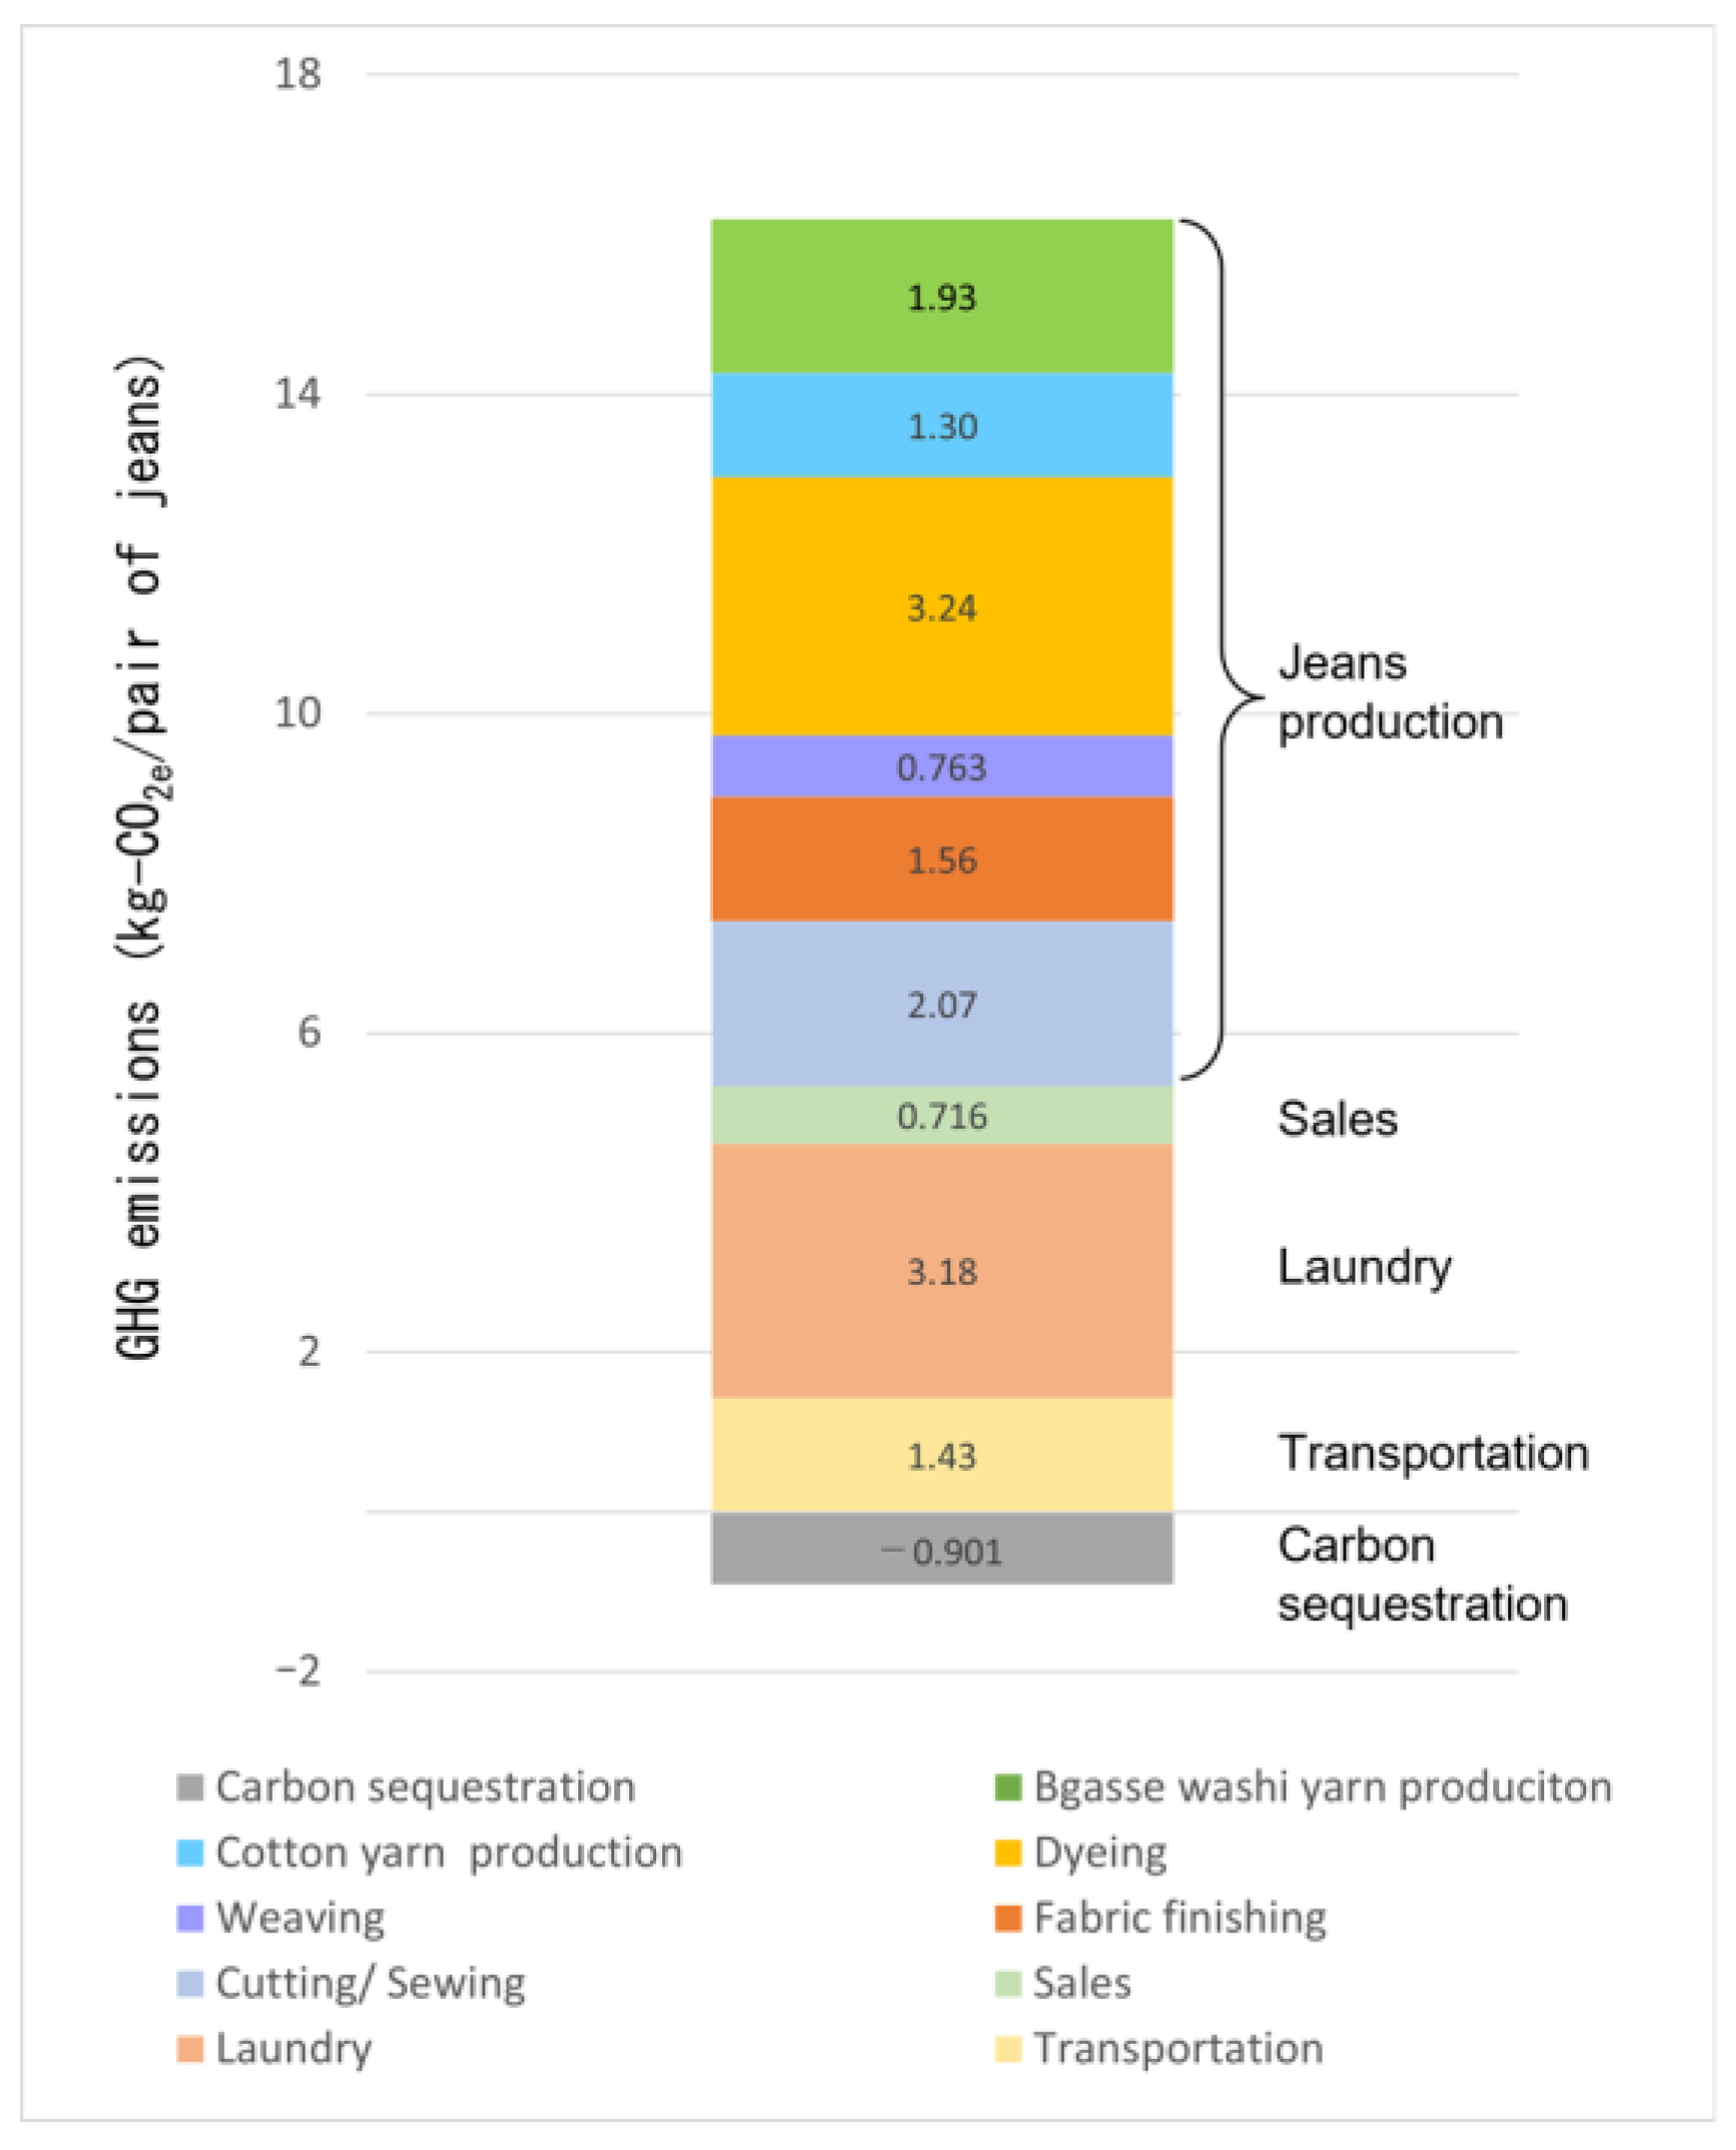
GHG emissions over the entire life cycle of bagasse washi jeans, from raw materials to production, sales, transportation, laundry, and disposal were 1.53 × 101 kg-CO2e. Dyeing accounted for the highest percentage, followed by laundry, cutting/sewing, and bagasse washi yarn production (Figure 4). The proportion of transportation accounted for 9.4% of the total. However, since approximately 70% of this is due to air transportation for online shopping, the transportation method is important. The disposal process can reduce GHG emissions by 9.01 × 10⁻¹ kg by processing used jeans and their production waste into biochar, as described in Section 2.2.12. The result of 45.5 laundry cycles (Fidan et al. [44]) accounted for approximately 22% of the entire life cycle.
Table 6 compares this study to that of Fidan et al. [44]. Both studies report 45.5 laundry cycles over the entire life cycle. Additionally, both studies assume natural drying after laundry. In scenario S2 of Fidan et al. [44], it is assumed that 50% of Turkish consumers launder their clothing at 40 °C, while the remaining 50% launder at 60 °C. Since it is not customary to use hot water for laundering in Japan, the proportion of GHG emissions from laundering in this study is lower than that in Fidan et al. [44]. The laundry cycles over the life cycle of jeans have a wide range because they are affected by the frequency of launders by consumers and their lifetime. In previous reports on the laundry cycles of jeans, Mistra Future Fashion [14] set it at 10, Zamani et al. [65] and Levänen et al. [66] at 20, Luo et al. [43] at 52, and Hedman [15] at 200. For example, in Mistra Future Fashion [14] in Sweden, jeans are laundered once every 24 times. Because they are worn 240 times before disposal, this results in 10 laundry cycles.

4. Discussion

4.1. Comparison of Bagasse Washi Jeans and Conventional Jeans (100% Cotton)

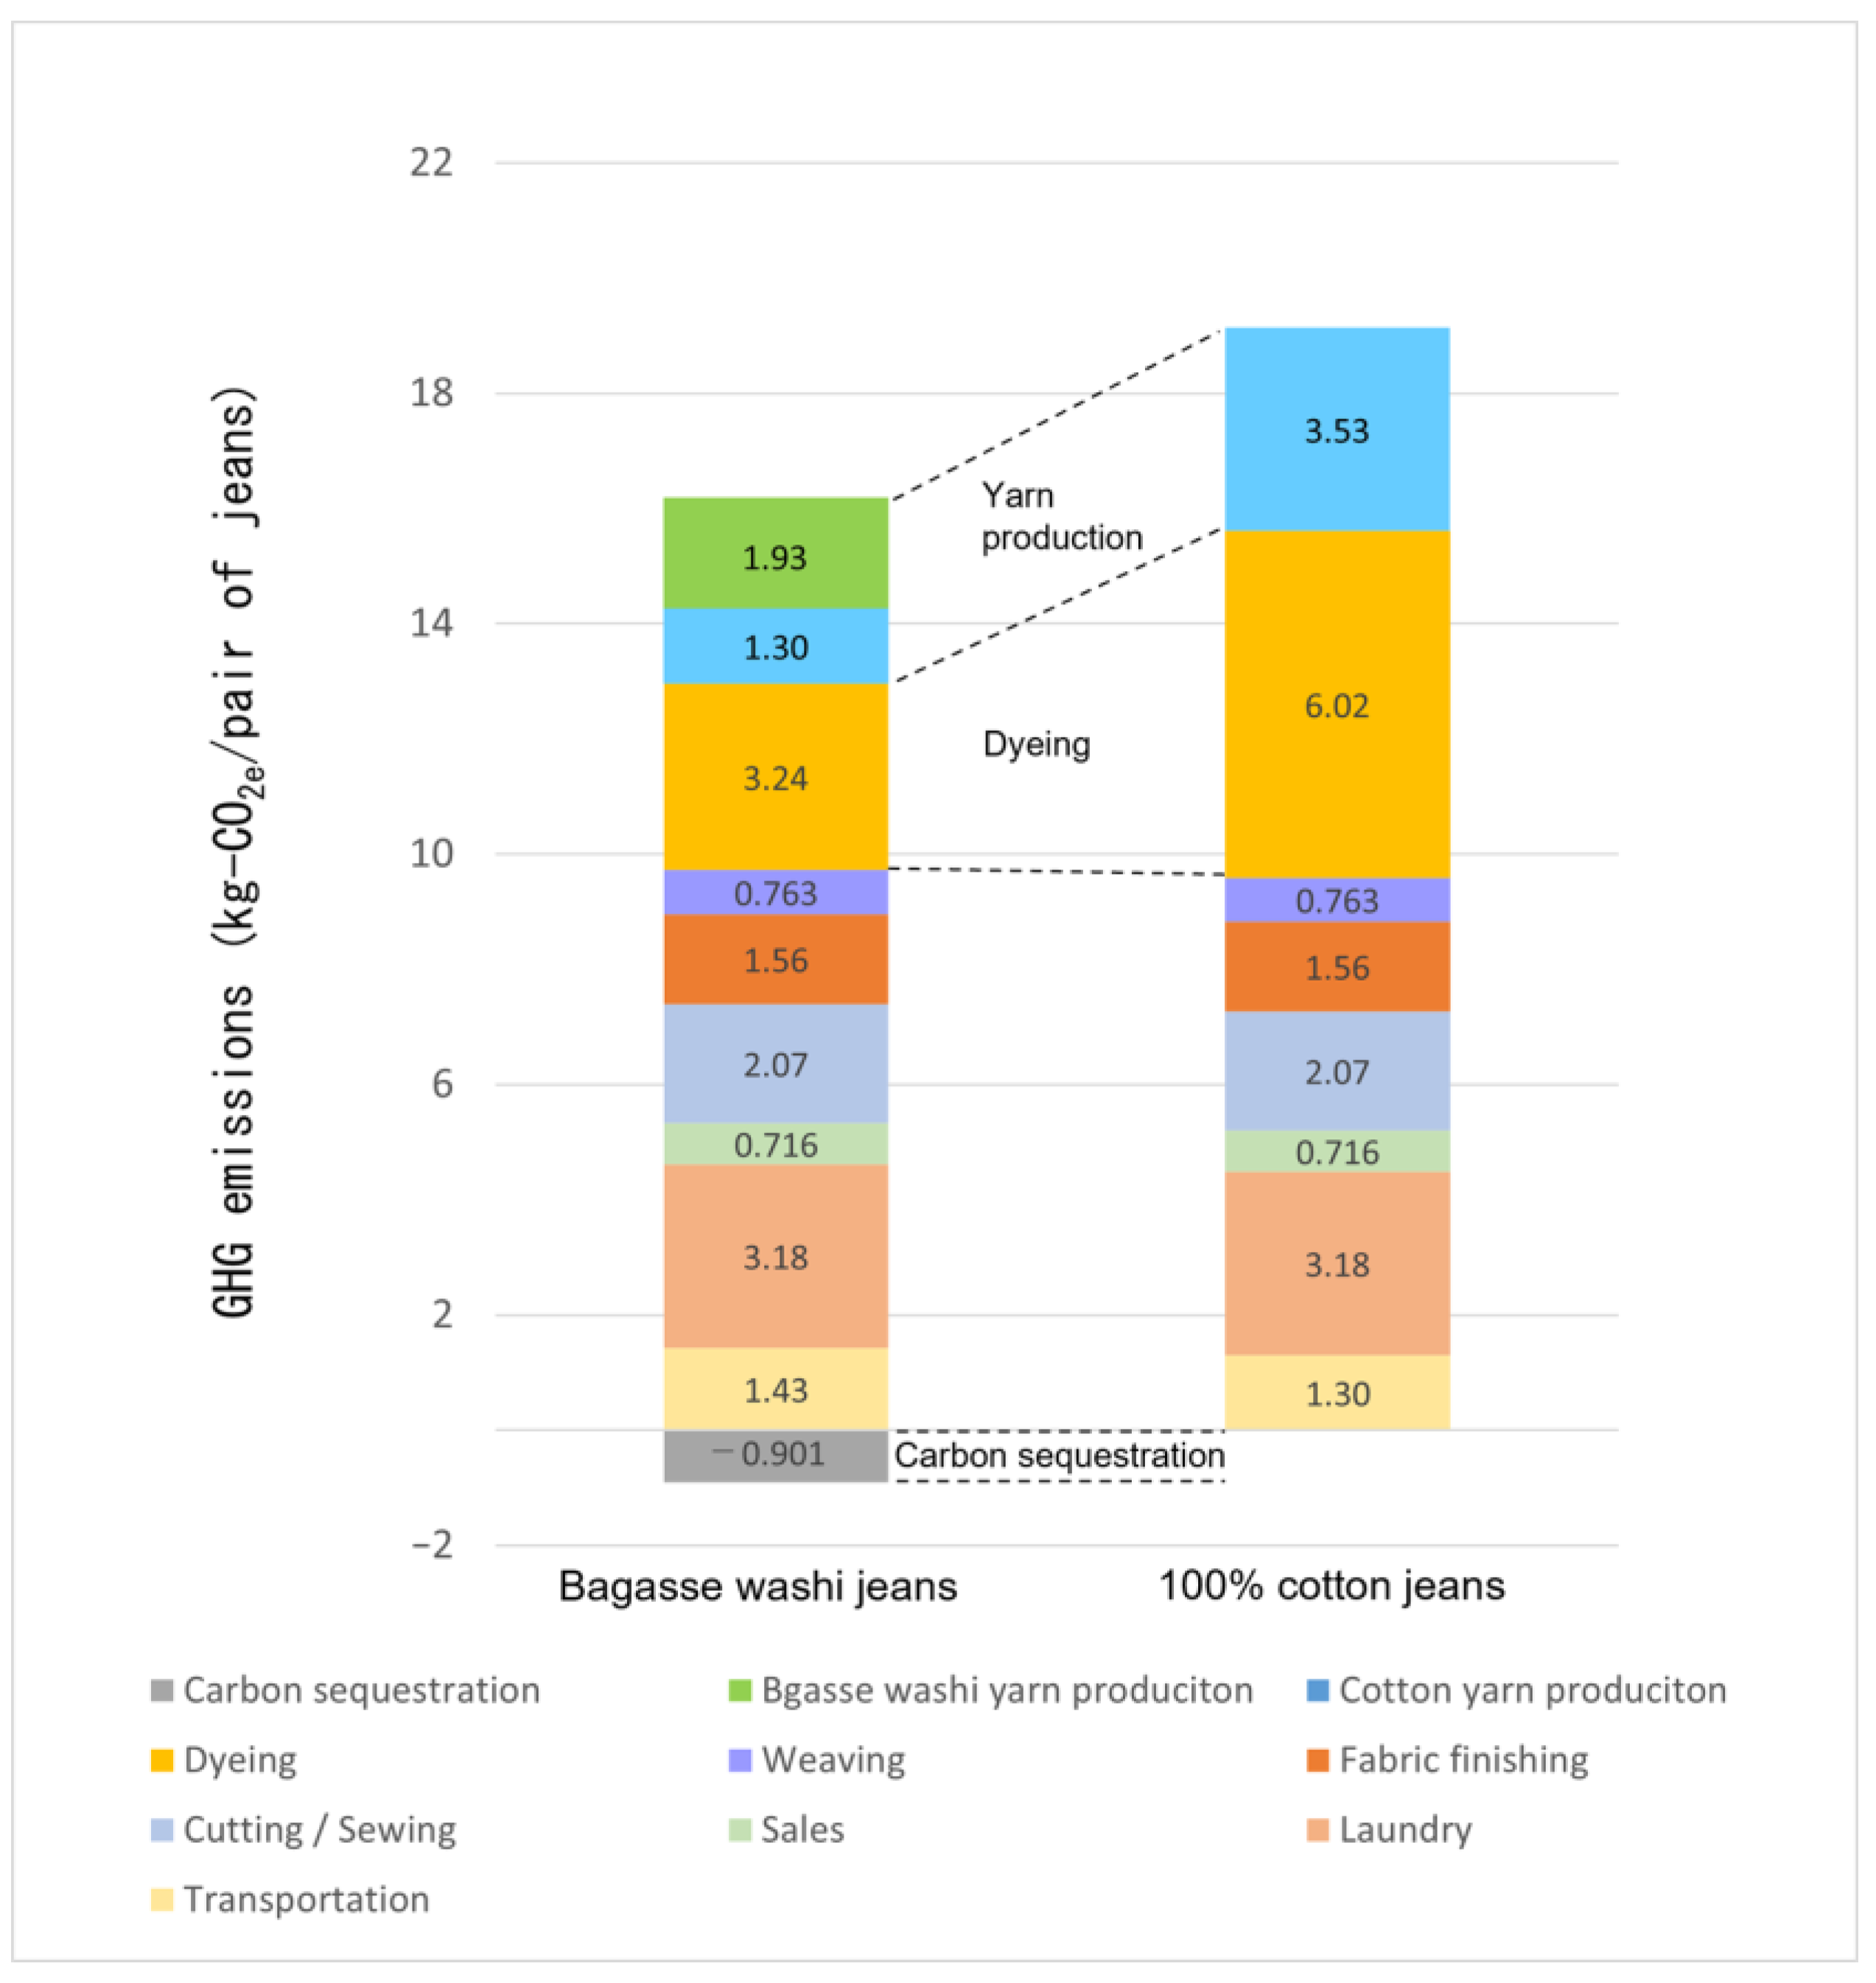
We compared the total GHG emissions over the entire lifecycle of bagasse washi jeans and 100% cotton jeans (Figure 5). The differences lie in yarn production, dyeing, transportation, and disposal. In yarn production, using bagasse washi yarn reduced emissions by −2.99 × 10⁻¹ kg-CO2e. This is because the GHG emissions for producing 1 kg of washi yarn, unbleached cotton yarn, and bleached cotton yarn, respectively, are 4.85 kg-CO2e, 2.57 kg-CO2e, and 5.61 kg-CO2e, and 100% cotton jeans use bleached cotton yarn for the weft instead of washi yarn. In dyeing, primarily due to the introduction of small boilers, which reduced the use of heavy oil A, GHG emissions were reduced by 2.78 kg-CO2e. On the other hand, in transportation, the GHG emissions for bagasse washi jeans were 1.29 × 10⁻¹ kg-CO2e larger. This is due to the collection of both production waste and used jeans. In disposal, by processing the production waste and used jeans into biochar, GHG emissions were reduced by −9.01 × 10⁻¹ kg-CO2e. Previous reports on disposal indicate that Mistra Future Fashion [14] reported that the incineration process emitted 1.2 × 10⁻² kg-CO2e. Sohn et al. [42] found that disposal emits 1.1 × 10⁻¹ kg-CO2e on average in four countries (Germany, Poland, Sweden, and the US). LEVI STRAUSS & CO. [13] states that 9 × 10⁻¹ kg-CO2e is emitted at disposal. On the other hand, Fidan et al. [44] reported −1.25 × 10⁻¹ kg-CO2e at the end of life because they assumed that 70% of jeans would move to a landfill and the remaining 30% would be burned for energy recovery. Additionally, Luo et al. [43] state −8.2 × 10⁻¹ kg-CO2e because heat is recovered, and electricity is generated during disposal. Compared to these, carbon sequestration by biochar processing was found to be the most effective in reducing GHG emissions. Over the entire lifecycle, the three effects of bagasse as raw material, improved dyeing, and carbon sequestration in the disposal were combined to reduce 3.85 kg-CO2e.

4.2. Sensitivity Analysis

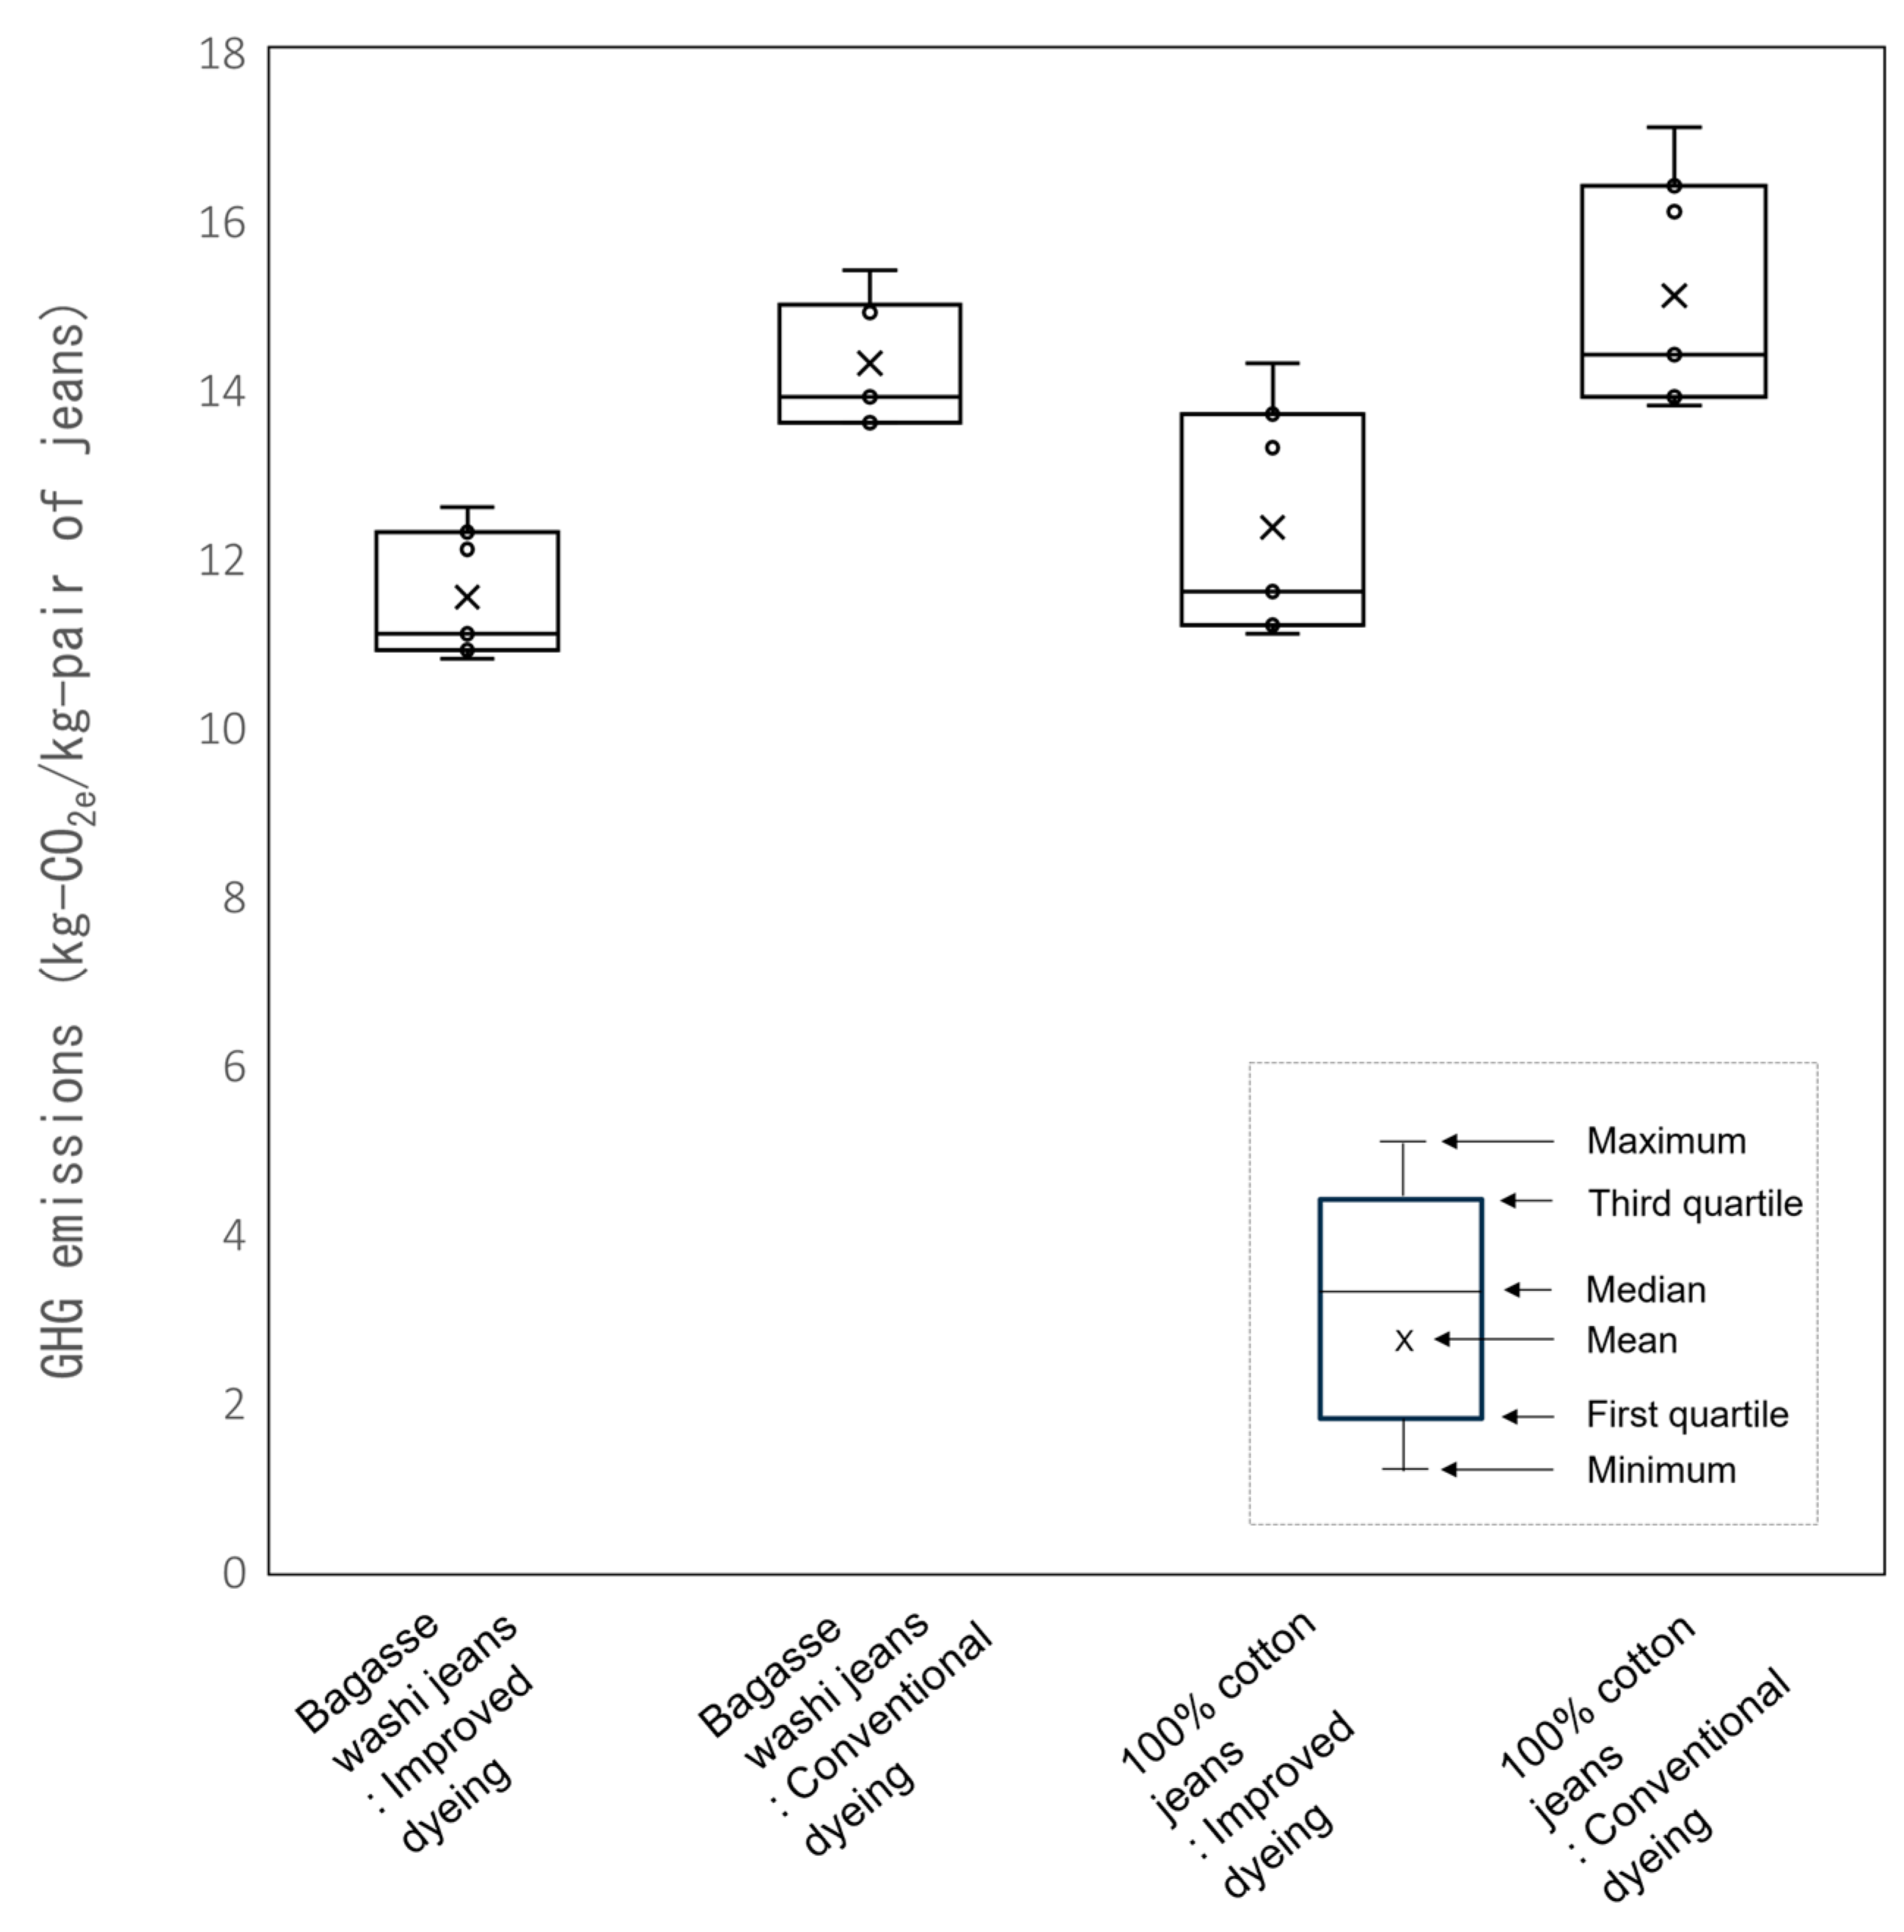
Many studies have been published on GHG emissions from cotton cultivation (Table 7). However, only a few studies include ginning, where cotton fiber and seeds are separated after harvest. The GHG emissions from cotton fiber production up to ginning ranged from 1.24 to 4.43 kg-CO2e/kg-fiber. Among these, Cotton Incorporated [29] covers the major cotton-growing regions of the world (US, China, India, and Australia) and has been cited numerous times; therefore, in this study, Cotton Incorporated [29]’s 1.33 kg-CO2e/kg-fiber was used. This was mainly composed of 35% N2O from fertilizer decomposition, 27% from fertilizer production, and 14% from ginning. Figure 6 shows the change in GHG emissions from jeans production when the GHG emissions from cotton cultivation in Table 7 are applied. Compared to bagasse washi jeans, the range of the boxplots was larger for 100% cotton jeans because of the higher percentage of cotton fiber used and the use of bleached cotton yarn in the weft. When the GHG emissions from cotton fiber production varied, the overall change in GHG emissions from bagasse washi jeans ranged from 1.80 to 3.20 kg-CO2e. This was found to be similar to the change in GHG emissions with the choice of dyeing method (approximately 2.8 kg-CO2e: see Figure 5).
The entire lifecycle of GHG emissions from bagasse washi jeans, including transport, sales, laundry, and disposal, were 1.53 × 101 kg-CO2e, of which laundry during the use phase (45.5 cycles) accounted for approximately 21%. Laundry cycles in the lifetime of this study were evaluated at 45.5, but if we assume 10 cycles, as in Mistra Future Fashion [14], the GHG emissions would be 1.28 × 101 kg-CO2e. If we assume 200 cycles, as in Hedman [15], the GHG emissions would be 2.61 × 101 kg-CO2e/pair of jeans. In the latter case, GHG emissions are approximately 1.7 times the GHG emissions over the entire life cycle. Therefore, it is important to determine consumer behavior more accurately, such as launder frequency and lifetime.

4.3. Potential to Reduce GHG Emissions

The first is the papermaking process. In this study, 3.74 kg-CO2e was emitted per kg of bagasse washi. Previously, unbleached packaging paper was reported to have GHG emissions of 1.37 kg-CO2e/kg (Japan Paper Association, LCA Subcommittee [67]), and a review paper by Sun et al. [68] reported a quartile range of GHG emissions of 0.516 to 1.30 kg-CO2e for wood-based or recycled-based paper production.The following factors were considered responsible for this: the production lot is small (approximately 600 kg), and the waste rate is 28.5%, and the production efficiency is not high because the manufacturing company produces specialty papers, such as sanitary paper. GHG emissions can be reduced by re-inputting waste from the papermaking process, achieving mass-production effects, and using natural gas or renewable energy for utilities. Additionally, because primary data were unavailable for this pulping process, the kraft pulp process from IDEA [45] was used. Compared to wood used as raw materials for pulp, non-wood materials such as Manila hemp require less energy and fewer chemicals for cooking (UNEP [69]). Therefore, the GHG emissions from the pulping process may be smaller.
The second is the dyeing process. The dyeing process uses heavy oil A as the fuel for the boiler, accounting for 56.5% of the GHG emissions from the improved dyeing process. GHG emission reductions of 21.5% can be achieved by using liquefied natural gas instead of heavy oil A.

5. Limitations of This Study

In this study, LCA was conducted in Japan. Curelabo Co., Ltd. [8]’s annual production of jeans is small, at approximately 110 jeans per year. Secondary data were used for processes where primary data were unavailable, such as the spinning and bleaching processes. Setting the lifetime and laundry cycles is difficult because some consumers enjoy the process of jeans deteriorating. The collection route for waste generated in the production process and used jeans was not established; therefore, it was assumed.

6. Conclusions and Future Research Perspectives

This study performed an LCA on a circular economy model of jeans made of bagasse and compared it with conventional 100% cotton jeans. The results showed that the GHG emissions per pair of bagasse washi jeans production were 1.09 × 101 kg-CO2e and 1.53 × 101 kg-CO2e including transportation, sales, laundry, and disposal. First, the use of bagasse washi yarn in the weft of bagasse washi denim fabric resulted in reductions of 2.99 × 10⁻¹ kg-CO2e compared to the use of conventional 100% bleached cotton yarn. Second, compared with conventional dyeing, improved dyeing reduced GHG emissions by 2.78 kg-CO2e per pair of jeans by eliminating the use of detergents and acids and reducing the use of heavy oil A by introducing a small boiler. Third, the disposal of used jeans and their production waste into biochar reduced GHG emissions by 9.01 × 10⁻¹ kg-CO2e. Although transportation increases emissions by 1.29 × 10⁻¹ kg-CO2e, it was found that the entire lifecycle can reduce emissions by 3.85 kg-CO2e per pair of jeans. Additionally, dyeing, bleaching, and fabric finishing, collectively known as the wet process, were found to contribute a large proportion of GHG emissions due to their high energy consumption. In the future, we are considering conducting an LCA in scenarios where cotton yarn is replaced with recycled cotton yarn.
While the mass production and disposal of clothing is a global problem, Curelabo Co., Ltd. [8] produces clothing in a coordinated manner to avoid inventory disposal. The company also offers repair services. Considering the rising labor costs and production risks in Asia, it is essential to assess the environmental impact of clothing production, particularly within the Japanese domestic supply chain. This study assessed GHG emissions, which are among the most pressing global environmental issues. However, considering the high potential for reducing the environmental impact of water consumption and wastewater in the dyeing process, as well as reducing land use by decreasing cotton fiber consumption, it is expected that future analysis will be conducted from a comprehensive perspective.

Supplementary Materials

The following supporting information can be downloaded at: https://www.mdpi.com/article/10.3390/su16146044/s1, Table S1. Wastewater treatment process data (during bagasse washi production)., Table S2. Slitting bagasse washi process data., Table S3. Bagasse washi yarn production process data., Table S4. Cotton yarn spinning process data., Table S5. Cotton yarn bleaching process data., Table S6. Bagasse washi denim fabric weaving process data., Table S7. Cutting process data., Table S8. Bagasse washi jeans production process data., Table S9. Comparison of the life cycle of bagasse washi jeans and conventional 100% cotton jeans., Table S10. List of companies providing data on the production of bagasse washi jeans., Table S11. Utilities of fossil resources.

Author Contributions

Conceptualization, T.S., R.F. and N.I.; investigation, T.S. and N.I.; writing—original draft preparation, T.S. and N.I.; writing—review and editing, T.S., R.F. and N.I.; funding acquisition, T.S. All authors have read and agreed to the published version of the manuscript.

Funding

This research was funded by the Nippon Life Insurance Foundation (Research Grant 2023, Research topic: Life Cycle Assessment of Clothing.), grant number 12.

Data Availability Statement

The original contributions presented in the study are included in the article/Supplementary Materials, further inquiries can be directed to the corresponding author/s.

Conflicts of Interest

The authors declare no conflicts of interest. This research was funded by the Nippon Life Insurance Foundation (Research Grant 2023, Research topic: Life Cycle Assessment Evaluation of Clothing), grant number 12. The funders had no role in the design of the study; in the collection, analyses, or interpretation of data; in the writing of the manuscript; or in the decision to publish the results.

References

  1. Ellen MacArthur Foundation. A New Textiles Economy: Redesigning Fashion’s Future; Ellen MacArthur Foundation: Cowes, UK, 2017. [Google Scholar]
  2. The Japan Textiles Importers Association. Japan’s Apparel Market and Imports; The Japan Textiles Importers Association: Osaka City, Japan, 2021. [Google Scholar]
  3. Sun, X.; Wang, X.; Sun, F.; Tian, M.; Qu, L.; Perry, P.; Owens, H.; Liu, X. Textile Waste Fiber Regeneration via a Green Chemistry Approach: A Molecular Strategy for Sustainable Fashion. Adv. Mater. 2021, 33, 2105174. [Google Scholar] [CrossRef] [PubMed]
  4. Ministry of the Environment. FY 2020 Survey on Fashion and the Environment—Results of the “Fashion and the Environment” Survey; Ministry of the Environment: Tokyo, Japan, 2020.
  5. Global Fashion Agenda. Fashion on Climate; Global Fashion Agenda: København, Denmark, 2020. [Google Scholar]
  6. H&M Group. Available online: https://hmgroup.com/sustainability/circularity-and-climate/circularity/ (accessed on 1 May 2024).
  7. Patagonia Inc. Available online: https://www.patagonia.jp/stories/our-quest-for-circularity/story-96496.html (accessed on 1 May 2024).
  8. Curelabo Co. Ltd. Available online: https://curelabo.co.jp/ (accessed on 1 May 2024).
  9. ISO 14040; Environmental Management-Life Cycle Assessment-Principles and Framework. 2nd ed, International Standard Organisation: Geneva, Switzerland, 2006.
  10. ISO 14044; Environmental Management-Life Cycle Assessment-Requirements and Guidelines. 1st ed, International Standard Organisation: Geneva, Switzerland, 2006.
  11. Baydar, G.; Ciliz, N.; Mammadov, A. Life cycle assessment of cotton textile products in Turkey. Resour. Conserv. Recycl. 2015, 104, 213–223. [Google Scholar] [CrossRef]
  12. Zhang, Y.; Liu, X.; Xiao, R.; Yuan, Z. Life cycle assessment of cotton T-shirts in China. Int. J. Life Cycle Assess. 2015, 20, 994–1004. [Google Scholar] [CrossRef]
  13. Levi Strauss & Co. The Life Cycle of a Jean. 2015. Available online: https://levistrauss.com/wp-content/uploads/2015/03/Full-LCA-Results-Deck-FINAL.pdf (accessed on 1 May 2024).
  14. Mistra Future Fashion. Environmental Assessment of Swedish Clothing Consumption—Six Garments, Sustainable Futures. 2019. Available online: https://core.ac.uk/download/pdf/270109142.pdf (accessed on 1 May 2024).
  15. Hedman, A.E. Comparative Life Cycle Assessment of Jeans: A Case Study Performed at Nudie Jeans; Bachelor, KTH Royal Institute of Technology: Stockholm, Sweden, 2018. [Google Scholar]
  16. Ecoinvent. Available online: https://ecoinvent.org/ (accessed on 1 May 2024).
  17. Cotton Incorporated. Monthly Economic Letter-Cotton Market Fundamentals & Price Outlook JULY 2022; Cotton Incorporated: Cary, NC, USA, 2022. [Google Scholar]
  18. Liu, Y.; Huang, H.; Zhu, L.; Zhang, C.; Ren, F.; Liu, Z. Could the recycled yarns substitute for the virgin cotton yarns: A comparative LCA. Int. J. Life Cycle Assess. 2020, 25, 2050–2062. [Google Scholar] [CrossRef]
  19. van der Velden, N.M.; Patel, M.K.; Vogtländer, J.G. LCA benchmarking study on textiles made of cotton, polyester, nylon, acryl, or elastane. Int. J. Life Cycle Assess. 2014, 19, 331–356. [Google Scholar] [CrossRef]
  20. Günther, J.; Thevs, N.; Gusovius, H.; Sigmund, I.; Brückner, T.; Beckmann, V.; Abdusalik, N. Carbon and phosphorus footprint of the cotton production in Xinjiang, China, in comparison to an alternative fibre (Apocynum) from Central Asia. J. Clean. Prod. 2017, 148, 490–497. [Google Scholar] [CrossRef]
  21. Thinkstep. Life Cycle Assessment of Cotton Cultivation Systems—Better Cotton, Conventional Cotton and Organic Cotton. 2019. Available online: https://www.laudesfoundation.org/media/43anrffi/4332-environmentall-care-port-june19.pdf (accessed on 1 May 2024).
  22. Nalley, L.; Popp, M.; Niederman, Z.; Brye, K.; Matlock, M. How Potential Carbon Policies Could Affect Where and How Cotton Is Produced in the United States. Agric. Resour. Econ. Rev. 2012, 41, 215–231. [Google Scholar] [CrossRef]
  23. Khabbaz, B.G. Life Cycle Energy Use and Greenhouse Gas Emissions of Australian Cotton: Impact of Farming Systems. Master’s Thesis, University of Southern Queensland, Queensland, Australia, 2010. [Google Scholar]
  24. Visser, F.; Dargusch, P.; Smith, C.; Grace, P.R. Application of the Crop Carbon Progress Calculator in a ‘farm to ship’ cotton production case study in Australia. J. Clean. Prod. 2015, 103, 675–684. [Google Scholar] [CrossRef]
  25. Morita, A.M.; Moore CC, S.; Nogueira, A.R.; Kulay, L.; Ravagnani, M.A. Assessment of potential alternatives for improving environmental trouser jeans manufacturing performance in Brazil. J. Clean. Prod. 2020, 247, 119156. [Google Scholar] [CrossRef]
  26. Avadí, A.; Marcin, M.; Biard, Y.; Renou, A.; Gourlot, J.; Basset-Mens, C. Life cycle assessment of organic and conventional non-Bt cotton products from Mali. Int. J. Life Cycle Assess. 2020, 25, 678–697. [Google Scholar] [CrossRef]
  27. Aid by Trade Foundation. Life Cycle Assessment of Cotton Made in Africa. 2021. Available online: https://cottonmadeinafrica.org/wp-content/uploads/CmiA_LCA-Study_2021.pdf (accessed on 1 May 2024).
  28. Cotton Incorporated. Life Cycle Assessment of Cotton Fiber & Fabric Full Report. 2012. Available online: https://cottoncultivated.cottoninc.com/wp-content/uploads/2015/06/2012-LCA-Full-Report.pdf (accessed on 1 May 2024).
  29. Cotton Incorporated. Lca Update of Cotton Fiber and Fabric Life Cycle Inventory. 2017. Available online: https://resource.cottoninc.com/LCA/2016-LCA-Full-Report-Update.pdf (accessed on 1 May 2024).
  30. Textile Exchange. Life Cycle Assessment (LCA) of Organic Cotton-A Global Average; Textile Exchange: Lamesa, TX, USA, 2014. [Google Scholar]
  31. Munasinghe, P.; Druckman, A.; Dissanayake, D.G.K. A systematic review of the life cycle inventory of clothing. J. Clean. Prod. 2021, 20, 128852. [Google Scholar] [CrossRef]
  32. Zhang, S.; Xu, C.; Xie, R.; Yu, H.; Sun, M.; Li, F. Environmental assessment of fabric wet processing from gate-to-gate perspective: Comparative study of weaving and materials. Sci. Total Environ. 2023, 857, 159495. [Google Scholar] [CrossRef] [PubMed]
  33. Kazan, H.; Akgul, D.; Kerc, A. Life cycle assessment of cotton woven shirts and alternative manufacturing techniques. Clean. Technol. Environ. Policy. 2020, 22, 849–864. [Google Scholar] [CrossRef]
  34. Salemdeeb, R.; Saint, R.; Pomponi, F.; Pratt, K.; Lenaghan, M. Beyond recycling: An LCA-based decision-support tool to accelerate Scotland’s transition to a circular economy. Resourc. Conserv. Recycl. 2022, 13, 200069. [Google Scholar] [CrossRef]
  35. Farrant, L.; Olsen, S.I.; Wangel, A. Environmental benefits from reusing clothes. Int. J. Life Cycle Assess. 2010, 15, 726–736. [Google Scholar] [CrossRef]
  36. Zamani, B.; Svanström, M.; Peters, G.; Rydberg, T. A Carbon Footprint of Textile Recycling: A Case Study in Sweden. J. Ind. Ecol. 2015, 19, 676–687. [Google Scholar] [CrossRef]
  37. Semba, T.; Sakai, Y.; Ishikawa, M.; Inaba, A. Greenhouse Gas Emission Reductions by Reusing and Recycling Used Clothing in Japan. Sustainability 2020, 12, 8214. [Google Scholar] [CrossRef]
  38. Pattanaik, L.; Duraivadivel, P.; Hariprasad, P.; Naik, S.N. Utilization and re-use of solid and liquid waste generated from the natural indigo dye production process—A zero waste approach. Bioresour. Technol. 2020, 301, 122721. [Google Scholar] [CrossRef]
  39. Saling, P.; Kicherer, A.; Dittrich-Krämer, B.; Wittlinger, R.; Zombik, W.; Schmidt, I.; Schrott, W.; Schmidt, S. Eco-efficiency41 analysis by basf: The method. Int. J. Life Cycle Assess. 2002, 7, 203–218. [Google Scholar] [CrossRef]
  40. Fidan, F.S.; Aydoğan, E.K.; Uzal, N. Multi-dimensional Sustainability Evaluation of Indigo Rope Dyeing with a life cycle approach and hesitant fuzzy analytic hierarchy process. J. Clean. Prod. 2021, 309, 127454. [Google Scholar] [CrossRef]
  41. Periyasamy, A.P.; Duraisamy, G. Carbon Footprint on Denim Manufacturing. In Handbook of Ecomaterials; Martínez, L.M.T., Kharissova, O.V., Kharisov, B.I., Eds.; Springer: Berlin/Heidelberg, Germany, 2019; pp. 1581–1598. [Google Scholar]
  42. Sohn, J.; Nielsen, K.S.; Birkved, M.; Joanes, T.; Gwozdz, W. The environmental impacts of clothing: Evidence from United States and three European countries. Sustain. Prod. Consum. 2021, 27, 2153–2164. [Google Scholar] [CrossRef]
  43. Luo, Y.; Wu, X.; Ding, X. Carbon and water footprints assessment of cotton jeans using the method based on modularity: A full life cycle perspective. J. Clean. Prod. 2022, 332, 130042. [Google Scholar] [CrossRef]
  44. Fidan, F.S.; Aydoğan, E.K.; Uzal, N. The impact of organic cotton use and consumer habits in the sustainability of jean production using the LCA approach. Environ. Sci. Pollut. 2023, 30, 8853–8867. [Google Scholar] [CrossRef] [PubMed]
  45. Inventory Database (IDEA) for Environmental Analysis developed by the National Institute of Advanced Industrial Science and Technology (AIST) and Japan Environmental Management Association for Industry (JEMAI). Available online: https://idea-lca.com/en/ (accessed on 1 May 2024).
  46. Department of Agriculture, Forestry and Fisheries, Okinawa Prefecture. Sugarcane and Ama-Sugar Production Results for the Year 2020/2021; Department of Agriculture, Forestry and Fisheries, Okinawa Prefecture: Tokyo, Japan, 2021.
  47. Kikuchi, K.; Hondo, H. Environmental Impacts and Employment Effects Induced by Utilization of Biomass Resources in Local Areas: A Case Study of a Bioethanol Project in Miyako-Island. J. Jpn. Inst. Energy 2011, 90, 643–653. [Google Scholar] [CrossRef]
  48. National Institute for Environmental Studies, Japan. The Greenhouse Gas Inventory Office of Japan (GIO); National Institute for Environmental Studies, Japan: Tsukuba, Japan, 2022. [Google Scholar]
  49. Agriculture & Livestock Industries Corporation (ALIC). Statistical Data Business-Related Data 1; Agriculture & Livestock Industries Corporation (ALIC): Tokyo, Japan, 2023. [Google Scholar]
  50. Hayakawa, T.; Suzuki, K.; Sato, M. Technology for Fuel Ethanol Production from Molasses Bagasse in Sugar Mills. TSK Technical. J. 2010, 14, 21. [Google Scholar]
  51. Cortez, C.; Alcantara, A.; Pacardo, E.; Rebancos, C. Life Cycle Assessment of Manila Hemp in Catanduanes, Philippines. J. Environ. Sci. Manag. 2015, 18, 53–61. [Google Scholar] [CrossRef]
  52. Simbaña, E.; Ordonez, P.; Ordóñez, Y.F.; Guerrero, V.A.; Mera, M.C.; Carvajal, E. 6—Abaca: Cultivation, obtaining fibre and potential uses. In Handbook of Natural Fibres, 2nd ed.; Kozłowski, R.M., Mackiewicz-Talarczyk, M., Eds.; Elsevier: Amsterdam, The Netherlands, 2020; Volume 1, pp. 197–218. [Google Scholar]
  53. Ministry of Economy, Trade and Industry. LCA Study Report on Textile Products (Clothing)-Updated Version Due to Correction of Data on Dyeing Process, etc.; Ministry of Economy, Trade and Industry: Tokyo, Japan, 2009.
  54. NX-GREEN Calculator. Available online: https://www.nittsu.co.jp/logistics_solution/it/eco_solution/emission-cal.html (accessed on 1 May 2024).
  55. Google Maps. Available online: https://www.google.co.jp/maps/ (accessed on 1 May 2024).
  56. Yamaguchi, Y.; Seii, E.; Itagaki, M.; Nagayama, M. Evaluation of domestic washing in Japan using life cycle assessment (LCA). Int. J. Consum. Stud. 2011, 35, 243–253. [Google Scholar] [CrossRef]
  57. Ministry of Agriculture, Forestry and Fisheries, Guideline for the Maximum Amount of Biochar to Be Applied. Available online: https://www.maff.go.jp/j/seisan/kankyo/ondanka/biochar01.html (accessed on 1 May 2024).
  58. Lehmann, J.; Gaunt, J.; Rondon, M. Bio-char sequestration in terrestrial ecosystems—A review. Mitig. Adapt. Strategy Glob. Chang. 2006, 11, 403–427. [Google Scholar] [CrossRef]
  59. Lehmann, J. A handful of carbon. Nature 2007, 447, 143–144. [Google Scholar] [CrossRef]
  60. Gupta, S.; Kua, H.W.; Koh, H.J. Application of biochar from food and wood waste as green admixture for cement mortar. Sci. Total Environ. 2018, 619–620, 419–435. [Google Scholar] [CrossRef]
  61. Mohammadi, A.; Cowie, A.L.; Mai TL, A.; Brandao, M.; Rosa RA, R.; Kristiansen, P.; Joseph, S. Climate-change and health effects of using rice husk for biochar-compost: Comparing three pyrolysis systems. J. Clean. Prod. 2017, 162, 260–272. [Google Scholar] [CrossRef]
  62. Li, M.; Tang, Y.; Ren, N.; Zhang, Z.; Cao, Y. Effect of mineral constituents on temperature-dependent structural characterization of carbon fractions in sewage sludge-derived biochar. J. Clean. Prod. 2018, 172, 3342–3350. [Google Scholar] [CrossRef]
  63. Lehmann, J.; da Silva, J.P., Jr.; Rondon, M.; Cravo, M.D.S.; Greenwood, J.; Nehls, T.; Steiner, C.; Glaser, B. Slash-and-char-a feasible alternative for soil fertility management in the central Amazon. In Proceedings of the 17th World Congress of Soil Science, Bangkok, Thailand, 14–21 August 2002; pp. 1–12. [Google Scholar]
  64. National Institute for Environmental Studies, Japan. National Greenhouse Gas Inventory Report of Japan 2020. 2020. Available online: https://cger.nies.go.jp/publications/report/i150/i150.pdf (accessed on 1 May 2024).
  65. Zamani, B.; Sandin, G.; Peters, G.M. Life cycle assessment of clothing libraries: Can collaborative consumption reduce the environmental impact of fast fashion? J. Clean. Prod. 2017, 162, 1368–1375. [Google Scholar] [CrossRef]
  66. Levänen, J.; Uusitalo, V.; Härri, A.; Kareinen, E.; Linnanen, L. Innovative recycling or extended use? Comparing the global warming potential of different ownership and end-of-life scenarios for textiles. Environ. Res. Lett. 2021, 16, 054069. [Google Scholar] [CrossRef]
  67. Japan Paper Association, LCA Subcommittee. CO2 Emissions in Life Cycle Assessment of Paper and Paperboard; Japan Paper Association, LCA Subcommittee: Tokyo, Japan, 2011. [Google Scholar]
  68. Sun, M.; Wang, Y.; Shi, L.; Klemeš, J.J. Uncovering energy use, carbon emissions and environmental burdens of pulp and paper industry: A systematic review and meta-analysis. Renew. Sust. Energ. Rev. 2018, 92, 823–833. [Google Scholar] [CrossRef]
  69. UNEP. Non-Wood Fibres for Pulp and Paper. Original 1983, Translated 1984; Translated by Suzuki, T. J. Jpn. Tech. Assoc. Pulp Pap. Ind. 1984, 38, 174–195. [Google Scholar]
Figure 1. Bagasse washi jeans life cycle flow.
Sustainability 16 06044 g001
Figure 2. Bagasse.
Figure 2. Bagasse.
Sustainability 16 06044 g002
Figure 3. GHG emissions from bagasse washi jeans production.
Sustainability 16 06044 g003
Figure 4. GHG emissions over the entire life cycle of bagasse washi jeans (improved dyeing).
Sustainability 16 06044 g004
Figure 5. Comparison of the life cycle of bagasse washi jeans and 100% cotton jeans (Left: Bagasse washi jeans; Right: 100% cotton jeans).
Sustainability 16 06044 g005
Figure 6. Impact of cotton fiber production on GHG emissions from jeans production.
Sustainability 16 06044 g006
Table 1. Sugarcane cultivation process data.
ItemAmount of Activity
per kg of Sugarcane
InputSugarcane seedlings-
Agrochemical1.38 × 10−3kg
Fertilizer5.90 × 10−2kg
Diesel oil2.22 × 10−6kL
Rainwater-
OutputSugarcane1.00kg
Waste1.44 × 10−2kg
Table 2. Bagasse washi production process data.
ItemAmount of Activity per kg
of Bagasse Washi
InputBagasse powder2.83 × 10−1kg
Manila hemp pulp1.12kg
Polyethylene oxide (adhesive)5.59 × 10⁻³kg
Polyamine epichlorohydrin resin solution (5% solution)
(wet paper strength agent)
3.80 × 10⁻³kg
Carboxyquimethylcellulose (yield improver)2.51 × 10⁻³kg
Polyacrylamide resin solution (20% solution)
(paper strength enhancer)
3.14 × 10⁻²kg
Distilled water9.74 × 10−2kg
Public Electricity2.32kWh
LPG3.43 × 10−1kg
Groundwater5.79 × 102kg
OutBagasse washi1.00kg
Waste3.98 × 10−1kg
Wastewater5.82 × 102kg
Table 3. Improved dyeing process data.
ItemAmount of Activity
per kg of Dyed Cotton Yarn
InputCotton yarn1.00kg
Indigo dye9.52 × 10−2kg
Hydrosulfite (Na2S2O4)9.52 × 10⁻²kg
Sodium hydroxide7.14 × 10−2kg
Surfactant (for detergent)7.69 × 10⁻¹kg
Starch9.52 × 10−2kg
Sodium chloride (for electrolytic water)7.94 × 10⁻³kg
Public power1.08kWh
Heavy oil A (for boilers)1.59L
Underground water1.78 × 10−1m3
OutputDyed cotton yarn1.00kg
Waste3.01 × 10−3kg
Wastewater1.78 × 10−1m3
Table 4. Bagasse washi denim fabric finishing process data.
ItemAmount of Activity per kg
of Bagasse Washi Denim
Fabric
InputBagasse washi denim fabric1.00kg
LPG1.07MJ
Heavy oil A (for boilers)1.54 × 101MJ
Public electricity4.28 × 10−1kWh
Water supply3.67 × 10−3m3
Industrial water2.51 × 10−2m3
Softeners5.43 × 10−3kg
Penetrants5.55 × 10−3kg
OutputBagasse washi denim fabric1.00kg
Wastewater2.88 × 10−2m3
Table 5. Comparison of GHG emissions from jeans production with previously reported data.
ReportsThis StudyLevi’s [13]
0.34 kg
Mistra Future Fashion [14]
0.477 kg
Morita et al. [25] 0.959 kgPeriyasamyet al. [41]
0.57 kg
Sohn et al. [42]
1 kg
Luo et al. [43]
1 kg
Fidan et al. [44] 0.67 kg
Bagasse Washi Jeans
(Improved Dyeing)
0.750 kg
100% Cotton Jeans (Conventional Dyeing)
0.750 kg
GHG Emissions
(kg-CO2e)
Ratio (%)GHG Emissions
(kg-CO2e)
Ratio (%)GHG Emissions
(kg-CO2e)
Ratio (%)GHG Emissions
(kg-CO2e)
Ratio (%)GHG Emissions
(kg-CO2e)
Ratio (%)GHG Emissions
(kg-CO2e)
Ratio (%)GHG Emissions
(kg-CO2e)
Ratio (%)GHG Emissions
(kg-CO2e)
Ratio (%)GHG Emissions
(kg-CO2e)
Ratio (%)
Fabric
production
Yarn productionBagasse washi yarn1.9329.8----------------
Cotton
yarn
1.313.5325.31.19 × 10182.13.0134.61.9926.11.90 × 10175.32.81 × 1011004.715.24.2877.4
Dyeing3.2429.86.0243.22.8332.54.66 × 10151.7
Weaving
/Fabric finishing
2.3221.42.3216.61.4116.31.6221.2
Jeans
production
Cutting/Sewing
/Finishing
2.0719.12.0714.92.6017.91.4516.74.0252.76.2624.73.89 × 10143.11.2522.6
Total1.09 × 1011001.39 × 1011001.45 × 1011008.701007.631002.53 × 1011002.81 × 1011009.02 × 1011005.53100
Note: The data from Periyasamy et al. [41], Mistra Future Fashion [14], Morita et al. [25], Shohn et al. [42], Luo et al. [43], and Fidan et al. [44] are cited from Figure 11, Figure 4.21, Table 3, Table 3, Figure 4, and Table S2, respectively. Luo et al. [43] estimated carbon fixation by photosynthesis in cotton cultivation to be −1.804 × 101 kg-CO2e, which is excluded in Table 5.
Table 6. GHG emissions from Jeans production, laundry, and disposal (excluding transportation and sales).
ProcessBagasse Washi Jeans
in this Study
Fidan et al. [44]
GHG Emissions
(kg-CO2e/Pair of Jeans)
Rate
(%)
GHG Emissions
(kg-CO2e/Pair of Jeans)
Rate
(%)
Fabric production8.7966.94.2825.6
Jeans production2.0715.81.257.5
Laundry3.1824.21.13 × 10167.6
Disposal−9.01 × 10⁻¹−6.9−1.25 × 10⁻¹−0.7
Total1.31 × 1011001.67 × 101100
Note: To compare both, the number of laundry cycles was set to 45.5, and natural drying was assumed. Additionally, transportation and sales were excluded from this study.
Table 7. Previously reported GHG emissions from cotton fiber.
AuthorGHG Emissions
(kg-CO2e/kg-Fiber)
Region
Khabbaz et al. [23]3.8Australia
Cotton Incorporated [28]1.81Global mean (China, India, US)
van der Velden et al. [19]3.47China
Visser et al. [24]1.42Australia
Cotton Incorporated [29]1.33Global mean (US, India, China, Australia)
Günther et al. [20]4.43Xinjiang, China
Aid by Trade Foundation [27]1.24Africa
Disclaimer/Publisher’s Note: The statements, opinions and data contained in all publications are solely those of the individual author(s) and contributor(s) and not of MDPI and/or the editor(s). MDPI and/or the editor(s) disclaim responsibility for any injury to people or property resulting from any ideas, methods, instructions or products referred to in the content.