Article

Research on Low-Carbon Design and Energy Efficiency by Harnessing Indigenous Resources through BIM-Ecotect Analysis in Hot Climates

1
School of Architecture, Southeast University, Nanjing 210096, China
2
Architects Engineers Co., Ltd. of Southeast University, Nanjing 210096, China
*
Author to whom correspondence should be addressed.
Sustainability 2024, 16(14), 6057; https://doi.org/10.3390/su16146057
Submission received: 13 May 2024 / Revised: 13 June 2024 / Accepted: 9 July 2024 / Published: 16 July 2024

Abstract

:
In the face of contemporary challenges, such as economic instability, environmental degradation, and the urgent global warming crisis, the imperative of sustainability and energy efficiency has reached unparalleled significance. Sustainability encompasses not only the natural environment, but also extends to our immediate surroundings, including the built structures and the communities they serve. Embracing this comprehensive perspective, we embarked on a mission to conceive and construct a model house that harnesses state-of-the-art energy-efficient technologies. Our goal was to seamlessly integrate these features not only to meet our sustainability objectives, but also to mitigate environmental threats.This model embodies a harmonious fusion of indigenous resources, employing locally sourced stone and employing traditional construction techniques. Through this approach, we achieved significant reductions in carbon emissions and established a framework for passive cooling and heating systems. Moreover, the design is intrinsically attuned to its contextual surroundings, preserving the diverse tapestry of regional architectural styles. This study stands as a testament to the potential of innovative design and technology in shaping a sustainable future. The research employs a multi-dimensional approach, encompassing strategies of architectural design with a traditional planning approach, sustainable material selection, energy efficiency, and life cycle assessment across a diverse set of case studies. Building energy analysis is conducted through the application of BIM (Ecotect), providing insights into how BIM can adapt and thrive in various environments. Key findings underscore that thermal performance, minimizing energy loads, and reducing carbon emissions are pivotal aspects in designating a building as both green and energy efficient.

1. Introduction

With the escalating awareness of the potential of sustainable buildings and construction, there has been a notable surge in concern for the environment, propelling green building practices to the forefront [1]. As stated, “Global warming and climatic variation are important factors for the rising awareness of green buildings.” [2]. Buildings account for 30% of worldwide energy use and 27% of global carbon emissions. This means that energy and environmental issues require urgent attention [3]. Since buildings account for 40% of the world’s energy usage, efforts are being made to achieve almost zero energy use [4].
The expanding urban sprawl is driving an increased demand for energy [5], and it is projected that by 2030, a substantial 60% of the global population will be residing in urban areas [6]. Green buildings stand as the optimal choice, offering a cost-effective solution for developers and policymakers in mitigating the adverse environmental impacts of development [7], while simultaneously enhancing stakeholder relations through improved public image, community outreach, and education [8]. Achieving carbon neutrality and addressing peak carbon in buildings require optimizing energy savings in rural dwellings [9]. If organic and sustainable materials are used in buildings, the overall environmental impact is greatly decreased, and remarkable zero-emission results are obtained. To attain sustainable growth, certain standards in the areas of the economy, environment, and society must be met.
This study highlights the qualities and technologies of energy-efficient practices while examining their vital value. Energy efficiency must be given top priority in buildings to ensure sustainability. Energy-intensive construction techniques and the need for heating, cooling, ventilation, and lighting lead to an interaction between building energy consumption and environmental impact. These requests deplete important natural resources. Buildings can, however, be made to minimize the use of energy and resources while still satisfying the needs of their occupants in terms of thermal comfort, aesthetic appeal, and psychological well-being.
As the building industry has evolved, smart and sustainable construction techniques represent a major turn during sustainability. Digital tools improve design to support daylight, air quality, and well-being [10]. Our energy-efficient model house demonstrates our commitment to sustainable practices and energy-efficient design by incorporating several energy-saving measures, meticulous planning, and locally sourced materials. This method helps us design spaces that are more ecologically friendly.
To meet sustainability goals, this study assesses a method of building energy analysis. Using BIM-Ecotect analysis, it looks at reducing carbon emissions as well as building energy load and demand. The study investigates the load and demand on energy, emphasizing the usage of locally produced products to lower carbon emissions and lessen energy requirements. Vernacular approaches are combined with passive strategies, including using a mumpty as a wind catcher and lowering window widths to improve ventilation in the summer. Analyzing building energy usage and suggesting PV panels for upcoming energy requirements are examples of active techniques. The goal of this research is to improve building comfort and energy efficiency through the integration of local materials and technologies. Because carbon reduction has been effectively addressed using local materials in conjunction with smart design and energy analysis, this technique is viable for rural areas with harsh climatic conditions.
The substantial decrease in carbon emissions highlighted in this paper demonstrates our ongoing commitment to sustainability. We utilized locally sourced materials based on their durability and sustainability in the environment, considering the climatology of the area. The building is a model for regions with varying climates because of its design, which combines thermal mass components with regional building methods. Future research will use cutting-edge software for life cycle assessments and building energy analysis.

2. Literature Review

2.1. Energy Efficiency and Energy Efficient Building

“Using less energy to provide the same and require services”. The best way to understand energy efficiency is through examples: While replacing a single-pane window with an energy-efficient one, the new one prevents heat from escaping in the winter, thus saving energy. In summer, efficient windows keep the heat out, so the air conditioning does not run as often, thus saving power. Energy efficiency in buildings is a first step towards achieving sustainability. It helps control rising energy costs, reduces environmental footprints, and increases the value of buildings [11]. In recent decades, there has been a global interest in zero-energy buildings (ZEBs), which provide acceptable thermal conditions with minimum energy use [12].

2.2. Energy Efficiency in Architecture

Current building designs lead to environmental issues due to high energy consumption. This stems from using energy-intensive methods for heating, cooling, ventilation, and lighting, depleting natural resources. It suggests that buildings can be designed for comfort while minimizing energy use through an integrated approach. This involves incorporating solar passive techniques to reduce reliance on conventional systems while utilizing natural energy sources.
Further, it emphasizes various strategies for energy conservation in building design. It suggests using energy-efficient equipment, controls, and operation strategies for artificial lighting and HVAC systems. Incorporating renewable energy systems like solar photovoltaic and solar water heating can help offset building energy needs. Additionally, it recommends using low-energy materials and construction methods, along with minimizing transportation energy. Efficient structural design, reducing the use of high-energy materials like glass and steel, and opting for low-energy building materials, are also highlighted. Overall, an energy-efficient building combines passive solar design, efficient equipment, and renewable energy sources [13]. Green finance is seen as a key approach for sustainable development and environmental protection [14].
One effective strategy for addressing climate change is to optimize the construction sector for energy efficiency [15,16]. Energy consumption and greenhouse gas emissions can be considerably decreased by creating energy-efficient buildings, which can be accomplished by implementing strategies like installing renewable energy sources and adopting durable materials. Retrofitting buildings can reduce energy consumption by 57% [17]. Energy efficiency improvements in a Turkish school resulted in a 60% reduction in energy use and CO2 emissions [18].

2.3. Green Buildings

A green building provides specified building performance requirements while minimizing disturbance to improve the functioning of the local, regional, and global ecosystems, both during and after its construction and specified service life [19]. A green building also optimizes efficiencies in resource management and operational performance and minimizes risks to human health and the environment.
Green building is a trillion-dollar industry that acts as a catalyst for the adaptation of green construction and design across the globe and inspires innovation in material products and processing [20]. According to the definition of sustainable buildings, “the results of an applied sustainable way of construction sustainability approach to create a built environment that should be focused on high-performance green buildings” [21]. Nowadays, we can call them net zero buildings or zero energy building, which produce energy as they need to consume it, and energy that should be produced on site through renewable sources like wind, sun, and water [22].
Better resource management and construction are the main goals of sustainable, green, and energy-efficient buildings. Choices made in the process of designing, manufacturing, operating, and demolishing a building determine its overall impact on the environment and resource efficiency [23].

Challenges of Green Buildings

Emphasis is needed on the identification of green building adaptation barriers in developing countries [24]. Time, budget, and risk are highly influenced while adapting to decide to go green [25] for some individual, external, corporate, and project-level drivers [26]. Many barriers have been identified in Malaysia while developing green building, which are the risk of investment, lack of demand, and lack of credit resources [27]. In Saudi Arabia, the major challenges identified to the adoption of green buildings identified were financial, technical, cultural, and market [5]. In Asia [28], there is a lack of awareness, training, and education about sustainability. Over all, this study has the following challenges:
  • Technical difficulties during the construction process.
  • High-green appliance design and energy + material cost savings [29].
  • Lack of awareness and knowledge about green buildings [30]
  • Lack of integrated building regulations and bye-laws within the green framework.
  • Lack of motivated demand from customers and insufficient policy implementation efforts [31].
The United States Environmental Protection Agency (US EPA) defined “green or sustainable buildings as creating a healthy, resource-efficient model of construction, renovation, operation, maintenance, and demolition” [32]. Green buildings play a key role in the urban sustainability movement, complementing strategies like roof-top gardens [33], urban parks [34], green belts, and green ways [35] to reduce urban ecological footprints. The built environment is a significant consumer of natural resources in the United States, accounting for 40% of energy consumption [35], 65% of power consumption, and 30% of green gas emissions and raw material usage, and produces 136 million tons of waste output annually [36].

2.4. Evaluation of Building Materials for Greenness

Resource management is the general criterion for evaluating building materials, pollution, indoor environmental quality (IEQ), and performance [33,37]. Resources used by materials include all components and energy used to extract, process, transport, use, dispose of, or recycle [33]. Materials with low durability, no matter how benignly produced, can hardly qualify as green. Proper design, installation, and detailing are critical to ensuring long-term durability. Construction materials can endure much longer than other materials [33,38]. Approximately 60% of the materials extracted from the Earth’s crust end up in the built environment [38], and they have a life cycle that is mostly related to the time when the building is in operation.

2.5. Common Materials Used in Green Buildings

The green and sustainable building materials with low carbon characteristics are shown in Table 1.

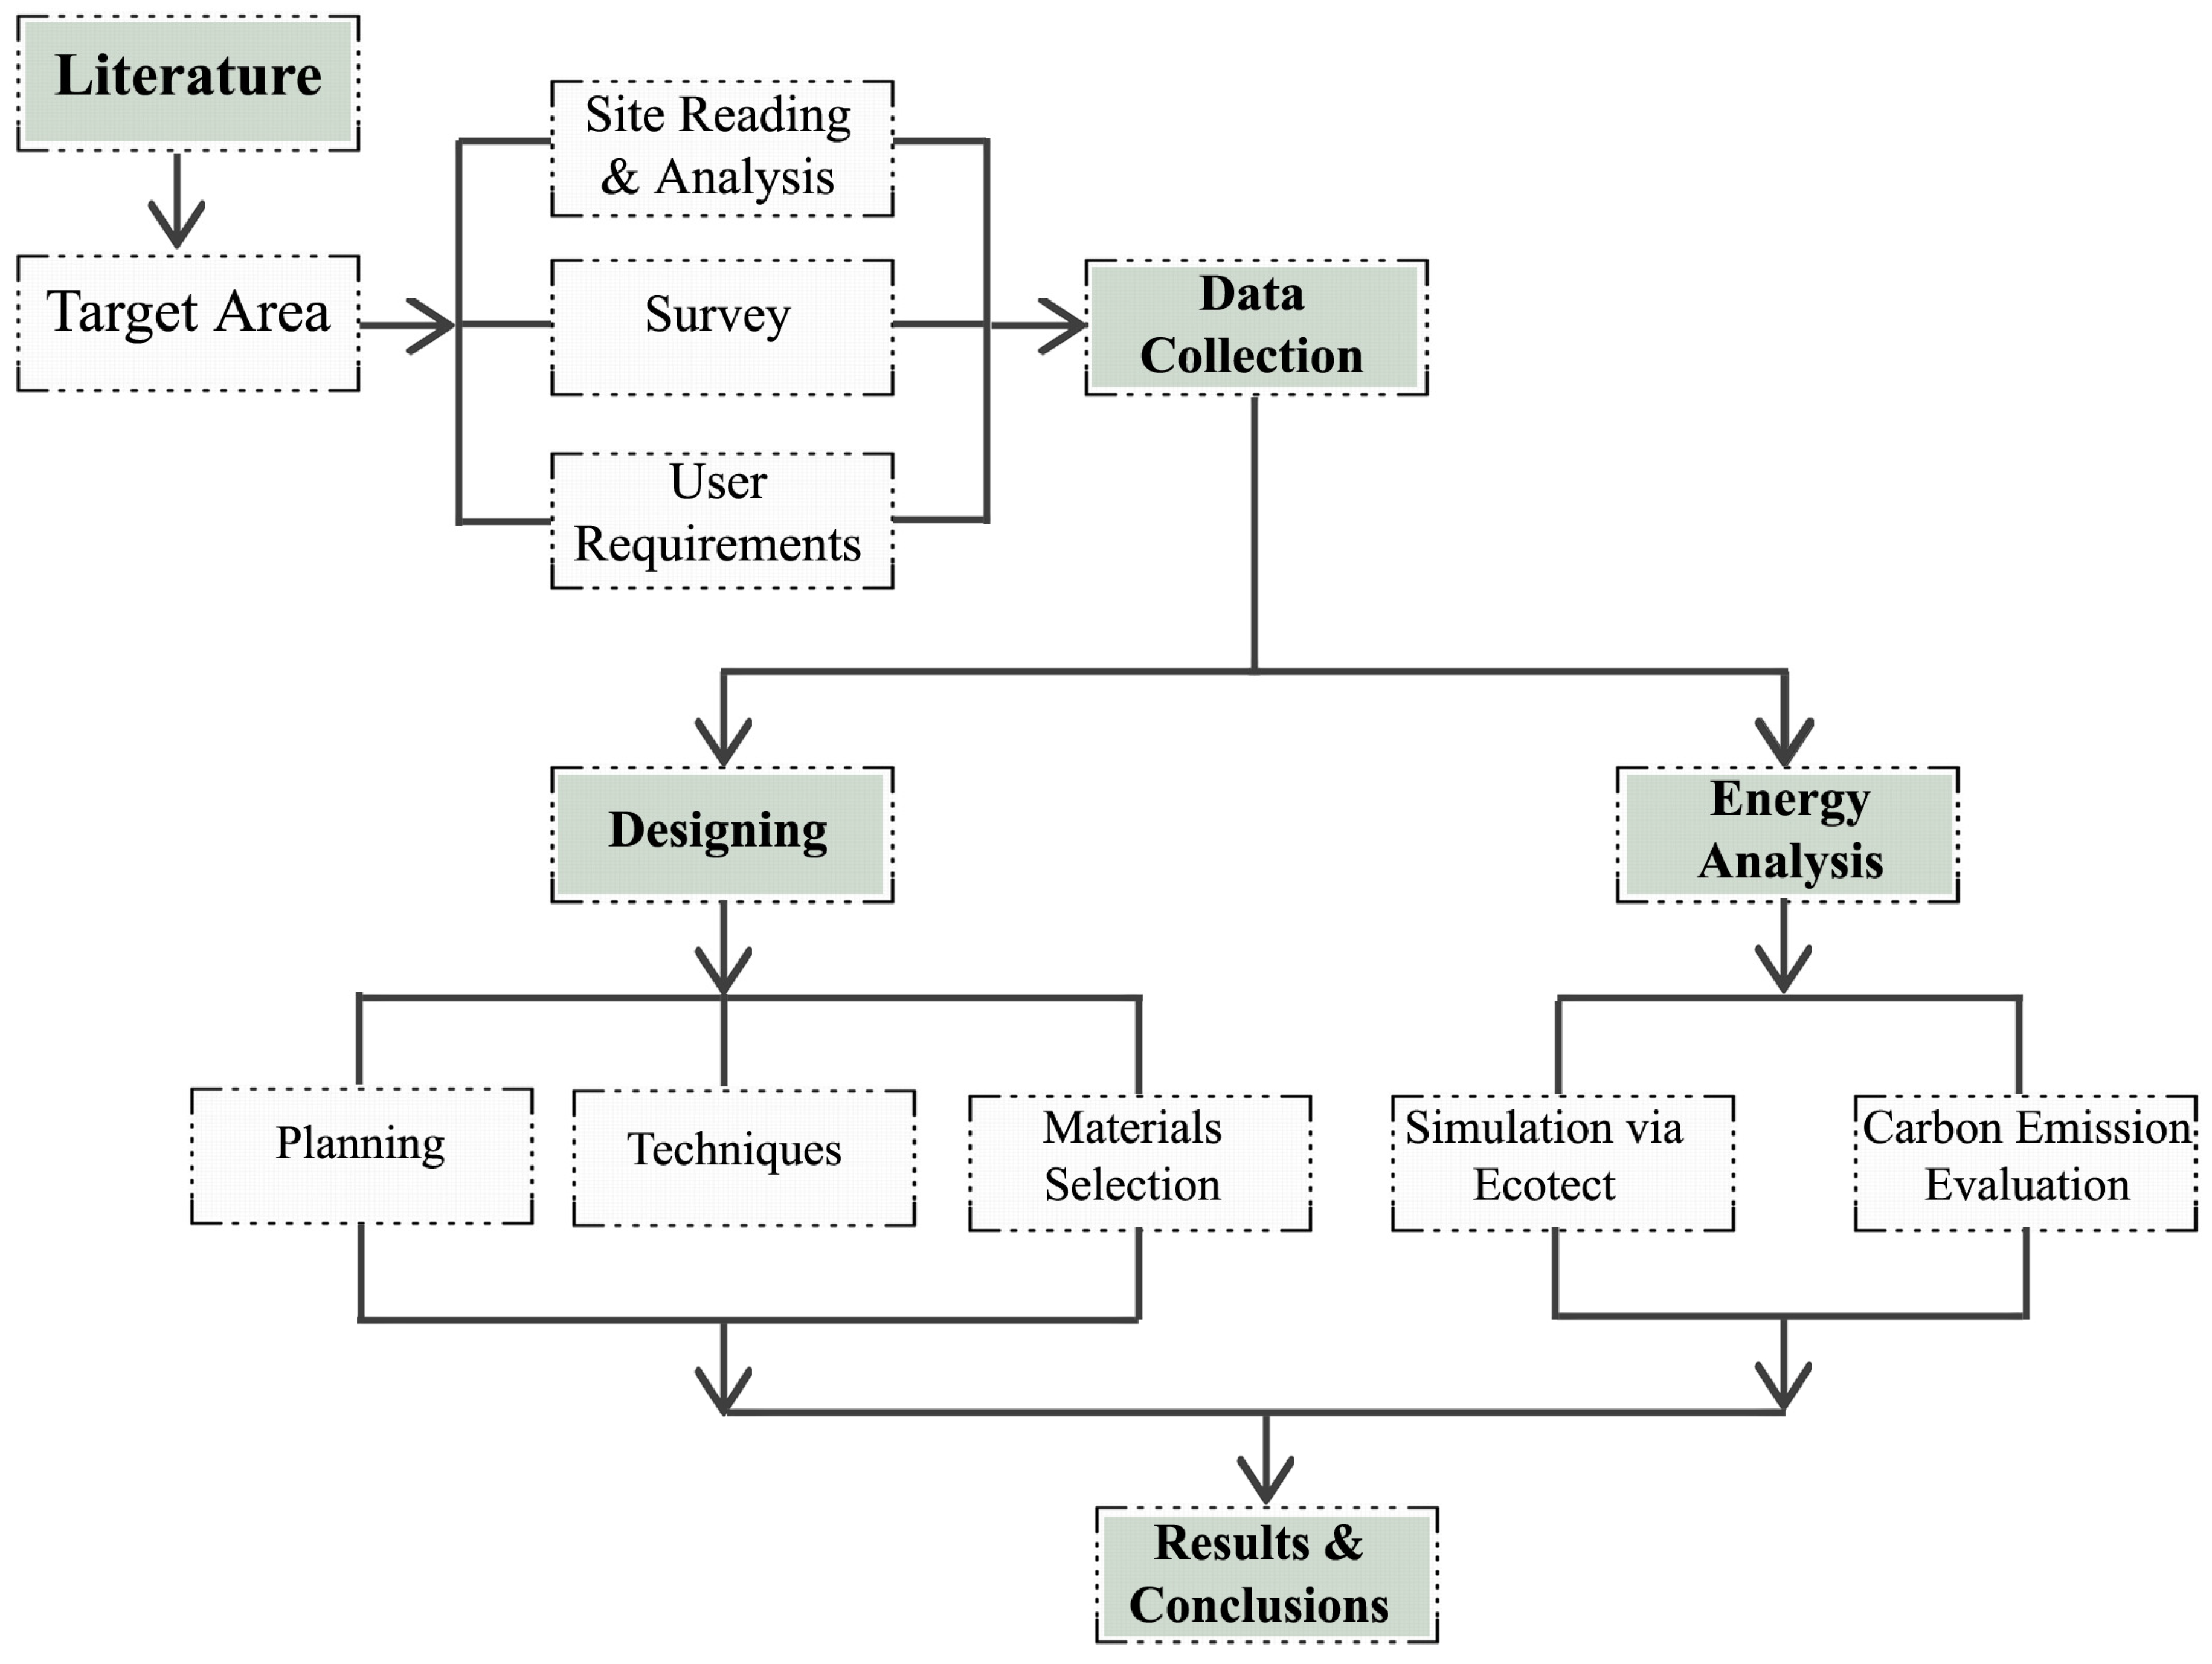
3. Design and Methodology

3.1. Materials and Methods

Phase 1. This study includes a significant amount of data collection and a literature review that was studied and analyzed [39]. The literature data for the understanding of green buildings and energy efficiency were only taken from published studies based on data collected from the industry, and the literature was used for analysis and studies of terminologies in terms of energy-efficient buildings and sustainability. The research methodology in this article includes work flow guidelines, as shown in Figure 1.
Phase 2. After devising the strategies of methodological design through relevant literature and site studies and analysis, ground was made. After the data collection, as per the user’s requirement and climatic sensitivity and materials studies, the design stage was initiated and completed. As per the client and climatic condition demand, the Ecotect analysis simulation/evaluation process was applied for the energy analysis of the buildings, as per discussed in Results in detail. To achieve the main objective of claiming it as a green and energy-efficient building, along with the main ingredients and components of sustainable residential requirements and design, and to establish the interrelationships between green buildings, the role of BIM (Ecotect) in design and construction, and the materials used for sustainable buildings were discussed, analyzed, and implemented.

3.2. The Analysis Tool of Choice Is Autodesk Ecotect

Autodesk Ecotect is a flexible building performance simulation tool. It addresses thermal performance, sun exposure, artificial and daylight lighting, materials, and resource use. To analyze daylighting and solar exposure, the tool needs the exact building geometry. Examining light and shadow projection on any surface—interior or exterior—at any time of year is made possible by detailed models. The design and direction of a residence are examined in this study using Ecotect to optimize natural lighting.

4. Case Study

4.1. Geographical Location and Climatic Zone

The district Kohat lies between north latitudes 32°47′ and 33°53′ and east longitudes 70°34′ and 72°17′. It is bounded [40] on the north by the district Peshawar, the capital city of Khyber Pakhtunkhwa Province of Pakistan and the Afridi and Orakzai hills; on the east by Indus; on the south by the district Bannu; and on the west by the river Kurrum and Waziri hills. There are four major climatic zones, i.e., highland climate, low land climate, desert/arid climate, and coastal/maritime climate, in the district Kohat, which lies in the rain-fed arid zone of the province and is separated into two main zones based on rainfall, temperature, and soil texture. One is the Thall zone, which is comparatively hot and has less than 500 mm of annual rainfall.

4.2. Project Overview

Table 2 presents the project characteristics in full, including building typology, climatic conditions, methodologies used, and all relevant information.

4.3. Site Reading and Analysis

Table 3 includes some relevant and basic information about the site where we designed it; these are the basic steps moving towards the site and collecting data about the site. The solar path, wind directions, neighborhood, views, noise, access, and climatic graphs are the relevant information; the site reading and analysis about the site are shown in Figure 2a,b.

4.4. Design Development Process

Some of the basic developmental processes highlighted by wind movement and ventilation studies along with wind directions are shown in Figure 3a,b.

4.5. Planning (Ground Floor Plan)

The house’s one-story floor plan is shown in Figure 4, together with the covered area, open plot area, and spatial dimensions. Brown stone masonry walls, measuring eighteen inches, adorn the external enclosure. Important features include the main entrance, eastward-facing trees that shade and shield the building from the summer sun, and a partially covered north-facing verandah intended for summer use. This design demonstrates how structural elements and natural elements are integrated to improve the comfort and functioning of the home. The internal structure of the building is seen in Figure 5, which also highlights the passage of air and wind, as well as how it interacts with the mumpty, which serves as a wind catcher.

4.5.1. Structure and Methodology

The structure consists of thick, heavy masonry walls of stone that support the entire structure, also accompanied by tie beams, girders, lintels, trusses, and angle iron. T-iron and steel guarders are composed of straight members connected at their ends by hinged connections to form stability.

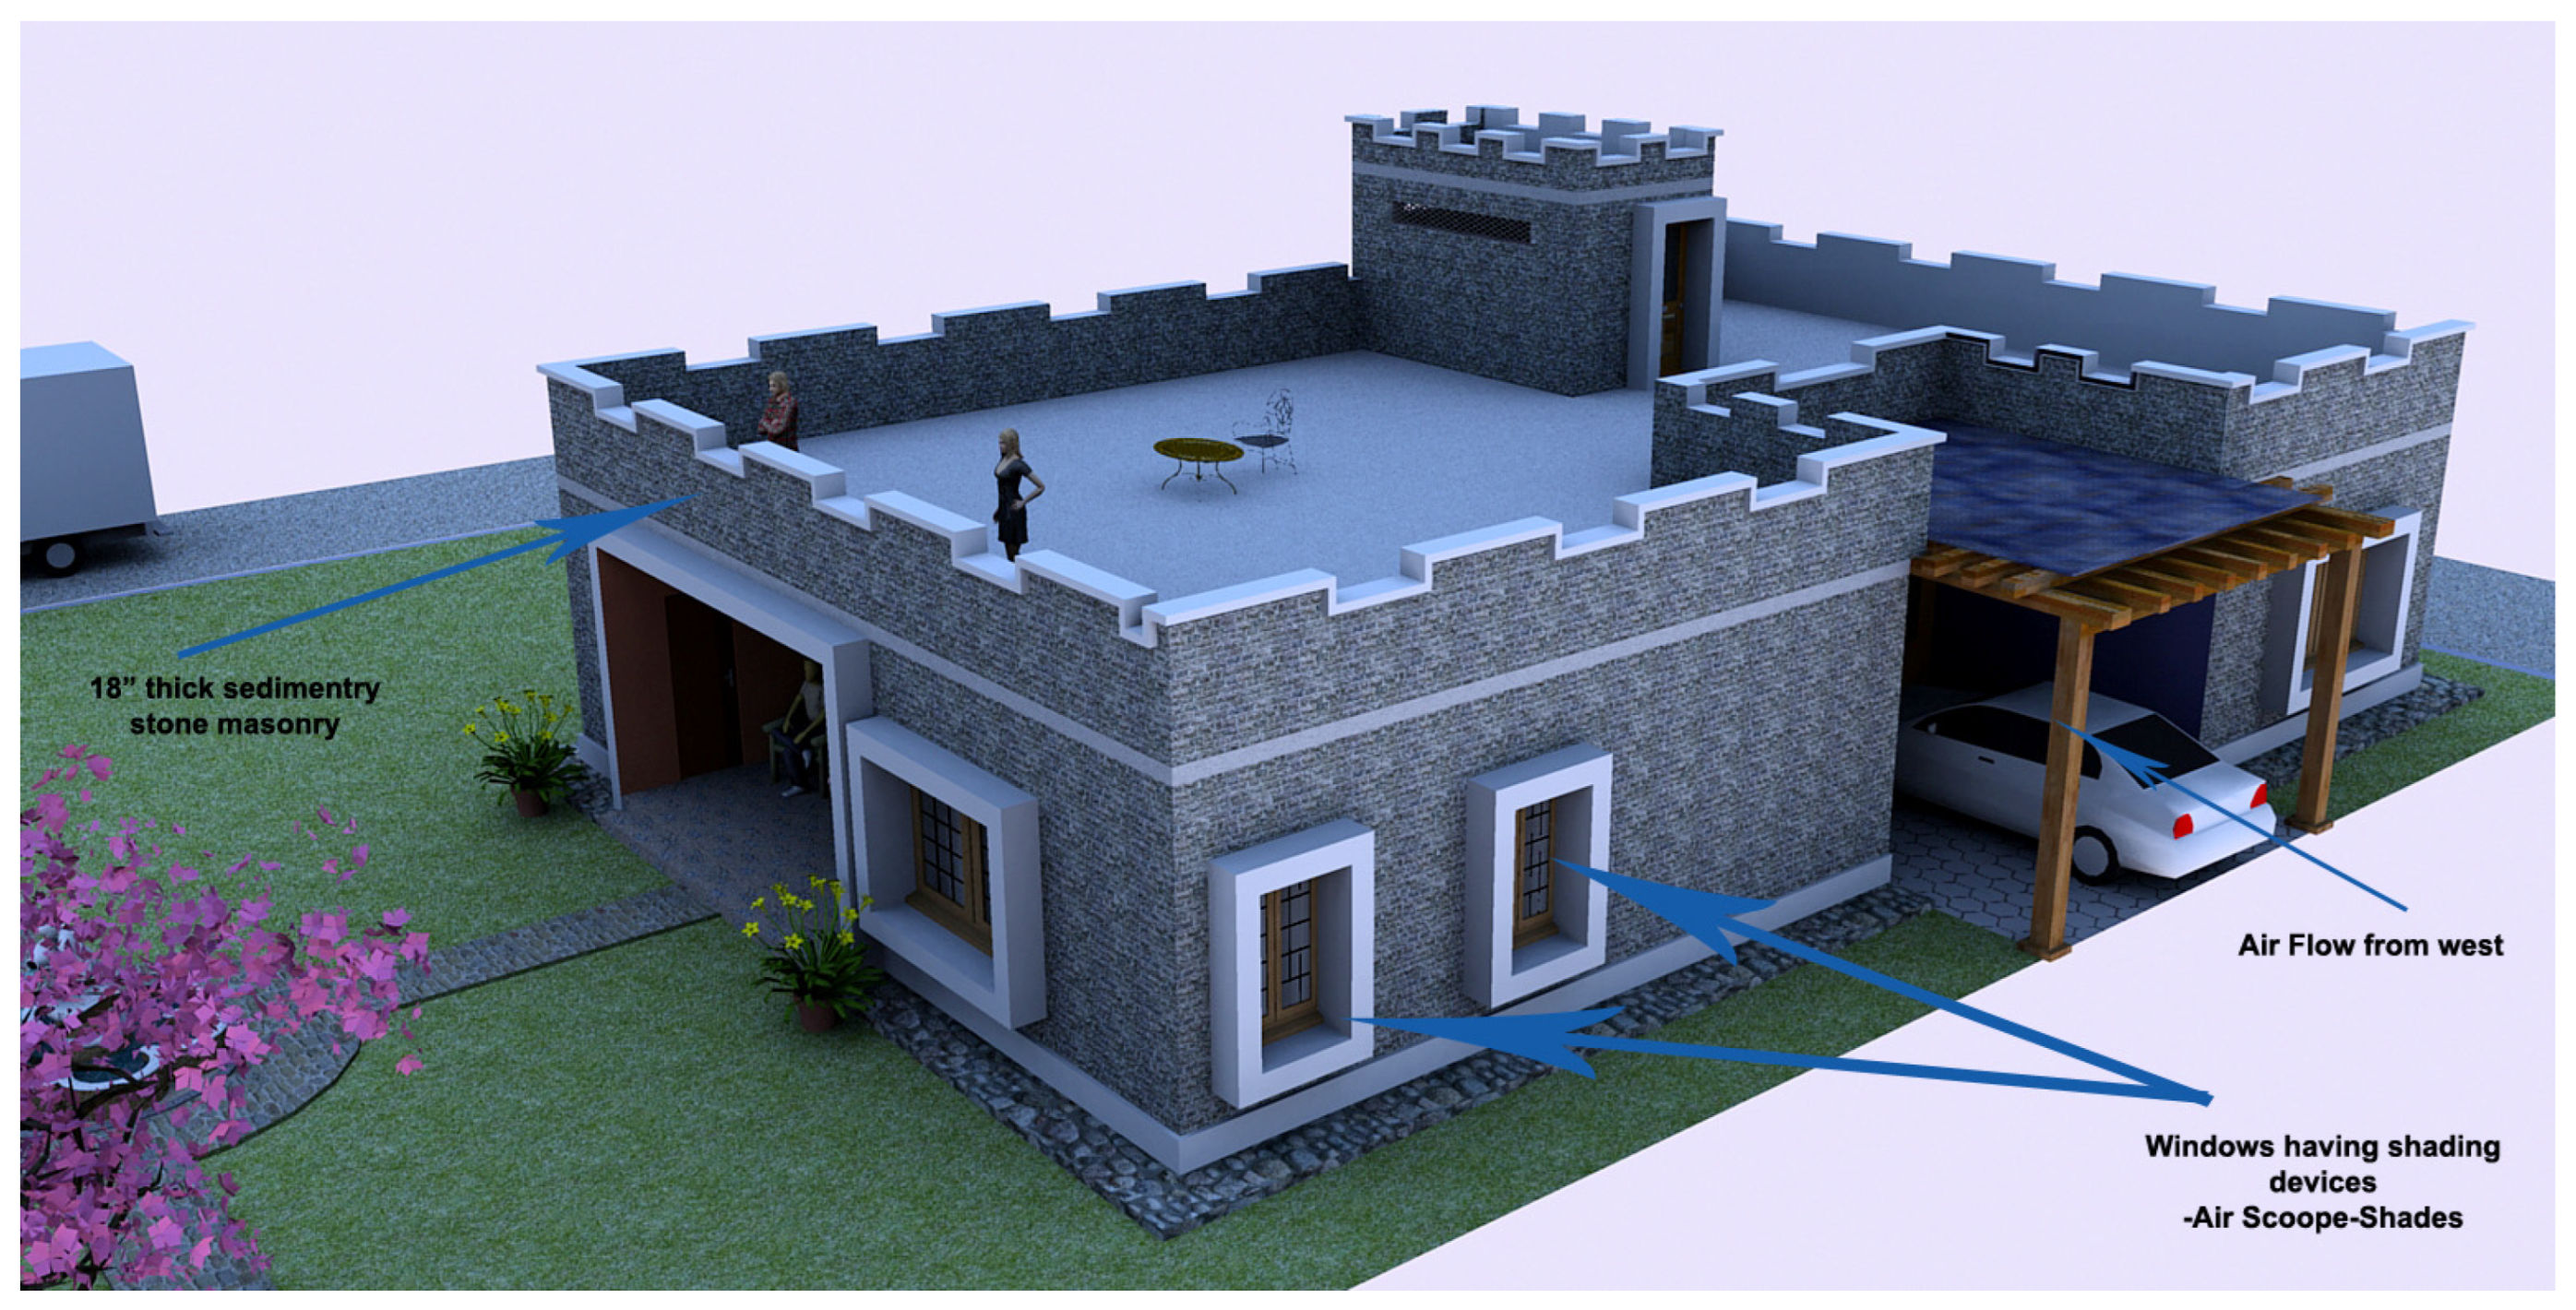
4.5.2. Masonry and Foundation Details

In exterior walls, the masonry is stone; the wall thickness is 18 inches and it is constructed with cement mortar having a ratio of 1:4. The interior wall masonry is brick; the wall thickness is 9 inches and it is constructed with cement mortar having a ratio of 1:4. All the interior walls and the inner surface of the exterior wall are plastered with cement with a ratio of 1:6. The exterior walls are finished with pointing. Excavation of 3 feet has been done and the soil is compacted. A 6-inch P.C.C. layer with a ratio of 1:4:8 has been laid for the leaning of the surface. Stone masonry with concrete mortar extends above the natural soil up to the DPC level, as shown in Figure 6.

4.5.3. Openings/Doors and Windows

All the windows have been considered a primary source of light and ventilation. The size and placement of windows are measured as per the requirements of day light, privacy factors, and ventilation. The shape is rectangular as per the local style and surrounded by horizontal and vertical shading devices. The glass is placed on the inner side to achieve defuse light and avoid glare and radiation, convection of direct light, and reflection. Further, to achieve pleasant, ventilated environments, the windows act to catch the outside breeze passing through trees.

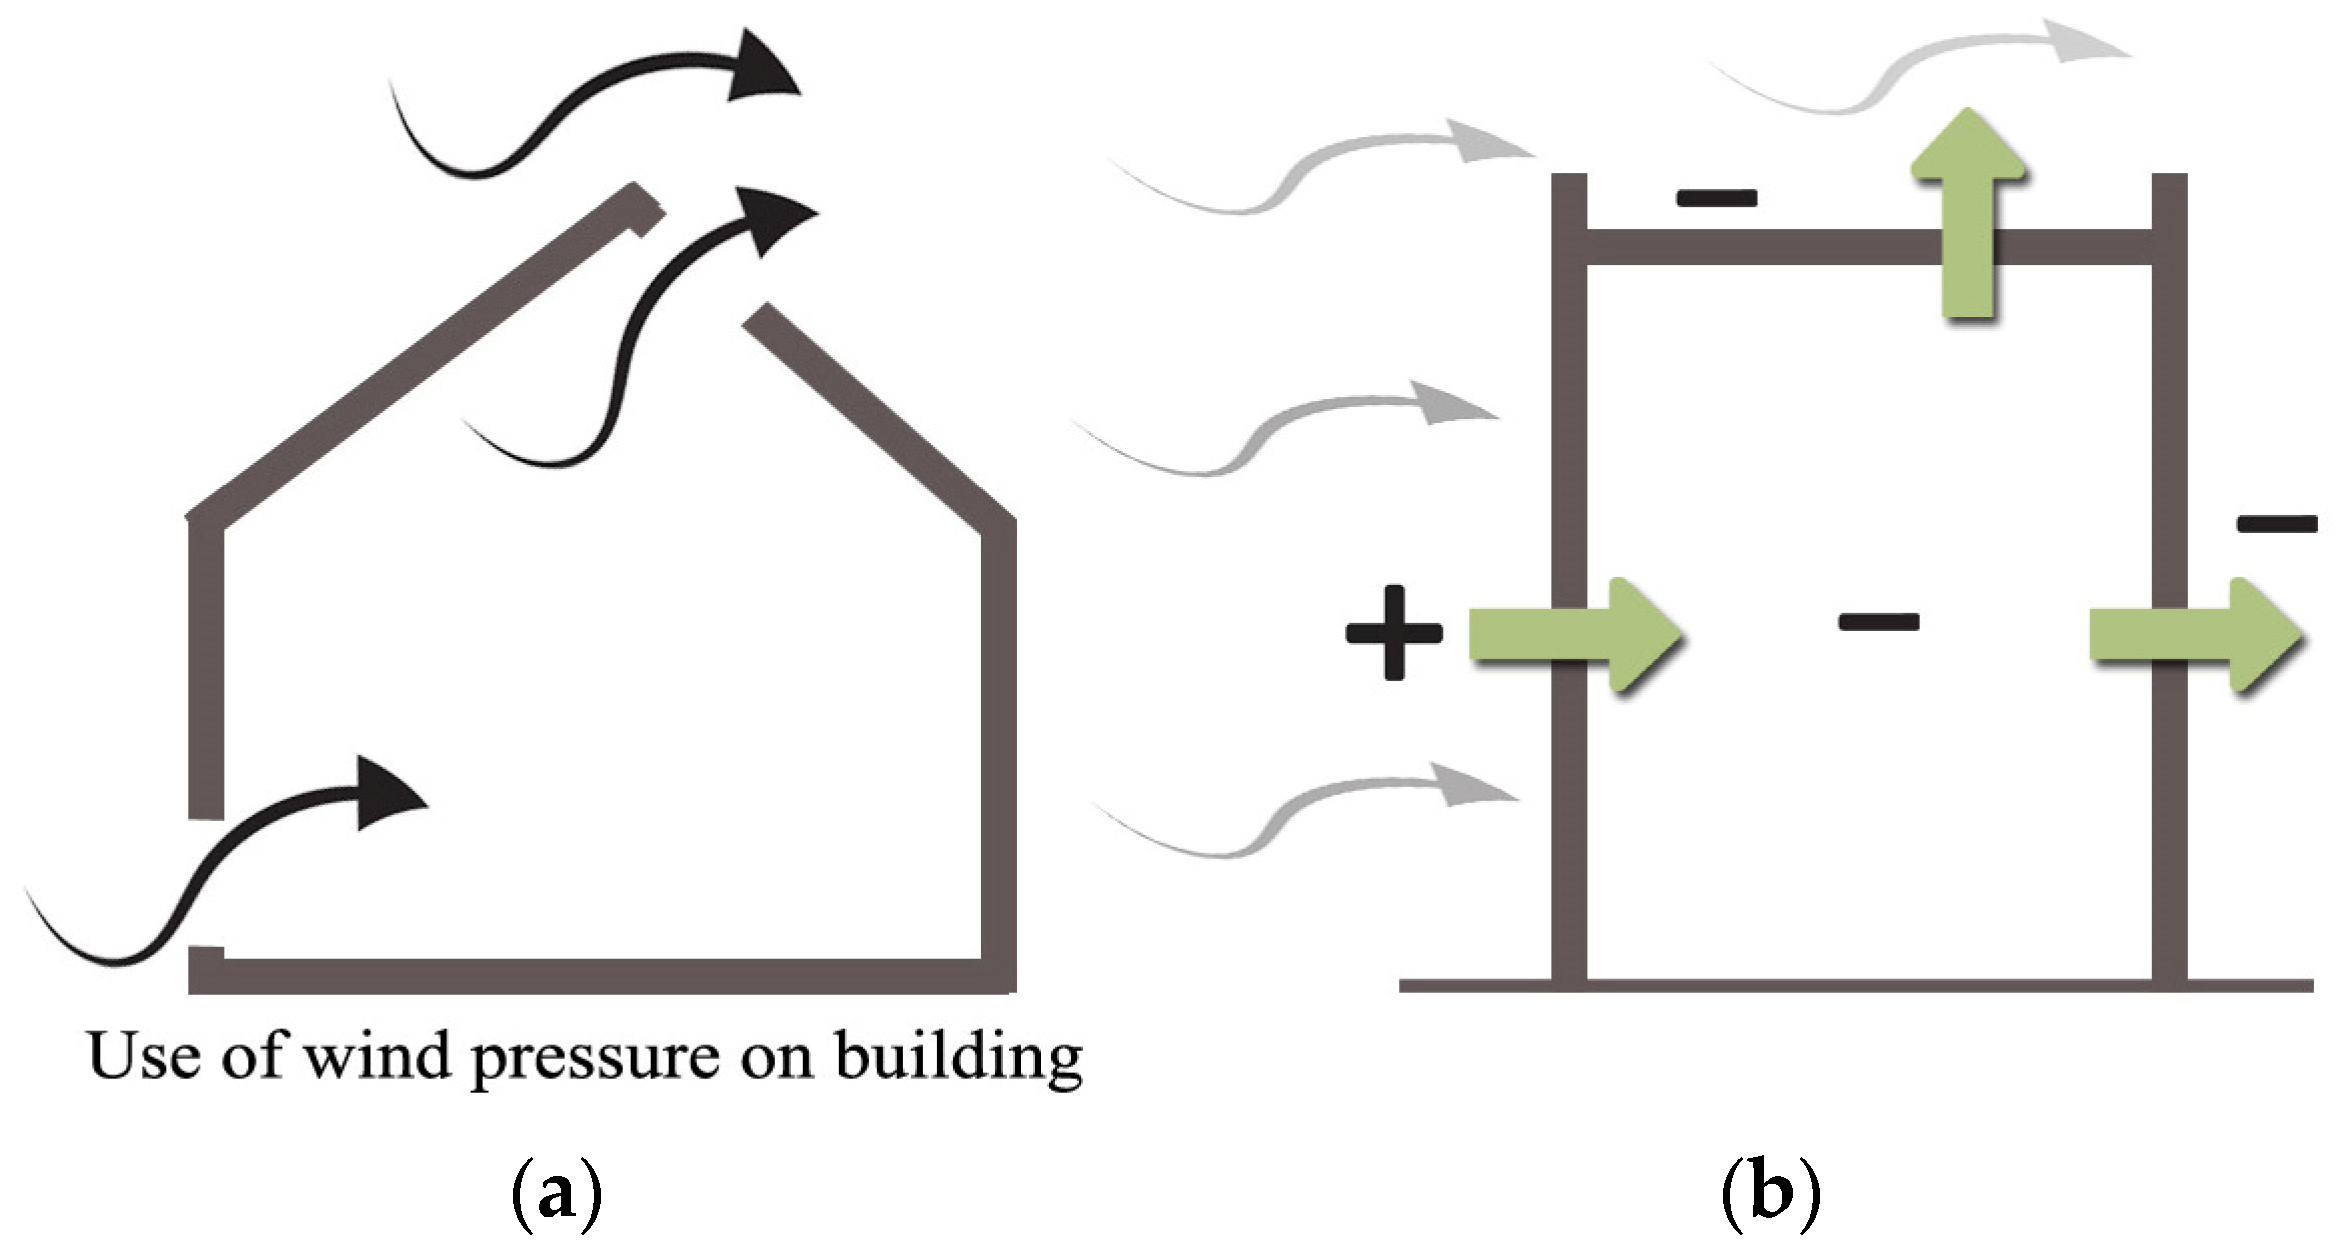
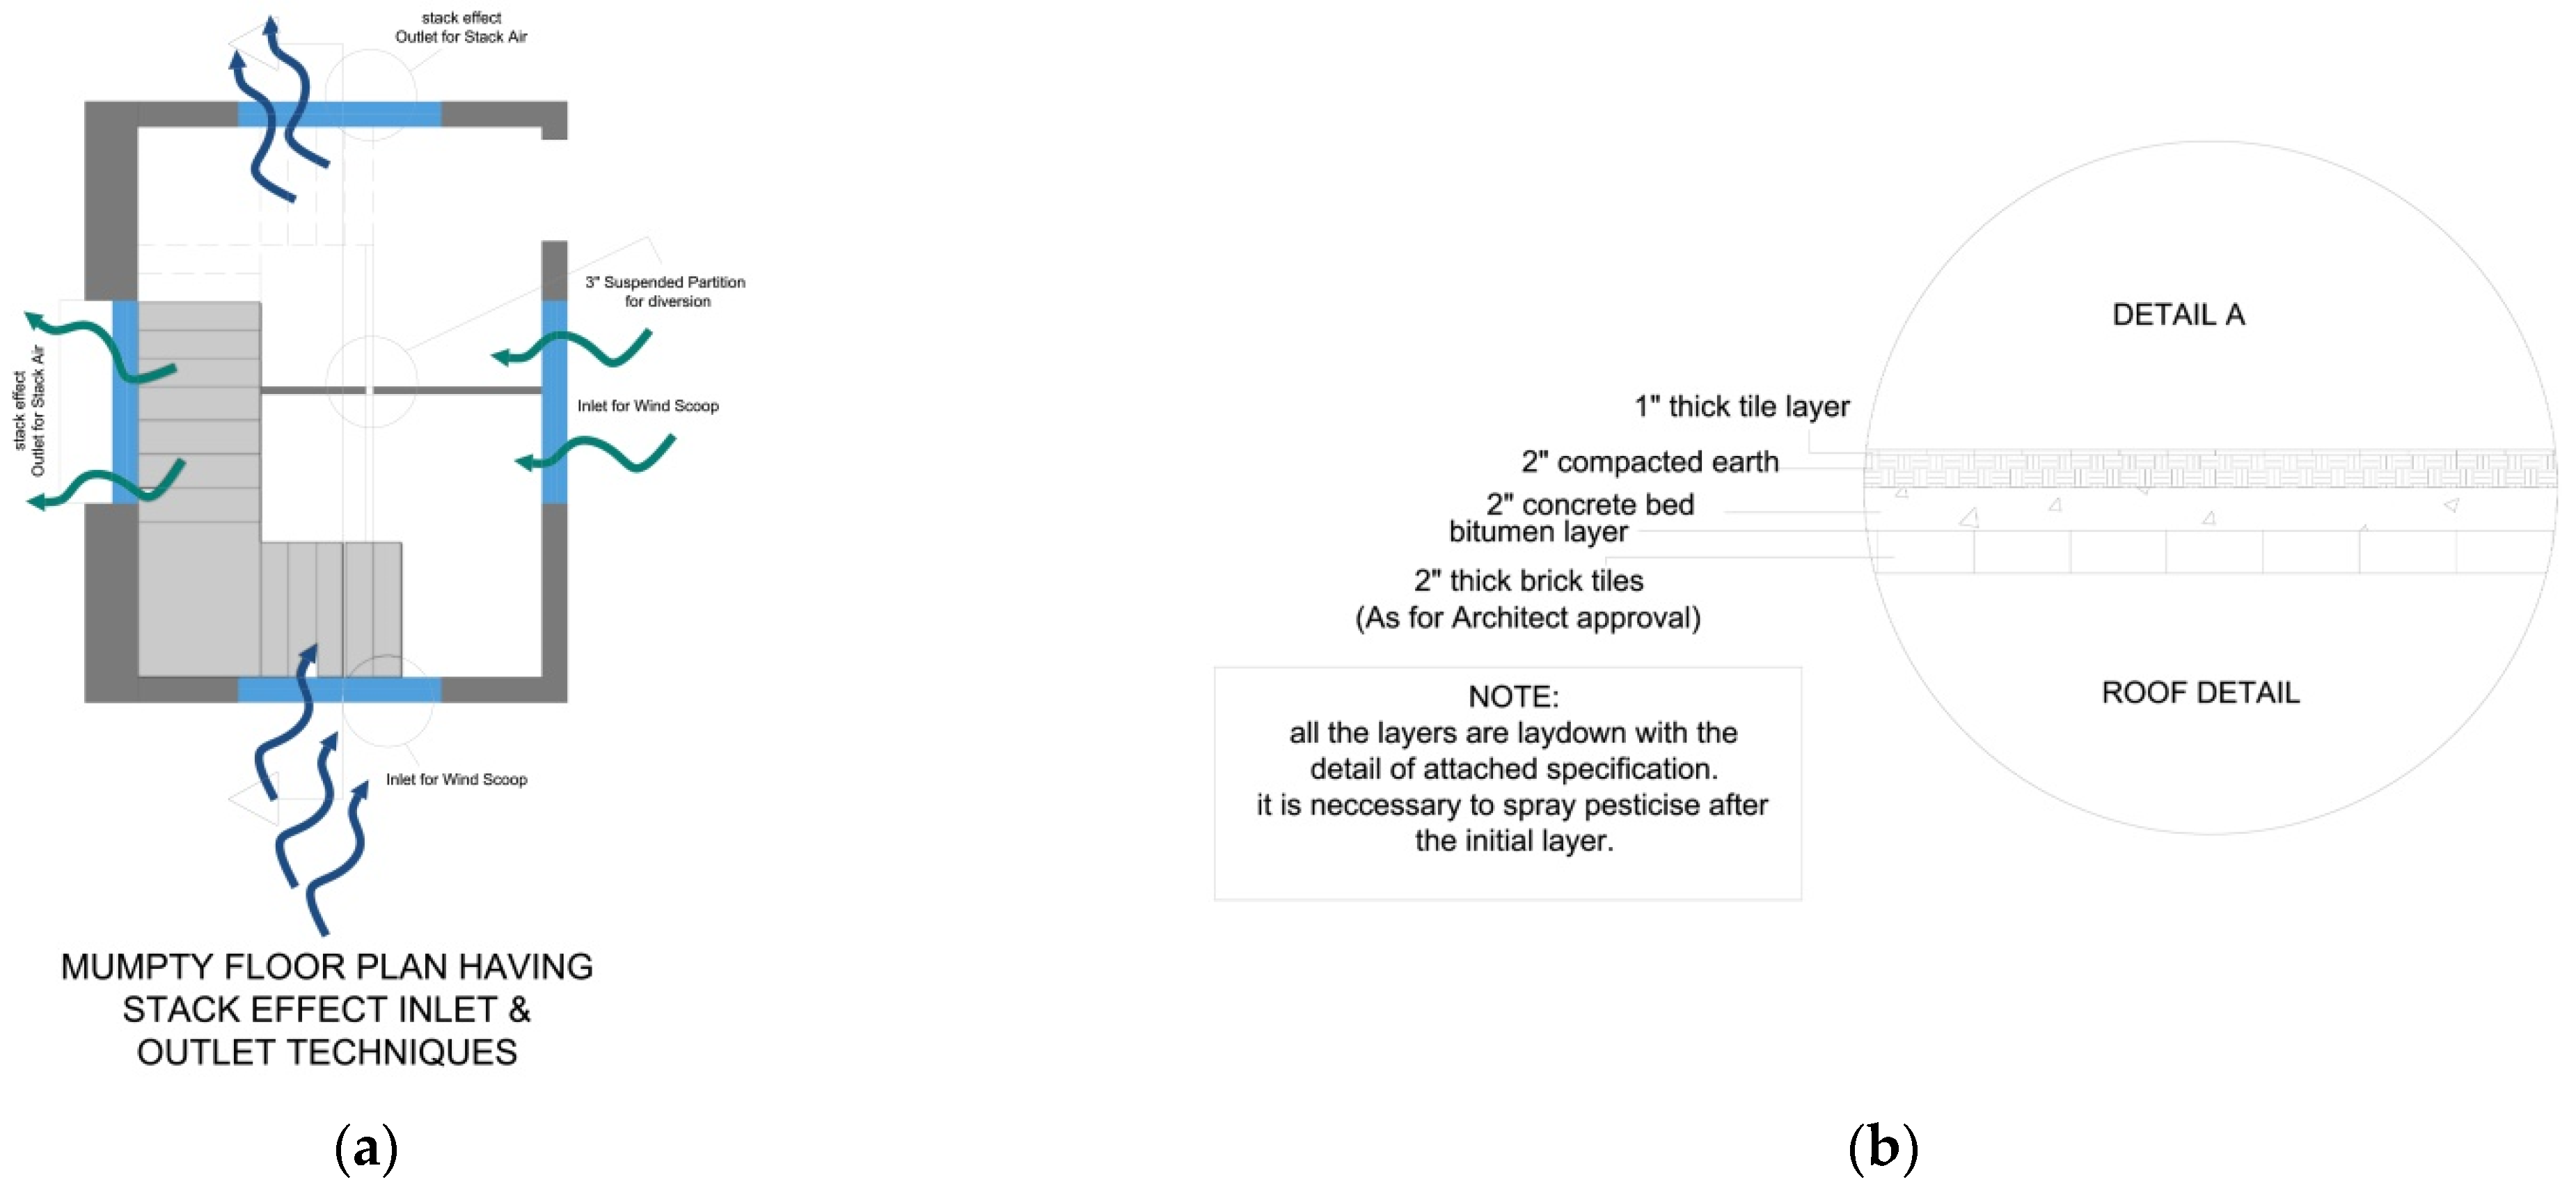
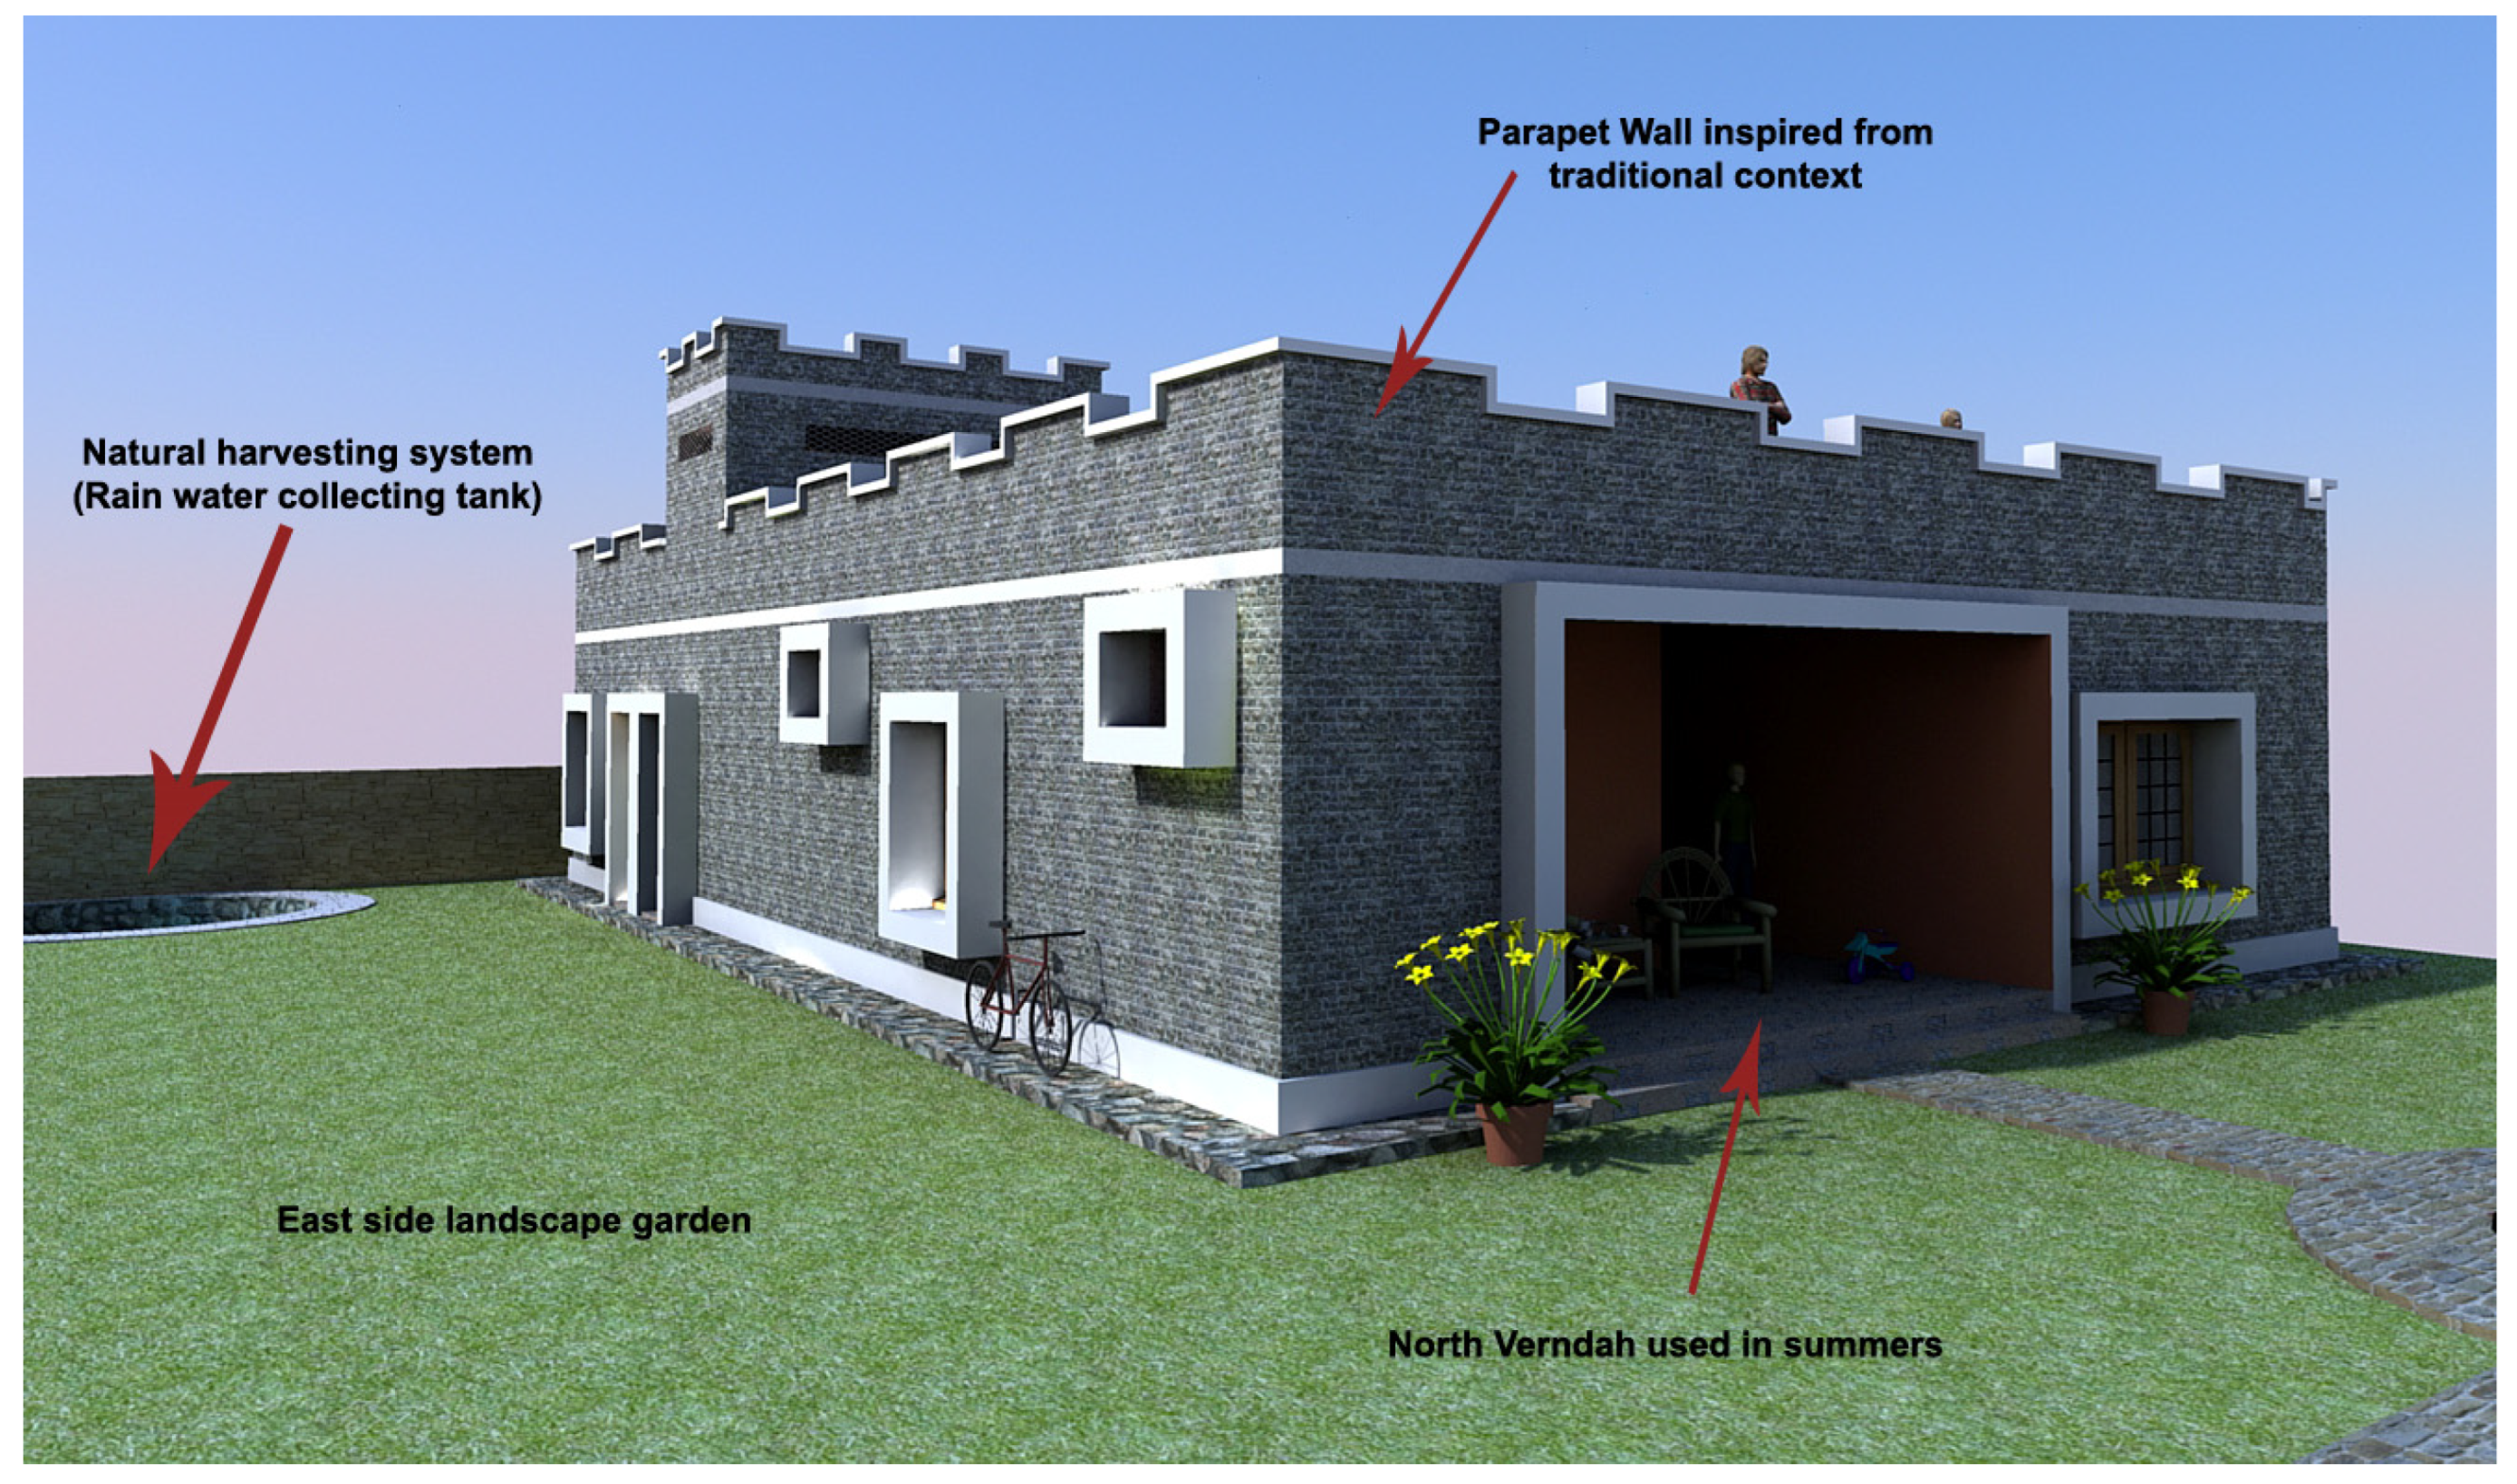
4.5.4. Membrane, Roof, and Air Flow Management

The roof is composed of steel guarders and T-iron with brick tiles; after the primary member, the roof is covered by a thick layer of mud with a 3-inch thickness; the roof is totally water-proofed by bitumen; and finally, it is covered by Chawka brick. Roofs are specially treated for summer hot solar radiation through passive techniques, as shown in Figure 7b.

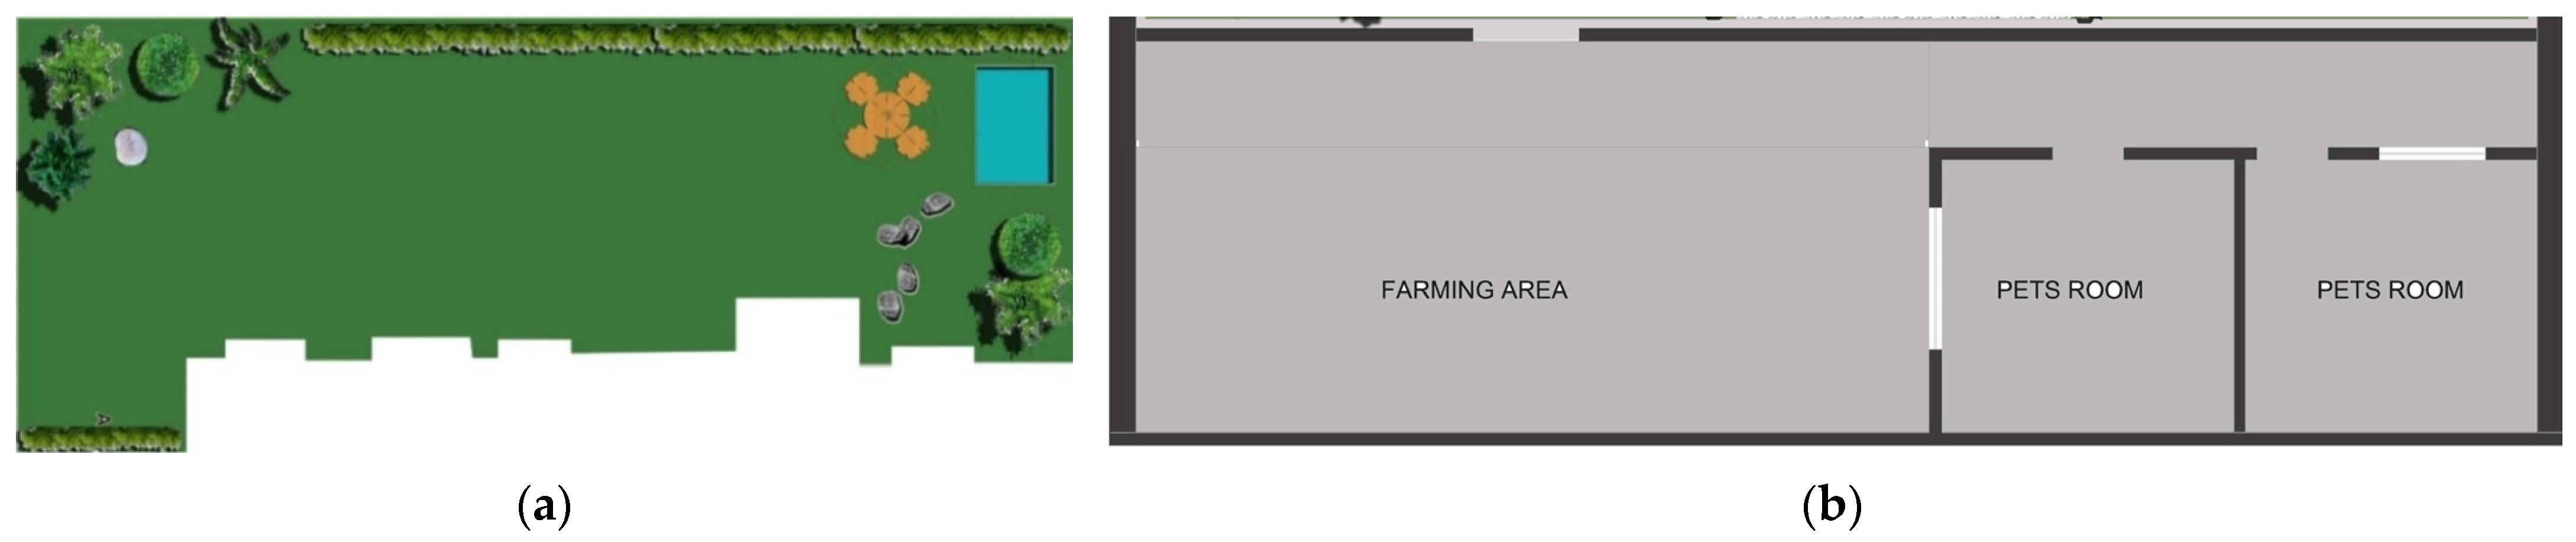
4.5.5. Landscape, Livestock, and Farming

The client has been focused on the landscape, and the landscape is mainly divided into two parts: a garden and a farming area. The garden is designed with local horticultural species. The paving is designed with local sandstone slabs. Space for livestock and poultry includes two rooms, for goats and one room for chickens, as shown in Figure 8a,b.

4.6. Energy Efficient Strategies Followed in Design

4.6.1. Primary Materials

The main materials selected for the building are wood for windows and doors, as depicted in Figure 9, and 18-inch stone masonry.

4.6.2. System/Techniques Used

The following techniques were used: Winds, inside and outside air flow, stack effect, catching/sucker windows, construction system control through material, width of exterior walls and openings, and controlling the emission of carbon and radiation through a green landscape.

4.6.3. Orientation and Rainwater Harvesting

The mass is placed according to the axis of approaching access. Most opening schedules are installed according to the flow of wind and daylight utilization. The site is in a harsh climatology, where water is not sufficient to fulfill the needs of farming and vegetation. We tried to collect the rainwater that comes from the roof to store it in a channel, which is an underground water tank. This is further used for the landscape as well as for livestock.

4.7. Three-Dimensional Views and Details

Figure 10, Figure 11 and Figure 12 offer detailed views of the house’s design and features. Figure 10 presents a 3-dimensional view showcasing all four sides, including trees, a water body, an entryway, a roof, and the wind-catching mumpty. Figure 11 focuses on the parapet, wooden porch, window air scope, and shading devices, while Figure 12 displays the building’s southwest perspective.

5. Building Energy Evaluation

5.1. Building Energy Analysis through Ecotect

In the general simulation, in accordance with the Karachi Zone 1 local context, Google SketchUp was used for 3-dimensional modeling and imported to Ecotect for energy analysis.
The building envelope serves as a crucial conduit for exchanging environmental heat both within and outside the building, significantly influencing the overall energy usage [41]. The thermal insulation characteristics of the building envelope have a direct impact on the cooling requirements in summer and heating demands in winter. The extent of heat gain indicates the room’s load level to some degree [42]. When the building envelope exhibits strong thermal insulation, there should be a noticeable temperature contrast between the interior and exterior of the building, resulting in a minimal influence of the outdoor temperature on the indoor temperature. By examining the hourly temperature pattern, envelope heat gain, and other simulation outcomes of building models, we can assess the effectiveness of the building envelope’s thermal performance and gather insights to enhance building energy efficiency.
This study conducted separate calculations for hourly temperature, hourly heat gain, hourly heat loss, annual monthly heating—cooling load, gain and loss, monthly degree days, temperature distribution, and the proportion of various types of heat gain (or loss) for the model. Additionally, we performed an evaluation of energy consumption and explored the potential for energy savings based on the analysis of these calculations. Figure 13 illustrates the hourly temperature profile of the model on the hottest day (28 May) in Kohat based on Zone 1 (Karachi), without air conditioning. Figure 14 depicts the hourly temperature profile of the model on the coldest day (January 15) in Kohat based on Zone 1, without air conditioning.

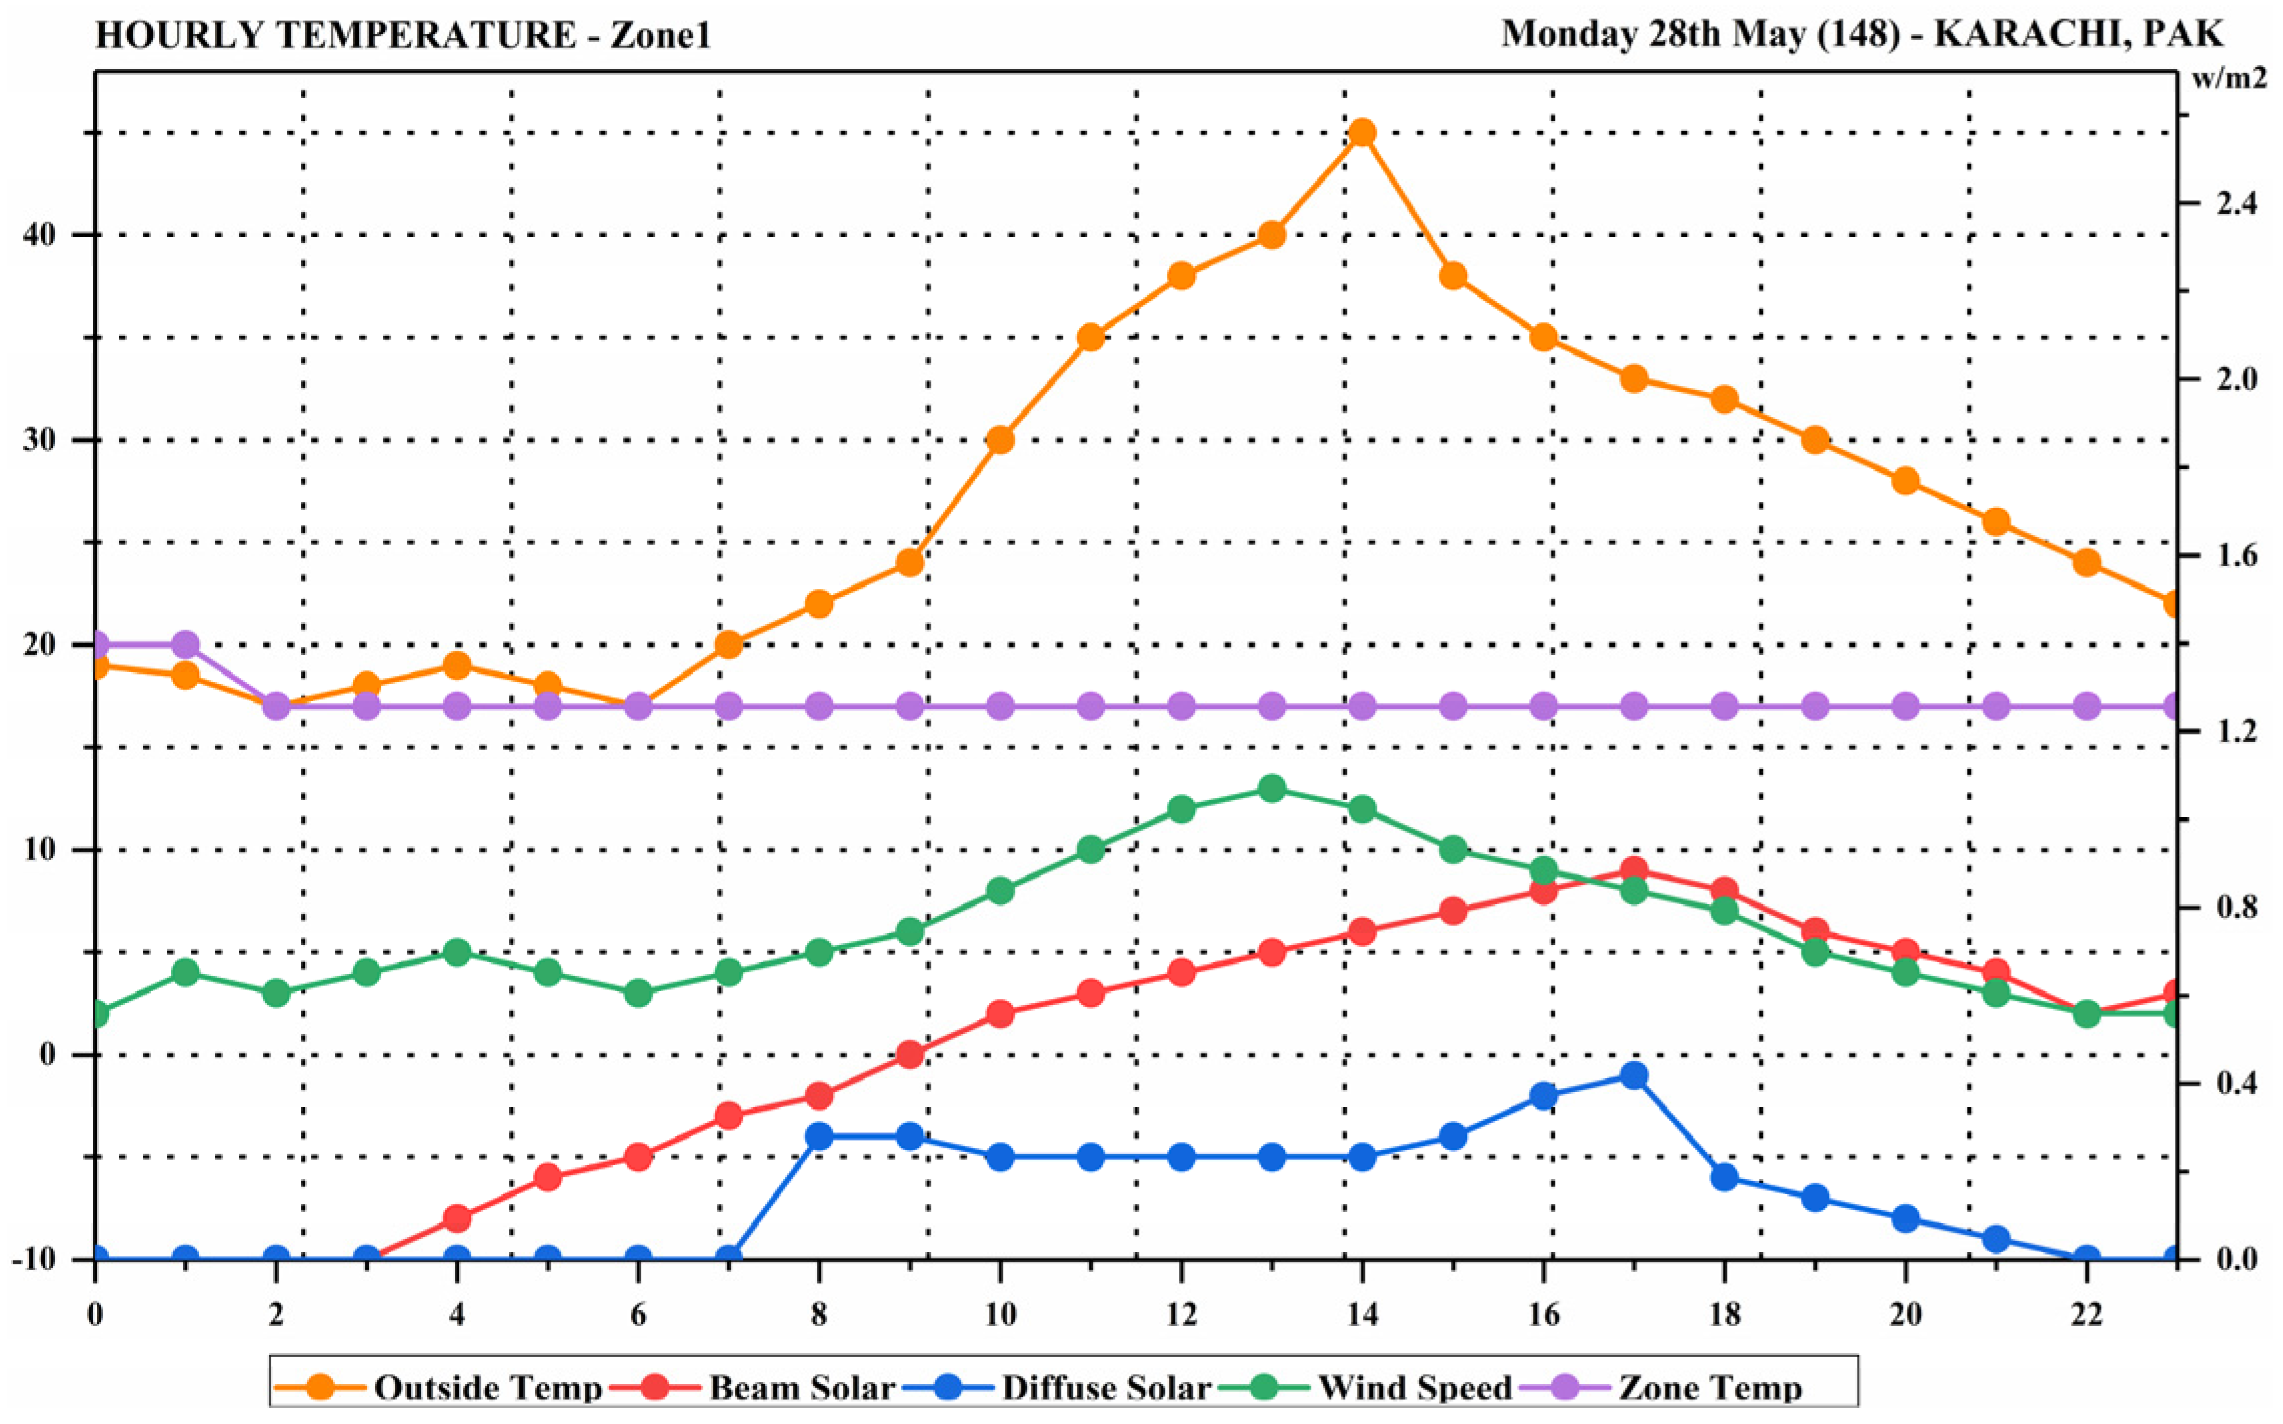
5.2. Hourly Temperature Profile of the Building on the Hottest Day Analyzed

Table 4 illustrates the hourly average temperature, while Figure 13 and Table 5 indicates the temperature of the hottest day (28 May). The simulation results show that the outside temperature from 12 p.m. to 2 p.m. was almost 40 °C and the Zone 1 temperature remained 18 °C, while the solar radiation was high from 3 p.m. to 5 p.m. and the wind speed was high from 11 a.m. to 2 p.m.
Bed room (15′ × 14′) fully air conditioned with bands 18–26 °C.

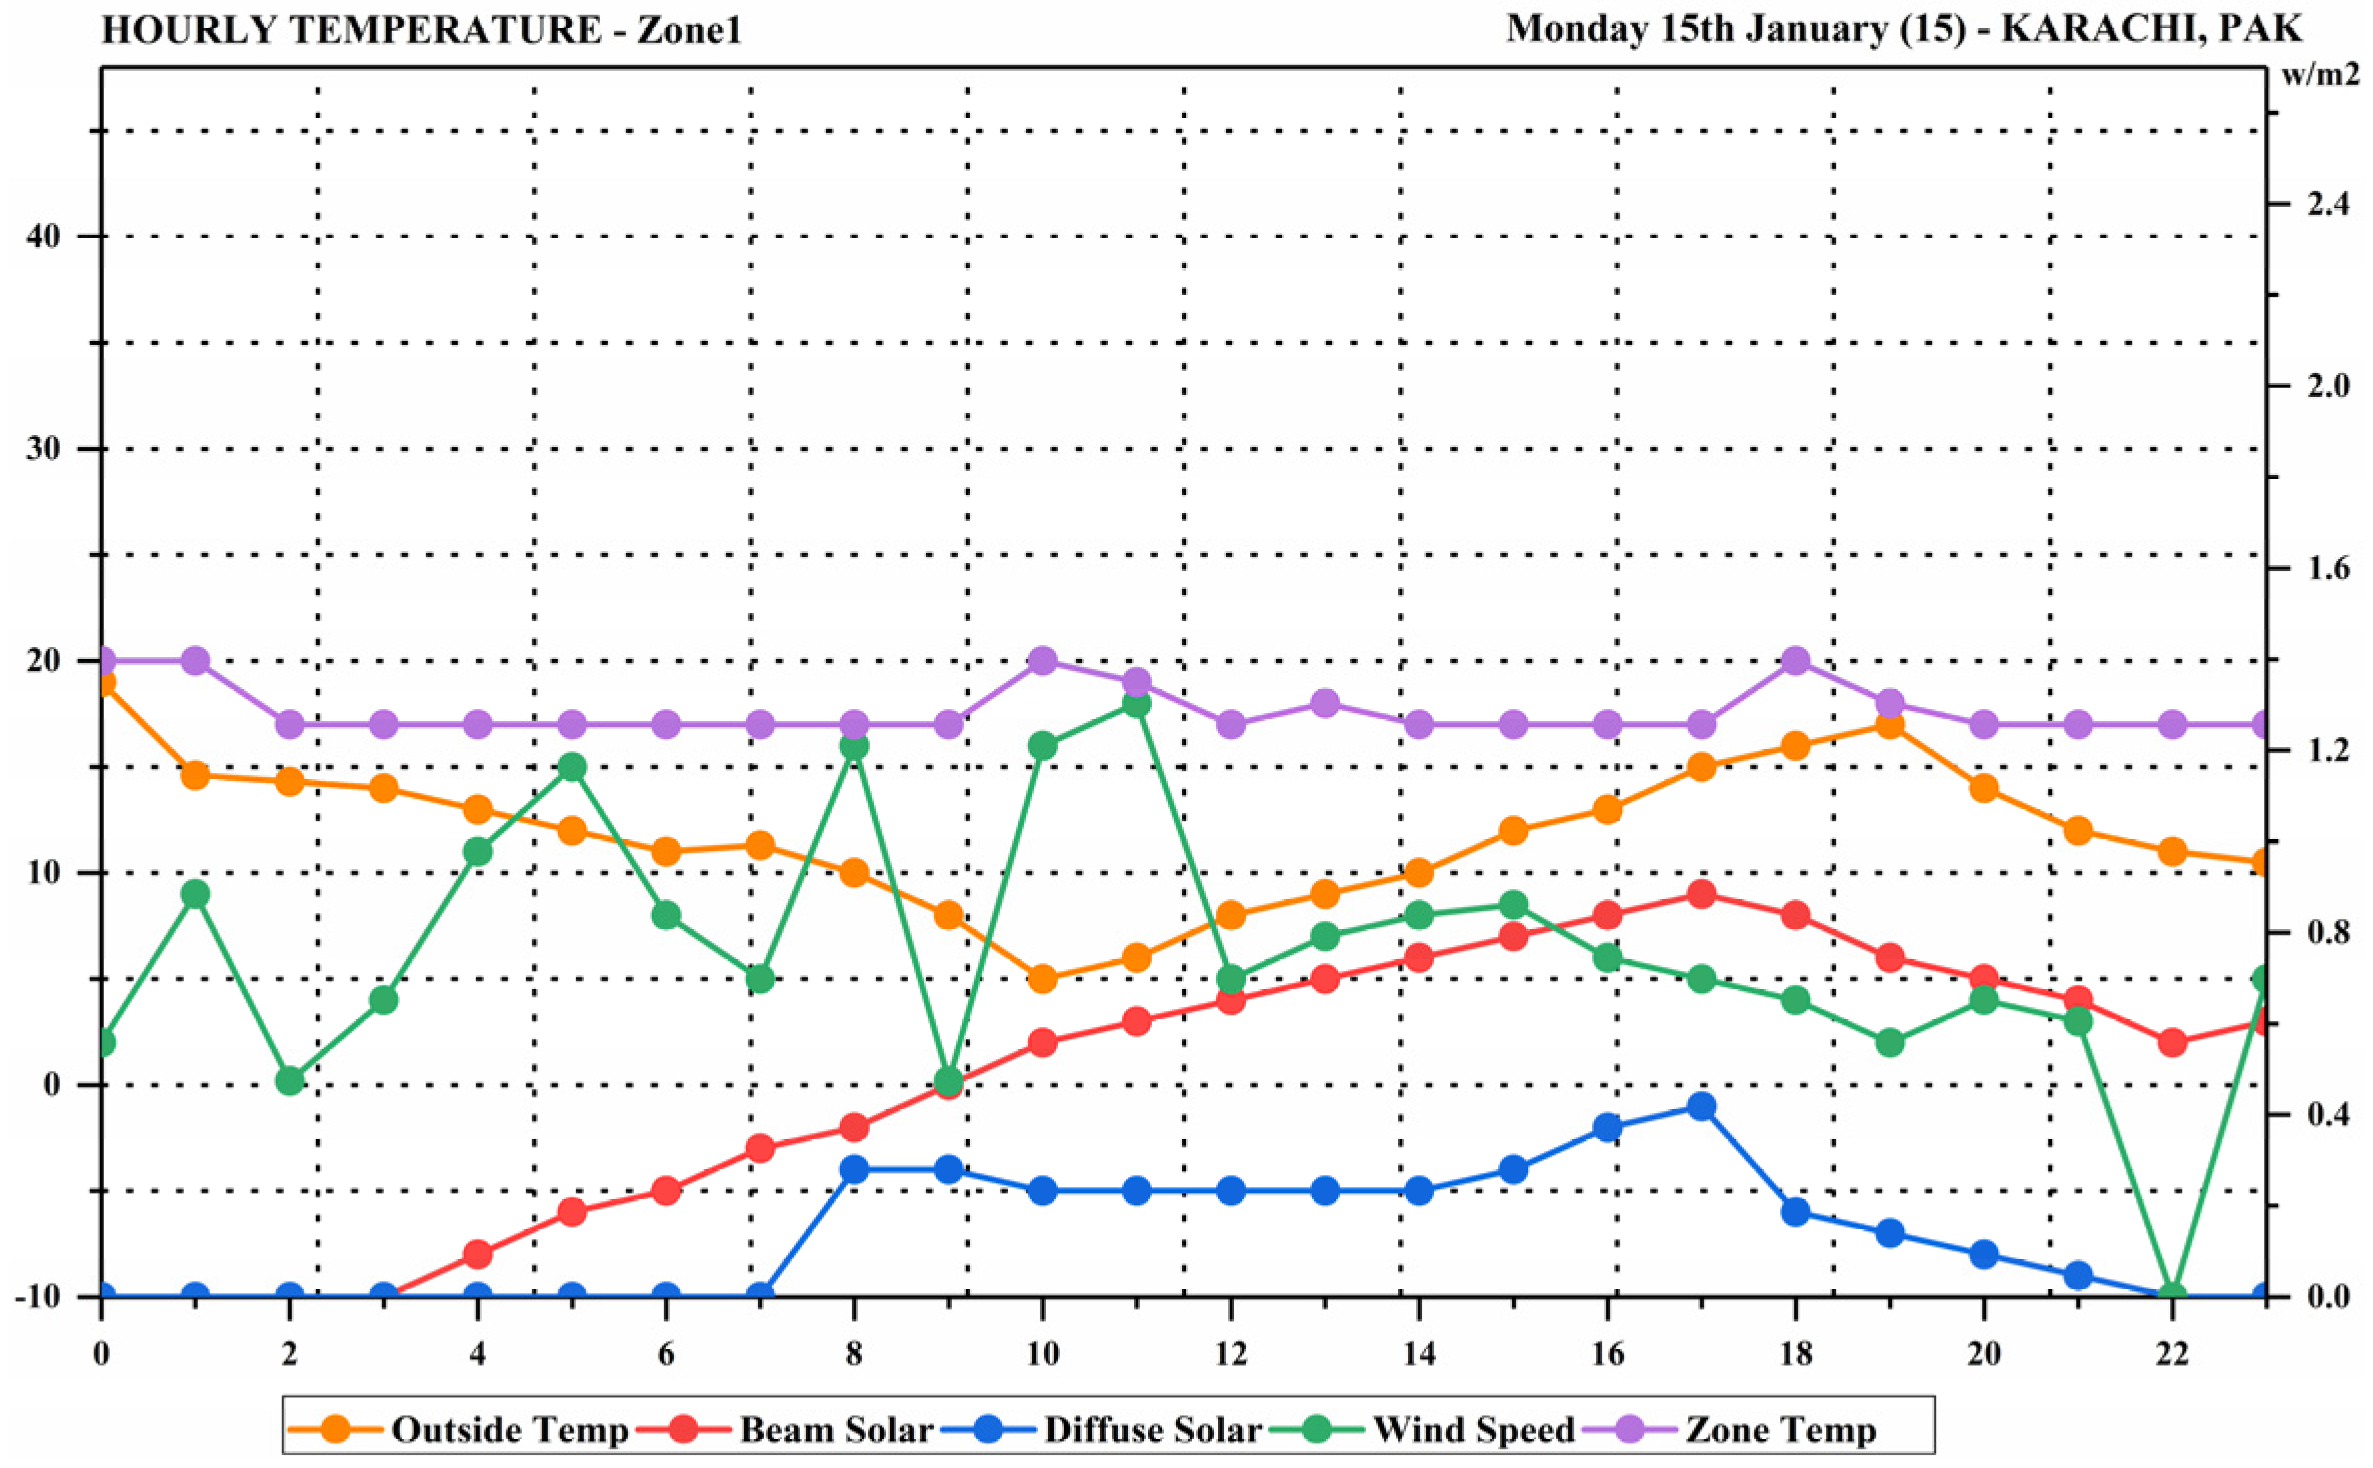
5.3. Hourly Temperature Profile of the Building on the Coldest Day Analyzed

Figure 14 and Table 6 shows the Autodesk Ecotect 2011 (Energy Simulation Software) analysis of the temperature of the coldest day (15 January). The simulation results indicate that the outside temperature at 12 p.m. was 6 °C and at 2 p.m. was 10 °C, and the zone temperature from 2 a.m. to 10 p.m. almost remained 17 °C to 18 °C, while the solar radiation and wind speed changed with time.

5.4. Hourly Gains Profile of the Building on the Hottest Day Analyzed

Figure 15 and Table 7 below indicates the hourly gains of the hottest day (28 May). The simulation results indicate that at 7 a.m., 1000 watts was consumed for HVAC, and at 8 a.m., 1100 watts was consumed for HVAC, while in the afternoon, at 12 p.m., 1200 watts was consumed for HVAC, and the internal zone remained normal.

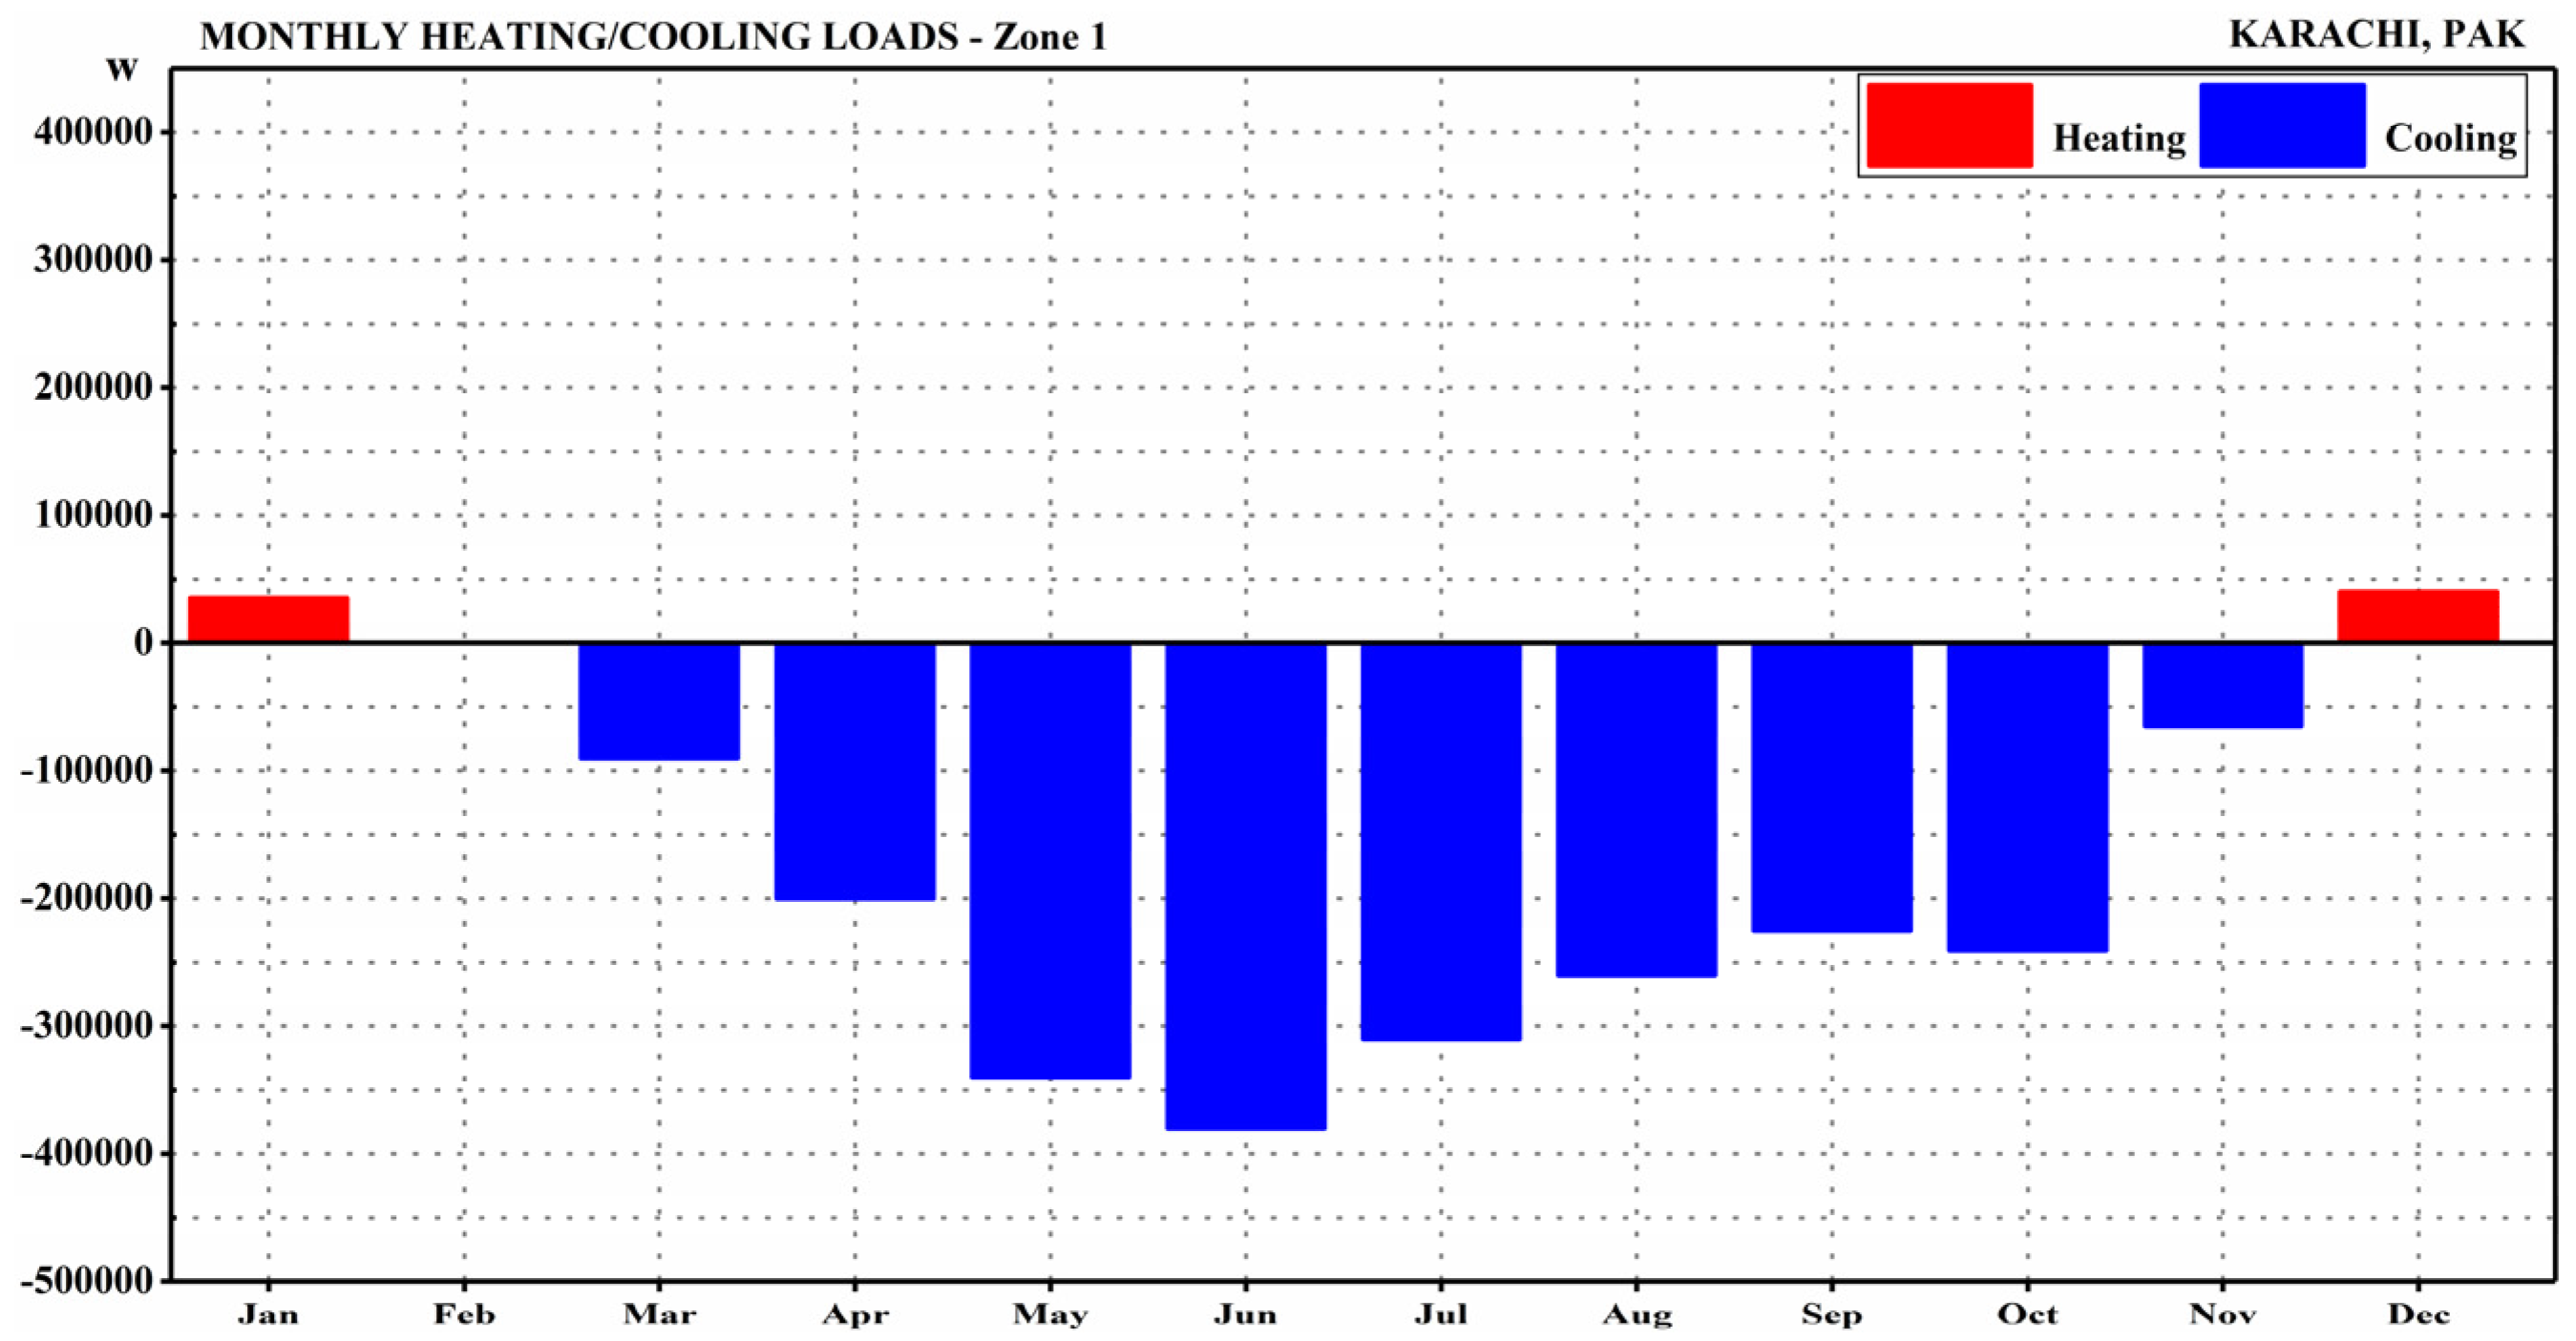
5.5. Monthly Heating–Cooling Load of the Building Analyzed

Figure 16 and Table 8 indicates the monthly energy load for heating and cooling. According to the simulation results, in January and December, the building consumed almost 40,000 watts of energy for heating purposes, while it consumed most of that energy in May, amounting to −340,000 watts, and in June, it consumed 380,000 watts for cooling purposes.

5.6. Hourly Gains Profile of the Building on the Coldest Day Analyzed

Figure 17 and Table 9 shows the hourly gains of the coldest day (15 January). The simulation results indicate that at 7 a.m., the building consumed −250 w for HVAC, and at 8 a.m. it consumed −160 w, while in the afternoon at 12 p.m. it consumed −80 w for HVAC, and the internal zone remained normal.

6. Results and Discussion

6.1. Analysis of the Hourly Temperature Profile of the Building on the Hottest Day

From the temperature profile of 28 May, which was the hottest day, the findings of the simulation indicate that while the temperature inside Zone 1 stayed much lower at 18 °C, the outside temperature peaked at about 40 °C between 12 and 2 p.m. This indicates how well the building’s materials and design worked to keep the interior environment cooler despite the high outside temperatures. Furthermore, the peak hours for wind and solar radiation were, respectively, 3 and 5 p.m. and 11 a.m. and 2 p.m. These are contributory variables that the passive design characteristics of the building effectively countered.

6.2. Analysis of the Hourly Temperature Profile of the Building on the Coldest Day

The Ecotect analysis for 15 January, the coldest day, illustrates that, by 12 p.m., the outside temperature was 6 °C, and by 2 p.m., it was 10 °C. Nonetheless, from 2 a.m. until 10 p.m., the inside temperature of the structure stayed comparatively constant, ranging from 17 °C to 18 °C. This stability suggests that the interior temperatures are successfully regulated by the building’s thermal mass and insulation, allowing for comfort without the need for significant active heating systems. Throughout the day, variations in wind and solar radiation intensity enhance the building’s resistance to outside weather changes.

6.3. Analysis of the Hourly Gains Profile of the Building on the Hottest Day

The energy gained per hour on 28 May showed that the HVAC systems used 1000 watts at 7 a.m., 1100 watts at 8 a.m., and 1200 watts at 12 p.m., according to the simulation. This slow rise corresponds with increasing outside temperatures, emphasizing the HVAC system’s function in preserving comfort within. The efficiency of the system is demonstrated by the internal zone being within acceptable thermal limitations despite the significant energy use.

6.4. Analysis of the Monthly Heating-Cooling Load of the Building

According to the data for the monthly energy load of the building for cooling and heating, January and December had a notable heating demand of 40,000 watts, which is consistent with lower outside temperatures. On the other hand, May and June had the highest cooling demand, using 340,000 and 380,000 watts, respectively. This significant energy use highlights the necessity of passive cooling techniques and efficient insulation to lessen reliance on active systems during the hottest summer months.

6.5. Analysis of the Hourly Gains Profile of the Building on the Coldest Day

On the coldest day (15 January), the hourly energy increased. The energy consumption of the HVAC system was negative; it was −250 watts at 7 a.m., improved to −160 watts at 8 a.m., and reached −80 watts by 12 p.m. This negative consumption suggests that less energy is needed for heating, most likely because of the building’s thermal mass and efficient passive heating elements. The building’s ability to sustain pleasant conditions with low energy use is further confirmed by the internal zone temperature, which remained consistent.

6.6. Analysis of Building’s Thermal Performance and Energy-Saving Measures

The thermal performance of this building’s external wall is better as compared to the houses that exist in the neighborhood. The roof is specially treated for summer hot solar radiation through passive techniques and methodology, having a 7-inch width while using local materials to resist heat absorption in summer and absorb heat rays in winter. The roof membrane is composed of steel guarders and T-iron with brick tiles. After the primary member, the roof is covered by a thick layer of mud with a 3-inch thickness and a total of 7 inches. The roof is totally water-proofed by bitumen and finally covered with Chawka local brick.
The ventilation heat gain and loss of the building is too much; we should consider reducing the air exchange frequency in summer and winter, strengthening the seal, or setting up a shelter to appropriately avoid wind at the entrance appropriately. The systems and techniques used to control the indoor environment are the stack effect, catch/sucker windows, construction system control through material, 18-inch width of exterior walls and openings, controlling the emission of carbon and radiation through the green landscape, and wind scope, and the inlet and outlet of the stack effect is achieved through the mumpty for air flow.
Technically, windows have been considered a primary source of light and ventilation. The size and placement of windows are measured as per the requirements of daylight, privacy factors, and ventilation. The shape is rectangular as per the local style and surrounded by horizontal and vertical shading devices. The glass is placed on the inner side to defuse light and avoid glare and radiation, convection of direct light, and reflection. Further, to provide pleasant, ventilated environments, the windows act as a scope to catch the outside breeze passing through trees. Changes have been simultaneously made in the design in Ecotect to improve the design, minimize its energy requirement, and reduce carbon emissions.
The effectiveness of the building’s design is demonstrated by the investigation of temperature profiles, energy consumption on the hottest and coldest days, and monthly heating and cooling loads, as discussed above. The building uses passive design techniques and materials that are produced locally to keep internal temperatures constant while using less energy. Ecotect simulations confirm that energy-efficient, sustainable results can be obtained by combining conventional techniques with contemporary equipment. Subsequent research endeavors will try to refine these strategies and investigate novel materials to improve energy efficiency under varied climatic conditions.

7. Conclusions

This study conducted a detailed energy analysis on a custom-designed residential house, representing a traditional building, using Building Information Modeling (BIM), specifically Ecotect. This method enabled the evaluation of the building’s energy requirements, load, and consumption, with the goal of proposing energy-saving measures. The results confirmed that this objective was met successfully.
The model house was constructed using locally sourced materials, predominantly stone, and traditional construction techniques. This choice resulted in low carbon emissions and facilitated passive cooling and heating systems. The design was meticulously tailored to respond to the local climate and environmental conditions, avoiding high-tech solutions and relying on proven traditional methods. By prioritizing user needs and climatic sensitivities, the study demonstrated that the selection of indigenous materials was crucial for achieving green and energy-efficient outcomes. The BIM (Ecotect) simulations and analysis verified that the building met the desired benchmarks for minimizing energy load and consumption.
The research identified four major sustainable and indigenous techniques to enhance energy efficiency and sustainability:
  • Solar energy: Utilizing photovoltaic (PV) panels to harness solar energy.
  • Rainwater harvesting: Implementing channels throughout the roof to collect rainwater.
  • Biogas production: Using cattle waste to produce and assemble a biogas plant.
  • Integration of indigenous practices and digital strategies: Combining traditional methods with modern digital tools to enable the house to produce its own energy and reduce its carbon footprint.
Future work will involve a detailed carbon evaluation using BIM simulation and advanced digital strategies to further integrate these indigenous techniques. This approach aims to advance sustainable building practices in challenging environments, ensure practicality and acceptance in similar regions, and promote a comprehensive model for sustainable living.

Author Contributions

Data curation, H.U., H.Y., I.A. and M.C.; Writing—original draft, H.U.; Writing—review and editing, H.Z. and H.U.; All authors have read and agreed to the published version of the manuscript.

Funding

This research was funded by National Key R&D Program of China (2022YFC3803804 in 2022YFC3803800).

Institutional Review Board Statement

Not applicable.

Informed Consent Statement

Not applicable.

Data Availability Statement

The dataset is available on request from the authors.

Conflicts of Interest

Author Meng Cong was employed by the company Architects Engineers Co., Ltd. of Southeast University. The remaining authors declare that the research was conducted in the absence of any commercial or financial relationships that could be construed as a potential conflict of interest.

References

  1. Khoza, S. Department of Environmental Affairs Investigating the Potential Use of Public Private Partnerships to Fund Green Building Initiatives: The Case of the Department of Environmental Affairs. Ph.D. Thesis, Stellenbosch University, Stellenbosch, South Africa, 2021. [Google Scholar]
  2. Videras Rodríguez, M.; Sánchez Cordero, A.; Gómez Melgar, S.; Andújar Márquez, J.M. Impact of global warming in subtropical climate buildings: Future trends and mitigation strategies. Energies 2020, 13, 6188. [Google Scholar] [CrossRef]
  3. IEA. 2022. Available online: https://www.iea.org/topics/buildings (accessed on 23 January 2023).
  4. Azam, U.; Farooq, M.; Munir, M.A.; Riaz, F.; Sultan, M.; Rehman, A.U.; Imran, M. Modelling Framework for Reducing Energy Loads to Achieve Net-Zero Energy Building in Semi-Arid Climate: A Case Study. Buildings 2023, 13, 2695. [Google Scholar] [CrossRef]
  5. Mosly, I. Barriers to the diffusion and adoption of green buildings in Saudi Arabia. J. Mgmt. Sustain. 2015, 5, 104. [Google Scholar] [CrossRef]
  6. Hoornweg, D.; Pope, K. Population predictions for the world’s largest cities in the 21st century. Environ. Urban. 2017, 29, 195–216. [Google Scholar] [CrossRef]
  7. Eerikäinen, H.; Sarasoja, A.L. Marketing green buildings–well-structured process or forgotten minor detail? Evidence from Finland. Prop. Manag. 2013, 31, 233–245. [Google Scholar]
  8. Ying Liu, J.; Pheng Low, S.; He, X. Green practices in the Chinese building industry: Drivers and impediments. J. Technol. Manag. China 2012, 7, 50–63. [Google Scholar] [CrossRef]
  9. Sun, M.; Xue, Y.; Wang, L. Research on Optimized Design of Rural Housing in Cold Regions Based on Parametrization and Machine Learning. Sustainability 2024, 16, 667. [Google Scholar] [CrossRef]
  10. Ullah, H.; Zhang, H.; Huang, B.; Gong, Y. BIM-Based Digital Construction Strategies to Evaluate Carbon Emissions in Green Prefabricated Buildings. Buildings 2024, 14, 1689. [Google Scholar] [CrossRef]
  11. Watson, R.T.; Boudreau, M.C.; Chen, A.; Huber, M. Green IS: Building sustainable business practices. Inf. Syst. 2008, 17, 17. [Google Scholar]
  12. Deng, Q.; Zhang, S.; Shan, M.; Li, J. Research on Envelope Thermal Performance of Ultra-Low Energy Rural Residential Buildings in China. Sustainability 2023, 15, 6931. [Google Scholar] [CrossRef]
  13. Tulevech, S.M.; Hage, D.J.; Jorgensen, S.K.; Guensler, C.L.; Himmler, R.; Gheewala, S.H. Life cycle assessment: A multi-scenario case study of a low-energy industrial building in Thailand. Energy Build. 2018, 168, 191–200. [Google Scholar] [CrossRef]
  14. Jiang, R.; Jin, C.; Wang, H. Research on Energy Conservation and Emission-Reduction Effects of Green Finance: Evidence from China. Sustainability 2024, 16, 3257. [Google Scholar] [CrossRef]
  15. Irfan, M.; Abas, N.; Saleem, M.S. Thermal performance analysis of net zero energy home for subzero temperature areas. Case Stud. Therm. Eng. 2018, 12, 789–796. [Google Scholar] [CrossRef]
  16. Xiao, Z.; Li, H.; Jiang, H.; Li, Y.; Alazab, M.; Zhu, Y.; Dustdar, S. Predicting Urban Region Heat via Learning Arrive-Stay-Leave Behaviors of Private Cars. IEEE Trans. Intell. Transp. Syst. 2023, 24, 10843–10856. [Google Scholar] [CrossRef]
  17. Cai, T.; Dong, M.; Chen, K.; Gong, T. Methods of participating power spot market bidding and settlement for renewable energy systems. Energy Rep. 2022, 8, 7764–7772. [Google Scholar] [CrossRef]
  18. Jiang, J.; Zhang, L.; Wen, X.; Valipour, E.; Nojavan, S. Risk-based performance of power-to-gas storage technology integrated with energy hub system regarding downside risk constrained approach. Int. J. Hydrogen Energy 2022, 47, 39429–39442. [Google Scholar] [CrossRef]
  19. Walker, B.; Salt, D. Resilience Practice: Building Capacity to Absorb Disturbance and Maintain Function; Island Press: Washington, DC, USA, 2012. [Google Scholar]
  20. World Green Building Council. The Business Case for Green Building: A Review of the Costs and Benefits for Developers, Investors and Occupants; WGBC: Washington, DC, USA, 2013. [Google Scholar]
  21. Kibert, C.J. Sustaination: Green Building Design and Delivery, 3rd ed.; John Wiley and Sons, Inc.: Hoboken, NJ, USA, 2012. [Google Scholar]
  22. Mahmoudi Saber, E.; Mast, M.; Tham, K.W.; Leibundgut, H. Numerical Modelling of an Indoor Space Conditioned with Low Exergy Cooling Technologies in the Tropics. In Proceedings of the 13th International Conference on Indoor Air Quality and Climate, Hong Kong, 6–12 July 2014; London South Bank University: London, UK, 2014. [Google Scholar]
  23. Zalejska-Jonsson, A. In the Business of Building Green: The Value of Low-Energy Residential Buildings from Customer and Developer Perspectives. Ph.D. Thesis, KTH Royal Institute of Technology, Stockholm, Sweden, 2013. [Google Scholar]
  24. Darko, A.; Chan, A.P. Critical analysis of green building research trend in construction journals. Habitat Int. 2016, 57, 53–63. [Google Scholar] [CrossRef]
  25. Roychowdhury, D.; Murthy, R.V.; Jose, P.D. Facilitating Green Building Adoption—An Optimization Based Decision Support Tool. SSRN Electron. J. 2015, 485. [Google Scholar] [CrossRef]
  26. Darko, A.; Zhang, C.; Chan, A.P. Drivers for Green buildings: A review of empirical studies. Habitat Int. 2017, 60, 34–49. [Google Scholar] [CrossRef]
  27. Samari, M.; Godrati, N.; Esmaeilifar, R.; Olfat, P.; Shafiei MW, M. The investigation of the barriers in developing green building in Malaysia. Mod. Appl. Sci. 2013, 7, 1. [Google Scholar] [CrossRef]
  28. Shafii, F.; Othman, M.Z. Sustainable Building and Construction in South-East Asia. In Proceedings of the Conference on Sustainable Building South-East Asia, Kuala Lumpur, Malaysia, 11–13 April 2005; pp. 11–13. [Google Scholar]
  29. Kulshreshtha, K.; Bajpai, N.; Tripathi, V.; Sharma, G. Consumer preference for eco-friendly appliances in trade-off: A conjoint analysis approach. Int. J. Prod. Dev. 2019, 23, 212–243. [Google Scholar] [CrossRef]
  30. Darko, A.; Chan, A.P. Review of barriers to green building adoption. Sustain. Dev. 2017, 25, 167–179. [Google Scholar] [CrossRef]
  31. Zhang, X.; Shen, L.; Wu, Y. Green strategy for gaining competitive advantage in housing development: A China study. J. Clean. Prod. 2011, 19, 157–167. [Google Scholar] [CrossRef]
  32. Aghdam, K.A.; Rad, A.F.; Shakeri, H.; Sardroud, J.M. Approaching green buildings using eco-efficient construction materials: A review of the state-of-the-art. J. Constr. Eng. Proj. Manag. 2018, 8, 1–23. [Google Scholar]
  33. Wei, W.; Ramalho, O.; Mandin, C. Indoor air quality requirements in green building certifications. Build. Environ. 2015, 92, 10–19. [Google Scholar] [CrossRef]
  34. Hopkins, G.; Goodwin, C. Living Architecture: Green Roofs and Walls; Csiro Publishing: Clayton, VIC, Australia, 2011. [Google Scholar]
  35. Schröpfer, T. Dense+ Green: Innovative Building Types for Sustainable Urban Architecture; Birkhäuser: Basel, Switzerland, 2015. [Google Scholar]
  36. United States Green Building Council. Green Building Facts. Available online: http://www.usgbc.org/DisplayPage.aspx?CMSPageID=1718 (accessed on 9 March 2008).
  37. Spiegel, R.; Meadows, D. Green Building Materials: A Guide to Product Selection and Specification; John Wiley & Sons: Hoboken, NJ, USA, 2010. [Google Scholar]
  38. Schroeder, H. Sustainable Building with Earth; Springer: Cham, Switzerland, 2016; Volume 582. [Google Scholar]
  39. Castañeda, K.; Sánchez, O.; Herrera, R.F.; Mejía, G. Highway Planning Trends: A Bibliometric Analysis. Sustainability 2022, 14, 5544. [Google Scholar] [CrossRef]
  40. Adnan, M.; Hussain, J.; Tahir Shah, M.; Shinwari, Z.K.; Ullah, F.; Bahader, A.; Khan, N.; Latif Khan, A.; Watanabe, T. Proximate and nutrient composition of medicinal plants of humid and sub-humid regions in North-west Pakistan. J. Med. Plants Res. 2010, 4, 339–345. [Google Scholar]
  41. Wang, Q.K.; Wan, C. Analysis on the influence of building envelope to public buildings’ energy consumption. J. Wuhan Univ. Technol. 2011, 33, 112–115. [Google Scholar]
  42. Li, H.M.; Zhu, J. Energy audit and energy saving strategy of the existing building in college and university. Build Energy Sav. 2012, 40, 71–73. [Google Scholar]
Figure 1. Methodological flow chart framework for building design and energy evaluation.
Sustainability 16 06057 g001
Figure 2. (a) Site plan and analysis; (b) solar path and climate graph.
Sustainability 16 06057 g002
Figure 3. (a,b) The development process highlights wind movement and ventilation studies a long with wind directions.
Sustainability 16 06057 g003
Figure 4. Ground floor plan highlighting spatial relationships and solid-voids.
Sustainability 16 06057 g004
Figure 5. Section at A-A’ highlighting the wind direction and technique used in the mumpty.
Sustainability 16 06057 g005
Figure 6. Typical section of a wall, highlighting the masonry work and details.
Sustainability 16 06057 g006
Figure 7. (a) Mumpty floor plan, highlighting the wind scope and inlet and outlet of the stack effect; (b) typical section of a roof having slab details.
Sustainability 16 06057 g007
Figure 8. (a) Landscape features and open space; (b) floor plan for livestock and farming.
Sustainability 16 06057 g008
Figure 9. (a,b) Primary material highlighting the sedimentary stones.
Sustainability 16 06057 g009
Figure 10. View highlighting neighborhood, context, and rainwater harvesting storage.
Sustainability 16 06057 g010
Figure 11. View highlighting the shading devices and air flow of the building through the scoop.
Sustainability 16 06057 g011
Figure 12. View highlighting the traditional inspired parapet wall and open space through the north.
Sustainability 16 06057 g012
Figure 13. Hourly temperature graph on Monday, 28 May, Zone−1, at the hottest day, analyzed through Ecotect.
Sustainability 16 06057 g013
Figure 14. Hourly temperature graph on Monday, 15 January, Zone−1 at the coldest day, analyzed through Ecotect.
Sustainability 16 06057 g014
Figure 15. Hourly gains profile graph of the building on 28 May hottest day at Zone−1 analyzed.
Sustainability 16 06057 g015
Figure 16. Monthly heating and cooling load of the building graph at Zone–1 analyzed.
Sustainability 16 06057 g016
Figure 17. Hourly gains profile graph of the building on 15 January, coldest day in Zone–1, analyzed.
Sustainability 16 06057 g017
Table 1. Common materials used to make a building energy efficient.
S. NoTypeCharacteristics
1WoodSustainably sourced timber and engineered wood products like cross-laminated timber (CLT) are popular choices due to their renewable nature.
2BambooA rapidly renewable resource, bamboo is strong, lightweight, and can be used in various construction applications.
3Recycled SteelUsing recycled steel reduces the demand for new steel production, which has a significant environmental impact.
4Recycled ConcreteIncorporating recycled concrete aggregates helps divert waste from landfills and reduces the need for new concrete production.
5Rammed EarthA technique where natural raw materials like earth, chalk, lime, or gravel are compacted to form walls.
6Straw BalesUsed for insulation and can be an excellent natural insulating material.
7Recycled Glass and
Recycled Plastic
Used in the production of glass countertops, tiles, and architectural elements. Some prefabricated materials incorporate recycled plastics, which helps reduce plastic waste.
8Sustainable Insulation MaterialsThese can include materials like sheep’s wool, cotton, or recycled denim.
9Green RoofsVegetative layers on the roof provide insulation, reduce storm water runoff, and improve air quality.
10Solar Panels and Photovoltaic CellsThese are integrated into the structure to generate renewable energy.
11Energy-Efficient Windows and DoorsThese are designed to minimize heat loss and gain.
12Rainwater Harvesting SystemsCollecting and reusing rainwater for non-potable uses.
Source: [21].
Table 2. Project Details.
S. NoTypeDetail
1Project LocationDistrict Kohat, Pakistan
2ContextResidential,
Sub-urban area
3Climatic
Zone
Arid zone (hot)
Zone 4
4Building typeResidential
5No of Users1 master bed room
+ 2 bed rooms having attached bath rooms, kitchen–dining + porch
6Project AreaSite Area
8900 Sq-ft
Covered
2878 Sq-ft
Open
6022 Sq-ft
7Techniques and methodologyEnergy efficient, sustainable and passive environmental control system.
8Building Materials:Sedimentary stone, mortar (sand and cement), T-iron, and Chawka brickwork with clay used in the roof.
9Client/User RequirementThe client, a civil engineer with over 20 years of experience in Doha, Qatar, prioritized sustainable and energy-efficient techniques. Inspired by villas utilizing passive means, he demanded a design reflecting local and indigenous styles. His vision included sustainable living, incorporating farming, livestock, and extensive landscaping within the house.
10OtherThe plot area is covered with an outside landscape, including for livestock (chickens and pigeons). Open areas include landscape features, use, and farming.
Table 3. Site details.
S. NoTypeDetails
1AccessibilityThe site is connected from two sides and 22 feet wide. The road on the south and east sides of the site and the main 30-foot-wide road are connected on the eastern side.
2Shape and Area
of Site
Rectangular and plain.
3Availability
of Services
All the major utilities are available along the adjacent road to the site. Sewerage and water supply lines. Gas and electricity are available at adequate capacity.
4TopographyThe site is plain, having no contours.
5OrientationThe north is at a 30-degree angle to the site. The sun’s path is east toward west through south. Wind direction: summer wind west to east, and winter wind north towards south.
6ContextWith reference to the context of the proposed area, there are residential buildings on three sides of the site, and one side is open.
Table 4. Average Temperature on Monday, 28 May (hottest day).
S. NoZone 1
1Avg. Temperature31.2 °C (Ground 26.2 °C)
2Total Surface Area69.079 m2 (351.9% flr area).
3Total Exposed Area46.660 m2 (237.7% flr area).
4Total South Window0.000 m2 (0.0% flr area).
5Total Window Area4.181 m2 (21.3% flr area).
6Total Conductance (AU)85 W/°K
7Total Admittance (AY) 364 W/°K
8Response Factor3.95
Table 5. Hourly temperatures dated Monday, 28 May (hottest day).
S. NoHourInsideOutsideTemperature Difference
102628−2
212627−1
322627−1
432627−1
5426260
6526260
762627−1
872628−2
982630−4
1092632−6
11102636−10
12112637−11
13122644−18
14132639−13
15142640−14
16152639−13
17162638.5−12.5
18172636.7−10.7
19182635−9
20192631−5
21202631−5
22212630−4
23222630.5−4.5
24232629−3
Table 6. Hourly temperatures dated Monday, 15 January (coldest day).
S. NoZone 1
1Avg. Temperature16.6 °C (Ground 26.2 °C)
2Total Surface Area69.079 m2 (351.9% flr area).
3Total Exposed Area46.660 m2 (237.7% flr area).
4Total South Window0.000 m2 (0.0% flr area).
5Total Window Area4.181 m2 (21.3% flr area).
6Total Conductance (AU)85 W/°K
7Total Admittance (AY) 364 W/°K
8Response Factor3.95
Table 7. Hourly gain dated Monday, 28 May (hottest).
S. NoHourInsideOutsideTemperature Difference
1018153
2118153
3218144
4318135
541811.56.5
6518126
7618117
87186.111.9
9818135
10918144
11101814.53.5
121118162
131218171
14131817.50.5
151418180
161518180
17161817.50.5
181718171
191818162
201918153
212018144
222118126
232218117
242318117
Table 8. Monthly heating–cooling load.
S. NoZone 1
1OperationWeekdays 00–24, Weekends 00–24
2Thermostat Settings18.0–26.0 °C
3Max Heating666 W at 07:00 on 15 January
4Max Cooling1293 W at 15:00 on 3 June
Table 9. Hourly gains Monday, 15 January.
S. NoHourHVAC
(Wh)
FABRIC
(Wh)
SOLAR
(Wh)
VENT
(Wh)
INTERN
(Wh)
ZONAL
(Wh)
10325161065980
21269140031980
32262134030980
43242115029980
541767800980
651434500980
7618859031980
8724783065980
983431110134980
1094501560196980
11106742620314980
12117763100368980
131211204840537980
14139694290442980
151411124930521980
161510364810456980
171610765690409980
18179164640354980
19188444450301980
20196163550163980
21205983500149980
22215603330128980
23225373240115980
2423474289087980
Total-13,95166700492523560
Disclaimer/Publisher’s Note: The statements, opinions and data contained in all publications are solely those of the individual author(s) and contributor(s) and not of MDPI and/or the editor(s). MDPI and/or the editor(s) disclaim responsibility for any injury to people or property resulting from any ideas, methods, instructions or products referred to in the content.

