
Hyperspectral Image Analysis and Machine Learning Techniques for Crop Disease Detection and Identification: A Review
 , , and
Abstract
:1. Introduction
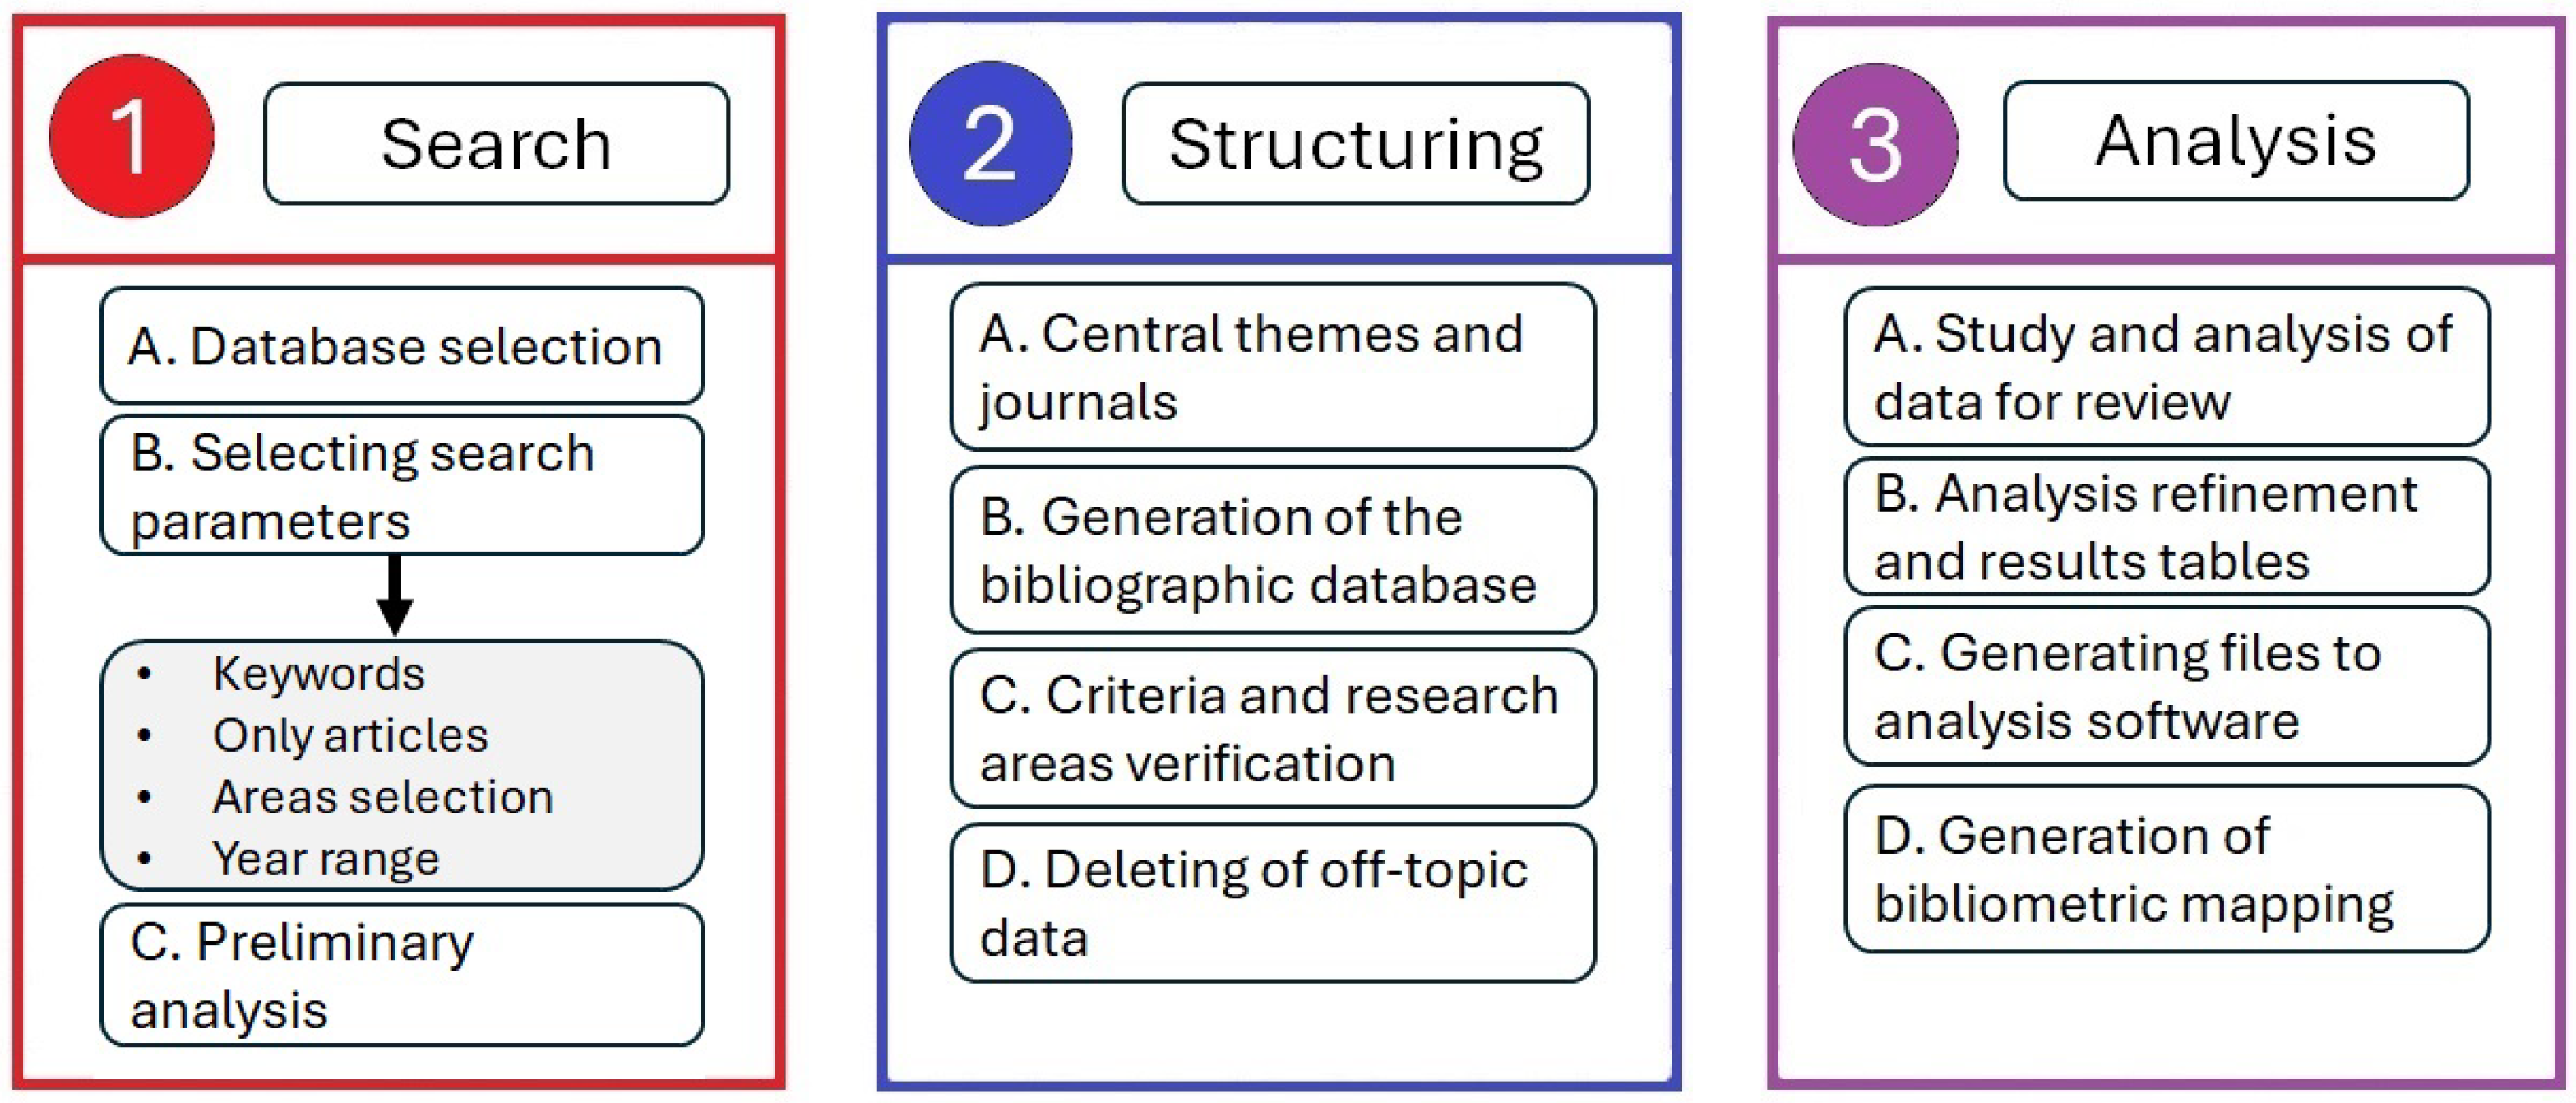
2. Methodology
2.1. Stage 1: Search Strategy
- Database selection
- ScienceDirect;
- Web of Science;
- Scopus;
- MDPI;
- Frontiers in Science;
- Google Scholar (for complementary grey literature).
- Keywords
- “Hyperspectral imaging” OR “HSI”;
- “Machine learning” OR “ML”;
- “Crop disease detection”;
- “Crop disease identification”;
- “Precision agriculture”.
- Inclusion Criteria
- Peer-reviewed research articles published in English within the last 10 years (2013–2023).
- Studies focusing on the application of HSI and ML for crop disease detection and identification.
- Studies exploring various machine learning algorithms used for HSI data analysis in the context of crop disease detection and classification.
- Studies discussing the advantages and challenges associated with this approach.
- Exclusion Criteria
- Studies solely focused on the development or engineering aspects of HSI technology without addressing its application in disease detection or classification.
- Conference proceedings, editorials, and opinion pieces were excluded unless they offered substantial data or reviews.
- Studies published in languages other than English.
- Selection Process
- Initial search results were exported to a reference management software (e.g., Mendeley Desktop v1.19.8, EndNote 21) for duplicate removal.
- Titles and abstracts were screened based on the inclusion and exclusion criteria.
- Remaining articles were reviewed in detail based on the full text to ensure that they met the research question’s scope.
- Synthesis Process
- A narrative synthesis approach was used to analyze and interpret the findings from the selected studies.
- Key themes and evidence were extracted regarding the application of HSI and various machine learning techniques for crop disease detection and identification.
- The review focused on advantages like early disease detection, non-invasiveness, and species differentiation potential.
- Challenges associated with data volume, cost, and variable field conditions were also discussed.
- Finally, the review explored future directions for research and development in this area.
2.2. Stage 2: Structuring
2.3. Stage 3: Analysis
3. Results
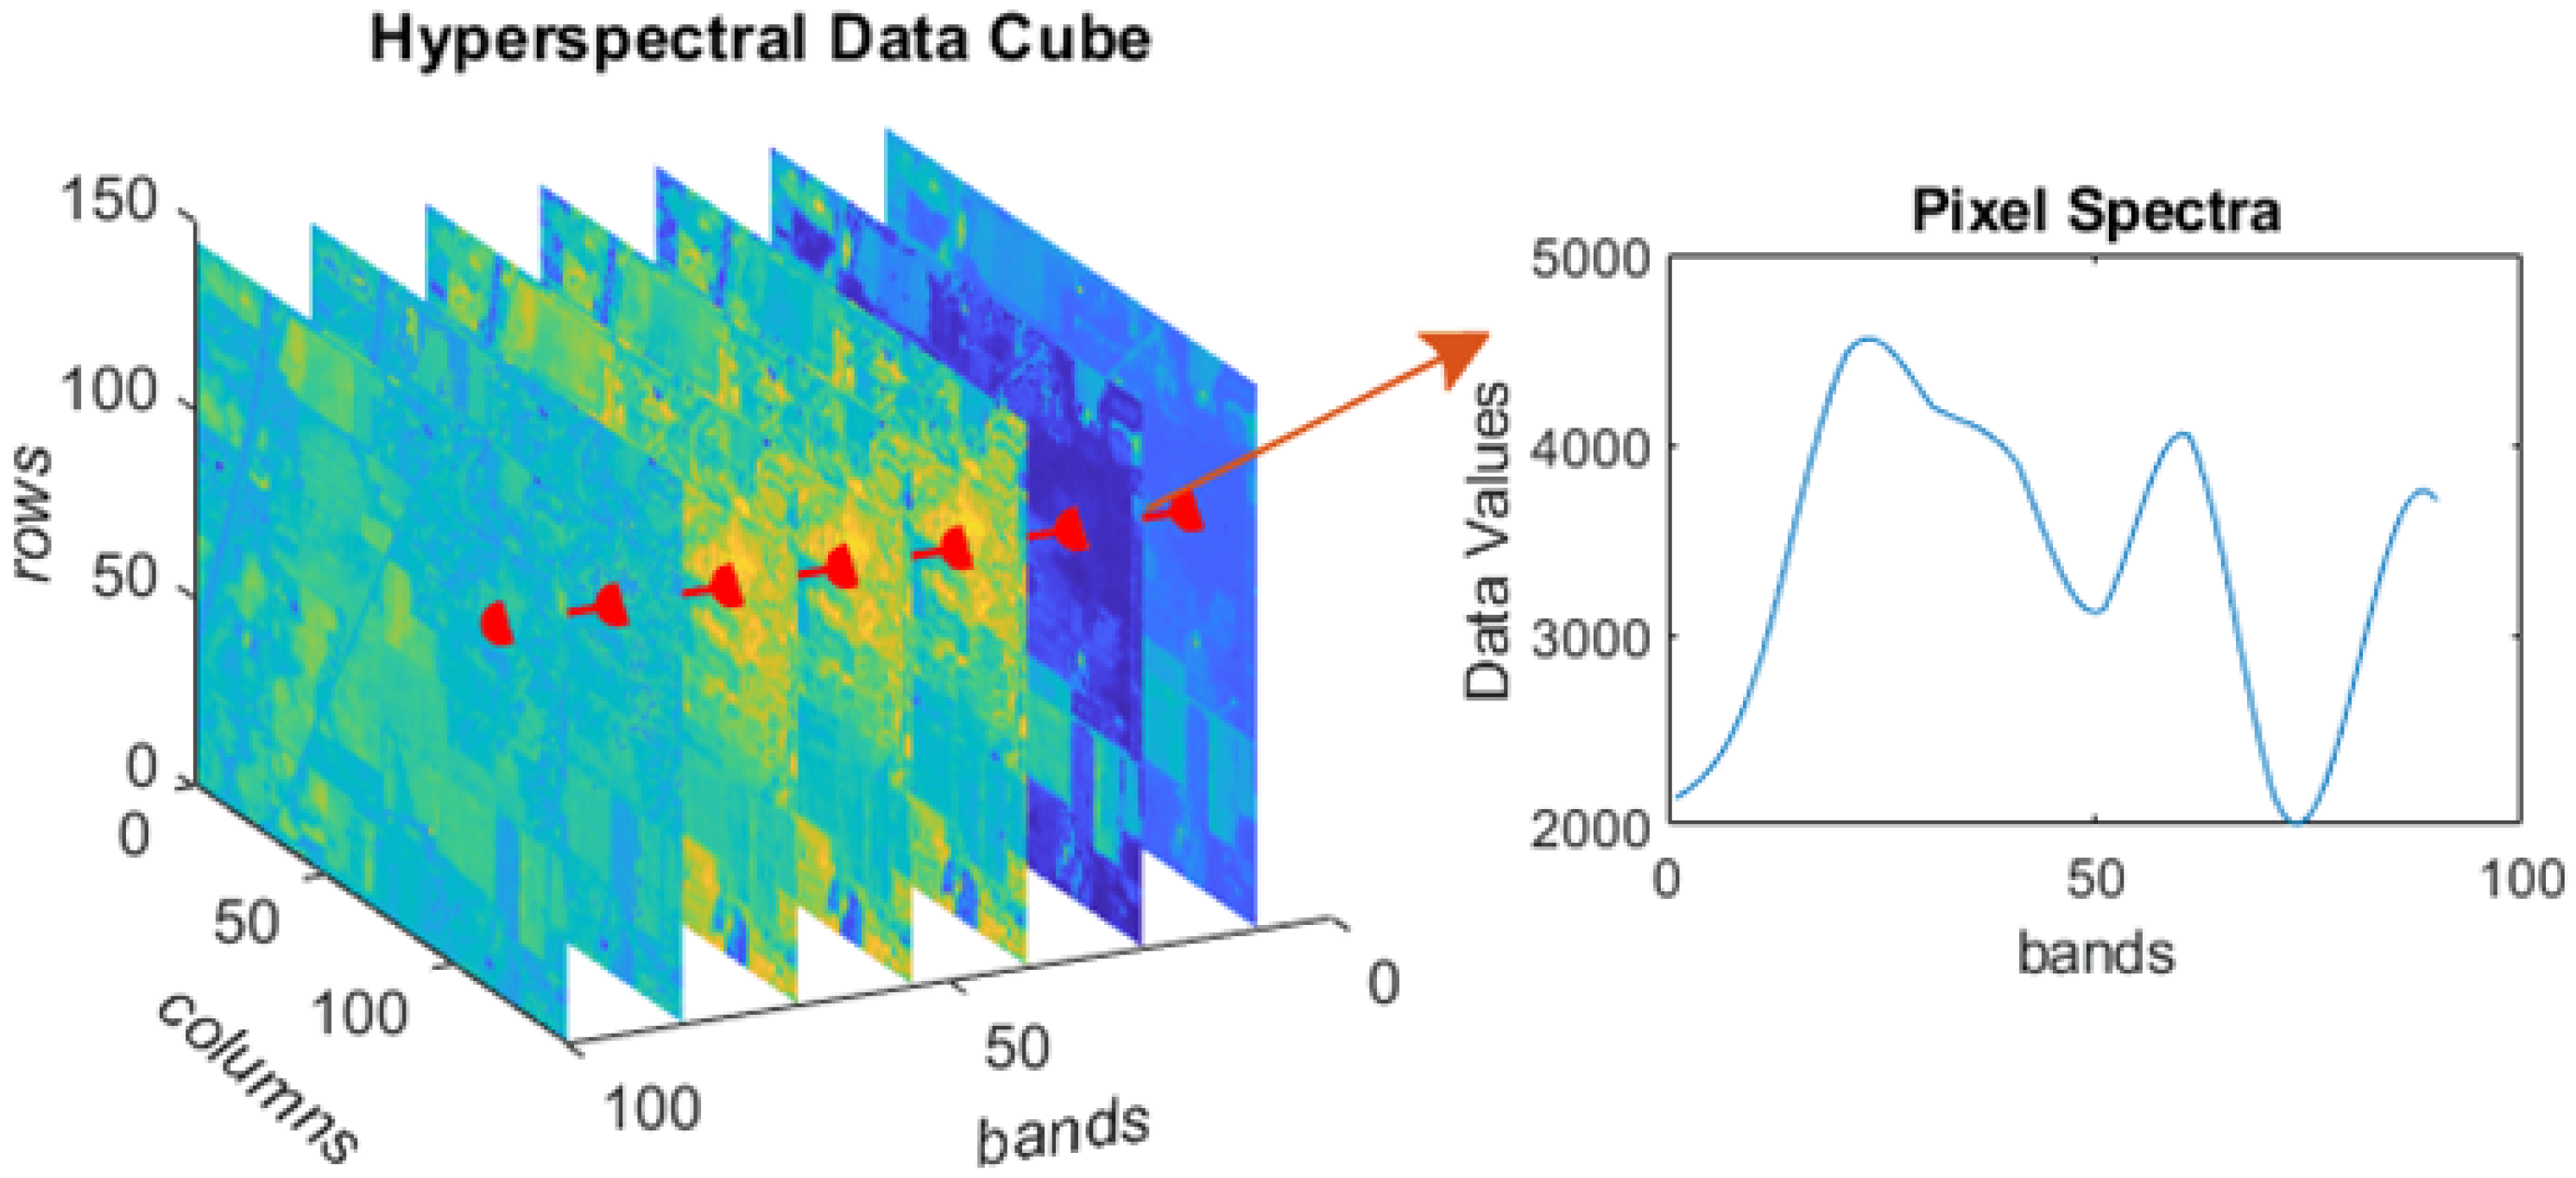
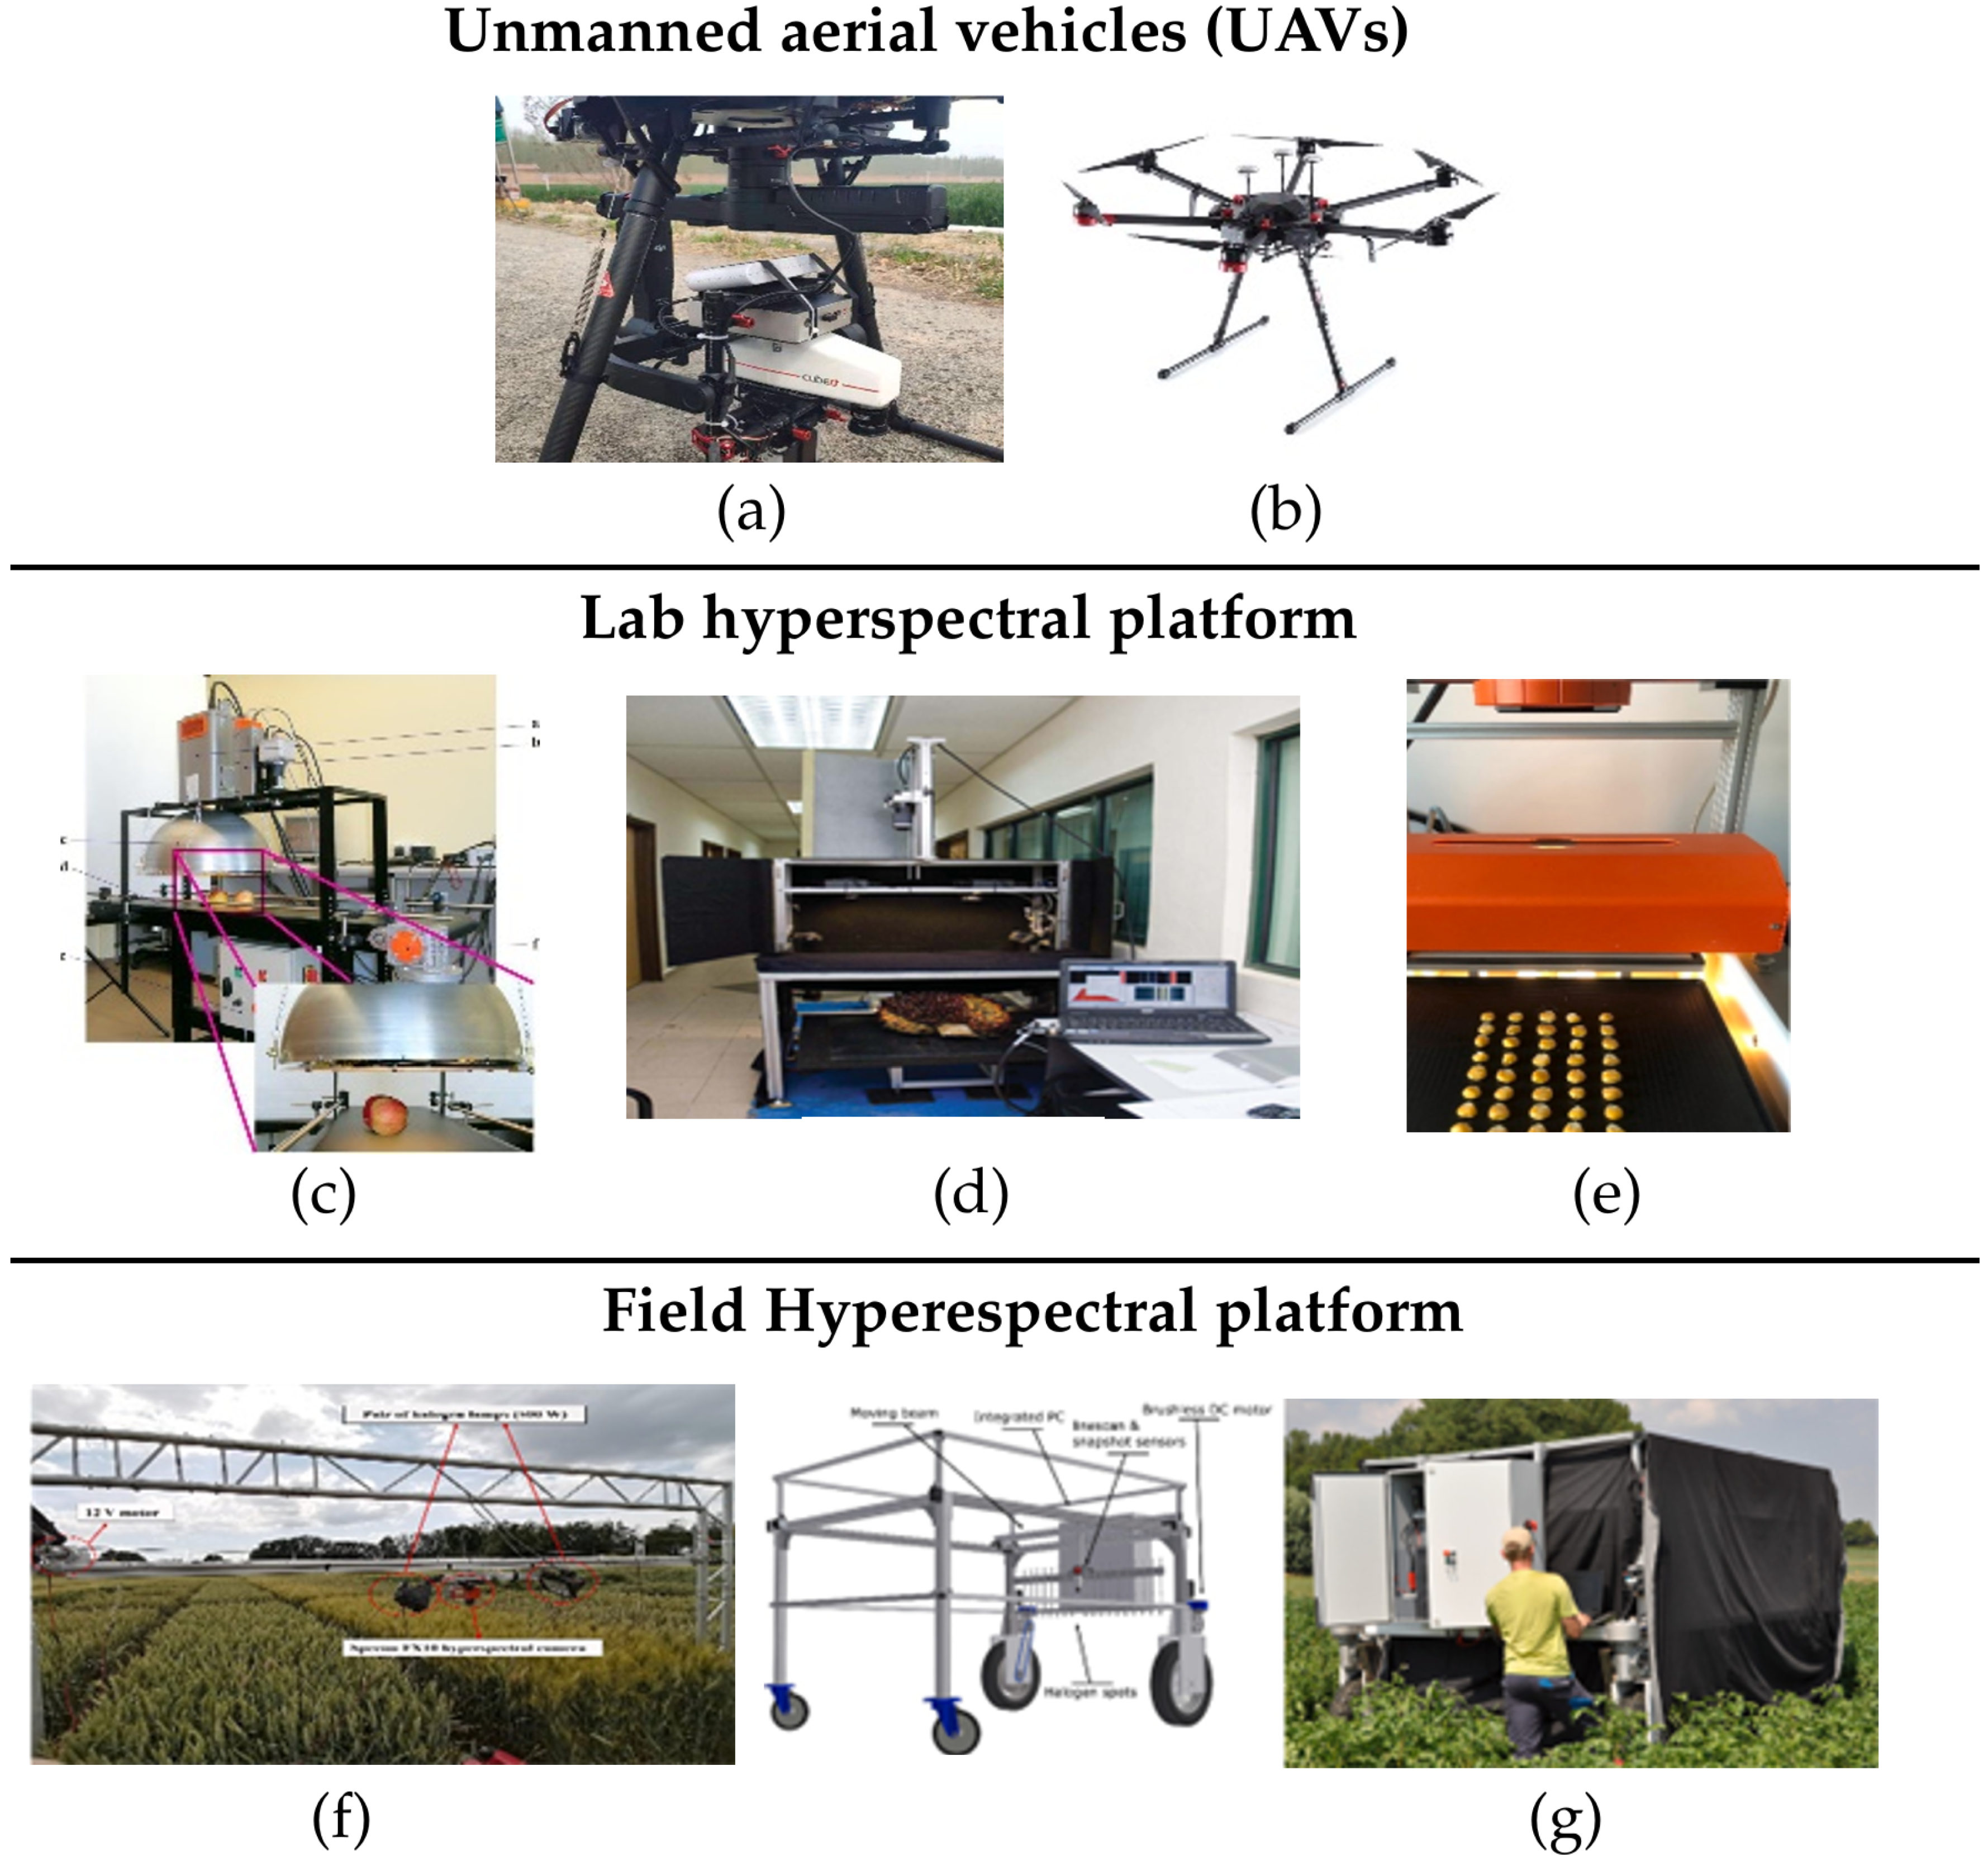
3.1. Technology Based on Hyperspectral Images
Real Case Studies
3.2. Identification of Plant Diseases Using Hyperspectral Images
3.3. Machine Learning
3.3.1. Supervised Machine Learning
Artificial Neural Networks (ANNs)
Support Vector Machine (SVM)
K-Nearest Neighbor (K-NN)
Classification and Decision Tree (CART)
Logistic Regression (LR)
Linear Regression
Multivariate Linear Regression (MLR)
Deep Forest
Backpropagation Neural Networks (BPNNs)
Linear Discriminant Analysis (LDA)
Modified Partial Least Squares Regression (MPLSR)
Light Gradient Boosting Machine (LightGBM)
3.3.2. Unsupervised Machine Learning
K-Means Clustering
Hierarchical Clustering
WEKAXMeans (WXM)
Iterative Self-Organizing Data Analysis Technique (ISODATA)
Dimensionality Reduction
Principal Component Analysis (PCA)
Singular Value Decomposition (SVD)
Partial Least Squares Regression (PLSR)
3.3.3. Deep Learning
Convolutional Neural Network (CNN)
Recurrent Neural Networks (RNNs)
Long Short-Term Memory (LSTM)
Stacked Denoising Autoencoder (SDAE)
Residual Attention Convolutional Neural Networks (RACNNs)
Wavelet Attention Convolutional Neural Networks (WACNNs)
One-Dimensional Convolutional Neural Network (1D CNN)

| Reference | Crops | Disease | Bandwidths (nm) | Algorithms |
|---|---|---|---|---|
| [102] | Potato | Alternaria solani | (550–750) | Partial least squares discriminant analysis (PLS-DA), support vector machines (SVMs) |
| [98] | Potato | Late blight | (450–950) | 3D convolutional neural network (3D-CNN) |
| [60] | Potato | Bruised | (450–1000) | Principal component analysis (PCA) |
| [103] | Strawberry | Leaves | (359–1020) | Extreme learning machine (ELM), support vector machine (SVM), k-nearest neighbor (k-NN) |
| [104] | Leek | White tip | (800–870) | Supervised machine learning (SVM) |
| [64] | Tea | Anthracnose | (450–950) | Iterative self-organizing data analysis techniques (ISODATAs) |
| [105] | Chickpea | Ascochyta blight | (666–840) | Discriminant analysis (DA), support vector machine (SVM) |
| [99] | Peanut | Bacterial wilt | (730–900) | Analysis of variance (ANOVA), multilayer perceptron (MLP) |
| [106] | Cucumber | Powdery mildew | (400–900) | Support vector machine (SVM) |
| [107] | Tobacco | Spotted wilt virus | (400–1000) | Regression tree (CART) |
| [108] | Citrus | Fungal infection | (325–1100) | Principal component analysis (PCA) |
| [109] | Citrus | Diagnosis of citrus Huanglongbing | (450–1023) | Least squares–support vector machine (LS-SVM) |
| [66] | Green-peel citrus | Thrips defect | (523, 587, 700, 768) | Principal component analysis (PCA) |
| [110] | Tomato | Firmness estimation | (400–1000) | One-dimensional (1D) convolutional ResNet |
| [110] | Tomato | Early blight | (380–1023) | Extreme learning machine (ELM) |
| [35] | Olive | Verticillium wilt | (650–720 680–800 8000–15000) | Support vector machine (SVM), linear discriminant analysis (LDA) |
| [111] | Grape | Leafroll | (690, 715, 731, 1409, 1425, 1582) | Least squares–support vector machine (LS-SVM) |
| [44] | Apple | Marssonina blotch | (800–1100) | Orthogonal subspace projection (OSP) |
| [45] | Apple | Bruising | (400–1000) 1000–2500 | Support vector machine (SVM), linear discriminant analysis (LDA) |
| [46] | Apple | Bitter pit detection | (550–1700) | Partial least square regression (PLSR) |
| [57] | Beet | Seed Ggrmination | (1000–2500) | Support vector machine (SVM), random forest (RF), light gradient boosting machine (LightGBM) |
| Reference | Crops | Disease | Bandwidths (nm) | Algorithms |
|---|---|---|---|---|
| [28] | Various | Classification | (400–1000 400–2500) | Random forest (RF), support vector machine (SVM), naive Bayes (NB), WekaXMeans (WXM) |
| [80] | Various | Classification | (400–1000) | Wavelet attention convolutional neural network (WA-CNN) |
| [112] | Various | Classification | (400–700 700–1000 100–2500) | Convolutional neural network (CNN) |
| [50] | Wheat | Wheat and weed discrimination | (400–1000) | Partial least squares discriminant analysis (PLS-DA), support vector machine (SVM) |
| [40] | Wheat | Kernel presence | (990–1200) | Partial least squares discriminant analysis (PLS-DA) |
| [12] | Wheat | Predicting micronutrients | (375–1000) | Partial least squares regression (PLSR) |
| [30] | Wheat | Nitrogen and water status | (400–850 95–1750) | Analysis of variance, or ANOVA |
| [117] | Rice | Rice variety | (400–1000) | Principal component analysis network |
| [76] | Rice | Rice varieties | (400–950) | Convolutional neural network (CNN) |
| [118] | Rice | Rice vigor | (873–1374) | Convolutional neural network (CNN) |
| [119] | Rice | Chlorophyll content estimation | (450–950) | Partial least squares regression (PLSR), support vector machine (SVM), artificial neural network (ANN) |
| [75] | Rice | Rice classification | (450–950) | Convolutional neural network (CNN) |
| [113] | Rice | Nitrogen stress | Variable | Convolutional neural network (CNN) |
| [76] | Rice | Rice classification | (320–1100) | Convolutional neural network (CNN) |
| [47] | Rice | Nitrogen content | Variable | Partial least squares regression (PLSR), support vector machine (SVM), artificial neural network (ANN) |
| [120] | Rice | Rice flour intensity | (500–900) | Stepwise multiple linear regressions (SMLRs) and random forest (RF) |
| [121] | Rice | Rice seeds vigor | (874.41–1734.91) | Deep convolution neural network (DCNN), principal component analysis (PCA) |
| [91] | Rice | Nitrogen concentration | Variable | Multivariate linear regression (MLR), long short-term memory (LSTM) |
| [122] | Corn | Corn seedling recognition | (400–1000) | Convolutional neural network (CNN) |
| [51] | Maize | Biomass estimating | (450–950) | Random forest (RF) |
| [53] | Maize seed | Moisture content (MC) | (930–2548) | Partial least squares regression (PLSR), least squares–support vector machine (LS-SVM) |
| [123] | Maize | Hardness for maize | (399.75–1005.8) | Partial least squares regression (PLSR) |
| [114] | Corn Maize | Moisture detection | (968.05–2575.05) | Convolutional neural network (CNN), long short-term memory (LSTM) |
| [112] | Corn Soybean Wheat Alfalfa | Normalized difference vegetation index (NDVI), and modified normalized difference water index (MNDWI) | (400–700 700–1000 1000–2500) | Convolutional neural network (CNN) |
| [124] | Maize | Crop traits in maize | Variable | Partial least squares (PLS), successive projection algorithm (SPA) random forest (RF) algorithms, adaptive reweighted sampling (CARS) |
| [125] | Maize | Water and nitrogen status | (325–1075) | Analysis of variance (ANOVA) |
| [126] | Barley | Nutrient concentration | (1000–2500) | Partial least squares regression (PLS) |
| [127] | Barley | Phenology of barley | (395–793) | Support vector machines (SVMs) |
| [128] | Barley | Phenolic compounds | (950–1760) | principal component analysis (PCA), support vector machines (SVMs) |
| [129] | Sorghum | Sorghum purity | (935–1720) | Principal component analysis (PCA) |
| [115] | Soybean | Soybean crop variables | (350–2500) | Partial least squares (PLS) |
| [130] | Soybean | Identification of soybean seed varieties | (874–1734) | Convolutional neural networks (CNNs) |
| [131] | Oil Palm | Weight and ripeness | (560, 680, 740, 910) | Multilinear regression (MLR) |
| [132] | Oil Palm | Fruit grading | (750–910) | Artificial neural network (ANN) |
| [133] | Peanut | Peanut maturity | (400–1000) | Linear mixture model (LMM) |
4. Discussion
5. Conclusions
Author Contributions
Funding
Data Availability Statement
Conflicts of Interest
Nomenclature and Abbreviations
| ANOVA | Analysis of Variance |
| ANN | Artificial Neural Network |
| BPNN-GA | Backpropagation Neural Network |
| CART | Classification And Regression Tree |
| CNN | Convolutional Neural Network |
| CARS | Competitive Adaptive Reweighting Algorithm |
| DA | Discriminant Analysis |
| DCNN | Deep Convolution Neural Network |
| EMD | Empirical Mode Decomposition |
| ELM | Extreme Learning Machine |
| k-NN | K-Nearest Neighbor |
| LDA | Linear Discriminant Analysis |
| LightGBM | Light Gradient Boosting Machine |
| LSTM | Long Short-Term Memory |
| CFI | Chlorophyll Fluorescence Imaging |
| CNN | Convolutional Neural Network |
| LR | Logistic Regression |
| MA | Moving Average Smoothing |
| MLR | Multivariate Linear Regression |
| MLP | Multilayer Perceptron |
| MPLS | Modified Partial Least Squares Regression |
| NB | Naive Bayes |
| NIR | Near-Infrared Light |
| NDVI | Difference Vegetation Index |
| OSP | Orthogonal Subspace Projection |
| PCA | Principal Component Analysis |
| PLSR | Partial Least Squares Regression |
| PLS | Partial Least Squares |
| PLSDA | Partial Least Squares Discriminant Analysis |
| RF | Random Forest Algorithm |
| RACNN | Residual Attention Convolution Neural Network |
| RNNs | Recurrent Neural Networks |
| SAM | Spectral Angle Mapping |
| SVD | Singular Value Decomposition |
| SMLR | Stepwise Multiple Linear Regression |
| SDAE | Stacked Denoising Autoencoder |
| SWIR | Short-Wave Infrared |
References
- Food and Agriculture Organization of the United Nations (FAO). The Future of Food and Agriculture—Alternative Pathways to 2050; FAO: Roma, Italy, 2018. [Google Scholar] [CrossRef]
- Ghini, R.; Bettiol, W.; Hamada, E. Diseases in Tropical and Plantation Crops as Affected by Climate Changes: Current Knowledge and Perspectives. Plant Pathol. 2011, 60, 122–132. [Google Scholar] [CrossRef]
- Khan, A.; Vibhute, A.D.; Mali, S.; Patil, C.H. A Systematic Review on Hyperspectral Imaging Technology with a Machine and Deep Learning Methodology for Agricultural Applications. Ecol. Inform. 2022, 69, 101678. [Google Scholar] [CrossRef]
- Razfar, N.; True, J.; Bassiouny, R.; Venkatesh, V.; Kashef, R. Weed Detection in Soybean Crops Using Custom Lightweight Deep Learning Models. J. Agric. Food Res. 2022, 8, 100308. [Google Scholar] [CrossRef]
- Lowe, A.; Harrison, N.; French, A.P. Hyperspectral Image Analysis Techniques for the Detection and Classification of the Early Onset of Plant Disease and Stress. Plant Methods. 2017, 13, 80. [Google Scholar] [CrossRef] [PubMed]
- ElMasry, G.; Sun, D.W. Meat quality assessment using a hyperspectral imaging system. In Hyperspectral Imaging for Food Quality Analysis and Control; Academic Press: Cambridge, MA, USA, 2010; pp. 175–240. [Google Scholar]
- Moharram, M.A.; Sundaram, D.M. Land use and land cover classification with hyperspectral data: A comprehensive review of methods, challenges and future directions. Neurocomputing 2023, 536, 90–113. [Google Scholar] [CrossRef]
- Liu, J.; Wang, X. Plant Diseases and Pests Detection Based on Deep Learning: A Review. Plant Methods. 2021, 17, 22. [Google Scholar] [CrossRef] [PubMed]
- Ram, B.G.; Oduor, P.; Igathinathane, C.; Howatt, K.; Sun, X. A Systematic Review of Hyperspectral Imaging in Precision Agriculture: Analysis of Its Current State and Future Prospects. Comput. Electron. Agric. 2024, 222, 109037. [Google Scholar] [CrossRef]
- Tao, F.; Yao, H.; Hruska, Z.; Rajasekaran, K.; Qin, J.; Kim, M. Use of Line-Scan Raman Hyperspectral Imaging to Identify Corn Kernels Infected with Aspergillus Flavus. J. Cereal Sci. 2021, 102, 103364. [Google Scholar] [CrossRef]
- Terentev, A.; Dolzhenko, V.; Fedotov, A.; Eremenko, D. Current State of Hyperspectral Remote Sensing for Early Plant Disease Detection: A Review. Sensors 2022, 22, 757. [Google Scholar] [CrossRef]
- Hu, N.; Li, W.; Du, C.; Zhang, Z.; Gao, Y.; Sun, Z.; Yang, L.; Yu, K.; Zhang, Y.; Wang, Z. Predicting Micronutrients of Wheat Using Hyperspectral Imaging. Food Chem. 2021, 343, 128473. [Google Scholar] [CrossRef]
- Sarić, R.; Nguyen, V.D.; Burge, T.; Berkowitz, O.; Trtílek, M.; Whelan, J.; Lewsey, M.G.; Čustović, E. Applications of Hyperspectral Imaging in Plant Phenotyping. Trends Plant Sci. 2022, 27, 301–315. [Google Scholar] [CrossRef] [PubMed]
- Chitra, P.; Murukesh, C. A Review on Hyper Spectral Imaging for Remote Sensing Applications. Ijrti.org. 2018, 3, 23–33. Available online: https://ijrti.org/papers/IJRTI1809005.pdf (accessed on 15 February 2024).
- Som-ard, J.; Atzberger, C.; Izquierdo-Verdiguier, E.; Vuolo, F.; Immitzer, M. Remote Sensing Applications in Sugarcane Cultivation: A Review. Remote Sens. 2021, 13, 4040. [Google Scholar] [CrossRef]
- Xia, L.; Wu, X. A Review of Hyperspectral Remote Sensing of Crops. E3S Web Conf. 2022, 338, 01029. [Google Scholar] [CrossRef]
- Chen, Z.; Wang, J.; Wang, T.; Song, Z.; Li, Y.; Huang, Y.; Wang, L.; Jin, J. Automated In-Field Leaf-Level Hyperspectral Imaging of Corn Plants Using a Cartesian Robotic Platform. Comput. Electron. Agric. 2021, 183, 105996. [Google Scholar] [CrossRef]
- Venkataraju, A.; Arumugam, D.; Stepan, C.; Kiran, R.; Peters, T. A Review of Machine Learning Techniques for Identifying Weeds in Corn. Smart Agric. Technol. 2023, 3, 100102. [Google Scholar] [CrossRef]
- Ahmed, I.; Yadav, P.K. A Systematic Analysis of Machine Learning and Deep Learning Based Approaches for Identifying and Diagnosing Plant Diseases. Sustain. Oper. Comput. 2023, 4, 96–104. [Google Scholar] [CrossRef]
- Islam ElManawy, A.; Sun, D.; Abdalla, A.; Zhu, Y.; Cen, H. HSI-PP: A Flexible Open-Source Software for Hyperspectral Imaging-Based Plant Phenotyping. Comput. Electron. Agric. 2022, 200, 107248. [Google Scholar] [CrossRef]
- Mangalraj, P.; Cho, B.-K. Recent Trends and Advances in Hyperspectral Imaging Techniques to Estimate Solar Induced Fluorescence for Plant Phenotyping. Ecol. Indic. 2022, 137, 108721. [Google Scholar] [CrossRef]
- Dale, L.M.; Thewis, A.; Boudry, C.; Rotar, I.; Dardenne, P.; Baeten, V.; Pierna, J.A.F. Hyperspectral Imaging Applications in Agriculture and Agro-Food Product Quality and Safety Control: A Review. Appl. Spectrosc. Rev. 2013, 48, 142–159. [Google Scholar] [CrossRef]
- Hasan, M.M.; Uddin, A.F.M.S.; Akhond, M.R.; Uddin, M.J.; Hossain, M.A.; Hossain, M.A. Machine Learning and Image Processing Techniques for Rice Disease Detection: A Critical Analysis. Int. J. Plant Biol. 2023, 14, 1190–1207. [Google Scholar] [CrossRef]
- Mancini, A.; Frontoni, E.; Zingaretti, P. Challenges of Multi/Hyper Spectral Images in Precision Agriculture Applications. IOP Conf. Ser. Earth Environ. Sci. 2019, 275, 012001. [Google Scholar] [CrossRef]
- Golhani, K.; Balasundram, S.K.; Vadamalai, G.; Pradhan, B. A Review of Neural Networks in Plant Disease Detection Using Hyperspectral Data. Inf. Process. Agric. 2018, 5, 354–371. [Google Scholar] [CrossRef]
- VOSviewer—Visualizing Scientific Landscapes. (n.d.). VOSviewer. Retrieved 6 May 2024. Available online: https://www.vosviewer.com/ (accessed on 15 February 2024).
- Eller, J.A. Using Hyperspectral Remote Sensing Techniques to Identify Vitis Vinifera Powdery Mildew Napa Valley. Master’s Thesis, California State University, Northridge, CA, USA, 2023. [Google Scholar]
- Aneece, I.; Thenkabail, P.S. Classifying Crop Types Using Two Generations of Hyperspectral Sensors (Hyperion and DESIS) with Machine Learning on the Cloud. Remote Sens. 2021, 13, 4704. [Google Scholar] [CrossRef]
- Cheshkova, A.F. A Review of Hyperspectral Image Analysis Techniques for Plant Disease Detection and Identification. Vavilovskii Zhurnal Genet. Selektsii. 2022, 26, 202–213. [Google Scholar] [CrossRef] [PubMed]
- Pancorbo, J.L.; Camino, C.; Alonso-Ayuso, M.; Raya-Sereno, M.D.; Gonzalez-Fernandez, I.; Gabriel, J.L.; Zarco-Tejada, P.J.; Quemada, M. Simultaneous Assessment of Nitrogen and Water Status in Winter Wheat Using Hyperspectral and Thermal Sensors. Eur. J. Agron. 2021, 127, 126287. [Google Scholar] [CrossRef]
- Nturambirwe, J.F.I.; Perold, W.J.; Opara, U.L. Classification Learning of Latent Bruise Damage to Apples Using Shortwave Infrared Hyperspectral Imaging. Sensors 2021, 21, 4990. [Google Scholar] [CrossRef]
- Zhou, X.; Zhao, C.; Sun, J.; Cao, Y.; Yao, K.; Xu, M. A Deep Learning Method for Predicting Lead Content in Oilseed Rape Leaves Using Fluorescence Hyperspectral Imaging. Food Chem. 2023, 409, 135251. [Google Scholar] [CrossRef] [PubMed]
- Bauriegel, E.; Herppich, W. Hyperspectral and Chlorophyll Fluorescence Imaging for Early Detection of Plant Diseases, with Special Reference to Fusarium Spec. Infections on Wheat. Agriculture 2014, 4, 32–57. [Google Scholar] [CrossRef]
- Kurihara, J.; Koo, V.-C.; Guey, C.W.; Lee, Y.P.; Abidin, H. Early Detection of Basal Stem Rot Disease in Oil Palm Tree Using Unmanned Aerial Vehicle-Based Hyperspectral Imaging. Remote Sens. 2022, 14, 799. [Google Scholar] [CrossRef]
- Calderón, R.; Navas-Cortés, J.; Zarco-Tejada, P. Early Detection and Quantification of Verticillium Wilt in Olive Using Hyperspectral and Thermal Imagery over Large Areas. Remote Sens. 2015, 7, 5584–5610. [Google Scholar] [CrossRef]
- Li, C.; Chen, P.; Ma, C.; Feng, H.; Wei, F.; Wang, Y.; Shi, J.; Cui, Y. Estimation of Potato Chlorophyll Content Using Composite Hyperspectral Index Parameters Collected by an Unmanned Aerial Vehicle. Int. J. Remote Sens. 2020, 41, 8176–8197. [Google Scholar] [CrossRef]
- Lu, B.; Dao, P.; Liu, J.; He, Y.; Shang, J. Recent Advances of Hyperspectral Imaging Technology and Applications in Agriculture. Remote Sens. 2020, 12, 2659. [Google Scholar] [CrossRef]
- Panigrahi, B.; Kathala, K.C.R.; Sujatha, M. A Machine Learning-Based Comparative Approach to Predict the Crop Yield Using Supervised Learning with Regression Models. Procedia Comput. Sci. 2023, 218, 2684–2693. [Google Scholar] [CrossRef]
- Moshou, D.; Bravo, C.; Oberti, R.; West, J.S.; Ramon, H.; Vougioukas, S.; Bochtis, D. Intelligent Multi-Sensor System for the Detection and Treatment of Fungal Diseases in Arable Crops. Biosyst. Eng. 2011, 108, 311–321. [Google Scholar] [CrossRef]
- Vincke, D.; Mercatoris, B.; Eylenbosch, D.; Baeten, V.; Vermeulen, P. Assessment of Kernel Presence in Winter Wheat Ears at Spikelet Scale Using Near-Infrared Hyperspectral Imaging. J. Cereal Sci. 2022, 106, 103497. [Google Scholar] [CrossRef]
- Xia, J.; Huang, B.; Yang, Y.W.; Cao, H.X.; Zhang, W.; Xu, L.; Wan, Q.; Ke, Y.; Zhang, W.; Ge, D. Hyperspectral Identification and Classification of Oilseed Rape Waterlogging Stress Levels Using Parallel Computing. IEEE Access 2018, 6, 57663–57675. [Google Scholar] [CrossRef]
- Mahlein, A.-K.; Alisaac, E.; Al Masri, A.; Behmann, J.; Dehne, H.-W.; Oerke, E.-C. Comparison and Combination of Thermal, Fluorescence, and Hyperspectral Imaging for Monitoring Fusarium Head Blight of Wheat on Spikelet Scale. Sensors 2019, 19, 2281. [Google Scholar] [CrossRef] [PubMed]
- Chu, X.; Wang, W.; Ni, X.; Li, C.; Li, Y. Classifying Maize Kernels Naturally Infected by Fungi Using Near-Infrared Hyperspectral Imaging. Infrared Phys. Technol. 2020, 105, 103242. [Google Scholar] [CrossRef]
- Shuaibu, M.; Lee, W.S.; Schueller, J.; Gader, P.; Hong, Y.K.; Kim, S. Unsupervised Hyperspectral Band Selection for Apple Marssonina Blotch Detection. Comput. Electron. Agric. 2018, 148, 45–53. [Google Scholar] [CrossRef]
- Baranowski, P.; Mazurek, W.; Pastuszka-Woźniak, J. Supervised Classification of Bruised Apples with Respect to the Time after Bruising on the Basis of Hyperspectral Imaging Data. Postharvest Biol. Technol. 2013, 86, 249–258. [Google Scholar] [CrossRef]
- Jarolmasjed, S.; Khot, L.; Sankaran, S. Hyperspectral Imaging and Spectrometry-Derived Spectral Features for Bitter Pit Detection in Storage Apples. Sensors 2018, 18, 1561. [Google Scholar] [CrossRef] [PubMed]
- Wang, L.; Chen, S.; Li, D.; Wang, C.; Jiang, H.; Zheng, Q.; Peng, Z. Estimation of Paddy Rice Nitrogen Content and Accumulation Both at Leaf and Plant Levels from UAV Hyperspectral Imagery. Remote Sens. 2021, 13, 2956. [Google Scholar] [CrossRef]
- Hastie, T.; Tibshirani, R.; Friedman, J. The Elements of Statistical Learning; Springer: New York, NY, USA, 2009. [Google Scholar]
- Huang, H.; Fei, X.; Hu, X.; Tian, J.; Ju, J.; Luo, H.; Huang, D. Analysis of the Spectral and Textural Features of Hyperspectral Images for the Nondestructive Prediction of Amylopectin and Amylose Contents of Sorghum. J. Food Compost. Anal. 2023, 115, 105018. [Google Scholar] [CrossRef]
- Hadoux, X.; Gorretta, N.; Roger, J.-M.; Bendoula, R.; Rabatel, G. Comparison of the Efficacy of Spectral Pre-Treatments for Wheat and Weed Discrimination in Outdoor Conditions. Comput. Electron. Agric. 2014, 108, 242–249. [Google Scholar] [CrossRef]
- Zhang, Y.; Xia, C.; Zhang, X.; Cheng, X.; Feng, G.; Wang, Y.; Gao, Q. Estimating the Maize Biomass by Crop Height and Narrowband Vegetation Indices Derived from UAV-Based Hyperspectral Images. Ecol. Indic. 2021, 129, 107985. [Google Scholar] [CrossRef]
- Husin, N.A.; Khairunniza-Bejo, S.; Abdullah, A.F.; Kassim, M.S.M.; Ahmad, D.; Aziz, M.H.A. Classification of Basal Stem Rot Disease in Oil Palm Plantations Using Terrestrial Laser Scanning Data and Machine Learning. Agronomy 2020, 10, 1624. [Google Scholar] [CrossRef]
- Wang, Z.; Fan, S.; Wu, J.; Zhang, C.; Xu, F.; Yang, X.; Li, J. Application of Long-Wave near Infrared Hyperspectral Imaging for Determination of Moisture Content of Single Maize Seed. Spectrochim. Acta A Mol. Biomol. Spectrosc. 2021, 254, 119666. [Google Scholar] [CrossRef] [PubMed]
- Cheng, B.; Wu, X. An Modified PLSR Method in Prediction. J. Data Sci. 2021, 4, 257–274. [Google Scholar] [CrossRef]
- Gabrielli, M.; Lançon-Verdier, V.; Picouet, P.; Maury, C. Hyperspectral Imaging to Characterize Table Grapes. Chemosensors 2021, 9, 71. [Google Scholar] [CrossRef]
- Ke, G.; Meng, Q.; Finley, T.; Wang, T.; Chen, W.; Ma, W.; Ye, Q.; Liu, T.-Y. LightGBM: A Highly Efficient Gradient Boosting Decision Tree. In Proceedings of the 31st International Conference on Neural Information Processing Systems, Long Beach, CA, USA, 4–9 December 2017; Curran Associates Inc.: Red Hook, NY, USA, 2017; pp. 3149–3157. [Google Scholar]
- Zhou, S.; Sun, L.; Xing, W.; Feng, G.; Ji, Y.; Yang, J.; Liu, S. Hyperspectral Imaging of Beet Seed Germination Prediction. Infrared Phys. Technol. 2020, 108, 103363. [Google Scholar] [CrossRef]
- Avola, G.; Matese, A.; Riggi, E. An Overview of the Special Issue on “Precision Agriculture Using Hyperspectral Images”. Remote Sens. 2023, 15, 1917. [Google Scholar] [CrossRef]
- Almoujahed, M.B.; Rangarajan, A.K.; Whetton, R.L.; Vincke, D.; Eylenbosch, D.; Vermeulen, P.; Mouazen, A.M. Detection of Fusarium Head Blight in Wheat under Field Conditions Using a Hyperspectral Camera and Machine Learning. Comput. Electron. Agric. 2022, 203, 107456. [Google Scholar] [CrossRef]
- Ji, Y.; Sun, L.; Li, Y.; Ye, D. Detection of Bruised Potatoes Using Hyperspectral Imaging Technique Based on Discrete Wavelet Transform. Infrared Phys. Technol. 2019, 103, 103054. [Google Scholar] [CrossRef]
- Baker, F.B.; Hubert, L.J. Measuring the Power of Hierarchical Cluster Analysis. J. Am. Stat. Assoc. 1975, 70, 31–38. [Google Scholar] [CrossRef]
- Waikato.ac.nz. Available online: http://old-www.cms.waikato.ac.nz (accessed on 12 June 2024).
- Memarsadeghi, N.; Mount, D.M.; Netanyahu, N.S.; Le Moigne, J. A Fast Implementation of the Isodata Clustering Algorithm. Int. J. Comput. Geom. Appl. 2007, 17, 71–103. [Google Scholar] [CrossRef]
- Yuan, L.; Yan, P.; Han, W.; Huang, Y.; Wang, B.; Zhang, J.; Zhang, H.; Bao, Z. Detection of Anthracnose in Tea Plants Based on Hyperspectral Imaging. Comput. Electron. Agric. 2019, 167, 105039. [Google Scholar] [CrossRef]
- Ruiz Hidalgo, D.; Bacca Cortés, B.; Caicedo Bravo, E. Una Herramienta Para El Análisis de Índices Espectrales Para La Detección Remota de Vegetación y Cultivos Utilizando Imágenes Hiperespectrales. Entre Cienc. Ing. 2019, 13, 51–58. [Google Scholar] [CrossRef]
- Dong, C.-W.; Ye, Y.; Zhang, J.-Q.; Zhu, H.-K.; Liu, F. Detection of Thrips Defect on Green-Peel Citrus Using Hyperspectral Imaging Technology Combining PCA and B-Spline Lighting Correction Method. J. Integr. Agric. 2014, 13, 2229–2235. [Google Scholar] [CrossRef]
- Murphy, Kevin, P. Machine Learning: A Probabilistic Perspective; MIT Press: London, UK, 2012; ISBN 978-0262018029. [Google Scholar]
- Kandpal, L.M.; Lee, S.; Kim, M.S.; Bae, H.; Cho, B.-K. Short Wave Infrared (SWIR) Hyperspectral Imaging Technique for Examination of Aflatoxin B1 (AFB1) on Corn Kernels. Food Control. 2015, 51, 171–176. [Google Scholar] [CrossRef]
- Su, W.-H.; Yang, C.; Dong, Y.; Johnson, R.; Page, R.; Szinyei, T.; Hirsch, C.D.; Steffenson, B.J. Hyperspectral Imaging and Improved Feature Variable Selection for Automated Determination of Deoxynivalenol in Various Genetic Lines of Barley Kernels for Resistance Screening. Food Chem. 2021, 343, 128507. [Google Scholar] [CrossRef] [PubMed]
- Geladi, P.; Kowalski, B.R. Partial Least-Squares Regression: A Tutorial. Anal. Chim. Acta. 1986, 185, 1–17. [Google Scholar] [CrossRef]
- Chamundeshwari; Biradar, N.; Udaykumar. Adaptive Despeckling and Heart Disease Diagnosis by Echocardiogram Using Optimized Deep Learning Model. Comput. Methods Biomech. Biomed. Eng. Imaging Vis. 2023, 11, 1–17. [Google Scholar] [CrossRef]
- Mohanty, S.P.; Hughes, D.P.; Salathé, M. Using Deep Learning for Image-Based Plant Disease Detection. Front. Plant Sci. 2016, 7, 1419. [Google Scholar] [CrossRef] [PubMed]
- Xiang, Y.; Chen, Q.; Su, Z.; Zhang, L.; Chen, Z.; Zhou, G.; Yao, Z.; Xuan, Q.; Cheng, Y. Deep Learning and Hyperspectral Images Based Tomato Soluble Solids Content and Firmness Estimation. Front. Plant Sci. 2022, 13, 860656. [Google Scholar] [CrossRef]
- Mamba Kabala, D.; Hafiane, A.; Bobelin, L.; Canals, R. Image-Based Crop Disease Detection with Federated Learning. Sci. Rep. 2023, 13, 19220. [Google Scholar] [CrossRef]
- Meng, Y.; Ma, Z.; Ji, Z.; Gao, R.; Su, Z. Fine Hyperspectral Classification of Rice Varieties Based on Attention Module 3D-2DCNN. Comput. Electron. Agric. 2022, 203, 107474. [Google Scholar] [CrossRef]
- Meng, Y.; Yuan, W.; Aktilek, E.U.; Zhong, Z.; Wang, Y.; Gao, R.; Su, Z. Fine Hyperspectral Classification of Rice Varieties Based on Self-Attention Mechanism. Ecol. Inform. 2023, 75, 102035. [Google Scholar] [CrossRef]
- Nagasubramanian, K.; Jones, S.; Singh, A.K.; Sarkar, S.; Singh, A.; Ganapathysubramanian, B. Plant Disease Identification Using Explainable 3D Deep Learning on Hyperspectral Images. Plant Methods 2019, 15, 98. [Google Scholar] [CrossRef] [PubMed]
- Lu, Y.; Yi, S.; Zeng, N.; Liu, Y.; Zhang, Y. Identification of Rice Diseases Using Deep Convolutional Neural Networks. Neurocomputing 2017, 267, 378–384. [Google Scholar] [CrossRef]
- Weng, S.; Han, K.; Chu, Z.; Zhu, G.; Liu, C.; Zhu, Z.; Zhang, Z.; Zheng, L.; Huang, L. Reflectance Images of Effective Wavelengths from Hyperspectral Imaging for Identification of Fusarium Head Blight-Infected Wheat Kernels Combined with a Residual Attention Convolution Neural Network. Comput. Electron. Agric. 2021, 190, 106483. [Google Scholar] [CrossRef]
- Farmonov, N.; Amankulova, K.; Szatmari, J.; Sharifi, A.; Abbasi-Moghadam, D.; Mirhoseini Nejad, S.M.; Mucsi, L. Crop Type Classification by DESIS Hyperspectral Imagery and Machine Learning Algorithms. IEEE J. Sel. Top. Appl. Earth Obs. Remote Sens. 2023, 16, 1576–1588. [Google Scholar] [CrossRef]
- Zhao, X.; Huang, P.; Shu, X. Wavelet-Attention CNN for Image Classification. Multimed. Syst. 2022, 28, 915–924. [Google Scholar] [CrossRef]
- El-gayar, M.M.; Soliman, H.; Meky, N. A Comparative Study of Image Low Level Feature Extraction Algorithms. Egypt. Inform. J. 2013, 14, 175–181. [Google Scholar] [CrossRef]
- Ejaz, I.; Li, W.; Naseer, M.A.; Li, Y.; Qin, W.; Farooq, M.; Li, F.; Huang, S.; Zhang, Y.; Wang, Z.; et al. Detection of Combined Frost and Drought Stress in Wheat Using Hyperspectral and Chlorophyll Fluorescence Imaging. Environ. Technol. Innov. 2023, 30, 103051. [Google Scholar] [CrossRef]
- Zhang, H.; Huang, L.; Huang, W.; Dong, Y.; Weng, S.; Zhao, J.; Ma, H.; Liu, L. Detection of Wheat Fusarium Head Blight Using UAV-Based Spectral and Image Feature Fusion. Front. Plant Sci. 2022, 13, 1004427. [Google Scholar] [CrossRef] [PubMed]
- Delwiche, S.R.; Rodriguez, I.T.; Rausch, S.R.; Graybosch, R.A. Estimating Percentages of Fusarium-Damaged Kernels in Hard Wheat by near-Infrared Hyperspectral Imaging. J. Cereal Sci. 2019, 87, 18–24. [Google Scholar] [CrossRef]
- Yipeng, L.; Wenbing, L.; Kaixuan, H.; Wentao, T.; Ling, Z.; Shizhuang, W.; Linsheng, H. Determination of Wheat Kernels Damaged by Fusarium Head Blight Using Monochromatic Images of Effective Wavelengths from Hyperspectral Imaging Coupled with an Architecture Self-Search Deep Network. Food Control. 2022, 135, 108819. [Google Scholar] [CrossRef]
- Zheng, Q.; Huang, W.; Ye, H.; Dong, Y.; Shi, Y.; Chen, S. Using Continous Wavelet Analysis for Monitoring Wheat Yellow Rust in Different Infestation Stages Based on Unmanned Aerial Vehicle Hyperspectral Images. Appl. Opt. 2020, 59, 8003. [Google Scholar] [CrossRef]
- Zhang, L.; Sun, H.; Li, H.; Rao, Z.; Ji, H. Identification of Rice-Weevil (Sitophilus Oryzae L.) Damaged Wheat Kernels Using Multi-Angle NIR Hyperspectral Data. J. Cereal Sci. 2021, 101, 103313. [Google Scholar] [CrossRef]
- Srivastava, S.; Mishra, H.N. Detection of Insect Damaged Rice Grains Using Visible and near Infrared Hyperspectral Imaging Technique. Chemometr. Intell. Lab. Syst. 2022, 221, 104489. [Google Scholar] [CrossRef]
- Zhang, J.; Tian, Y.; Yan, L.; Wang, B.; Wang, L.; Xu, J.; Wu, K. Diagnosing the Symptoms of Sheath Blight Disease on Rice Stalk with an In-Situ Hyperspectral Imaging Technique. Biosyst. Eng. 2021, 209, 94–105. [Google Scholar] [CrossRef]
- Yu, F.-H.; Bai, J.-C.; Jin, Z.-Y.; Guo, Z.-H.; Yang, J.-X.; Chen, C.-L. Combining the Critical Nitrogen Concentration and Machine Learning Algorithms to Estimate Nitrogen Deficiency in Rice from UAV Hyperspectral Data. J. Integr. Agric. 2023, 22, 1216–1229. [Google Scholar] [CrossRef]
- Wu, N.; Jiang, H.; Bao, Y.; Zhang, C.; Zhang, J.; Song, W.; Zhao, Y.; Mi, C.; He, Y.; Liu, F. Practicability Investigation of Using Near-Infrared Hyperspectral Imaging to Detect Rice Kernels Infected with Rice False Smut in Different Conditions. Sens. Actuators B Chem. 2020, 308, 127696. [Google Scholar] [CrossRef]
- Zhang, T.; Huang, Y.; Reddy, K.N.; Yang, P.; Zhao, X.; Zhang, J. Using Machine Learning and Hyperspectral Images to Assess Damages to Corn Plant Caused by Glyphosate and to Evaluate Recoverability. Agronomy 2021, 11, 583. [Google Scholar] [CrossRef]
- Yang, W.; Yang, C.; Hao, Z.; Xie, C.; Li, M. Diagnosis of Plant Cold Damage Based on Hyperspectral Imaging and Convolutional Neural Network. IEEE Access 2019, 7, 118239–118248. [Google Scholar] [CrossRef]
- Tao, F.; Yao, H.; Hruska, Z.; Kincaid, R.; Rajasekaran, K. Near-Infrared Hyperspectral Imaging for Evaluation of Aflatoxin Contamination in Corn Kernels. Biosyst. Eng. 2022, 221, 181–194. [Google Scholar] [CrossRef]
- Behmann, J.; Steinrücken, J.; Plümer, L. Detection of Early Plant Stress Responses in Hyperspectral Images. ISPRS J. Photogramm. Remote Sens. 2014, 93, 98–111. [Google Scholar] [CrossRef]
- Lee, C.C.; Koo, V.C.; Lim, T.S.; Lee, Y.P.; Abidin, H. A Multi-Layer Perceptron-Based Approach for Early Detection of BSR Disease in Oil Palm Trees Using Hyperspectral Images. Heliyon 2022, 8, e09252. [Google Scholar] [CrossRef]
- Shi, Y.; Han, L.; Kleerekoper, A.; Chang, S.; Hu, T. Novel CropdocNet Model for Automated Potato Late Blight Disease Detection from Unmanned Aerial Vehicle-Based Hyperspectral Imagery. Remote Sens. 2022, 14, 396. [Google Scholar] [CrossRef]
- Chen, T.; Yang, W.; Zhang, H.; Zhu, B.; Zeng, R.; Wang, X.; Wang, S.; Wang, L.; Qi, H.; Lan, Y.; et al. Early Detection of Bacterial Wilt in Peanut Plants through Leaf-Level Hyperspectral and Unmanned Aerial Vehicle Data. Comput. Electron. Agric. 2020, 177, 105708. [Google Scholar] [CrossRef]
- Li, S.; Wu, H.; Wan, D.; Zhu, J. An Effective Feature Selection Method for Hyperspectral Image Classification Based on Genetic Algorithm and Support Vector Machine. Knowl. Based Syst. 2011, 24, 40–48. [Google Scholar] [CrossRef]
- Riccioli, C.; Pérez-Marín, D.; Garrido-Varo, A. Optimizing Spatial Data Reduction in Hyperspectral Imaging for the Prediction of Quality Parameters in Intact Oranges. Postharvest Biol. Technol. 2021, 176, 111504. [Google Scholar] [CrossRef]
- Van De Vijver, R.; Mertens, K.; Heungens, K.; Somers, B.; Nuyttens, D.; Borra-Serrano, I.; Lootens, P.; Roldán-Ruiz, I.; Vangeyte, J.; Saeys, W. In-Field Detection of Alternaria Solani in Potato Crops Using Hyperspectral Imaging. Comput. Electron. Agric. 2020, 168, 105106. [Google Scholar] [CrossRef]
- Wu, G.; Fang, Y.; Jiang, Q.; Cui, M.; Li, N.; Ou, Y.; Diao, Z.; Zhang, B. Early Identification of Strawberry Leaves Disease Utilizing Hyperspectral Imaging Combing with Spectral Features, Multiple Vegetation Indices and Textural Features. Comput. Electron. Agriculture 2023, 204, 107553. [Google Scholar] [CrossRef]
- Appeltans, S.; Pieters, J.G.; Mouazen, A.M. Detection of Leek White Tip Disease under Field Conditions Using Hyperspectral Proximal Sensing and Supervised Machine Learning. Comput. Electron. Agric. 2021, 190, 106453. [Google Scholar] [CrossRef]
- Zhang, C.; Chen, T.; Chen, W.; Sankaran, S. Non-Invasive Evaluation of Ascochyta Blight Disease Severity in Chickpea Using Field Asymmetric Ion Mobility Spectrometry and Hyperspectral Imaging Techniques. Crop Prot. 2023, 165, 106163. [Google Scholar] [CrossRef]
- Fernández, C.I.; Leblon, B.; Wang, J.; Haddadi, A.; Wang, K. Cucumber Powdery Mildew Detection Using Hyperspectral Data. Can. J. Plant Sci. 2022, 102, 20–32. [Google Scholar] [CrossRef]
- Gu, Q.; Sheng, L.; Zhang, T.; Lu, Y.; Zhang, Z.; Zheng, K.; Hu, H.; Zhou, H. Early Detection of Tomato Spotted Wilt Virus Infection in Tobacco Using the Hyperspectral Imaging Technique and Machine Learning Algorithms. Comput. Electron. Agric. 2019, 167, 105066. [Google Scholar] [CrossRef]
- Li, J.; Huang, W.; Tian, X.; Wang, C.; Fan, S.; Zhao, C. Fast Detection and Visualization of Early Decay in Citrus Using Vis-NIR Hyperspectral Imaging. Comput. Electron. Agric. 2016, 127, 582–592. [Google Scholar] [CrossRef]
- Weng, H.; Lv, J.; Cen, H.; He, M.; Zeng, Y.; Hua, S.; Li, H.; Meng, Y.; Fang, H.; He, Y. Hyperspectral Reflectance Imaging Combined with Carbohydrate Metabolism Analysis for Diagnosis of Citrus Huanglongbing in Different Seasons and Cultivars. Sens. Actuators B Chem. 2018, 275, 50–60. [Google Scholar] [CrossRef]
- Xie, C.; Shao, Y.; Li, X.; He, Y. Detection of Early Blight and Late Blight Diseases on Tomato Leaves Using Hyperspectral Imaging. Sci. Rep. 2015, 5, 16564. [Google Scholar] [CrossRef] [PubMed]
- Gao, Z.; Khot, L.R.; Naidu, R.A.; Zhang, Q. Early Detection of Grapevine Leafroll Disease in a Red-Berried Wine Grape Cultivar Using Hyperspectral Imaging. Comput. Electron. Agric. 2020, 179, 105807. [Google Scholar] [CrossRef]
- Agilandeeswari, L.; Prabukumar, M.; Radhesyam, V.; Phaneendra, K.L.N.B.; Farhan, A. Crop Classification for Agricultural Applications in Hyperspectral Remote Sensing Images. Appl. Sci. 2022, 12, 1670. [Google Scholar] [CrossRef]
- Zhu, Y.; Abdalla, A.; Tang, Z.; Cen, H. Improving Rice Nitrogen Stress Diagnosis by Denoising Strips in Hyperspectral Images via Deep Learning. Biosyst. Eng. 2022, 219, 165–176. [Google Scholar] [CrossRef]
- Zhang, L.; Zhang, Q.; Wu, J.; Liu, Y.; Yu, L.; Chen, Y. Moisture Detection of Single Corn Seed Based on Hyperspectral Imaging and Deep Learning. Infrared Phys. Technol. 2022, 125, 104279. [Google Scholar] [CrossRef]
- Chiozza, M.V.; Parmley, K.A.; Higgins, R.H.; Singh, A.K.; Miguez, F.E. Comparative Prediction Accuracy of Hyperspectral Bands for Different Soybean Crop Variables: From Leaf Area to Seed Composition. Field Crops Res. 2021, 271, 108260. [Google Scholar] [CrossRef]
- Gui, J.; Fei, J.; Wu, Z.; Fu, X.; Diakite, A. Grading Method of Soybean Mosaic Disease Based on Hyperspectral Imaging Technology. Inf. Process. Agric. 2021, 8, 380–385. [Google Scholar] [CrossRef]
- Weng, S.; Tang, P.; Yuan, H.; Guo, B.; Yu, S.; Huang, L.; Xu, C. Hyperspectral Imaging for Accurate Determination of Rice Variety Using a Deep Learning Network with Multi-Feature Fusion. Spectrochim. Acta A Mol. Biomol. Spectrosc. 2020, 234, 118237. [Google Scholar] [CrossRef]
- Yang, Y.; Chen, J.; He, Y.; Liu, F.; Feng, X.; Zhang, J. Assessment of the Vigor of Rice Seeds by Near-Infrared Hyperspectral Imaging Combined with Transfer Learning. RSC Adv. 2020, 10, 44149–44158. [Google Scholar] [CrossRef]
- Ban, S.; Liu, W.; Tian, M.; Wang, Q.; Yuan, T.; Chang, Q.; Li, L. Rice Leaf Chlorophyll Content Estimation Using UAV-Based Spectral Images in Different Regions. Agronomy 2022, 12, 2832. [Google Scholar] [CrossRef]
- Yao, X.; Yi, Q.; Wang, F.; Xu, T.; Zheng, J.; Shi, Z. Estimating Rice Flower Intensity Using Flower Spectral Information from Unmanned Aerial Vehicle (UAV) Hyperspectral Images. Int. J. Appl. Earth Obs. Geoinf. 2023, 122, 103415. [Google Scholar] [CrossRef]
- Wu, N.; Weng, S.; Chen, J.; Xiao, Q.; Zhang, C.; He, Y. Deep Convolution Neural Network with Weighted Loss to Detect Rice Seeds Vigor Based on Hyperspectral Imaging under the Sample-Imbalanced Condition. Comput. Electron. Agric. 2022, 196, 106850. [Google Scholar] [CrossRef]
- Diao, Z.; Yan, J.; He, Z.; Zhao, S.; Guo, P. Corn Seedling Recognition Algorithm Based on Hyperspectral Image and Lightweight-3D-CNN. Comput. Electron. Agriculture 2022, 201, 107343. [Google Scholar] [CrossRef]
- Qiao, M.; Xu, Y.; Xia, G.; Su, Y.; Lu, B.; Gao, X.; Fan, H. Determination of Hardness for Maize Kernels Based on Hyperspectral Imaging. Food Chem. 2022, 366, 130559. [Google Scholar] [CrossRef] [PubMed]
- Shu, M.; Shen, M.; Zuo, J.; Yin, P.; Wang, M.; Xie, Z.; Tang, J.; Wang, R.; Li, B.; Yang, X.; et al. The Application of UAV-Based Hyperspectral Imaging to Estimate Crop Traits in Maize Inbred Lines. Plant Phenomics. 2021. [Google Scholar] [CrossRef] [PubMed]
- Colovic, M.; Yu, K.; Todorovic, M.; Cantore, V.; Hamze, M.; Albrizio, R.; Stellacci, A.M. Hyperspectral Vegetation Indices to Assess Water and Nitrogen Status of Sweet Maize Crop. Agronomy 2022, 12, 2181. [Google Scholar] [CrossRef]
- Grieco, M.; Schmidt, M.; Warnemünde, S.; Backhaus, A.; Klück, H.-C.; Garibay, A.; Tandrón Moya, Y.A.; Jozefowicz, A.M.; Mock, H.-P.; Seiffert, U.; et al. Dynamics and Genetic Regulation of Leaf Nutrient Concentration in Barley Based on Hyperspectral Imaging and Machine Learning. Plant Sci. 2022, 315, 111123. [Google Scholar] [CrossRef]
- Lausch, A.; Salbach, C.; Schmidt, A.; Doktor, D.; Merbach, I.; Pause, M. Deriving Phenology of Barley with Imaging Hyperspectral Remote Sensing. Ecol. Modell. 2015, 295, 123–135. [Google Scholar] [CrossRef]
- Yan, Y.; Ren, J.; Tschannerl, J.; Zhao, H.; Harrison, B.; Jack, F. Nondestructive Phenolic Compounds Measurement and Origin Discrimination of Peated Barley Malt Using Near-Infrared Hyperspectral Imagery and Machine Learning. IEEE Trans. Instrum. Meas. 2021, 70, 1–15. [Google Scholar] [CrossRef]
- Huang, H.; Hu, X.; Tian, J.; Peng, X.; Luo, H.; Huang, D.; Zheng, J.; Wang, H. Rapid and Nondestructive Determination of Sorghum Purity Combined with Deep Forest and Near-Infrared Hyperspectral Imaging. Food Chem. 2022, 377, 131981. [Google Scholar] [CrossRef]
- Zhu, S.; Zhou, L.; Zhang, C.; Bao, Y.; Wu, B.; Chu, H.; Yu, Y.; He, Y.; Feng, L. Identification of Soybean Varieties Using Hyperspectral Imaging Coupled with Convolutional Neural Network. Sensors 2019, 19, 4065. [Google Scholar] [CrossRef]
- Junkwon, P.; Takigawa, T.; Okamoto, H.; Hasegawa, H.; Koike, M.; Sakai, K.; Siruntawineti, J.; Chaeychomsri, W.; Sanevas, N.; Tittinuchanon, P.; et al. Potential Application of Color and Hyperspectral Images for Estimation of Weight and Ripeness of Oil Palm (Elaeis Guineensis Jacq. Var. Tenera). Agric. Inf. Res. 2009, 18, 72–81. [Google Scholar] [CrossRef]
- Bensaeed, O.M.; Shariff, A.M.; Mahmud, A.B.; Shafri, H.; Alfatni, M. Oil Palm Fruit Grading Using a Hyperspectral Device and Machine Learning Algorithm. IOP Conf. Ser. Earth Environ. Sci. 2014, 20, 012017. [Google Scholar] [CrossRef]
- Zou, S.; Tseng, Y.-C.; Zare, A.; Rowland, D.L.; Tillman, B.L.; Yoon, S.-C. Peanut Maturity Classification Using Hyperspectral Imagery. Biosyst. Eng. 2019, 188, 165–177. [Google Scholar] [CrossRef]
- Nansen, C.; Singh, K.; Mian, A.; Allison, B.J.; Simmons, C.W. Using Hyperspectral Imaging to Characterize Consistency of Coffee Brands and Their Respective Roasting Classes. J. Food Eng. 2016, 190, 34–39. [Google Scholar] [CrossRef]
- Zhang, C.; Liu, F.; He, Y. Identification of Coffee Bean Varieties Using Hyperspectral Imaging: Influence of Preprocessing Methods and Pixel-Wise Spectra Analysis. Sci. Rep. 2018, 8, 2166. [Google Scholar] [CrossRef] [PubMed]
- Ma, H.; Zhao, K.; Jin, X.; Ji, J.; Qiu, Z.; Gao, S. Spectral Difference Analysis and Identification of Different Maturity Blueberry Fruit Based on Hyperspectral Imaging Using Spectral Index. Int. J. Agric. Biol. Eng. 2019, 12, 134–140. [Google Scholar] [CrossRef]
- Nogales-Bueno, J.; Hernández-Hierro, J.M.; Rodríguez-Pulido, F.J.; Heredia, F.J. Determination of Technological Maturity of Grapes and Total Phenolic Compounds of Grape Skins in Red and White Cultivars during Ripening by near Infrared Hyperspectral Image: A Preliminary Approach. Food Chem. 2014, 152, 586–591. [Google Scholar] [CrossRef]
- Torres, I.; Sánchez, M.-T.; Cho, B.-K.; Garrido-Varo, A.; Pérez-Marín, D. Setting up a Methodology to Distinguish between Green Oranges and Leaves Using Hyperspectral Imaging. Comput. Electron. Agric. 2019, 167, 105070. [Google Scholar] [CrossRef]
- Yu, S.; Fan, J.; Lu, X.; Wen, W.; Shao, S.; Liang, D.; Yang, X.; Guo, X.; Zhao, C. Deep Learning Models Based on Hyperspectral Data and Time-Series Phenotypes for Predicting Quality Attributes in Lettuces under Water Stress. Comput. Electron. Agric. 2023, 211, 108034. [Google Scholar] [CrossRef]
- Ronay, I.; Ephrath, J.E.; Eizenberg, H.; Blumberg, D.G.; Maman, S. Hyperspectral Reflectance and Indices for Characterizing the Dynamics of Crop—Weed Competition for Water. Remote Sens. 2021, 13, 513. [Google Scholar] [CrossRef]
- Leiva-Valenzuela, G.A.; Lu, R.; Aguilera, J.M. Assessment of Internal Quality of Blueberries Using Hyperspectral Transmittance and Reflectance Images with Whole Spectra or Selected Wavelengths. Innov. Food Sci. Emerg. Technol. 2014, 24, 2–13. [Google Scholar] [CrossRef]
- Gao, Z.; Shao, Y.; Xuan, G.; Wang, Y.; Liu, Y.; Han, X. Real-Time Hyperspectral Imaging for the in-Field Estimation of Strawberry Ripeness with Deep Learning. Artif. Intell. Agric. 2020, 4, 31–38. [Google Scholar] [CrossRef]
- Che, W.; Sun, L.; Zhang, Q.; Tan, W.; Ye, D.; Zhang, D.; Liu, Y. Pixel Based Bruise Region Extraction of Apple Using Vis-NIR Hyperspectral Imaging. Comput. Electron. Agric. 2018, 146, 12–21. [Google Scholar] [CrossRef]
- Suarez, L.; Zhang, P.; Sun, J.; Wang, Y.; Poblete, T.; Hornero, A.; Zarco-Tejada, P.J. Assessing Wine Grape Quality Parameters Using Plant Traits Derived from Physical Model Inversion of Hyperspectral Imagery. Agric. For. Meteorol. 2021, 306, 108445. [Google Scholar] [CrossRef]
- Mesa, A.R.; Chiang, J.Y. Multi-Input Deep Learning Model with RGB and Hyperspectral Imaging for Banana Grading. Agriculture 2021, 11, 687. [Google Scholar] [CrossRef]
- Sun, H.; Liu, N.; Wu, L.; Chen, L.; Yang, L.; Li, M.; Zhang, Q. Water Content Detection of Potato Leaves Based on Hyperspectral Image. IFAC-PapersOnLine 2018, 51, 443–448. [Google Scholar] [CrossRef]
- Badaró, A.T.; Garcia-Martin, J.F.; del Carmen López-Barrera, M.; Barbin, D.F.; Alvarez-Mateos, P. Determination of Pectin Content in Orange Peels by near Infrared Hyperspectral Imaging. Food Chem. 2020, 323, 126861. [Google Scholar] [CrossRef]
- Tang, Y.; Wang, F.; Zhao, X.; Yang, G.; Xu, B.; Zhang, Y.; Xu, Z.; Yang, H.; Yan, L.; Li, L. A Nondestructive Method for Determination of Green Tea Quality by Hyperspectral Imaging. J. Food Compost. Anal. 2023, 123, 105621. [Google Scholar] [CrossRef]
- Abd-El Monsef, H.; Smith, S.E.; Rowland, D.L.; Abd El Rasol, N. Using Multispectral Imagery to Extract a Pure Spectral Canopy Signature for Predicting Peanut Maturity. Comput. Electron. Agric. 2019, 162, 561–572. [Google Scholar] [CrossRef]
- Rutkoski, J.; Poland, J.; Mondal, S.; Autrique, E.; Pérez, L.G.; Crossa, J.; Reynolds, M.; Singh, R. Canopy Temperature and Vegetation Indices from High-Throughput Phenotyping Improve Accuracy of Pedigree and Genomic Selection for Grain Yield in Wheat. G3 2016, 6, 2799–2808. [Google Scholar] [CrossRef] [PubMed]
- Ampatzidis, Y.; De Bellis, L.; Luvisi, A. IPathology: Robotic Applications and Management of Plants and Plant Diseases. Sustainability 2017, 9, 1010. [Google Scholar] [CrossRef]
- Zhu, W.; Sun, Z.; Yang, T.; Li, J.; Peng, J.; Zhu, K.; Li, S.; Gong, H.; Lyu, Y.; Li, B.; et al. Estimating Leaf Chlorophyll Content of Crops via Optimal Unmanned Aerial Vehicle Hyperspectral Data at Multi-Scales. Comput. Electron. Agric. 2020, 178, 105786. [Google Scholar] [CrossRef]
- Li, L.; Zhang, Q.; Huang, D. A Review of Imaging Techniques for Plant Phenotyping. Sensors 2014, 14, 20078–20111. [Google Scholar] [CrossRef] [PubMed]
- Schaepman, M.E.; Ustin, S.L.; Plaza, A.J.; Painter, T.H.; Verrelst, J.; Liang, S. Earth System Science Related Imaging Spectroscopy—An Assessment. Remote Sens. Environ. 2009, 113, S123–S137. [Google Scholar] [CrossRef]
- Thenkabail, P.; Lyon, J.; Huete, A. Advances in Hyperspectral Remote Sensing of Vegetation and Agricultural Croplands. In Hyperspectral Remote Sensing of Vegetation; CRC Press: Boca Raton, FL, USA, 2011; pp. 3–36. [Google Scholar]
- Barbedo, J.G.A. A Review on the Combination of Deep Learning Techniques with Proximal Hyperspectral Images in Agriculture. Comput. Electron. Agric. 2023, 210, 107920. [Google Scholar] [CrossRef]
- Mishra, M.K.; Rathore, P.S.; Misra, A.; Kumar, R. Atmospheric Correction of Multispectral VNIR Remote Sensing Data: Algorithm and Inter-sensor Comparison of Aerosol and Surface Reflectance Products. Earth Space Sci. 2020, 7, e2019EA000710. [Google Scholar] [CrossRef]


| Journal | Cite Score | SJR | H-Index | JCR | ISSN | ND |
|---|---|---|---|---|---|---|
| Computers and Electronics in Agriculture | 13.6 | 1.59 | 149 | 8.3 | 0168-1699 | 19 |
| Remote sensing | 7.9 | 1.14 | 168 | 5.0 | 2072-4292 | 7 |
| Infrared Physics and Technology | 5.6 | 0.6 | 78 | 3.3 | 1350-4495 | 6 |
| Food Chemistry | 14.9 | 1.62 | 302 | 8.8 | 1873-7072 | 6 |
| Sensors | 6.8 | 0.76 | 219 | 3.9 | 1424-8220 | 5 |
| Agronomy | 5.2 | 0.66 | 67 | 3.7 | 2073-4395 | 4 |
| Biosystems Engineering | 10.1 | 1.06 | 125 | 5.1 | 1537-5129 | 3 |
| Journal of Cereal Science | 6.8 | 0.74 | 131 | 3.8 | 1095-9963 | 3 |
| Journal of Food Composition and Analysis | 5.5 | 0.65 | 130 | 4.3 | 1096-0481 | 2 |
| Journal of Integrative Agriculture | 7.2 | 0.94 | 69 | 4.8 | 2095-3119 | 2 |
| Sensors and Actuators B: Chemical | 14.6 | 0.64 | 145 | 8.4 | 0925-4005 | 2 |
| Spectrochimica Acta Part A: Molecular and Biomolecular Spectroscopy | 7.9 | 0.64 | 145 | 1386-1425 | 2 | |
| ISPRS Journal of Photogrammetry and Remote Sensing | 19.2 | 3.31 | 174 | 12.7 | 0924-2716 | 2 |
| International Journal of Applied Earth Observation and Geoinformation | 10.2 | 1.63 | 120 | 7.5 | 1872-826X | 2 |
| Plant Methods | 5.1 | 1.12 | 86 | 5.1 | 1746-4811 | 2 |
| Ecological Informatics | 6.1 | 0.92 | 66 | 5.1 | 1574-9541 | 2 |
| IEEE Computer Science Computer Science (miscellaneous) | 3.5 | 0.93 | 204 | 3.9 | 2169-3536 | 2 |
| International Journal of Remote Sensing | 7 | 0.73 | 195 | 3.4 | 1366-5901 | 1 |
| Frontiers of Plant Sciences | 7.1 | 1.23 | 187 | 5.6 | 1664-462X | 1 |
| Model | Performance | Advantages | Drawbacks |
|---|---|---|---|
| Support Vector Machines (SVMs) | SVMs are widely used in hyperspectral imaging for classification tasks due to their effectiveness in high-dimensional spaces. | Robustness: SVMs are capable of handling non-linear data distributions with the use of kernel functions Generalization: They are less prone to overfitting, especially in scenarios with limited training data. | Computational Intensity: Training and testing can be slow, particularly with large datasets. Parameter Tuning: They require the careful selection of parameters, like the regularization parameter and kernel type, which can be computationally expensive. |
| Convolutional Neural Networks (CNNs) | CNNs excel in image processing, including hyperspectral imaging, by leveraging spatial and spectral correlations. | Feature Learning: They automatically learn hierarchical features from data, feature extraction, integration of spatial and spectral information, and robustness to noise. Spatial Context: They have improved classification accuracy, scalability, flexibility in network design, and the ability to leverage transfer learning. | Data Requirements: They require large amounts of labeled data for effective training. Computational Resources: Training CNNs is resource-intensive, often requiring GPUs. |
| Backpropagation Neural Networks (BPNNs) | BPNNs offer a flexible and powerful approach for analyzing hyperspectral imaging data, capable of addressing various tasks such as classification, regression, dimensionality reduction, and feature learning | Classification: BPNNs can be used for classification tasks in hyperspectral imaging, where the goal is to classify each pixel in an image into predefined classes or categories. By training on labeled hyperspectral data, BPNNs can learn to identify spectral signatures associated with different materials or land cover types. Feature Learning: BPNNs are capable of learning hierarchical representations of data, which can be beneficial for feature learning in hyperspectral imaging. Transfer Learning: BPNNs trained on large-scale datasets from other domains, such as natural images, can be fine-tuned for hyperspectral imaging tasks through transfer learning by leveraging pre-trained models and adapting them to hyperspectral data. | Training Time and Computational Resources: Training deep BPNNs on large hyperspectral datasets can be computationally intensive and time-consuming, especially when using complex architectures and optimization algorithms. Hyperparameter Tuning: BPNNs have several hyperparameters, including the number of layers, the number of neurons per layer, the learning rate, and the activation functions, which need to be carefully tuned to achieve optimal performance. Finding the right combination of hyperparameters can be challenging and may require extensive experimentation. |
| Random Forests (RFs) | RFs are effective for both classification and regression tasks in hyperspectral data processing, leveraging an ensemble of decision trees. | Non-linearity Handling: They are capable of modeling complex relationships. Feature Importance: They provide insights into the importance of different spectral bands. Scalability: They efficiently handle large datasets. | Interpretability: They are less interpretable than simpler models. Overfitting: There is a risk of overfitting if not properly validated, though typically less than other methods. |
| Deep Forest | Deep forests show promise for hyperspectral image analysis, particularly due to their strengths in handling complex, high-dimensional data. | Efficient Handling of High-Dimensional Data: Hyperspectral images consist of a large number of spectral bands, resulting in high-dimensional data. Deep forests, with their hierarchical feature learning approach, can effectively handle such high-dimensional data by learning hierarchical representations of the spectral information. Robustness to Noise: Hyperspectral images may contain noise due to various factors such as sensor limitations or atmospheric conditions. Deep forests have shown robustness to noise, which can be beneficial in real-world hyperspectral imaging applications where data quality may be variable. | Complexity: Deep forests involves multiple layers of decision forests, which can increase the complexity of the model. This complexity may lead to longer training times and increased computational resources required, especially for large-scale hyperspectral imaging datasets. Interpretability: Although deep forests provide hierarchical representations of the data, their overall structure can be complex, making them challenging to interpret compared to simpler models like decision trees. Understanding how the model arrives at its predictions may be more difficult, which can be a drawback in applications where interpretability is crucial. |
| Recurrent Neural Networks (RNNs) and Long Short-Term Memory (LSTM) Networks | RNNs and LSTM networks are suited for sequential data, making them adaptable to the spectral dimension in hyperspectral data. | Sequence Modeling: LSTM networks captures dependencies across spectral bands due to their memory capabilities. Temporal Patterns: They are effective at learning patterns across the spectral sequence. | Training: Complexity: They can be difficult to train due to issues like vanishing gradients. Computational Load: They have a high computational demand for training and inference |
| K-Nearest Neighbors (k-NNs) | K-nearest neighbors (k-NNs) are non-parametric machine learning algorithms widely used in hyperspectral image classification. | Intuitive Approach: k-NNs are straightforward and easy to understand. They classify a sample based on the majority label among its k-nearest neighbors. No Training Phase: Unlike other models that require an extensive training process, k-NN is a lazy learning algorithm. This means that it does not require a separate training phase, making implementation simpler and faster. | High Computational Cost: The algorithm requires computing distances between the test sample and all training samples, which can be computationally expensive, especially with large datasets typical in hyperspectral imaging. Memory Usage: Storing all training samples for distance computation can require significant memory resources. |
| Extreme Learning Machines (ELMs) | ELMs (extreme learning machines) can be a valuable tool for analyzing hyperspectral images, offering some advantages over traditional methods. | Fast Training: ELMs excel in training speed compared to traditional neural networks. This is particularly beneficial for hyperspectral data, which can be high-dimensional and computationally expensive to analyze. Good Generalization: ELMs can achieve good performance on unseen data, making them suitable for real-world applications where the model needs to handle variations not present in the training set. Less Prone to Overfitting: The random assignment of weights in ELMs helps to reduce the risk of overfitting the training data, which can be a common issue with hyperspectral image analysis due to the high dimensionality. Potentially Competitive Accuracy: ELMs can achieve a classification accuracy comparable to other methods like support vector machines (SVMs) with significantly faster training times. | Limited Interpretability: Like many other machine learning algorithms, ELMs are often considered as “black box” models, meaning that it can be challenging to interpret how the model arrives at its predictions. In hyperspectral imaging applications where interpretability is crucial for understanding the underlying physical phenomena, this lack of interpretability could be a drawback. Sensitivity to Initialization: ELMs rely on randomly generated input-to-hidden layer weights, which can make them sensitive to initialization. Although this randomness contributes to their fast training speed, it can also lead to variability in model performance and requires the careful tuning of hyperparameters. |
| Partial Least Squares Regression (PLSR) | Partial least squares regression (PLSR) is primarily used for dimensionality reduction and regression tasks, but it can also be applied to classification tasks in hyperspectral imaging. | Dimensionality Reduction: PLSR can effectively reduce the dimensionality of hyperspectral data while preserving relevant spectral information. Interpretability: PLSR models are relatively interpretable compared to some other machine learning techniques, such as deep learning models. The latent variables extracted by PLSR represent linear combinations of the original spectral bands, allowing researchers to understand how different spectral features contribute to the prediction of the target variable. | Linear Model Assumption: PLSR assumes a linear relationship between the spectral data and the target variable. If the underlying relationship is highly nonlinear, PLSR may not capture it accurately, leading to suboptimal predictions. Overfitting: Like any regression technique, PLSR is susceptible to overfitting, especially when the number of latent variables or components is not properly chosen. Overfitting can occur if the model captures noise in the training data rather than the underlying signal, resulting in poor generalization performance on unseen data. Interpretability Trade-off: While PLSR provides relatively interpretable models compared to some other machine learning techniques, such as deep learning models, the interpretation of latent variables and their contributions to the prediction may not always be straightforward, especially in high-dimensional datasets. |
| Naïve Bayes | The Naïve Bayes algorithm is used for classification problems. | Efficiency: Naive Bayes is computationally efficient, making it suitable for analyzing hyperspectral data, which often involves a large number of spectral bands. Simple Model: Its simplicity makes it easy to implement and understand, which can be advantageous for quick analysis and prototyping. Handling of High-Dimensional Data: Naive Bayes can handle high-dimensional data effectively, making it suitable for hyperspectral imaging, where each pixel in an image is represented by a large number of spectral bands. Probabilistic Predictions: Naive Bayes provides probabilistic predictions, allowing for the estimation of class probabilities. This can be useful for decision making and assessing the confidence of predictions. | Strong Independence Assumption: The “naive” assumption of independence between features may not hold true in hyperspectral data, where spectral bands are often correlated. This can lead to suboptimal performance when features are dependent. Limited Expressiveness: Naive Bayes may struggle to capture complex relationships and interactions between spectral bands in hyperspectral data. As a result, it may not perform as well as more complex models in scenarios where feature dependencies are significant. |
| Classification and Decision Tree (CART) | A decision tree is a supervised learning algorithm that is used for classification and regression modeling. | Interpretability: Decision trees are highly interpretable models, which makes them suitable for analyzing hyperspectral imaging data. They provide insights into the decision-making process by visualizing the hierarchical structure of the tree. Handling of High-Dimensional Data: Decision trees can handle high-dimensional data, such as hyperspectral images, effectively. They select the most informative spectral bands for classification, which can aid in feature selection and dimensionality reduction. | Overfitting: Decision trees are prone to overfitting, especially when the tree depth is not appropriately controlled. A deep tree may capture noise in the training data, leading to poor generalization performance on unseen data. High Variance: Decision trees have high variance, meaning that they can produce different trees for the same dataset due to small variations in the training data. This sensitivity to data changes can make decision trees less robust. |
| Reference | Crops | Disease | Bandwidths (nm) | Algorithms |
|---|---|---|---|---|
| [83] | Wheat | Frost and drought stress | (280–500) | Partial least squares regression (PLSR) |
| [42] | Wheat | Fusarium head blight | (400–1000, 1000–2500) | Support vector machine (SVM) |
| [59] | Wheat | Fusarium head blight | (600–1100) | Support vector machine (SVM), artificial neural network (ANN), logistic regression (LR) |
| [59] | Wheat | Fusarium head blight | (400–750) | Combined convolutional neural network (CNN) |
| [84] | Wheat | Fusarium head blight | (450–950) | Random forest (RF) algorithm |
| [85] | Wheat | Fusarium head blight | (1100, 1197, 1308, 1394) | Partial least squares discriminant analysis (PLSDA) |
| [86] | Wheat | Fusarium head blight | (941, 876, 732) | Competitive adaptive reweighting algorithm (CARS) |
| [79] | Wheat | Fusarium head blight | Variable | Residual attention convolution neural network (RACNN) |
| [87] | Wheat | Yellow rust | (400–1000) | Support vector machine (SVM) |
| [88] | Wheat | Rice weevil | (866.4–1701) | Linear discriminant analysis (LDA), support vector machine (SVM), principal component analysis (PCA) |
| [89] | Rice | Insect damage | Variable | Principal component analysis (PCA) |
| [90] | Rice | Sheath blight | (726–930) | Support vector machine (SVM) |
| [91] | Rice | Nitrogen deficiency | (550–690) | Long short-term memory (LTSM), multivariate linear regression (MLR) |
| [92] | Rice | Rice false smut | (874.41–1734.91) | Principal component analysis (PCA) |
| [93] | Corn | Glyphosate-resistant (GR) | (400–900) | K-nearest neighbor (k-NN), random forest (RF), support vector machine (SVM) |
| [94] | Corn | Cold damage | (395–885) | Convolutional neural network (CNN) |
| [95] | Corn | Aflatoxin contamination | Variable | Partial least squares discriminant analysis (PLSDA) |
| Reference | Crops | Disease | Bandwidths (nm) | Algorithms |
|---|---|---|---|---|
| [139] | Lettuces | Phenotypes | (400–1000) | Recurrent neural networks (RNNs), long short-term memory (LSTM) |
| [135] | Coffee | Coffee bean varieties | (973–1630) | Wavelet transform (WT), support vector machine (SVM) |
| [135] | Coffee | Coffee bean varieties | (973–1629) | Moving average smoothing (MA), wavelet transform (WT), support vector machine (SVM), empirical mode decomposition (EMD) |
| [134] | Coffee | Consistency | (408–1008) | Partial least squares (PLS) |
| [140] | Weed | Indicator of competition for water | Variable | Analysis of variance (ANOVA) |
| [136] | Blueberry | Growth stages | Variable | Spectral angle mapping (SAM), multinomial logistic regression (MLR) |
| [141] | Blueberry | Internal quality | (400–100) | Partial least squares (PLS) |
| [142] | Strawberry | Strawberry ripeness | (503, 604 528, 715) | Support vector machine (SVM), convolutional neural network (CNN) |
| [143] | Apple | Bruise region | (675–960) | Principal component analysis (PCA), random forest (RF) |
| [31] | Apple | Bruise damage | (930–2500) | K-nearest Neighbor (k-NN), linear discriminant analysis (LDA), support vector machine (SVM) |
| [55] | Grape | Predicting sugar, total flavonoid, and total anthocyanin contents | (411–1000) | Multiple linear regression (MLR), partial least squares (PLS) |
| [144] | Grape | Pigment composition | (400–1000) | Radiative transfer model (RTM) |
| [137] | Grape | Maturity of grapes | (900–1700) | Modified partial least squares regression (MPLS) |
| [145] | Banana | Banana grading | (1069.21) | Convolutional neural network (CNN), multilayer perceptron (MLP) |
| [146] | Potato | Water content | (1400–1450) | Partial least squares (PLS), competitive adaptive reweighting algorithm (CARS) |
| [101] | Orange | Orange quality | (900–1700) | Artificial neural network (ANN) |
| [147] | Orange | Pectin content | (900–2500) | Principal component analysis (PCA), partial least squares regression (PLSR) |
| [138] | Orange | Distinction between green oranges and leaves | (400–100 900–2500) | Analysis of variance (ANOVA) |
| [108] | Citrus | Early decay | (325–1100) | Principal component analysis (PCA) |
| [148] | Tea | Green tea quality | (379–1040) | K-nearest neighbor (k-NN), support vector machine (SVM) |
| [149] | Peanut | Peanut maturity | (545, 660, 790) | Partial least squares (PLS) |
| Advantage | Hyperspectral Imaging | RGB Imaging |
|---|---|---|
| Spectral Resolution | Captures a wide spectrum of light across many narrow, contiguous bands, ranging from the visible to the near-infrared and even further. This allows for the detection of subtle differences in plant properties. | Captures light in only three broad bands (red, green, and blue), limiting the amount of information that can be obtained about the vegetation. |
| Detailed Analysis of Plant Health | Can detect specific wavelengths that are indicative of particular plant health issues, such as nutrient deficiencies, water stress, disease, or pest infestations, often before these issues are visible to the naked eye. | Provides limited information, mainly based on color changes that are visible to the human eye, which usually appear at later stages of plant health problems. |
| Enhanced Crop Monitoring | Allows for the detailed monitoring of plant growth and development, enabling precision agriculture practices such as variable rate application of fertilizers and pesticides. | Can provide basic information about plant growth stages and general health but lacks the detailed spectral information necessary for precise monitoring. |
| Soil and Crop Differentiation | Can distinguish between different soil types, crop species, and even different varieties of the same crop by analyzing their unique spectral signatures. | Often struggles to differentiate between similar-looking soils and crops due to its limited spectral information. |
| Yield Prediction | Enables more accurate yield predictions by analyzing the spectral signatures related to plant biomass, chlorophyll content, and other growth parameters. | Provides more general estimates based on visible growth, which may not be as precise. |
| Environmental Monitoring | Can detect environmental stressors such as pollution, soil contamination, and water quality issues by analyzing specific spectral features. | Limited in its ability to detect such detailed environmental conditions. |
Disclaimer/Publisher’s Note: The statements, opinions and data contained in all publications are solely those of the individual author(s) and contributor(s) and not of MDPI and/or the editor(s). MDPI and/or the editor(s) disclaim responsibility for any injury to people or property resulting from any ideas, methods, instructions or products referred to in the content. |
© 2024 by the authors. Licensee MDPI, Basel, Switzerland. This article is an open access article distributed under the terms and conditions of the Creative Commons Attribution (CC BY) license (https://creativecommons.org/licenses/by/4.0/).
Share and Cite
García-Vera, Y.E.; Polochè-Arango, A.; Mendivelso-Fajardo, C.A.; Gutiérrez-Bernal, F.J. Hyperspectral Image Analysis and Machine Learning Techniques for Crop Disease Detection and Identification: A Review. Sustainability 2024, 16, 6064. https://doi.org/10.3390/su16146064
García-Vera YE, Polochè-Arango A, Mendivelso-Fajardo CA, Gutiérrez-Bernal FJ. Hyperspectral Image Analysis and Machine Learning Techniques for Crop Disease Detection and Identification: A Review. Sustainability. 2024; 16(14):6064. https://doi.org/10.3390/su16146064
Chicago/Turabian StyleGarcía-Vera, Yimy E., Andrés Polochè-Arango, Camilo A. Mendivelso-Fajardo, and Félix J. Gutiérrez-Bernal. 2024. "Hyperspectral Image Analysis and Machine Learning Techniques for Crop Disease Detection and Identification: A Review" Sustainability 16, no. 14: 6064. https://doi.org/10.3390/su16146064