Article

Sustainable Brand Reputation: Evaluation of iPhone Customer Reviews with Machine Learning and Sentiment Analysis

by
Mehmet Kayakuş
1,*,
Fatma Yiğit Açikgöz
2,
Mirela Nicoleta Dinca
3,* and
Onder Kabas
4
1
Department of Management Information Systems, Faculty of Social and Human Sciences, Akdeniz University, Antalya 07070, Türkiye
2
Department of Marketing and Advertising, Social Sciences Vocational School, Akdeniz University, Antalya 07070, Türkiye
3
Department of Biotechnical Systems, Faculty of Biotechnical Systems Engineering, National University of Science and Technology Politehnica Bucharest, 060042 Bucharest, Romania
4
Department of Machine, Technical Science Vocational School, Akdeniz University, Antalya 07070, Türkiye
*
Authors to whom correspondence should be addressed.
Sustainability 2024, 16(14), 6121; https://doi.org/10.3390/su16146121
Submission received: 26 June 2024 / Revised: 15 July 2024 / Accepted: 16 July 2024 / Published: 17 July 2024

Abstract

:
Brand reputation directly influences customer trust and decision-making. A good reputation can lead to greater customer loyalty, commitment, and advocacy. This study aims to understand the effects of brand reputation on customer trust and loyalty and to determine how brands can protect their reputation. This study, which was conducted on the iPhone 11 sample by obtaining statistical data from customer reviews, can be adapted and used by researchers and companies that want to measure brand reputation. In this study, customer reviews for the iPhone 11 phone on the Trendyol e-commerce site, the largest e-commerce platform in Turkey, are analyzed using sentiment analysis and machine learning methods. While 85 percent of customers are satisfied with the iPhone 11, 13 percent are dissatisfied with it. The neutral comment rate of 2 percent indicates that some customers do not express a clear positive or negative opinion about the product. In the comments of customers who bought the iPhone 11, there are those who express satisfaction with the quality, technical features, performance, and price/performance ratio of the product, as well as those who express significant complaints about delivery, quality, price, and customer service. Neutral comments generally focus on the product itself, price, quality, shipping, and packaging, and make informative evaluations. A sustainable reputation is based on the extent to which an organization embraces ethical principles, social responsibility, and sustainable practices throughout its operations and business relationships. Brands can improve, protect, and increase their brand reputation by considering and analyzing the thoughts and feelings of their customers. For this, they should develop policies and strategies to reinforce their strong features and improve their faulty and deficient features.

1. Introduction

Reputation is the general respectability and reliability of a person or organization in society. It is built based on the past actions, behaviors, and achievements of the person or organization. Reputation is important in business because it affects customer trust, brand value, partnerships, employee relations, investor confidence, crisis management, and the overall working environment.
Brand reputation is the perception of customers, employees, business partners, and others about a brand. A strong brand reputation brings many benefits, such as higher customer loyalty, more sales, better employee recruitment, and more favorable media coverage [1]. Brand reputation can change over time, both on an individual and societal scale. Therefore, it is very important for companies to monitor and manage it closely. Brand reputation can be managed using a variety of strategies, such as consistent brand messaging, excellent customer service, and social responsibility initiatives [2].
Sentiment analysis uses social media data and other online sources to understand what people think and feel about a brand [3]. By analyzing data from social media data and customer reviews, sentiment analysis can provide valuable insights into brand perception [4]. This information can be used to refine marketing strategies, improve customer service, and drive reputation management efforts.
Text mining is a powerful method for analyzing vast quantities of textual data and uncovering valuable insights [5]. Together, brand reputation and text mining can be used to help brands monitor and improve their reputation [6]. Utilizing text mining allows businesses to analyze customer feedback across social media, online reviews, and forums to enhance their brand reputation and address any customer satisfaction concerns [7].
Sustainable practices significantly strengthen a company’s brand image, positioning it as a forward-thinking and responsible organization and appealing to consumers’ values. Sustainability acts as a magnet to attract talented individuals seeking purpose and alignment in their professional lives with their personal values. The impact of sustainable practices extends beyond brand reputation. In addition to increasing customer loyalty, such practices can also motivate employees.
In this study, customer reviews for iPhone 11 (Apple Inc., Cupertino, CA, USA) phones on Trendyol (İstanbul, Türkiye), the largest e-commerce platform in Turkey, are analyzed using sentiment analysis and text mining methods [8,9]. The results are evaluated in terms of iPhone’s brand reputation. The customer-oriented reputation of the brand and the features that affect it are mentioned and suggestions are made to increase the brand reputation.

2. Literature

Brand reputation is a multifaceted concept that encompasses the opinions of customers, employees, and other stakeholders about a brand. Academic studies in this field offer various perspectives that examine the formation, management, and impact of brand reputation.
Loureiro et al. conducted a study with the objective of examining the influence of corporate brand reputation on brand engagement and brand loyalty within the automotive industry, specifically focusing on the brands Tesla, Toyota, and Volvo. This analysis involved a collaborative effort and a sample survey encompassing 327 participants who are associated with car brand communities. The results of the study indicate that the perception of corporate brand reputation holds a greater influence on increasing brand loyalty compared to brand loyalty itself. It is noteworthy, however, that this influence may be contingent upon the specific strategy employed by the car brand. Furthermore, it can be posited that customer service and altruism are among the most significant corporate attributes perceived by the customers of these three brands [10].
Greyser seeks to offer a comprehensive understanding of the identification, causes, and management of corporate brand crises by amalgamating corporate case studies and the perils to brand reputation. The objective is to furnish guidelines for analytical methodologies and suggested corporate measures. The publication presents an analytical framework for evaluating the gravity of risks to corporate brand reputation. It underscores that openness in communication and authentic and reliable responsiveness in conduct are the most effective means to regain trust and salvage a brand facing a crisis [11].
Vidya et al. undertake the investigation of this issue by quantifying brand reputation through an assessment of customer satisfaction via the analysis of customer sentiment expressed on Twitter. The researchers collected and analyzed 10,000 original Twitter messages from January to March 2015 pertaining to three leading mobile service providers in Indonesia. The study encompasses a comparative analysis of different methods for feature extraction, algorithms, and classification schemes. Following the essential steps of data cleaning and balancing, sentiments are evaluated and juxtaposed utilizing three distinct algorithms: Naïve Bayes, Support Vector Machine, and the Decision Tree classifier approach. The evaluation of customer satisfaction spans across five product categories, namely 3G, 4G, short messaging, voice, and Internet services. The findings underscore the significance of telecommunication companies accommodating a substantial user base for these services while still being unaware of the public perception regarding the quality of their service provision. Significantly, the study highlights the prevalent tendency of disregarding user opinions by these companies [12].
Sharma et al. conducted an analysis of smartphone company brand reputations in India utilizing Twitter sentiment analysis. The study’s primary objective was to identify the most favored brand among Indian smartphone users. The examined brands include Xiaomi, Samsung, Honor, Apple, OnePlus, and Lenovo, and their ranking was determined according to their net brand reputation scores. The findings of this research aimed to assist consumers in making informed decisions when purchasing smartphones by considering the expressed sentiments of fellow Indian smartphone users on social media platforms regarding specific brands [13].
Haruna Isah et al. analyzed the opinions and experiences of users of pharmaceutical and cosmetic products through Facebook and Twitter comments using machine learning, text mining, and sentiment analysis. This work provides a useful model for customers, product manufacturers, and organizations to monitor brand or product sentiment trends and take action when there is a sudden or significant increase in negative sentiment [14].
Li et al. examined the economic impact of tourism by proposing a Travel Review Sentiment Classifier that analyzes online reviews of hotels in Egypt. A total of 11,458 reviews of five hotels in Aswan were collected and analyzed using three classification techniques, such as Naïve Bayes, support vector machines, and decision trees. The results show that the Naïve Bayes algorithm has the highest level of accuracy [15].
Mostafa aimed to analyze travelers’ reviews on hotels in Egypt and classify each sentiment according to hotel characteristics. Travelers’ sentiments regarding five hotels located in Aswan, with a total of 11,458 reviews, were collected and analyzed. The sentiment model uses three classification techniques, namely support vector machines, naive bayes, and decision trees. The results show that Naïve Bayes has the highest level of accuracy [16].
Hossain and Rahman used various machine learning techniques to analyze and predict customer reviews of insurance products. The dataset used consists of consumer rating data from the Yelp website. The texts were rated with positive, neutral, or negative sentiments. The findings of the study revealed that customer reviews of insurance products were mostly negative, and the average number of words with negative sentiment was higher. Furthermore, the study revealed that all approaches, such as decision trees, K-neighbors’ classifiers, support vector machines (SVM), logistic regression, and random forest classifiers, can accurately classify the review text into sentiment classes, but logistic regression performs better at high accuracy [17].
Rasool et al. measured public opinion regarding the top two international clothing brands and compared positive or negative attitudes toward each brand. They used Twitter data for sentiment analysis. They used machine learning techniques such as the Naïve Bayes method for classification [18].
Loukili et al. compared the performance metrics of supervised machine learning models to identify the best-performing model for consumer sentiment analysis using a dataset of women’s clothing e-commerce stores. They obtained between 80% and 90% accuracy from the proposed models. The logistic regression model outperformed the other models in terms of confusion matrix parameters and AUC score [19].
Ahmad et al. develop an application to help users make purchasing decisions by analyzing user responses about the product. Using sentiment analysis and opinion mining methods, their study shows that Motorola has the highest popularity among all brands. They also calculated the net brand reputation of all brands and found that Motorola has the highest net brand reputation [20].

3. Materials and Methods

This study is limited to iPhone 11 customer reviews on the Trendyol e-commerce platform. In addition, the methods used in the study are limited to sentiment analysis and machine learning and consist of 10,143 customer reviews.
Figure 1 shows the four steps of the approach proposed. Initially, the raw data is made ready for analysis by text pre-processing. Then, features are extracted from user reviews using feature extraction algorithms. During the third stage, the product’s prominent attributes are determined through the process of text mining. Subsequently, in the fourth phase, support vector regression, a machine learning technique, is employed to categorize customers’ product evaluations based on sentiment analysis. The outputs of the proposed system consist of the following positive, neutral, and negative emotional states.

3.1. Data Collection

The dataset utilized in this study was sourced from customer comments retrieved from the Trendyol e-commerce website. Trendyol is an e-commerce platform established in 2010. Initially selling only fashion products, Trendyol has expanded its product range over time and now serves in many categories, such as electronics, household goods, and cosmetics. Trendyol is one of the largest e-commerce platforms in Turkey. In 2022, with more than 30 million active users and deliveries to more than 100 countries, it will be among the most visited e-commerce websites in Turkey [8].
There are various studies that confirm the loyalty of iPhone users to the Apple brand. According to a 2021 report by Consumer Intelligence Research Partners (CIRP), most iPhone users have high satisfaction rates and plan to choose the iPhone again in their next phone choice [21]. In addition, according to Statista (Hamburg, Germany) surveys in 2020 and 2021, more than 90 percent of iPhone users said they plan to use iPhones in the future [22]. In the 2021 study of Brand Keys (New York, NY, USA), which publishes annual reports on brand loyalty, it was stated that Apple users are at the top of brand loyalty. These studies explain why Apple has created strong brand loyalty and why its users cannot give up the brand [23].
The iPhone phone brand was preferred for brand reputation analysis. The iPhone is a smartphone series designed and developed by Apple. The first iPhone was released in 2007. iPhones use the iOS operating system and have a touchscreen interface. iPhones have a variety of features. These include a high-resolution screen, a powerful processor, an advanced camera, and long battery life. They also provide access to many applications that can be downloaded from the App Store IOS 17.5.1 [24]. As of 2023, there are more than 1.5 billion active iPhone users worldwide. This number makes the iPhone the world’s most popular smartphone brand [24]. According to 2023 data, there are approximately 10 million iPhone users in Turkey. This figure represents 16.5% of Turkey’s total mobile phone user base [25].
The iPhone 11 ranks first among the most reviewed models in the smartphone category on Trendyol. More comments make the analyzed data set more comprehensive and representative and increases the accuracy of sentiment analysis [15]. In addition, a high number of comments makes it easier to identify sentiment trends and patterns over time and provides detailed insights on specific topics or features [26]. In addition, big data enables different demographic groups and various perspectives to be included in the analysis [27]. In summary, a high number of comments in sentiment analysis increases the accuracy, reliability, and scope of the analyses, leading to deeper and more meaningful insights [28].
The data set of the study consists of 10,143 customer reviews for the iPhone 11 128 GB phone on Trendyol. The amount of data in text mining is of great importance in terms of the accuracy and reliability of the results that can be obtained. More data enables more comprehensive and accurate analyses. Large datasets provide more accurate and meaningful results. Table 1 presents a sample data set for reference.

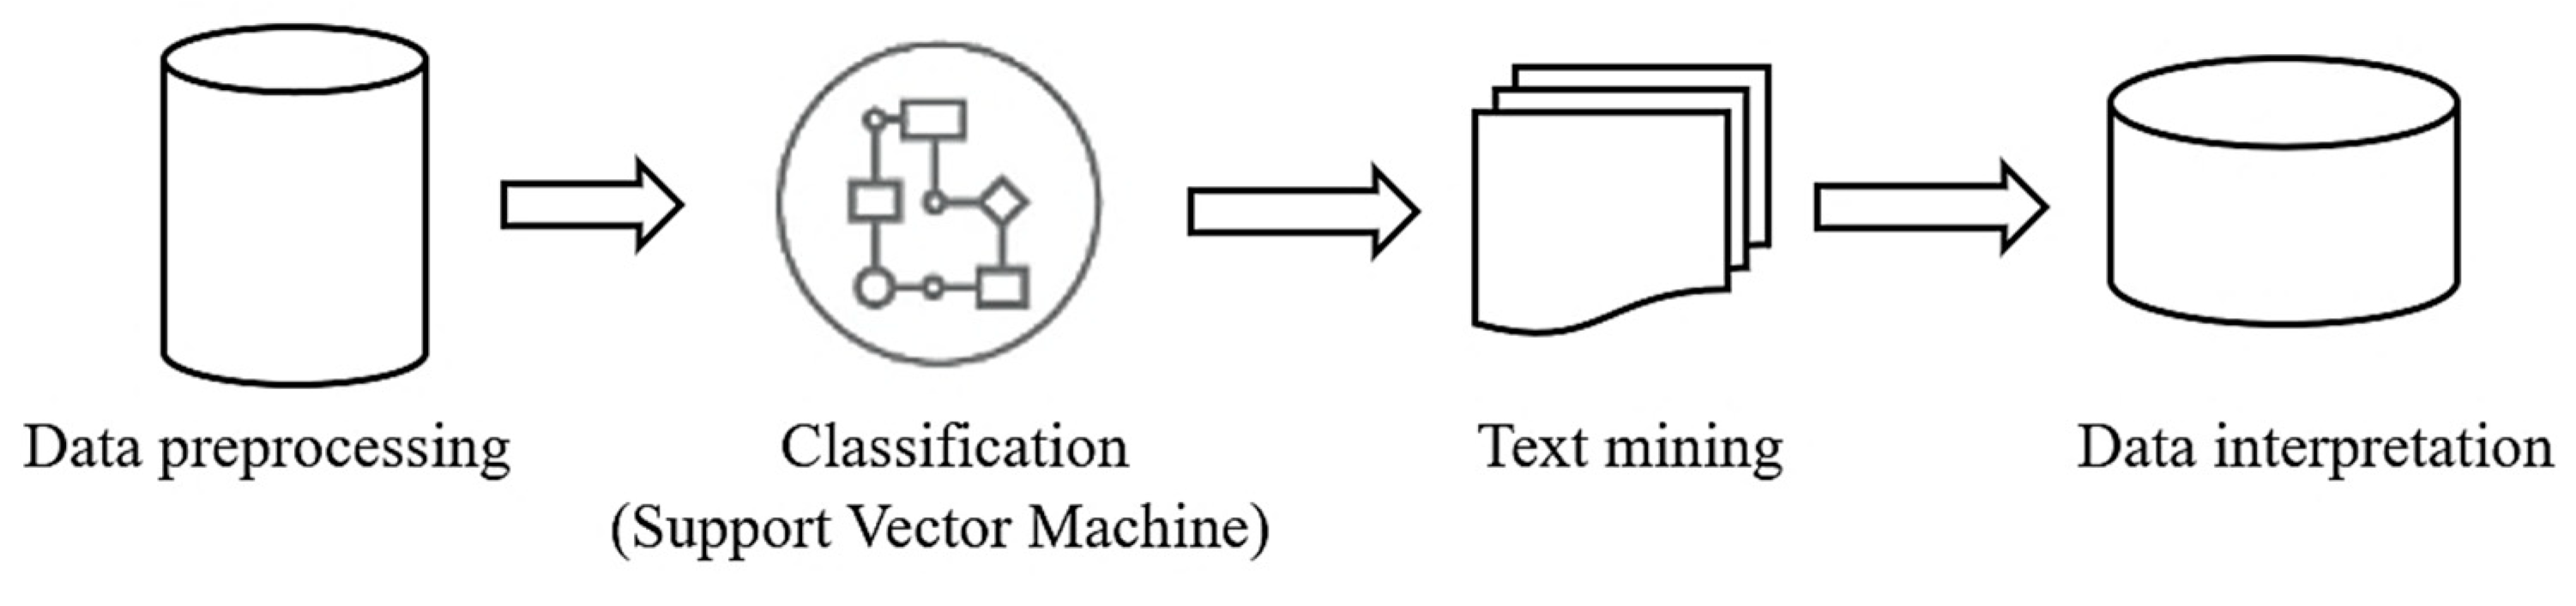
3.2. Data Pre-Processing

Pre-processing of text is an essential preliminary step in text analysis. It is the process of making the input data consistent to facilitate the digitization of the text. Text pre-processing is the process of processing raw text in natural language processing (NLP) projects to prepare it for analysis and modelling. This process facilitates the understanding and processing of the text, resulting in more accurate and effective results [29].
Text pre-processing usually involves the following steps. The most important thing to do before NLP text pre-processing is to tokenize the sentence (document) into its own words. Tokenizing can be defined as breaking words into the smallest meaningful expressions. Special characters are also considered tokens. This divides the text into meaningful parts and prepares it for analysis [30]. Noise removal is the process of removing unnecessary characters, symbols, HTML tags, unnecessary spaces, punctuation marks, or special characters from the text [31]. Normalization is the process of bringing different forms of text into the same form. It includes steps such as correcting spelling errors, separating words into their roots, and case conversion [32]. Commonly used words known as “stop words” do not contribute the original meaning to a sentence. Stop Word Removal is the process of removing words (e.g., “and”, “but”, “or”) that are frequently used in the language but whose meaning is not usually decisive [33]. Stemming and lemmatization are the processes of transforming words into their roots. Stemming uses regular truncation to find the root of the word, while lemmatization uses grammatical rules to find the true root of the word [34]. N-gram is the process of forming consecutive groups of words in a text. It is especially useful for language modelling and text classification [35].

3.3. Text Mining

As the use of the Internet and personal computers continues to skyrocket, an increasing volume of documents is being generated. While important information is lost in these increasing piles of documents, the need to determine the content of the documents and to be able to query them accordingly to access valuable information makes itself felt [36].
Text mining encompasses the systematic extraction of pertinent information from unstructured textual data that lacks a predetermined format and may contain irregular formatting. This involves the comprehensive analysis of textual data, extraction of pertinent attributes, categorization, and establishment of connections. Through text mining, valuable insights can be derived from textual data, enabling informed predictions based on this extracted information [37].
Text mining is a data mining method that enables the extraction of meaningful information from large amounts of text data. Studies in the field of text mining pertain to the exploration of textual data, acknowledging text as a valuable source of information. The overarching objective is to extract organized and structured data from unstructured text [38]. It discovers patterns, relationships, and meaningful insights by analyzing text documents. This method is used to make sense of data using natural language processing (NLP) techniques and statistical methods [39].

3.3.1. Feature Extraction

Feature extraction involves deriving variables and features from raw data [40]. N-gram models find applications in fields like probability and statistical natural language processing, where they analyze specific sequences to determine their probabilities. An n-gram refers to a consecutive sequence of n elements within a text document. This model aims to forecast the likelihood of the next event given the probability of the preceding n-element sequence [41].
N-grams, whether word-based or character-based, are extensively employed in text mining and natural language processing. In the application of the n-gram model within natural language processing, the independence assumption is applied to the preceding words in the n − 1 row. This implies that the probability of a word is contingent solely upon the n − 1 preceding words [42].
The unigram (1-g) attribute representation models whether a specific word is present or absent in a text document. The Bigram (2-g) attribute representation is used to model the presence of consecutive words. Similarly, the trigram (3-g) attribute representation is used to model the presence of three consecutive words in a text fragment. The unigram model depends on the sequence of words preceding it. The bigram model depends on the preceding word, while in the trigram model, the word depends on the last two preceding words [43].

3.3.2. Term Weighting

One of the most widely used techniques for accessing information is term frequency and inverse term frequency (TF-IDF). Term frequency indicates how often a term is repeated in a document, with higher repetitions leading to an increased frequency value for that term [44]. TF-IDF, or term frequency-inverse document frequency, is a technique utilized for determining the significance of words within a given text or sequence. Inverse term frequency denotes the frequency of a term’s occurrence across multiple documents. Unlike term frequency, the lower the number of documents in which a term appears, the greater its perceived importance [45,46]. The inverse document frequency (IDF) is a metric that gauges the significance of a word within a body of text. It reveals whether the word is commonly used or uncommon across all documents. By calculating the frequency of the word in multiple documents, IDF aims to ascertain whether the word is a meaningful term or simply a common connector (stop words). The greater the frequency of a term within a document, the less informative it is considered to be [47,48]. Low-frequency terms have a high IDF score, and high-frequency terms have a low IDF score. The TF-IDF value is high when a term appears frequently in a small number of documents. Conversely, if the term is used in all documents, its TF-IDF value is at its lowest [49].

3.4. Machine Learning

Machine learning involves using computers to model systems and make predictions based on data through mathematical and statistical operations. In this field, algorithms are specifically trained to identify patterns and correlations within extensive datasets, enabling them to make optimal decisions and predictions. When a machine learning method generates an output for prediction, it is termed as classification for categorical outputs and regression for numerical outputs [50]. In this study, support vector classification algorithms from machine learning methods are used for classification.

Support Vector Machines

Support vector machines represent a commonly employed method within supervised machine learning for both classification and regression tasks. The primary objective of utilizing support vector machines is to ascertain a discriminant function within multidimensional space capable of effectively distinguishing training data characterized by known class labels [51]. It determines the decision boundary between the two classes that maximizes the margin from any point in the training dataset we utilized for modeling. For this purpose, decision boundaries, or hyperplanes, are determined. The decision boundary is created by maximizing the distance from different classes to the nearest data points. Put differently, the SVM decision boundary is influenced by the distance between data points [52].
A support vector machine is capable of categorizing data into two or more classes using separation methods, which may be linear in two-dimensional space, planar in three-dimensional space, or hyperplane in multi-dimensional space [53]. Linear SVM is used for datasets that can be linearly separated. A straight line can effectively separate and classify two groups [54]. Nonlinear SVM is used for datasets that cannot be separated by a straight line. Since a linear hyperplane cannot be used, the kernel function method is used. Non-linear transformations can be made using the kernel function, allowing linear separation in high dimensionality. The most common kernel functions are Gaussian, RBF, polynomial, and sigmoid functions [55].

3.5. Sentiment Analysis

Sharing changes in people’s daily lives through social media channels not only accumulates valuable information but also enables important inferences to be drawn from it. The level of reaction to any post or information on social media facilitates easy access to detailed information about individuals, thus influencing decision-making. The study that examines people’s opinions, evaluations, attitudes, and emotions from written language, also known as image analysis, is defined as sentiment analysis.
Sentiment analysis involves analyzing digital text to ascertain its emotional tone, whether positive, negative, or neutral. Nowadays, companies deal with vast amounts of text data including emails, customer support chat transcripts, social media comments, and reviews [56]. Sentiment analysis tools can scan this text to automatically assess the author’s attitude towards a topic. Companies utilize insights from sentiment analysis to enhance customer service and bolster brand reputation [57].
Analyzing and using customer feedback correctly is critical to the success of brands because this data-driven approach helps increase customer satisfaction, develop effective products and services, and help brands retain their competitive advantage. Sentiment analytics is a scalable, cost-effective solution for collecting customer feedback from multiple channels into a single channel and analyzing the customer journey.
Sentiment analysis helps to infer, measure, or understand the image your product, service, or brand carries in the market. Sentiment analysis reveals the opinions people have about a brand, product, service, or all of these [58]. To perform sentiment analysis, users’ opinions and views on the subject should be collected. Sentiment analysis aims to categorize text into some classes according to its subjective content. In general, texts are classified as positive, neutral, and negative [59].
During sentiment analysis, there are scores corresponding to the terms in the dictionary, and these scores are between −1 and +1. The words in the sentence are summed by assigning the corresponding scores in the dictionary. The value obtained because of this summing process is called the polarity score [60].

3.6. Brand Reputation

Reputation is the sum of the values your brand holds in the eyes of consumers, customers, and investors [61]. Brand reputation is the overall evaluation of a brand by its stakeholders, including customers, employees, investors, and the public. Brand reputation is the consumers’ perceptions of and trust in a brand. Brand reputation reflects all the impressions created by your products or services in the eyes of consumers. It can be positive as well as affected by negative image. A good reputation provides great advantages to businesses in terms of customer loyalty and gaining new customers [62,63].
It represents the sum of individuals’ experiences, interactions, and communications with a brand and shapes opinions about the reliability and value of the brand. A positive brand reputation is built on consistent delivery of promises, ethical behavior, and exceptional customer experiences [64]. Brand reputation can often be more influential than price and product quality in consumers’ decision-making processes. Any reputational damage can significantly reduce the brand’s chances of future success. A strong brand reputation serves as a valuable intangible asset that differentiates the brand from others in a competitive market, increasing customer loyalty and business performance. A positive brand reputation increases brand equity, influences consumer behavior, and contributes to sustainable brand success [65].
Brand reputation is a long-term process that requires continuous effort. Various factors contribute to the development and protection of brand reputation [66]. Businesses can build and protect their brand reputation by prioritizing customer satisfaction, providing quality products and services, participating in social responsibility projects, and implementing effective communication strategies [67]. For example, corporate social responsibility (CSR) initiatives significantly enhance brand reputation by demonstrating a company’s commitment to ethical practices and social causes. In addition, corporate identity, corporate branding, and corporate reputation are interrelated elements that affect brand reputation. The perceived quality of products or services, customer experiences, and brand communication strategies also play a role in shaping a brand’s reputation.
Brand reputation management is done through brand themes, designs, logos, and vision statements. The aim is to differentiate the business from its competitors and create a loyal customer base [68].
Sustainable brand management allows a brand to increase its image and reputation while at the same time increasing its profits. The sustainability of brand reputation is a process that aims to maximize the impact of a brand on people, the environment, and society by protecting its tangible and intangible values. Sustainable brand management is one of the most critical elements and is of great importance to the sustainability of brand reputations in developed societies. This approach underpins the future success of brands and plays a vital role in meeting customer, employee, and community expectations. To build a sustainable brand, brand owners and managers must continually review their social and environmental responsibilities.

4. Results and Discussion

In the study, a unique data set containing 10,143 customer reviews of the Apple iPhone 11 128 GB phone purchased from Trendyol was used. Sentiment analyses and evaluations were performed using machine learning techniques on the data set. The Phyton 3.12.4 programming language was used for the analyses.
The first stage of the study consists of data cleaning. Data cleaning is a necessary step in text mining projects to extract meaning from unstructured data. This process involves removing irrelevant data and making the data ready for analysis.
In the second stage, word-stemming was performed. Stemming in text mining makes it easier to analyze texts by finding the meaningful roots of words. In text mining, stemming is used in many areas, such as text summarization, sentiment analysis, topic identification, and machine translation. Stemming helps to analyze texts more accurately and efficiently. This process ensures that words retain their meaning despite their different inflections. Various methods are used for stemming in Turkish texts. These include dictionary-based methods, statistical methods, and mixed methods. Each method has its own advantages and disadvantages.
The study involves dividing the data set into training and testing phases. During the training phase, the model parameters are evaluated, while the testing phase assesses the model’s performance. While there is no strict rule for splitting the data set, the most effective approach often involves trial and error to determine the optimal division. In the study, tests were performed at various rates (60–40%, 70–30%, 80–20%, etc.), and the most successful result was obtained at a rate of 70–30%. Accordingly, 7100 comments were used for training, and 3043 comments were used for testing.
In this study, support vector machines, one of the machine learning methods, were used to predict the emotional states of customers. Radial Basis Function (RBF) was selected as the kernel function for classification with support vector machines. RBF calculates the similarity of two points in the dataset according to their locations. The hyperparameter C is set to 10. The larger C is, the narrower the margin, and the smaller C is, the larger the margin.
The metrics used to compare the classification performance and the related formulas are given below.
Precision gives the degree of certainty of the classifier result. Precision is a measure of how much is correctly predicted from all classes. It is the ratio of the number of positively labeled samples to the total number of positively classified samples.
P = T P T P + F P
Sensitivity (recall) is the ratio of positively labeled samples to the total number of truly positive samples. Sensitivity measures the accuracy of the positive prediction. It shows how much prediction is made correctly. A good classifier should have a sensitivity of 1.
R e c a l l = T P T P + F N
Accuracy is the most used measurement in the classification process. It is the ratio of correctly classified samples to the total number of samples. The accuracy rate measures how often the classifier makes a correct prediction. The accuracy rate has a value between 0 and 1, where 0 is the worst rate, and 1 is the best rate.
A c c u r a c y = T P + T N T P + T N + F P + F N
The F-measure is calculated using precision and sensitivity metrics. It is used to optimize the system towards precision or sensitivity. The F score is a measure of how well the classifier performs. The F score is frequently used in the literature to compare the success of classifiers.
F 1 = 2 R e c a l l P r e c i s i o n P r e c i s i o n + R e c a l l
TP, FP, TN, and FN values used in the equations are, respectively, as follows: TP (true positive rate) indicates the number of comments that are positive and also classified as positive by the classifier. FP (False Positive Rate) indicates the number of comments that are positive but not classified as positive by the classifier. TN (true negative rate) indicates the number of comments that are negative but also classified as negative by the classifier. FN (False Negative Rate) indicates the number of comments that are negative but not classified as negative by the classifier. Table 2 shows the performance measurement results of the support vector classification model used in the study.
In Table 2, four different model evaluation metrics are compared: Precision, Recall, Accuracy, and F Score (F1 score). According to the metric, Precision was 0.504, Recall 0.963, Accuracy 0.500 and F Score 0.662. Recall is the metric with the highest value. The high recall value of the model indicates that it is very successful in capturing positive classes. The F1 score reflects the overall performance of the model in a more balanced way and is a good metric for overall evaluation, as both precision and recall are considered. Accuracy is in third place with about 0.55. This indicates the overall accuracy of the model, i.e., the proportion of all correct classifications. Precision has the lowest value. This indicates how much of what the model positively predicts is correct. A low precision value indicates that many of the model’s positive predictions are incorrect. This can be a problem when the cost of false positives (FP) is high.
According to the precision, sensitivity, and recall metrics in Figure 2, it is evident that the support vector machine classifier has high accuracy and is successful in its predictions. It is very successful in capturing positive classes (high recall), but the accuracy of positive predictions is relatively low (low precision). The overall accuracy and F1 score indicate that the performance of the model is acceptable, but the model may need to be improved to increase precision. This could be done to ensure that there are fewer false positive predictions.
Sentiment analysis was performed using machine learning techniques in the study. Table 3 shows the classification of customer reviews.
Positive reviews account for 85% of all reviews. This indicates that customers are generally satisfied with the iPhone 11 and have had positive experiences. Negative reviews account for 13% of all reviews. This indicates that some customers had negative experiences with the product or that their expectations were not met. Neutral reviews account for 2%. This indicates that some customers have neither a positive nor a negative opinion about the product; their comments are more objective or undecided. Figure 3 shows a graphical representation of customer reviews.
The high percentage of positive reviews (85 percent) indicates that customers are generally satisfied with the iPhone 11. This suggests that the product’s performance, design, ease of use, and other features are appreciated by the majority. The 13% negative reviews indicate that some customers have expressed dissatisfaction with the product. These comments can often include issues with specific features of the product, not meeting expectations, or problems experienced. The neutral comment rate of 2% indicates that some customers did not express a distinct positive or negative opinion about the product. These results suggest that the iPhone 11 offers a generally positive customer experience, but that there is room for improvement. Apple can take negative feedback into account and address these issues in future products.
Figure 4 shows the word cloud generated using the support vector classification method using positive and negative comments.
Words such as “product”, “quality”, “great”, “beautiful”, and “nice” in the word cloud in Figure 4 show that customers are satisfied with the quality and aesthetic appearance of the iPhone 11. Words such as “packaged”, “packaging”, and “wrapped” reflect positive comments about the packaging of the product. Customers appreciate the safe and careful packaging of the product. Words such as “delivered”, “shipping”, “arrived”, “quickly”, and “fast” indicate that the delivery process was fast and smooth and that customers were satisfied with it. Words such as “thank”, “satisfied”, “recommend”, “good”, and “happy” reflect that customers are generally satisfied with their shopping experience and recommend it to others. Words like “camera”, “screen”, and “performance” indicate that the iPhone 11’s specifications and performance meet or exceed expectations. Words like “price”, “worth”, and “affordable” indicate that customers feel they got what they paid for, and that the iPhone 11 is a good product for the price. This word cloud reveals that iPhone 11 buyers are generally satisfied with the quality of the product, the delivery process, and customer service, like the technical features and performance of the product, and find it satisfactory in terms of price and performance. Customers rate the iPhone 11 as a positive experience and recommend it to others.
In the word cloud in Figure 5, the word “problems” is quite large and prominent. This suggests that customers are experiencing many problems with the device and mention these problems frequently. The large size of the word “quality” suggests that customers have complaints about product quality. Phrases such as “low quality” may have been used. The size of the word “cargo” indicates that there are complaints about the delivery process. Problems such as a slow shipping process and damage to the package may have been experienced. The word “price” shows that there are more comments mentioning the cost of the product. Customers may think that the price is high, and the product is not worth the price. The word “packaging” is also quite prominent. This may indicate that there are complaints that the packaging was not adequate or that the product arrived damaged. Words related to returning and returning indicate that customers had problems with the process of returning the product or had to return it. Damaged (broken) and defective (defective): these words indicate that the product arrived damaged or defective. The word “service” indicates that there have been complaints about customer service. Customers may feel that the service was inadequate or unsatisfactory. “Wait” indicates that customers complain about long waiting times. In general, the reviews of customers who purchased the iPhone 11 show that there are significant complaints about delivery, quality, price, and customer service. These words indicate that customer dissatisfaction with the product is widespread and varied.
The word “product” appears prominently in the word cloud in Figure 6. This shows that customers often make general comments about the product. They may be evaluating the product without indicating a positive or negative bias. The word “iPhone” is also quite large and prominent. This suggests that customers are talking directly about the device and that their comments are focused on the iPhone 11. The word “price” is also prominent in the neutral cloud. Customers may be expressing both positive and negative opinions about the price. The word “shipping” shows that there are comments expressing neutral or mixed feelings about the delivery process. The word “packaging” is also noteworthy. This indicates that customers commented on the packaging but did not show a clear positive or negative trend. The words “problem” and “no problems” indicate that customers mention some problems, while others say they have no problems. The word “quality” shows that comments about product quality can be both positive and negative. The words “arrived” and “delivered”, words related to the delivery process, show that customers make neutral comments about when and how the product was delivered. In general, neutral reviews show that customers often focus on the product itself, price, quality, shipping, and packaging. These comments may be more informative and descriptive, often not expressing a distinct positive or negative sentiment.
When the comments of customers who purchased the iPhone 11 are analyzed, three main themes stand out. Firstly, in positive comments, customers state that they are satisfied with the quality, technical features, and performance of the product and that they find it satisfactory in terms of price and performance. They are also generally satisfied with the delivery process and customer service, and they recommend the iPhone 11 to others. Secondly, negative reviews contain serious complaints about delivery, quality, price, and customer service, indicating that dissatisfaction is widespread and varied. Finally, in neutral reviews, customers generally focus on the product itself, price, quality, shipping, and packaging, providing informative and descriptive reviews without expressing any specific positive or negative sentiment.

5. Conclusions

This study aims to understand the effects of brand reputation on customer trust and loyalty and to determine how brands can protect their reputation. Within the scope of the research, statistical data were obtained by analyzing customer reviews for the iPhone 11 on the Trendyol e-commerce platform. This analysis, conducted using sentiment analysis and machine learning methods, provides important findings on customer satisfaction.
Brand reputation is the way a company is perceived by customers, employees, investors, and other stakeholders. A good brand reputation increases the likelihood that customers will trust a company and its products or services. This can lead to higher customer satisfaction, loyalty, and advocacy.
85% of customers who bought an iPhone 11 gave a positive review, indicating that they were generally satisfied with the product. This high satisfaction rate indicates that Apple has built a strong reputation for product quality, specification, and performance. The 13 percent negative review rate indicates that some customers have expressed dissatisfaction with delivery, quality, or customer service. Such complaints indicate areas where the brand’s reputation could be negatively impacted. The neutral comment rate of 2% indicates that a small proportion of customers do not express a specific positive or negative opinion about the product and are more likely to make informative comments.
Customers are satisfied with the quality, specifications, performance, and price/performance ratio. They are also generally satisfied with the delivery process and customer service and would recommend the iPhone 11 to others. Customers express significant complaints about delivery, quality, price, and customer service. These comments show that dissatisfaction with the product is widespread and varied. Customers provide neutral and informative comments about the product itself, price, quality, shipping, and packaging. These comments do not express a specific positive or negative sentiment but rather explain the situation.
Overall, the high proportion of positive reviews suggests that Apple is in a strong position in terms of brand reputation. However, the negative comments point to some areas that need to be addressed. If Apple addresses these complaints and makes improvements, it will further enhance brand credibility and customer satisfaction. Neutral reviews, on the other hand, can provide objective information for potential customers, helping them make informed decisions. This balance suggests that Apple has an overall favorable perception of its brand reputation but needs to maintain and improve it through continuous improvement.
Customer reviews play a critical role in increasing customer loyalty by directly influencing the perceived credibility and reputation of the brand. Positive feedback encourages brand advocacy, while negative feedback allows brands to identify weaknesses and make improvements in these areas. Analysing this feedback meticulously and taking appropriate actions contributes significantly to maintaining and improving the sustainable reputation of brands. This study, based on the iPhone 11 sample, provides an applicable and adaptable methodology for researchers and companies that want to evaluate brand reputation. In this context, it is aimed at providing important contributions to integrate the data obtained from customer feedback into the strategic decision-making processes of brands. The research findings are expected to enable brands to develop strategies that will help them reinforce their strengths and improve their shortcomings.

Author Contributions

Conceptualization, M.K. and F.Y.A.; methodology, M.K., F.Y.A. and O.K.; software, M.K. and O.K.; validation, F.Y.A.; formal analysis, M.K. and M.N.D.; investigation, F.Y.A.; resources, F.Y.A. and M.N.D.; data curation, M.K. and F.Y.A.; writing—original draft preparation, M.K. and F.Y.A.; writing—review and editing, M.K. and F.Y.A.; visualization, M.K. and F.Y.A.; supervision, F.Y.A. and M.K. All authors have read and agreed to the published version of the manuscript.

Funding

This research was funded by National University of Science and Technology Politehnica Bucharest through PubArt program.

Institutional Review Board Statement

Not applicable.

Informed Consent Statement

Not applicable.

Data Availability Statement

The dataset is available from the authors upon reasonable request.

Conflicts of Interest

The authors declare no conflicts of interest. The funders had no role in the design of the study; in the collection, analyses, or interpretation of data; in the writing of the manuscript; or in the decision to publish the results.

References

  1. De Chernatony, L. Brand management through narrowing the gap between brand identity and brand reputation. J. Mark. Manag. 1999, 15, 157–179. [Google Scholar] [CrossRef]
  2. Forman, J.; Argenti, P.A. How corporate communication influences strategy implementation, reputation and the corporate brand: An exploratory qualitative study. Corp. Reput. Rev. 2005, 8, 245–264. [Google Scholar] [CrossRef]
  3. Dhaoui, C.; Webster, C.M.; Tan, L.P. Social media sentiment analysis: Lexicon versus machine learning. J. Consum. Mark. 2017, 34, 480–488. [Google Scholar] [CrossRef]
  4. He, W.; Zhang, W.; Tian, X.; Tao, R.; Akula, V. Identifying customer knowledge on social media through data analytics. J. Enterp. Inf. Manag. 2019, 32, 152–169. [Google Scholar] [CrossRef]
  5. Hassani, H.; Beneki, C.; Unger, S.; Mazinani, M.T.; Yeganegi, M.R. Text mining in big data analytics. Big Data Cogn. Comput. 2020, 4, 1. [Google Scholar] [CrossRef]
  6. Rust, R.T.; Rand, W.; Huang, M.H.; Stephen, A.T.; Brooks, G.; Chabuk, T. Real-time brand reputation tracking using social media. J. Mark. 2021, 85, 21–43. [Google Scholar] [CrossRef]
  7. Mousavi, R.; Johar, M.; Mookerjee, V.S. The voice of the customer: Managing customer care in Twitter. Inf. Syst. Res. 2020, 31, 340–360. [Google Scholar] [CrossRef]
  8. Trendyol. Whoweare. 2024. Available online: https://www.trendyol.com/whoweare (accessed on 13 June 2024).
  9. FastCompanyTurkey. Turkey’s Top 100 Internet Companies. 2024. Available online: https://fastcompany.com.tr/dergi/turkiyenin-en-buyuk-100-internet-sirketi-2023/ (accessed on 11 July 2024).
  10. Loureiro, S.M.C.; Sarmento, E.M.; Bellego, L.G. The effect of corporate brand reputation on brand attachment and brand loyalty: Automobile sector. Cogent Bus. Manag. 2017, 4, 1360031. [Google Scholar] [CrossRef]
  11. Greyser, S.A. Corporate brand reputation and brand crisis management. Manag. Decis. 2009, 47, 590–602. [Google Scholar] [CrossRef]
  12. Vidya, N.A.; Fanany, M.I.; Budi, I. Twitter sentiment to analyze net brand reputation of mobile phone providers. Procedia Comput. Sci. 2015, 72, 519–526. [Google Scholar] [CrossRef]
  13. Sharma, S.K.; Daga, M.; Gemini, B. Twitter sentiment analysis for brand reputation of smart phone companies in India. In Proceedings of ICETIT 2019: Emerging Trends in Information Technology; Springer: Berlin/Heidelberg, Germany, 2020. [Google Scholar]
  14. Isah, H.; Trundle, P.; Neagu, D. Social media analysis for product safety using text mining and sentiment analysis. In Proceedings of the 2014 14th UK Workshop on Computational Intelligence (UKCI), Bradford, UK, 8–10 September 2014. [Google Scholar]
  15. Li, L.; Goh, T.T.; Jin, D. How textual quality of online reviews affect classification performance: A case of deep learning sentiment analysis. Neural Comput. Appl. 2020, 32, 4387–4415. [Google Scholar] [CrossRef]
  16. Mostafa, L. Machine learning-based sentiment analysis for analyzing the travelers reviews on Egyptian hotels. In The International Conference on Artificial Intelligence and Computer Vision; Springer: Berlin/Heidelberg, Germany, 2020. [Google Scholar]
  17. Hossain, M.S.; Rahman, M.F. Customer sentiment analysis and prediction of insurance products’ reviews using machine learning approaches. FIIB Bus. Rev. 2023, 12, 386–402. [Google Scholar] [CrossRef]
  18. Rasool, A.; Tao, R.; Marjan, K.; Naveed, T. Twitter sentiment analysis: A case study for apparel brands. J. Phys. Conf. Ser. 2019, 1176, 022015. [Google Scholar] [CrossRef]
  19. Loukili, M.; Messaoudi, F.; El Ghazi, M. Sentiment analysis of product reviews for e-commerce recommendation based on machine learning. Int. J. Adv. Soft Comput. Its Appl. 2023, 15, 1. [Google Scholar]
  20. Ahmad, S.; Tyagi, N.; Chandra, U.; Maaz, M. Sentiment Analysis Evaluating Net Brand Reputation of Mobile Phones Using Polarity. In Proceedings of the 2018 Fifth International Conference on Parallel, Distributed and Grid Computing (PDGC), Solan, India, 20–22 December 2018. [Google Scholar]
  21. CIRP. CIRP—Apple Report. 2024. Available online: https://cirpapple.substack.com/p/iphone-owners-keep-phones-longer (accessed on 11 July 2024).
  22. Statista. iPhone—Statistics & Facts. 2024. Available online: https://www.statista.com/topics/870/iphone/ (accessed on 11 July 2024).
  23. Keys, B. Brand Keys Loyalty Leaders 2022 Survey. 2022. Available online: https://brandkeys.com/wp-content/uploads/2020/11/PRESS-RELEASE-2022-Loyalty-Leaders-List.pdf (accessed on 11 July 2024).
  24. Mickalowski, K.; Mickelson, M.; Keltgen, J. Apple’s iPhone launch: A case study in effective marketing. Bus. Rev. 2008, 9, 283–288. [Google Scholar]
  25. Statcounter. Mobile Vendor Market Share Turkey. 2024. Available online: https://gs.statcounter.com/vendor-market-share/mobile/turkey (accessed on 13 June 2024).
  26. Abbasi, A.; Chen, H.; Salem, A. Sentiment analysis in multiple languages: Feature selection for opinion classification in web forums. ACM Trans. Inf. Syst. (TOIS) 2008, 26, 1–34. [Google Scholar] [CrossRef]
  27. Wu, X.; Zhu, X.; Wu, G.Q.; Ding, W. Data mining with big data. IEEE Trans. Knowl. Data Eng. 2013, 26, 97–107. [Google Scholar]
  28. Birjali, M.; Kasri, M.; Beni-Hssane, A. A comprehensive survey on sentiment analysis: Approaches, challenges and trends. Knowl.-Based Syst. 2021, 226, 107134. [Google Scholar] [CrossRef]
  29. Baek, S.; Jung, W.; Han, S.H. A critical review of text-based research in construction: Data source, analysis method, and implications. Autom. Constr. 2021, 132, 103915. [Google Scholar] [CrossRef]
  30. Jiang, J.; Zhai, C. An empirical study of tokenization strategies for biomedical information retrieval. Inf. Retr. 2007, 10, 341–363. [Google Scholar] [CrossRef]
  31. Chai, C.P. Comparison of text preprocessing methods. Nat. Lang. Eng. 2023, 29, 509–553. [Google Scholar] [CrossRef]
  32. Joshi, R.M.; Treiman, R.; Carreker, S.; Moats, L.C. How words cast their spell. Am. Educ. 2008, 32, 6–16. [Google Scholar]
  33. Stamatatos, E. Plagiarism detection using stopword n-grams. J. Am. Soc. Inf. Sci. Technol. 2011, 62, 2512–2527. [Google Scholar] [CrossRef]
  34. Khyani, D.; Siddhartha, B.S.; Niveditha, N.M.; Divya, B.M. An interpretation of lemmatization and stemming in natural language processing. J. Univ. Shanghai Sci. Technol. 2021, 22, 350–357. [Google Scholar]
  35. Yazdani, A.; Safdari, R.; Golkar, A.; Niakan Kalhori, R. Words prediction based on N-gram model for free-text entry in electronic health records. Health Inf. Sci. Syst. 2019, 7, 6. [Google Scholar] [CrossRef] [PubMed]
  36. Kayakuş, M.; Yiğit Açıkgöz, F. Classification of news texts by categories using machine learning methods. Alphanumeric J. 2022, 10, 155–166. [Google Scholar] [CrossRef]
  37. Kayakuş, M.; Yiğit Açıkgöz, F. Fake News Detection on Twitter with Machine Learning Methods. J. Abant Soc. Sci. 2023, 23, 1017–1027. [Google Scholar]
  38. Hotho, A.; Nürnberger, A.; Paaß, G. A brief survey of text mining. J. Lang. Technol. Comput. Linguist. 2005, 20, 19–62. [Google Scholar] [CrossRef]
  39. Nadkarni, P.M.; Ohno-Machado, L.; Chapman, W.W. Natural language processing: An introduction. J. Am. Med. Inform. Assoc. 2011, 18, 544–551. [Google Scholar] [CrossRef] [PubMed]
  40. Hira, Z.M.; Gillies, D.F. A review of feature selection and feature extraction methods applied on microarray data. Adv. Bioinform. 2015, 2015, 198363. [Google Scholar] [CrossRef] [PubMed]
  41. Liebeskind, C.; Dagan, I.; Schler, J. Semiautomatic construction of cross-period thesaurus. J. Comput. Cult. Herit. (JOCCH) 2016, 9, 1–26. [Google Scholar] [CrossRef]
  42. Doval, Y.; Gómez-Rodríguez, C. Comparing neural-and N-gram-based language models for word segmentation. J. Assoc. Inf. Sci. Technol. 2019, 70, 187–197. [Google Scholar] [CrossRef] [PubMed]
  43. García, M.; Maldonado, S.; Vairetti, C. Efficient n-gram construction for text categorization using feature selection techniques. Intell. Data Anal. 2021, 25, 509–525. [Google Scholar] [CrossRef]
  44. Yamamoto, M.; Church, K.W. Using suffix arrays to compute term frequency and document frequency for all substrings in a corpus. Comput. Linguist. 2001, 27, 1–30. [Google Scholar] [CrossRef]
  45. Zhang, W.; Yoshida, T.; Tang, X. A comparative study of TF* IDF, LSI and multi-words for text classification. Expert Syst. Appl. 2011, 38, 2758–2765. [Google Scholar] [CrossRef]
  46. Qaiser, S.; Ali, R. Text mining: Use of TF-IDF to examine the relevance of words to documents. Int. J. Comput. Appl. 2018, 181, 25–29. [Google Scholar] [CrossRef]
  47. Robertson, S. Understanding inverse document frequency: On theoretical arguments for IDF. J. Doc. 2004, 60, 503–520. [Google Scholar] [CrossRef]
  48. Srinivasan, P. A comparison of two-poisson, inverse document frequency and discrimination value models of document representation. Inf. Process. Manag. 1990, 26, 269–278. [Google Scholar] [CrossRef]
  49. Kim, S.-W.; Gil, J.-M. Research paper classification systems based on TF-IDF and LDA schemes. Hum.-Centric Comput. Inf. Sci. 2019, 9, 30. [Google Scholar] [CrossRef]
  50. Yetiz, F.; Terzioğlu, M.; Kayakuş, M. An Analysis of Turkish Deposit Banks’ Customer Forecasting with Machine Learning Methods. Sosyoekonomi 2021, 29, 413–432. [Google Scholar] [CrossRef]
  51. Kayakuş, M. The Estimation of Turkey’s Energy Demand Through Artificial Neural Networks and Support Vector Regression Methods. Alphanumeric J. 2020, 8, 227–236. [Google Scholar] [CrossRef]
  52. Erdoğan, H.; Terzioğlu, M.; Kayakuş, M. Forecasting the Number of Tourists Coming to Turkey for Accommodation from Germany Using Artificial Intelligence Techniques. Eur. J. Sci. Technol. 2021, 27, 961–971. [Google Scholar]
  53. Roy, A.; Chakraborty, S. Support vector machine in structural reliability analysis: A review. Reliab. Eng. Syst. Saf. 2023, 233, 109126. [Google Scholar] [CrossRef]
  54. Elizondo, D. The linear separability problem: Some testing methods. IEEE Trans. Neural Netw. 2006, 17, 330–344. [Google Scholar] [CrossRef] [PubMed]
  55. Suykens, J.A. Support vector machines: A nonlinear modelling and control perspective. Eur. J. Control 2001, 7, 311–327. [Google Scholar] [CrossRef]
  56. Nandwani, P.; Verma, R. A review on sentiment analysis and emotion detection from text. Soc. Netw. Anal. Min. 2021, 11, 81. [Google Scholar] [CrossRef] [PubMed]
  57. Sadegh, M.; Ibrahim, R.; Othman, Z.A. Opinion mining and sentiment analysis: A survey. Int. J. Comput. Technol. 2012, 2, 171–178. [Google Scholar]
  58. Liu, B. Sentiment analysis and subjectivity. Handb. Nat. Lang. Process. 2010, 2, 627–666. [Google Scholar]
  59. Hemmatian, F.; Sohrabi, M.K. A survey on classification techniques for opinion mining and sentiment analysis. Artif. Intell. Rev. 2019, 52, 1495–1545. [Google Scholar] [CrossRef]
  60. Min, W.N.S.W.; Zulkarnain, N.Z. Comparative evaluation of lexicons in performing sentiment analysis. J. Adv. Comput. Technol. Appl. (JACTA) 2020, 2, 14–20. [Google Scholar]
  61. Dowling, G.R. Corporate reputations: Should you compete on yours? Calif. Manag. Rev. 2004, 46, 19–36. [Google Scholar] [CrossRef]
  62. Shamma, H.M.; Hassan, S.S. Customer and non-customer perspectives for examining corporate reputation. J. Prod. Brand Manag. 2009, 18, 326–337. [Google Scholar] [CrossRef]
  63. Chun, R. Corporate reputation: Meaning and measurement. Int. J. Manag. Rev. 2005, 7, 91–109. [Google Scholar] [CrossRef]
  64. Walsh, G.; Beatty, S.E. Customer-based corporate reputation of a service firm: Scale development and validation. J. Acad. Mark. Sci. 2007, 35, 127–143. [Google Scholar] [CrossRef]
  65. Zaichkowsky, J.L.; Parlee, M.; Hill, J. Managing industrial brand equity: Developing tangible benefits for intangible assets. Ind. Mark. Manag. 2010, 39, 776–783. [Google Scholar] [CrossRef]
  66. Guzman, F. A brand building literature review. ICFAI J. Brand Manag. 2005, 2, 30–48. [Google Scholar]
  67. Tingchi Liu, M.; Anthony Wong, I.; Shi, G.; Chu, R.; Brock, J.L. The impact of corporate social responsibility (CSR) performance and perceived brand quality on customer-based brand preference. J. Serv. Mark. 2014, 28, 181–194. [Google Scholar] [CrossRef]
  68. Park, C.W.; Jaworski, B.J.; MacInnis, D.J. Strategic brand concept-image management. J. Mark. 1986, 50, 135–145. [Google Scholar] [CrossRef]
Figure 1. Process flow.
Sustainability 16 06121 g001
Figure 2. Comparison of model results.
Sustainability 16 06121 g002
Figure 3. Customer comments.
Sustainability 16 06121 g003
Figure 4. Word cloud of positive comments.
Sustainability 16 06121 g004
Figure 5. Word cloud of negative comments.
Sustainability 16 06121 g005
Figure 6. Word cloud of neutral comments.
Sustainability 16 06121 g006
Table 1. Data set example.
I liked it very well
I liked it very much, you can buy it with peace of mind, it is perfect, everything came in perfect condition, and it is original with warranty, approved from the iPhone website, I recommend it, it is perfect.
The product arrived without any problems, the shipping was fast, the packaging was good. Thanks to the seller and the cargo company
It arrived without any problems; it arrived well wrapped and the shipping was fast.
It came to me quickly and securely. Thank you trendyol…
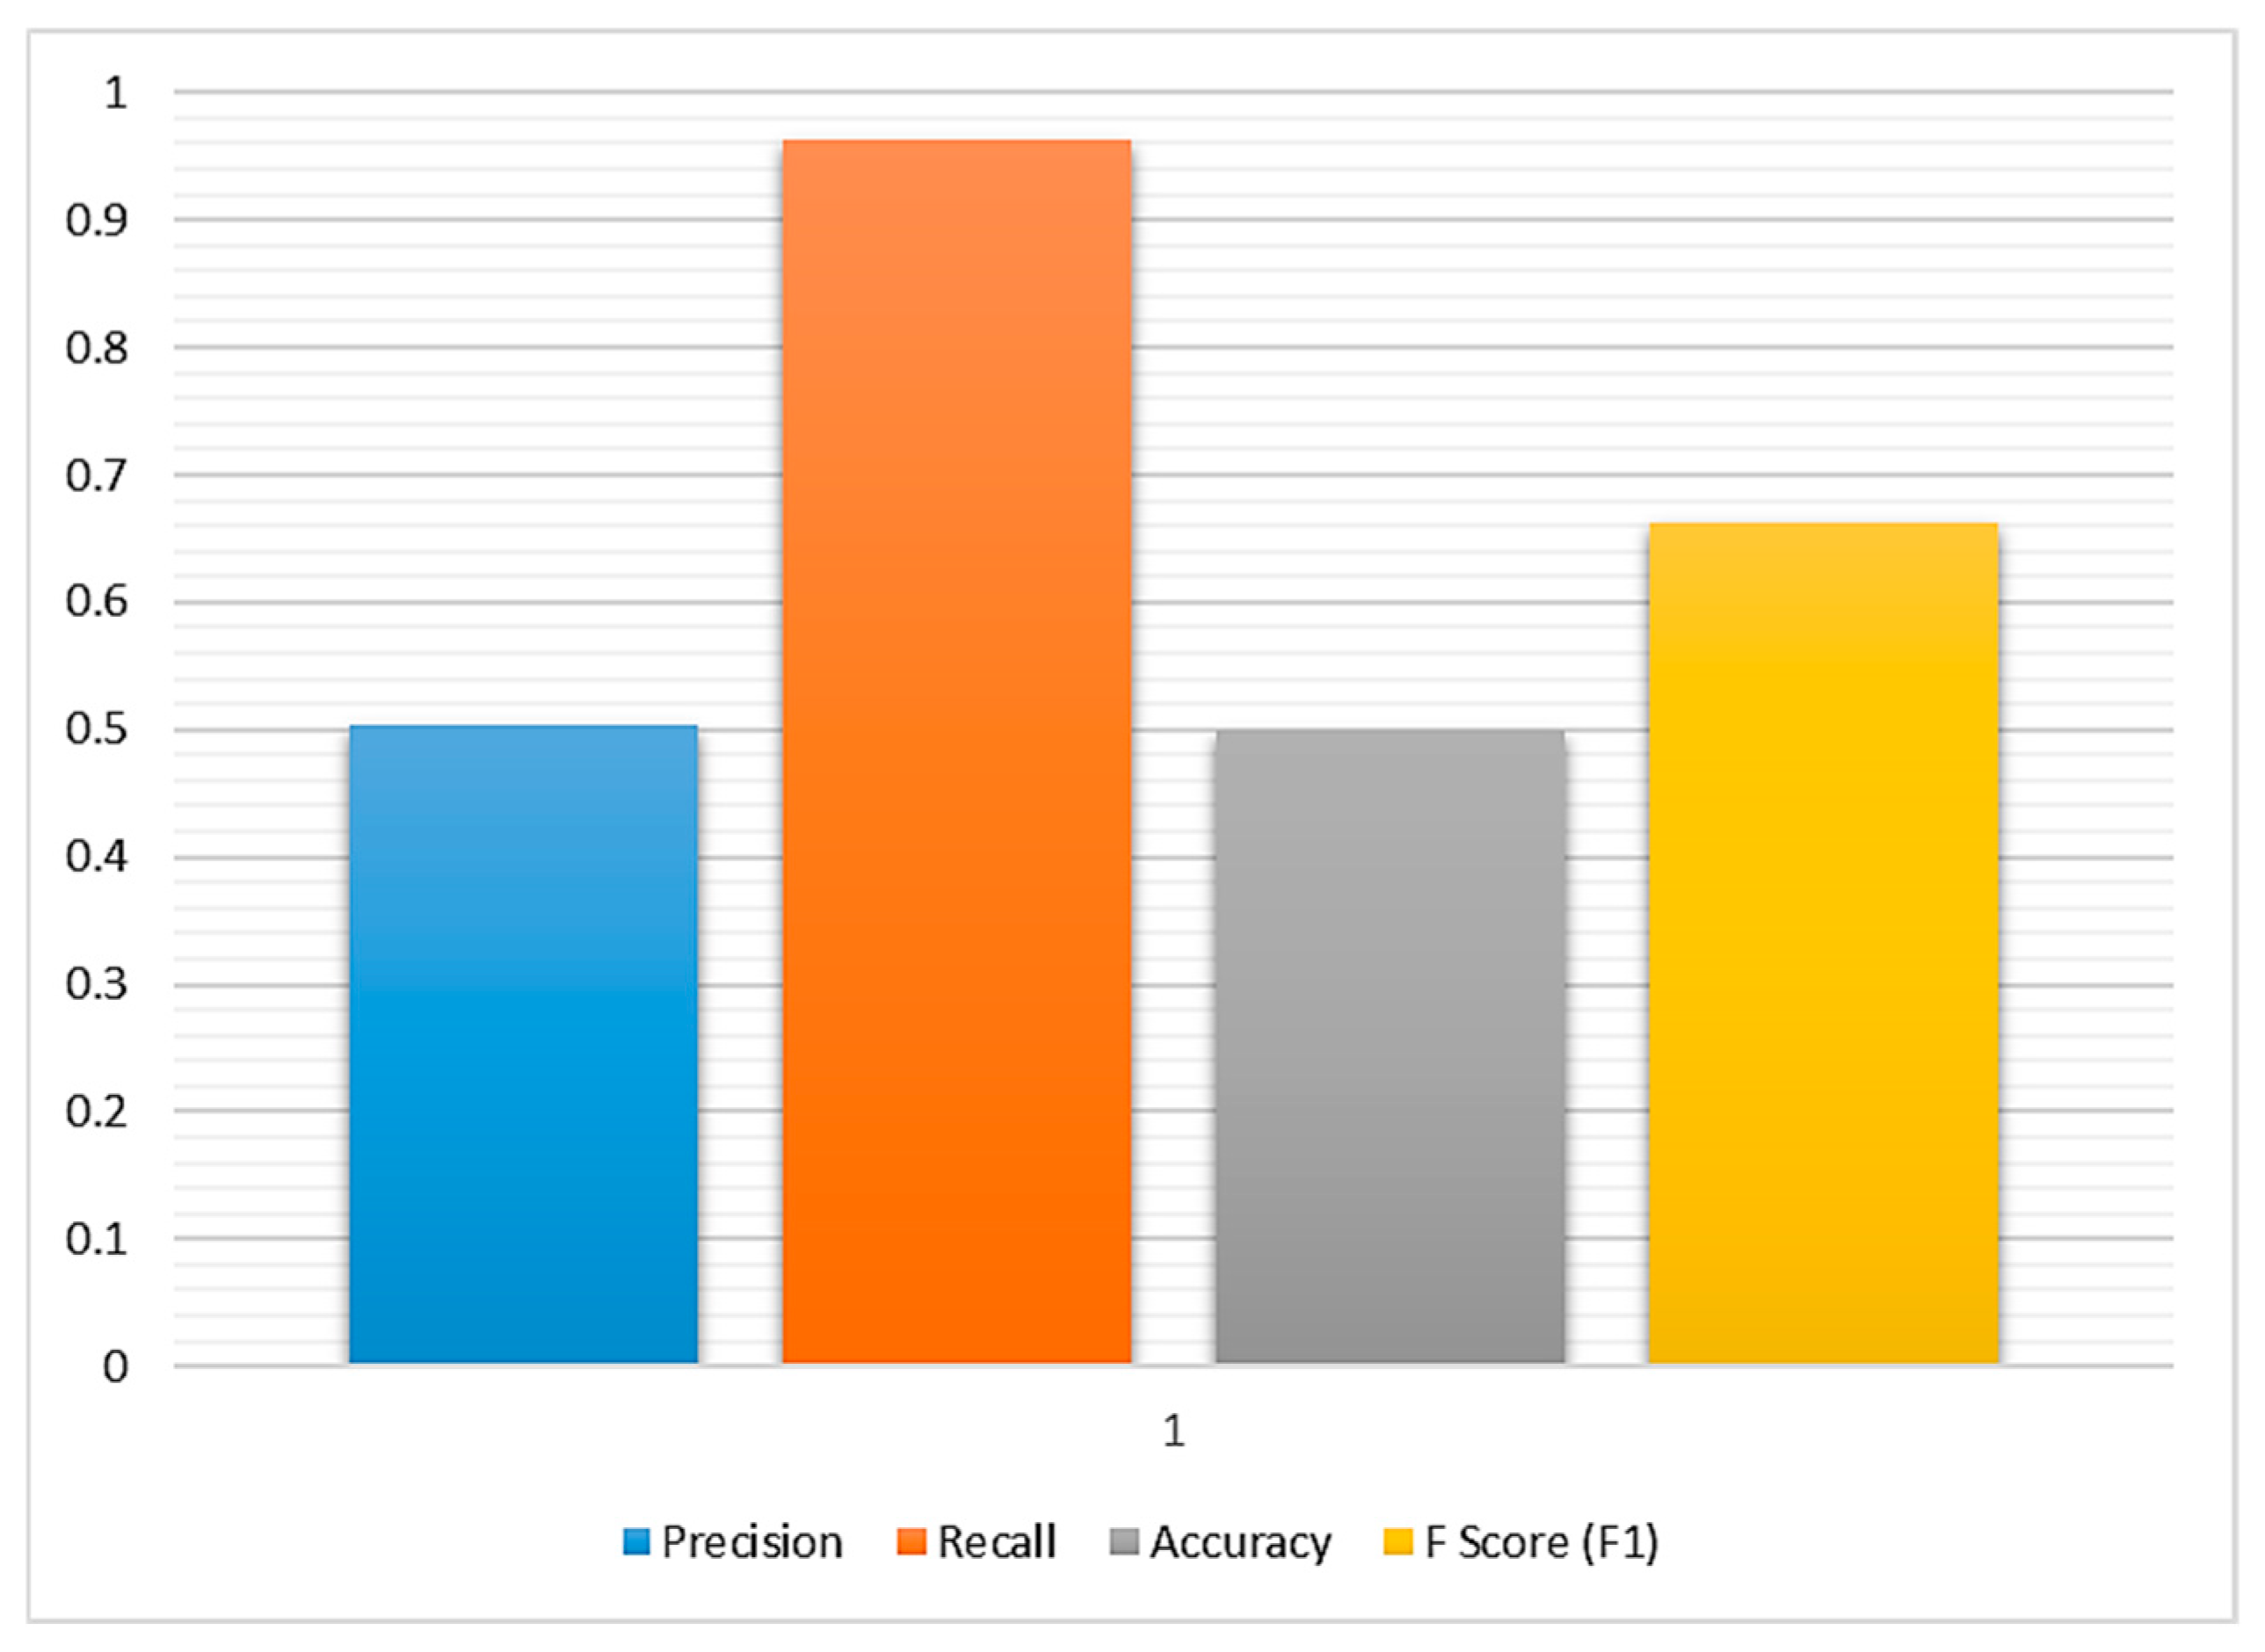
Table 2. Performance measurement results.
PrecisionRecallAccuracyF Score (F1)
0.5040.9630.5000.662
Table 3. Sentiment analyses of customer comments.
Emotion StatusNumber of Comments
Positive8547
Negative1299
Neutral154
Disclaimer/Publisher’s Note: The statements, opinions and data contained in all publications are solely those of the individual author(s) and contributor(s) and not of MDPI and/or the editor(s). MDPI and/or the editor(s) disclaim responsibility for any injury to people or property resulting from any ideas, methods, instructions or products referred to in the content.

