Article

Activated Carbons for Removing Ammonia from Piggery Vent Air: A Promising Tool for Mitigating the Environmental Impact of Large-Scale Pig Breeding

1
Department of Advanced Material Technologies, Faculty of Chemistry, Wrocław University of Science and Technology, ul. Gdańska 7/9, 50-436 Wrocław, Poland
2
Innovation and Implementation Company Ekomotor Ltd., ul. Wyścigowa 1A, 53-011 Wrocław, Poland
*
Author to whom correspondence should be addressed.
Sustainability 2024, 16(14), 6122; https://doi.org/10.3390/su16146122
Submission received: 30 May 2024 / Revised: 28 June 2024 / Accepted: 12 July 2024 / Published: 17 July 2024
(This article belongs to the Section Environmental Sustainability and Applications)

Abstract

:
Unsustainable pig breeding is a great threat to the environment. Ammonia is one of the main pollutants emitted in piggery vent air. This work is a comparative survey that presents the findings on the effectiveness of ammonia adsorption from air using various activated carbons (ACs). Detailed consideration is given to the effects of (i) type of raw material (wood char, wood pellet, and commercial lignite-based char), (ii) preparation method (CO2, steam, and KOH activation), and (iii) activation conditions (temperature and KOH/char ratio), on the porous structure of ACs and their ammonia sorption capacity and reversibility. Response surface methodology and genetic algorithm were used to find optimum KOH activation conditions. Economic analyses of AC production were performed using process modeling in Aspen software. It was found that ACs obtained from wood char in KOH activation show a maximum ammonia capacity of 397 g/kg, which is at least 2.5-fold higher than that reached on ACs from physical activation. A lower activation temperature (<750 °C) and a higher KOH/char ratio (>3) were preferred for effective adsorption, regardless of the type of feedstock. High sorption reversibility was achieved (87–96%). This makes the obtained sorbents promising sorbents for ammonia removal from piggery vent air with potential subsequent application as nitrogen-enriched biochar for crop fertilization. Thus, it facilitates sustainable pig breeding.

1. Introduction

Pork is one of the most widely consumed meats, accounting for 34% of global meat consumption in 2022. As of the most recent data available, the global pig production volume is estimated to be around 1.2 billion pigs annually [1]. The livestock sector is responsible for a considerable environmental impact, and, over the years, awareness of this impact has increased. This is confirmed by the constant tightening of the law, including EU regulations. The EU’s clean air policy is based on three pillars: Ambient Air Quality Directive (Directive 2008/50/EC), National Emission Reduction Commitments (EU Directive 2016/2284), and Industrial Emission Directive (IED, EU Directive 2010/75). Most recently (i.e., April 2024), the UE Council adopted the revised directive on industrial emissions, which aims at better protection of human health and the environment by reducing harmful emissions. These restrictions include the industrial breeding of pigs and poultry.
Ammonia (NH3), volatile organic compounds (VOCs), particulate matter (PM), and greenhouse gases (GHGs) such as CH4 and N2O are the main pollutants associated with industrial livestock farming. However, most of the attention in research and discussions on gas pollution produced during pig farming is paid to ammonia, which is a source of various environmental issues. This pollutant not only contributes to indirect N2O, but is also one of the main culprits (together with NO2 and SOX) of soil acidification and eutrophication [2,3,4,5]. Direct, negative impact on human and animal life has also been proven. Long exposure to odors causes respiratory diseases in humans [6,7]. Furthermore, increased nitrogen supply to terrestrial and aquatic ecosystems can cause eutrophication, strongly destroying the life cycle of fauna [7].
The intensity of ammonia emission from pig breeding is influenced by the housing system, as well as the system of storing and managing slurry. Therefore, the approaches to mitigate the effect of ammonia emissions from swine farming are mainly focused on reducing the amount of ammonia in pig droppings and also on minimizing emissions from those already produced [8]. The first goal is achieved through proper forage composition, that is, primarily by limiting the amount of protein, the undigested remains of which are metabolized, among others, to ammonia [9] and also by doping feed additives that increase feeding efficiency and improve the retention time of food in the animal’s body [10]. Phase feeding also gives good results, in which the composition of the feed is adapted to the pig development phase [11], whereas, in order to lower emissions from swine excrements, the following strategies are used: slatted floors made of plastic or steel instead of concrete, an appropriate method of managing the slurry and manure, e.g., by decreasing the surface of the slurry pit, as well as maintaining the suitable environmental conditions inside the building and ventilation air purification systems [12]. A separate approach is the utilization of captured ammonia as a source of added-value streams [13].
Among the commercial technologies of ammonia removal from waste gases, the most frequently operated is absorption in liquids [14]. Nevertheless, other procedures are also used, such as thermal oxidation, catalytic decomposition, condensation, reaction with other gases, ion exchange over resins, separation on biofilters, and adsorption on porous materials [15,16,17]. The concentration of ammonia in the exhaust gases is the crucial parameter that determines the adaptation of a given method in the gas purification system. For example, thermal or catalytic oxidation requires additional energy if the ammonia concentration is too low, and results in increased NOx emissions if it is too high [18]. In turn, biofiltration is effective only at a low concentration of ammonia [19], while condensation occurs at a high concentration [20]. In the case of absorption in solvents and adsorption on porous materials, their use is profitable only if there is a way to manage the used sorbents. Units for ammonia adsorption are unchallenging in construction and economical in operation, and by selecting the appropriate sorbent, high operational efficiency can be achieved at low costs. Several inorganic and organic sorbents have been examined, including various carbon materials such as activated carbons (ACs) [21], nanofibers [22], graphene oxide (GO) [23,24], mesoporous carbon materials [25], biomass-derived materials [26,27], zeolites [28], alumina [29], metal oxides [30], modified silica gels [31,32], polymers [33], MOFs [34], and Prussian blue [35,36], as well as composites of the above materials, e.g., zeolite/activated carbon [37], activated carbon/MOF [38], TiO2/activated carbon [39], graphene/MOF [40], ZrO2/GO [41], and iron/zeolite [42]. However, it seems that of the abovementioned, activated carbons are the most universal, mainly because of their extremely developed porous structure, the possibility of surface functionalization, and relatively low production costs [43,44]. In some ammonia adsorption solutions, it is necessary to bind it irreversibly, for example, in gas masks, the electronics industry, and residential air filters. To obtain a permanent ammonia bonding, activated carbons with a modified surface are used, on which chemical adsorption takes place through interactions with the basic and polar ammonia molecules. In practice, two types of modification are used, where the first one involves the oxidation of activated carbons, which results in introducing acidic oxygen functional groups on their surface. For this purpose, activated carbons are exposed to gases (air, ozone), acids (sulfuric, nitric, phosphorus, hydrochloric, or acetic), salts, or hydrogen peroxide [45,46]. However, excessive oxidation of activated carbons provides a material with insufficient mechanical resistance. The second type of functionalization involves the impregnation of activated carbons with transition metal ions, which enables the coordinate binding of ammonia in the pores of the sorbent. The tested metals include Al, Co, Cr, Cu, Fe, Mo, Ni, Zn, V, and W ions [47]. However, this method of carbon modification involves the problem of reusing it, e.g., as a bioadditive. In general, spent activated carbons can be regenerated and reused. For example, carbon sorbents can be used as biochar, i.e., a soil structure-forming additive, which has a number of advantages: it improves soil structure, inhibits water and wind erosion, and increases organic carbon content in the soil [48]. Furthermore, unlike biomass, which is also used to improve soil structure, it is not decomposed by microorganisms and does not release organic acids and, therefore, does not lead to soil acidification. Due to its strong adsorption properties, it improves the water and cationic capacity of the soil, and, therefore, reduces its salinity and contributes to the increase in nutrients content while limiting their leaching [49]. Biochar enriched with ammonia could be used as a long-acting nitrogen fertilizer. For this to be possible, however, such an additive must be free from impurities that may lead to soil contamination, such as heavy metals.
Therefore, the presented study focuses on developing ACs with the maximum ammonia sorption capacity, displaying the most reversible sorption mode. Particular consideration was given to the influence of (i) the raw sources (i.e., wood char from gasification, lignite char, and wood pellet) used for ACs manufacturing, (ii) the activation technique, i.e., by using carbon dioxide, steam, and potassium hydroxide, and (iii) the carbonization and activation temperature on the features of the obtained sorbents and their effectiveness in the adsorption of ammonia. In addition, a simplified economic analysis of activated carbon production was carried out for the raw materials studied.
The assessment of the economic feasibility of producing activated carbons from biomass is a complex and multithreaded issue that is influenced by several factors. These include the availability and quality of biomass, the demand for products, transport costs, and the wages of employees [50]. The activation method has the largest share in the cost of obtaining activated carbons, lower in the case of physical activation and higher in the case of chemical activation. This is due to both the complexity of the process and the energy consumption itself [51].
The studies presented in the paper were an indispensable part of the project whose objective was to develop a comprehensive system to reduce the formation and emission of gaseous pollutants, mainly methane and ammonia, during pig breeding by using appropriate feed additives [10,52], the utilization of excrement in a biogas plant [53,54], and the purification of ventilation air.

2. Materials and Methods

2.1. Materials

Three types of commercial raw materials were used for activated carbon preparation: wood char from gasification (W), lignite char (KC), and sawdust pellet (PO). W was obtained from Wirex Sp. z o.o. (Kiełczygłów, Poland). It is a product of the partial gasification of wood wastes from the facility. Gas from the gasification is combusted to produce energy required for the production of sawdust pellets. When the gas yield drops below the required level, the reaction is stopped by quenching wood waste. They were treated as waste and stored in a landfill. For the purpose of the presented studies, wet remains from the furnace were collected, air-dried to a stable mass, and ground to a particle size < 5.0 mm. KC was obtained from Elbar-Katowice Sp z o.o., Katowice, Poland: Carbon Racibórz, Racibórz, Poland. It is a commercial char obtained from lignite with a particle size in the range of 2 to 5 mm. PO was obtained from Barlinek S.A., Kielce, Poland. This coniferous wood pellet is made without any binder and was conditioned using dry steam. It was ground to a particle size < 5.0 mm before carbonization. Commercial AC: BA_NH4 (Carbon) was used for comparison of ammonia sorption. This granular AC is produced from coal by steam activation and modified with concentrated sulfuric acid after activation. It was designed to remove ammonia from air. Table 1 presents its characteristic provided by the producer.
Potassium hydroxide (85%, P.A.) and hydrochloric acid (35–38%, P.A.) for chemical activation were purchased from POCH (Avantor), Gliwice, Poland. Benzene (P.A.) for sorption measurements was purchased from Chempur, Piekary Śląskie, Poland. Ammonia gas (99.95%) for ammonia sorption measurements was purchased from Messer Polska, Chorzow, Poland. Carbon dioxide for sorption measurements and argon for carbonization and activation were purchased from SIAD Poland, Ruda Śląska, Poland.

2.2. Carbonization

PO was subjected to low-temperature carbonization before activated carbon preparation because, in contrast to KC and W, it is untreated biomass, not char. This pretreatment was aimed at increasing the solid yield in the carbonization and activation process. In addition, raw material of the same type as K and WC was obtained. The process was carried out in the Fischer–Schrader retort at 500 °C (holding time at final temperature: 1 h) under an inert atmosphere (N2, 30 L/h). The liquid product was separated from the flue gases. The solid obtained was denoted as PO500.
The carbonization of raw materials (KC and W) and PO500 was performed using a thermogravimetric apparatus described elsewhere [55]. Samples weighing 1 g were heated in an inert atmosphere (Ar, 30 L/h) with a heating rate of 10 °C/min, to a final temperature of 750, 800, 850, or 900 °C, which was held for 30 min, and then cooled to room temperature in argon flow. The chars obtained were named in the following manner: “raw material_carbonization temperature”, for example, W750.

2.3. Steam and CO2 Activation

Thermal (physical) activation of the obtained chars was carried out using the same apparatus as carbonization (Section 2.2). It allows one to control mass loss during the process. The W chars were activated with steam, KC with steam and CO2, and PO with CO2. The activation temperature was the same as the final charring temperature of the respective char, which means that W750 was activated at 750 °C, W800 at 800 °C, etc. After 30 min of stabilization in the final temperature, the gas was switched to CO2 or steam. Isothermal activation was carried out to 50% burn-off (daf—dry-ash free). The reactivity of each char was calculated as a ratio of weight loss (daf) during activation to the initial char mass and time of activation. After 50% burn-off, the samples were cooled to room temperature in argon flow. The activated carbons obtained were named in the following manner: “raw material_carbonization (=activation) temperature_activating agent”, e.g., W750H2O, or PO900CO2.

2.4. Chemical (KOH) Activation

Raw materials (W and KC) and PO500 were also activated by solid KOH using the method described earlier [56]. The effects of temperature and KOH-to-char weight ratio on the porous texture of activated carbons and the ammonia sorption capacity were studied. Activated carbons from KC and W were prepared in every combination of temperatures 700, 800, and 900 °C and KOH/char ratios 1:1, 2:1, 3:1, and 4:1. It resulted in 12 ACs from each raw material. ACs from PO500 were prepared at temperatures 600, 700, 800, and 900 °C and KOH excess of 4, and at temperature of 700 °C and KOH excess of 1, 2, 3, and 4. It sums up with 7 ACs. The ACs obtained were named in the following manner: “raw material_activation temperature_KOH_KOH weight excess”, e.g., W700KOH1.

2.5. Proximate Analysis

Air-dried raw materials and PO500 were characterized by proximate analysis according to Polish standards [57,58,59]. Each sample was analyzed in triplicate, and the final result is an average result. The differences between the individual test results are within the repeatability limit given in the standard.

2.6. Ultimate Analysis

The elemental composition (C, H, N, and S) of raw materials (PO and W) and PO500 was analyzed using an elemental analyzer VarioEl (Elementar, Langenselbold, Germany). The oxygen content was calculated by the difference. Each sample was analyzed in triplicate, and the final result is an average result.

2.7. Heat of Combustion

The determination of the heat of combustion of raw materials was performed with the use of a calorimetric bomb, according to the standard [60]. Each sample was analyzed in triplicate, and the final result is an average result. The differences between the individual test results are within the repeatability limit given in the standard.

2.8. Thermogravimetric Analysis

Thermogravimetric analysis (TG) of raw materials and PO500 was carried out using the same thermogravimetric apparatus as for carbonization and activation (Section 2.2). The same conditions as for carbonization (1 g sample, heating rate: 10 °C/min, gas: Ar2, gas flow rate: 30 L/h) were applied.

2.9. Porous Texture Determination

The porous texture of raw materials, chars, and activated carbons was characterized using sorption measurements performed on the McBain–Bakr type gravimetric apparatus described elsewhere [55]. Pores surface area and volume, pore size distribution, and the average pore width were calculated on the basis of the adsorption isotherm of carbon dioxide (in the pressure range of 0 to 93.3 kPa) and the adsorption/desorption isotherm of benzene (25 °C). Details of the calculations can be found elsewhere [56].

2.10. Ammonia Sorption Measurements

Raw materials, chars, and activated carbons were tested for ammonia sorption in a static experiment at room temperature (25 °C). Ammonia adsorption and desorption isotherms were obtained using the same apparatus and under the same conditions as porous texture analysis (Section 2.9) within the pressure range of 0 to 93.3 kPa. The ammonia sorption capacity was calculated from the adsorption isotherm. The reversibility of adsorption was calculated from the difference between the ammonia sorption capacity and the volume of ammonia that remained within the sorbent after decreasing the pressure to approximately 0 kPa (irreversible adsorption).

2.11. Methodology of Optimization the Activation Method

Among the activation methods, that with KOH resulted in activated carbons with the highest ammonia sorption capacity. Therefore, it was selected for detailed analysis. Indication of the optimal process temperature, as well as activating agent concentration, is not a simple matter if, as in the case of this work, only single point data are available in the grid of the experiment. Commonly used optimization methods require continuous functions at their base. One way to extract a continuous description from discrete data is to use the response surface methodology (RSM). It involves fitting the parameters of simple functions (usually second- to fifth-degree polynomials) to the experimental data [61,62].
The described methodology was performed in the Matlab R2024a environment using poly23 and poly22 (simplified) methods [63]. The degree of polynomial was limited by the number of experimental points available. In the general case, the number of coefficients of the polynomial cannot exceed the number of experimental points. In the case of W and KC activated carbons, only maximum degrees 2–3 or 3–2 (with respect to temperature and KOH/char ratio) are applicable. For PO pellet where the number of experimental points is equal to 7, only degree two is applicable.
For the localization of local optima, the genetic algorithm (GA) was applied to polynomial functions [64,65]. This method involves using a generation-splitting evolutionary algorithm to find the optimum value without exploring the entire solution space. The range within which the optimum was sought was adopted according to the limits of the experimental data.
Statistical analysis of the results was performed in the Matlab2024a environment. Significance of the differences was assessed by ANOVA analysis.

2.12. Economic Analysis of Activated Carbon Production

Two raw materials, sawdust pellets (PO) and char obtained from partial gasification of waste wood (W), were selected for economic feasibility studies, as they are industrial waste that can be purchased at low or no price. Steam and carbon dioxide were chosen as activation agents. The chemical activation by potassium hydroxide was omitted in the analysis because of the multistage process, high consumption of KOH, HCl, and water, and, thus, the high environmental impact.
The preparation of activated carbons was modeled using the Aspen Plus 12.1 package, employing a similar approach to that described in other works [66,67]. The process was conducted in a steady state using the Peng–Robinson equation with the Berthelot mixing rules to determine the physical properties of compounds. The pyrolysis and activation process simulation required a definition of the composition of PO and W, which was performed using the results of the proximate and the ultimate analysis (Section 2.6 and Section 2.7). The raw material stream was defined as a nonconventional solid, and its enthalpy and density were determined by HCOALGEN and DCOALIGT models, respectively.
Figure 1 presents a simplified flow sheet of the developed model. The reactor, where pyrolysis and activation occur, was simulated using two Aspen units: RYield and RGibbs reactors. Pyrolysis of the feed stream takes place in the first one (R1 in the diagram), transforming an unconventional raw material stream into conventional compounds with a previously determined efficiency. After mixing with an activation agent (i.e., steam or carbon dioxide), the stream of gaseous products is directed to the second reactor (R2), which generates products of drying, pyrolysis, partial oxidation, and gasification processes through the equilibrium path with minimal Gibbs free energy at specified P and T conditions. The inlet stream’s molar ratio of the activation agent to carbon was set to 1.1 to ensure that all carbon eventually reacts. The pressure remained constant during all simulations, and the temperature was changed from 750 to 900 °C.
The stream leaving reactor R2 is then separated in a separator S1 into a stream of post-reaction gas and activated carbon. The activated carbon is cooled in the H3 heat exchanger to room temperature and the gas is directed to the furnace (F), where it is burned under adiabatic conditions. Exhaust gases pass through two heat exchangers. The first one (H1) is used to reduce the exhaust gas temperature to about 1000 °C by partially recycled cold exhaust gases, and the second exchanger (H2) cools the exhaust gases to a temperature 20 °C higher than the dew point temperature.
The above model can be used to analyze activated carbon production economically. Assumptions made during its development, such as not considering the cost of equipment, employees, and transportation, may lead to an underestimation of the overall AC preparation cost. In addition to economic analysis, the proposed model offers possibility to determine the pyrolysis gas composition, which can be found in the Supplementary Materials (Table S1).

3. Results and Discussion

3.1. Raw Materials Characterization

The characterization of raw materials was performed to evaluate their potential as a feedstock for activated carbon manufacturing and to obtain the data necessary for economic analysis. Proximate analysis results are collected in Table 2. The PO sample has a low ash content and a very high volatile matter content, typical for wood pellets [68,69]. It was subjected to low-temperature carbonization to prepare material similar to the other raw materials (W and KC). The volatile matter content is significantly lower in the product PO500, as expected, but still remains a few times higher than in KC and W. It is below 5% in KC and W, indicating that those two materials are chars with very stable structure. It suggests that those commercial chars were obtained at a higher temperature than PO500. The ash content in those materials is also higher than in PO500, which could also be the result of a higher carbonization temperature or a higher ash content in the raw materials used for their preparation [70].
The elemental composition of PO presented in Table 3 resembles those of the other lignocellulosic materials, with about 50% carbon content, 6% hydrogen, 43% oxygen, and well below 1% content of other elements [68,69]. After carbonization, the carbon content increased and the hydrogen, oxygen, and sulfur content decreased. Thus, the H/C and O/C ratios also declined. It is the result of the devolatilization of organic matter upon thermal treatment. The W char had even higher H/C and O/C ratios and extremely high carbon content, which is another piece of evidence of the high temperature during its production. Its high carbon content is also a reason for its high heat of combustion (see Table 2).
The TG results presented in Figure 2a confirmed the high thermal stability of char raw materials. All of them, after the initial mass loss associated with the release of moisture (below 200 °C), remain stable. Further decomposition starts at the lowest temperature in the case of PO500—at 400 °C because its carbonization temperature was 500 °C. Decomposition of KC starts at 600 °C. Also, the total mass loss of chars at 900 °C is very low: 15.2% and 11.2% for KC and W, respectively. The mass loss of PO500 is slightly higher (21.3%). The wood pellet thermogram is, of course, different. The lignocellulosic biomass is made up of three main polymers: hemicellulose, cellulose, and lignin. Each of them has different thermal stability, which is reflected in more than one stage of thermal decomposition. Below 200 °C almost 6% mass loss is observed, which is related to moisture release. Then, the most intense decomposition starts at 250 °C, with the peak maximum around 350 °C. This is the region in which all three polymers decompose, starting with the least stable hemicellulose. The last decomposition stage is less pronounced and starts at 375 °C. At 400 °C, the maximum intensity of cellulose decomposition occurs. Lignin decomposes in the wide temperature range between 250 and 850 °C [71,72]. The thermal degradation temperature is affected not only by the type of sample but also by its weight. Heat and mass transfer cannot be ignored when a high sample mass (1 g or higher) is used (macro-TG). It affects the kinetics of the process, and the decomposition temperature is usually shifted to a higher value [71]. However, macro-TG is of practical value for studying the carbonization process since the same sample mass and heating rate were used during the TG analysis and carbonization.
According to the results presented in Figure 2b and Table 4, the raw materials have a poorly developed porous texture with BET surface area below 100 m2/g. The only exception is KC, with BET surface of 356 m2/g. In addition, this char is the only one lacking submicropores (<0.4 nm width) in its structure. It is well known that chars obtained at higher temperatures have a larger surface area and pore volume, but generally not greater than 500 m2/g and 0.2 cm3/g [73]. The studied chars are highly microporous materials, with an 88–95% share of micropores in the total pores volume.

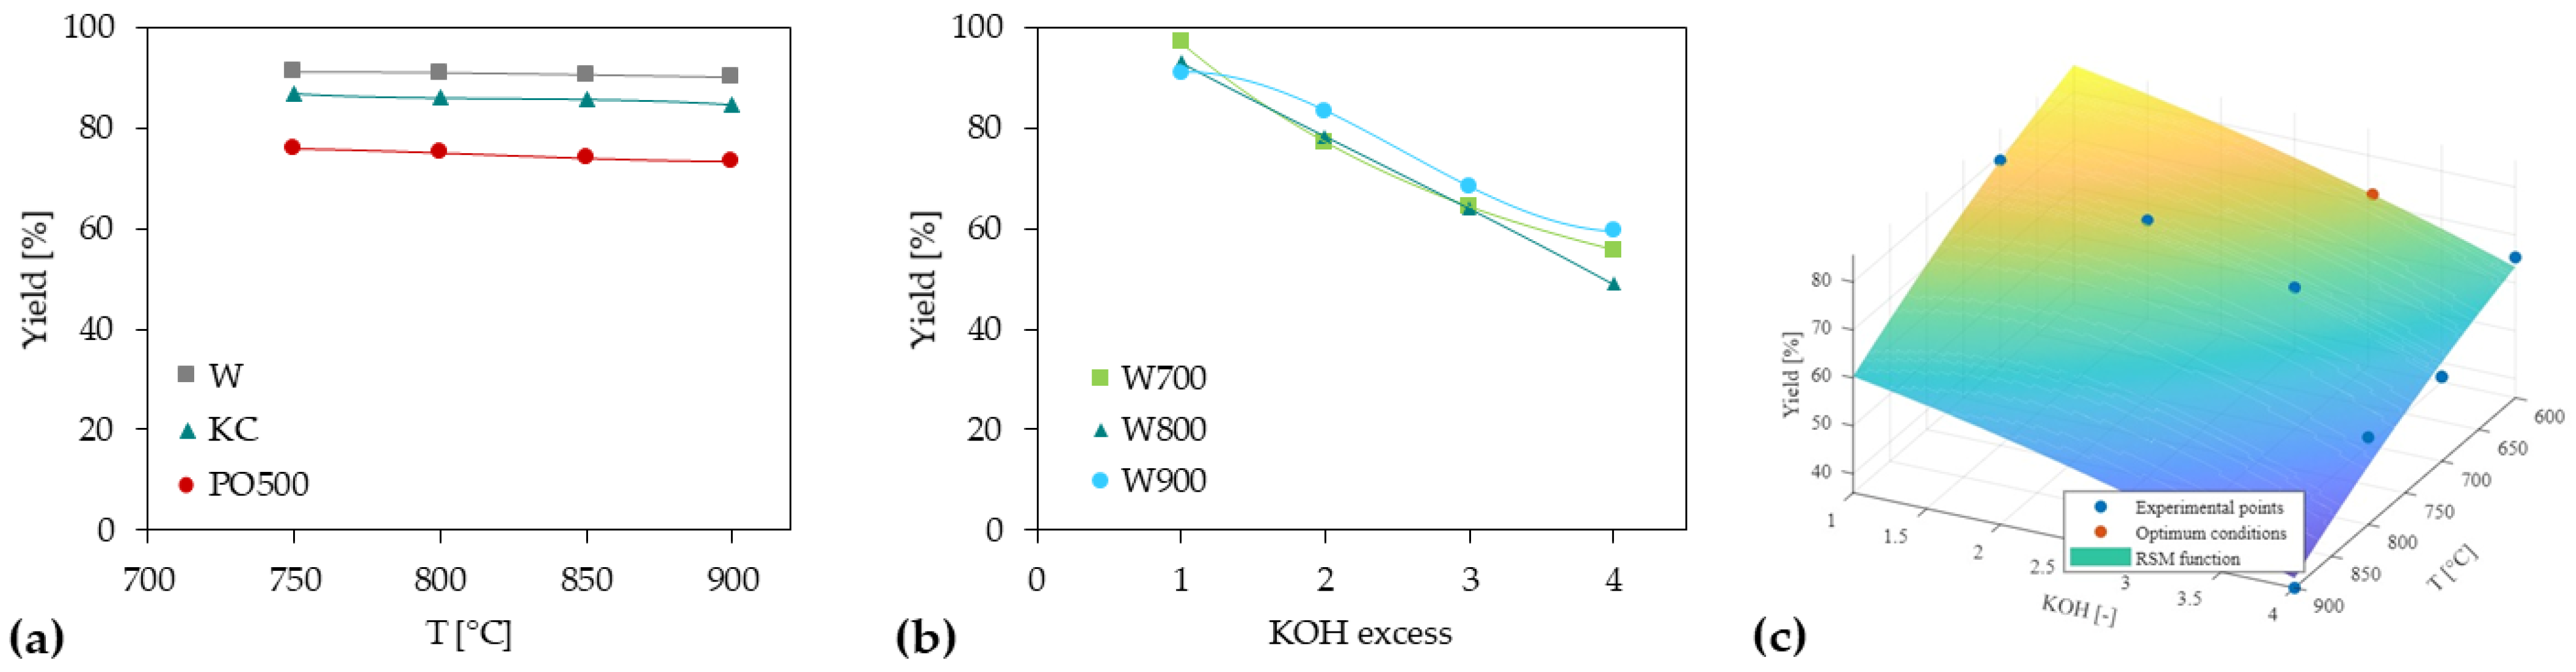
3.2. Activated Carbon Preparation

Carbonization and physical activation of raw materials (W and KC) and PO500 were performed in one run. In addition, carbonization under the same conditions was performed in order to study the characteristics of the obtained chars. Figure 3 shows the yield of chars and selected KOH activated carbons. The yield slightly decreased with temperature, but is primarily governed by the type of raw material. Chars from the same raw material were obtained with a similar yield regardless of temperature: 90.5 ± 0.5 (W), 85.7 ± 0.9 (KC), and 74.7 ± 1.1 (PO500). The most thermally stable raw materials resulted in the highest char yield. In the case of chemically activated carbons, the yield is mainly governed by KOH excess. The higher the KOH/char ratio, the lower the ACs yield, at the same activation temperature. It is worth noting that during W activation with equal KOH mass, a very high yield of 91–97% was achieved.
The reactivity of the chars was calculated in steam and CO2 activation, and the results are collated in Table 5. Reactivity and, as a result, time of activation are affected by both properties of the raw material and the activation temperature. It was proved that more stable materials with lower volatiles content and higher carbon content are less prone to activation by both steam and CO2. This explains why the most stable KC char was less reactive during both steam and CO2 activation than the other ones. This difference is more pronounced at lower activation temperatures. Activation temperature is the main factor that affects the reactivity of the chars. Reactivity increases with increasing temperature (7.8–11.8 times in the temperature range 750–900 °C), regardless of the type of char.

3.3. Porous Structure of Chars and Activated Carbons

3.3.1. Chars and ACs from Physical Activation

The porous texture parameters of the chars and ACs from steam and CO2 activation are presented in Figure 4.
The BET surface area of the obtained chars is in the range of 76 to 438 m2/g. It differs more with raw material type than with carbonization temperature. Chars with the lowest SBET were prepared from PO feedstock and those with the highest from KC. In the case of PO and W chars, the surface area increases in comparison to that of raw material, in contrast to that of KC-based chars, which have SBET similar to those of KC.
The specific surface area of activated carbons is significantly greater (668–1019 m2/g) compared to starting materials. In the case of all feedstocks, except PO, the highest value has AC manufactured at a moderate temperature of 800 or 850 °C. The KC_CO2 samples display the highest values of SBET among all the materials examined. However, they have the lowest total pore volume, together with the sorbents obtained by the same method using other feedstock (PO) (Figure 4b). Both series of ACs received in steam activation have a higher Vtot value (max. 0.610 cm3/g). A developed mesoporosity in their porous structure (Figure 4c), which even reaches 57.2% for W850H2O sample, accounts for that phenomenon. ACs obtained from CO2 activation and chars are predominantly microporous, with 79.8–87.7% of micropores in total pore volume, with a minimal share of mesopores, while PO chars have homogeneous microporous structure (96.2–98.5% of micropores). Steam activation usually yielded sorbents with less uniform pore size distribution. The reason is the higher reactivity of steam than that of CO2 (see Table 5). As a result, the activation rate is usually limited by internal diffusion, and the reaction proceeds faster closer to the pores entrance than inside them. At elevated activation temperature, the reactivity of the activating agent is enhanced, which consequently contributes to an increase in the share of mesopores in the final material. However, when reactivity is too high, it might lead to an external diffusion-limited activation rate. Activation proceeds partially on the external surface, and intrinsic pores are not well developed, as is observed for ACs prepared in 900 °C (with the exception of PO900CO2).

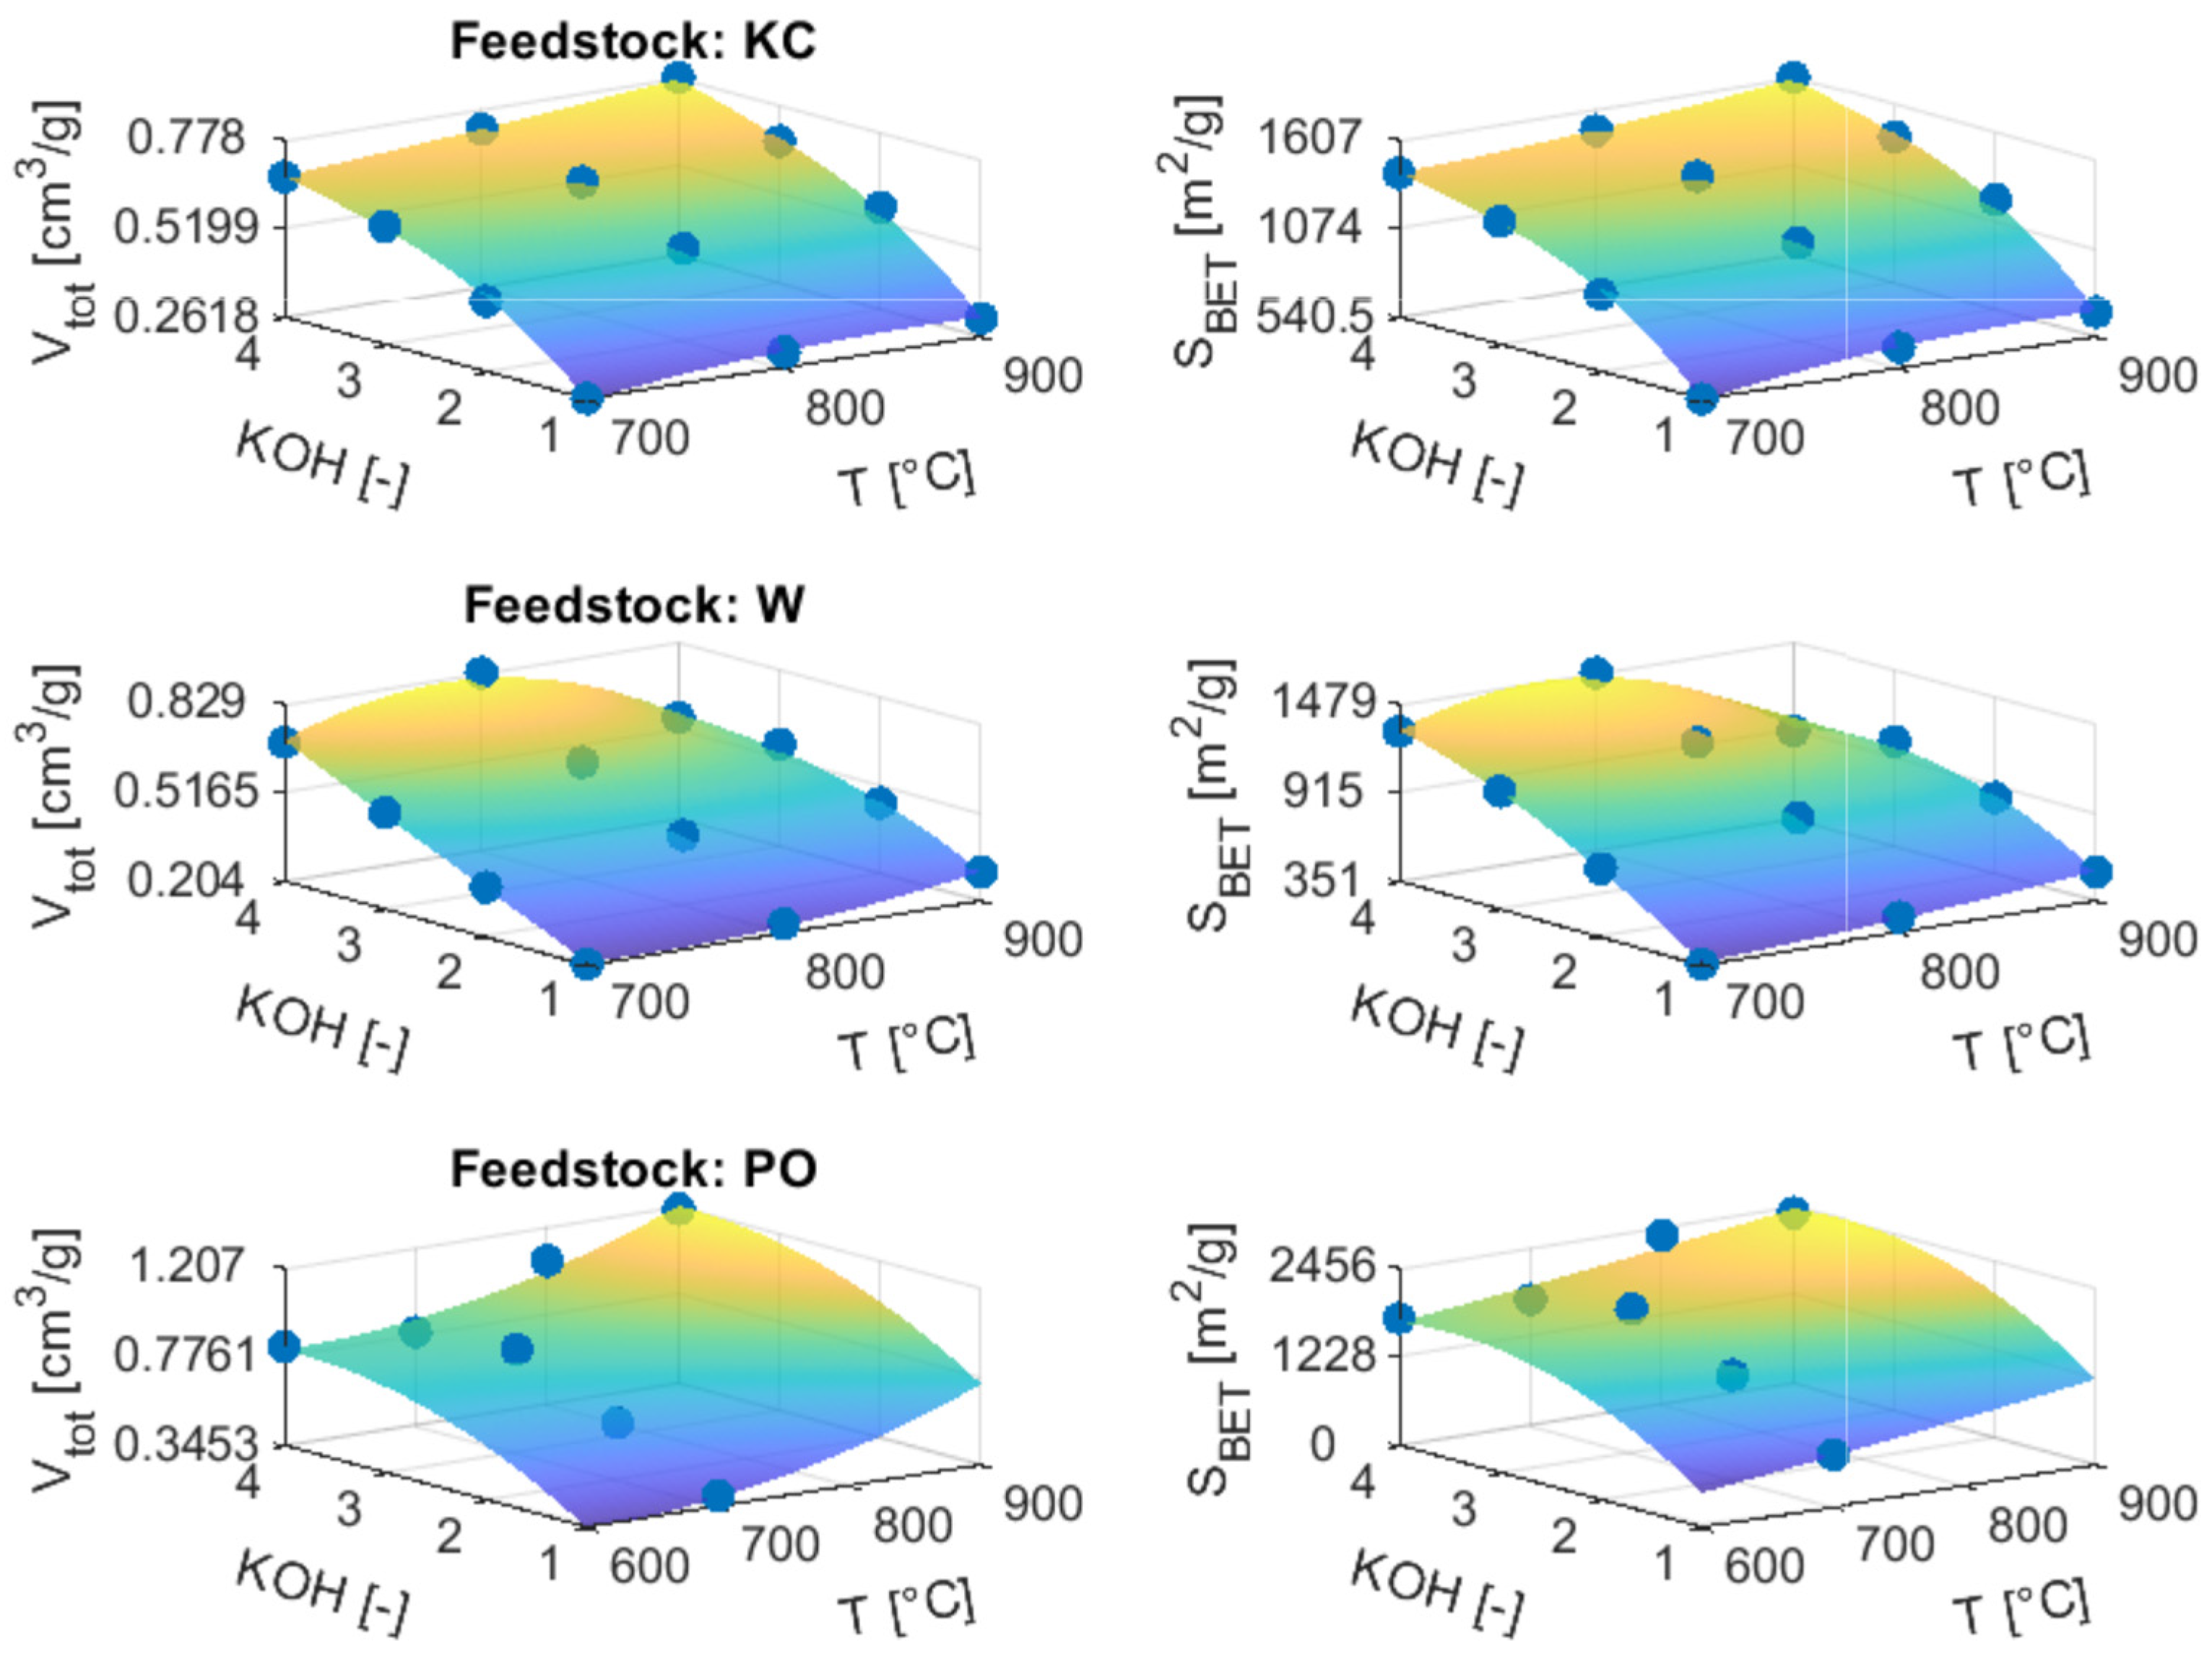
3.3.2. ACs from Chemical Activation

The porous structure parameters of 31 ACs produced from KOH activation can be found in Table S2 in the Supplementary Materials. On the basis of the obtained results, optimization of activation was made in order to find process parameters (temperature and KOH/char ratio) which resulted in ACs with the highest BET surface area and total pores volume.
Only in the case of the W and KC raw materials was a full experimental grid available, allowing the following equation to be used:
surface ( x , y ) = p 00 + p 10 x + p 01 y + p 20 x 2 + p 11 x y + p 02 y 2 + p 21 x 2 y + p 12 x y 2 + p 03 y 3
where x stands for temperature, and y for the ratio of KOH. This means that the polynomial is of second degree with respect to x, and third with respect to y. Alternatively, it is possible to invert the degrees of the polynomial, but the initial screening showed that in this case, the accuracy of fitting the surface to the experimental points decreases, so this possibility was rejected. For PO raw material, where only seven experimental points were available, it was necessary to use a simplified equation:
surface x , y = p 00 + p 10 x + p 01 y + p 20 x 2 + p 02 y 2
It is a polynomial of the second degree with respect to both variables, with the x·y interaction removed. The results of the fitting versus the experimental data are presented in Figure 5.
The plots indicate that the correlation between the experiment and the polynomial model is high. The KC and W plots show higher accuracy, with R2adj in the range between 0.995 and 0.978. On the other hand, plots for PO are only moderately weaker with R2adj of 0.930 and 0.875, respectively. All R2adj values are summarized in Table 6.
To prove the statistical significance of the conclusions drawn, ANOVA multivariance analysis was conducted. The results are presented in Table 7.
Regardless of the type of raw material, the BET surface area and pore volume rise with increasing KOH/char ratio, reaching a maximum at the highest studied ratio of 4. This tendency is independent of the activation temperature. The only exceptions are PO-based and W-based ACs obtained at 900 °C, with the highest parameters at the ratio of 3. As can be seen in the plots, the temperature effect is significantly less pronounced than the KOH/char ratio in the examined ranges. ANOVA analysis confirmed that only in the case of KC-based ACs are there significant differences between sorbents obtained at different temperatures in terms of their porous texture parameters. This means that the latter parameter is more important in controlling porous texture development in ACs.
Having continuous functions describing all cases, it is possible to proceed to the search for the optimum. GA was applied to find the localization of optima for all presented surfaces. Figure 6B reveals the result of the procedure mentioned above. As can be seen, in all cases, the optimum was located on one of the edges of the tested conditions. However, the exact values of the temperature and KOH/char ratio were similar but not uniform between the parameters. Regardless of the raw material type, AC with the highest SBET and Vtot was obtained with a KOH/char ratio of 4, with the only exception of SBET of PO-based ACs. In the case of KC and PO-based ACs the highest temperature of 900 °C was beneficial. The opposite tendency shows W-based ACs, which reach the maximum of porous texture parameters at temperatures below 800 °C.
Ultimately, as can be seen, there are small discrepancies between the features, so a more complex objective function had to be used to produce the final recommendation. Regarding parameters related to the physical structure of material, the objective function takes the following form:
obj 1   ( x , y ) = V T O T × 10 3 + S B E T 2
where VTOT describes the total pore volume of activated carbon, and SBET is its surface area. Multiplication by 103 is necessary to equalize the order of magnitude between the parameters. The proposed objective functions were applied independently to all three types of activated carbons, resulting in the output presented in Table 8.
The AC with the highest pores volume and surface area (1.201 cm3/g and 2454 m2/g, respectively) was obtained from wood pellet. The other feedstocks resulted in sorbents with a much less developed porous texture: Vtot of about 0.8 cm3/g and SBET of about 1500 m2/g. These values are well below what is expected for KOH activation under those conditions. It is probably caused by a very stable structure of the KC and W chars, which were less prone to activation than the PO char.

3.4. Ammonia Sorption

3.4.1. Chars and ACs from Physical Activation

The ammonia sorption capacity and sorption reversibility of raw materials, chars, and activated carbons from physical activation are depicted in Figure 7.
All raw materials show a high ammonia sorption capacity (76.7–93.9 g/kg), which is higher than commercial AC: BA_NH4 (71.2 g/kg). However, commercial ACs for ammonia sorption (ZnCl2-loaded) tested in the other studies show higher sorption capacity of about 180 g/kg [74]. Thus, pristine raw materials are not valuable sorbents for the removal of this pollutant.
Moreover, the acid-impregnated sorbent is dedicated to irreversible adsorption of ammonia, so only 72.9% of ammonia was desorbed upon pressure change. The aim of the presented study was to prepare sorbents for reversible ammonia sorption. However, an interesting low-cost alternative to BA_NH4 was also found. Low-temperature char PO500 shows similar sorption reversibility (75.8%) and significantly higher ammonia capacity (93.8 g/kg). The high amount of ammonia retained in the material after desorption might be a result of a chemisorption process or kinetic constraints imposed by submicropores in the sorbent [74]. The former is the case of commercial AC, which is functionalized with sulfuric acid. PO500 has a high share of submicropores (48 vol.%) that can act as a bottleneck that traps ammonia molecules inside the porous structure.
The sorption capacity remained at the same level or even decreased when the raw materials were carbonized. However, after activation, this tendency was reversed. ACs made from all materials exhibited higher adsorption compared to those of raw materials, except those obtained from KC using steam. The higher ammonia capacity of KC ACs from CO2 activation could be explained by the higher content of oxygen and acid functional groups, favorable for ammonia adsorption [75], on the surface of ACs after CO2 activation, compared to those activated with steam [76]. The KC raw material was the least suitable for the preparation of carbon sorbents for ammonia sorption. KC chars adsorbed an average of 65.2 g/kg and steam activated KC: 69.4 g/kg, which is lower than KC itself. Only KC_CO2 ACs provide a mean ammonia capacity of 93.8 g/kg. However, they have a mean reversibility of 84.3%, which is significantly lower than for other prepared ACs. The rest of the ACs have very high reversibility in the range of 91.2 to 93.2%. It proves mainly physical mode of adsorption. The highest adsorption shows PO750CO2: 143.9 g/kg. Also, it has the highest reversible adsorption of 133.8 g/kg. The other ACs prepared from PO using CO2 activation have only slightly lower capacity. For all ACs obtained, the effect of activation temperature on ammonia capacity is negligible when compared with the effect of feedstock type and activation method.

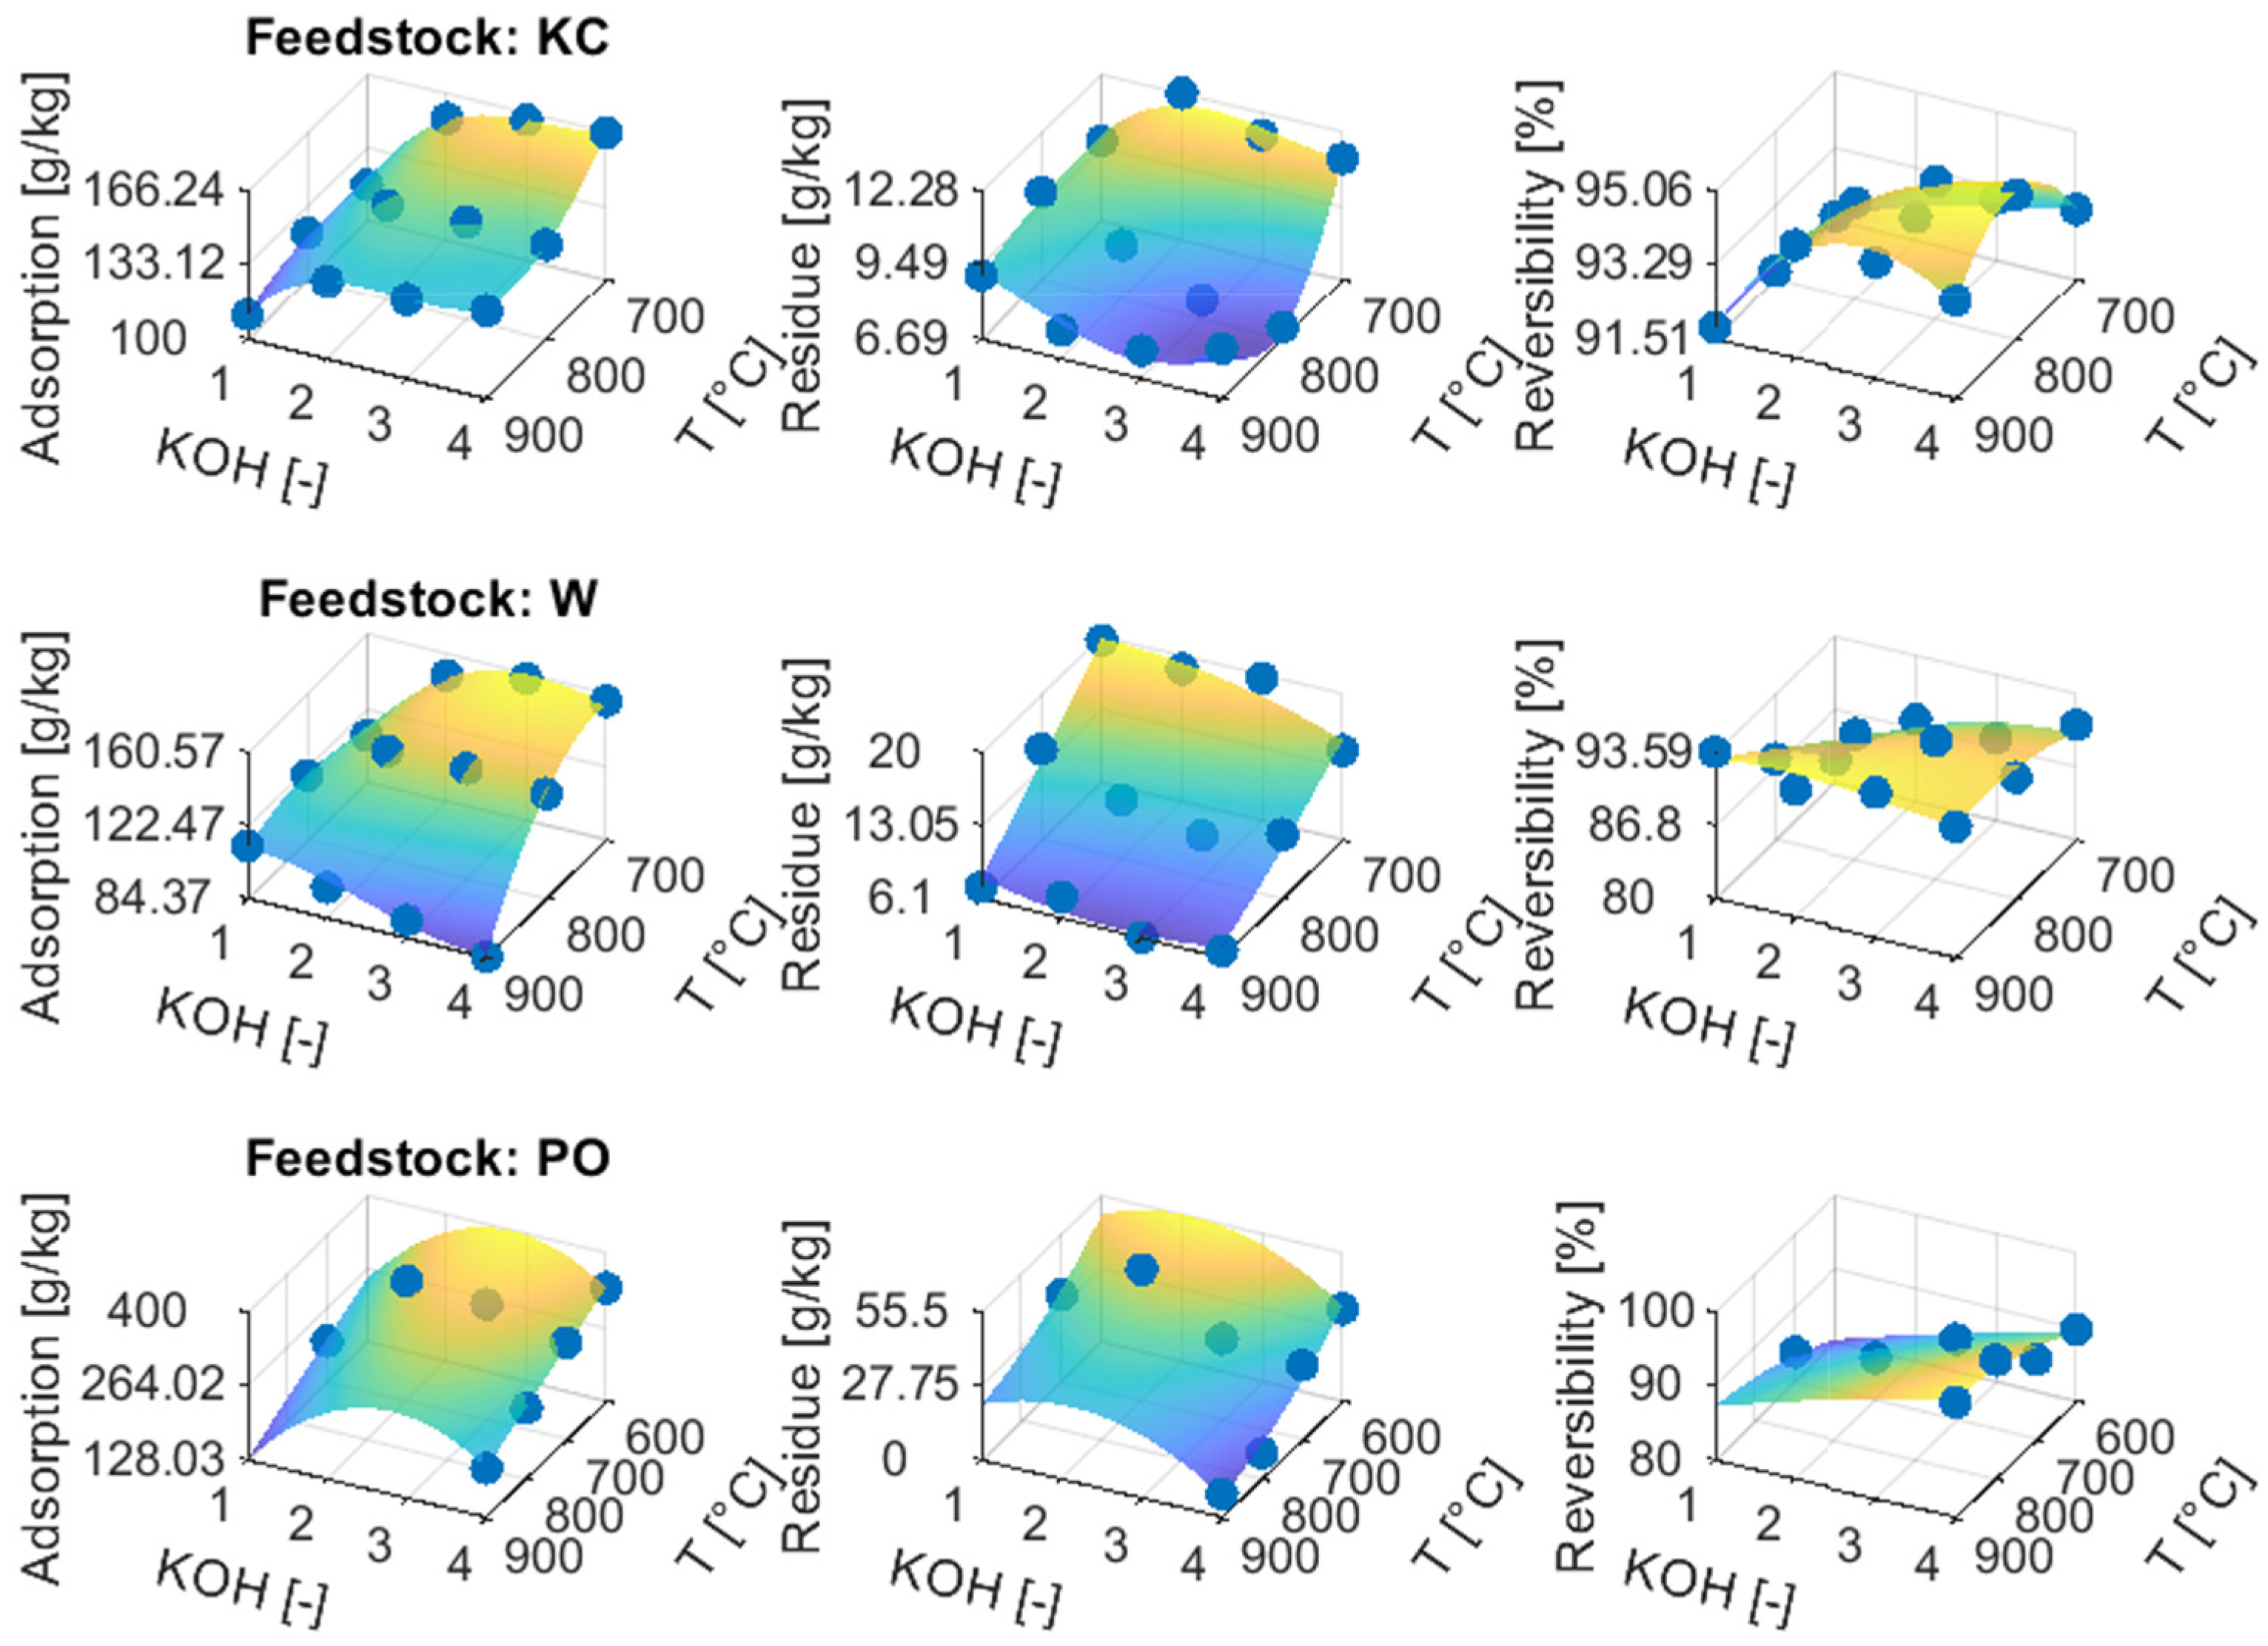
3.4.2. ACs from Chemical Activation

The ammonia capacity of ACs obtained in KOH activation was in the range of 84.4 g/kg on W900KOH4 to 348.3 g/kg on PO700KOH2. Mean capacity (167.3 g/kg) was higher than the highest value obtained on ACs from physical activation. This means that, generally, KOH ACs are more suitable for ammonia adsorption.
They show a greater variability of the sorption reversibility, which was in the range of 82.0 to 96.2%. In the lower region of that range fall almost exclusively ACs obtained in 700 °C from W and PO chars. Almost 20% of irreversible adsorption indicates partial chemisorption of ammonia and the presence of functional groups forming specific bonds between adsorptive and adsorbent. The most reversible adsorption occurred on PO-based ACs obtained with a KOH/char ratio of 4 at 800 and 900 °C.
Optimization of ammonia capacity and sorption reversibility with respect to activation parameters (T and KOH/char ratio) was performed for activated carbons from chemical activation. The same procedure was used as for ACs porous texture optimization (Section 3.3.2). The plots that present polynomial fitting and experimental data are collated in Figure 8.
Plots 1 to 6 indicate high consistency with the experimental data. The R2adj varies in the range of 0.820 to 0.993 (with the only exception for W reversibility and R2adj 0.743), and relative mean squared error (RMSE) between 0.003 and 3.141. For plots 7–9, those with simplified equation, the accuracy is diverse, and for PO desorption, it is only 0.608. However, this result is exceptional, and find no repetition in any other plot. All R2adj can be found in Table 6.
Generally, both of the tested parameters (temperature and KOH excess) affect ammonia sorption. However, there are a few exceptions which can be seen in the graphs in Figure 8 and are proved by ANOVA results (Table 7). The amount of desorption residue does not differ significantly on sorbents obtained with different KOH-to-char ratio regardless of feedstock. In the case of W-based sorbents, ammonia capacity and reversibility do not show significant differences, regardless of which KOH excess was used for their preparation.
Ammonia capacity strongly depends on activation temperature, and it is the highest on sorbents obtained at the lowest temperature of 700 °C. Also, it was observed that the effect of KOH excess changes with activation temperature. At lower activation temperature, adsorptivity increased with KOH-to-char ratio. At higher temperatures, this correlation is less pronounced, and on W-based activated carbons, even reverse correlation is observed. Ammonia adsorption on ACs obtained at 900 °C decreased with increasing KOH excess. A similar observation was made by Mochizuki [77]. It can be explained by the content of acidic surface groups. The total amount of this type of group decreased with increasing temperature during activation. In addition, the effect of KOH excess is more pronounced at lower activation temperature.
Optimization of the obtained continuous functions was performed. Naturally, the direction of the search will depend on the chosen parameter. A raw material with the highest possible sorption and the lowest desorption leftover, i.e., with reversibility tending towards unity, is desirable. The optima located using GA are shown in Figure 6A. Similarly, like in porous texture optimization, in most cases, the optimum was located at the extreme of one of the tested conditions. However, the optimal values of the KOH/char ratio and the temperature of different sorption parameters were not the same. For adsorption capacity, low temperature was preferred. Regardless of the type of feedstock, the amount of ammonia adsorbed was the highest on 700 °C activated ACs with the three or four times excess of KOH. On the contrary, the lowest amount of ammonia remained after desorption within the structure of ACs obtained at 900 °C (W and PO) or at least above 800 °C (KC). The same pattern was observed for the sorption reversibility. A KOH/char ratio above 3 was beneficial for all sorption parameters, except for reversibility on ACs made from W char (KOH/char ratio below 2).
Because of significantly higher discrepancies between features, complex function is an even more valuable tool for sorption optimization than in the case of porous texture. The function for sorption-related parameters was as follows:
obj 2   ( x , y ) = A d s o r p t i o n R E V   × 0.7 + A d s o r p t i o n T O T A L ×   0.3
where the first part describes the reversible part of adsorption (total adsorbed NH3 reduced by the residue after desorption) and the second describes the total amount of NH3 adsorbed in the activated carbon.
The maximum ammonia adsorption on optimized ACs reaches 396.9 g/kg (39.7 wt.%) for the PO-based sorbent obtained with 3.03 excess of KOH in 600 °C (Table 7). Even with 50.9 g/kg desorption residue, it gives 346.0 g/kg of reversible adsorption. Optimum ACs based on the other feedstocks studied (KC and W) were over two times less effective in the removal of ammonia.
As can be seen, the optimal values for sorption-related parameters are not in line with the carbon structure-related parameters. Only the amount of KOH used for activation covers most parts. The preferred temperatures are mutually exclusive, except for W char, where, indeed, both factors indicated a preference toward moderate temperature, around 750 °C.

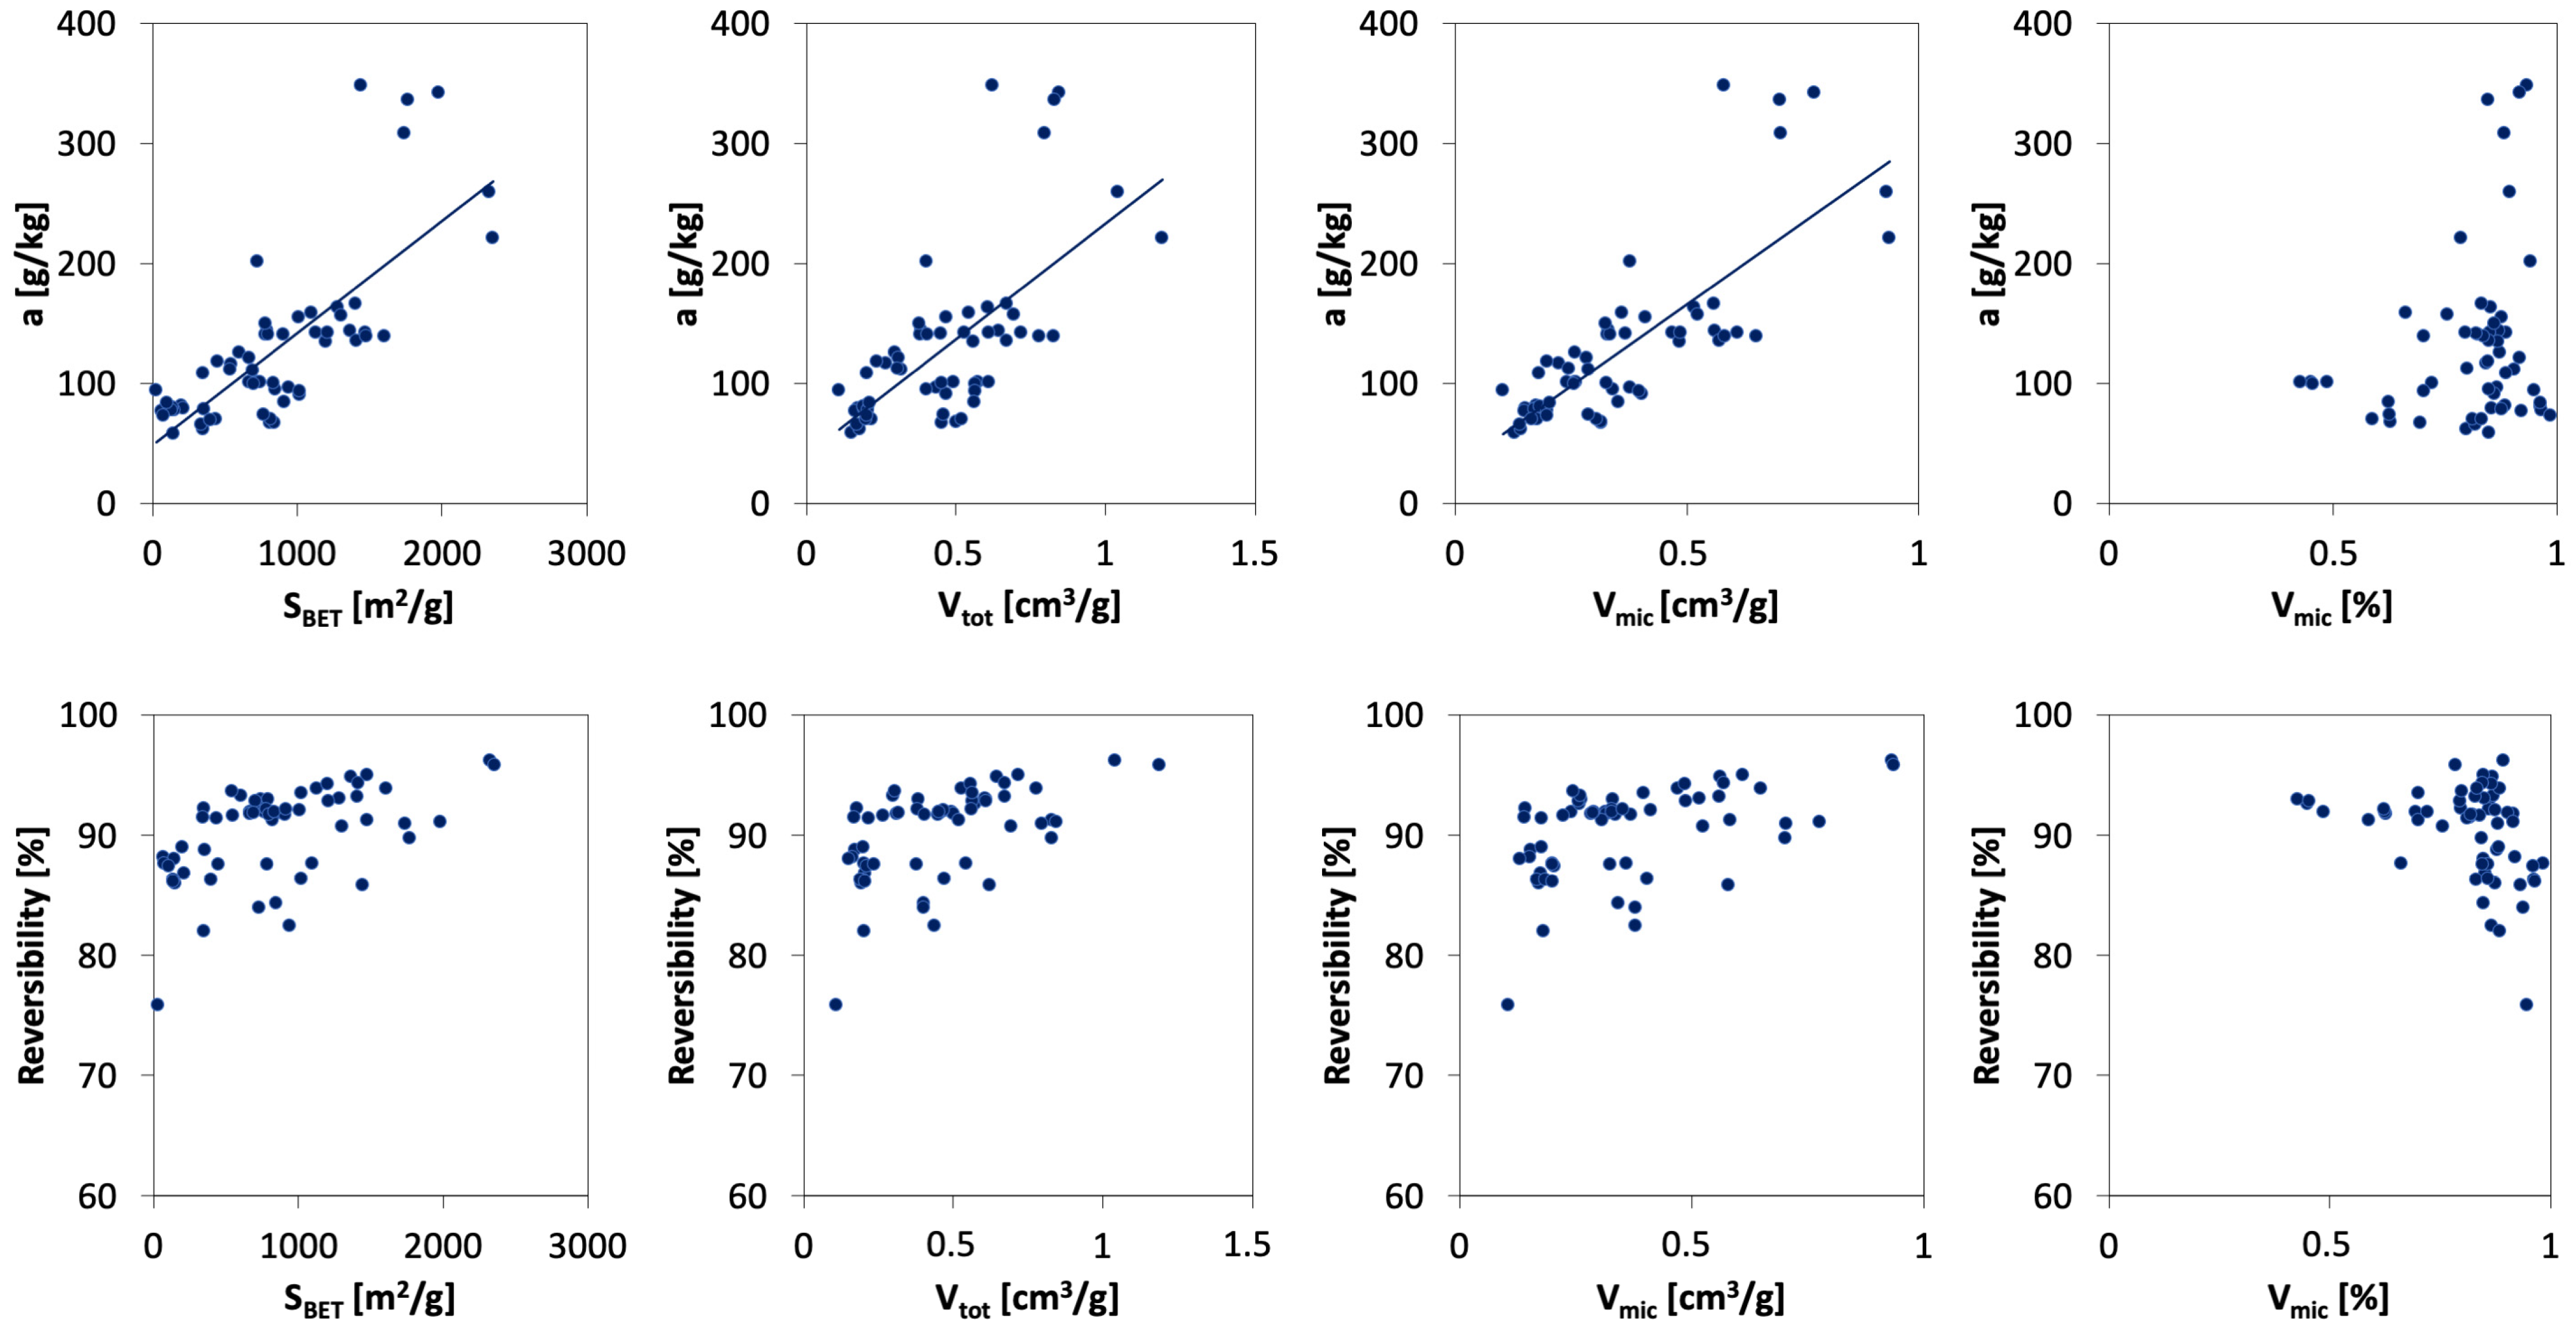
3.5. Effect of Porous Texture Parameters on Ammonia Sorption

Therefore, in the next step, the effect of porous texture parameters on ammonia sorption characteristics was studied, with the aim of checking whether and how these two groups are correlated. The results are presented in Figure 9. Analysis was performed for all raw materials, chars, and prepared activated carbons, which means 61 samples. Commercial activated carbon BA_NH4 was excluded as it was impregnated with acids, so chemical interactions, not physical ones, govern ammonia adsorption on it.
A clear positive correlation between sorption capacity and BET surface area, micropores, and total pores volume was found. R2 is within the range of 0.568 to 0.613, with the highest value for the micropore volume dependence. On the basis of the knowledge of the adsorption process, it can be assumed that the micropores may play a crucial role in the adsorption of small molecules of ammonia. The results presented by Petit and Bandosz [78] confirm that for unmodified activated carbons, with a small number of functional groups on the surface, ammonia adsorption depends linearly on the volume of micropores and, to a lesser extent, on the total volume and surface area of the pores. Analysis for separate groups of materials (chars, ACs physical activation, ACs chemical activation) shows that the highest correlation (R2 = 0.6836) is for chars. These materials have the lowest number of surface groups.
Reversible adsorption is also favorable on ACs with the most developed porous texture, but, as can be seen from the last graph, a homogenous microporous structure is not desired. Mesopores are required for the high rate of internal diffusion of adsorptive molecules.
However, correlation factors below 0.7 mean that there are also other than porous-texture ACs parameters that affect ammonia sorption. ACs from CO2 activation have higher content of acidic oxygen functional groups which is beneficial for ammonia sorption [78].

3.6. Economic Assessment

The economic feasibility of activated carbon preparation was evaluated through economic cost analysis based on the cost of raw materials, pure chemicals, and the amount of energy used in the process (Table 9). To simplify the calculation, labor and equipment costs were not included in the cost analysis process.
Simulations performed on the production of activated carbons allowed us to determine the cost of obtaining one kilogram of activated carbon and the amount of excess thermal energy (ETE) that can be obtained during this process (Table 10). This energy is calculated as the difference between the energy recovered from the exhaust gas stream (H2 exchanger, Figure 1) and the energy needed to activate char W or pellets PO at a specific temperature.
Because char (W) is a free waste material, the cost of obtaining activated carbon from it using steam activation is, on average, EUR 0.03 lower than that of AC, made from sawdust pellets (PO). At the same time, the amount of thermal energy recovered from exhaust gases is higher for char (W) by approximately 1.1 to 1.6 kW/kg of AC, due to the lower, in comparison to PO, amount of H2O and CO2 in the evolved gases (Table S1).
In the case of carbon dioxide activation, the cost of obtaining one kilogram of activated carbon from W is usually higher than that from PO (Table 10). This is due to the more significant energy input required to activate W and is related to the composition of the raw materials: mainly higher carbon content (see Table 3 and Table 4).
Increasing the activation temperature significantly impacts the composition of the post-reaction gas. The amount of hydrogen decreases in the case of both starting materials, and the carbon monoxide share rises at the expense of carbon dioxide (a growth from 74.4 to 89.3% for W and 48.7 to 51.1% for PO; see Table S1). The most significant difference can be observed for the water vapor content, which drops with temperature in the case of W and increases in the case of PO.
It is worth noting that the temperature at which activation is carried out has little effect on the final price of the product, regardless of the type of activating agent. The type of raw material and its properties are much more important here.
The results of the economic analysis based on the simulation of activated carbon production indicate a similar cost per kilogram of AC as reported in the literature [79,80]. Simultaneously, prices are lower than those for commercial activated carbon BA_NH4 (Table 9). However, the simplification made during the development of the model used in these simulations (see Section 2.12) causes the obtained prices to be lower than the actual ones. On the other hand, it is possible to further reduce costs, for example, by using heat obtained from the combustion of post-reaction gases to generate steam and heat the reactor where activation occurs as well as the separation of carbon dioxide from the exhaust gas stream, which could then serve as an activating agent. These approaches could significantly reduce the costs of obtaining activated carbons.

4. Conclusions

The paper presented research regarding ammonia sorption on prepared activated carbons. Three different raw materials (waste char, sawdust pellet, and commercial char) were subjected to activation, either physical (by steam or CO2) or chemical (by solid KOH). The effects of activation parameters (temperature and KOH/char ratio) on AC porous structure parameters and ammonia sorption were evaluated. Response surface methodology and genetic algorithm were used for searching for optimum KOH activation conditions regarding both ammonia sorption and porous texture of ACs.
An exceptional sorption capacity of 396.9 g/kg was found for AC based on sawdust pellet obtained at optimum conditions of 600 °C and 3.03 KOH/char ratio, showing a sorption reversibility of 87.2%. The maxima obtained is higher than that reported previously on both modified and native ACs, e.g., Qajar et al. [81] reported 290 g/kg of ammonia uptake by polymer-based AC treated with nitric acid, in contrast to about 170 g/kg by untreated carbon. Also, after physical activation, the same raw material resulted in the AC with the highest ammonia sorption of 143.9 g/kg, among physically activated carbons, and even higher reversibility, amounting to 92.9%. However, it displayed 2.5-fold lower efficiency of ammonia removal than that of chemically activated sorbent. The other sorbents prepared on the basis of this raw material are only slightly less effective. Irrespective of the activation method, the type of feedstock was the main factor that affected both the porous texture of the ACs and their ammonia capacity. Additionally, during chemical activation, the KOH/char ratio was an important variable. The effect of temperature in the studied range was negligible in most cases.
Porous texture of activated carbons affects ammonia capacity and reversibility, but the effect of surface chemistry cannot be ignored. The highest positive correlation was found between ammonia capacity and micropores volume. Reversibility also increased with the pores volume, but a heterogenous porous structure is required.
Despite significantly better properties of KOH activated carbon, this method is rarely used in the industry, due to a multistage process and problematic waste. However, it must be noted that the yield of optimum AC production was higher in chemical activation: over 72%, compared to 39% in CO2 activation with carbonization. From a practical point of view, the sorbent performance, the cost of its production, and the environmental impact of this process have to be taken into account.
The results obtained proved that sawdust pellet is a promising material for preparing ACs for the removal of ammonia from piggery vent air. Highly reversible sorption makes used sorbent a promising structure-forming soil additive that may fertilize crops in carbon and nitrogen. Thus, prepared sorbents can contribute to a more sustainable agriculture in two ways: by reducing ammonia pollutant emission from piggeries, and by creating a potentially more environmentally friendly alternative to ammonia-based mineral fertilizers.

Supplementary Materials

The following supporting information can be downloaded at: https://www.mdpi.com/article/10.3390/su16146122/s1, Table S1: Composition of the gas stream (selected compounds) at the furnace (F) inlet calculated during activation process simulation. Table S2: Porous texture of activated carbons prepared by KOH activation.

Author Contributions

Conceptualization, J.K., M.K., H.F., R.Ł., S.H., K.J. and K.P. (Katarzyna Pstrowska); methodology, J.K., K.P. (Karol Postawa) and R.Ł.; software, R.Ł. and K.P. (Karol Postawa); validation, R.Ł., H.F. and K.P. (Karol Postawa); formal analysis, H.F., J.K., R.Ł. and K.P. (Karol Postawa); investigation, J.K., H.F., K.P. (Katarzyna Pstrowska) and R.Ł.; resources, M.K.; data curation, H.F., J.K., R.Ł. and K.P. (Karol Postawa); writing—original draft preparation, H.F., K.J., S.H., K.P. (Katarzyna Pstrowska), R.Ł. and K.P. (Karol Postawa); writing—review and editing, J.K. and M.K.; visualization, K.P. (Karol Postawa), H.F. and R.Ł.; supervision, M.K.; project administration, M.K.; funding acquisition, M.K. and K.P. (Karol Postawa). All authors have read and agreed to the published version of the manuscript.

Funding

This research was funded by Narodowe Centrum Badań i Rozwoju, grant number BIOSTRATEG2/298357/8/NCBR/2016.

Institutional Review Board Statement

Not applicable.

Informed Consent Statement

Not applicable.

Data Availability Statement

The original contributions presented in the study are included in the article/Supplementary Materials; further inquiries can be directed to the corresponding author/s.

Acknowledgments

The authors are thankful to Justyna Zawada, Anna Dul, Klaudia Mikołajczyk, Tomasz Sipiora, and Marcin Jankowski for their support during the preparation of activated carbons. Donation in kind from Elbar-Katowice Sp z o.o.: Carbon Racibórz (KC raw material and BA_NH4 activated carbon) is greatly acknowledged.

Conflicts of Interest

Author Marek Kułażyński was employed by the company Innovation and Implementation Company Ekomotor Ltd. The remaining authors declare that the research was conducted in the·absence of·any commercial or financial relationships that could be construed as a potential conflict of interest.

References

  1. Kim, S.W.; Gormley, A.; Jang, K.B.; Duarte, M.E. Invited Review—Current Status of Global Pig Production: An Overview and Research Trends. Anim. Biosci. 2024, 37, 719–729. [Google Scholar] [CrossRef] [PubMed]
  2. Ruiz-Colmenero, M.; Costantini, M.; Bàllega, A.; Zoli, M.; Andón, M.; Cerrillo, M.; Fàbrega, E.; Bonmatí, A.; Guarino, M.; Bacenetti, J. Air Treatment Technologies in Pig Farms. Life Cycle Assessment of Dry and Wet Scrubbers in Northern Italy and Northeastern Spain. Sci. Total Environ. 2024, 922, 171197. [Google Scholar] [CrossRef] [PubMed]
  3. Hassouna, M.; Eglin, T.; Cellier, P.; Colomb, V.; Cohan, J.-P.; Decuq, C.; Delabuis, M.; Edouard, N. Measuring Emissions from Livestock Farming: Greenhouse Gases, Ammonia and Nitrogen Oxides; INRA-ADEME: Paris, France, 2016. [Google Scholar]
  4. Guthrie, S.; Giles, S.; Dunkerley, F.; Tabaqchali, H.; Harshfield, A.; Ioppolo, B.; Manville, C. The Impact of Ammonia Emissions from Agriculture on Biodiversity An Evidence Synthesis; RAND Corporation and The Royal Society: Cambridge, UK, 2018. [Google Scholar]
  5. Ma, R.; Li, K.; Guo, Y.; Zhang, B.; Zhao, X.; Linder, S.; Guan, C.H.; Chen, G.; Gan, Y.; Meng, J. Mitigation Potential of Global Ammonia Emissions and Related Health Impacts in the Trade Network. Nat. Commun. 2021, 12, 6308. [Google Scholar] [CrossRef] [PubMed]
  6. Konkol, D.; Popiela, E.; Skrzypczak, D.; Izydorczyk, G.; Mikula, K.; Moustakas, K.; Opaliński, S.; Korczyński, M.; Witek-Krowiak, A.; Chojnacka, K. Recent Innovations in Various Methods of Harmful Gases Conversion and Its Mechanism in Poultry Farms. Environ. Res. 2022, 214, 113825. [Google Scholar] [CrossRef] [PubMed]
  7. Anderson, N.; Strader, R.; Davidson, C. Airborne Reduced Nitrogen: Ammonia Emissions from Agriculture and Other Sources. Environ. Int. 2003, 29, 277–286. [Google Scholar] [CrossRef] [PubMed]
  8. Philippe, F.X.; Cabaraux, J.F.; Nicks, B. Ammonia Emissions from Pig Houses: Influencing Factors and Mitigation Techniques. Agric. Ecosyst. Environ. 2011, 141, 245–260. [Google Scholar] [CrossRef]
  9. Vogel, G.J.; Kayser, W.C.; Savides, M.C.; Edmonds, M.; Van Engen, N.; Edwards, T.M.; Allen, J.B.; Rincker, P.J.; Lawrence, T.E.; McKeith, F.K.; et al. Effects of Lubabegron Removal on Tissue Concentration, Calculated Ammonia Gas Emissions, Live Performance, and Carcass Characteristics of Beef Steers. Appl. Anim. Sci. 2023, 39, 484–493. [Google Scholar] [CrossRef]
  10. Ossowski, M.; Wlazło, Ł.; Bis-Wencel, H.; Krzaczek, P.; Nowakowicz-Dębek, B. The Use of Natural Sorbents in the Diet of Pigs as a Method for Reducing Gaseous Pollutants and Manure Nutrients from Livestock Housing. Przem. Chem. 2022, 1, 39–45. [Google Scholar] [CrossRef]
  11. Le Dinh, P.; van der Peet-Schwering, C.M.C.; Ogink, N.W.M.; Aarnink, A.J.A. Effect of Diet Composition on Excreta Composition and Ammonia Emissions from Growing-Finishing Pigs. Animals 2022, 12, 229. [Google Scholar] [CrossRef] [PubMed]
  12. Rong, L. Effect of Partial Pit Exhaust Ventilation System on Ammonia Removal Ratio and Mass Transfer Coefficients from Different Emission Sources in Pig Houses. Energy Built Environ. 2020, 1, 343–350. [Google Scholar] [CrossRef]
  13. Soto-Herranz, M.; Sánchez-Báscones, M.; Antolín-Rodríguez, J.M.; Martín-Ramos, P. Pilot Plant for the Capture of Ammonia from the Atmosphere of Pig and Poultry Farms Using Gas-Permeable Membrane Technology. Membranes 2021, 11, 859. [Google Scholar] [CrossRef] [PubMed]
  14. Zhan, G.; Cao, F.; Bai, L.; Chang, F.; Zhou, B.; Duan, Y.; Zeng, S.; Dong, H.; Li, Z.; Zhang, X. Process Simulation and Optimization of Ammonia-Containing Gas Separation and Ammonia Recovery with Ionic Liquids. ACS Sustain. Chem. Eng. 2021, 9, 312–325. [Google Scholar] [CrossRef]
  15. Chmielarz, L.; Jabłońska, M. Advances in Selective Catalytic Oxidation of Ammonia to Dinitrogen: A Review. RSC Adv. 2015, 5, 43408–43431. [Google Scholar] [CrossRef]
  16. Shang, B.; Zhou, T.; Tao, X.; Chen, Y. Greenhouse Gas Emissions From Biofilters for Composting Exhaust Ammonia Removal. Front. Bioeng. Biotechnol. 2022, 10, 918365. [Google Scholar] [CrossRef] [PubMed]
  17. Niu, L.; Baig, Z.T.; Yeung, M.; Soomro, A.F.; Lu, L.; Xi, J. Low-Concentration Organics Mitigate the Inhibition of Free Nitrous Acid on Nitrification in Biofilters for Gaseous Ammonia Removal. Chem. Eng. J. 2023, 476, 146757. [Google Scholar] [CrossRef]
  18. Kobayashi, H.; Hayakawa, A.; Somarathne, K.D.K.A.; Okafor, E.C. Science and Technology of Ammonia Combustion. Proc. Combust. Inst. 2019, 37, 109–133. [Google Scholar] [CrossRef]
  19. Rolewicz-Kalińska, A.; Lelicińska-Serafin, K.; Manczarski, P. Volatile Organic Compounds, Ammonia and Hydrogen Sulphide Removal Using a Two-Stage Membrane Biofiltration Process. Chem. Eng. Res. Des. 2021, 165, 69–80. [Google Scholar] [CrossRef]
  20. Chen, Q.; Yang, D.; Chen, X.; Wang, X.; Dong, B.; Dai, X. Vacuum Ammonia Stripping from Liquid Digestate: Effects of PH, Alkalinity, Temperature, Negative Pressure and Process Optimization. J. Environ. Sci. 2025, 149, 638–650. [Google Scholar] [CrossRef]
  21. Jeong, M.; Zhao, S.; Ji, Y.; Khan, S.A.; Saqlain, S.; Kim, Y.D. Efficacious Removal of Benzene and Ammonia Gases over Visible Light Irradiated Activated Carbon. Appl. Surf. Sci. 2023, 613, 156012. [Google Scholar] [CrossRef]
  22. Johnson, K.I.; Borges, W.; Sharma, P.R.; Sharma, S.K.; Chang, H.Y.; Abou-Krisha, M.M.; Alhamzani, A.G.; Hsiao, B.S. Cellulose Sulfate Nanofibers for Enhanced Ammonium Removal. Nanomaterials 2024, 14, 507. [Google Scholar] [CrossRef] [PubMed]
  23. Khurshid, F.; Jeyavelan, M.; Hussain, T.; Hudson, M.S.L.; Nagarajan, S. Ammonia Gas Adsorption Study on Graphene Oxide Based Sensing Device under Different Humidity Conditions. Mater. Chem. Phys. 2020, 242, 122485. [Google Scholar] [CrossRef]
  24. Sha, Y.; Liu, J.; Yu, J.; Xu, S.; Yan, W.; Li, Z.; Shahbaz, M. Effect of Graphene Oxide on the Ammonia Removal and Bacterial Community in a Simulated Wastewater Treatment Process. J. Environ. Eng. 2020, 146, 04020097. [Google Scholar] [CrossRef]
  25. Li, C.; Liu, B.; Fang, D.; Zhang, P.; Li, F.; Qiu, X.; Mo, X.; Li, K. Polyaniline-Derived Mesoporous Carbon Electrode for Selective and Efficient Ammonium Removal with in a Flow-Electrode Capacitive Deionization System. J. Environ. Chem. Eng. 2023, 11, 110857. [Google Scholar] [CrossRef]
  26. Li, J.F.; Li, Z.M.; Xu, J.B.; Guo, C.Y.; Fang, G.W.; Zhou, Y.; Sun, M.S.; Tao, D.J. Demethylation of Waste Alkali Lignin for Rapid and Efficient Ammonia Adsorption. Ind. Eng. Chem. Res. 2024, 63, 3282–3289. [Google Scholar] [CrossRef]
  27. Krounbi, L.; Enders, A.; Anderton, C.R.; Engelhard, M.H.; Hestrin, R.; Torres-Rojas, D.; Dynes, J.J.; Lehmann, J. Sequential Ammonia and Carbon Dioxide Adsorption on Pyrolyzed Biomass to Recover Waste Stream Nutrients. ACS Sustain. Chem. Eng. 2020, 8, 7121–7131. [Google Scholar] [CrossRef]
  28. Tokushige, M.; Ryu, J. Adsorption and Desorption Behaviors of Ammonia on Zeolites at 473 K by the Pressure-Swing Method. ACS Omega 2023, 8, 32536–32543. [Google Scholar] [CrossRef] [PubMed]
  29. Vo, H.T.; Kim, J.; Kim, N.Y.; Lee, J.K.; Joo, J.B. Effect of Pore Texture Property of Mesoporous Alumina on Adsorption Performance of Ammonia Gas. J. Ind. Eng. Chem. 2020, 91, 129–138. [Google Scholar] [CrossRef]
  30. Rezaei, E.; Schlageter, B.; Nemati, M.; Predicala, B. Evaluation of Metal Oxide Nanoparticles for Adsorption of Gas Phase Ammonia. J. Environ. Chem. Eng. 2017, 5, 422–431. [Google Scholar] [CrossRef]
  31. Zong, K.; Li, K.; Zhou, Z.; Gong, L.; Deng, D. Highly Efficient and Reversible Adsorption of Ammonia by Incorporation of Deep Eutectic Solvents into Silica Gel and Al2O3. New J. Chem. 2022, 46, 15959–15966. [Google Scholar] [CrossRef]
  32. Zeng, S.; Wang, J.; Li, P.; Dong, H.; Wang, H.; Zhang, X.; Zhang, X. Efficient Adsorption of Ammonia by Incorporation of Metal Ionic Liquids into Silica Gels as Mesoporous Composites. Chem. Eng. J. 2019, 370, 81–88. [Google Scholar] [CrossRef]
  33. Jung, D.; Chen, Z.; Alayoglu, S.; Mian, M.R.; Goetjen, T.A.; Idrees, K.B.; Kirlikovali, K.O.; Islamoglu, T.; Farha, O.K. Postsynthetically Modified Polymers of Intrinsic Microporosity (PIMs) for Capturing Toxic Gases. ACS Appl. Mater. Interfaces 2021, 13, 10409–10415. [Google Scholar] [CrossRef] [PubMed]
  34. Wang, Z.; Li, Z.; Wang, H.; Zhao, Y.; Xia, Q.; Qiu, J.; Wang, J. Regulating the Pore Microenvironment of Microporous Metal-Organic Frameworks for Efficient Adsorption of Low-Concentration Ammonia. ACS Sustain. Chem. Eng. 2022, 10, 10945–10954. [Google Scholar] [CrossRef]
  35. Takahashi, A.; Tanaka, H.; Parajuli, D.; Nakamura, T.; Minami, K.; Sugiyama, Y.; Hakuta, Y.; Ohkoshi, S.I.; Kawamoto, T. Historical Pigment Exhibiting Ammonia Gas Capture beyond Standard Adsorbents with Adsorption Sites of Two Kinds. J. Am. Chem. Soc. 2016, 138, 6376–6379. [Google Scholar] [CrossRef] [PubMed]
  36. Usuda, H.; Watanabe, T.; Ishikawa, T.; Nakashima, N.; Noda, K.; Takahashi, A.; Kawamoto, T.; Minami, K. Ammonia Concentrator for Repeatable Adsorption/Desorption Using Nickel Hexacyanoferrate as Adsorbent and Production of Solid Ammonium Bicarbonate. ACS Sustain. Chem. Eng. 2024, 12, 2183–2190. [Google Scholar] [CrossRef]
  37. Wang, M.; Xie, R.; Chen, Y.; Pu, X.; Jiang, W.; Yao, L. A Novel Mesoporous Zeolite-Activated Carbon Composite as an Effective Adsorbent for Removal of Ammonia-Nitrogen and Methylene Blue from Aqueous Solution. Bioresour. Technol. 2018, 268, 726–732. [Google Scholar] [CrossRef] [PubMed]
  38. McHugh, L.N.; Terracina, A.; Wheatley, P.S.; Buscarino, G.; Smith, M.W.; Morris, R.E. Metal–Organic Framework-Activated Carbon Composite Materials for the Removal of Ammonia from Contaminated Airstreams. Angew. Chemie—Int. Ed. 2019, 58, 11747–11751. [Google Scholar] [CrossRef] [PubMed]
  39. Rezaei, E.; Azar, R.; Nemati, M.; Predicala, B. Gas Phase Adsorption of Ammonia Using Nano TiO2-Activated Carbon Composites—Effect of TiO2 Loading and Composite Characterization. J. Environ. Chem. Eng. 2017, 5, 5902–5911. [Google Scholar] [CrossRef]
  40. Nazir, M.A.; Javed, M.S.; Islam, M.; Assiri, M.A.; Hassan, A.M.; Jamshaid, M.; Najam, T.; Shah, S.S.A.; ur Rehman, A. MOF@graphene Nanocomposites for Energy and Environment Applications. Compos. Commun. 2024, 45, 101783. [Google Scholar] [CrossRef]
  41. Mousavi, S.V.; Ahranjani, P.J.; Saei, S.F.; Mehrdadi, N.; Bidhendi, G.N.; Jume, B.H.; Rezania, S.; Mojiri, A. Ammonia Removal from Industrial Effluent Using Zirconium Oxide and Graphene-Oxide Nanocomposites. Chemosphere 2022, 297, 134008. [Google Scholar] [CrossRef] [PubMed]
  42. Eljamal, O.; Eljamal, R.; Maamoun, I.; Khalil, A.M.E.; Shubair, T.; Falyouna, O.; Sugihara, Y. Efficient Treatment of Ammonia-Nitrogen Contaminated Waters by Nano Zero-Valent Iron/Zeolite Composite. Chemosphere 2022, 287, 131990. [Google Scholar] [CrossRef] [PubMed]
  43. Saleh, T.A. A Review on the Technologies for Converting Biomass into Carbon-Based Materials: Sustainability and Economy. Bioresour. Technol. Rep. 2024, 25, 101771. [Google Scholar] [CrossRef]
  44. Fan, Q.; Song, C.; Fu, P. Advances in the Improvement of the Quality and Efficiency of Biomass-Derived Porous Carbon: A Comprehensive Review on Synthesis Strategies and Heteroatom Doping Effects. J. Clean. Prod. 2024, 452, 142169. [Google Scholar] [CrossRef]
  45. Wang, X.; Cheng, H.; Ye, G.; Fan, J.; Yao, F.; Wang, Y.; Jiao, Y.; Zhu, W.; Huang, H.; Ye, D. Key Factors and Primary Modification Methods of Activated Carbon and Their Application in Adsorption of Carbon-Based Gases: A Review. Chemosphere 2022, 287, 131995. [Google Scholar] [CrossRef] [PubMed]
  46. Heidarinejad, Z.; Dehghani, M.H.; Heidari, M.; Javedan, G.; Ali, I.; Sillanpää, M. Methods for Preparation and Activation of Activated Carbon: A Review. Environ. Chem. Lett. 2020, 18, 393–415. [Google Scholar] [CrossRef]
  47. Gopalan, J.; Buthiyappan, A.; Raman, A.A.A. Insight into Metal-Impregnated Biomass Based Activated Carbon for Enhanced Carbon Dioxide Adsorption: A Review. J. Ind. Eng. Chem. 2022, 113, 72–95. [Google Scholar] [CrossRef]
  48. Hamid, Y.; Tang, L.; Hussain, B.; Usman, M.; Lin, Q.; Rashid, M.S.; He, Z.; Yang, X. Organic Soil Additives for the Remediation of Cadmium Contaminated Soils and Their Impact on the Soil-Plant System: A Review. Sci. Total Environ. 2020, 707, 136121. [Google Scholar] [CrossRef] [PubMed]
  49. Wang, X.; Ding, J.; Han, L.; Tan, J.; Ge, X.; Nan, Q. Biochar Addition Reduces Salinity in Salt-Affected Soils with No Impact on Soil PH: A Meta-Analysis. Geoderma 2024, 443, 116845. [Google Scholar] [CrossRef]
  50. Lo, S.L.Y.; How, B.S.; Leong, W.D.; Teng, S.Y.; Rhamdhani, M.A.; Sunarso, J. Techno-Economic Analysis for Biomass Supply Chain: A State-of-the-Art Review. Renew. Sustain. Energy Rev. 2021, 135, 110164. [Google Scholar] [CrossRef]
  51. Ng, C.; Marshall, W.E.; Rao, R.M.; Bansode, R.R.; Losso, J.N. Activated Carbon from Pecan Shell: Process Description and Economic Analysis. Ind. Crops Prod. 2003, 17, 209–217. [Google Scholar] [CrossRef]
  52. Wlazło, Ł.; Kwiecień, M.; Bis-Wencel, H.; Łopuszyński, W.; Buszewicz, G.; Karpińska, K.; Rodzyń, I.; Kasela, M.; Sobczak, P.; Nowakowicz-Dębek, B. Assessment of Health Safety of Pigs Taking Natural Sorbents with Feed. BMC Vet. Res. 2023, 19, 3. [Google Scholar] [CrossRef] [PubMed]
  53. Postawa, K.; Szczygieł, J.; Kułażyński, M. Heuristic Methods in Optimization of Selected Parameters of Two-Phase Anaerobic Digestion (TPAD) Model. Fuel 2020, 281, 118257. [Google Scholar] [CrossRef]
  54. Postawa, K.; Szczygieł, J.; Wrzesińska-Jędrusiak, E.; Klimek, K.; Kułażyński, M. The Pump-Mixed Anaerobic Digestion of Pig Slurry: New Technology and Mathematical Modeling. Waste Manag. 2021, 123, 111–119. [Google Scholar] [CrossRef] [PubMed]
  55. Pstrowska, K.; Kaczmarczyk, J.; Czapor-Irzabek, H.; Kułażyński, M. Characterization of Activated Beech Wood Char—Methane Storage Application. Stud. Univ. Babeș-Bolyai Chem. 2018, 63, 21–39. [Google Scholar] [CrossRef]
  56. Fałtynowicz, H.; Kaczmarczyk, J.; Kułażyński, M. Preparation and Characterization of Activated Carbons from Biomass Material—Giant Knotweed (Reynoutria Sachalinensis). Open Chem. 2015, 13, 1150–1156. [Google Scholar] [CrossRef]
  57. PN-ISO 1171:2002; Paliwa Stałe—Oznaczanie Popiołu. Polish Committee for Standardization: Warsaw, Poland, 2002.
  58. PN-G-04511:1980; Paliwa Stałe—Oznaczanie Zawartości Wilgoci. Polish Committee for Standardization: Warsaw, Poland, 1980.
  59. PN-G-04516:1988; Paliwa Stałe—Oznaczanie Zawartości Części Lotnych Metodą Wagową. Polish Committee for Standardization: Warsaw, Poland, 1998.
  60. PN-C-04375-2:2013–07; Badanie Paliw Stałych i Ciekłych—Oznaczanie Ciepła Spalania w Bombie Kalorymetrycznej i Obliczanie Wartości Opałowej—Część 2: Metoda z Zastosowaniem Kalorymetru Izoperibolicznego lub Kalorymetru z Płaszczem Statycznym. Polish Committee for Standardization: Warsaw, Poland, 2013.
  61. Veza, I.; Spraggon, M.; Fattah, I.M.R.; Idris, M. Response Surface Methodology (RSM) for Optimizing Engine Performance and Emissions Fueled with Biofuel: Review of RSM for Sustainability Energy Transition. Results Eng. 2023, 18, 101213. [Google Scholar] [CrossRef]
  62. Pereira, L.M.S.; Milan, T.M.; Tapia-Blácido, D.R. Using Response Surface Methodology (RSM) to Optimize 2G Bioethanol Production: A Review. Biomass Bioenergy 2021, 151, 106166. [Google Scholar] [CrossRef]
  63. Aziz, S.H. Polynomial Interpolation in Matlab. J. Eng. Sci. Res. 2018, 2, 12–19. [Google Scholar] [CrossRef]
  64. Goldberg, D.E. Genetic Algorithms in Search, Optimization and Machine Learning, 1st ed.; Addison-Wesley Longman Publishing Co., Inc.: Boston, MA, USA, 1989; ISBN 978-0-201-15767-3. [Google Scholar]
  65. Katoch, S.; Chauhan, S.S.; Kumar, V. A Review on Genetic Algorithm: Past, Present, and Future. Multimed. Tools Appl. 2021, 80, 8091–8126. [Google Scholar] [CrossRef] [PubMed]
  66. Hasnain, M.F.U.; Ali, H.O.; Aziz, S.; Kouotou, P.M.; Waqas, M.; Naqvi, S.M.A.; Athar, M.H.; Ammar, M.; Shah, I.; Jung, D.W. Optimization and Techno-Economic Analysis of Catalytic Gasification of Wheat Straw Biomass Using ASPEN PLUS Model. Arab. J. Chem. 2024, 17, 105821. [Google Scholar] [CrossRef]
  67. Liu, L.; Qian, H.; Mu, L.; Wu, J.; Feng, X.; Lu, X.; Zhu, J. Techno-Economic Analysis of Biomass Processing with Dual Outputs of Energy and Activated Carbon. Bioresour. Technol. 2021, 319, 124108. [Google Scholar] [CrossRef] [PubMed]
  68. Wang, L.; Khalil, R.A.; Bakken, J.; Skreiberg, Ø. Production and Characterization of Biocarbon from Woody Biomasses Produced at 1000 °C. Fuel 2024, 370, 131667. [Google Scholar] [CrossRef]
  69. Obernberger, I.; Thek, G. Physical Characterisation and Chemical Composition of Densified Biomass Fuels with Regard to Their Combustion Behaviour. Biomass Bioenergy 2004, 27, 653–669. [Google Scholar] [CrossRef]
  70. Ferraro, G.; Pecori, G.; Rosi, L.; Bettucci, L.; Fratini, E.; Casini, D.; Rizzo, A.M.; Chiaramonti, D. Biochar from Lab-Scale Pyrolysis: Influence of Feedstock and Operational Temperature. Biomass Convers. Biorefinery 2024, 14, 5901–5911. [Google Scholar] [CrossRef]
  71. Zhou, H.; Long, Y.; Meng, A.; Chen, S.; Li, Q.; Zhang, Y. A Novel Method for Kinetics Analysis of Pyrolysis of Hemicellulose, Cellulose, and Lignin in TGA and Macro-TGA. RSC Adv. 2015, 5, 26509–26516. [Google Scholar] [CrossRef]
  72. Postawa, K.; Fałtynowicz, H.; Szczygieł, J.; Beran, E.; Kułażyński, M. Analyzing the Kinetics of Waste Plant Biomass Pyrolysis via Thermogravimetry Modeling and Semi-Statistical Methods. Bioresour. Technol. 2022, 344, 126181. [Google Scholar] [CrossRef] [PubMed]
  73. Bolan, N.; Hoang, S.A.; Beiyuan, J.; Gupta, S.; Hou, D.; Karakoti, A.; Joseph, S.; Jung, S.; Kim, K.H.; Kirkham, M.B.; et al. Multifunctional Applications of Biochar beyond Carbon Storage. Int. Mater. Rev. 2022, 67, 150–200. [Google Scholar] [CrossRef]
  74. Cardenas, C.; Sigot, L.; Vallières, C.; Marsteau, S.; Marchal, M.; Latifi, A.M. Ammonia Capture by Adsorption on Doped and Undoped Activated Carbon: Isotherm and Breakthrough Curve Measurements. Sep. Purif. Technol. 2023, 313, 123454. [Google Scholar] [CrossRef]
  75. Corre, Y.; Seredych, M.; Bandosz, T.J. Analysis of the Chemical and Physical Factors Affecting Reactive Adsorption of Ammonia on Graphene/Nanoporous Carbon Composites. Carbon 2013, 55, 176–184. [Google Scholar] [CrossRef]
  76. Molina-Sabio, M.; González, M.T.; Rodriguez-Reinoso, F.; Sepúlveda-Escribano, A. Effect of Steam and Carbon Dioxide Activation in the Micropore Size Distribution of Activated Carbon. Carbon 1996, 34, 505–509. [Google Scholar] [CrossRef]
  77. Mochizuki, T.; Kubota, M.; Matsuda, H.; D’Elia Camacho, L.F. Adsorption Behaviors of Ammonia and Hydrogen Sulfide on Activated Carbon Prepared from Petroleum Coke by KOH Chemical Activation. Fuel Process. Technol. 2016, 144, 164–169. [Google Scholar] [CrossRef]
  78. Bandosz, T.J.; Petit, C. On the Reactive Adsorption of Ammonia on Activated Carbons Modified by Impregnation with Inorganic Compounds. J. Colloid Interface Sci. 2009, 338, 329–345. [Google Scholar] [CrossRef] [PubMed]
  79. Stavropoulos, G.G.; Zabaniotou, A.A. Minimizing Activated Carbons Production Cost. Fuel Process. Technol. 2009, 90, 952–957. [Google Scholar] [CrossRef]
  80. León, M.; Silva, J.; Carrasco, S.; Barrientos, N. Design, Cost Estimation and Sensitivity Analysis for a Production Process of Activated Carbon from Waste Nutshells by Physical Activation. Processes 2020, 8, 945. [Google Scholar] [CrossRef]
  81. Qajar, A.; Peer, M.; Andalibi, M.R.; Rajagopalan, R.; Foley, H.C. Enhanced Ammonia Adsorption on Functionalized Nanoporous Carbons. Microporous Mesoporous Mater. 2015, 218, 15–23. [Google Scholar] [CrossRef]
Figure 1. Simplified flowchart of the activated carbon preparation model. R1—yield reactor; R2—Gibbs reactor; S1—separator; F—furnace; H1, H2, H3—heat exchangers; AC—activated carbon.
Sustainability 16 06122 g001
Figure 2. Characterization of the raw materials: (a) TG (solid lines) and DTG curves (dashed lines) and (b) pore size distribution of raw materials (PO, KC, and W) and low-temperature char PO500.
Sustainability 16 06122 g002
Figure 3. Yield (analytical) of (a) chars, (b) W-based activated carbons (KOH activation), and (c) PO-based activated carbons (KOH activation).
Sustainability 16 06122 g003
Figure 4. Porous structure parameters of chars and ACs from steam and CO2 activation: (a) BET surface area, (b) total pore volume, and (c) micropore volume.
Sustainability 16 06122 g004
Figure 5. Porous structure of the activated carbons (SBET and Vtot)—surface plots and experimental points.
Sustainability 16 06122 g005
Figure 6. Summary of the optima localization: (A) ammonia sorption parameters and (B) porous structure parameters.
Sustainability 16 06122 g006
Figure 7. Ammonia sorption (a,b) capacity and (c,d) reversibility on (a,c) raw materials and commercial AC (BA_NH4), and (b,d) prepared chars and ACs from physical activation.
Sustainability 16 06122 g007
Figure 8. Ammonia capacity, desorption residue, and sorption reversibility surface plots and experimental points.
Sustainability 16 06122 g008
Figure 9. Correlation of ammonia sorption capacity and reversibility with porous structure parameters for raw materials, chars, and prepared activated carbons.
Sustainability 16 06122 g009
Table 1. Characteristics of BA_NH4 activated carbon.
ParameterUnitBA_NH4
Iodine number *mg/g1000
Acid concentration%~10
pH-1.5
Bulk densityg/L530 ± 30
Particle sizemm4
Moisture (Ma)wt.%max. 10
* Before impregnation with acid.
Table 2. Heat of combustion (Qc) and proximate analysis of raw materials and PO500 (M—moisture, A—ash, V—volatile matter, Fc—fixed carbon).
SampleM a (wt.%)A a (wt.%)A d (wt.%)V a (wt.%)V daf (wt.%)Fc a (wt.%)Qc (MJ/kg)
PO6.430.220.2379.0984.7214.2620.04
PO5002.370.830.8525.3226.1671.49-
KC9.879.8710.963.664.5776.6027.45
W3.237.748.004.104.6184.9329.52
a Analytical; d dry basis; daf dry-ash-free basis.
Table 3. Ultimate analysis of raw materials and PO500.
SampleC daf (wt.%)H daf (wt.%)N daf (wt.%) S daf (wt.%)O daf (wt.%) *H/CO/C
PO51.125.970.030.0642.820.1170.838
PO50084.783.70.13011.390.0440.134
W95.950.410.6203.020.0040.032
daf Dry-ash-free basis; * calculated by difference.
Table 4. Porous texture parameters of raw materials and PO500.
SampleSBET (m2/g)Vtot (cm3/g)Vmic (cm3/g)Vmic (%)Vmes (cm3/g)d (nm)
PO70.0410.02765.90.0147.00
PO500290.1100.10494.80.0063.71
KC3560.1740.15387.90.0214.39
W660.1640.15192.10.0134.73
Table 5. Reactivity and time of steam and CO2 activation (50% burn-off).
  Steam  
 WKC
Temperature (°C)t (min)R daf (g/(g·h))t (min)R daf (g/(g·h))
7501950.1545600.054
800770.3902000.150
850350.857900.333
900251.200470.638
  CO2  
 PO500KC
7504100.073- *- *
8001330.2268850.034
850470.6384020.075
900360.833980.306
daf Dry-ash-free basis; * activation was not performed since the expected activation time on the basis of KC activation at higher temperatures would be unreasonably long.
Table 6. Summary of surface plot function accuracy (R2adj).
 AdsorptionDesorptionReversibility of SorptionVtotSBET
KC0.9930.9080.9420.9950.996
W0.9850.8200.7430.9780.986
PO0.8940.6080.8240.9300.875
Table 7. ANOVA n-way analysis of variance results for temperature (X1) and KOH-to-char ratio (X2).
 KCWPO
 F-Valuep-ValueF-Valuep-ValueF-Value *p-Value *
Adsorption (X1)8.990.01578.050.020077.020.0835
Adsorption (X2)15.990.00290.740.5644132.440.0638
Desorption (X1)7.710.022041.010.000314.750.1886
Desorption (X2)0.320.81001.280.36218.980.2394
Reversibility (X1)6.520.03136.740.029219.570.1643
Reversibility (X2)11.180.00721.680.268738.960.1171
Vtot (X1)32.410.00061.150.378566.810.0896
Vtot (X2)534.930.000019.660.001793.770.0757
SBET (X1)42.890.00031.520.292624.900.1460
SBET (X2)652.740.000015.450.003286.590.0788
* Results for PO were supported with a single modeled data point to fulfill minimal requirements for ANOVA.
Table 8. Optimum preparation conditions of ACs with respect to the porous structure of obtained sorbents and their ammonia capacity and sorption reversibility.
 T
(°C)
KOH
(-)
Vtot
(cm3/g)
SBET
(m2/g)
KC9004.000.7741598
W7744.000.8141478
PO9003.621.2012454
 T
(°C)
KOH
(-)
Adsorption
(g/kg)
Desorption residue (g/kg)
KC7004.00166.211.3
W7253.40158.415.6
PO6003.03396.950.9
Table 9. Prices of energy, raw materials, and products used in this study (Poland, May 2024).
Economic QuantityPriceUnit
Energy from NG * combustion0.057EUR/kWh
Water1.92EUR/m3
Carbon dioxide0.70EUR/kg
Sawdust pellet (PO)0.04EUR/kg
Activated carbon (BA_NH4)4.18EUR/kg
* NG—natural gas.
Table 10. The cost and amount of excess thermal energy for sorbents obtained by steam and carbon dioxide activation at different temperatures.
Temperature (°C)750800850900
 Cost (EUR/kg)ETE (kW/kg)Cost (EUR/kg)ETE (kW/kg)Cost (EUR/kg)ETE (kW/kg)Cost (EUR/kg)ETE (kW/kg)
H2O
W0.223.920.244.090.253.960.263.86
PO0.262.840.272.640.282.460.292.29
CO2
W2.172.36 2.523.582.724.192.734.11
PO2.433.102.442.912.452.732.462.55
ETE—excess thermal energy.
Disclaimer/Publisher’s Note: The statements, opinions and data contained in all publications are solely those of the individual author(s) and contributor(s) and not of MDPI and/or the editor(s). MDPI and/or the editor(s) disclaim responsibility for any injury to people or property resulting from any ideas, methods, instructions or products referred to in the content.

