Abstract
Cosmetics are a staple in daily beauty routines worldwide, embraced for their role in enhancing personal appearance and self-care. However, their direct application exposes the skin to a range of ingredients, including metal(loid)s, and these can have a hazardous impact on human health if they exceed the limits defined by regulatory agencies. As a result, it is important to evaluate metal(loid) levels to ensure the safety of these cosmetic products. This research aimed to analyze several cosmetic products (massage cream, cleaner, mud mask, skin polish, scrub, lipstick, foundation, lotion, face powder, and highlighter) for metalloids (Al, Cr, Mn, Fe, Co, Ni, Cu, Zn, Sr, As, Sb, Cd, Pb, Bi, and Hg) by using inductively coupled plasma-optical emission spectrometry (ICP-OES). Multivariate and bivariate statistical approaches were used to interpret the sources and association between the metal(loid)s. The concentration ranges of metals were found to be Al (1.18–4.15 mg/kg), Cr (0.13–2.19 mg/kg), Mn (1.89–28.77 mg/kg), Fe (4.09–126.02 mg/kg), Co (0.19–31.62 mg/kg), Ni (0.11–5.39 mg/kg), Cu (0.08–0.19 mg/kg), Zn (1.99–47.81 mg/kg), Sr (0.99–10.34 mg/kg), Cd (0.16–1.50 mg/kg), Pb (0.29–2.44 mg/kg), Bi (0.23–2.18 mg/kg), and Hg (0.012–0.42 mg/kg), whereas the concentration ranges of metalloids were found to be As (0.011–0.051 mg/kg) and Sb (0.042–1.66 mg/kg). Among the tested cosmetic products for the metal(loid) levels, the estimation of the margin of safety (MOS < 100), hazard quotient (HQ > 1), hazard index (HI > 1), and cumulative cancer risk (LCR ≤ 1 × 10⁻³) indicated non-carcinogenic and carcinogenic health risks associated with the use of few products. Most of the cosmetics products under investigation are safe with respect to non-carcinogenic and carcinogenic health risks. By highlighting the need to limit excessive use and adhering to sustainable safety practices, this study underscores the importance of monitoring and regulating metal(loid) content to ensure consumer safety and mitigate environmental impact.
1. Introduction
Since ancient times, cosmetics have been a standard part of personal care for all social classes, not just the elite. The global cosmetics market has consistently grown over the past decades, driven by the pursuit of personal beauty [1,2,3]. Individuals, particularly women, need to become more glamorous, and this increases the demand for cosmetics, due to their frequent use on a daily basis [4]. There is a broad range of cosmetics available, including creams, lotions, shampoos, perfumes, and various personal hygiene, skin, and hair care products from different brands [5]. Both organic and inorganic additives are commonly used in these products. Cosmetic additives, such as fragrances, preservatives, stabilizers, surfactants, dyes, and shimmers, enhance their quality, properties, and shelf life [6]. Numerous other raw materials such as plant-based oils, honey, and plant extracts may be used to make cosmetics. These synthetic and natural materials contain metals (Al, Cr, Mn, Fe, Co, Ni, Cu, Zn, Sr, Cd, Pb, Bi, and Hg) and metalloids (As and Sb). Even in trace concentrations, these metal(loid)s can have a variety of harmful and unfavorable impacts on health. Chronic metal toxicity happens when a person is exposed to low levels of toxic metals over a long period. Cosmetic companies are not mandated to report such impurities. Because hazardous metals and metalloids are non-degradable, they can biologically accumulate in various tissues, including the liver, kidneys, bones, and brain [7]. Although the skin acts as a protective barrier, metals can still penetrate areas like the face, lips, or eyes, causing local or systemic effects [8]. The prolonged use of cosmetics can lead to the accumulation of potentially toxic metal(loid)s in the body, either through adsorption or absorption through the skin, eventually entering the bloodstream. Various exposure scenarios exist with cosmetics: some are washed off shortly after application, like shampoos and toothpaste, while others, such as body lotions, facial masks, and lipsticks, remain on the skin for extended periods [9]. Body lotions, covering large surface areas, pose a higher risk of exposure, and cosmetics used around the eyes can contact the conjunctiva or mucosa due to the thin epithelial lining. Lipsticks also carry a higher risk of direct oral ingestion [10]. Due to these potentially toxic effects, some countries have imposed legislative restrictions on metal content in cosmetics. The US FDA regulates mercury levels in cosmetics and specifies limits for Pb, As, and Hg in most color additives. Similarly, Health Canada has proposed draft guidelines addressing the impurities of metals such as Pb, As, Cd, Hg, and Sb in cosmetics [11]. In China, the Hygienic Standard for Cosmetics sets regulations on the heavy metal content in these products [12]. Consequently, it is essential to monitor the levels of metal(loid)s in cosmetics.
Due to their low concentrations, trace metal(loid)s might be difficult to quantify. Employing highly sensitive and precise analytical techniques ensures reliable data. Atomic spectroscopy methods, including atomic absorption spectroscopy (AAS), utilize different ionization sources to detect metal concentrations. For example, flame atomic absorption spectroscopy (FAAS) uses a flame to atomize the sample, while electrothermal atomic absorption spectroscopy (ET-AAS) employs a graphite furnace for the same purpose. These techniques can measure metal concentrations in the range of parts per million (ppm) to parts per billion (ppb). For detecting metals at even lower concentrations, known as ultratrace levels, inductively coupled plasma spectroscopy (ICP) techniques are employed. ICP with optical emission (ICP-OES) and ICP with mass spectrometry (ICP-MS) are particularly effective. ICP-OES uses the light emitted by excited atoms and ions in the plasma to determine metal concentrations, while ICP-MS measures the mass-to-charge ratio of ions, allowing for the precise quantification of metals at extremely low levels. These advanced techniques are crucial for accurately analyzing the metal content in samples, especially when dealing with trace or ultratrace amounts [13,14]. However, these analytical techniques typically necessitate converting samples into aqueous solutions, requiring initial sample preparation to ensure the metals are in a form suitable for analysis [15]. The two primary methods for this preparation are dry ashing and acid digestion. Acid digestion is particularly advantageous because it effectively breaks down both organic and inorganic materials, making it possible to degrade the sample matrix [16]. For this process, HNO3 is commonly used, often in combination with H2O2. This combination acts as a universal reagent capable of decomposing both organic and inorganic substances [17,18,19].
Understanding the origin and distribution of metal(loid)s in cosmetics is crucial, particularly when using advanced statistical methods like principal component analysis (PCA), hierarchical cluster analysis (HCA), and Pearson correlation coefficient (PCC). This study aims to enhance our knowledge of cosmetic quality and contamination levels. Assessing the concentrations of these metal(loid)s is crucial for ensuring consumer safety and aligns with sustainable practices by minimizing potential health risks and environmental contamination. This research underscores the importance of sustainable safety evaluations to protect human health and promote eco-friendly cosmetics manufacturing. The research objectives are (i) assessing the levels of metal(loid)s such as Al, Cr, Mn, Fe, Co, Ni, Cu, Zn, Sr, As, Sb, Cd, Pb, Bi, and Hg in various cosmetics (massage cream, cleanser, mud mask, skin polish, scrub, lipstick, foundation, lotion, face powder, and highlighter); (ii) determining the margin of safety (MoS) and systemic exposure dosage (SED) for these metal(loid)s; (iii) applying risk assessment models to evaluate potential health risks, including the hazard quotient (HQ), hazard index (HI), and lifetime cancer risk (LCR); and (iv) using multivariate and bivariate statistical analyses (PCA, HCA, and PCC) to understand potential sources of metal(loid) contamination.
2. Materials and Methods
2.1. Reagents and Standards
Reagent grade 65% m/m nitric acid (HNO3, Sigma Aldrich, St. Louis, MI, USA), 30% v/v hydrogen peroxide (H2O2, Sigma Aldrich, St. Louis, MI, USA), and certified multielement reference standard (1000 mg/L, Merck, Darmstadt, Germany) were purchased from a local vendor (Falcon Chemicals) in Lahore, Pakistan. A GenPure water system (Thermo Scientific, Waltham, MA, USA) was employed for 18 MΩ.cm quality water production, which was utilized throughout the experiments for blank, reference, standard, and sample dilutions. All the glassware was of ISO Class A and soaked overnight in HNO3 (20% v/v) to minimize contamination. San Joaquin’s soil (Soil Standard Reference Materials for Element Content, NIST SRM 2709a, Gaithersburg, MD, USA) was used as a reference standard for quality control purposes.
2.2. Collection of Samples and Their Preparation
Ten different cosmetic products, including massage cream, cleaner, mud mask, skin polish, scrub, lipstick, foundation, lotion, face powder, and highlighter, of different brands, were purchased from the local market in Lahore, Pakistan. Ten brands of each product were collected (10 brands × 10 products). Each product comprised three samples; these samples were selected randomly, and a composite sampling technique was used. Three samples of each product were mixed thoroughly to obtain the composite sample. All the cosmetic samples under study were locally manufactured. The collected samples were crushed in a mortar and pestle to homogenize. Potentially toxic metal(loid)s in cosmetic samples were extracted using an acid digestion technique. From the homogenized powder, precisely 0.5 g of each sample was measured and placed into a 25 mL crucible. Each sample underwent digestion with 10 mL of 65% HNO3. The mixture was then heated at 85 °C on a heating mantle for 6 to 8 h until digestion was complete, leaving behind a solid residue. The obtained residue was dissolved in 1 mL of H2O2 (30% v/v) and heated for 1 h at 85 °C. The sample was cooled down and diluted with distilled water, and after thorough mixing, it was filtered through a Whatman filter paper in a 25 mL measuring flask, and the volume was up to mark. San Joaquin’s soil was digested identically, and the reference solution was prepared the same way as the samples. Further dilution of stock standard solutions, cosmetic samples, and SRM 2709a was completed as per the requirement of analysis by ICP-OES. All samples were assayed in triplicate, and the results were presented in mg/kg.
2.3. Instrumentation
ICP-OES, model: iCAP 7400 (Thermo Scientific, Waltham, MA, USA), integrated with a radial/axial plasma viewing system and featuring 52.91 grooves/mm echelle-type grating, was employed for the quantification of metal(loid)s in the cosmetic samples under study. After igniting the plasma, the instrument was warmed up for 15 min. The operational parameters were set as RF power at 1150 W, and radial/axial exposure time of 15 s for UV and 5 s for Vis. A concentric glass nebulizer set out to flow the plasma coolant gas, nebulizer gas, and auxiliary gas at a rate of 12.0 L/min, 0.55 L/min, and 0.5 L/min, respectively, whereas the pump rate was adjusted to 50 rpm during the uptake of the sample, which was adjusted on the basis of sample quantity. An axial plasma view was selected for Al (396.152 nm), Ni (231.604 nm), Cd (214.439 nm), As (189.042 nm), Co (238.892 nm), Sr (407.771 nm), Sb (206.833 nm), Pb (220.353 nm), Bi (223.061 nm), and Hg (184.950 nm). A radial plasma view was chosen for Cr (267.716 nm), Fe (259.940 nm), Mn (257.610 nm), Cu (327.393 nm), and Zn (188.980 nm) [20].
2.4. Quality Control
We evaluated the proposed method’s precision and accuracy for analyzing metal(loid)s in cosmetic samples using NIST SRM 2709a. The assessment of accuracy and precision was conducted through percentage recovery and relative standard deviation (% RSD) studies, each performed ten times (n = 10). For determining detection limits, we analyzed a calibration blank in ten replicates (n = 10), calculated the standard deviation, multiplied it by 3.14, and repeated this process three times to obtain the average detection limits [21]. The detection limits were determined with different acquisition times in ultrapure water. For elements such as Al, Cr, Mn, Fe, Co, Ni, Cu, Zn, Sr, As, Sb, Cd, Pb, Bi, and Hg, a calibration curve was created over a linear dynamic range of 0 to 3000 μg/L using the equation y = mx + b
2.5. Chemometric Modelling
All results were expressed using the mean and standard deviation. The maximum and minimum metal(loid) concentrations were also found using the Microsoft Excel 2022 application. Using OriginPro 2021 (Copyright© 1991–2020 Origin Lab Corporation, Northampton, MA, USA) and SPSS® version 22.0, all statistical and graphical work was completed. A bivariate statistical assay and multivariate statistical techniques, including principal component analysis (PCA) and hierarchical cluster analysis (HCA), were used to evaluate the data. PCA suggests splitting up a dataset into smaller portions when there are a lot of dependent variables in it. This will make the results more understandable and comprehensible. PCA is an ideal tool for analyzing such problems, as it describes a dataset using its principal components based on the data’s degree of variation. This reduces the dataset’s size and allows for the visualization of its fundamental structure, highlighting experimental relationships between data and samples. Pearson’s correlation coefficient (PCC) was also used. The relationships between metal(loid)s were interpreted via PCC, and these interpretations were ultimately confirmed by the PCA and HCA results.
2.6. Calculation of Risk Assessment
2.6.1. Margin of Safety (MoS)
The Scientific Committee on Consumer Safety (SCCS) developed a protocol for margin of safety (MoS) to calculate the impact of potential impurities in cosmetics on human health. In this study, MoS was used to evaluate the effect of metal(loid) impurities on human health by utilizing the cosmetics under study [11]. The MoS is calculated as the ratio of the lowest no-observed-adverse-effect level (NOAEL) to the systemic exposure dosage (SED), as represented in Equation (1).
NOAEL is exposure level where no adverse effect is observed, and dermal reference doses (RfD) was used to determine its value, as is given in Equation (2)
where UF is the uncertainty factor, designated with a value of 1, which reflects overall confidence in the various data sets; and MF is the modifying factor, given a value of 100, which is derived from the scientific judgment; and RfD represents dermal reference doses (mg/kg/day) of different metal(loid)s which are as follows: Al = 1, Cd = 0.005, Co = 0.06, Cr = 0.019, Ni = 0.0054, Pb = 0.00042, Hg = 0.0003, As = 0.0003, Mn = 0.00184, Fe = 140, Cu = 0.04, and Zn = 0.3 [2].
The SED value was calculated by Equation (3).
where Cs (mg/kg) is the concentration of metal found in the sample; SSA (cm2) is the surface area of skin that the cosmetic product is applied; AA (g/cm2) is the quantity applied; RF is the retention factor; F (product/day) is the frequency of a product/day; BF is the bio-accessibility factor; 10−3 (mg/kg) is used as unit conversion factor; and BW (70 kg) is the average body weight taken in this study. The details of these factors can be seen in Table S1 (Supplementary Materials), which are as-recommended by the SCCS. A MoS level equal to 100 is considered safe and acceptable as per the guidelines established by WHO. The oral bioavailability of a metallic element is set to be 100% by the SCCS if oral absorption data are not available. However, it is considered appropriate to assume that not more than 50% of an orally administered dose is systemically accessible.
2.6.2. Hazardous Quotient and Index
The HQ is a metric used to assess potential health risks associated with exposure to a specific substance, in this case, the meta(loid)s. It is calculated as the ratio of a substance’s systemic exposure dosage (SED) to its dermal reference dose (RfD), the safe exposure limit for that substance, as outlined in Equation (4). An HQ value below 1 indicates that exposure is within safe limits, posing no significant health risk. Conversely, an HQ value above 1 suggests that exposure exceeds the safe threshold and may harm human health. The HI is calculated to evaluate the cumulative health risk from exposure to multiple metal(loid)s (as described in Equation (5)). The HI is the sum of HQ values for all the metal(loid)s in the exposure scenario. An HI value above 1 indicates a potential health risk due to combined exposure to multiple hazardous substances [22].
2.6.3. Lifetime Cancer Risk (LCR)
LCR is often evaluated for metals known to cause cancer. In this study, LCR was calculated using Equation (6), given as
where SF stands for the carcinogenicity slope factor, which measures the cancer risk per unit dose of a substance over a lifetime, expressed in mg/kg/day. The SF values used in the calculations are Pb = 0.0085, Cd = 0.38, Cr = 0.5, Cu = 1.5, Ni = 0.91, Al = 0.0014, and As = 3.6 [7].
3. Results and Discussion
3.1. Quality Control
Ensuring accuracy is crucial in research, as analytical methods can be prone to errors that may affect the validity of the results. To validate the precision in quantifying metal(loid)s in actual samples, NIST SRM 2709a was analyzed in recovery studies. The recovery results, shown as percentages in Table S2, indicate the extraction efficiency of the metals, which ranged from 96.7% to 103.9%. To assess method precision, repeatability was evaluated by analyzing SRM 2709a three times (n = 3), and the results, expressed as % RSD (relative standard deviation), varied from 1.8% to 5.7%, reflecting satisfactory precision (refer to Table S3 in the Supplementary Materials) [21]. Calibration curves were plotted with a linear equation (y = mx + c), where “m” represents the slope of the curve, “c” is the intercept, and “x” is the concentration. Linear regression equations were developed and key parameters were recorded. Detection limits (LOD and LOQ) were established using the proposed methods, with lower values signifying adequate sensitivity (detailed in Table S2, Supplementary Materials).
3.2. Concentration of Metal(loid)s in Cosmetic Products
3.2.1. Aluminium
The mean concentrations (mg/kg) of Al varied in the cosmetic products in the following order: lipstick (4.15) > mud mask (1.74) > face powder (1.48) > highlighter (1.46) > skin polish (1.40) > foundation (1.21) > cleaner (1.19) = face lotion (1.19) = scrub (1.19) = massage cream (1.19), as shown in Table 1. A maximum concentration of 3660 mg/kg in face powder has already been reported in Qatar [22], while the mean concentrations of Al were found to be 48.2 mg/kg and 70.5 mg/kg in lipstick samples studied in Europe and China, respectively [23], higher than the results found in this present study for lipstick (4.15 mg/kg) and face powder (1.48 mg/kg). Al is a component of several cosmetic product formulations, such as Al powder and Al lake dyes, such as FD & C blue 1 Al lake. The word “lake” describes color additives that are typically found in medications, food, and cosmetics. It has aluminum oxide in it, which reacts with colorants in an aqueous solution. Because these pigments stain via dispersion and are not soluble in water, they are regarded as harmless. But due of its derma-abrasive attributes, some unreacted aluminum oxide might also be present in the finished product, which could pose modest danger to skin safety [7]. Al exposure through cosmetic products occurs predominantly via dermal contact. Al in cosmetics can penetrate the skin barrier, leading to potential absorption and accumulation in various tissues. This can induce oxidative stress, resulting in cellular damage and structural alterations. Research suggests a correlation between Al exposure and adverse health effects, including skin irritation and potential systemic toxicity. Cosmetics containing Al, such as antiperspirants and foundation, pose a risk of prolonged exposure, especially if used regularly over time. The European SCCS considers Al safe for use in cosmetics at specific concentrations and allow the 7700 mg/kg in lipstick [24].

Table 1.
Concentration of metal(loid)s in cosmetic products (mean ± SD, n = 3, mg/kg).
3.2.2. Chromium
Table 1 presents the mean concentrations (mg/kg) of Cr in following order: foundation (2.19) > skin polish (0.51) > mud mask (0.36) > highlighter (0.28) > scrub (0.26) > lipstick (0.19) > massage cream (0.15) = face lotion (0.15) > cleaner (0.14) > face powder (0.13). In previous studies in Pakistan for metals analysis in cosmetic products including lotion, foundation, and lipstick, the mean Cr concentrations were 0.28 mg/kg, 0.24 mg/kg, and 0.34 mg/kg, respectively. The concentrations found in foundation in this present study are higher than the concentrations found in the samples in previous studies [2]. The mean concentration of Cr in face powder has been reported to be 21.6 mg/kg in Ghana [25], which is higher than the mean concertation of Cr found in the present investigation. The lipstick and foundation samples were analyzed in Italy for Cr, and the concentrations ranged between 0.5–2.1 mg/kg (mean = 1.04 mg/kg), and 0.9–2.2 mg/kg (mean = 1.40 mg/kg), respectively, and the mean concentration in foundation was less than the concentrations of Cr found in this present study. ISS-Italy has set the limit of 1 mg/kg for Cr (VI) and 5 mg/kg for Cr (III) in cosmetics [11]. The Cr concentrations were found to range from 3.32 to 7.41 mg/kg in face cream and lotions samples obtained from several beauty stores in Botswana [26]. A mean of 0.33 mg/kg has been reported previously in lipsticks obtained from China [27], which surpasses the results found in the current investigation (0.19 mg/kg). The Cr concentrations in cream foundations taken from the Iranian market were determined to be 3.52–30.9 mg/kg in previous research [28], substantially higher than the current results (2.19 mg/kg). The assessments of Cr concentrations in lipstick samples in Turkey varied between 1.5 and 2.3 mg/kg [29], higher than the concentrations found in present investigation (Table 1). Cr in its hexavalent form is more toxic than its trivalent form. Although Cr (VI) is not legally restricted as an ingredient in cosmetics, its presence must be controlled as an impurity due to its harmful effects on human health. Certain Cr-containing compounds, with long-term exposure, can present health hazards. Cr (III) is comparatively stable, has low water solubility, and is essential in small amounts for human health. Conversely, chromium (VI) is highly toxic, mobile, and soluble in water. It is utilized in various industrial processes, which can result in human exposure, including cosmetics. The FDA does not have a specific limit for Cr in cosmetics. However, it restricts Cr levels as an impurity in some approved color additives to 50 mg/kg. The EU has a stricter limit. Cr is allowed in cosmetics, but only up to a maximum of 1 mg/kg of the product [30].
3.2.3. Manganese
The mean concentrations (mg/kg) of Mn were found in the following order: face powder (28.77) > mud mask (7.42) = skin polish (7.42) > face lotion (6.91) > massage cream (5.41) > highlighter (5.29) > lipstick (4.55) > scrub (4.22) > cleaner (3.61) > foundation (3.45). The Mn concertation in face powder was found to be 38.6 mg/kg in face powder samples in Ghana [25], which is higher than the mean concentration of Mn found in the present investigation (Table 1). Another study in Qatar reported the concentration of Mn as 73.08 µg/kg in face powder [22], which is less than the Mn concentration found in the present study (Table 1).
The mean concentrations of Mn were found to be in the range of 6.83 ± 1.98–17.65 ± 5.31 mg/kg, 21.08 ± 11.05–27.45 ± 14.23 mg/kg, and 11.27 ± 9.27–13.73 ± 2.20 mg/kg in skin lightening, face powder, and lipstick products, respectively, collected in Nigeria [31], and these concentrations are higher than the Mn contents found in this present study. Mn is an essential metal in biological systems, and plays critical roles in vital metabolic processes like oxidative phosphorylation, lipid and carbohydrate metabolism, and enzyme activation. However, excessive Mn accumulation in the brain can result in neurological disorders characterized by cognitive, behavioral, and motor impairments. Mn contamination is a significant concern in various cosmetic products due to its potential health risks. In cleaners, manganese dioxide is used as a mineral-based abrasive, contributing to contamination. Lipsticks may contain pigments with Mn compounds for coloration, while lotions might utilize manganese-based compounds in emulsifiers or thickeners, leading to contamination. Face powders and foundations can harbor Mn contamination from mineral-based pigments like manganese ferrite. Mud masks may contain naturally occurring Mn or acquire it during processing. Highlighters and skin polishing products may incorporate Mn-based pigments or abrasive particles like manganese carbonate or manganese oxide, respectively. Additionally, massage creams and scrub products might introduce Mn contamination through Mn-containing oils or abrasive materials, underscoring the broad range of cosmetics susceptible to such contamination.
3.2.4. Iron
Mean concentrations (mg/kg) of Fe in cosmetics under investigation decreased in the following order: massage cream (126.02) = scrub (126.02) > foundation (93.89) > face powder (62.86) > mud mask (52.9) > highlighter (31.71) > metal cleaner (17.70) > lipstick (15.25) > face lotion (12.74). The mean concentration of Fe was found in face powder as 61.8 mg/kg in samples collected in Ghana [25], which is almost the same as observed in this present investigation (Table 1). The mean concentrations of Fe have been reported as 2.14 mg/kg, 9.64 mg/kg, and 11.95 mg/kg in face lotion, foundation, and lipstick, respectively, in samples reported in Pakistan [2], and these previously reported results are lower than the Fe content found in this present investigation. The mean concentrations of Fe were found in the range of 4.03 ± 0.96–22.12 ± 6.57 mg/kg in foundation samples analyzed in Qatar [22], and these results of Fe content are less than the results found in this present study. The mean Fe contents have been reported as 13.0 mg/kg and 21.10 mg/kg in lipstick and face powder samples, respectively, analyzed in Nigeria [32], and these findings are less than the results of the present investigation (Table 1). Iron oxide pigments are frequently included in cosmetics, especially in eyeshadow and foundation formulas. Despite being widely regarded as harmless, they occasionally have the potential to irritate the skin or trigger allergic responses, particularly in people with sensitive skin. Fe might not be a purposefully added element in cosmetics, but rather an impurity or contaminant. Contaminants can arise during the manufacturing process or from raw materials [33]. Certain forms of Fe can be dangerous if consumed or absorbed via the skin in excessive doses. There is a chance that iron oxide particles from powder cosmetics, such as blushes or loose powders, can become airborne during application. Although there is usually little chance of toxicity from inhaling iron oxide particles found in cosmetics, breathing in too many tiny particles might irritate the respiratory tract or aggravate lung problems, especially in people who already have respiratory diseases [34].
3.2.5. Cobalt
The mean concentrations of Co (mg/kg) in cosmetics were observed in following order: massage cream (31.62) > cleaner (5.03) > scrub (5.02) > mud mask (0.37) > foundation (0.28) = face powder (0.28) > face lotion (0.25) > highlighter (0.22) > lipstick (0.19). The Co concentrations were found to be 0.45–3.77 mg/kg in cream foundations chosen from the Iranian market [28], similar to the Co contents in the present investigation. A concentration of 0.2 ± 0.01 mg/kg has been reported previously in lipsticks in Turkey, although some of the lipstick samples were below the detection limit of 0.2 μg/kg [29]. In a prior study in Qatar, the minimum amount of Co reported in samples was 169.35 µg/kg, and the maximum concentration was given as 1.02 mg/kg [22]. The highest value of Co content (48.2 mg/kg) found in eye pencils in previous research [2] is higher than the concentrations of Co found in this present study. The average Co content was 5.29 mg/kg in this current study, which is almost equal to the Co content (5.67 mg/kg) reported in lipstick samples gathered from Romania, but slightly higher than the Co content found in eye shadow (2.09 mg/kg) [11]. Co can be found in cosmetics for a few reasons, although it is not a common ingredient. Co may be an unintended contaminant in some cosmetic ingredients. Coconut oil’s moisturizing qualities and possible advantages for skin and hair have made it a popular ingredient in cosmetics. Co content in cosmetics likely refers to the use of coconut oil [35]. Co may result in allergic contact dermatitis, an inflammatory, reddening, and itchy skin disease. Overexposure to Co can cause a number of health concerns, such as neurological symptoms, cardiovascular impacts, and respiratory troubles. While external contact with cobalt rarely results in significant systemic exposure, it can still be absorbed through the skin, potentially causing systemic effects [36].
3.2.6. Nickel
The decreasing pattern of Ni concentrations (mg/kg) in the cosmetic samples from highest to lowest mean value are as follows: highlighter (5.39) > lipstick (2.51) > foundation (1.12) > face powder (0.91) > mud mask (0.90) > skin polish (0.35) > face lotion (0.19) > massage cream (0.11) = scrub (0.11) = cleaner (0.11). A previous study in Botswana indicated that the cosmetic goods (lotions and creams for the face and body) acquired from several beauty stores had concentrations of Ni ranging from 2.99 to 9.50 mg/kg [26], and these findings of Ni are higher than the results of this present study. The lipstick samples analyzed in China demonstrated a mean concentration of Ni 0.9 mg/kg [27], which is lower than the mean contents of Cr found in the present investigation. In line with the current findings (1.12 mg/kg in foundation), the Ni contents in a previous study on cream foundations in Iran ranged from 1.75 to 16.92 mg/kg [28]. Previous research on lipsticks in Turkey revealed concentrations between 0.4 and 1.3 mg/kg, [29] lower than the current findings. The maximum concentration of Ni in mud masks was 5.84 mg/kg, whereas the minimum levels were found in a scrub (0.29 mg/kg). In our study, the mean concentration was 1.00 mg/kg, which is much smaller than the value in a former study (7.99 mg/kg) [2]. The Ni level was below the limit of detection (10.89 µg/g) in samples originated from Ghana [25]. In the present investigation, the results for Ni in lipstick were slightly lower than the concentrations in lipstick found in samples from Romania, 3.98 ± 0.22 mg/kg [11]. Ni can be found in a variety of cosmetic products, mostly as a trace element in colorants and preservatives, or as a contaminant in raw materials and pigments. It is present in cosmetics such as hair dyes, lipsticks, and eye makeup [37]. Ni-induced allergic reactions, notably contact dermatitis, are also prevalent. Notably, the first documented instance of Ni allergy attributed to eye shadow has been reported, with sensitivities triggered even at minute Ni concentrations, potentially exacerbating pre-existing allergies. Vigilance regarding Ni exposure and its associated health risks is paramount, necessitating stringent regulation and monitoring measures. Within the EU, Ni and its salts are prohibited in any cosmetic product. The permissible limit for Ni in cosmetics is set at 10 mg/kg according to global standards [30,37].
3.2.7. Copper
The mean values of Cu (mg/kg) in cosmetic products are in the order of face powder lipstick (0.19) > face lotion (0.16) > cleaner (0.14) > face powder (0.12) = mud mask (0.12) = scrub (0.12) > massage cream (0.11) = foundation (0.11) > highlighter (0.09) > skin polish (0.08). A Cu mean concentration of 0.44 mg/kg, with a range of 0.0018–3.38 mg/kg, in lipsticks was observed in the samples analyzed in China [27], higher than the results of Cu in lipstick samples in the present investigation. Lipsticks have previously been reported to have a mean content of 0.20 mg/kg from Turkey [29], which is higher than the results found in this present study. The concentration of Cu was found to be 7.63–21.0 mg/kg, 6.70–6.78 mg/kg, and 5.94 mg/kg in lipstick, face powder, and skin-lightening samples, respectively, collected in Nigeria [31,32], and these values of Cu are higher than the results observed in this present study. The concentration of Cu was found in the range of 0.14–8.12 mg/kg in foundation samples analyzed in Qatar [22], higher than the results in this present study. Cu is mostly used as a colorant and preservative in cosmetics. Some products contain Cu-peptides because of their possible anti-aging properties. It is a vital trace element that supports the stability and production of proteins, which is good for the health of the skin. On the other hand, overexposure to Cu in cosmetics may be dangerous. Overuse of Cu in cosmetics can irritate skin, produce redness, or allergic responses, especially in people who are sensitive. Extended exposure to elevated Cu concentrations may result in Cu poisoning, with symptoms including nausea, vomiting, and abdominal pain. Absorption through the skin can contribute to an increased intake of Cu, potentially leading to systemic effects [35].
3.2.8. Zinc
The mean concentrations (mg/kg) of Zn in cosmetic products were found in the following pattern: scrub (47.81) > cleaner (21.18) > skin polish (19.55) > foundation (12.69) > highlighter (9.93) > mud mask (9.87) > face powder (6.39) > lipstick (5.53) > massage cream (3.48) > face lotion (1.99). The mean concentrations of Zn were found to be 325 mg/kg and 18.2 mg/kg in face powder and lipstick, respectively, in the samples collected in Nigeria [32], and these results of Zn are higher than the present findings. Zn was found in the range of 1.4–8909 mg/kg in different samples of foundation analyzed in Qatar [22], and most samples had higher concentrations of Zn than the results observed in this present study. The Zn content has been reported to be 11.2 mg/kg in face powder in Ghana [25], and the present investigation demonstrated less Zn content than the samples studied in Ghana. Zn contains anti-inflammatory and antibacterial qualities that can help to treat dandruff and acne. It can also regulate sebum secretion and possibly mend the skin. Zinc oxide is also a common and safe ingredient in sunscreens, providing protection against UV rays. Nevertheless, it is essential to note that excessive Zn intake, either through cosmetics or other sources, can lead to adverse effects, such as gastrointestinal upset and impaired immune function [38,39].
3.2.9. Arsenic
The mean concentrations (mg/kg) of As in the cosmetic samples were observed in the following order: highlighter (0.051) > massage cream (0.032) > mud mask (0.031) = skin polish (0.031) = scrub (0.031) > foundation (0.022) > face powder (0.021) > face lotion (0.011). The concentrations of As in the cleaner and lipstick were below the detection limit. The As concentrations in cosmetic products have been reported in lipstick 0.73 ± 0.06 mg/kg in Romania [11], and this is higher than the content of As found in this present study. The concentrations of As in facial and body creams and lotions purchased from different beauty shops in Botswana have been reported in the range of 1.95–4.52 mg/kg [26]. A mean of 0.025 mg/kg, with a range between 0.00 mg/kg and 0.14 mg/kg, has been reported previously in lipsticks obtained from China, which is consistent with the current investigation (As was undetectable in lipstick) [27]. The As concentrations in foundation have been reported in the range of 15.74–214.63 µg/kg in samples tested in Qatar [22], higher than the results observed in the present investigation. A mean concentration of As was found to be 3.87 mg/kg in face powder samples analyzed in Ghana [25], which is higher than the results found in the present investigation. Prolonged exposure to As can cause skin sores, cancer, heart disease, and neurological issues, among other harmful health effects. Although the use of As in cosmetic items is banned in many countries, its presence remains a concern due to potential contamination during manufacturing processes. Frequent quality evaluation and regulatory measures are necessary to mitigate the risks associated with As exposure from cosmetics [40,41]. In Canada, for example, As is prohibited as an ingredient. The FDA, EU, GCC (Gulf Cooperation Council), ASEAN (Association of Southeast Asian Nations), China, and Korea have guidelines to limit As levels to 3.0 (for colorant used in cosmetics), 0.5, 3.0, 5.0, 2.0, and 10 mg/kg, respectively [30,37].
3.2.10. Antimony
The mean Sb concentrations (mg/kg) in the cosmetic samples followed a decreasing pattern as follows: skin polish (1.66) > scrub (1.47) > massage cream (0.66) > mud mask (0.29) > highlighter (0.25) > face lotion (0.24) > face powder (0.21) > lipstick (0.20) > foundation (0.18) > cleaner (0.04). Concentrations of Sb have been reported in the range of 0.47–547.46 µg/kg in foundation samples analyzed in Qatar [22], less than the results observed in the present investigation. Sb is a concern in cosmetics due to its potential health impacts. Skin spots, dermatitis, eye irritation, and gastrointestinal issues can all result from long-term exposure to Sb. Sb is limited in cosmetics to prevent negative effects. Maintaining consistent regulation and monitoring is essential for reducing the dangers of Sb exposure from cosmetic use. The EU, GCC, Canada, and Korea have guidelines to limit Sb levels to 0.5, 5.0, 5.0, and 10 mg/kg, respectively [30,37].
3.2.11. Strontium
The decreasing pattern of Sr concentration (mg/kg) in cosmetic samples is as follows: mud mask (10.34) > highlighter (7.61) > lipstick (7.35) > foundation (5.75) > skin polish (3.38) > scrub (3.12) > cleaner (3.10) = massage cream (3.10) > face lotion (2.78) > face powder (0.99). Sr is being explored for its potential benefits in skincare products due to its anti-inflammatory properties [42]. According to previous studies, Sr salts are helpful in topical formulations because they can reduce sensory irritation efficiently without having the negative effects of a local anesthetic. Although Sr’s toxicity to humans has not been directly demonstrated, its usage in cosmetic goods needs to be carefully considered and regulated to guarantee both safety and effectiveness [43].
3.2.12. Cadmium
Cd concentrations (mg/kg) in cosmetic samples follow a decreasing pattern as follows: highlighter (1.5) > lipstick (0.57) > massage cream (0.46) > face lotion (0.23) = cleaner (0.23) = scrub (0.23) > foundation (0.22) > mud mask (0.19) > face powder (0.16). Earlier studies on lipsticks obtained from China revealed a mean of 0.0024 mg/kg [27], which is considerably lower than the levels observed in this current study (0.57 mg/kg). Cd concentrations were found to be in the range of 0–4.77 mg/kg in a previous study on cream foundation samples analyzed in Iran [28], significantly higher than the results obtained in a present investigation (0.22 mg/kg Cd in foundation). The mean Cd content was found to be 0.46 mg/kg for all samples, which is higher than the Cd levels found in a previous study on different cosmetic products previously reported in Pakistan (0.13 mg/kg) [2]. In Ghana, cosmetic samples were found to contain Cd concentrations below the detection limit of 3.31 mg/kg [25]. In Spain, the mean Cd concentrations in cosmetic brands ranged between 0.00–0.09 mg/kg [7]. In Romania, the lowest concentrations were found to range from 0.006 mg/kg to 0.58 mg/kg in lipstick, consistent with the findings of this study (mean concentration in lipstick = 0.56 mg/kg) [11]. Cd is a toxic heavy metal that can be found in various cosmetic products. Exposure to Cd through cosmetics can lead to severe health effects, including stomach irritation, vomiting, and diarrhea, and long-term exposure may result in kidney, liver, and brain damage [41]. Therefore, it is crucial that regulatory authorities monitor and regulate the levels of cadmium in cosmetics to ensure consumer safety. The EU, GCC, ASEAN, China, Canada, and Korea have guidelines to limit Cd to 0.1, 3.0, 5.0, 5.0, 3.0 and 5 mg/kg, respectively [30,37].
3.2.13. Lead
The mean concentrations (mg/kg) of Pb in the descending order are as follows: foundation (2.44) > mud mask (1.93) > skin polish (1.42) > face lotion (1.27) = face powder (1.27) > massage cream (1.26) > lipstick (1.24) > scrub (1.22) > highlighter (0.38) > cleaner (0.29). Pb concentrations were found in the range between 45.75 and 193.60 mg/kg in body and facial creams and lotions in samples analyzed in Botswana [26], and these results are higher than the concentrations found in different cosmetic samples in this present study. The present investigation’s results (1.24 mg/kg) surpass a prior study from China [27], which reported a mean of 0.05 mg/kg, with a range of 0.00–0.13 mg/kg, in lipsticks. According to the obtained results of a prior study on cream foundations selected from the Iranian market, the Pb concentrations were 1.45–398.5 mg/kg [28], comparable to the current results (2.24 mg/kg Pb in foundation). Mean concentrations between 0.3 mg/kg and 1.1 mg/kg have been reported previously in lipsticks in Turkey [29], consistent with the results of the current analysis. A mean Pb content of 0.05482 mg/kg was reported in Chinese lipstick products, with a range of 0.00–0.14 mg/kg [44], which is less than the current Pb values. In prior studies in which cosmetic brands were collected from Pakistan [2] and Ghana [25], the mean values of Pb were reported as 6.37 mg/kg and 0.76 mg/kg in facial powders, respectively. The Pb content found in lipstick was 0.27 mg/kg in samples from China and 0.38 mg/kg in samples from Europe. These results are lower than those found in our study (mean value of Pb in lipsticks = 1.24 mg/kg) [7]. The Pb contents in facial cosmetic samples collected in Romania were found in the range of 27.02–40.90 mg/kg [11]. Pb may contaminate color additives used in cosmetics, especially those derived from minerals or mica powder. Pb contamination can occur during the sourcing or manufacturing process of raw materials used in cosmetics. Environmental factors such as contaminated water, soil, and air can lead to the presence of Pb in cosmetic ingredients [2]. Pb in cosmetic products poses significant risks to human health. It is a heavy metal that builds up in the body over time and causes a number of harmful health effects. Pb exposure from cosmetics has been connected to developmental delays, cancer, neurological impairment, and reproductive complications. Pb-containing cosmetics are particularly concerning for pregnant women as lead exposure during pregnancy can harm the developing fetus [45]. The FDA, EU, GCC, ASEAN, China, Canada, and Korea have guidelines to limit Pb (20 for colorant used in cosmetics, 10 for lip cosmetics) to 2.0, 10, 20, 10, and 20 mg/kg, respectively [30,37].
3.2.14. Bismuth
The findings of this study showed that mud masks and highlighters had the minimum and maximum Bi, at concentration values of 2.18 mg/kg and 0.23 mg/kg, respectively (mean = 0.47 mg/kg). The observed decreasing order of concentrations (mg/kg) of Bi in the samples is as follows: highlighter (2.18) > lipstick (0.46) > skin polish (0.28) > face powder (0.27) > cleaner (0.26) = face lotion (0.26) = massage cream (0.26) = scrub (0.26) > foundation (0.25) > mud mask (0.23). Bi is commonly found in cosmetic products, especially in mineral makeup and powders. It provides a pearlescent sheen and helps makeup adhere to the skin. Bismuth oxychloride, a common form of Bi used in cosmetics, can cause skin irritation and sensitivity. Bismuth oxychloride may worsen acne and trigger rosacea flare-ups [46].
3.2.15. Mercury
The mean concentrations (mg/kg) of Hg in the descending order are as follows: massage cream (0.042) > scrub (0.033) > face lotion (0.032) = skin polish (0.032) > lipstick (0.031) = mud mask (0.031) = highlighter (0.031) > face powder (0.021) = foundation (0.021) > cleaner (0.012). These results are consistent with a previous study in which the means were 0.62 ± 0.05 mg/kg in lipstick and 0.45 ± 0.03 mg/kg in eyeshadow [11]. The mean concentration of Hg was found to be 2.82 mg/kg in facial powder in Ghana [25]; the present investigation demonstrated less Hg content than the samples studied in Ghana. The concentrations of Hg were found to be in the range of 1.05–5.33 µg/kg in foundation samples analyzed in Qatar [22], lower than the results found in this present study. In a previous study in Pakistan, the mean concentrations Hg were reported to be 0.49 mg/kg, 1.21 mg/kg, and 5.42 mg/kg in foundation, face powder, lipstick samples, respectively [41], higher than the results found in the present investigation for various cosmetic products. Hg is often present in cosmetics, particularly in skin-lightening creams and facial products. It can enter cosmetics as a contaminant during manufacturing processes or intentionally added as a preservative or skin-lightening agent. Hg exposure from cosmetics can lead to skin disorders and irritation. Prolonged exposure to Hg can cause neurological issues, affecting cognition and nerve function [47,48]. The FDA, EU, GCC, ASEAN, China, Canada, and Korea have guidelines to limit Hg (1 for colorant used in cosmetics) to 0.1, and 1 mg/kg, respectively [30,37].
3.3. Chemometric Modeling
PCC analysis displays the results in a matrix format, revealing the sequential links between variables. This technique is quite helpful when evaluating the strength and direction of correlations between variables, like the concentrations of metal(loid)s in cosmetic items. In summary, the positive correlations between potentially harmful metal(loid)s in these samples imply that they most likely come from shared sources [18]. PCC was utilized to ascertain whether the different concentrations of metal(loid)s in the cosmetics are related, as shown in Figure 1. Strong positive correlations were found for Cr–Cd (0.67), Cu–Cd (0.63), Cu–Pb (0.77), Fe–Sb (0.66), Fe–Mn (0.87), and Zn–Ni (0.62) in cleaner. Cd–Bi (0.9), Pb–Ni (0.77), Sr–Al (0.61), As–Cd (0.73), Mn–Cr (0.67), Zn–Al (0.74), and Zn–Cr (0.82) showed strong associations in lipstick. Cr–Cd and Sb–Cd were positively related to each other in lotion at r values of 0.67 and 0.62, respectively. Positive correlations, at r values of 0.76, 0.71, 0.67, 0.61, 0.66, and 0.65, were observed for Cd–Al, Co–Al, Cr–Al, Ni–Bi, Mn–Cr and Cu–Sr, respectively, in face powder. In cases of foundation, these correlations were found highest for Sr–Cr (0.73), Sb–Co (0.61), Mn–Bi (0.79), and Cu–As (0.68). In mud masks, Cr–Al, Cr–Co, Ni–Cd, Sb–Cd, Sb–Ni, Mn–Pb, and Cu–Al represented the maximum relations with highest r values of 0.64, 0.65, 0.95, 0.80, 0.78, 0.65, and 0.63, respectively. For highlighters, these correlations were significant among Cd–Bi (0.63), Pb–Ni (0.82), Mn–Cr (0.67), Mn–Ni (0.73), Mn–Pb (0.81), and Cu–Ni (0.61). Skin polish products represented strong relations among Cd–Al (0.66), Ni–Bi (0.69), Sr–Co (0.65), Sb–Cr (0.91), and Sb–Ni (0.86). Zn was positively interlinked with many metals including Cr, Ni, Pb, and Sb with r values of 0.68, 0.65, 0.62, and 0.77, respectively. In massage cream and scrubs, Cr–Cd (0.67) and Zn–Cu (0.85) were found to be strongly correlated with each other (Figure 1).
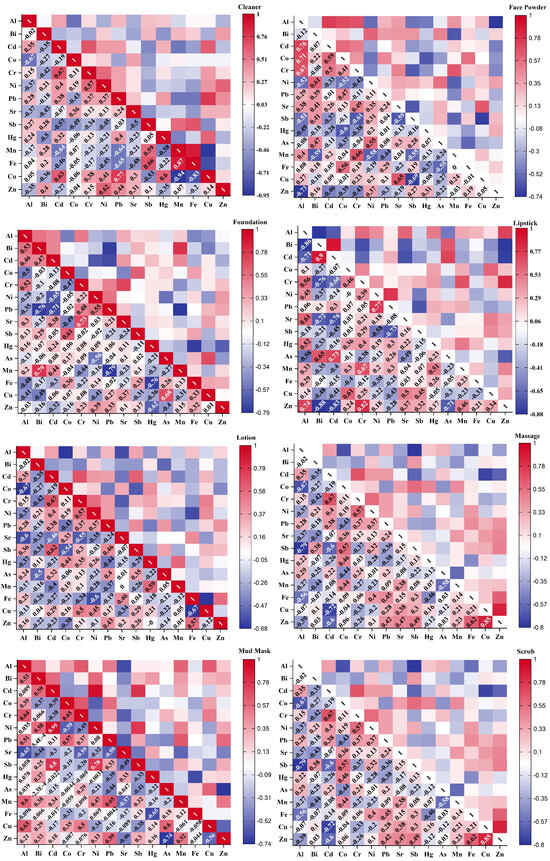
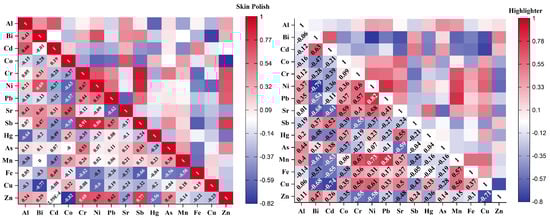
Figure 1.
Pearson correlation between metal(loid)s in different cosmetic products, figuring out the connections between various metal(loid)s in cosmetic samples.
This correlation analysis revealed significant differences in the levels of metal(loid)s (p ≤ 0.05 and p ≤ 0.01), suggesting notable variations among the cosmetic samples. These disparities might be due to inconsistencies in the samples. Since most of the metals examined showed strong correlations with each other, we applied various multivariate statistical techniques, such as HCA and PCA, to delve deeper into the classifications and distributions of these elements.
Using as input data the values of potentially toxic metal(loid)s (Cr, Mn, Fe, Co, Ni, Cu, Zn, Al, Cd, Ba, Pb, Hg, As, and Sb) for the 10 different cosmetic products, the variations in the data were explained by the first three main components at a rate of 73.5% as follows: PC1 = 34.24%, PC2 = 21.82%, and PC3 = 17.44%. The PCA loadings of correlated potentially toxic metal(loid)s are given in Table S4 (Supplementary Materials) and demonstrated in Figure 2a. The PC loading values are shown in Figure 2b by the radar diagram. Metal(loid)s such Co, Pb, Sb, Hg, As, Fe, and Zn have substantial positive loading values exceeding 0.85 in PC1, which accounts for 34.24% of the overall variation. On the other hand, PC2, which accounts for 21.82% of the variation overall, has positive loading values for Cr, Ni, Pb, Fe, and Cu above 0.9. Furthermore, as seen in Figure 2b and described in Table S5 of the Supplementary Materials, Bi, Cd, Sr, As, Mn, and Zn exhibit positive loading values larger than 0.8 in PC3, which accounts for 17.44% of the overall variation. We assessed the quantitative relationships between various potentially toxic metal(loid)s using this statistical method. HCA revealed additional groupings that offer deeper insights into their likely common sources.
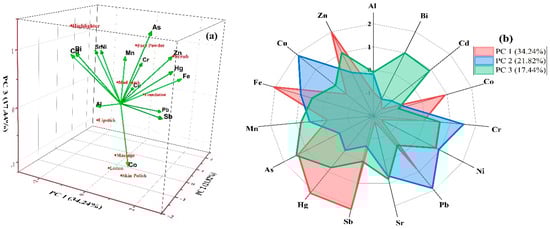
Figure 2.
Principal component analysis (a) and PC loading values (b) of metal(loid)s in different cosmetic products.
According to PCA, three principal components with eigenvalues of 1 or greater accounted for about 92.84% of the total variance in the measured parameters. The first component, with an eigenvalue of 5.14, explained approximately 34.24% of the variance. The second component, with an eigenvalue of 3.27, accounted for 21.82%, while the fourth component, with an eigenvalue of 1.78, contributed 11.90%. Lastly, the component with an eigenvalue of 1.11 explained 7.44% of the variance (refer to Table S5 in the Supplementary Materials). Consequently, the scree plot indicated that the potentially toxic metal(loid)s were derived from five distinct sources, as illustrated in Figure 3a. To further validate the PCA results, HCA was employed to group the metals into correlated classes within a variable space. Figure 3b demonstrates the alignment between the PCA findings and the HCA dendrogram, which identified five separate clusters. One group was formed by Bi, Cd, Ni, and Sr concentrations, second cluster comprising Cr, Mn, Pb, and Cu concentrations, and a third cluster included Sb, Hg, Zn, As, and Fe. Co and Al clustered separately, which indicates their independent sources of contamination in cosmetic products. In addition, Sb represented less associations with other metals in the third cluster, as shown in the circular cluster graph (Figure 3b).
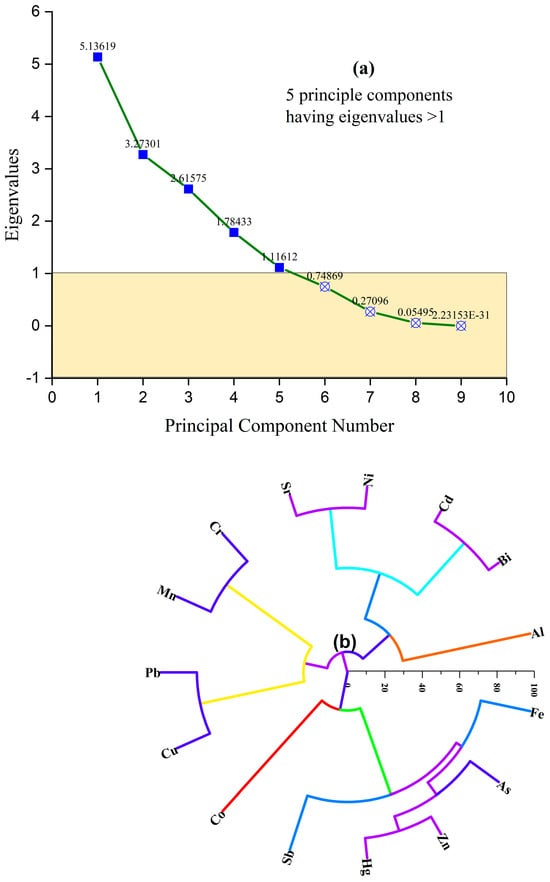
Figure 3.
Scree plot (a) and hierarchical cluster analysis (b) of metal(loid)s in different cosmetic products.
Varying categories of cosmetic items have varied concentrations of potentially hazardous metal(loids), and their distribution patterns in PCC, HCA, and PCA may be attributed to the types of raw materials and the sources from which they are acquired. These chemometric analyses represented that elevated Al levels were present in certain brands of lipsticks. The sources of Al contamination in lipstick may stem from various origins, including pigment additives like alumina (Al2O3), used for coloration, and aluminum hydroxide or aluminum stearate, utilized as thickeners or stabilizers in formulations. Rare sources of Al contamination could involve cross-contamination during manufacturing processes, impurities in raw materials, or environmental contamination during ingredient sourcing. Furthermore, Al nanoparticles, used for various cosmetic purposes, could contribute in lipstick formulation. The Co contamination observed in lotions, massage oils, and skin polishes may originate from various sources, including raw material impurities or equipment used in the production line, such as cobalt-containing alloys or lubricants, which may inadvertently introduce trace amounts of meals into the final products. Further investigation into the specific manufacturing practices and raw material sourcing is warranted to pinpoint the exact origins of this potentially toxic metal(loid) in these cosmetic products.
The Zn, Hg, and Fe detected in scrub cosmetics may derive from raw materials such as zinc oxide, mercurial compounds used in preservatives, and iron oxides commonly employed as colorants or abrasives. The Mn, Cr, and As found in face powder formulations could stem from mineral pigments, clay additives, or talc contaminants. The Cu detected in mud masks and foundations might result from the presence of copper-containing minerals in clays or from equipment used in processing. The Bi and Cd observed in highlighters may originate from bismuth oxychloride in pearlescent pigments and Cd-containing colorants, respectively. In addition, iron carbonates, ferric hydroxide, iron oxides (black, red, and yellow), Cr compounds (chromium (III) oxide and chromium (III) hydroxide), and compounds of iron are deliberately added to cosmetic items as color pigments. In a comparable manner, Cd is utilized in cosmetics due to its capacity to create numerous shades when blended with other ingredients. For example, the reason cadmium sulfide is used is because of its yellow color. Likewise, to create cadmium green, a light green combination, viridian (Cr (III) oxide) is mixed with cadmium yellow. The same metal may be consciously added, depending on the regulatory restrictions, or accidentally introduced as an impurity. Pb, Cd, and Ni are among the other metals that can accumulate as contaminants throughout multiple stages of the cosmetic manufacturing procedure, primarily because to the inclusion of color minerals and additives. Additionally, contaminations can originate from the sorting and manufacturing processes in the cosmetic industries that involve the use of solvents, water, and various machinery [2]. Understanding these origins of metal(loid) contaminants in cosmetic formulations is crucial for ensuring product safety and regulatory compliance, warranting further investigation into the specific pathways of metal(loid) introduction and their potential health implications. Moreover, understanding these potential sources is crucial for mitigating contamination in cosmetic products [17].
3.4. Human Health Risk Evaluation
3.4.1. Non-Carcinogenic Risk Evaluation
Systemic Exposure Dose
At 50% and 100% bio-accessibility factors, the highest values were observed for Fe followed by Zn and Mn (Table 2). For face powder, the highest values of metals were found in the pattern of Fe (3.97 mg/kg/day) > Mn (1.82 mg/kg/day) at 50% bio-accessibility. Moreover, in scrub samples, SED at 50% and 100% bio-accessibility was evaluated highest for Fe (5.10 mg/kg) followed by Zn (1.93 mg/kg). This was not observed in cleaner cosmetic products (Table 2). It was noted in a recent study from Pakistan that at 50% and 100% bio-accessibility, SED values for Fe, Ni, and Pb were reported highest [2], which is comparable to our study. SED values of Al, Cd, and Pb in lipstick products are also in good agreement with the results, mentioned earlier, for lipstick samples from China, Europe, and Romanian markets, respectively [7,11].
Table 2.
SED values (mg/kg/day) of potentially toxic metal(loid)s in cosmetic products.
Margin of Safety
The methodology developed by the SCCS for testing and evaluating the safety of cosmetic elements served as the foundation for the development of the MoS [49]. The MoS (Figure 4) evaluation in this current study was based on the dermal bioavailability of the cosmetic product at 50% and 100% of the identified metal(loid) content. At 50% bio-accessibility, the MoS of Al and Fe was greater than 100, which indicates safe levels in all cosmetics. But, at 100% bio-accessibility, Al values were <100 in cleaner, lotion, face powder, mud mask, skin polish, massage cream, and scrub. Moreover, Fe levels at 100% bio-accessibility were below 100, showing unsafe and obvious risk levels. The MoS results of Co, Cr, Ni, Pb, Sb, Hg, and Mn in both 50% and 100% scenarios were less than 100 in all cosmetics except for lipstick and highlighter, representing their potential risk, especially referring to condemnation from different sources. Cd results at 50% and 100% bio-accessibility were in safe ranges only for lotion, highlighter, lipstick and foundation; its MoS results were >100 (Figure 4), indicating safe margin of exposure. Fe levels were safe from exposure in all cosmetic products at 50% bio-accessibility. But, in cases of 100% bio-accessibility, its values were less than 100, indicating risk through dermal exposure. Cu values were within safe limits (MoS > 100) at 50% and 100% bio-accessibility. In lipstick, lotion, and massage cream, the MoS ranges for Zn were greater than 100 at a bio-accessibility of 50%. On the other hand, at 100% bio-accessibility, its results were less than 100 for all cosmetics products except for lotion and massage cream. The findings of this current study are consistent with previous research. According to the results of a recent investigation, every metal(loid) in the powdered cosmetics for face had a MOS value of less than 100, with the exception of Pb and Cr, which came from a local Ghanaian market [25]. Furthermore, samples gathered from various markets in Pakistan showed MoS values exceeding 100 for hair dye, foundation, whitening cream, and lipstick. Conversely, MoS values for Cd, Cr, and Pb in lotions and sunscreens were below 100 [2].
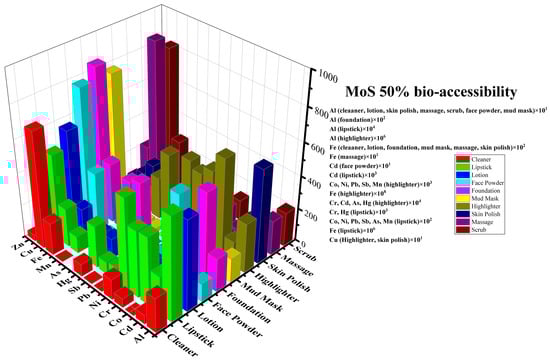
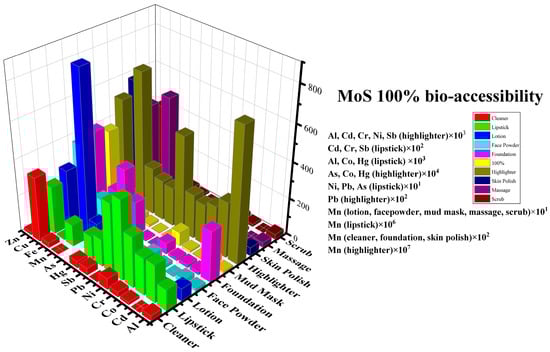
Figure 4.
MoS for metal(loid)s in cosmetic products at 50% and 100% bio-accessibility.
Hazard Quotient and Hazard Index
HQ results for Al at 50% and 100% were less than 1 for all cosmetic products, indicating no risk to consumers. The HQ for Cd was found to be >1 for cleaners, face powders, mud masks, massage creams, scrubs, and skin polish products at 50% and 100% bio-accessibility. At 50% and 100% bio-accessibility, the HQ was found to be less than 1 except the scrub and mud mask at 100% bio-accessibility. Ni and Pb HQ statistics revealed risk for every cosmetic sample except the lipstick, lotion, and highlighter at 100% bio-accessibility. At both bio-accessibility levels (50% and 100%), Hg, As, and Mn values were below 1 for lipstick, foundation, and highlighter, representing no non-cancer risks (Table 3). While all other samples were under the non-carcinogenic risk range (HQ > 1), the HI results for Fe in all cosmetics samples represented safe levels of non-cancer hazard (HQ < 1). The results of Cu for the 50% and 100% bio-accessibility scenarios showed no non-carcinogenic hazard index values in all samples (HQ < 1). The HI values for Zn were also above 1 in many samples, showing potential risks to consuming these products, with the exception of lipstick, lotion, and massage cream at 50% (Figure 5a), and lotion and massage cream at 100% bio-accessibility (Figure 5b).
Table 3.
HQ results of the metal(loid)s in cosmetic products at 50% and 100% bio-accessibility.

Figure 5.
HI results of the metal(loid)s in cosmetic products at (a) 50% and (b) 100% bio-accessibility.
These results can be compared to previous studies where, at 50% bio-accessibility, the HQ values for metals were significantly higher in lotion and sunblock samples, with values exceeding 1 for Cd, Cr, and Pb. In contrast, the HQ values were substantially less than 1 in samples of hair dye, foundation, whitening cream, and lipsticks. In agreement with the findings of this study, previously reported HQ levels for lotion at 50% and 100% bio-accessibility were both higher than 1 [2]. In the present investigation, all samples of cosmetics had HI values of more than one, indicating possible health hazards associated with metal exposure. These findings highlight the need for robust procedures for quality assurance and regulatory oversight to prevent the detrimental consequences of metal contamination in cosmetics. Hazard indices (HIs) for Pb, Mn, and Cr were less than 1, and As, Hg, Zn, and Fe were more than 1, according to a prior report on facial makeup powders [25]. Moreover, similar to this current study, HI levels for lotion were greater than 1 at both 50% and 100% bio-accessibility in previous research [2].
3.4.2. Carcinogenic Risk Evaluation
Lifetime Cancer Risk
Cr, Pb, Ni, and Cd are classified as carcinogenic metals by the International Agency for Research on Cancer [50]. The primary way these metals enter the body from cosmetics is through dermal absorption. These potentially toxic metal(loid)s are non-biodegradable, leading to their prolonged accumulation in the body. This accumulation can disrupt cell functions and intracellular mechanisms, increasing the risk of cancer-related diseases due to oxidative stress, DNA damage, and cell death [51]. The Lifetime LCR assesses the potential cancer risk for users exposed to metal(loid)s found in cosmetic products. According to USEPA guidelines, an acceptable LCR range is ≤1 × 10⁻³. LCR calculations were performed for cancer-causing metals (Al, Ni, Cr, Cu, As, Cd, and Pb) at 50% and 100% bio-accessibility levels, as detailed in Table 4.
Table 4.
Calculated LCR metal(loid)s in cosmetic products at 50% and 100% bio-accessibility.
At 50% bio-accessibility, the LCR value for Cu was found to be 1.15 × 10⁻² for lipstick, which is higher than the threshold value, raising the possibility of lifetime cancer risk. These findings are similar to previous studies, which calculated the lifetime cancer risk to be higher than the acceptable level and include cosmetics other than lipsticks [2]. In addition, it has been reported in a previous study that LCR for different facial cosmetic products was below 10−6, including for lipstick [25]. Moreover, it is also important to note that in a study on lipsticks collected from Europe and China, the calculated results on carcinogenic risk were very close to the US EPA safe range. So, the possible risk to the population of the habitual use of these products should not be underestimated [7]. The most probable reason for the lower carcinogenic risk of lipstick and highlighter is that these cosmetic products are applied on comparatively small area (lips = 4.8 cm2 and eyelashes = 3.2 cm2) in relatively small amount. However, these results are alarming and continuous use of these products over a long time period may cause cancer to the users.
4. Conclusions
In this study, the comprehensive analysis of various cosmetic products revealed significant variability in the concentrations of metal(loid)s. The metal(loid) contents in most of the cosmetic products under investigation followed the safe limits set by global guidelines such as FDA, EU, GCC, ASEAN, China, Canada, and Korea for cosmetics. The findings of the statistical models underscore the importance of understanding the sources and distributions of metal contaminants in cosmetics, which can originate from raw materials, manufacturing processes, and environmental sources. Moreover, the assessment of human health impacts, including non-carcinogenic risk evaluation and carcinogenic risk estimation, sheds light on the potential hazards associated with metal exposure through cosmetic use. The calculation of SED, MoS, HQ, and LCR provided valuable insights into the risks posed by metal(loid)s. While some products demonstrated levels within acceptable limits, others raised concerns about potential health hazards, particularly regarding dermal exposure. At 50% bio-accessibility, the LCR value for Cu was found to be 1.15 × 10⁻² for lipstick, which is higher than the threshold value, raising the possibility of lifetime cancer risk. Given the widespread use of cosmetics and the potential for prolonged exposure, regulatory agencies should enforce stricter guidelines to ensure the safety of cosmetic products. Additionally, manufacturers should prioritize the use of safer ingredients and transparent labeling practices to empower consumers to make informed choices regarding their cosmetic purchases. Continued monitoring and research into the presence and impact of metal(loid)s in cosmetics are essential for safeguarding public health and well-being.
Supplementary Materials
The following supporting information can be downloaded at: https://www.mdpi.com/article/10.3390/su16146127/s1, Table S1: Parameters for SED calculation. Table S2: Parameters of regression equation, detection limits and precision studies. Table S3: Measured and certified values of the elements in SRM 2709a. Table S4: PCA loading values of potentially toxic metal(loid)s in cosmetic products. Table S5: Eigenvalues of the correlation matrix and percentage variance from PCA report of potentially toxic metal(loid)s in cosmetic products.
Author Contributions
Conceptualization, writing—original draft, writing—review and editing, M.A. (Mahmood Ahmed); project administration, supervision, M.A. (Muhammad Ahmad); formal analysis, writing—original draft, A.S. (Aamir Sohail); formal analysis, investigation, M.S.; software, data curation, visualization, A.S. (Ahmad Saeed); validation, H.M.A.; validation, K.K.; validation, S.Q.; validation, funding acquisition, T.A.W.; validation, S.Z. All authors have read and agreed to the published version of the manuscript.
Funding
This research was funded by King Saud University, Riyadh Saudi Arabia.
Institutional Review Board Statement
Not applicable.
Informed Consent Statement
Not applicable.
Data Availability Statement
Data are contained within the article and Supplementary Materials.
Acknowledgments
The authors extend their appreciation to researchers supporting project number (RSP2024R357), and King Saud University, Riyadh Saudi Arabia for funding this research.
Conflicts of Interest
The authors declare no conflicts of interest.
References
- Hall, B.; Tozer, S.; Safford, B.; Coroama, M.; Steiling, W.; Leneveu-Duchemin, M.; McNamara, C.; Gibney, M. European consumer exposure to cosmetic products, a framework for conducting population exposure assessments. Food Chem. Toxicol. 2007, 45, 2097–2108. [Google Scholar] [CrossRef] [PubMed]
- Arshad, H.; Mehmood, M.Z.; Shah, M.H.; Abbasi, A.M. Evaluation of heavy metals in cosmetic products and their health risk assessment. Saudi Pharm. J. 2020, 28, 779–790. [Google Scholar] [CrossRef] [PubMed]
- Orisakwe, O.E.; Otaraku, J.O. Metal concentrations in cosmetics commonly used in Nigeria. Sci. World J. 2013, 2013, 959637. [Google Scholar] [CrossRef] [PubMed]
- Market, V.F. Global Opportunity Analysis and Industry Forecast, 2017–2023; Allied Market Research: Philadelphia, PA, USA, 2016. [Google Scholar]
- Massadeh, A.; El-Khateeb, M.; Ibrahim, S. Evaluation of Cd, Cr, Cu, Ni, and Pb in selected cosmetic products from Jordanian, Sudanese, and Syrian markets. Public Health 2017, 149, 130–137. [Google Scholar] [CrossRef] [PubMed]
- Bilal, M.; Mehmood, S.; Iqbal, H.M. The beast of beauty: Environmental and health concerns of toxic components in cosmetics. Cosmetics 2020, 7, 13. [Google Scholar] [CrossRef]
- Lara-Torres, S.; Figueiredo, D.; Paz, S.; Gutiérrez, A.J.; Rubio, C.; González-Weller, D.; Revert, C.; Hardisson, A. Determination and risk assessment of toxic metals in lipsticks from Europe and China. J. Trace Elem. Med. Biol. 2021, 67, 126792. [Google Scholar] [CrossRef] [PubMed]
- Maxwell, G.; Aleksic, M.; Aptula, A.; Carmichael, P.; Fentem, J.; Gilmour, N.; MacKay, C.; Pease, C.; Pendlington, R.; Reynolds, F. Assuring consumer safety without animal testing: A feasibility case study for skin sensitisation. Altern. Lab. Anim. 2008, 36, 557–568. [Google Scholar] [CrossRef] [PubMed]
- Centers for Disease Control and Prevention. Second national Report on Human Exposure to Environmental Chemicals. 2003. Available online: https://cfpub.epa.gov/si/si_public_record_Report.cfm?Lab=NCEA&dirEntryID=58071 (accessed on 3 February 2024).
- Loretz, L.; Api, A.M.; Barraj, L.; Burdick, J.; Davis, D.A.; Dressler, W.; Gilberti, E.; Jarrett, G.; Mann, S.; Pan, Y.L. Exposure data for personal care products: Hairspray, spray perfume, liquid foundation, shampoo, body wash, and solid antiperspirant. Food Chem. Toxicol. 2006, 44, 2008–2018. [Google Scholar] [CrossRef]
- Voica, C.; Iordache, A.; Roba, C.; Nechita, C. Determination of Toxic Elements in Facial Cosmetics from the Romanian Market and Their Health Risk Assessment. Anal. Lett. 2023, 56, 244–256. [Google Scholar] [CrossRef]
- Brandon, E.F.; Oomen, A.G.; Rompelberg, C.J.; Versantvoort, C.H.; van Engelen, J.G.; Sips, A.J. Consumer product in vitro digestion model: Bioaccessibility of contaminants and its application in risk assessment. Regul. Toxicol. Pharmacol. 2006, 44, 161–171. [Google Scholar] [CrossRef]
- Anissa, Z.; Sofiane, B.; Adda, A.; Marlie-Landy, J. Evaluation of trace metallic element levels in coffee by icp-ms: A comparative study among different origins, forms, and packaging types and consumer risk assessment. Biol. Trace Elem. Res. 2023, 201, 5455–5467. [Google Scholar] [CrossRef]
- Ingham, J.R.; Donati, G.L.; Douvris, L.; Bartzas, G.; Bussan, D.D.; Douvris, C. Commercially available mouthguards: Unearthing trace elements for the first time. Sci. Total Environ. 2024, 930, 172790. [Google Scholar] [CrossRef] [PubMed]
- Pereira, R.M.; Crizel, M.G.; Novo, D.L.R.; dos Santos, C.M.M.; Mesko, M.F. Multitechnique determination of metals and non-metals in sports supplements after microwave-assisted digestion using diluted acid. Microchem. J. 2019, 145, 235–241. [Google Scholar] [CrossRef]
- Uddin, A.H.; Khalid, R.S.; Alaama, M.; Abdualkader, A.M.; Kasmuri, A.; Abbas, S. Comparative study of three digestion methods for elemental analysis in traditional medicine products using atomic absorption spectrometry. J. Anal. Sci. Technol. 2016, 7, 6. [Google Scholar] [CrossRef]
- Ahmed, M.; Sanaullah, M.; Sarfraz, S.; Zahra, M.; Tanveer, M.; Sohail, A.; Qamar, S.; Ahmad, W.; Kundi, I.A.; Feroz, M. Essential and non-essential metals in coconut milk: Determination, chemometric analysis, and risk assessment study. J. Food Compos. Anal. 2024, 127, 105943. [Google Scholar] [CrossRef]
- Ahmed, M.; Shafqat, S.S.; Javed, A.; Sanaullah, M.; Shakoor, A.; Shafiq, M.I.; Shahzadi, S.K.; Wani, T.A.; Zargar, S. Exposure Assessment of Essential and Potentially Toxic Metals in Wheat-Based Sweets for Human Consumption: Multivariate Analysis and Risk Evaluation Studies. Molecules 2023, 28, 7365. [Google Scholar] [CrossRef] [PubMed]
- Ahmad, W.; Alharthy, R.D.; Zubair, M.; Ahmed, M.; Hameed, A.; Rafique, S. Toxic and heavy metals contamination assessment in soil and water to evaluate human health risk. Sci. Rep. 2021, 11, 17006. [Google Scholar] [CrossRef]
- Ahmad, W.; Zubair, M.; Ahmed, M.; Ahmad, M.; Latif, S.; Hameed, A.; Kanwal, Q.; Iqbal, D.N. Assessment of potentially toxic metal (loid) s contamination in soil near the industrial landfill and impact on human health: An evaluation of risk. Environ. Geochem. Health 2023, 45, 4353–4369. [Google Scholar] [CrossRef]
- Khaleeq, A.; Ahmed, M.; Huma, R.; Mujtaba, A.; Noor, S.; Rehman, R.; Sheikh, T.A.; Qamar, S.; Iqbal, D.N.; Alharthy, R.D. Evaluation of trace and heavy metals in different varieties of sauces to characterize their impact on human health. J. Food Compos. Anal. 2022, 114, 104789. [Google Scholar] [CrossRef]
- Shomar, B.; Rashkeev, S.N. A comprehensive risk assessment of toxic elements in international brands of face foundation powders. Environ. Res. 2021, 192, 110274. [Google Scholar] [CrossRef]
- Mathew, A.R.; Cavallucci, V.; Fidaleo, M. Altered vitamin B12 metabolism in the central nervous system is associated with the modification of ribosomal gene expression: New insights from comparative RNA dataset analysis. Funct. Integr. Genom. 2023, 23, 45. [Google Scholar] [CrossRef] [PubMed]
- Bernauer, U.; Bodin, L.; Chaudhry, Q.; Coenraads, P.J.; Dusinska, M.; Ezendam, J.; Gaffet, E.; Galli, C.L.; Granum, B.; Panteri, E.; et al. Opinion on the Safety of Aluminium in Cosmetic Products-Submission II; Publications Office of the European Union: Luxembourg, 2021. [Google Scholar]
- Saah, S.A.; Boadi, N.O.; Sakyi, P.O.; Darko, G.; Mensah, M.B. Risk of exposure to trace elements through the application of facial makeup powders. J. Chem. 2022, 2022. [Google Scholar] [CrossRef]
- Dinake, P.; Motswetla, O.; Kereeditse, T.T.; Kelebemang, R. Assessment of level of heavy metals in cosmetics. Toxicol. Res. Appl. 2023, 7, 23978473231156620. [Google Scholar] [CrossRef]
- Li, Y.; Liu, Z.; Zhang, Y.; Jiang, L.; Cai, Y.; Chen, X.; Zhou, X.; Li, H.; Li, F.; Zhang, J.; et al. Investigation and probabilistic health risk assessment of trace elements in good sale lip cosmetics crawled by Python from Chinese e-commerce market. J. Hazard. Mater. 2021, 405, 124279. [Google Scholar] [CrossRef] [PubMed]
- Miranzadeh, M.B.; Mostafaii, G.; Kafaei, R.; Rezvani Ghalhari, M.; Atoof, F.; Hoseindoost, G.; Karamali, F. Determination of heavy metals in cream foundations and assessment of their dermal sensitivity, carcinogenicity, and non-carcinogenicity. Int. J. Environ. Anal. Chem. 2023, 103, 1411–1423. [Google Scholar] [CrossRef]
- Kilic, S.; Kilic, M.; Soylak, M. The determination of toxic metals in some traditional cosmetic products and health risk assessment. Biol. Trace Elem. Res. 2021, 199, 2272–2277. [Google Scholar] [CrossRef] [PubMed]
- Halicz, L.; Portugal-Cohen, M.; Russo, M.Z.; Robino, F.; Vanhaecke, T.; Rogiers, V. Safety evaluation of traces of nickel and chrome in cosmetics: The case of Dead Sea mud. Regul. Toxicol. Pharmacol. 2015, 73, 797–801. [Google Scholar]
- Sani, A.; Gaya, M.B.; Abubakar, F.A. Determination of some heavy metals in selected cosmetic products sold in kano metropolis, Nigeria. Toxicol. Rep. 2016, 3, 866–869. [Google Scholar] [CrossRef] [PubMed]
- Iwegbue, C.M.; Bassey, F.I.; Obi, G.; Tesi, G.O.; Martincigh, B.S. Concentrations and exposure risks of some metals in facial cosmetics in Nigeria. Toxicol. Rep. 2016, 3, 464–472. [Google Scholar] [CrossRef]
- Sharma, G.; Gadhiya, J.; Dhanawat, M. Textbook of Cosmetic Formulations. 2018; Volume 901. Available online: https://www.researchgate.net/publication/325023106_Textbook_of_Cosmetic_Formulations (accessed on 1 February 2024).
- Matsui, M.S.; Carle, T.; Costa, M. The interaction of metals and the skin: The good, bad, and the ugly. In Handbook on the Toxicology of Metals; Elsevier: Amsterdam, The Netherlands, 2022; pp. 407–420. [Google Scholar]
- Borowska, S.; Brzóska, M.M. Metals in cosmetics: Implications for human health. J. Appl. Toxicol. 2015, 35, 551–572. [Google Scholar] [CrossRef]
- Radwan, A.; El-Sewify, I.M.; Azzazy, H.M.E.-S. Monitoring of cobalt and cadmium in daily cosmetics using powder and paper optical chemosensors. ACS Omega 2022, 7, 15739–15750. [Google Scholar] [CrossRef] [PubMed]
- Attard, T.; Attard, E. Heavy metals in cosmetics. In Environmental Impact and Remediation of Heavy Metals; IntechOpen Limited: London, UK, 2022. [Google Scholar]
- Lawi, D.J.; Abdulwhaab, W.S.; Abojassim, A.A. Potential health risks of Zn, Fe, and Pb in medical skin creams and cosmetic products derived from plants in Iraq. Biol. Trace Elem. Res. 2023, 201, 4167–4176. [Google Scholar] [CrossRef]
- Abendrot, M.; Kalinowska-Lis, U. Zinc-containing compounds for personal care applications. Int. J. Cosmet. Sci. 2018, 40, 319–327. [Google Scholar] [CrossRef] [PubMed]
- Alam, M.; Akhter, M.; Mazumder, B.; Ferdous, A.; Hossain, M.; Dafader, N.; Ahmed, F.; Kundu, S.; Taheri, T.; Atique Ullah, A. Assessment of some heavy metals in selected cosmetics commonly used in Bangladesh and human health risk. J. Anal. Sci. Technol. 2019, 10, 2. [Google Scholar] [CrossRef]
- Akhtar, A.; Kazi, T.G.; Afridi, H.I.; Khan, M. Human exposure to toxic elements through facial cosmetic products: Dermal risk assessment. Regul. Toxicol. Pharmacol. 2022, 131, 105145. [Google Scholar] [CrossRef]
- Ru, X.; Yang, L.; Shen, G.; Wang, K.; Xu, Z.; Bian, W.; Zhu, W.; Guo, Y. Microelement strontium and human health: Comprehensive analysis of the role in inflammation and non-communicable diseases (NCDs). Front. Chem. 2024, 12, 1367395. [Google Scholar] [CrossRef] [PubMed]
- Hahn, G.S. Strontium is a potent and selective inhibitor of sensory irritation. Dermatol. Surg. 1999, 25, 689–694. [Google Scholar] [CrossRef] [PubMed]
- Li, Y.; Fang, Y.; Liu, Z.; Zhang, Y.; Liu, K.; Jiang, L.; Yang, B.; Yang, Y.; Song, Y.; Liu, C. Trace metal lead exposure in typical lip cosmetics from electronic commercial platform: Investigation, health risk assessment and blood lead level analysis. Front. Public Health 2021, 9, 766984. [Google Scholar] [CrossRef]
- Al-Saleh, I.; Al-Enazi, S.; Shinwari, N. Assessment of lead in cosmetic products. Regul. Toxicol. Pharmacol. 2009, 54, 105–113. [Google Scholar] [CrossRef]
- Pietrini, F.; Passatore, L.; Carloni, S.; Massimi, L.; Astolfi, M.L.; Giusto, C.; Zacchini, M. Bismuth exposure affects morpho-physiological performances and the ionomic profile in garden cress (Lepidium sativum L.) plants. Front. Environ. Sci. 2023, 11, 1–12. [Google Scholar] [CrossRef]
- Abbas, H.H.; Sakakibara, M.; Sera, K.; Nurgahayu; Andayanie, E. Mercury exposure and health problems of the students using skin-lightening cosmetic products in Makassar, South Sulawesi, Indonesia. Cosmetics 2020, 7, 58. [Google Scholar] [CrossRef]
- Podgórska, A.; Puścion-Jakubik, A.; Grodzka, A.; Naliwajko, S.K.; Markiewicz-Żukowska, R.; Socha, K. Natural and conventional cosmetics—Mercury exposure assessment. Molecules 2021, 26, 4088. [Google Scholar] [CrossRef] [PubMed]
- Bernauer, U.; Bodin, L.; Chaudhry, Q.; Coenraads, P.; Dusinska, M.; Ezendam, J.; Gaffet, E.; Galli, C.; Panteri, E.; Rogiers, V. The SCCS Notes of Guidance for the Testing of Cosmetic Ingredients and Their Safety Evaluation-12th Revision-SCCS/1647/22; 2023. Available online: https://health.ec.europa.eu/publications/sccs-notes-guidance-testing-cosmetic-ingredients-and-their-safety-evaluation-12th-revision_en (accessed on 1 February 2024).
- Tarone, R.E. On the International Agency for Research on Cancer classification of glyphosate as a probable human carcinogen. Eur. J. Cancer Prev. 2018, 27, 82–87. [Google Scholar] [CrossRef]
- Ahmed, M.; Ahmad, M.; Khan, M.A.; Sohail, A.; Sanaullah, M.; Ahmad, W.; Iqbal, D.N.; Khalid, K.; Wani, T.A.; Zargar, S. Assessment of carcinogenic and non-carcinogenic risk of exposure to potentially toxic elements in tea infusions: Determination by ICP-OES and multivariate statistical data analysis. J. Trace Elem. Med. Biol. 2024, 84, 127454. [Google Scholar] [CrossRef] [PubMed]
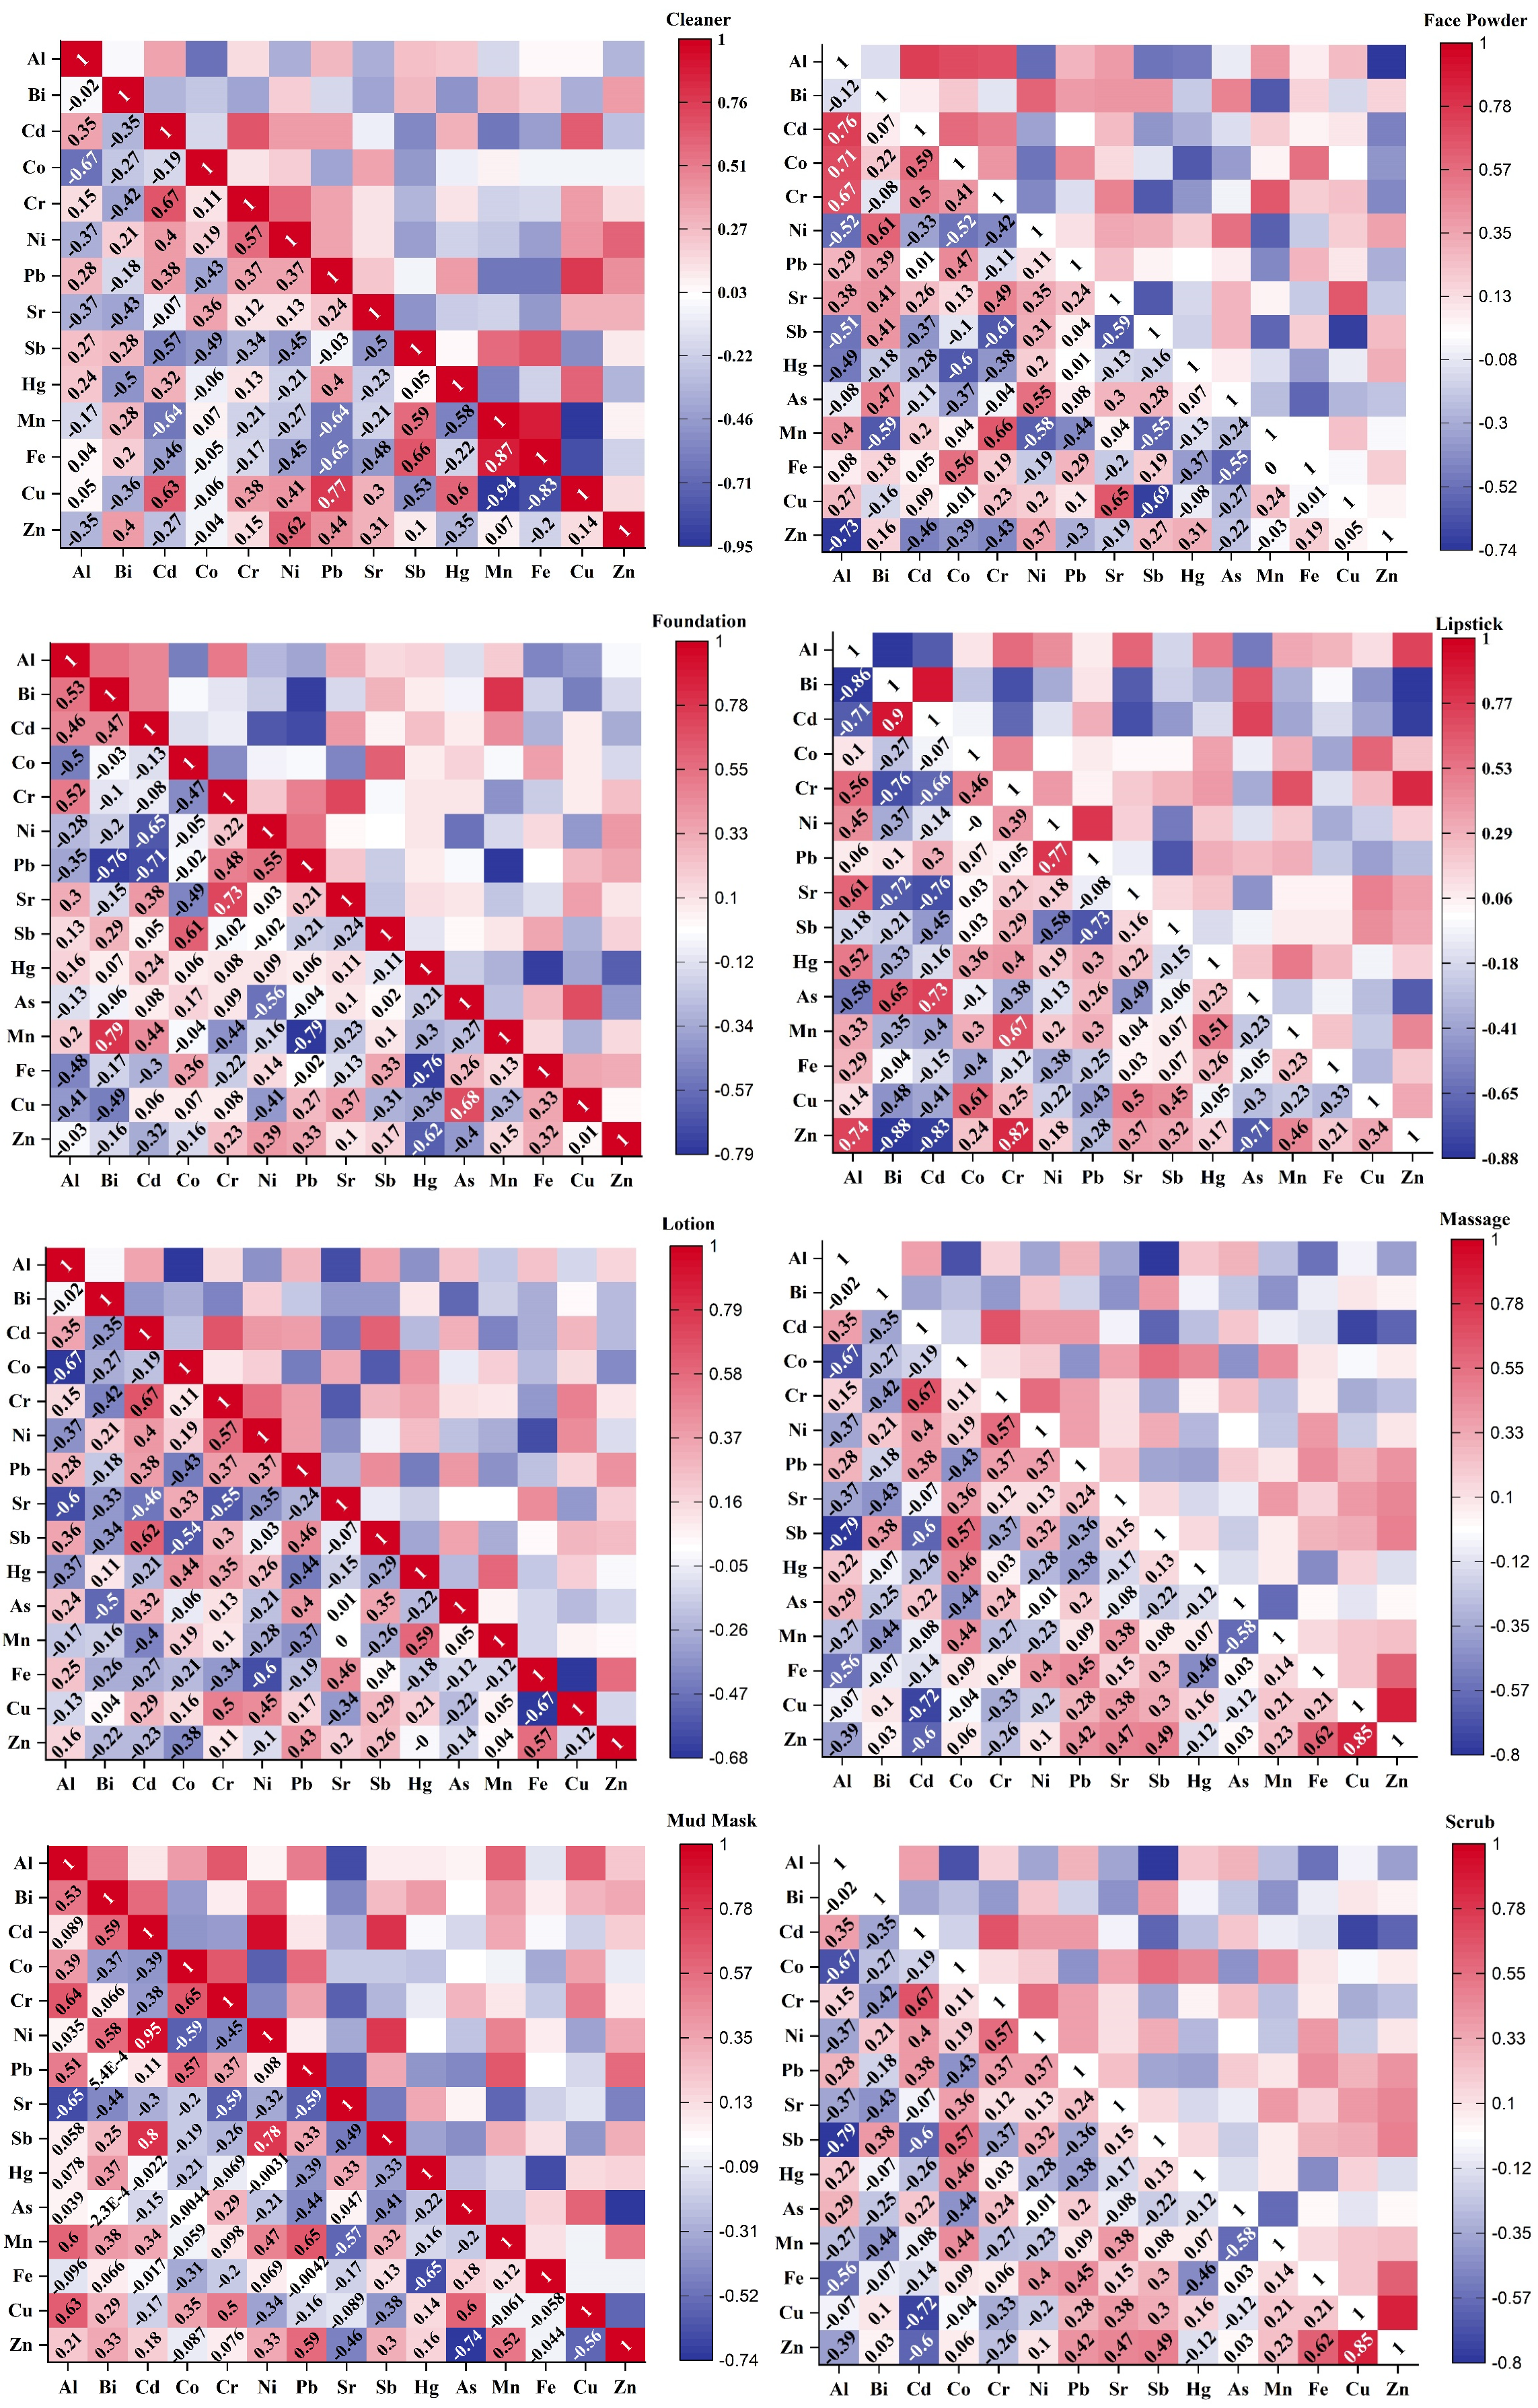
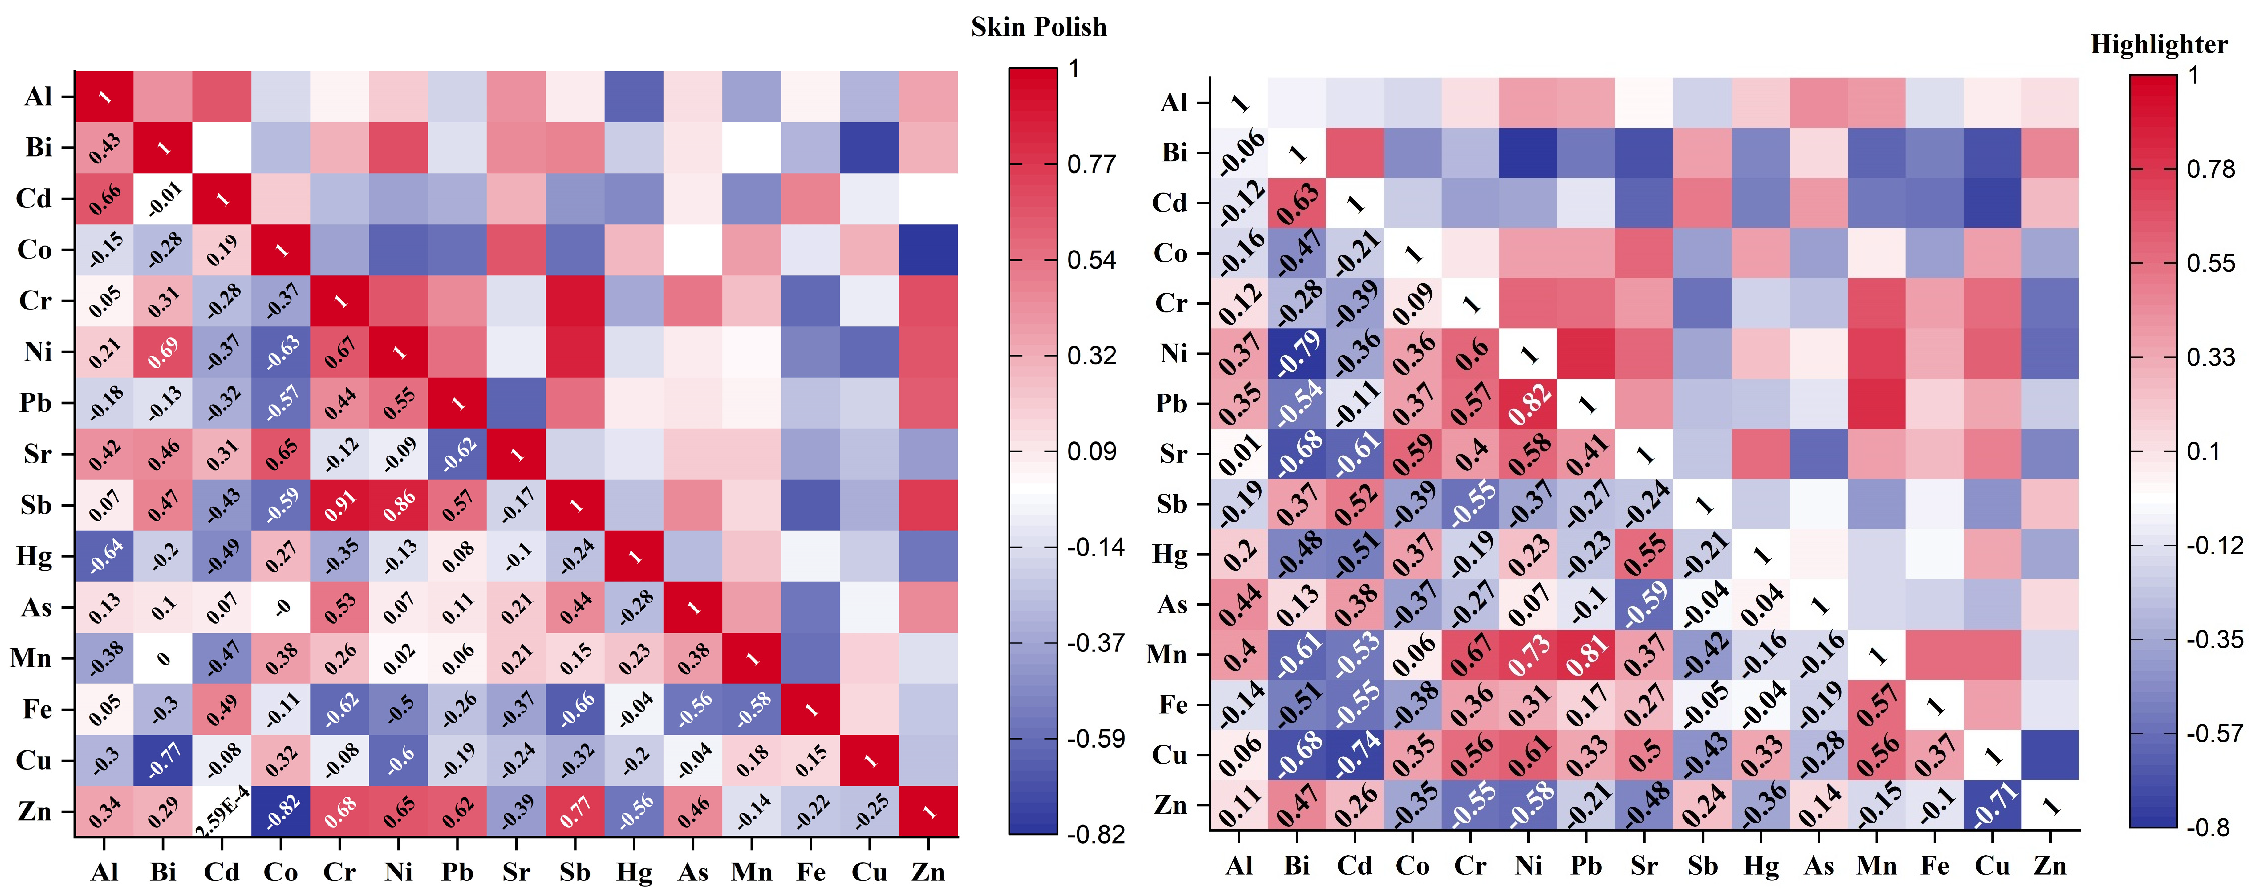
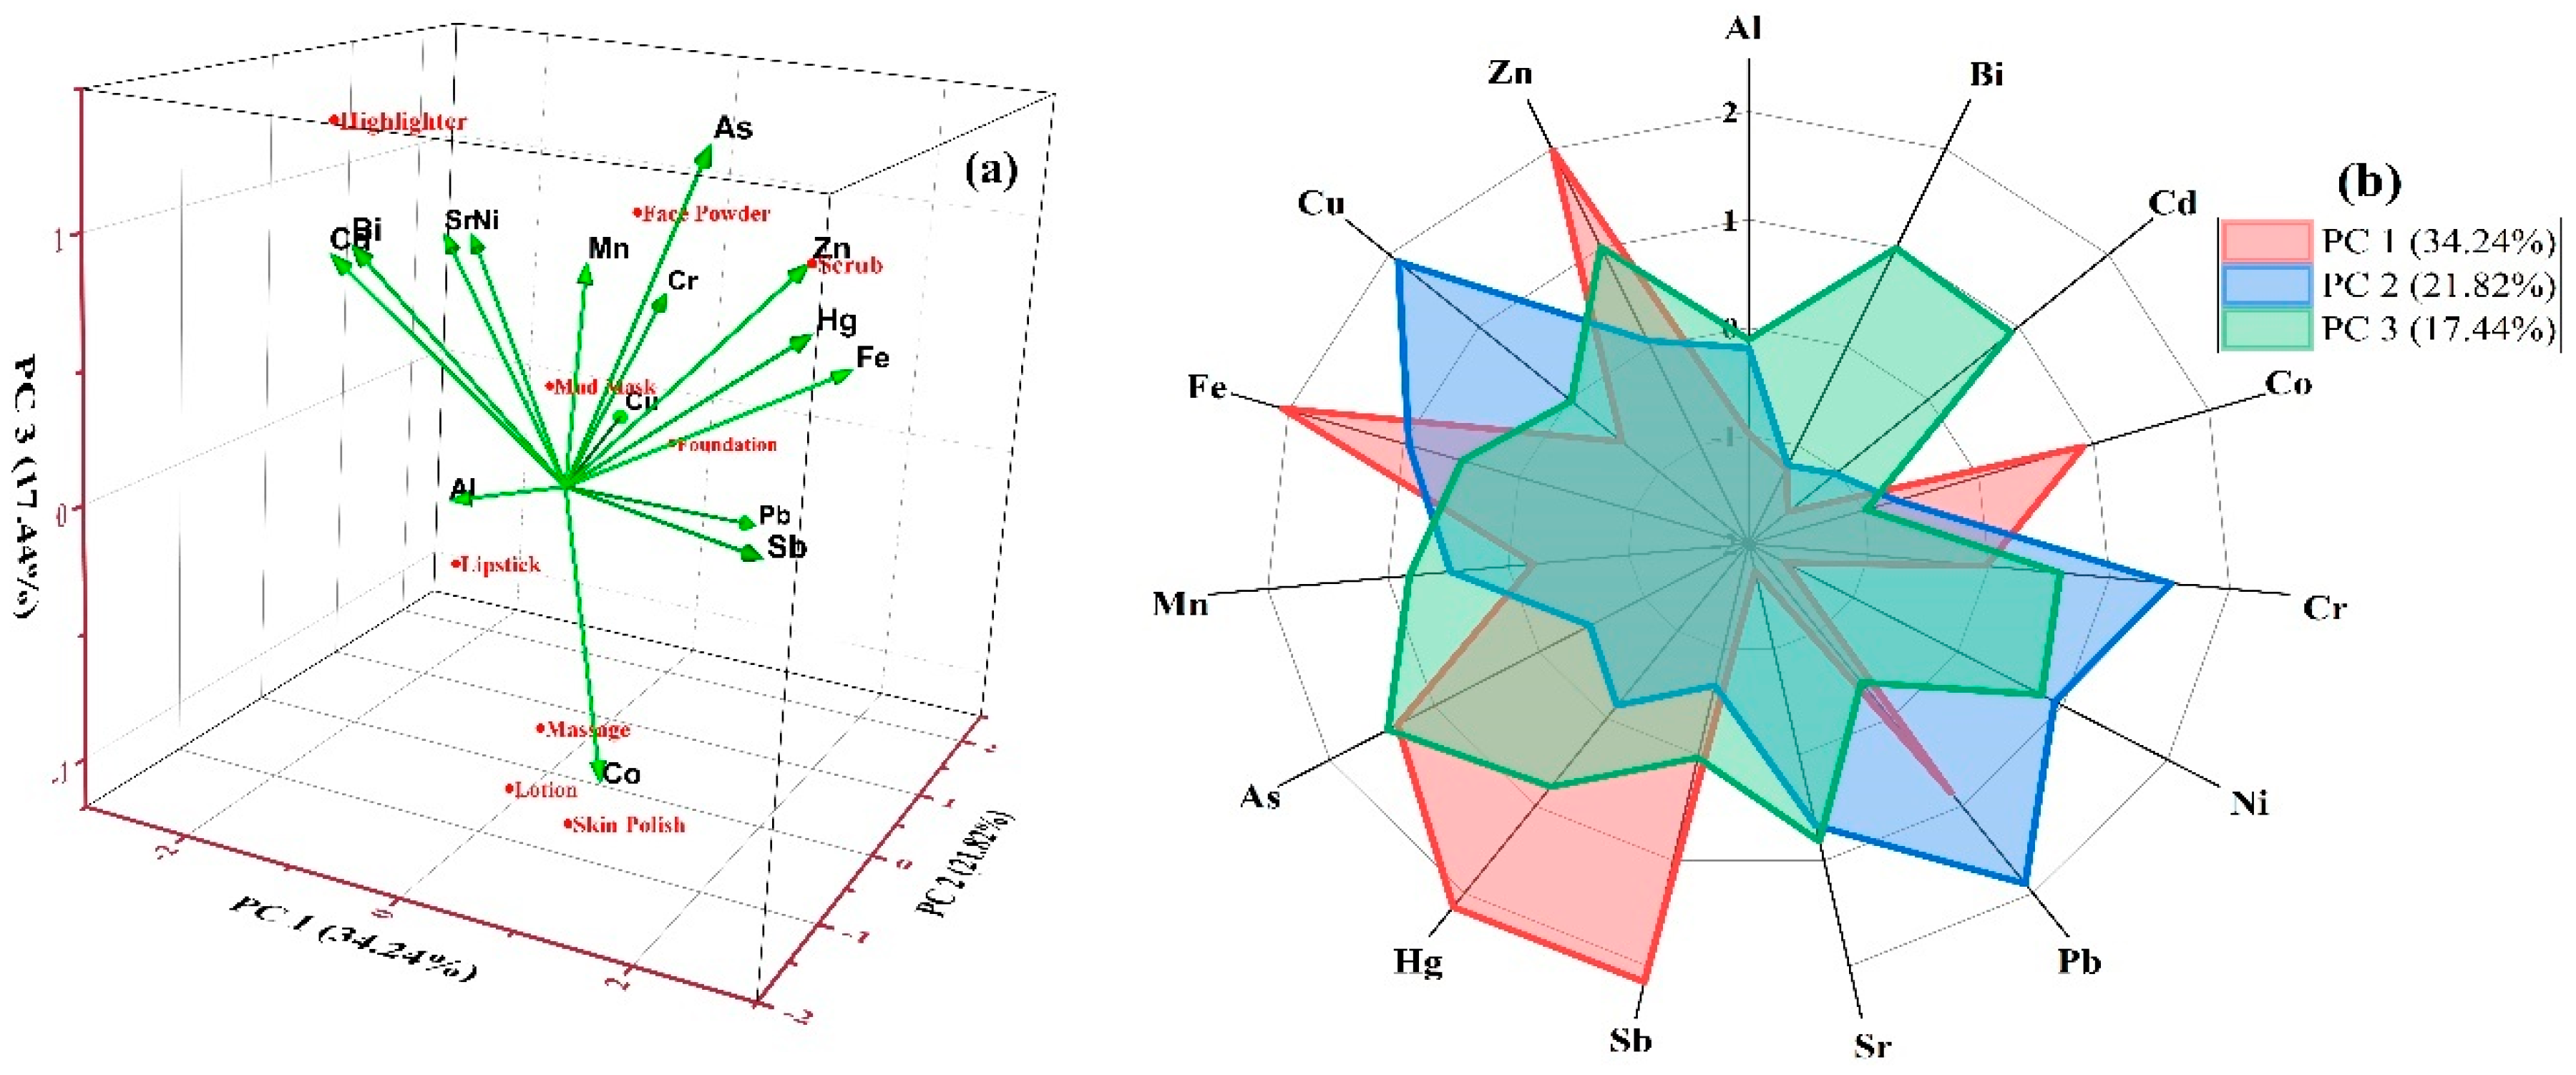
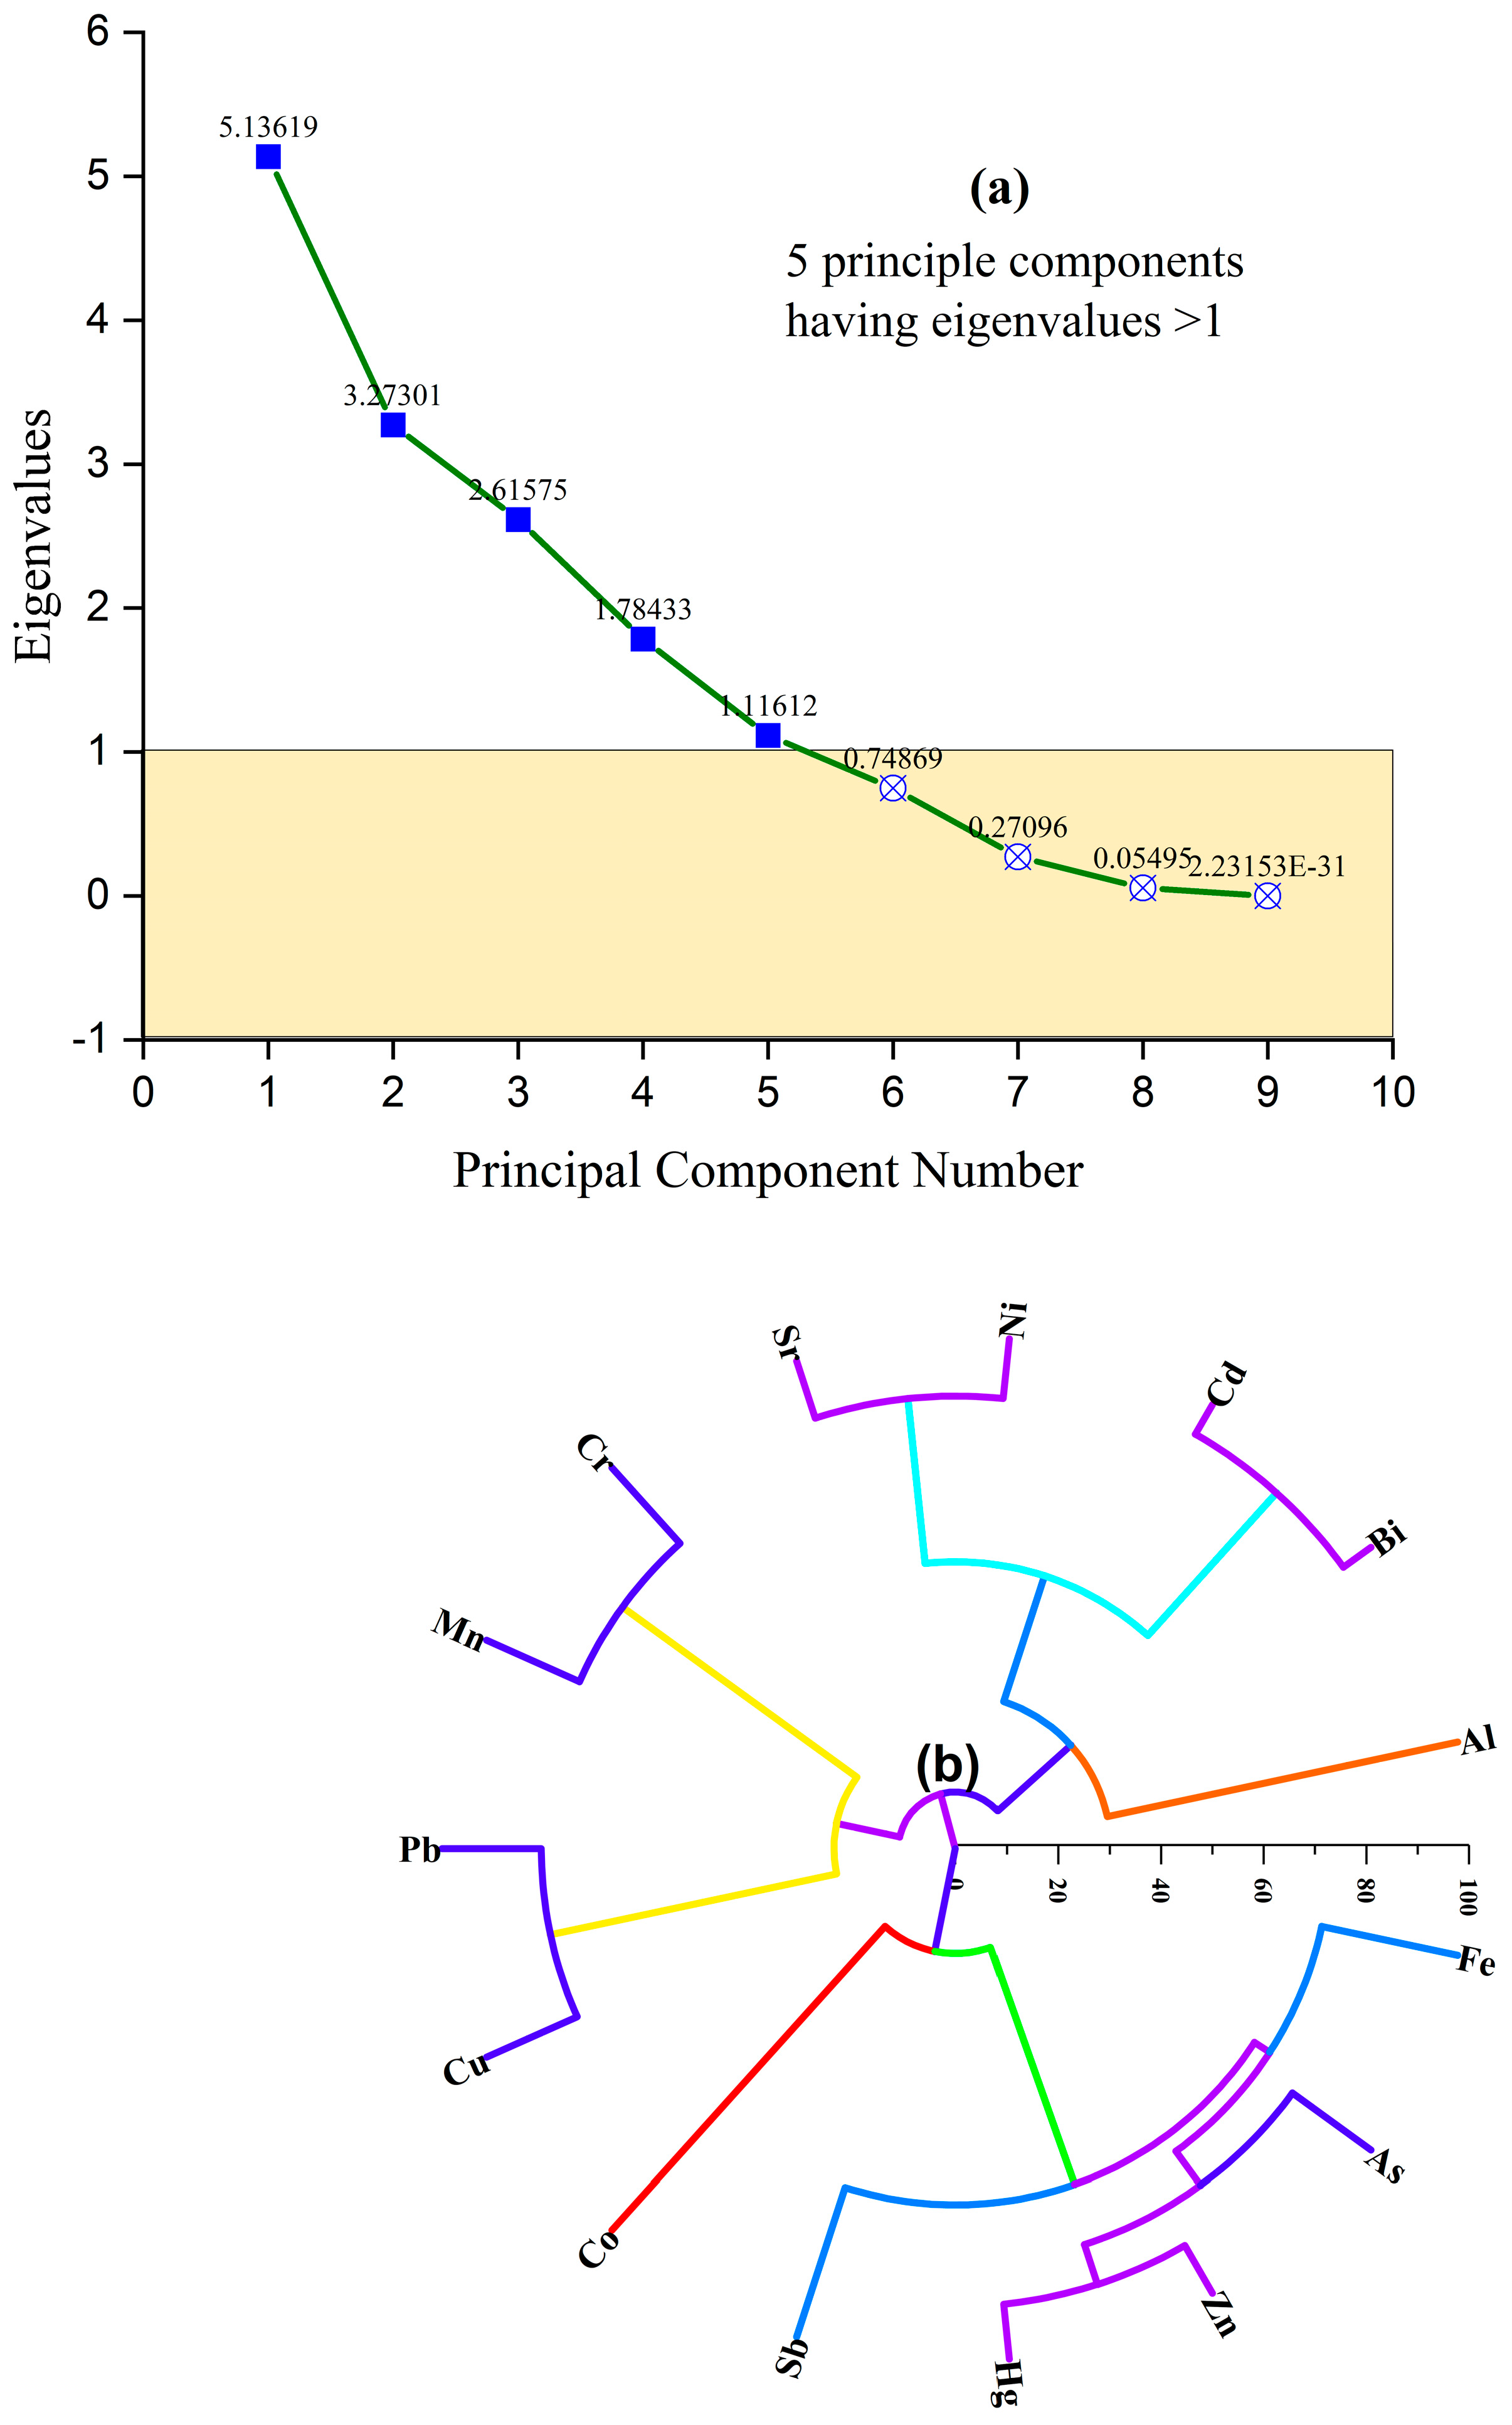


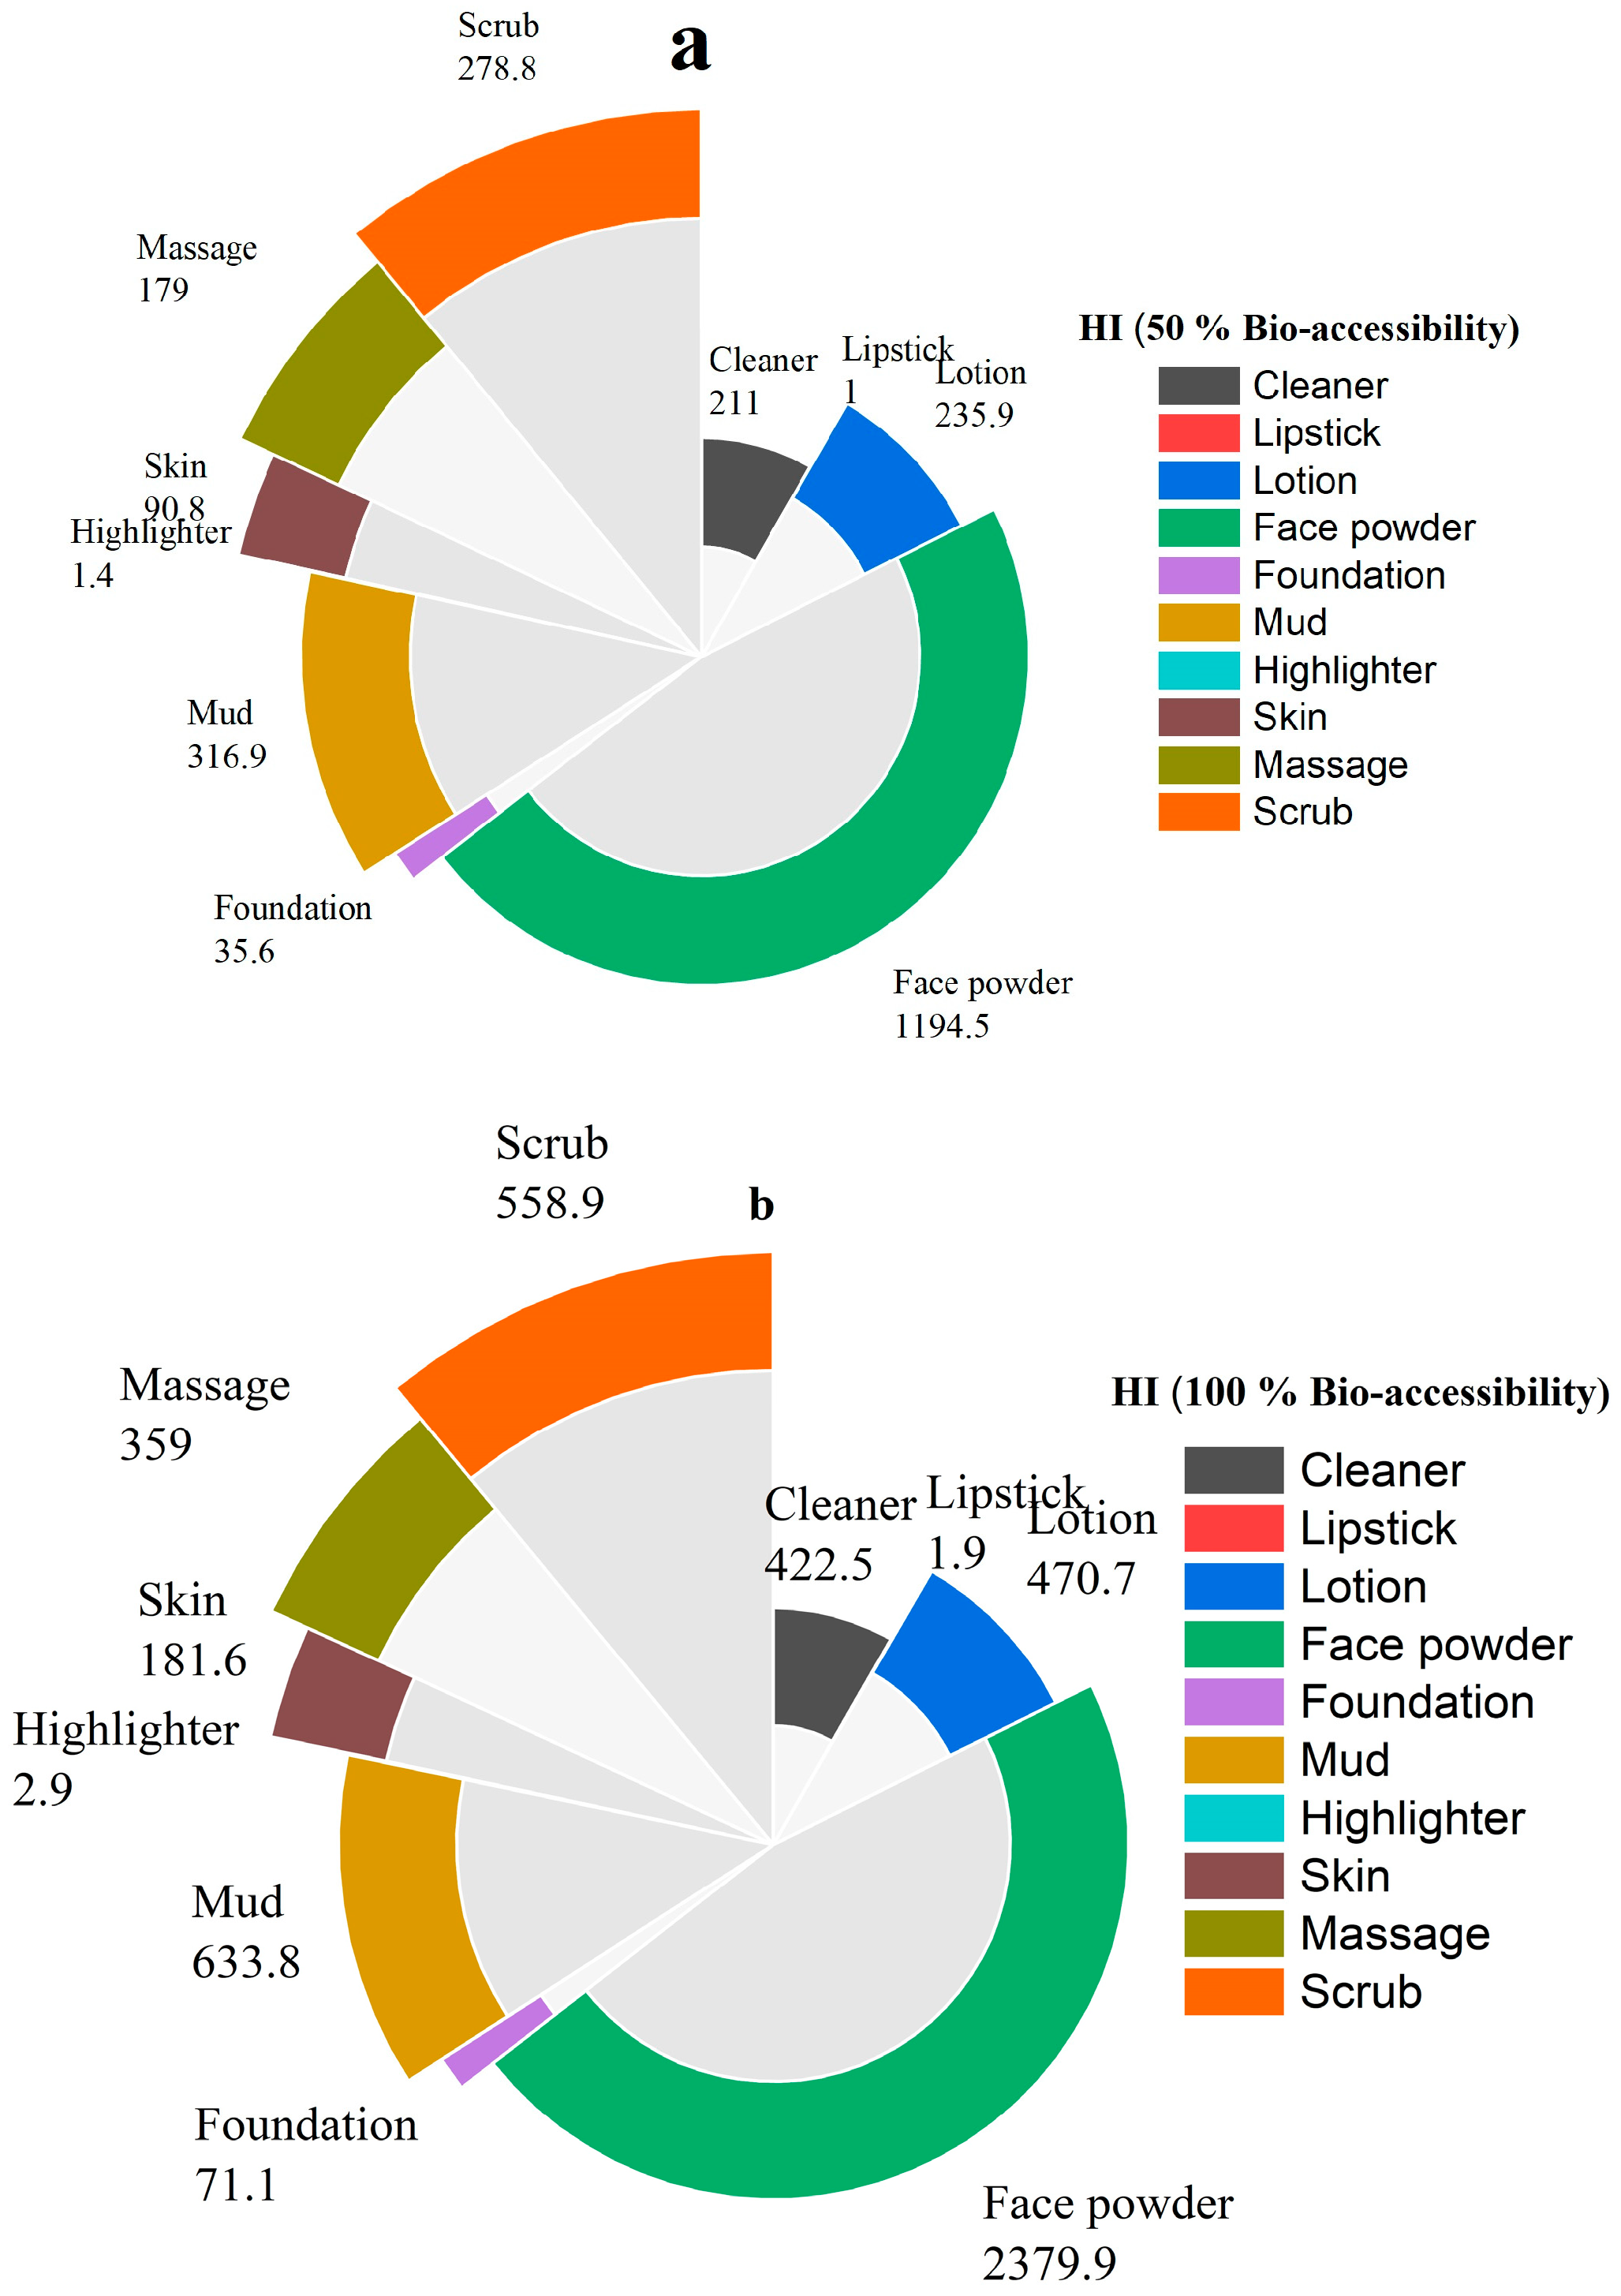
Disclaimer/Publisher’s Note: The statements, opinions and data contained in all publications are solely those of the individual author(s) and contributor(s) and not of MDPI and/or the editor(s). MDPI and/or the editor(s) disclaim responsibility for any injury to people or property resulting from any ideas, methods, instructions or products referred to in the content. |
© 2024 by the authors. Licensee MDPI, Basel, Switzerland. This article is an open access article distributed under the terms and conditions of the Creative Commons Attribution (CC BY) license (https://creativecommons.org/licenses/by/4.0/).