Article

A Quantitative Index for Evaluating Maize Leaf Wilting and Its Sustainable Application in Drought Resistance Screening

Institute of Grain Crops, Xinjiang Academy of Agricultural Sciences, Urumqi 830091, China
*
Authors to whom correspondence should be addressed.
Sustainability 2024, 16(14), 6129; https://doi.org/10.3390/su16146129
Submission received: 10 May 2024 / Revised: 14 July 2024 / Accepted: 15 July 2024 / Published: 18 July 2024

Abstract

:
Leaf wilting is one of the most intuitive morphological manifestations of plants under drought stress, and it is useful in drought resistance screening. However, existing quantitative leaf-wilting measurement methods lack simplicity and high-throughput capacity under field conditions, and there is a gap in the systematic drought resistance assessments. The present study was conducted in 2020, 2021, and 2022 using 100 inbred maize lines. The maize lines were subjected to three different water stress treatments: normal irrigation, moderate drought, and severe drought. The findings led to the design of a simplified image acquisition and processing platform for measuring the visible green leaf area. A new measurement index and quantitative formula for wilting have been proposed, which effectively reflect leaf wilting and facilitate a systematic analysis of the relationship between yield and drought resistance. The results showed that the daily variation pattern of the visible green leaf area followed a trend of wilting first and then recovery, with maximum wilting occurring at noon (14:00–16:00 local time). The period of maximum wilting throughout the entire growth stage was the flowering stage. The maize plants with leaf wilt exceeding 1/2 (wilt ratio > 0.5) during the flowering stage were all low-yielding or low-tolerance inbred lines. In conclusion, this study emphasizes that the flowering stage is crucial for monitoring leaf wilting and introduces a quick high-throughput method to quantify leaf wilting. Our findings not only provide details about key indicators for identifying drought and heat resistance but also facilitate research on sustainable screening methods in maize, which will expedite the selection and accelerate the breeding of new varieties.

1. Introduction

Maize (Zea mays) is one of the most widely planted and highest-yielding crops in the world, making it a crucial contributor to global food security [1]. As a C4 plant, maize exhibits high performance in terms of its light energy utilization efficiency [2]. With climate change and water resource constraints, research on maize’s resistance phenotypes against drought and other abiotic stresses has become important. Accurately quantifying stress phenotypes in maize leaves and identifying stress-specific traits are essential for breeding that can withstand these challenges, improving water management, and ensuring high crop yields. Wilting refers to the symptoms exhibited when plants cannot maintain their normal state due to changes in the internal and external pressure differences within their cell tissue. Wilting is caused by various stress factors, such as drought, waterlogging, high temperature, cold damage, and disease. Wilting is the most intuitive morphological manifestation of plant stress and occurs before permanent damage occurs. Therefore, it has significant value in evaluating plant resistance to drought, salinity, cold, heat, and disease.
Drought is a significant factor that limits the overall yield of field crops [3]. Adaptive responses to drought stress usually arise from physiological and morphological adjustments, and wilting is the first visible adaptive phenotypic change in plants [4]. On the one hand, by curling their leaves, plants can reduce the surface area exposed to the environment, thereby decreasing transpiration and water loss. This adaptive response helps plants maintain the water balance under stressful conditions and improves their survival ability. Many plants fold their leaves to reduce damage from excessive light radiation [5]. Studies have shown a clear correlation between light radiation levels and plant wilting. An appropriate level of light intensity facilitates the maintenance of the plant water balance and reduces the wilting severity [6]. On the other hand, plant leaf wilting and curling contribute to maintaining the internal water balance [7]. This may lead to the closure of the stomata, reducing transpiration and thus decreasing the entry of CO2 into cells, affecting photosynthesis. Prolonged wilting can lead to a reduced chlorophyll content [8], damaging the photosynthetic mechanism.
The use of the term “wilting” to evaluate plant drought resistance has a long history. Early on, scholars proposed the use of the wilting coefficient [9], but this coefficient represented soil moisture rather than morphological changes. In recent years, many scholars have conducted extensive research on phenotypic wilting, indicating a close relationship between leaf wilting and curling, plant drought resistance, and physiological mechanisms [10,11,12,13]. Severe drought conditions can lead to maize leaf rolling, affecting photosynthesis and reducing yield [14]. By capturing digital hemispherical photographs of the corn canopy structure during flowering under drought stress, Baret et al. found a close correlation between the leaf rolling score and the canopy structure changes [15]. Based on these findings, it was concluded that wilting may be a potential indicator of plant drought resistance.
Researchers have explored methods to measure wilting, but there are still relatively few mature methods available for practical applications. Leaf changes are the earliest observable wilting phenotypes. Early professionals used visual observation to assess leaf rolling, which required careful observation and judgment of the ratio of leaf curling. Usually, a rating of one to five is used for leaf rolling: one corresponds to no leaf rolling (the cross-section of the leaf is almost flat) and five represents the maximum leaf rolling when the cross-section of the leaf is completely rolled. O’Toole et al. used curling scores and curling indices to quantify leaf rolling [16,17]. This method for quantifying wilting relies heavily on empirical approaches, resulting in rough measurements that lack consistency among different individuals and species. Sirault et al. used a PEG solution to stress wheat leaves under saturated conditions in a laboratory setting. They quantified wilting by microscopically documenting the ratio of the change in the cross-sections of the leaves using computer vision and functional analysis to evaluate the curling ability of the leaves [18]. In another study, Rascio et al. developed a low-cost, semiautomated method to quantify leaf folding in wilting plants, focusing on wheat leaves, as a replacement for visual analysis [19].
However, these methods are relatively cumbersome and are not suitable for large-scale experiments. In recent years, digital imaging and image-processing techniques have gradually been applied to the study of leaf-wilting stages and mechanisms [20,21,22]. For instance, Han et al. used a DJI drone equipped with an RGB camera to acquire digital images for estimating maize plant height [23]. Ndlovu et al. utilized aerial vehicle multispectral images and machine-learning techniques to estimate maize leaf moisture indicators and assess their practicality [24]. In some advanced studies, a set of indicators based on color information from RGB images was developed to quantify plant wilting in tomato and soybean plants [25]. These studies provided technical references for high-throughput quantification of leaf wilting.
Currently, most wilting assessments are focused on leaf-based observations, with limited research linking wilting to crop yield and stress resistance, especially in the context of drought conditions. There is still a lack of a systematic approach, and further development is needed to extract and quantify leaf wilting digitally as a new indicator for identifying drought resistance. This study aimed to monitor the changes in the visible green leaf area using image-processing techniques to quantify the ratio of wilting. This study also established a link between the wilting ratio and yield and drought resistance, providing new evidence and sustainable methods for identifying drought resistance in maize.

2. Materials and Methods

2.1. Field Trials

Field trials were conducted in 2020, 2021, and 2022 at the Comprehensive Experimental Field of the Xinjiang Agricultural Sciences Academy (87.49 E, 43.95 N, altitude 590 m above sea level). The experimental site has a stable climate, with a mean daily temperature of 10–35 °C and precipitation of 50–70 mm during the maize-growing season from May to October. High temperature and drought conditions coincide in July and August, with an annual evaporation of 1500–1700 mm. The soil at the site is gray desert soils with moderate fertility [26].
Based on years of drought resistance identification, 100 varieties of maize with weak, moderate, and high drought resistance were selected for the 2020 and 2021 trials. The maize varieties were labeled XJ001-XJ100. In 2022, 10 varieties, namely, 006, 019, 022, 038, 078, 081, 095, PH4CV, PH6WC, and Zheng 58, with significant differences in leaf wilting and curling were selected (Table 1).
The experiment was conducted using drip irrigation with mulching. The plastic mulch used was a transparent polyethylene film with a thickness of 10 μm. The width of the mulch sheet was 0.7 m, and the gaps between the films were maintained at a spacing of 0.4 m. Subsurface drip irrigation under polyethylene mulch was followed. The drip pipe had a diameter of 16 mm, a wall thickness of 0.2 mm, and a dripper spacing of 200 mm, with a dripper flow rate of 2.2 L/h. Two rows of plants were maintained, with an intra-row spacing of 0.4 m and an inter-row spacing of 0.7 m, resulting in an average row spacing of 0.55 m. Each row was 3 m long, and there was a 1 m long walking path between the rows. The experiment was set up in a double-row planting configuration with two repetitions. The method of on-demand irrigation management was adopted to monitor the soil moisture and crop water demand in real time and set the irrigation thresholds for irrigation. Three water treatments were applied: normal irrigation (100%), moderate drought (50%), and severe drought (0%) (Table 2). Under the normal irrigation (100%) treatment, the single irrigation volume was 50 m3/666.7 m2. Under the moderate drought (50%) treatment, the single irrigation volume was 25 m3/666.7 m2, and under the severe drought (0%) treatment, only an initial irrigation volume of 50 m3/666.7 m2 was applied, with no further irrigation until harvest.
To observe the significant differences in wilting, leaf phenotype measurements were taken under severe drought stress conditions in 2020 and 2021, starting from the jointing stage and covering the entire growth period. In 2020, readings were taken at 10 time points, with observations starting at 8 AM and taken every 2 h until 8 PM. In 2021, measurements were taken at 9 time points starting at 8 AM, with intervals of every 3 h until 8 PM. In 2022, the leaf phenotypes were measured at four time points under three water treatments: normal irrigation, moderate drought and severe drought. Each measurement began at 8 AM and was taken every 3 h until 8 PM. Agronomic traits such as the yield were measured using conventional methods.
Yield: Before harvesting, the numbers of effective plants in each plot were investigated. During harvesting, all the ears from each plot were collected, air-dried naturally, and then threshed and weighed. Simultaneously, the moisture content of the corn grains was determined by PM-8188, and the yield was converted from 14% grain moisture content.
The yield calculation formula is as follows:
Y = (A × (1 − W))/(B × (1 − 14%))
where
A: weight of air-dried grains (g);
B: number of effective plants;
W: measured grain moisture content.
Drought resistance coefficient (Dc) = (PS.T)/(PS.W)
where
PS.T: phenotypic value of inbred maize lines under drought stress;
PS.W: phenotypic value of the material under normal irrigation.

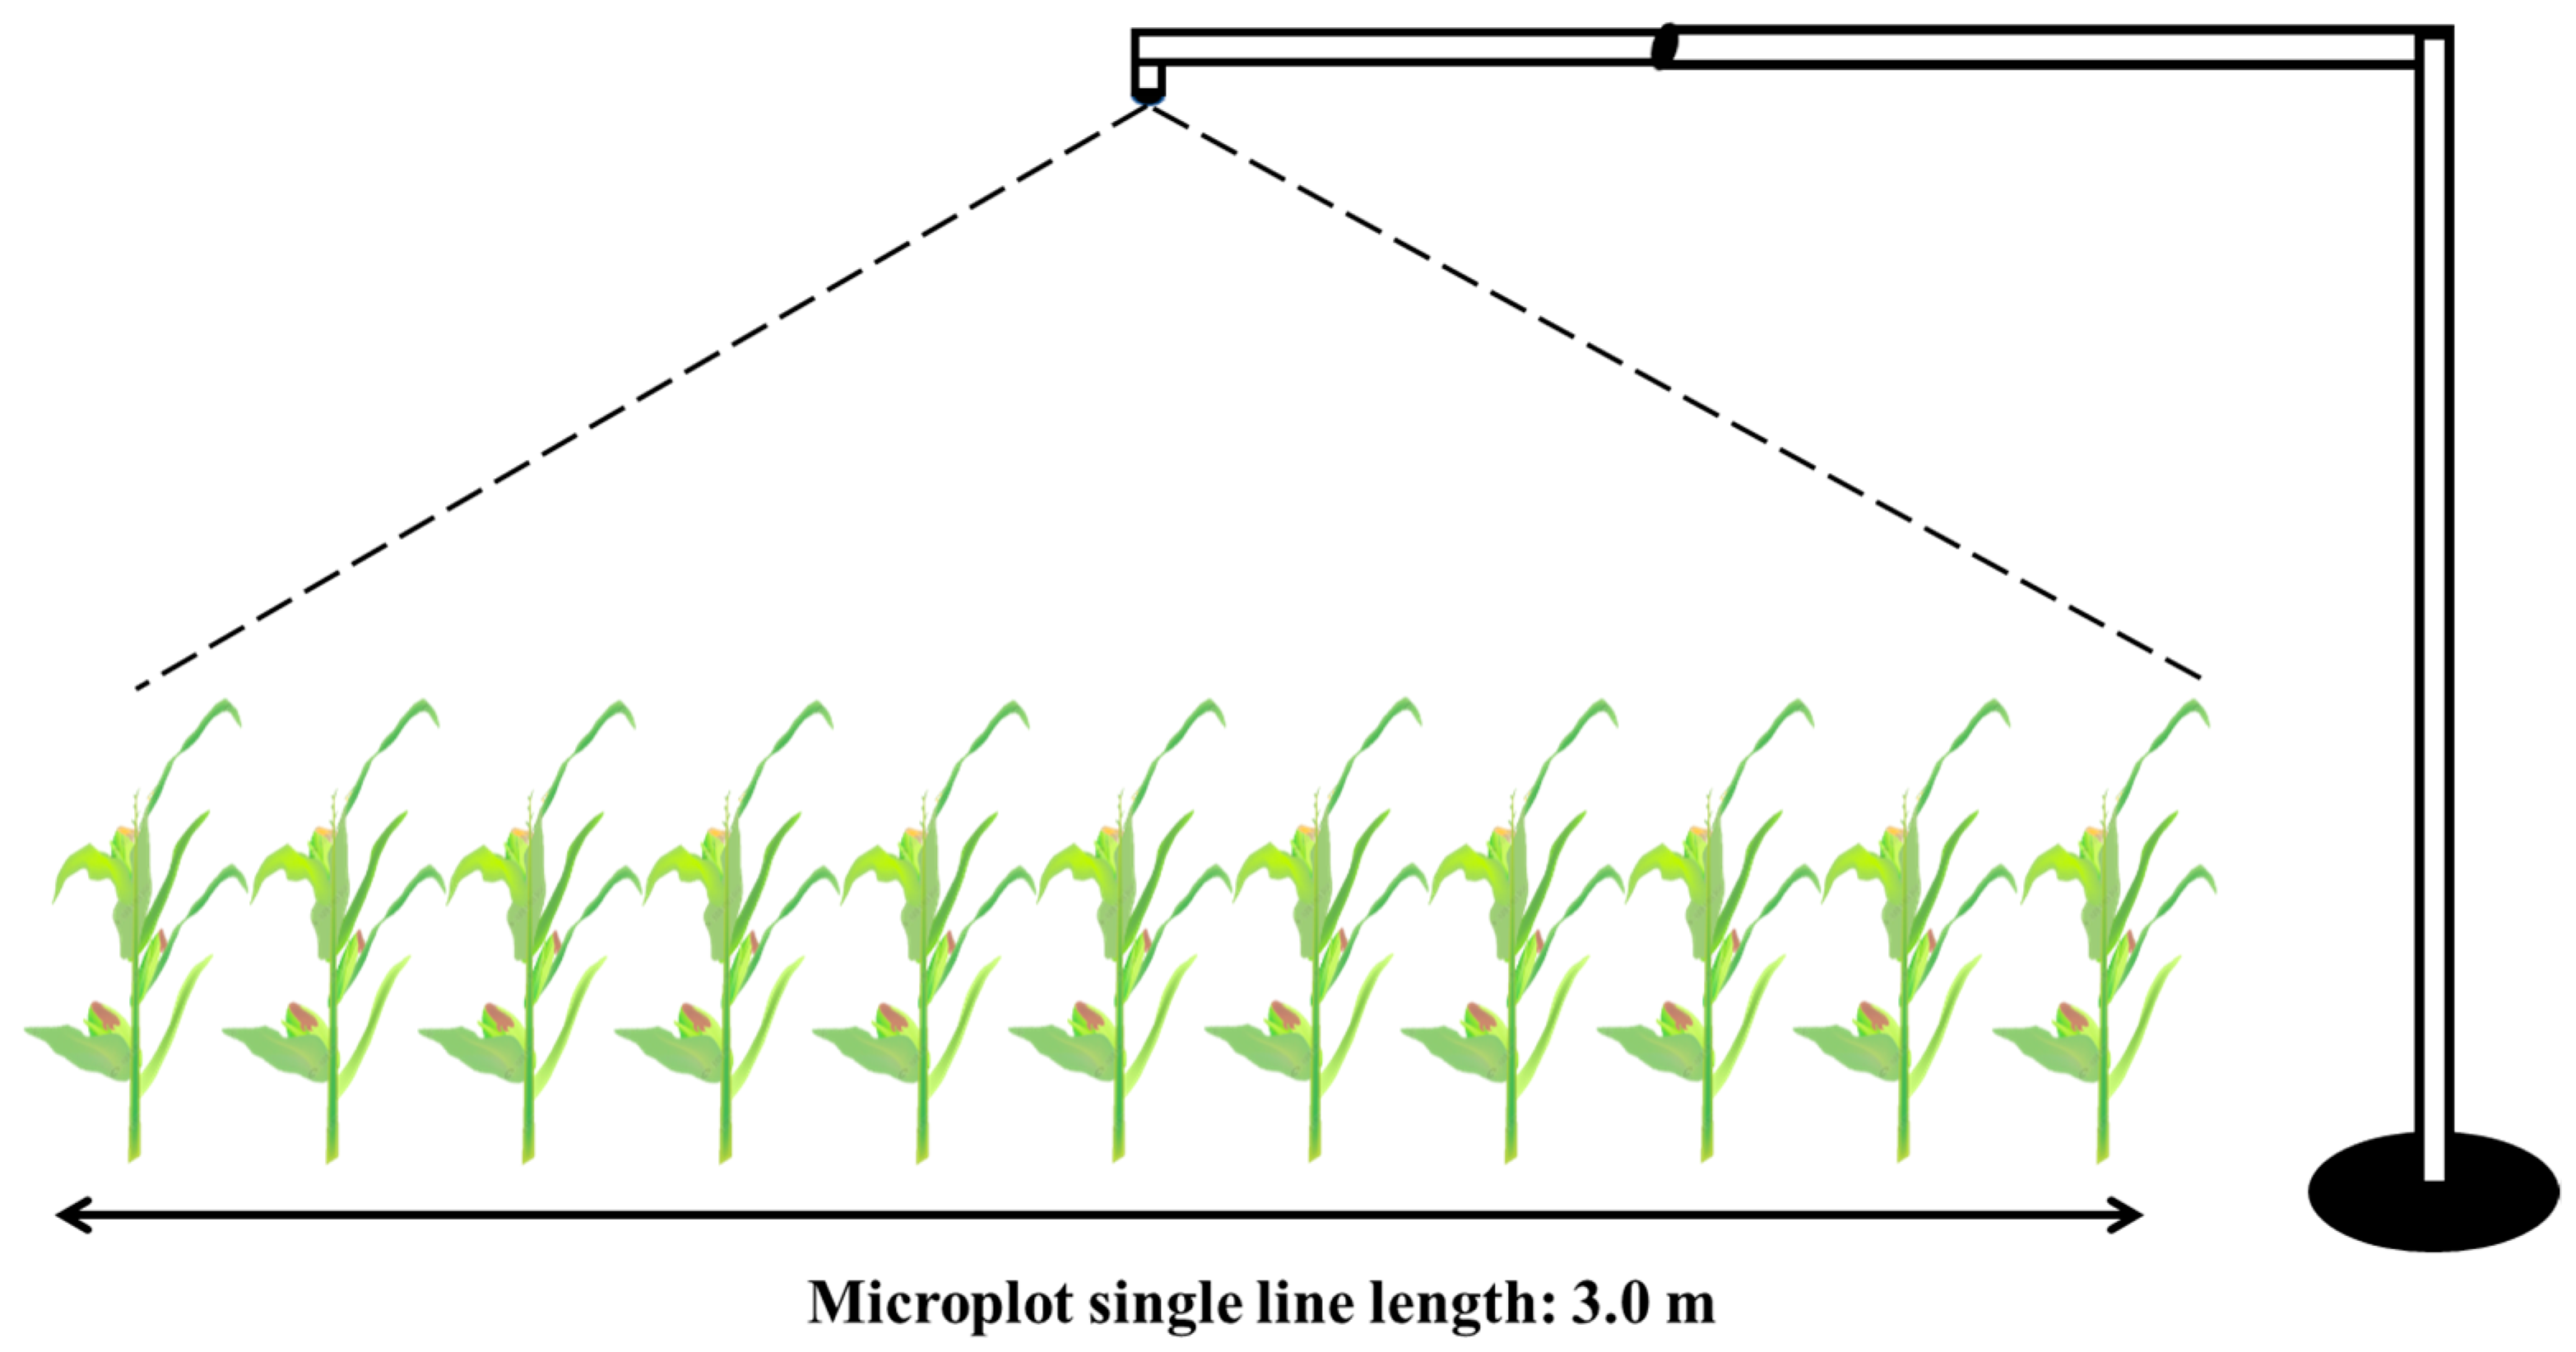
2.2. Design and Construction of the Image Acquisition Device

Imaging platforms used for phenotyping under field conditions have been widely adopted. However, their applicability during experiments is limited due to their high installation costs and vulnerability to terrain and environmental factors. This experiment aimed to address these issues by designing a simple and low-cost maize-phenotyping overhead image acquisition device. The setup mainly consisted of a vertically movable telescopic stand, a horizontally adjustable bracket, and an image acquisition camera (Sony WB500). A schematic diagram of the device is shown in Figure 1.
The vertically movable telescopic platform enabled the image acquisition module to move and capture images of the maize planting rows in the field environment. By adjusting the height of the platform, the maize planting rows were always maintained within the field of view of the imaging equipment. The horizontally adjustable bracket allowed the image acquisition module to be positioned directly overhead and centered on the maize planting rows by adjusting its length. Together, the vertically movable telescopic platform and the horizontally adjustable bracket ensured that the maize planting rows were centered parallel to the captured images. The camera could be any model that can connect wirelessly to a mobile phone or tablet, and the camera was operated using a mobile phone via a wireless network (Figure 2). This device was cost-effective, easy to operate, and required approximately 10–12 s for each capture, with the ability to capture 300–350 images per hour.

2.3. Image Processing

Image processing was carried out using self-developed software. The principles of the image processing and the specific operational steps are as follows.

2.3.1. Principle of Extracting Green Parts

The extraction of green parts in the image utilizes the HSV (Hue, Saturation, Value) color space in order to isolate the green leaf area. The Hue value for the green parts is 75–165 (Figure 3). The image was digitally processed to acquire the red, green, and blue primary color values of the pixels (R, G, B; values ranging from 0 to 255). The Hue value of the pixels was then calculated using the following formula:
Max = max (R, G, B); Min = min (R, G, B)
If Max = R, then H = (G − B)/(Max − Min)
If Max = G, then H = (B − R)/(Max − Min)
If Max = B, then H = (R − G)/(Max − min)
If H < 0 then Hue = H + 360 else Hue = H

2.3.2. Visible Green Area Ratio Calculation

The total number of pixels in an image refers to the product of the length and width of the image:
Total Pix = width × height
Green Pixel Count: Scanned all the pixels, calculated the RGB values of each pixel, converted them to Hue values, and counted the number of pixels with Hue values in the range of 75–165.
Visible green area ratio (GA) = Green Pix/Total Pix × 100 (%)

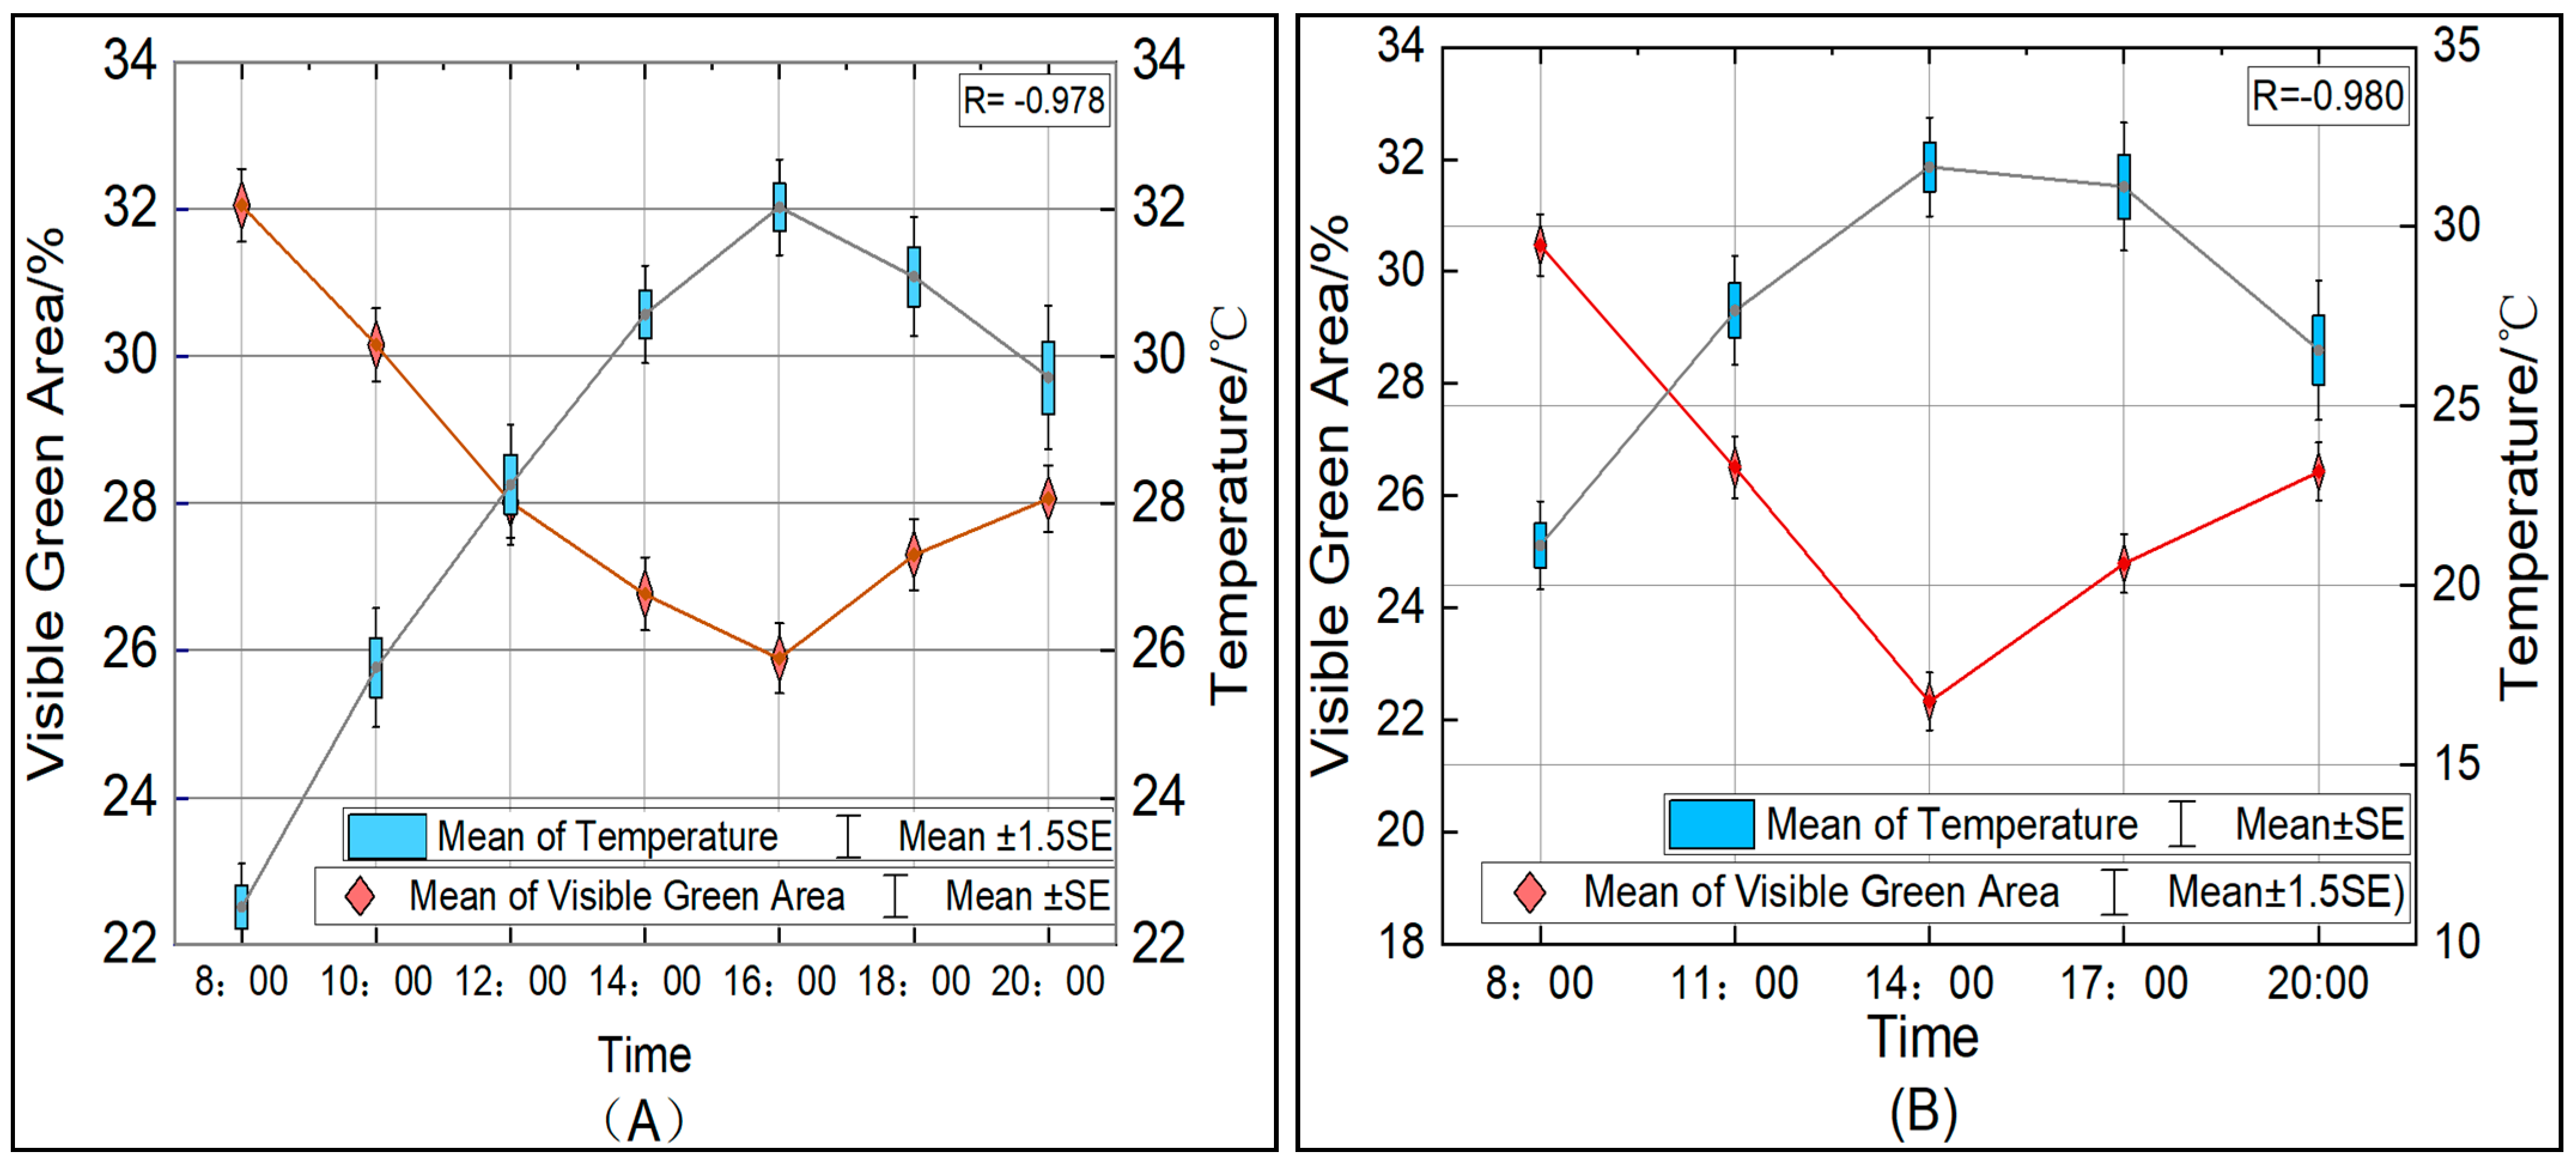
2.3.3. Effect of Light Intensity on Green Area Recognition

Photographs of the same leaf were taken and analyzed under midday strong light, weak shadow, and strong shadow conditions. The percentage deviation in the green image recognition and extraction was no greater than 3% (Figure 4), indicating that image processing using this software is minimally affected by midday strong light, weak shadow, and strong shadow conditions.

2.4. Leaf Wilting Ratio

This paper defines a computational indicator for measuring the ratio of leaf wilting curliness, known as the wilting ratio (Wr), which ranges from 0 to 1, with 0 indicating no wilting.
Wr (Wilting ratio) = (Amax − Amin)/Amax;
The Wr value range is 0 to 1, where Amax is the maximum visible green area, which appears in the morning, and Amin is the minimum visible green area, which appears at noon.

2.5. Data Processing

Statistical analysis of the data was performed using Statistica 14.0 (Tibco Software, Santa Clara, CA, USA) and Excel 2010 software (Microsoft, Redmond, WA, USA). Graphs were produced using Origin Pro 2021 (OriginLab Corporation, Northampton, MA, USA).

3. Results

3.1. Daily Changes in Visible Green Leaf Area

In 2020 and 2021, 100 inbred corn lines were subjected to severe drought treatment. The daily leaf changes of all the observed inbred lines exhibited similar wilting patterns (Figure 5). Starting from the first measurement in the early morning (8:00), when the leaves were fully expanded, the visible green area of the leaves gradually decreased as the temperature increased. By the time of the second measurement, the leaves began to curl, with significant differences in the curling ratio among the different inbred lines. During the noon hours (14:00–16:00), when the atmospheric temperature and solar radiation were at their peak, the wilting and curling of the leaves reached their maximum, and the visible green area was at its smallest. Subsequently, as the solar radiation and temperature stress decreased significantly, the leaves began to slowly unfold.

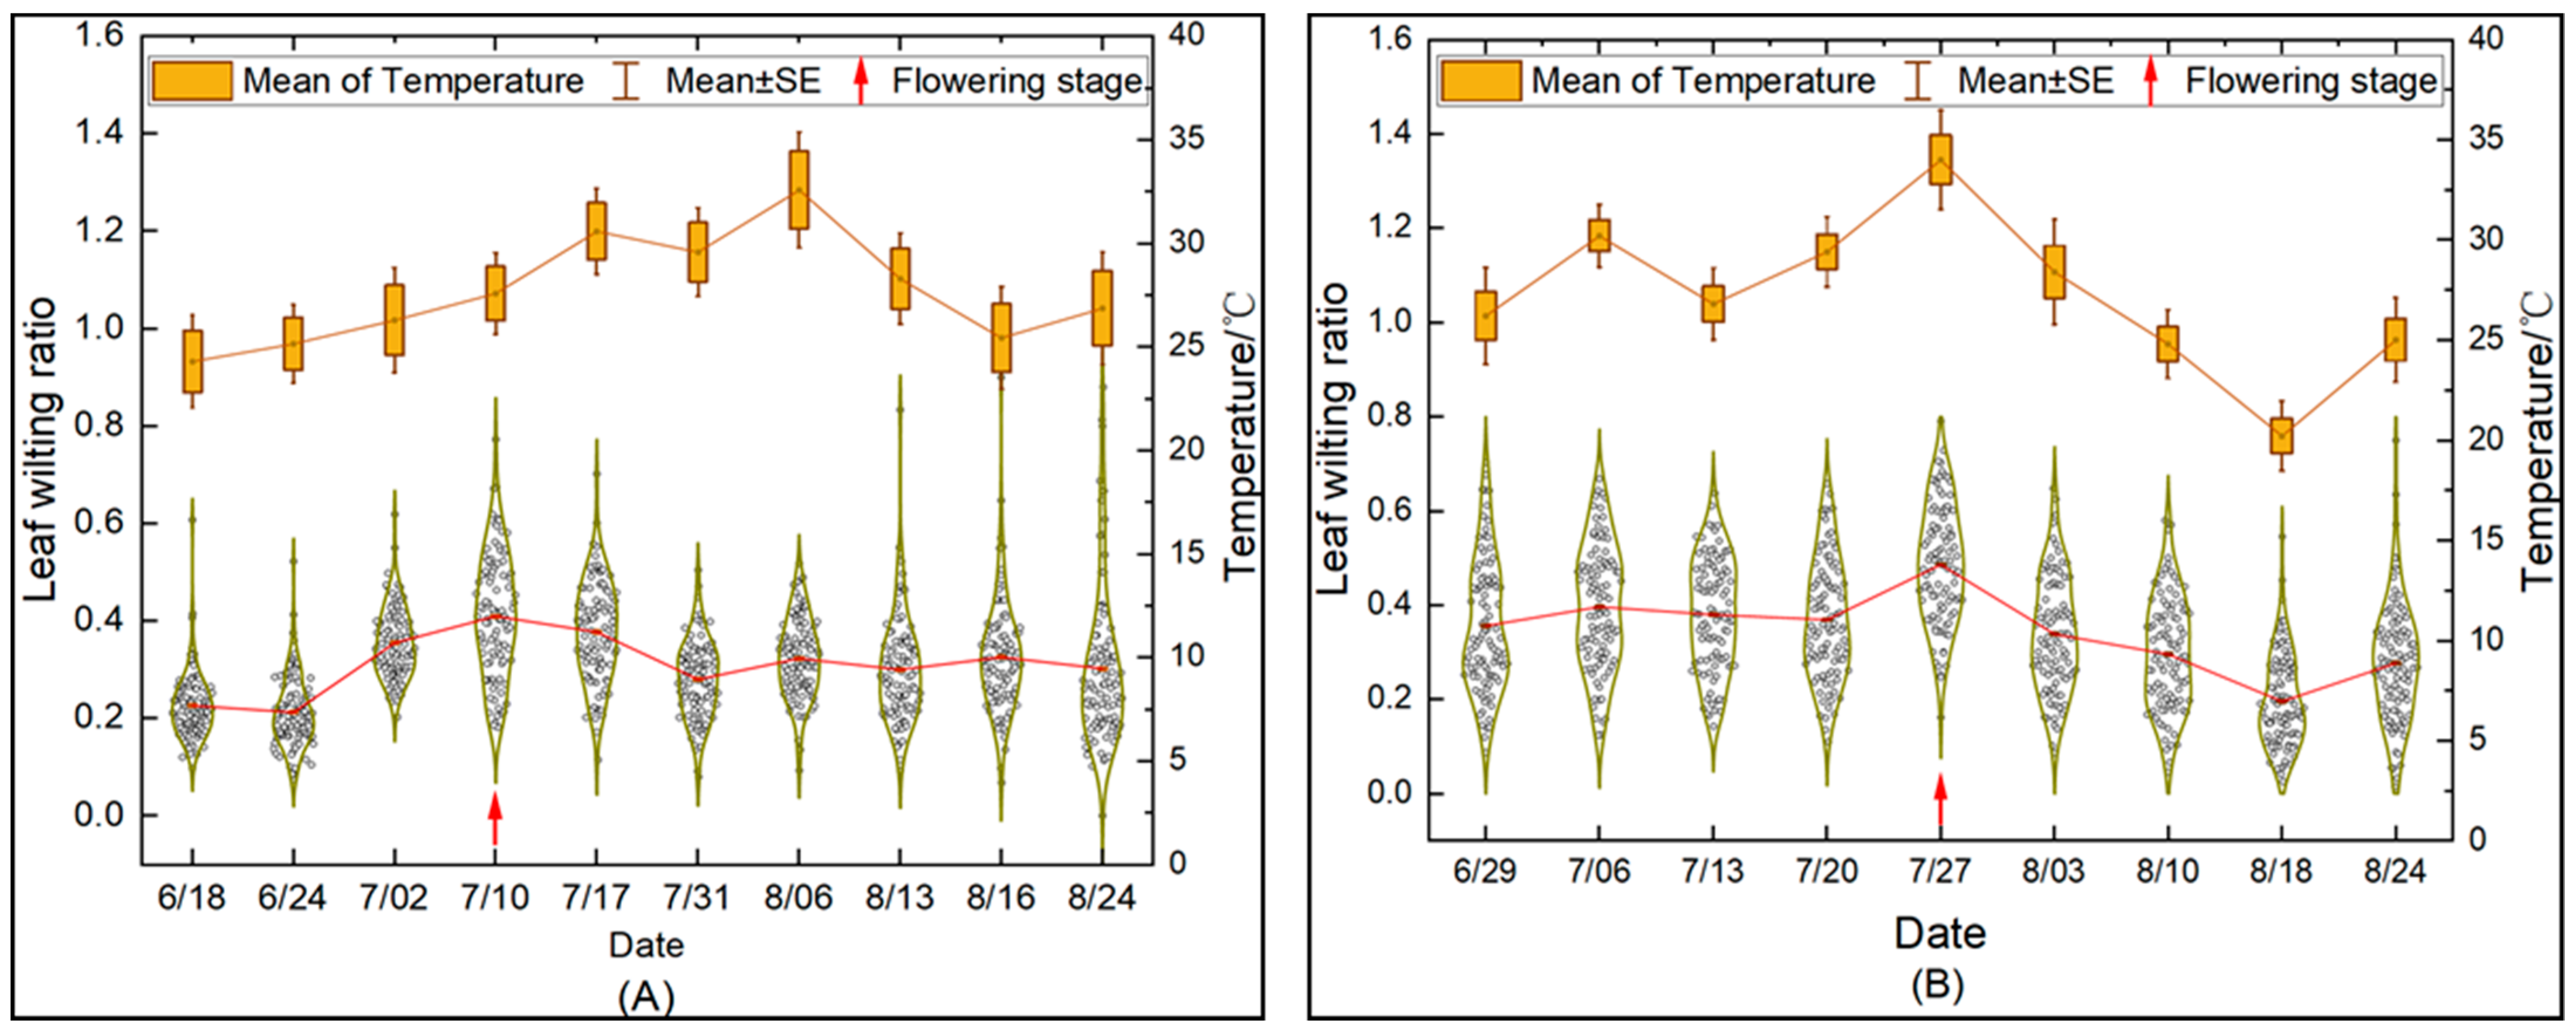
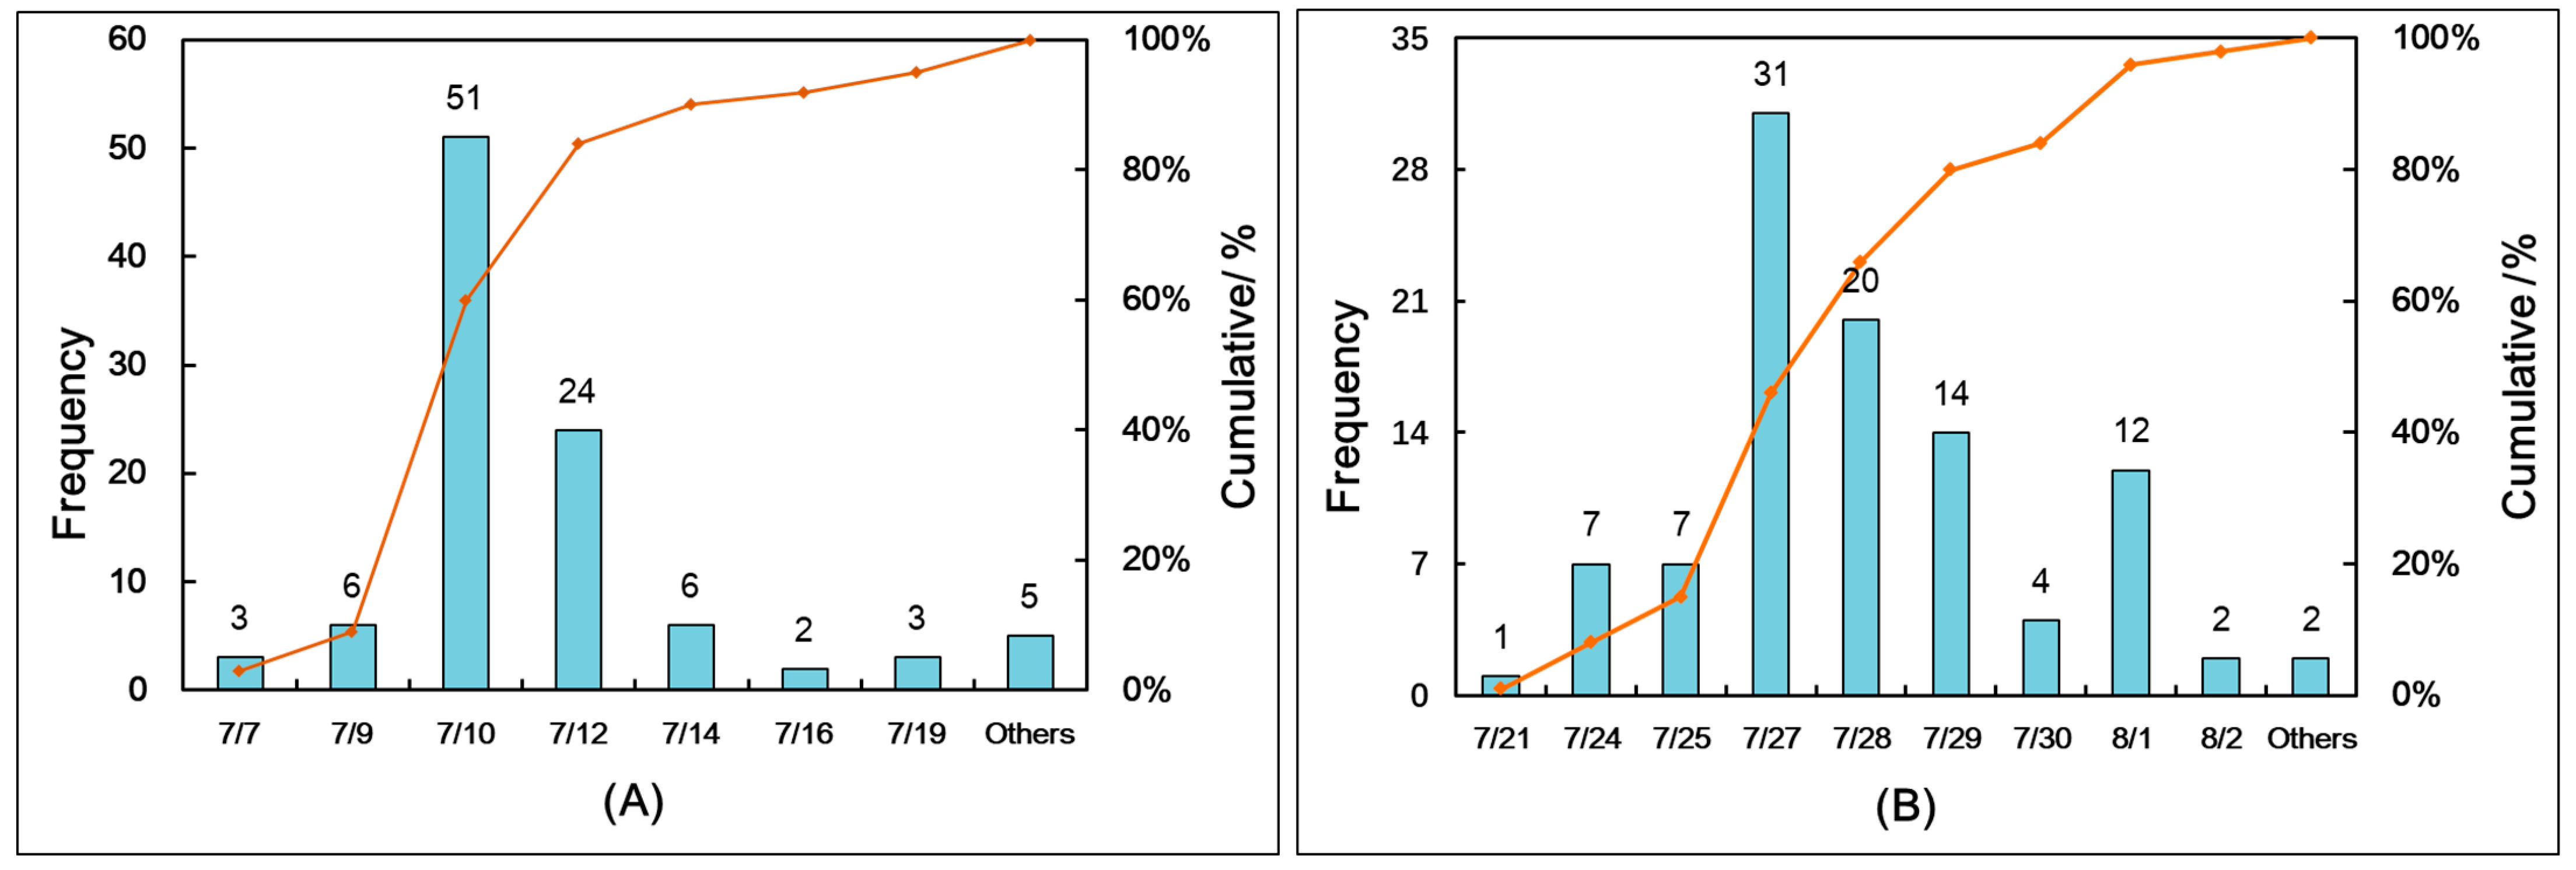
3.2. Changes in the Leaf Wilting Trend during the Entire Growth Period

The average daily temperatures for the entire wilting measurement period in 2020 and 2021 are presented in Table 3. The highest daily average temperature in 2020 occurred on 6 August, while in 2021 it occurred on 27 July. The extent of the leaf wilting in the 100 inbred maize lines over the entire growth period was measured in 2020 and 2021 (Figure 6), and the results showed that, from the perspective of the entire growth period, there was no strong correlation between leaf wilting and temperature, indicating that higher temperatures during the growth stage did not necessarily lead to more wilting. However, there was a strong correlation between leaf wilting and the water-sensitive period. The distribution of flowering periods for the 100 inbred maize lines in 2020 and 2021 is shown in Figure 7. The histogram corresponds to the left Y-axis, indicating the frequency of the flowering distribution; for the right Y-axis, the polyline represents the cumulative distributed frequencies. In 2020, 81% of the samples had flowering periods between 9 July and 12 July, while in 2021, 72% of the samples had flowering periods between 25 July and 29 July. In 2020, the maximum average leaf wilting occurred on 10 July, coinciding with the flowering period for most varieties. In 2021, due to delayed sowing, the maximum average leaf wilting during each growth stage was observed on 27 July. At this time, the daily average temperature was the highest, and approximately 72% of the materials were in the flowering stage.

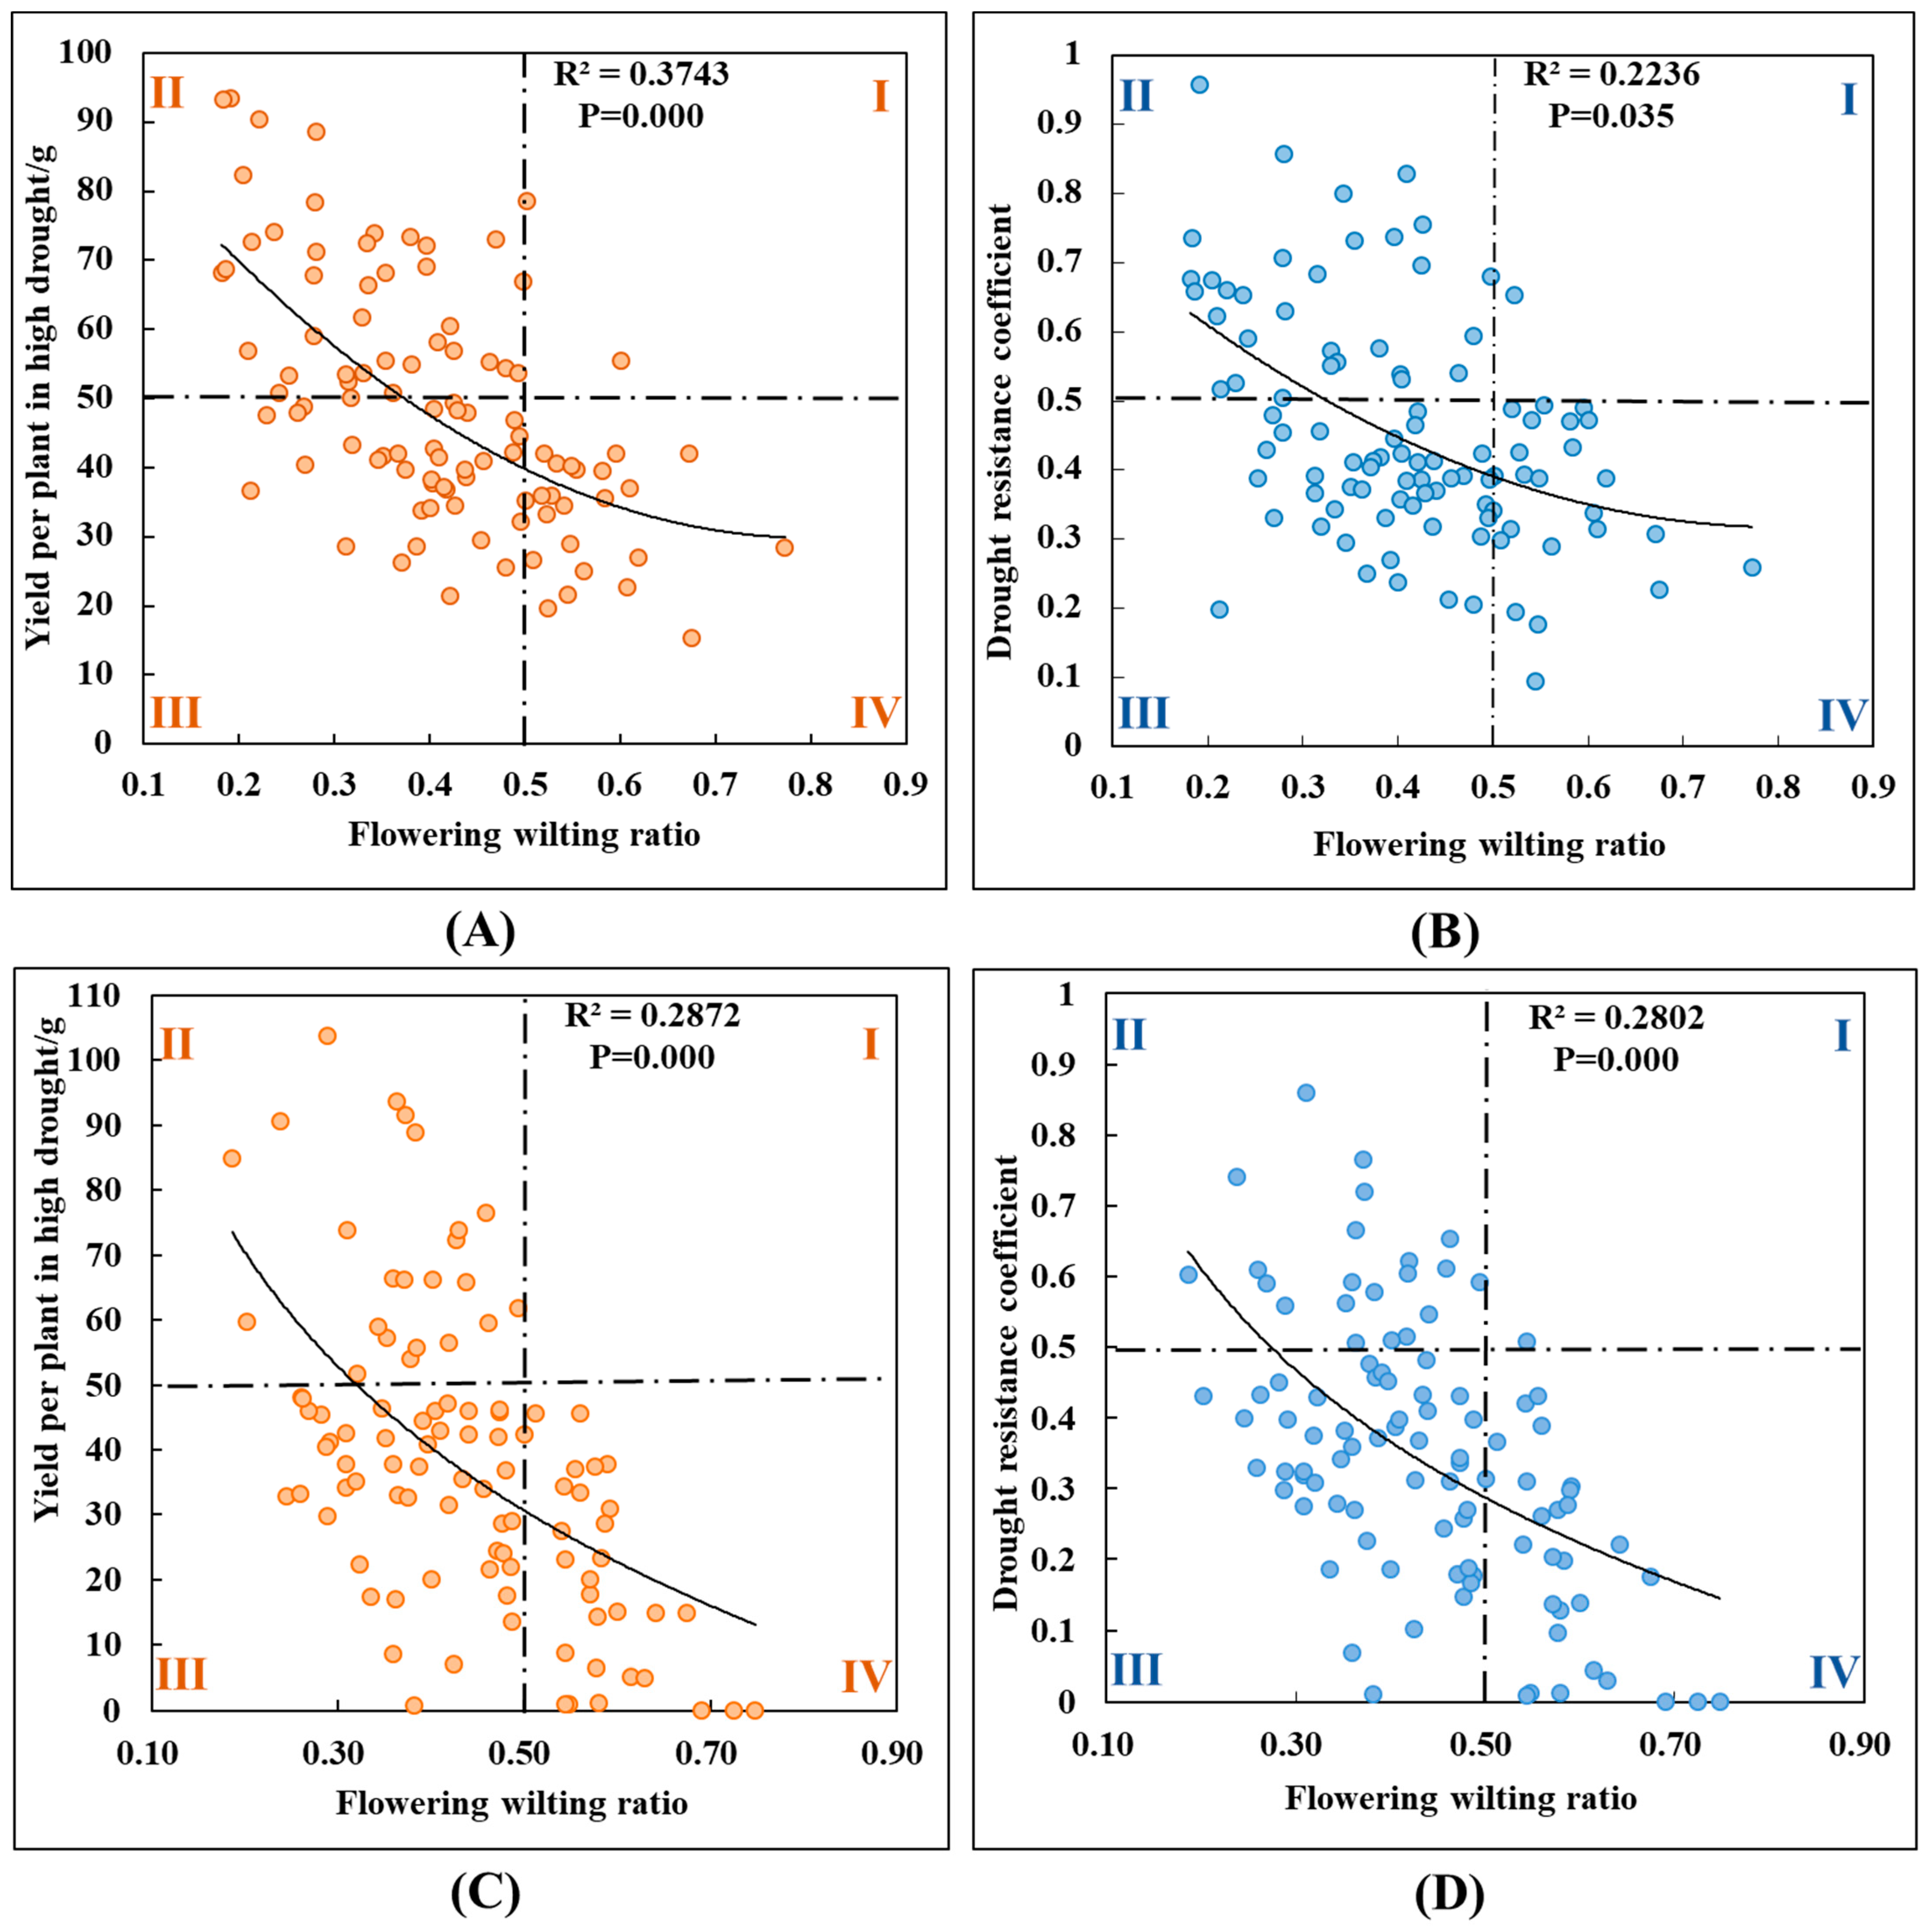
3.3. Leaf Wilting Amount, Yield, and Drought Resistance

The analysis of the variance in the leaf wilting severity across the various water treatments and different varieties is presented in Table 4. The results demonstrate a significant difference in the leaf wilting severity among the three water treatments. Specifically, there is no significant difference in the leaf wilting severity among the varieties under normal irrigation (100%) treatment. However, under the moderate drought (50%) and severe drought (0%) treatments, the differences among the varieties reach a highly significant level. The experimental observations showed a similar variation in the leaf wilting under different irrigation treatments (0%, 50%, 100%) across the 10 maize varieties (Figure 8). Leaf wilting occurs to some extent even under normal irrigation (100%), while it intensifies under moderate drought (50%). However, the differences among the varieties were slight. In contrast, compared with those under the moderate drought (50%) and normal irrigation (100%) treatments, wilting was more pronounced, and the inter-varietal variations were greater under the severe drought (0%) irrigation treatment. Moreover, the phenotype of leaf wilting was more prominent under severe drought conditions. Hence, monitoring leaf wilting under severe drought stress treatment is more effective.
Table 5 presents the correlation analysis between the leaf wilting scores and yield, as well as the drought resistance coefficients, during the years 2020 and 2021. In 2020, the leaf wilting scores showed highly significant negative correlations with the yield across seven measurement periods and with the drought resistance coefficients across four periods. The highest correlation coefficients with the yield and drought resistance coefficients were observed at the flowering stage (10 July), which were −0.593 and −0.343, respectively. Similarly, in 2021, the leaf wilting scores during all the measurement periods exhibited highly significant negative correlations with the yield and drought resistance coefficients. At the flowering stage (27 July), the highest correlation coefficients with the yield and drought resistance coefficients were −0.559 and −0.560, respectively. Figure 9 shows that under severe drought stress throughout the entire growth period in 2020 and 2021, the leaf wilting scores at the flowering stage ranged from 0.15 to 0.8 for 100 inbred maize lines. This indicates a decreasing trend in both the yield and drought resistance with increasing leaf wilting scores at the flowering stage. The graph categorizes the region into four quadrants using two horizontal and two vertical lines. In Quadrant I, there were high-yielding drought-resistant lines with high wilting ratios. Quadrant II consists of high-yielding drought-resistant lines with low wilting ratios. Quadrant III contains low-yielding weakly drought-resistant lines with low wilting ratios, while Quadrant IV encompasses low-yielding drought-sensitive varieties with high wilting ratios. The results indicate that under severe drought stress, most inbred lines exhibit wilting ratios within 1/2 (wilting ratio ≤ 0.5) and are distributed in Quadrants II and III, with varying yields and drought resistance. However, inbred lines with wilting ratios exceeding 1/2 (wilting ratio > 0.5) are uniformly characterized by low yields or weak resistance and are primarily located in Quadrant IV. Hence, there is a close relationship between the wilting ratio, yield, and drought resistance, with materials exhibiting higher wilting ratios mostly characterized by low yields and weak resistance, while those with lower wilting ratios may represent either high-yielding drought-resistant materials or low-yielding drought-sensitive maize varieties.

4. Discussion

Wilting has long been a highly concerning indicator of plant stress resistance, yet there have been difficulties in its high-throughput measurement and quantification techniques. With the increasing availability of image capture and analysis tools, high-throughput plant phenotype determination has developed rapidly. Sytar et al. summarized the high-parameterization phenotype typing platforms based on fluorescence kinetics imaging and hyperspectral, thermal, and near-infrared light imaging techniques in field or laboratory settings [27]. Other studies have focused on image processing, including the development of new tools to improve the segmentation accuracy [28] and the construction of complex stress-induced leaf deformation models [29]. Moreover, scientific quantitative indicators play a crucial role in assessing wilting phenotypes. Kenchanmane Raju et al. [30] developed a MATLAB R2014a (MathWorks, Natick, MA, USA) -based image-processing framework known as the Leaf Angle eXtractor (LAX). This program was utilized to extract and quantify the leaf angles from images of maize and sorghum plants experiencing drought conditions. The LAX enables rapid determination of whether the leaves are wilted or suffering from water deprivation. However, these methods require high-cost image capture devices, infrastructure, and professional operators, resulting in relatively low popularization rates. Simple, fast, and accurate high-throughput methods for measuring wilting are urgently needed in field trials.
The present research builds a simple image collection and processing platform, and it proposes a new wilting measurement index and quantitative formula. By using the daily changes in the visible green area of the leaves, the wilting of the leaves can be effectively reflected. Compared with previous research, firstly, the experimental collection platform and method in this study are simpler to operate and can quickly obtain the wilting status of plant leaves using a regular smartphone and a WIFI camera. The images can be analyzed indoors with software, making it fast, convenient, low-cost, and easy to operate. There is no need for expensive equipment or professional operating experience to quickly determine wilting in the field. Secondly, this study proposes a new wilting index—the leaf wilting ratio, which is calculated using the dynamic changes in the visible green area of the leaves. This index reflects the real situation of leaf wilting and is highly practical.
This study focused on measuring the daily dynamic changes in the visible green area of maize leaves under limited water conditions. All 100 maize varieties exhibited a similar pattern of wilting followed by recovery. In the early morning, the visible green area of the leaves was the largest, and as time progressed, the visible green area was the smallest at noon (14:00–16:00), when the solar radiation was at its peak. This result is consistent with the findings obtained by Sirault et al. through visual scoring [18]. Among the 10 varieties treated with 0%, 50%, and 100% irrigation, wilting gradually increased as water stress intensified.
The wilting results of 100 samples over the full growth phase indicated that varieties with greater leaf wilting exhibit significant wilting at various growth stages, whereas maize varieties with less wilting consistently show lower wilting across all the stages. Leaf wilting is closely related to the growth stage. Although the different sowing times over the two years led to inconsistencies in the flowering periods, the degree of wilting measured multiple times over the consecutive two years still indicates that most varieties exhibit the highest degree of wilting during the flowering period. Additionally, the wilting levels of the materials demonstrated a consistent trend across the different growth stages. The flowering stage is the most critical period for maize in terms of water and heat stress, as well as for potential yield reduction due to unfavorable conditions. Therefore, the flowering period is the optimal time for measuring leaf wilting. The results of this study demonstrated that during this period, the greatest variation in leaf wilting occurred among the materials, indicating that the ratio of wilting can effectively reflect the yield and drought/heat tolerance. However, the current study also has certain limitations. There are differences in the flowering times among the 100 varieties, which may result in inconsistencies when using regular measurements of the visible leaf area to accurately quantify wilting as an indication of leaf wilting during the flowering period. Therefore, future research should prioritize enhancing dynamic measurements of leaf wilting.
Leaf wilting is a complex phenotypic trait that has certain correlations with yield and drought resistance [31]. Under drought conditions, plants regulate transpiration to maintain a certain level of yield through appropriate leaf wilting. However, excessive wilting of plant leaves can affect their normal photosynthesis and nutrient absorption, thereby impacting the overall plant yield. Kadioglu et al. [32] found that plants exhibit resistance to drought and high temperatures through their wilting mechanism, which also leads to higher water use efficiency. The wilting traits of leaves have been widely used to identify crop drought resistance and forecast yield. Ye et al. [33] suggested that the slow wilting index is a very important indicator for maintaining yield under drought stress. Veerala et al. [34] used the leaf rolling scores and leaf senescence scores under drought conditions to evaluate 38 Basmati rice varieties for drought tolerance. They proposed that selection criteria based on leaf rolling and senescence can be used for breeding drought-tolerant varieties. Wirojsirasak et al. [35] examined leaf curling and wilting in sugarcane under drought stress and found a significant correlation between the sugarcane yield, percentage reduction, and leaf curling wilting. In this study, a comparative analysis of the wilting ratio, yield, and drought resistance of 100 maize varieties under severe drought stress was conducted. Plants whose leaf wilting exceeded 1/2 (wilting ratio > 0.5) were inevitably low-yield and highly sensitive varieties, while high-yield and drought-resistant varieties had varying ratios of wilting. This indicates that a small wilting ratio is a necessary condition for a high yield and strong resistance, but it is not a sufficient condition. Varieties with severe wilting can be directly eliminated; in other words, the wilting ratio is a new indicator for eliminating low-yield and weakly resistant materials.
The low wilting but low yield or high sensitivity of the varieties may be related to other factors, such as the reduced pollen activity at high temperatures. Therefore, it is necessary to continue in-depth research using multiomics approaches to better understand the comprehensive effects of drought and high temperature under water stress conditions.

5. Conclusions

In this study, a low-cost and easy-to-operate platform for the acquisition and processing of images of the visual green area of leaves was designed. This platform enables rapid determination of the leaf visual green area in the field. The findings showed that the daily variation pattern of the leaf visual green area involves wilting followed by recovery, with the maximum wilting occurring at noon. A new wilting measurement index and its quantification formula have been proposed, which can effectively reflect the wilting degree of leaves. Current research has proposed a method for calculating leaf wilting, and it has become evident that the flowering period is the best time to monitor leaf wilting. We discovered that varieties with a high wilting ratio exhibit a low yield and weak resistance. These research findings will assist breeders in eliminating low-yield and weak resistance materials, thus expediting the breeding process of new varieties. The wilting ratio can serve as a reference indicator for identifying drought and heat tolerance in maize in a sustainable manner.

Author Contributions

C.L. and H.T. designed the research. H.T. and X.X. performed the experiments. L.Z. and B.S. analyzed the data and wrote the manuscript. L.Z. edited the manuscript. All authors have read and agreed to the published version of the manuscript.

Funding

This research was supported by the 14th Five-Year National Key Research and Development Program Project, funding number 2021YFD1200703; the Renovation Capacity Building for the Young Sci-Tech Talents Project sponsored by the Xinjiang Academy of Agricultural Sciences, funding number xjnkq-2020010; and the Xinjiang Uygur Autonomous Region key research and development Program Project, funding number 2022B02001-4.

Institutional Review Board Statement

Not applicable.

Informed Consent Statement

Not applicable.

Data Availability Statement

Data will be provided on demand.

Acknowledgments

We are thankful that non-profit institutions supported the Government of Xinjiang in providing this project.

Conflicts of Interest

The authors declare no conflicts of interest.

References

  1. Patel, R.; Memon, J.; Kumar, S.; Patel, D.A.; Sakure, A.A.; Patel, M.B.; Das, A.; Karjagi, C.G.; Patel, S.; Patel, U.; et al. Genetic Diversity and Population Structure of Maize (Zea mays L.) Inbred Lines in Association with Phenotypic and Grain Qualitative Traits Using SSR Genotyping. Plants 2024, 13, 823. [Google Scholar] [CrossRef] [PubMed]
  2. Zhu, X.-G.; Long, S.P.; Ort, D.R. Improving photosynthetic efficiency for greater yield. Annu. Rev. Plant Biol. 2010, 61, 235–261. [Google Scholar] [CrossRef] [PubMed]
  3. Farhangfar, S.; Bannayan, M.; Khazaei, H.R.; Baygi, M.M. Vulnerability assessment of wheat and maize production affected by drought and climate change. Int. J. Disaster Risk Reduct. 2015, 13, 37–51. [Google Scholar] [CrossRef]
  4. Pathan, S.M.; Lee, J.-D.; Sleper, D.A.; Fritschi, F.B.; Sharp, R.E.; Carter, T.E.; Nelson, R.L.; King, C.A.; Schapaugh, W.T.; Ellersieck, M.R.; et al. Two soybean plant introductions display slow leaf wilting and reduced yield loss under drought. J. Agron. Crop Sci. 2014, 200, 231–236. [Google Scholar] [CrossRef]
  5. Duncan, W.J.C.S. Leaf angles, leaf area, and canopy photosynthesis 1. Crop Sci. 1971, 11, 482–485. [Google Scholar] [CrossRef]
  6. Shafiq, I.; Hussain, S.; Raza, M.A.; Iqbal, N.; Asghar, M.A.; Raza, A.; Fan, Y.-F.; Mumtaz, M.; Shoaib, M.; Ansar, M.; et al. Crop photosynthetic response to light quality and light intensity. J. Integr. Agric. 2021, 20, 4–23. [Google Scholar] [CrossRef]
  7. Zhao, S.; Zeng, W.; Li, Z.; Peng, Y. Mannose regulates water balance, leaf senescence, and genes related to stress tolerance in white clover under osmotic stress. Biol. Plant. 2020, 64, 406–416. [Google Scholar] [CrossRef]
  8. Subashri, M.; Robin, S.; Vinod, K.K.; Rajeswari, S.; Mohanasundaram, K.; Raveendran, T.S. Trait identification and QTL validation for reproductive stage drought resistance in rice using selective genotyping of near flowering RILs. Euphytica 2009, 166, 291–305. [Google Scholar] [CrossRef]
  9. Briggs, L.J.; Shantz, H.L. A wax seal method for determining the lower limit of available soil moisture. Bot. Gaz. 1911, 51, 210–219. [Google Scholar] [CrossRef]
  10. Zhu, J.-K. Abiotic stress signaling and responses in plants. Cell 2016, 167, 313–324. [Google Scholar] [CrossRef]
  11. Flexas, J.; Barón, M.; Bota, J.; Ducruet, J.-M.; Gallé, A.; Galmés, J.; Jiménez, M.; Pou, A.; Ribas-Carbó, M.; Sajnani, C.; et al. Photosynthesis limitations during water stress acclimation and recovery in the drought-adapted Vitis hybrid Richter-110 (V. berlandieri×V. rupestris). J. Exp. Bot. 2009, 60, 2361–2377. [Google Scholar] [CrossRef] [PubMed]
  12. Devi, E.L.; Kumar, S.; Singh, T.B.; Sharma, S.K.; Beemrote, A.; Devi, C.P.; Chongtham, S.K.; Singh, C.H.; Yumlembam, R.A.; Haribhushan, A.; et al. Adaptation strategies and defence mechanisms of plants during environmental stress. In Medicinal Plants and Environmental Challenges; Springer: Berlin/Heidelberg, Germany, 2017; pp. 359–413. [Google Scholar]
  13. Shinozaki, K.; Yamaguchi-Shinozaki, K. Gene networks involved in drought stress response and tolerance. J. Exp. Bot. 2007, 58, 221–227. [Google Scholar] [CrossRef]
  14. Saglam, A.; Kadioglu, A.; Demiralay, M.; Terzi, R. Leaf rolling reduces photosynthetic loss in maize under severe drought. Acta Bot. Croat. 2014, 73, 315–332. [Google Scholar] [CrossRef]
  15. Baret, F.; Madec, S.; Irfan, K.; Lopez, J.; Comar, A.; Hemmerlé, M.; Dutartre, D.; Praud, S.; Tixier, M.H. Leaf-rolling in maize crops: From leaf scoring to canopy-level measurements for phenotyping. J. Exp. Bot. 2018, 69, 2705–2716. [Google Scholar] [CrossRef]
  16. O’Toole, J.; Cruz, R.; Singh, T. Leaf rolling and transpiration. Plant Sci. Lett. 1979, 16, 111–114. [Google Scholar] [CrossRef]
  17. Matthews, R.; Azam-Ali, S.; Peacock, J. Response of four sorghum lines to mid-season drought. II. Leaf characteristics. Field Crop. Res. 1990, 25, 297–308. [Google Scholar] [CrossRef]
  18. Sirault, X.R.R.; Condon, A.G.; Wood, J.T.; Farquhar, G.D.; Rebetzke, G.J. “Rolled-upness”: Phenotyping leaf rolling in cereals using computer vision and functional data analysis approaches. Plant Methods 2015, 11, 52. [Google Scholar] [CrossRef]
  19. Rascio, A.; De Santis, G.; Sorrentino, G. A low-cost method for phenotyping wilting and recovery of wheat leaves under heat stress using semi-automated image analysis. Plants 2020, 9, 718. [Google Scholar] [CrossRef]
  20. Camargo, A.; Smith, J. Image pattern classification for the identification of disease causing agents in plants. Comput. Electron. Agric. 2009, 66, 121–125. [Google Scholar] [CrossRef]
  21. Wakamori, K.; Mineno, H. Optical flow-based analysis of the relationships between leaf wilting and stem diameter variations in tomato plants. Plant Phenomics 2019, 2019, 9136298. [Google Scholar] [CrossRef]
  22. Chen, Y.; Ribera, J.; Delp, E.J. Estimating plant centers using a deep binary classifier. In Proceedings of the 2018 IEEE Southwest Symposium on Image Analysis and Interpretation (SSIAI), Las Vegas, NV, USA, 8–10 April 2018. [Google Scholar]
  23. Han, L.; Yang, G.; Dai, H.; Yang, H.; Xu, B.; Feng, H.; Li, Z.; Yang, X. Fuzzy clustering of maize plant-height patterns using time series of UAV remote-sensing images and variety traits. Front. Plant Sci. 2019, 10, 926. [Google Scholar] [CrossRef] [PubMed]
  24. Ndlovu, H.S.; Odindi, J.; Sibanda, M.; Mutanga, O.; Clulow, A.; Chimonyo, V.G.P.; Mabhaudhi, T. A comparative estimation of maize leaf water content using machine learning techniques and unmanned aerial vehicle (UAV)-based proximal and remotely sensed data. Remote. Sens. 2021, 13, 4091. [Google Scholar] [CrossRef]
  25. Yang, C.; Baireddy, S.; Méline, V.; Cai, E.; Caldwell, D.; Iyer-Pascuzzi, A.S.; Delp, E.J. Image-based plant wilting estimation. Plant Methods 2023, 19, 52. [Google Scholar] [CrossRef] [PubMed]
  26. Xin, G.; Li, Q.Y.; Zhang, F.R. Comparison of soil genetic classification and soil taxonomy for plain soil in Xinjiang. CABI Digital Library 2011, 379, 312–317. [Google Scholar]
  27. Sytar, O.; Zivcak, M.; Olsovska, K.; Brestic, M. Perspectives in high-throughput phenotyping of qualitative traits at the whole-plant level. In Eco-Friendly Agro-Biological Techniques for Enhancing Crop Productivity; Springer: Berlin/Heidelberg, Germany, 2018; pp. 213–243. [Google Scholar]
  28. Chopin, J.; Laga, H.; Miklavcic, S.J. A hybrid approach for improving image segmentation: Application to phenotyping of wheat leaves. PLoS ONE 2016, 11, e0168496. [Google Scholar] [CrossRef] [PubMed]
  29. Jeong, S.; Park, S.; Kim, C. Simulation of morphology changes in drying leaves. Comput. Graph. Forum 2013, 32, 204–215. [Google Scholar] [CrossRef]
  30. Raju, S.K.K.; Adkins, M.; Enersen, A.; de Carvalho, D.S.; Studer, A.J.; Ganapathysubramanian, B.; Schnable, P.S.; Schnable, J.C. Leaf Angle eXtractor: A high-throughput image processing framework for leaf angle measurements in maize and sorghum. Appl. Plant Sci. 2020, 8, e11385. [Google Scholar] [CrossRef] [PubMed]
  31. Valliyodan, B.; Ye, H.; Song, L.; Murphy, M.; Shannon, J.G.; Nguyen, H.T. Genetic diversity and genomic strategies for improving drought and waterlogging tolerance in soybeans. J. Exp. Bot. 2017, 68, 1835–1849. [Google Scholar] [CrossRef]
  32. Kadioglu, A.; Terzi, R.; Saruhan, N.; Saglam, A. Current advances in the investigation of leaf rolling caused by biotic and abiotic stress factors. Plant Sci. 2012, 182, 42–48. [Google Scholar] [CrossRef]
  33. Ye, H.; Song, L.; Schapaugh, W.T.; Ali, L.; Sinclair, T.R.; Riar, M.K.; Mutava, R.N.; Li, Y.; Vuong, T.; Valliyodan, B.; et al. The importance of slow canopy wilting in drought tolerance in soybean. J. Exp. Bot. 2019, 71, 642–652. [Google Scholar] [CrossRef]
  34. Veerala, P.; Chand, P.; Das, T.R.; Gangwar, L.K.; Kumar, R. Leaf rolling and senescence scores as selection criteria to identify drought-tolerant genotypes in basmati rice (Oryza sativa L.). Indian J. Genet. Plant Breed. 2024, 84, 124–126. [Google Scholar]
  35. Wirojsirasak, W.; Songsri, P.; Jongrungklang, N.; Tangphatsornruang, S.; Klomsa-Ard, P.; Ukoskit, K. Determination of Morpho-Physiological Traits for Assessing Drought Tolerance in Sugarcane. Plants 2024, 13, 1072. [Google Scholar] [CrossRef] [PubMed]
Figure 1. Schematic diagram of the image acquisition device.
Sustainability 16 06129 g001
Figure 2. Example of image acquisition (the change in leaf phenotype of the same self-cross from 8:00 in the morning to 20:00 in the evening from left to right).
Sustainability 16 06129 g002
Figure 3. The Hue value range of a living leaf is about 75–165 in the HSV color space.
Sustainability 16 06129 g003
Figure 4. The relative percentage error (RPE) of the green area (GA) recognition.
Sustainability 16 06129 g004
Figure 5. Changes in the full-day visible green area of 100 maize self-crosses under severe drought treatment in 2020 (A) and 2021 (B) showing the maximum wilting at 14:00–16:00 (Urumqi).
Sustainability 16 06129 g005
Figure 6. Changes in wilting at various stages of the full growth period of the leaves of 100 maize self-crosses under severe drought treatment in 2020 (A) and 2021 (B). In the graph, the connecting lines represent the mean values.
Sustainability 16 06129 g006
Figure 7. Flowering period distribution of 100 inbred maize lines in 2020 (A) and 2021 (B).
Sustainability 16 06129 g007
Figure 8. Changes in the leaf wilting patterns of 10 maize varieties under different watering treatments (Blue: leaf wilting ratio under normal irrigation (100%) treatment, Green: leaf wilting ratio under moderate drought (50%) treatment, Red: leaf wilting ratio under severe drought (0%) treatment).
Sustainability 16 06129 g008
Figure 9. Correlation between the flowering wilting ratio of leaves under severe drought treatment in 100 maize self-crosses and the individual plant yield and drought resistance coefficient ((A): yield per plant and flowering wilting in 2020, (B): drought coefficient and flowering wilting in 2020, (C): yield per plant and flowering wilting in 2021, (D): drought coefficient and flowering wilting in 2021).
Sustainability 16 06129 g009
Table 1. Ten inbred maize lines’ drought resistance coefficient.
Line NumberDrought Resistance
Coefficient
Line NumberDrought Resistance
Coefficient
XJ0060.56 XJ 0810.41
XJ 0190.50 XJ 0950.49
XJ 0220.65 Z580.67
XJ 0380.39 PH4CV0.47
XJ 0780.57 PH6WC0.43
Table 2. Watering treatments for 2020, 2021 and 2022 (m3/666.7 m2).
YearPrecipitationNormal Irrigation (100%)Moderate Drought (50%)Severe Drought (0%)
202025.135017550
202151.835017550
202226.135017550
Table 3. Average daily temperature for different measuring periods in 2020 and 2021.
YearsItemData
2020Data6/186/247/27/107/177/318/68/138/168/24
Temperature/°C24.3 25.1 26.3 27.6 30.6 29.6 32.6 28.3 25.4 26.9
2021Data6/297/67/137/207/278/38/108/188/24
Temperature/°C26.233.826.829.43428.424.820.225
Table 4. Variance analysis of the leaf wilting ratio among different irrigation treatments and varieties.
ItemVariance SourceDFSSMSF-Valuep
Wilting ratioIrrigation24.4442.22290.1700.000
Varieties × Normal irrigation (100%)90.1910.0211.1870.304
Varieties × Mild drought
(50%)
90.8490.0945.5520.000
Varieties × Severe drought
(0%)
91.5960.1775.8230.000
Table 5. Correlation of the wilting ratio with the yield and drought coefficient in the measured periods in 2020 and 2021.
20202021
Wilting RatioYieldDcWilting RatioYieldDc
Wr (6/18)−0.171−0.025Wr (6/29)−0.397 **−0.395 **
Wr (6/24)−0.325 **−0.208Wr (7/06)−0.387 **−0.428 **
Wr (7/02)−0.093−0.116Wr (7/13)−0.447 **−0.492 **
Wr (7/10)−0.593 **−0.343 **Wr (7/20)−0.394 **−0.459 **
Wr (7/17)−0.305 **−0.243 **Wr (7/27)−0.559 **−0.560 **
Wr (7/31)−0.279 **−0.118Wr (8/03)−0.394 **−0.419 **
Wr (8/06)−0.136−0.047Wr (8/10)−0.454 **−0.476 **
Wr (8/13)−0.449 **−0.260 **Wr (8/18)−0.527 **−0.405 **
Wr (8/16)−0.552 **−0.278 **Wr (8/24)−0.471 **−0.402 **
Wr (8/24)−0.387 **−0.125
Note: “**” indicate significant p < 0.01 levels, respectively.
Disclaimer/Publisher’s Note: The statements, opinions and data contained in all publications are solely those of the individual author(s) and contributor(s) and not of MDPI and/or the editor(s). MDPI and/or the editor(s) disclaim responsibility for any injury to people or property resulting from any ideas, methods, instructions or products referred to in the content.

