Abstract
The key to promoting high-quality economic development (HQED) is to identify the influencing factors and the complex relationships among them. Under the guidance of China’s new development concept, we systematically analyze the factors influencing the HQED based on the DPSIR (Driver-Pressure-State-Impact-Response) model. We also establish a system dynamics model and adopt Vensim PLE x64 software to simulate the impact of dynamic changes on HQED, which include innovation, coordination, green, openness, sharing systems, and their combinations. The results show that increasing green investment is the most effective, followed by enhancing regional coordination, enhancing foreign trade, and improving human capital. Among the studied factors, improving livelihood is the weakest. For multiple policy scenarios, the balanced scenario is the most efficient, followed by the environment-oriented, and the weakest is the openness-oriented scenario. Interestingly, combined policies are also more effective than single policies, which does not always apply. Furthermore, the effect of the policy combination is more obvious with the strengthening of the implementation intensity, which is important for policymakers.
1. Introduction
China’s economy has shifted from the stage of high-speed growth to high-quality development. High-quality economic development (HQED) not only takes GDP as the goal, but also includes the development of social welfare, the rationality of industrial and economic structures, and the coordinated development of urban and rural areas. In other words, HQED pursues high quality in all fields and throughout the whole process of economic and social development. HQED, as the primary task of comprehensively building a modern socialist country, plays an important role in economic development and social progress. At the same time, HQED will be the theme of China’s long-term economic and social development. Foreign scholars point out that the driving forces of economic development are capital stock and technological progress [1]. Among them, technological progress is a decisive factor in maintaining sustained economic growth [2], which is consistent with the connotation of high-quality economic development. Therefore, the study of high-quality economic development provides a reference not only for China but also for other countries. In fact, HQED is a constantly changing complex system that is influenced by many factors, and the factors interact with each other. That is, HQED has the characteristics of dynamism, system, and complexity. Therefore, it is very essential to effectively identify the influencing factors of HQED and the complex relationships among the factors, which is of great guiding significance for the realization of HQED.
Existing studies on the measurement of HQED can be divided into single type [3,4] and composite index. However, the single-type method cannot reflect the multi-dimensionality of HQED. Thus, most scholars adopt the composite index, which is mainly guided by the new development concept [5]. However, the existing research on the construction of HQED evaluation system lacks theoretical support. The DPSIR (driving force-pressure-state-impact-response) model is widely used in the research and evaluation of resources, environment, society, and economic development [6], which lays an important theoretical foundation for this paper to carry out research on high-quality economic development.
Previous research in the analysis of factors influencing HQED can be divided into two categories, namely, empirical test method and factor analysis [7]. On the one hand, the empirical test method is mainly a quantitative analysis to verify the linear or nonlinear relationship between certain influencing factors and HQED. For example, some scholars empirically tested the linear impact of the digital economy on HQED [8] and the linear impact of two-way FDI on HQED [9]. Other scholars empirically verified the nonlinear relationship between industrial structure and HQED [10], and the weak “U-shaped” (almost “L-shaped”) influence of environmental regulation on HQED [11]. However, this method fails to identify the influence of multiple factors on HQED at the same time. In particular, the interactions between various factors are difficult to describe. On the other hand, factor analysis is a qualitative analysis method including principal component analysis [12] and obstacle factor analysis [13], which can analyze various factors influencing HQED. However, this method cannot accurately describe the complex relationship between different influencing factors and HQED. Motivated by the aforementioned shortcomings in the literature, this paper aims to identify the influencing factors and the complex relationships among them using system dynamics (SD). SD combines the advantages of the empirical test method and factor analysis, which has the characteristics of qualitative and quantitative analysis. Moreover, it can effectively identify the influencing factors of HQED and compensate for the shortcomings of the above methods in describing the nonlinear among the factors and multivariable dynamic stochastic processes.
The HQED system has the remarkable characteristics of complex systems, namely multi-dimensional, dynamic, and nonlinear. SD can analyze the internal microstructure of the HQED system, and describe the dynamic evolution process of the system by establishing the mathematical model, so as to evaluate the effect of various factors on the system. Moreover, SD can introduce variables whose data are not available for direct observation into the analysis to more fully understand the causal loop in the system, open the “black box” of the mechanism of HQED, and reveal the correlation between various elements. Therefore, SD has a good applicability in the study of HQED. In particular, SD has been widely used in many fields, such as energy conservation and emission reduction [14], environmental economic management [15], policy analysis [16], and influence factor analysis [17]. This provides a good reference for us to identify the influence factors of HQED and the interaction relationship among the influence factors.
Based on the above analysis, combined with the new development concept and the DPSIR theoretical model, this paper builds a theoretical framework for the evaluation system of HQED. It can also be seen that SD plays a significant role in describing the complex nonlinear relationship and dynamic process and revealing the correlation relationship among various factors. Specifically, in order to study the influence of various factors and their combinations on HQED under different regulatory scenarios, this paper conducts a multi-scenario simulation of HQED, which can provide scientific support for the effective improvement of HQED. In this paper, our contribution is mainly reflected in three aspects. The first contribution is that we construct a system dynamic model based on the new development concept and DPSIR theoretical model, which can describe the relationship between the influencing factors and HQED. Our second major contribution is to set up five regulatory scenarios based on China’s new development concept, namely innovation, coordination, green, openness, and sharing. We simulate and analyze the impact of dynamic changes in each system and their combination on HQED. The third contribution is to provide a scientific basis for deciding what to regulate and how to regulate in the process of improving HQED. In terms of what to regulate, our results show that human capital, regional coordination, green investment, foreign trade, and social welfare are effective regulatory measures to improve HQED. Moreover, the results also show that increasing green investment is the most effective, followed by enhancing regional coordination, and then enhancing foreign trade and improving human capital, and the weakest is improving livelihood, with 8.22540%, 7.02806%, 6.79506%, 6.71600%, and 6.69220% respectively. In terms of how to regulate, the balanced scenario is the most efficient, followed by the environment-oriented, and the weakest is the openness-oriented scenario. Interestingly, combined policies are also more effective than single policies, which does not always apply. Furthermore, the higher the intensity of regulation, the higher the level of HQED. Finally, this paper puts forward relevant policy suggestions for the formulation and improvement of HQED.
The rest of the paper is organized as follows. Section 2 reviews the relevant literature and describes the theoretical framework. Section 3 introduces the research method and dynamic hypothesis. Section 4 describes the system dynamic model and the mathematical formulation. Section 5 analyzes the system dynamic simulation results of different regulatory scenarios, which answer the two key questions of what to regulate and how to regulate. Section 6 discusses the managerial implications. Section 7 concludes the study.
2. Literature Review and Theoretical Framework
2.1. System Dynamics
Based on classic control theory, SD reflects the feedback loops, delays, and accumulation processes between causes and effects of social systems [18]. The feedback loops between SD variables are divided into positive feedback and negative feedback, which are also called enhanced and balanced, respectively. The delays show the time needed to adjust the system status, which usually exists in social systems due to the inherent delays in controlling processes [19]. The accumulation shows the dynamics of increasing and decreasing variables in systems, which usually occur under the situation of information cycle flow and pressure [20]. Furthermore, the pressure caused by accumulated substances can influence the decision makers through information transfer.
Größler et al. [21] present SD as a structural theory that can be used to explain, analyze, and understand the dynamic process. SD model is a powerful tool for explaining the behavior of complex systems and comparing different development scenarios, and it is also an effective tool for evaluating and simulating the changes in different scenarios [22]. In addition, the SD model has obvious advantages in solving the problems of policy analysis and factor analysis [16,17], because it embodies the characteristics of delays, nonlinearities, feedbacks, and long-term dynamics [23]. Furthermore, SD models provide more reliable prediction trends than statistical models and allow policy makers to choose reasonable scenarios to make decisions and policies [24]. In addition, compared with the statistical methods, the SD model can deal with complex, nonlinear, multi-feedback, and unstable system problems [25], which can describe the dynamic response processes between the various elements of a system [26].
For all of these reasons, system dynamics modeling is a valuable methodology for simulation and analysis, which is perfectly suitable for predicting HQED complex systems in uncertain situations. The SD approach for HQED analysis is mainly realized by implementing a feedback mechanism in a nonlinear dynamics model, which is composed of stock and flow.
2.2. Theoretical Framework
The DPSIR model, namely the driving force-pressure-state-influence-response model, is created by the European Environment Agency (EEA). The DPSIR model is widely used in the research and evaluation of resources, environment, society, and economic development [6], which lays an important theoretical foundation for this paper to carry out research on high-quality economic development.
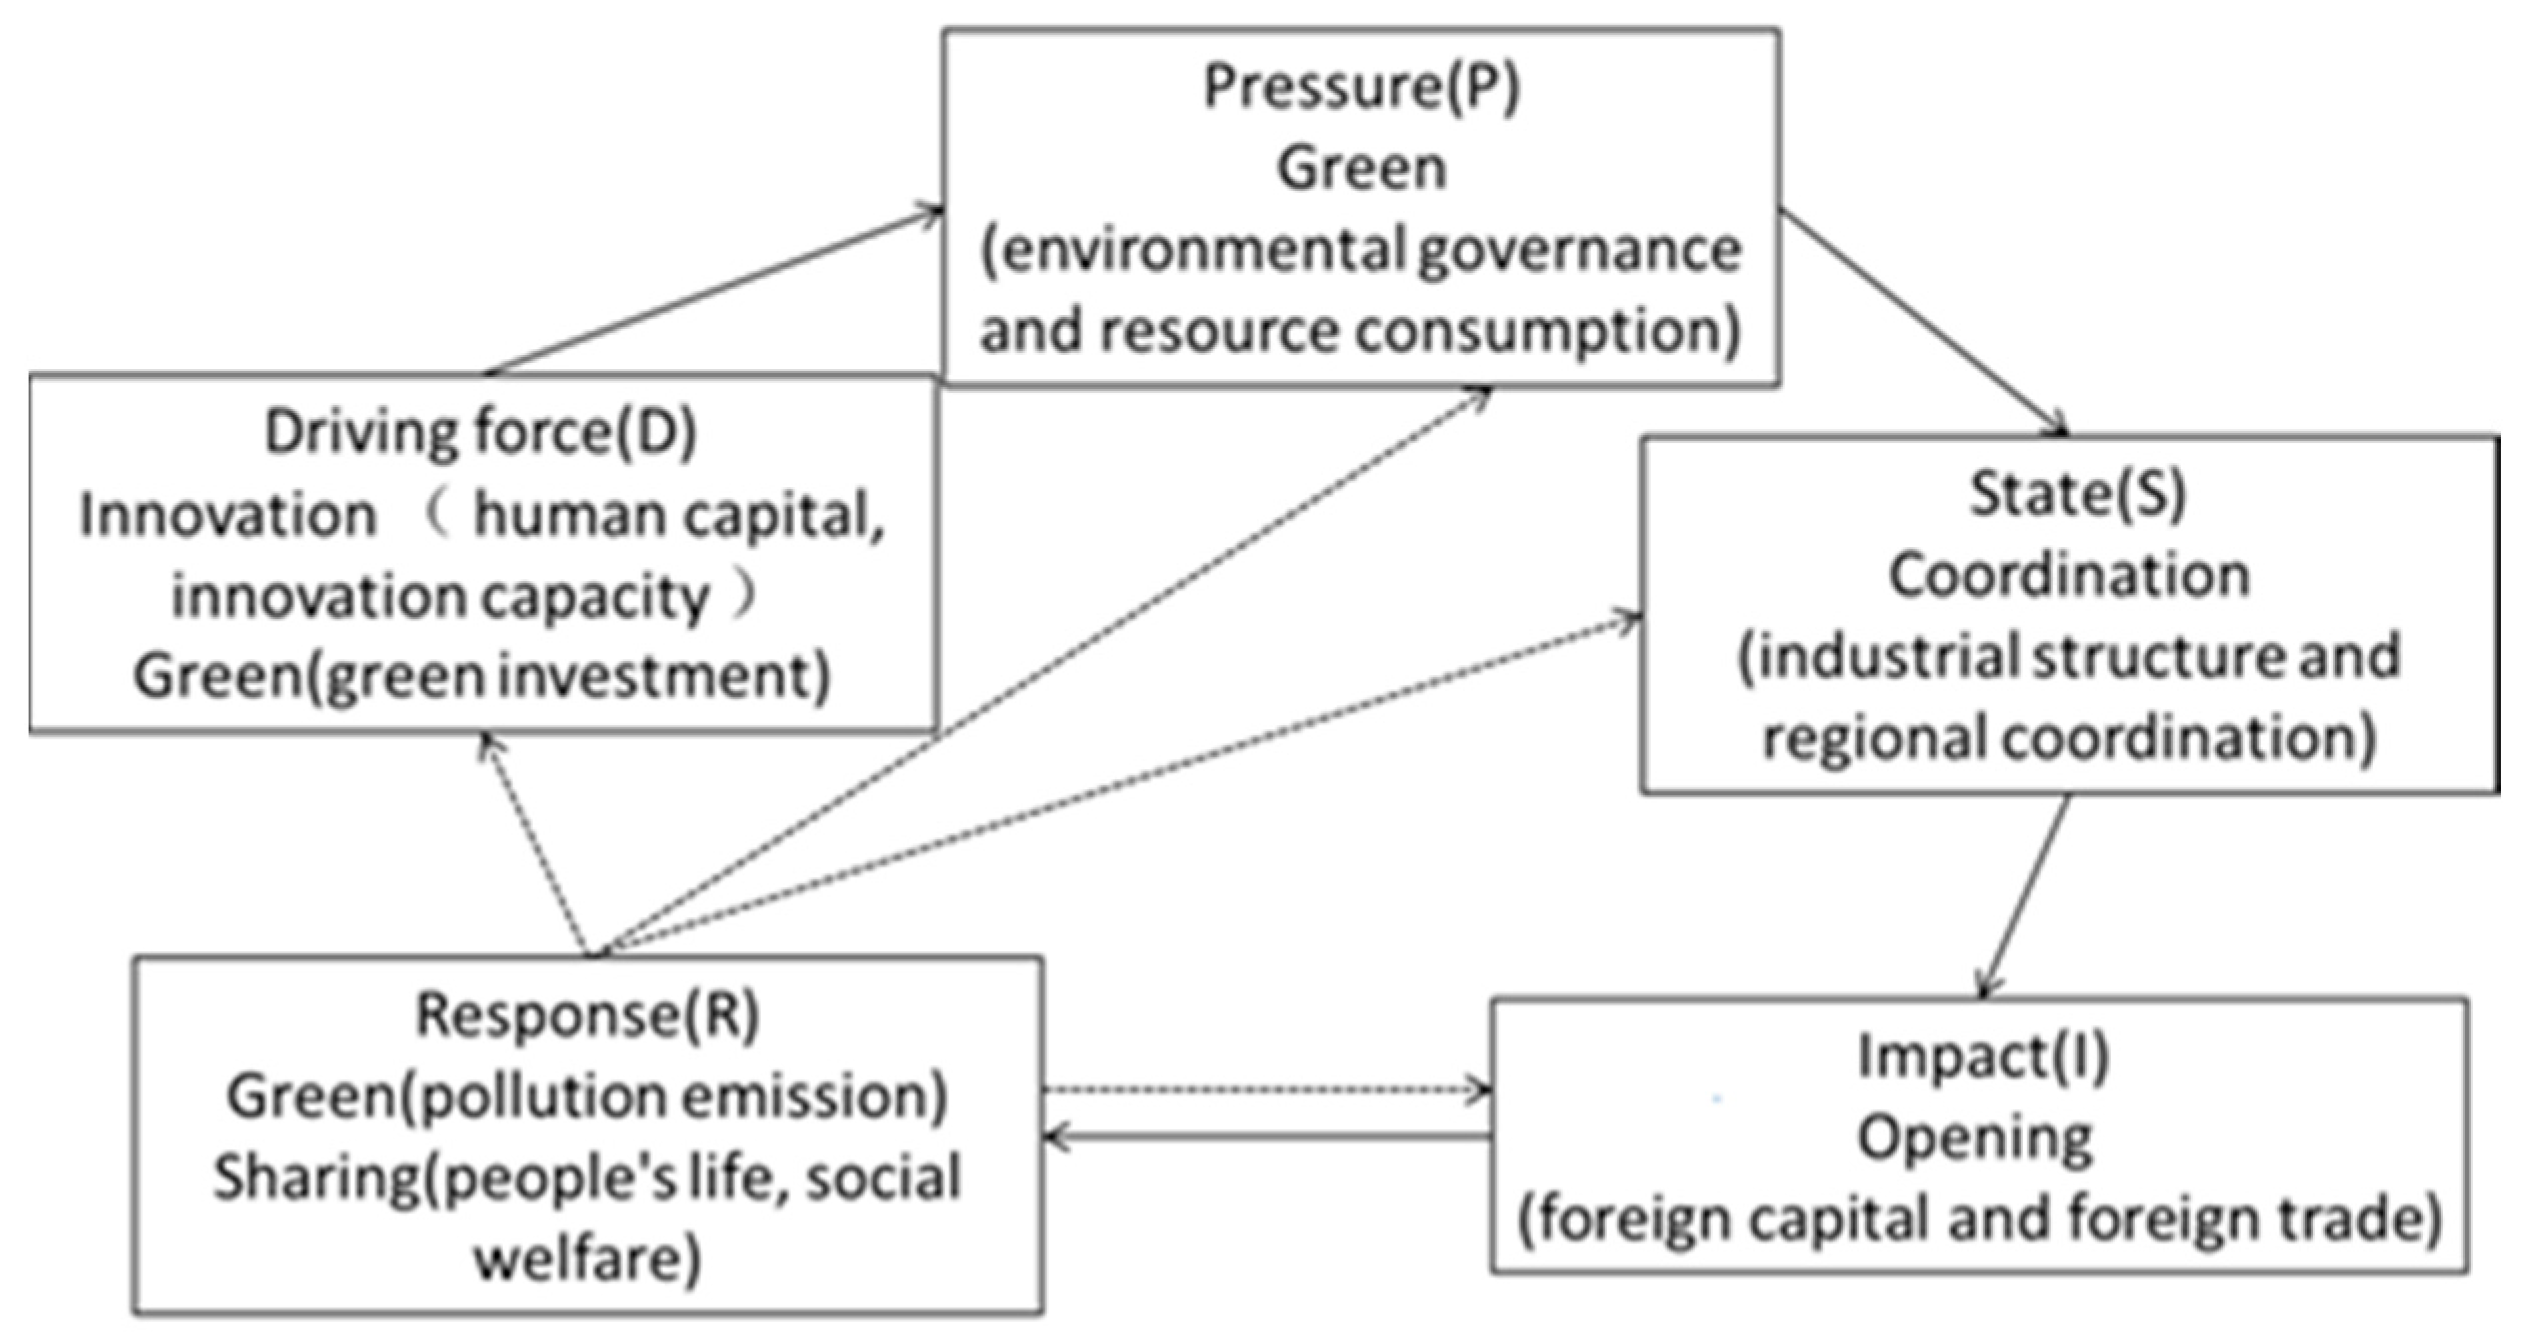
Combined with the new development concept and the DPSIR theoretical model, this paper builds a theoretical framework for the evaluation system of HQED, as shown in Figure 1 Driving force (D) refers to the potential driving force for achieving HQED. In other words, it is the cause of the change in the system of HQED. It corresponds to the innovation and green in the new development concept, including human capital, innovation capacity, and green investment. Neoclassical economic growth theory points out that the source of growth is technological progress and per capita capital stock [1]. Pressure (P) refers to the pressure that may change the state variables of HQED when acted on by driving forces. It corresponds to the green in the new development concept, including environmental governance and resource consumption. In particular, the “double carbon target” makes the importance of green development clearer, so we must consider the limitation of environmental resources. According to the “Porter hypothesis” [27], moderate environmental regulation can promote the progress of green technology and improve green productivity, which conforms to the concept of green development. State (S) refers to the state of development when pressure (P) acts on HQED, which corresponds to the coordination of the new development concept, including the coordination of industrial structure and regional coordination. Coordination plays an important guiding role in improving the efficiency of resource utilization and allocation, which is conducive to solving the problem of imbalance and insufficiency in economic development. Endogenous economic growth theories such as “horse array straddling well” and “plate chain pulling” point out that the core of development is to narrow the development gap between and within regions, and then achieve convergence development [28]. Impact (I) refers to the results caused by the situation variables, corresponding to the opening of new development concepts, including foreign capital and foreign trade. Openness means the optimization and improvement of the institutional environment [29], with the aim of expanding the scope, level, and field of open space. According to the resource-based theory [30], critical resources and capabilities include valuable, rare, inimitable, and nonsubstitutable features, which can strengthen its competitive advantages [31]. However, these competitive resources must rely on open and shared resources to promote collaborations [32]. Response (R) refers to the embodiment of the results of HQED, which can also generate feedback on other parts of high-quality economic development. It corresponds to the sharing and green of new development concepts, including people’s lives, social welfare, and pollution emission. In summary, HQED under the guidance of the new development concept is highly consistent with the connotation of the DPSIR model. In general, HQED takes human capital, innovation investment, and green investment as long-term driving forces, which puts pressure on environmental governance and resource consumption, thus changing the state of coordinated development level and affecting the level of opening, and further causing the response of people’s lives, social welfare level, and environment.

Figure 1.
The theoretical framework of HQED based on DPSIR. Note: solid lines represent positive impacts, dash lines represent feedbacks.
3. Research Method and Dynamic Hypothesis
3.1. Research Method
The system dynamics model can identify the factors influencing HQED and the relationship between them. First of all, there are many uncertainties in the process of achieving HQED, which is a long-term development goal. SD has significant advantages in dealing with long-term and cyclical problems. Secondly, SD can be simulated by computer software and has unique advantages in dealing with nonlinear and complex time-varying problems, making it suitable for the analysis of complex social and economic problems. Furthermore, SD is a powerful tool to identify the influential factors of HQED and the complex relationships among the factors, which can not only analyze the history and the present but also predict the future. Therefore, the SD model is a necessary tool to enhance the science of the research.
A system dynamics model consists of a set of interrelated differential and algebraic equations that are developed from a wide range of related data and described by simulation software [33]. SD uses stocks, flows, and parameters to simulate the complex behavior of different systems. Stocks or “state variables” represent the accumulation of inflows minus outflows. It can be expressed as a whole unit. A change in stock can only be caused by a ‘flow’ or ‘ratio’, which is usually expressed as a function of unit time. Parameters are numerical values that remain constant throughout the simulation. They can also affect other variables and flows in the model.
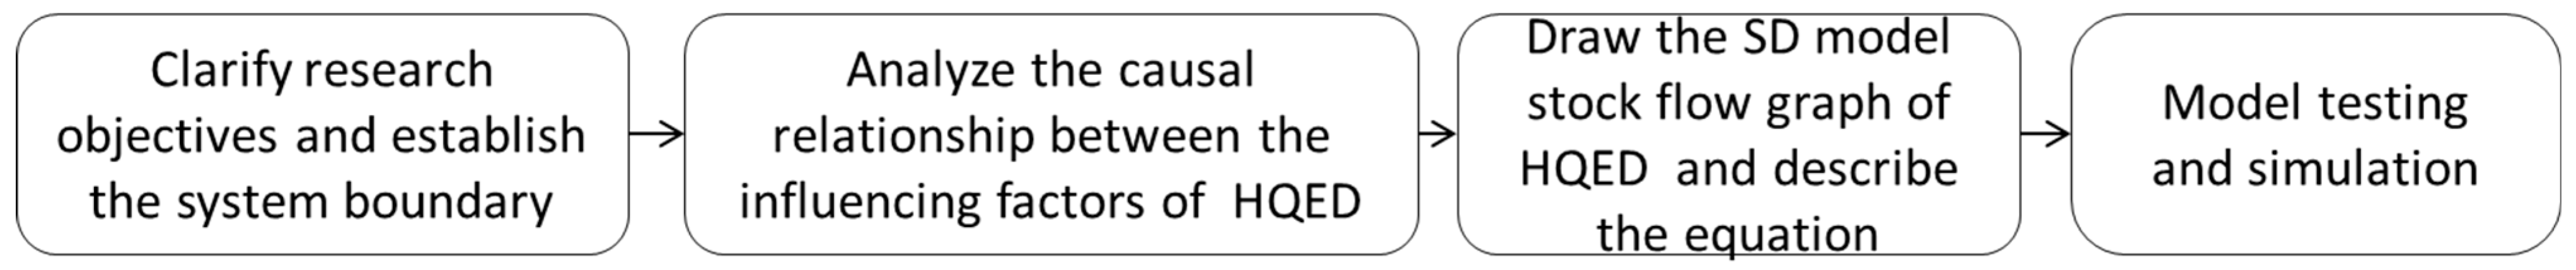
SD modeling generally includes the following steps: First, clarify the research objectives and establish the system boundary; Second, causality analysis; Third, draw the SD model stock flow graph and describe the equation; Fourth, model testing and simulation. Figure 2 shows an analysis framework for HQED based on SD.

Figure 2.
An analysis framework for HQED based on SD.
3.2. Dynamic Hypothesis
HQED is a dynamic development, and its different stages have different characteristics. For example, the mode of economic growth and the state of development. Before modeling the system dynamics, the system boundary should be established, that is, the useful factors should be incorporated into the model. China’s new development concept has significant guidance for the realization of HQED, which reflects the characteristics of interconnection and interaction. This paper appropriately simplified the model around the factors of innovation, coordination, green, openness, and sharing.
The factors influencing the HQED system are complex. Therefore, it is necessary to put forward the following hypotheses. Firstly, we consider HQED as a whole, and its development process is continuous and stable. Secondly, we only analyze the main factors and do not consider the system fluctuations caused by random factors and non-common factors.
4. Model Description and Mathematical Formulation
This section presents a detailed causal analysis diagram and a stock-flow diagram. The selection of research variables in this paper is based on the DPSIR theoretical model, while the selection of key parameters is derived from relevant government development plans and reports. The data mainly come from a variety of sources, such as the China Statistical Yearbook, China Environmental Statistical Yearbook, China Science and Technology Statistical Yearbook, China Outward Foreign Direct Investment Statistical Bulletin, China Energy Statistical Yearbook, and the statistical yearbooks of other provinces. In order to describe the relationships between the systems, notations and formulations have been assigned to each variable. The summary of all the notations and formulations used is shown in Table 1.

Table 1.
The summary of variables and formulations.
Referring to the concept of physical potential energy proposed by Zheng and Le [35], this paper puts forward the concept of HQED potential energy. In this paper, in order to analyze the evolution process of the HQED system, we use the potential energy of the HQED to measure the level of HQED in a certain region. According to the definition of potential energy, we define the potential energy of HQED as follows.
In Formula (1), represents the change of HQED potential energy. represents the change in innovation level, which means that the more innovation investment and human capital, the higher the innovation potential. represents the change of coordination level, which means that the higher the industrial structure and regional coordination, the higher the coordination potential. represents the change of green level, which means that the more green investment and the less pollution emission, the higher the green potential energy. represents the change of open level, which means that the higher the level of foreign capital and foreign trade, the higher the opening potential. represents the change of open level, which means that the higher the level of people’s living and social welfare, the higher the potential energy of share.
According to the above analysis, we use Vensim PLE x64, a system dynamics software, to draw a causal loop diagram reflecting the interaction relationship between different system elements of HQED. As shown in Figure 3, it consists of four positive feedback loops and a negative feedback system, namely innovation, coordination, openness, sharing, and green. At the same time, each subsystem interacts with each other. The directional arrow represents the causal link from cause to effect, with the positive and negative of the causal link represented by ‘+’ and ‘−’ respectively. Specifically, a positive causal link indicates that two linked variables will increase or decrease together (same direction), while a negative polarity between two variables implies an inverse or opposing relationship (opposite direction), that is, an increase in one variable causes a decrease in the other linked variable and vice versa [36].
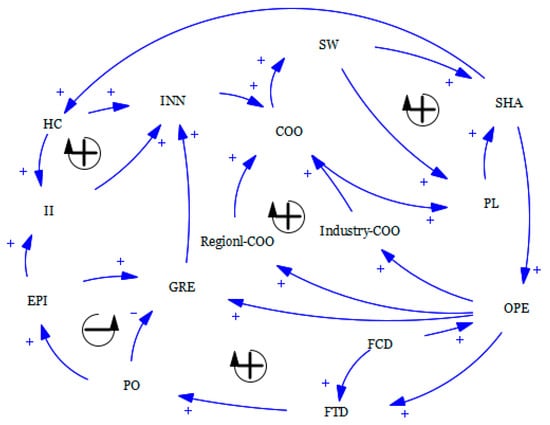
Figure 3.
Causality diagram of HQED. Note: black arrows represent positive or negative feedback loops, and blue arrows represent positive or negative relationships between variables.
The innovation loop (reinforcing feedback) indicates the higher the level of innovation, the higher the level of coordination, which can promote the development of social welfare leading to the improvement of the level of sharing. In turn, the development of HQED is conducive to the increase of human capital, which stimulates innovation input. As innovation input increases, the improvement of innovation is more active. This loop leads to an increase in human capital and results in an increase in HQED. In the coordination loop (reinforcing feedback), the higher the level of coordination, the better the people’s living standards, which can stimulate the development of share. Sharing will promote the operation of foreign capital, which is conducive to enhancing the level of openness. With the development of openness, the coordinated development of industrial structures will be much higher, leading to the development of coordination. This loop results in an increase in industrial structure coordination and brings about an increase in HQED. The open loop (reinforcing feedback) denotes that the improvement of the degree of openness is conducive to the coordinated development of regions, which can accelerate coordination. The improvement of coordination is a prerequisite for social welfare, and then the level of share becomes higher. This also provides a good social environment for the operation of foreign capital. As the foreign capital augments, the level of openness is higher. This loop causes an increase in foreign capital and leads to an increase in HQED. At the share loop (reinforcing feedback), sharing can promote the realization of foreign capital, which is necessary for the improvement of openness. Openness is an essential foundation for coordination among regions. As the level of coordination augments, so does social welfare. Therefore, people’s living standards will be improved, which is an important embodiment of shared development. This loop gives rise to an increase in coordination and causes an augment in HQED. The green loop (balancing feedback) shows that the improvement of green encourages enterprises to innovate, which is conducive to coordination. As the level of coordination increases, then the sharing increases, which is conducive to the development of foreign capital. Due to the “pollution avoidance” effect produced by foreign trade, it undoubtedly increases pollution emissions, and then inhibits green development. This loop gives rise to a decrease in pollution and causes an augment in HQED.
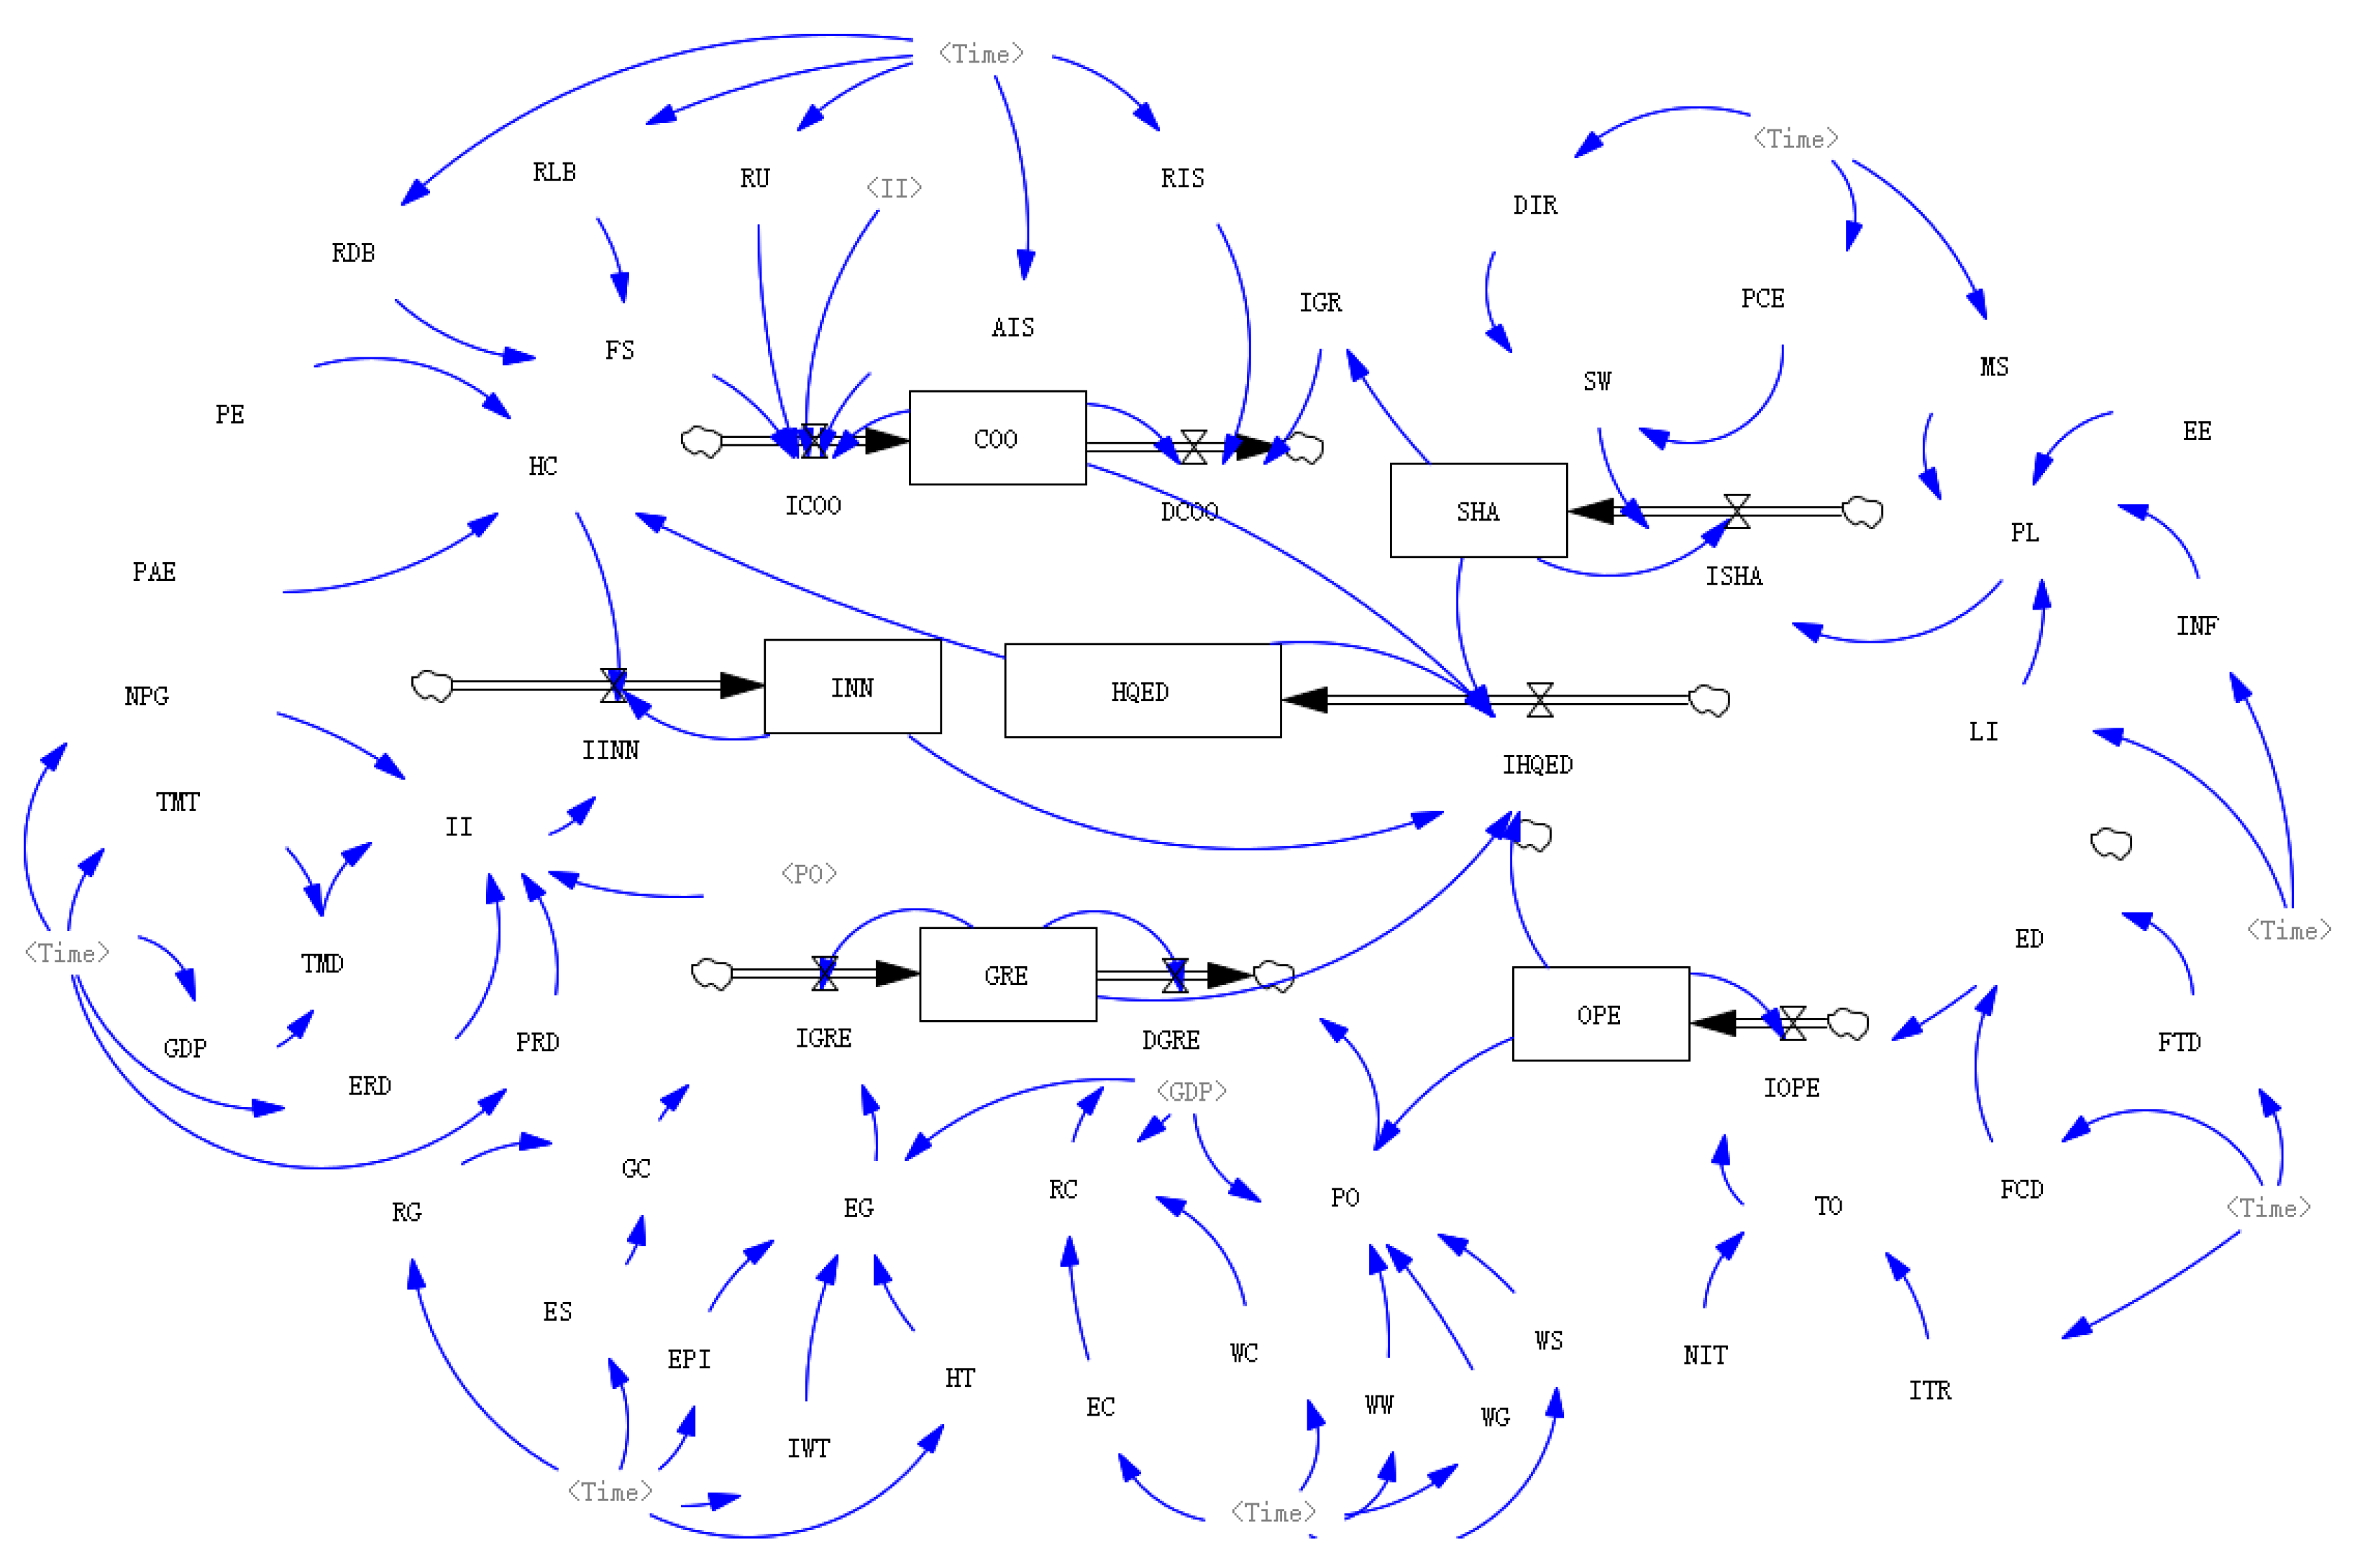
In fact, the causal loop diagram reflects the qualitative relationship among the subsystems of HQED. However, it cannot show the nature of the variables within the system. In order to quantitatively analyze the variables within the system and intuitively describe the logical relationship and the feedback loop, it is essential to build the stock flow diagram based on the causal loop diagram. As shown in Figure 4, based on the causal loop diagram, this paper refines the internal factors of each system and then constructs the dynamic stock-flow diagram of the HQED system. It consists of 59 variables, namely 6 state variables, 8 rate variables, 41 auxiliary variables, and 4 constants. State variables include innovation (INN), coordination (COO), green (GRE), openness (OPE), sharing (SH), and HQED. Flow variables include an increase in the level of innovation (IINN), an increase in the level of coordination (ICOO), decrease in the level of coordination (DCOO), increase in the level of green (IGRE), decrease in the level of green (DGRE), increase in the level of openness (IOPE), increase in the level of sharing (ISHA) and increase in the level of HQED (IHQED). Auxiliary variables include human capital (HC), technology market development (TMD), innovation input (II), financial structure (FS), social welfare (SW), people’s livelihood (PL), and so on. Constants include per capita years of education (PE), proportion of advanced education (PAE), education expenditure (EE), and the number of inbound tourism (NIT).
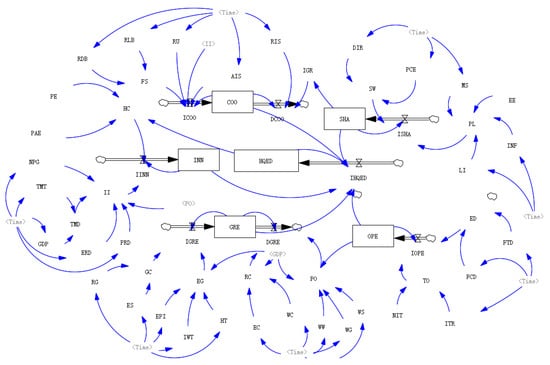
Figure 4.
Stock flow diagram of HQED. Note: <Time> represents a table function with a time-implicit variable. The black arrows represent the relationship between stocks and flows, and the blue arrows represent the relationship between other variables, including flows, auxiliary variables, and constants.
5. Simulation Results and Discussion
Referring to the research of Ge et al. [37], we define the time boundary of the system according to the time proposed by China’s new development concept and the availability of data. Therefore, we choose 2015–2019 as the time boundary of the system model simulation and the actual situation. Considering the 2030 carbon peaking target, which is consistent with HQED, we set the time boundary point of the projection to 2030. Specifically, we choose 2020–2030 as the time boundary of system policy simulation prediction, whose step length is 1 year. This can reflect the validity of the SD model from two aspects, namely the accuracy of historical simulation and the reliability of prediction.
5.1. Validation Test
System dynamics models need to be tested for validity, which mainly includes theory tests and authenticity tests [38]. The theory test runs through the whole process of the modeling, while the authenticity test can be divided into operation tests and history tests. According to the operation test, it is shown that both the model structure and variable units pass the test, which means that the model can run normally without abnormal result output. By comparing the simulated value with the actual value, the model passed the history test. Specifically, this paper takes stock variables as the test variables, including HQED, innovation, coordination, green, openness and sharing. The historical data from 2015–2019 are compared with the simulated data, as shown in Table 2. The results show that the error of each stock variable is within ±10%, indicating that the model is effective. Thus, the model can be used to simulate and predict the future development trend and the influence path of HQED.
Table 2.
Error test of real value and simulated value.
5.2. Sensitivity Analysis
In order to increase the reliability of the model, we perform a sensitivity analysis. Specifically, referring to Gu et al. [39], we increased several key variables in the subsystems of innovation, coordination, green, openness, and sharing by 20% to observe their impact on changes in HQED. The simulation results are shown in Table 3. As can be seen from the results, the sensitivities of the variables are in the normal range, which increases the reliability of the model.
Table 3.
Sensitivity analysis.
5.3. Scenario Analysis
5.3.1. Baseline Scenario Analysis
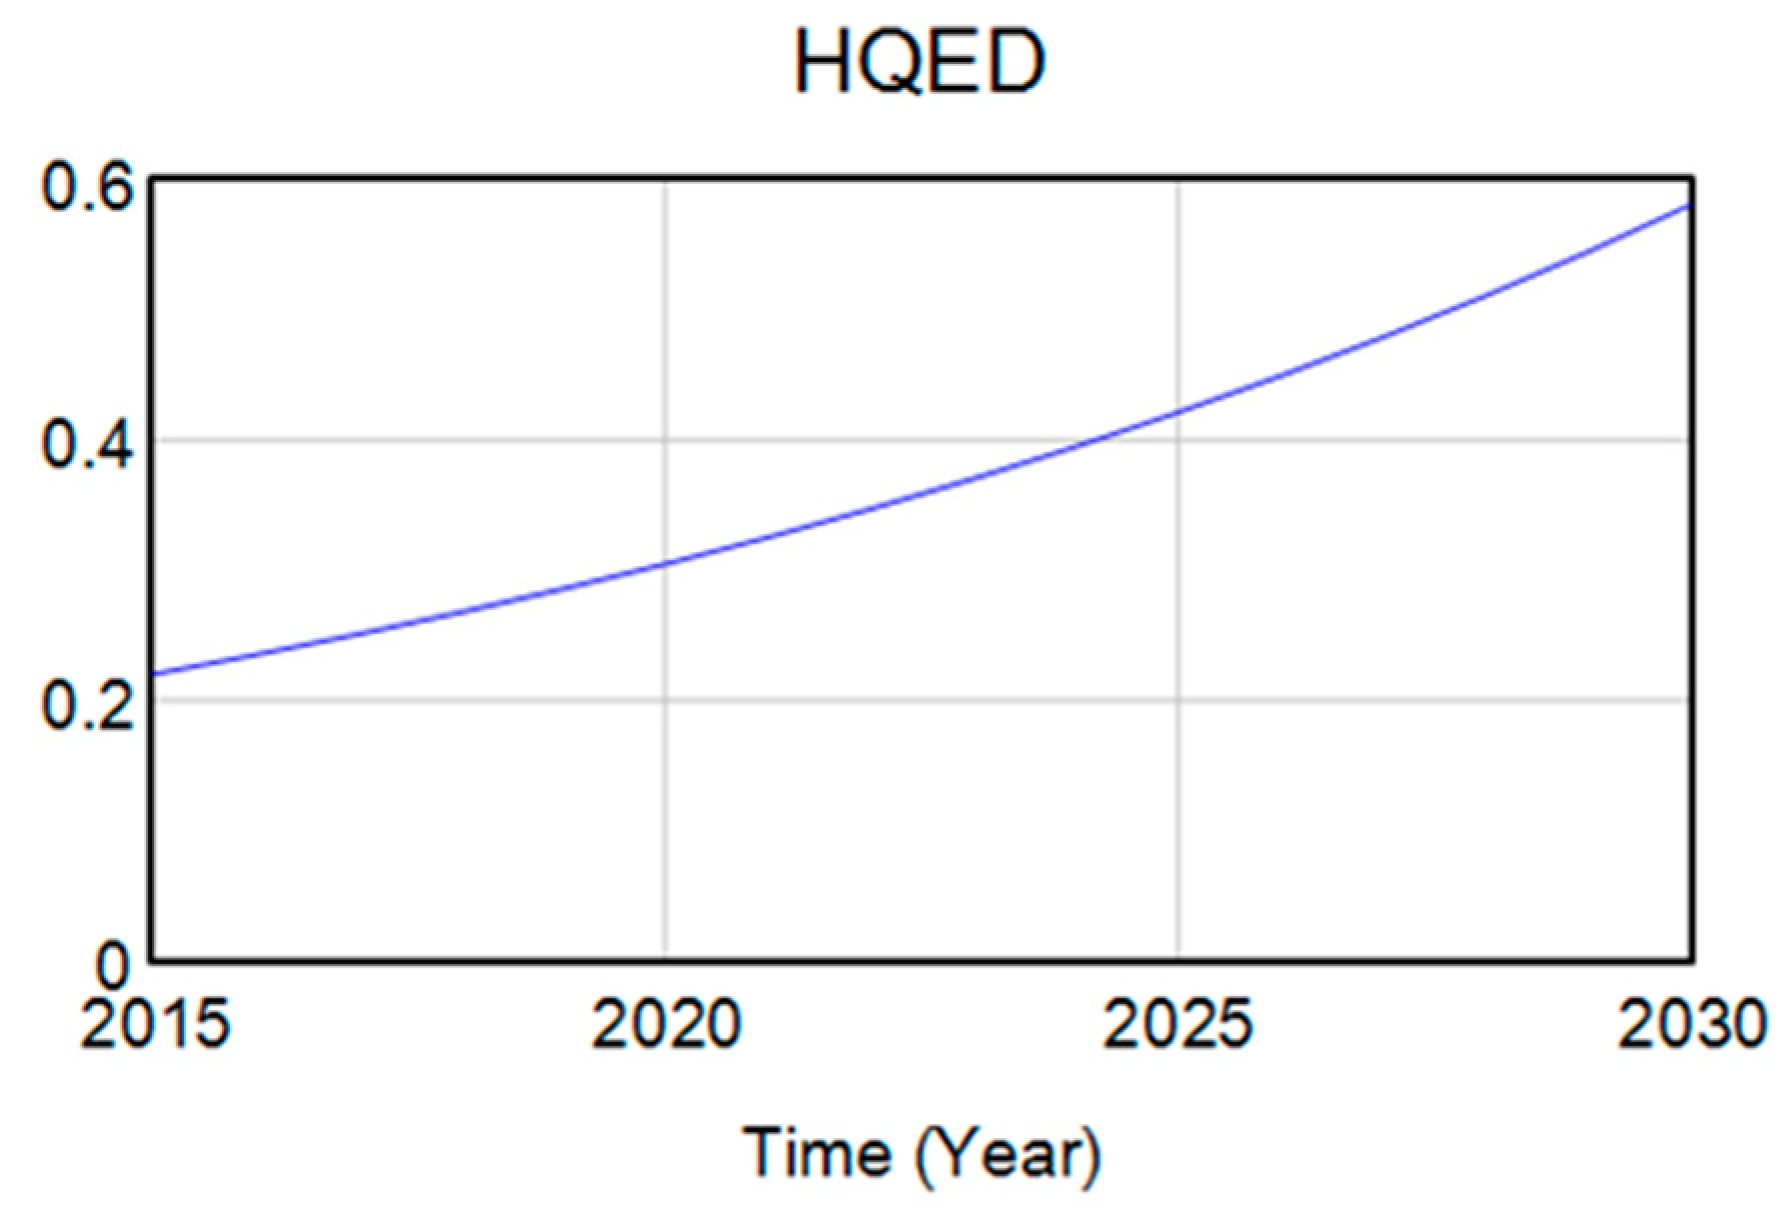
Figure 5 shows the simulation results of the HQED system from 2015 to 2030 if the policy remains unchanged (baseline scenario), including the simulation data and the changing trend of HQED. Under the condition that the existing regulations and policies remain unchanged, it can be seen that with the continuous development of the economy, the HQED will maintain a steady upward trend from 2015 to 2030. Compared with 2020, the HQED will reach 0.55 in 2030 with an increase of 66.7%, which is in line with China’s development goal of reaching the carbon peak to some extent. Therefore, the new development concept provides a good guideline for the realization of HQED and is also conducive to the realization of the national “3060” double carbon goal.

Figure 5.
The level of HQED in the baseline scenario.
5.3.2. Policy Scenario Analysis
HQED is a dynamic feedback process, which can respond to the changes of policies. Policy simulation refers to the impact of policy changes on the whole system, which can be realized by changing the key policy variables of the system dynamics model [26]. This is not only a prominent advantage of system dynamics analysis, but also an important method to achieve HQED. In order to analyze the effect of different policies on HQED, this paper chooses the regulation variables according to the relevant policies, including innovation input, human capital, regional coordination, industrial structure coordination, green investment, pollution emission, foreign capital, foreign trade, social welfare, and people’s lives. Compared with the base scenario A, A1-1~A5-2 are simulation scenarios in which a certain control measure is implemented separately, as shown in Table 4. According to the research of Tong et al. [40], the setting of the policy scenario in the model is mainly based on the relevant development plans and reports of the government, such as the relevant planning outline of the 14th Five-Year Plan.
Table 4.
Setting of policy scenario for HQED.
Based on the above scenario setting, the level of HQED is simulated. Table 4 shows the simulated value of HQED from 2020 to 2030 under different regulatory scenarios. The A3-2 regulatory measure is an inverse indicator, so except for a 30% reduction in that scenario, the other scenarios increase by 30%. It can be seen that the level of HQED maintains an overall stable growth trend from 2020 to 2030. According to the annual rate of change, the level of HQED is significantly improved compared with the baseline scenario.
The level of HQED under each regulatory subsystem is plotted based on the numerical values of the simulation, as shown in Table 4. It also shows the optimal regulatory measure under each subsystem. As we can see, the policy effect of enhancing human capital is better than that of improving innovation capability under the innovation subsystem, indicating that human capital is an important driving force for innovation. According to Table 5, we can see that the policy effect of enhancing regional coordination is better than that of improving industrial structure coordination, the effect of increasing green investment is better than that of reducing pollution emissions, the policy effect of improving foreign trade is better than that of foreign capital, and the policy effect of enhancing livelihood is better than that of improving social welfare.
Table 5.
Simulation values of HQED in various regulatory scenarios.
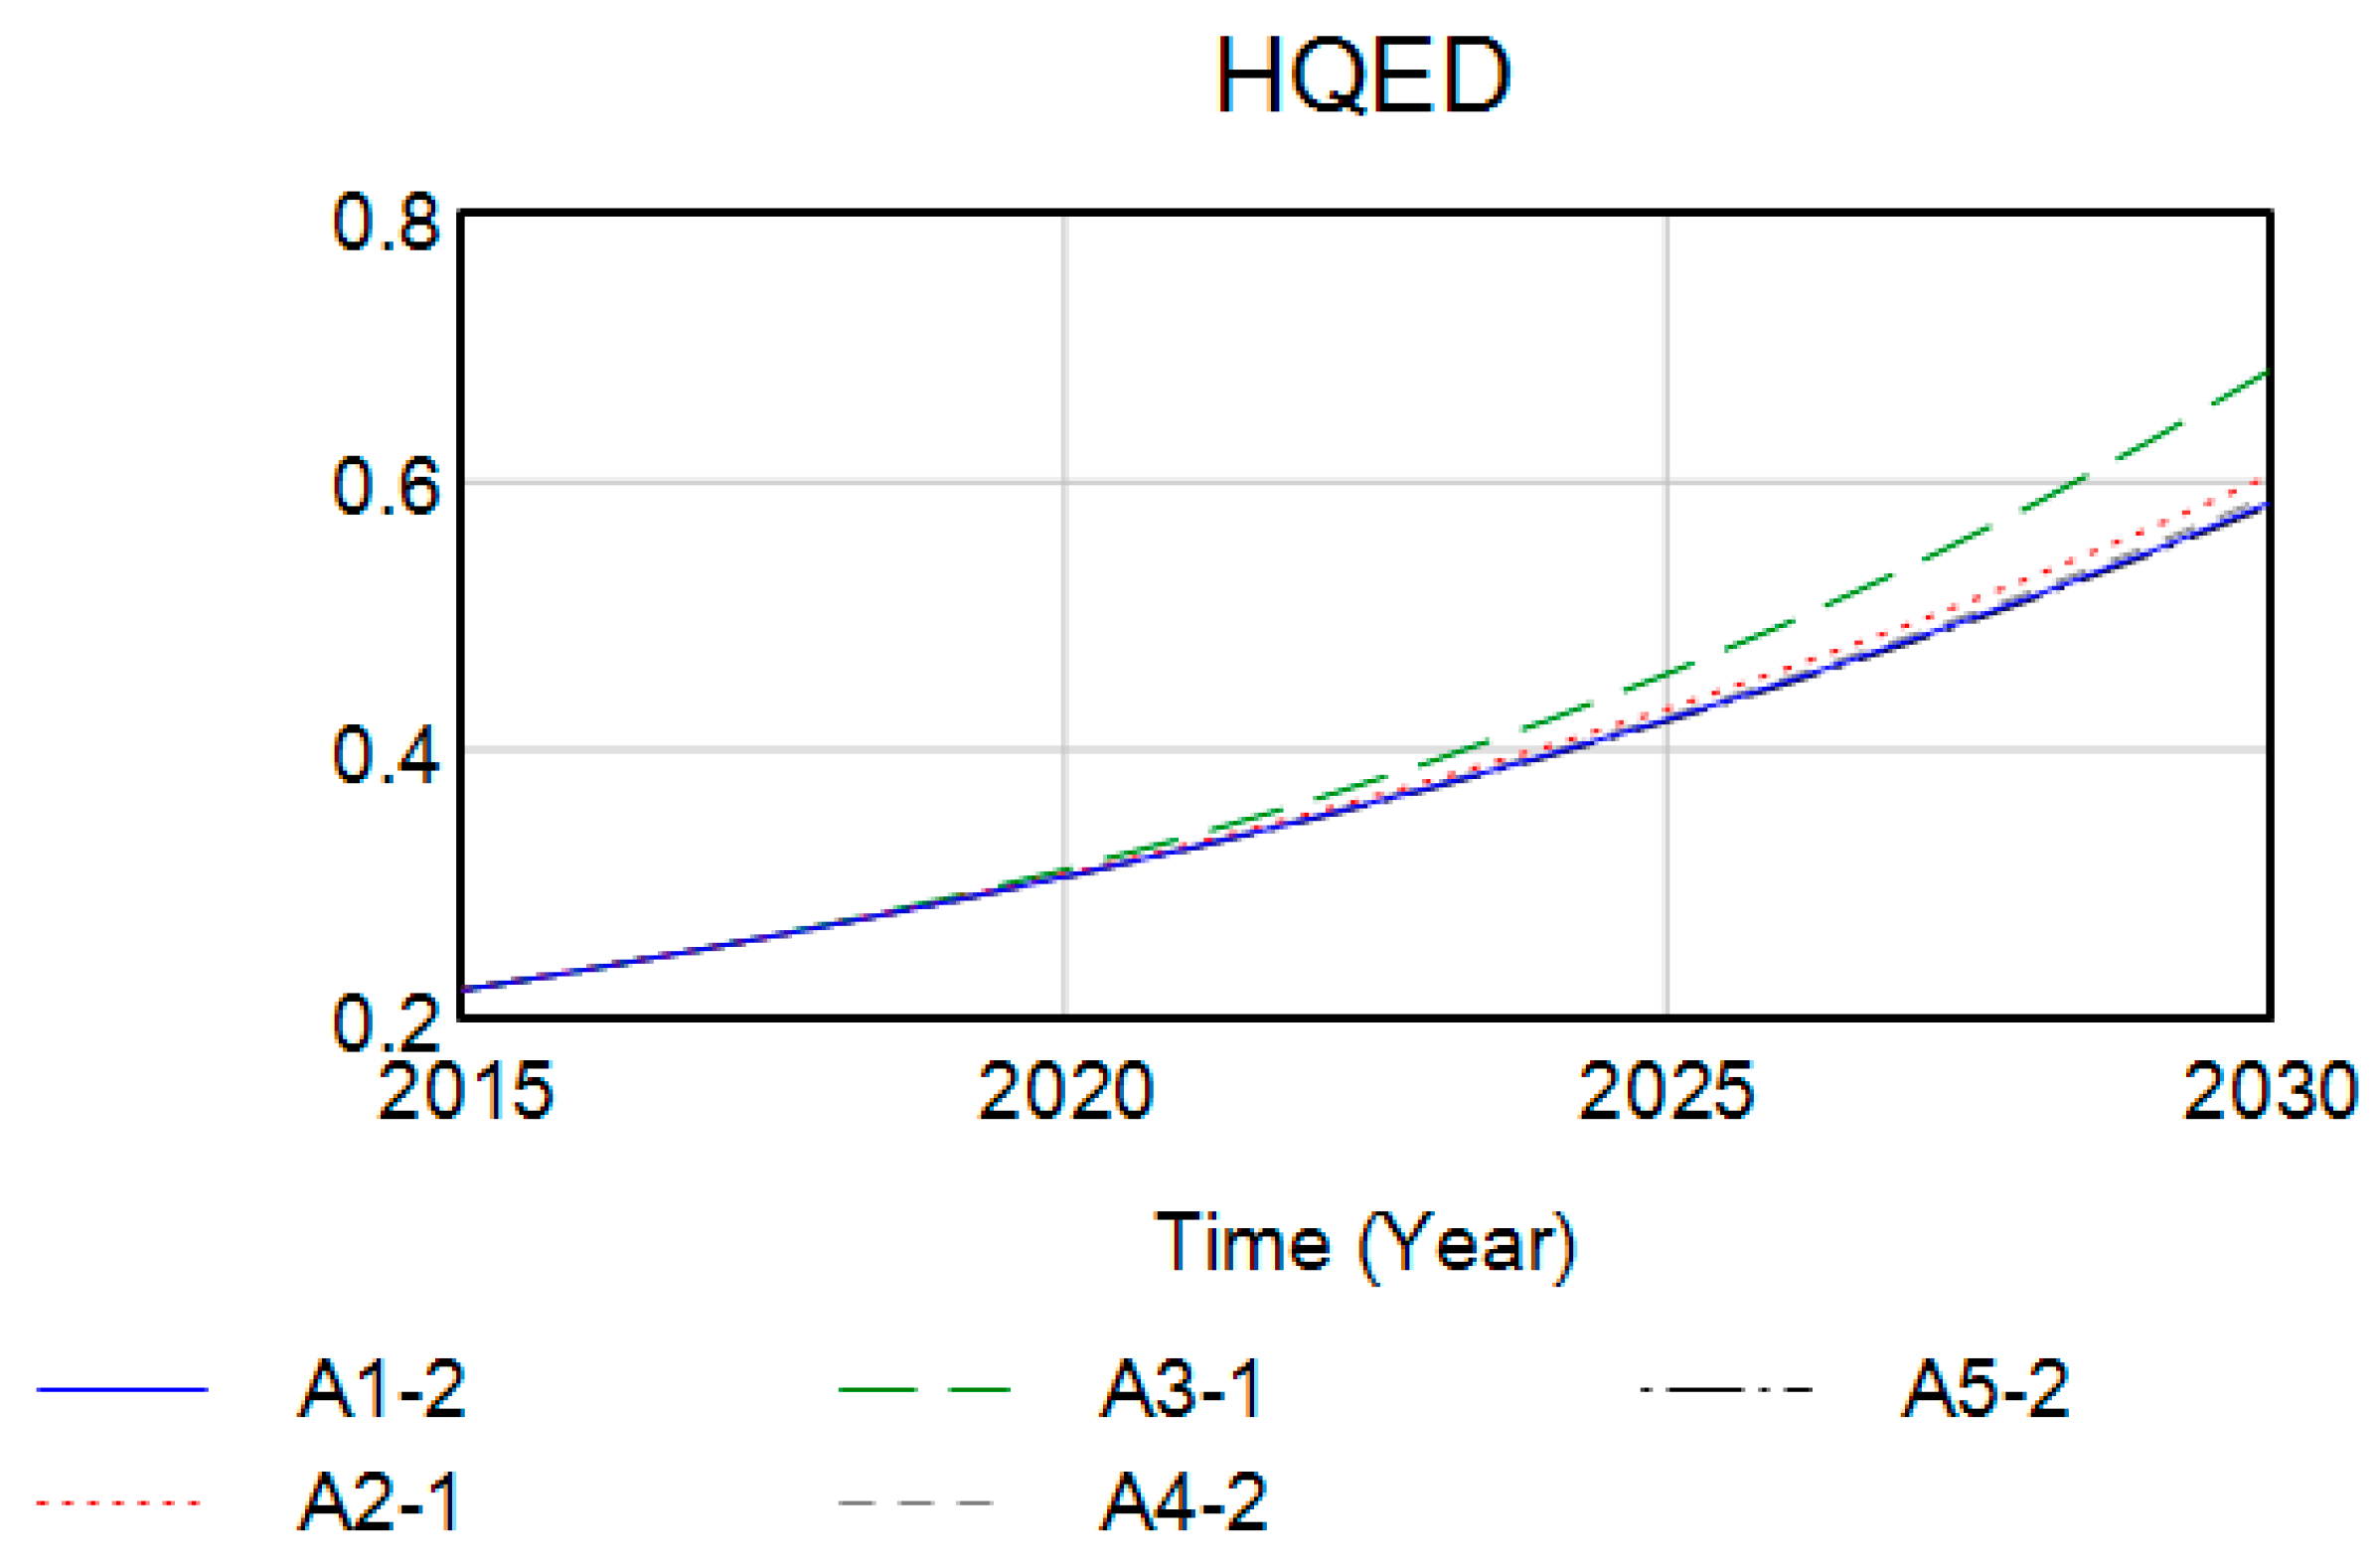
Based on the comparison of optimal strategies under the above five subsystems, the order of effect of the regulatory measure is shown in Figure 6. As we can see, increasing green investment is the most effective, followed by enhancing regional coordination, and then enhancing foreign trade and improving human capital, and the weakest is improving livelihood, with 8.22540%, 7.02806%, 6.79506%, 6.71600%, and 6.69220% respectively.
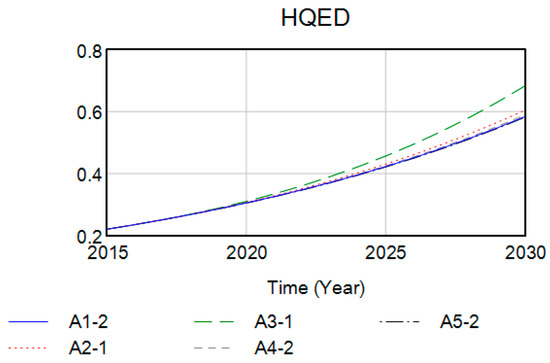
Figure 6.
The level of HQED in various regulatory scenarios.
Next, based on the above analysis, we conduct multiple policy scenarios, including openness-oriented, environment-oriented, and balanced scenarios. The environment-oriented scenario is a combination of improving human capital (A1-2) and increasing green investment (A3-1). The openness-orientated scenario is a combination of enhancing regional coordination (A2-1) and enhancing foreign trade (A4-2). The balanced scenario is a combination of the open and environmentally oriented types. As shown in Table 6, the balanced scenario (6.7203%) is the most efficient, followed by the environment-oriented (6.7073%), and the weakest is the openness-oriented scenario (6.6811%). Moreover, the openness-orientated policy effects are better than single policy effects of enhancing regional coordination (A2-1) and enhancing foreign trade (A4-2). Interestingly, combined policies are also more effective than single policies, which does not always apply. For example, the policy effects of the environment-oriented scenario are better than that of the improved human capital scenario (A1-2), but weaker than that of the increased green investment scenario (A3-1).
Table 6.
Simulation values of HQED in multiple policy scenarios.
5.4. What to Regulate and How to Regulate
In the regulatory process of HQED, the two key questions of what to regulate and how to regulate need to be well answered [26], which are important for the formulation and implementation of HQED policies.
5.4.1. What to Regulate
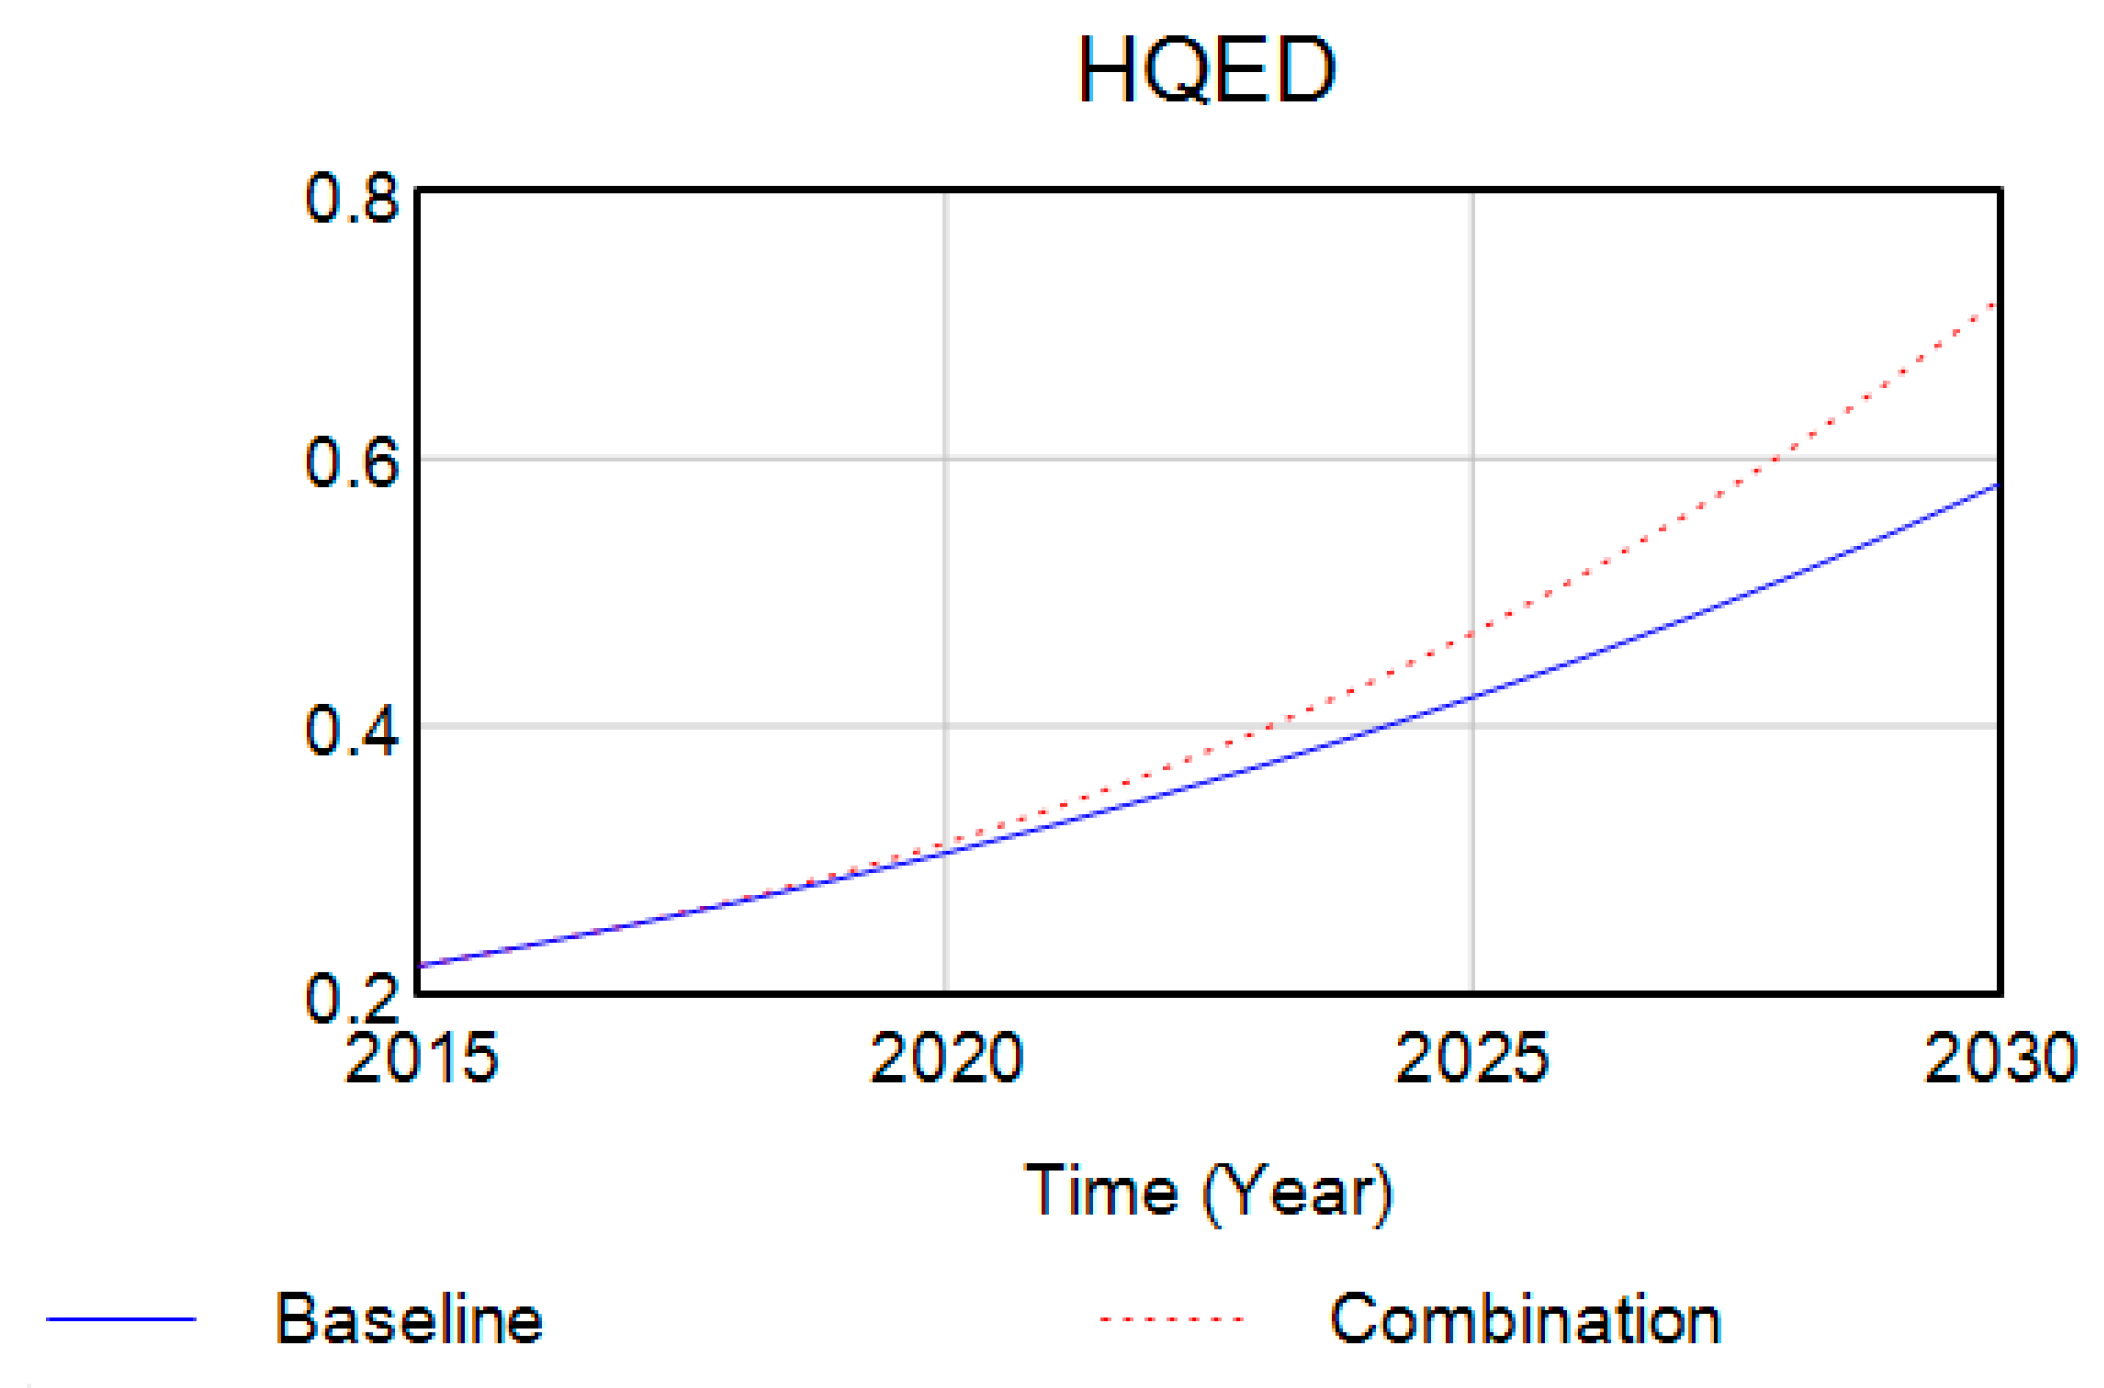
According to the above simulation results, compared with the baseline scenario, the regulatory measures of improving human capital (A1-2), enhancing regional coordination (A2-1), increasing green investment (A3-1), enhancing foreign trade (A4-2) and improving livelihood (A5-2) can effectively improve the level of HQED. Therefore, this paper selects the regulatory measures of A1-2, A2-1, A3-1, A4-2, and A5-2 as the regulation combination, which is increased by 30%. Figure 7 shows the dynamic changes of HQED under the baseline scenario and the regulatory combination scenario. It can be seen that the level of HQED under the combination scenario is significantly higher than that under the baseline scenario, and the rate of improvement gradually increases over time because of a time lag effect in the early stages of policy implementation. The research results provide powerful decision support for the implementation of combination measures for HQED.
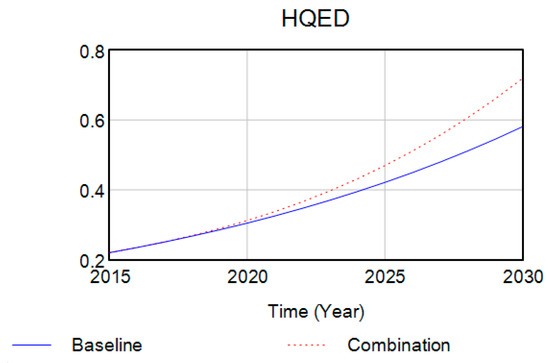
Figure 7.
Comparison between the baseline and the combination of HQED.
5.4.2. How to Regulate
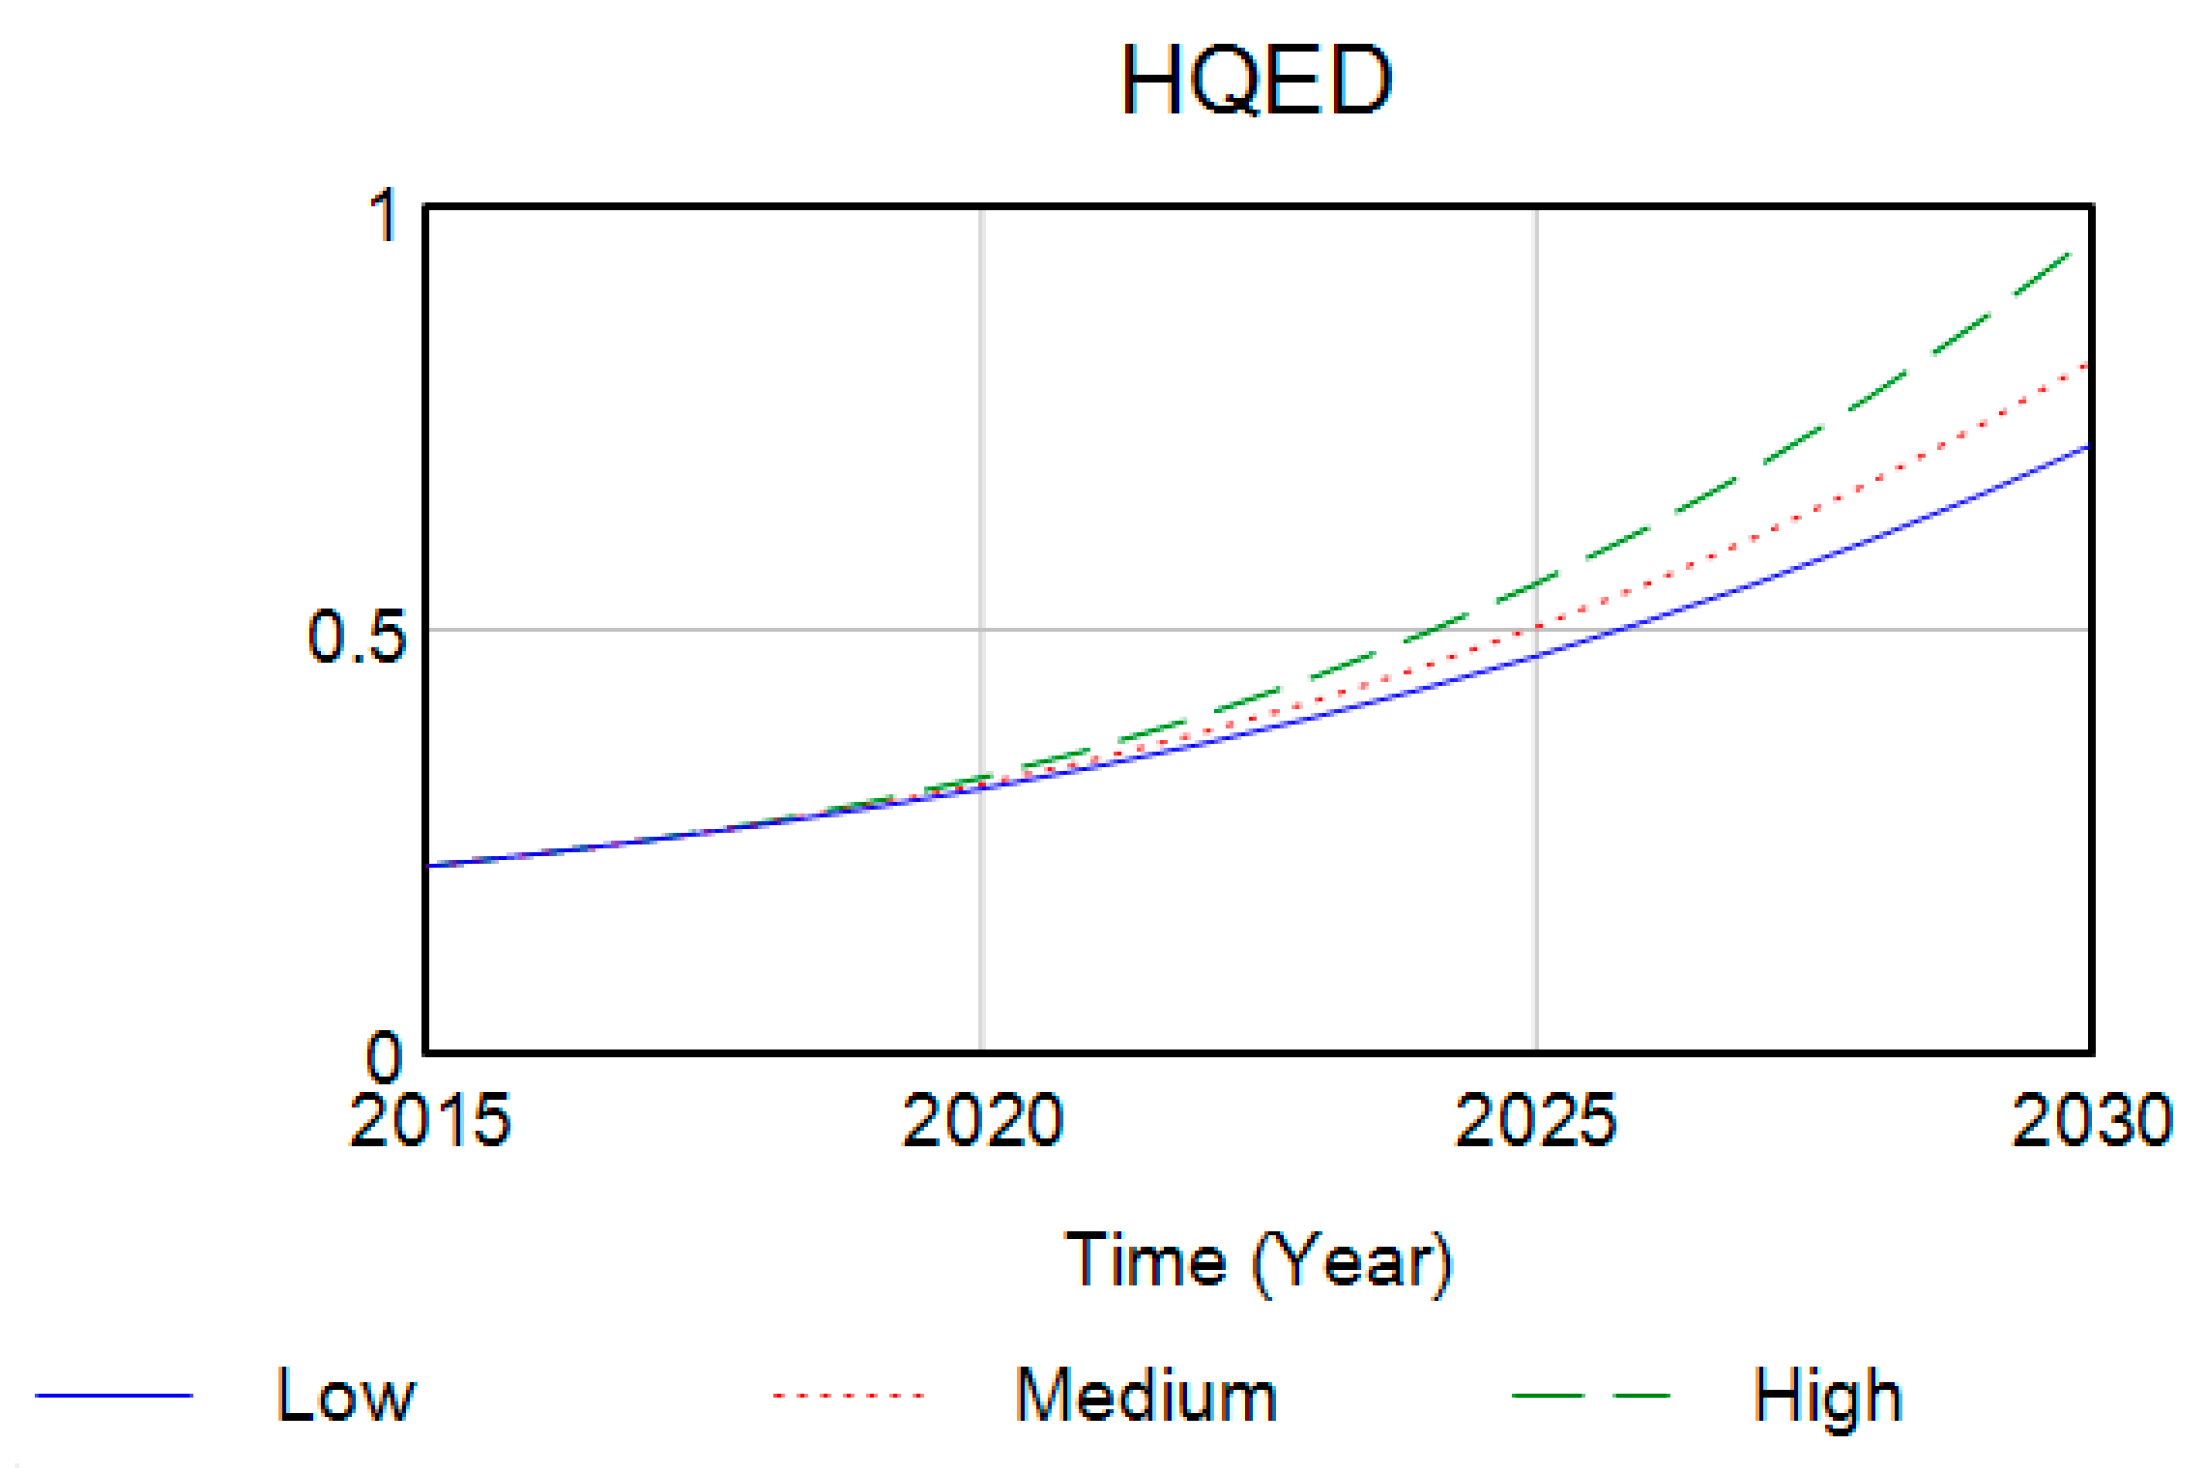
The key to how to regulate is to determine the time and the extent of regulation. The system of HQED is dynamic, so the control measures need to be adjusted in time. In fact, the HQED increases with the implementation of regulatory policies. Therefore, the question of the extent of regulation needs to be answered. According to the control intensity of the regulatory combination, it is divided into low-speed mode (30%), medium-speed mode (50%), and high-speed mode (80%), as shown in Figure 8. As can be seen from Figure 8, the level of HQED is positively correlated with the extent of regulatory combination. In other words, the level of HQED under high-speed mode is the highest, followed by the level of HQED under medium-speed mode, and the level of HQED under low-speed mode is the lowest. Furthermore, from the numerical point of view, the average annual growth rate of HQED under the low-speed mode, medium-speed mode, and high-speed mode is 11.50243%, 9.93048%, and 8.70611%, respectively, which is consistent with the above research conclusions.
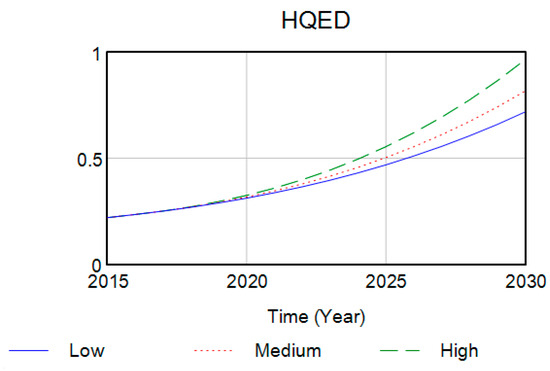
Figure 8.
Comparison of different level of HQED under regulatory combinations.
6. Discussion
Existing studies on the measurement of HQED can be divided into single type [3,4] and composite index. However, the single-type method cannot reflect the multi-dimensionality of HQED. Thus, most scholars adopt the composite index, which is mainly guided by the new development concept [5]. However, the existing research on the construction of the HQED evaluation system lacks theoretical support. The DPSIR model is widely used in the research and evaluation of resource, environmental, social, and economic development [6]. This paper adopts the DPSIR model not only provides theoretical support for selecting the influencing factors of HQED, but also expands the application field of the DPSIR model.
Previous research in the analysis of factors influencing HQED can be divided into two categories, namely, empirical test method and factor analysis [7]. However, those methods cannot accurately describe the complex relationship between different influencing factors and HQED. Motivated by the aforementioned shortcomings in the literature, this paper aims to identify the influencing factors and the complex relationships among them using system dynamics (SD). SD combines the advantages of the empirical test method and factor analysis, which has the characteristics of qualitative and quantitative analysis. Moreover, it can effectively identify the influencing factors of HQED and compensate for the shortcomings of the above methods in describing the nonlinear among the factors and multivariable dynamic stochastic processes.
The policy implications are as follows. Firstly, The implementation of the HQED policies should be guided by China’s new development concept. We should focus on innovation, coordination, green development, openness, and sharing from a holistic view. In other words, we should improve human capital, enhance regional coordination, increase green investment, enhance foreign trade, and improve livelihoods. Secondly, the balanced scenario is the most efficient, followed by the environment-oriented, and the weakest is the openness-oriented scenario. However, combined policies are also more effective than single policies, which does not always apply. Therefore, the government needs to make choices based on the actual situation. Thirdly, combined with the current situation of HQED, we need to strengthen the policy regulation as much as possible to achieve high-quality economic development.
The limitation of this paper suggests directions for future research. The system dynamics model constructed in this paper is a highly abstract operation system of HQED, which inevitably simplifies the actual situation to some extent. In fact, the implementation of HQED regulatory measures in the real situation needs to consider the uncertain factors and costs. Both of them may have uncertain effects on policy choices. For example, a combination of policies is not necessarily more effective than a single policy. Moreover, policy performance is not the same at different costs. Therefore, future research should build a more realistic system dynamics model of HQED, and consider the impact of costs, which can explore more effective regulatory measures.
7. Conclusions
Under the guidance of China’s new development concept, we introduce the system dynamics model that can accurately describe the interaction within HQED, so as to reveal the correlation between various elements and the dynamic development process. We analyze the influence of various factors and their combinations on HQED under different regulatory scenarios through simulation modeling. It answers the two key questions of what to regulate and how to regulate in the process of HQED, providing a scientific basis for improving HQED.
The conclusions of this paper are as follows: First, the regulatory measures of improving human capital, enhancing regional coordination, increasing green investment, enhancing foreign trade, and improving livelihood can effectively improve the level of HQED. Among them, increasing green investment is the most effective, followed by enhancing regional coordination, and then enhancing foreign trade and improving human capital, and the weakest is improving livelihood, with 8.22540%, 7.02806%, 6.79506%, 6.71600%, and 6.69220%, respectively. It answers the question of what to regulate in the process of HQED and provides an order of priority for the government in formulating relevant policies. Second, for multiple policy scenarios, the balanced scenario is the most efficient, followed by the environment-oriented, and the weakest is the openness-oriented scenario. Interestingly, combined policies are also more effective than single policies, which does not always apply. Therefore, governments need to make rational policies based on development needs. Furthermore, the level of HQED is positively correlated with the regulatory intensity of the regulatory combination. In other words, the level of HQED is the highest under the high-speed mode, followed by the level of HQED under the medium-speed mode, and the level of HQED under the low-speed mode is the lowest. It answers the question of how to regulate the process of HQED and shows that HQED is in a period of rapid development and can be regulated as much as possible.
Author Contributions
Conceptualization, G.F. and J.T.; methodology, G.F.; software, G.F.; validation, G.F.; formal analysis, G.F.; data curation, G.F.; writing—original draft preparation, G.F.; writing—review and editing, G.F. and J.T.; visualization, G.F.; supervision, J.T.; funding acquisition, J.T. All authors have read and agreed to the published version of the manuscript.
Funding
This research was funded by the National Natural Science Foundation of China (71831003) and the Liaoning Provincial Climbing Scholars and Liaoning Provincial Higher Education Innovation Team Support Program (WT2016001).
Institutional Review Board Statement
Not applicable.
Informed Consent Statement
Not applicable.
Data Availability Statement
The data presented in this study are available on request from the corresponding author.
Acknowledgments
The authors are grateful to the editors and the anonymous reviewers for their insightful comments and suggestions.
Conflicts of Interest
The authors declare no conflicts of interest.
References
- Solow, R. A Contribution to the Theory of Economic Growth. Q. J. Econ. 1956, 70, 65–94. [Google Scholar] [CrossRef]
- Lucas, R.E. On the mechanics of economic development. J. Monet. Econ. 1988, 22, 3–42. [Google Scholar] [CrossRef]
- Chu, M.; Zong, J.F. Government Intervention, Financial Deepening and Structural Transformation: An Examination Based on the Investigation of ”New Northeast Phenomenon”. China Soft Sci. 2018, 1, 63–76. [Google Scholar]
- Niu, H.; Yan, C.L. Environmental Tax, Resource Allocation and High-quality Economic Development. J. World Econ. 2021, 44, 28–50. [Google Scholar]
- Jing, W.M.; Wang, Y.; Mo, L.J. Educational Human Capital Structure, Technological Transformation and Upgrading and High-quality Development of Regional Economy. J. Macro-Qual. Res. 2019, 7, 18–32. [Google Scholar]
- Jiang, M.; Yang, Z.; Zhang, X.; Li, P.; Xu, Y.; Zhao, Y.; Ren, Z.; Wang, D.; Wen, M. Assessment of Water Security in Shaanxi, Gansu, Ningxia, Qinghai and Xinjiang, Northwest China Based on DPSIR Model. J. Earth Sci. Environ. 2022, 44, 535–544. [Google Scholar]
- Peng, D.Y.; Zhu, M.T. Analysis of Priority on Influencing Factors of High-Quality Economic Development and the Evaluation. Ecol. Econ. 2020, 36, 50–56+76. [Google Scholar]
- Zhao, T.; Zhang, Z.; Liang, S.K. Digital Economy, Entrepreneurship, and High-Quality Economic Development: Empirical Evidence from Urban China. Manag. World 2020, 36, 65–76. [Google Scholar]
- Fu, G.M.; Tang, J.F. Is America’s Re-Industrialization a Blessing or a Curse: Can Two-Way FDI Promote China’s High-Quality Economy Development?—Based on the Mediating Role of Industrial Structure and Technological Innovation. J. Syst. Manag. 2022, 31, 1137–1149. [Google Scholar]
- Fan, Q.Q.; Chu, C.J.; Gao, J.N. Effect of environmental regulation and industrial structure upgrading on high-quality economic development. Chin. Popul. Resour. Environ. 2020, 30, 84–94. [Google Scholar]
- Jia, J.X.; Luo, L.H.; Gu, J. Local Environmental Regulation and High-quality Economic Development. China Ind. Econ. 2023, 422, 99–117. [Google Scholar]
- Huang, S.C.; Qu, J.S.; Chen, H.F. Measurement and Type Division of Imbalance of High-quality Economic Development. Stat. Decis. 2022, 38, 83–88. [Google Scholar]
- Tong, H.F.; Yang, Y.; Wang, J.Y.; Feng, Y. Modeling China’s Green Economy 2050: Scenario Analysis Based on the System Dynamics Model. China Soft Sci. 2015, 6, 20–34. [Google Scholar]
- Zhou, X.Y.; Xu, Z.D.; Xi, Y.Q. The system dynamic model and policy optimized simulation of energy conservation and emission reduction in China. Syst. Eng.-Theory Pract. 2018, 38, 1422–1444. [Google Scholar]
- Liu, X.; Zeng, M. Renewable energy investment riske valuation model based on system dynamics. Renew. Sustain. Energy Rev. 2017, 73, 782–788. [Google Scholar] [CrossRef]
- Saleh, M.; Oliva, R.; Kampmann, C.E.; Davidsen, P.I. A comprehensive analytical approach for policy analysis of system dynamics models. Eur. J. Oper. Res. 2010, 203, 673–683. [Google Scholar] [CrossRef]
- Qiao, H.; Xu, J.R.; Zhang, S. Research on the impact of community e-commerce value creation based on system dynamics. Syst. Eng. Theory Pract. 2023, 43, 2615–2631. [Google Scholar]
- Bubnicki, Z. Modern Control Theory; Springer Science & Business Media: Berlin/Heidelberg, Germany, 2005. [Google Scholar]
- Kim, D.H.; Senge, P.M. Putting Systems Thinking into Practice. Syst. Dyn. Rev. 1994, 10, 277–290. [Google Scholar] [CrossRef]
- Li, X.; Wang, X. A Study of the Function-Based Policy Optimization in System Dynamics Model. Int. J. Innov. Comput. Inf. Control 2010, 6, 2847–2856. [Google Scholar]
- Größler, A.; Thun, J.H.; Milling, P.M. System Dynamics as a Structural Theory in Operations Management. Prod. Oper. Manag. 2008, 17, 373–384. [Google Scholar] [CrossRef]
- Datola, G.; Bottero, M.; De Angelis, E.; Romagnoli, F. Operationalising resilience: A methodological framework for assessing urban resilience through System Dynamics Mode. Ecol. Model. 2022, 465, 109851. [Google Scholar] [CrossRef]
- Sterman, J.D. Learning in and about complex systems. Syst. Dyn. Rev. 1994, 10, 291–330. [Google Scholar] [CrossRef]
- Lyneis, J.M. System dynamics for market forecasting and structural analysis. Syst. Dyn. Rev. 2000, 16, 3–25. [Google Scholar] [CrossRef]
- Ganji, F.; Nasseri, M. System dynamics approaches to assess the impacts of climate change on surface water quality and quantity: Case study of Karoun River, Iran. Environ. Sci. Pollut. Res. 2021, 28, 31327–31339. [Google Scholar] [CrossRef] [PubMed]
- Wang, Z.Y.; Fu, X.T. Scheme simulation and predictive analysis of water environment carrying capacity in Shanxi Province based on system dynamics and DPSIR model. Ecol. Indic. 2023, 154, 110862. [Google Scholar] [CrossRef]
- Porter, M.E.; van der Linde, C. Toward a New Conception of the Environment-Competitiveness Relationship. J. Econ. Perspect. 1995, 9, 97–118. [Google Scholar] [CrossRef]
- Yao, S.J. China’s economic theory and strategy for overcoming the “Middle income trap”. Int. Econ. Rev. 2018, 1, 86–107+6. [Google Scholar]
- Zhang, K.; Huang, L. The Power of Composition: Human Capital Upgrade, Institutional Environment and Regional Innovation Capability. Mod. Econ. Sci. 2022, 44, 28–41. [Google Scholar]
- Ren, Y.; Wu, K.J.; Lim, M.K.; Tseng, M.L. Technology transfer adoption to achieve a circular economy model under resource-based view: A high-tech firm. Int. J. Prod. Econ. 2023, 264, 108983. [Google Scholar] [CrossRef]
- Cuthbertson, R.W.; Furseth, P.I. Digital services and competitive advantage: Strengthening the links between RBV, KBV, and innovation. J. Bus. Res. 2022, 152, 168–176. [Google Scholar] [CrossRef]
- Braganza, A.; Brooks, L.; Nepelski, D.; Ali, M.; Moro, R. Resource management in big data initiatives: Processes and dynamic capabilities. J. Bus. Res. 2017, 70, 328–337. [Google Scholar] [CrossRef]
- Homer, J.B.; Hirsch, G.B. System dynamics modeling for public health: Background and opportunities. Am. J. Public Health 2006, 96, 452–458. [Google Scholar] [CrossRef] [PubMed]
- Zhu, B.Z.; Tang, J.J.; Jiang, M.X.; Wang, P. Simulation and regulation of carbon market risk based on system dynamics. Syst. Eng. Theory Pract. 2022, 42, 1859–1872. [Google Scholar]
- Zheng, L.; Le, Z.J. Research on System Dynamics Model for Government Public Information Resources Allocation System. China Soft Sci. 2011, 8, 178–184. [Google Scholar]
- Yao, C.Y.; Chen, G.J.; Zhang, Y. Study on the path of urban ecosystem construction based on System dynamics: A case study of Tianjin. J. Environ. Sci. 2020, 40, 1921–1930. [Google Scholar]
- Ge, Y.J.; Qu, J.S.; Gao, X.Y.; Liu, C.S.; Tang, J.; Song, X. Simulation of Chinese Household Carbon Emission Based on System Dynamics. Sci. Technol. Manag. Res. 2022, 42, 239–246. [Google Scholar]
- Song, Y.Q.; Wang, Q.; Li, H.J.; Li, G.J. Modeling and simulation of enterprise innovation investment decision based on system dynamics. Syst. Eng. Theory Pract. 2018, 38, 3097–3108. [Google Scholar]
- Gu, M.R.; Wang, F.; Wang, S.H. Simulation of China’s Green Development Policy Based on System Dynamics. Chin. J. Environ. Manag. 2021, 13, 126–135. [Google Scholar]
- Tong, M.H.; Chu, C.C.; Li, Y. Research on the Distribution Dynamics, Regional Differences and Convergence of China’s High-quality Economic Development. J. Quant. Technol. Econ. 2022, 39, 3–22. [Google Scholar]

Disclaimer/Publisher’s Note: The statements, opinions and data contained in all publications are solely those of the individual author(s) and contributor(s) and not of MDPI and/or the editor(s). MDPI and/or the editor(s) disclaim responsibility for any injury to people or property resulting from any ideas, methods, instructions or products referred to in the content. |
© 2024 by the authors. Licensee MDPI, Basel, Switzerland. This article is an open access article distributed under the terms and conditions of the Creative Commons Attribution (CC BY) license (https://creativecommons.org/licenses/by/4.0/).