Abstract
Due to the effects of global warming, the vapor pressure deficit (VPD) will inevitably and continuously rise in future, which is a fact that must be faced when discussing the sustainable development of vegetation ecosystems. Understanding the response of vegetation to changes in the atmospheric moisture state is necessary for minimizing the adverse effects of climate change. Using the leaf area index (LAI) and meteorological data in the Yellow River Basin collected over nearly 40 years, we explore the spatiotemporal variations in VPD and vegetation within the growing season and the differences in the effects of VPD on vegetation in different climatic zones. The results show the following: (1) both VPD and LAI in the Yellow River Basin show an increasing trend, in which VPD increases radially outward centered on the arid regions, while the vegetation develops favorably over almost the whole basin; (2) at the whole-basin scale, the area of VPD positively correlated with vegetation growth is greater than the area of negative correlation, and this overall trend is increasing significantly; (3) the VPD exerts heterogeneous effects on different vegetation in different climatic zones, and these heterogeneity findings suggest that the effects of VPD on vegetation are more influenced by differences among the climatic zones of the vegetation than by differences in the vegetation types themselves. Our results provide insights into the effects of atmospheric moisture on vegetation growth and provide references for the sustainable development of vegetation ecosystems and future safeguarding strategies of vegetation over large spatial scales.
1. Introduction
Terrestrial vegetation growth in the context of global warming is increasingly water-limited, and atmospheric drought is one of the important influences on terrestrial vegetation growth [1,2,3]. VPD is the difference between the saturated water vapor pressure of air at a given temperature and the actual water vapor pressure at that temperature, which is an important indicator of atmospheric drought, closely related to the physiological processes of vegetation, and a key factor in determining the photosynthesis of plants [4,5,6]. An increase in VPD can promote stomata opening in plant leaves for photosynthesis, but when the VPD is excessive, plants reduce their stomatal conductance and photosynthesis to minimize water loss so their growth is inhibited [7], and an extreme increase in VPD can induce plant tissue and death [8]. In addition to affecting plant physiology, an excessive VPD can cause the rapid evaporation of soil water, plant water stress, and drought [9]. For vegetation in arid regions, the low precipitation, soil water deficit, and high air temperatures associated with drought usually lead to a decrease in stomatal conductance, photosynthetic CO2 uptake, and annual forest production [10]. Soil water deficit is a phenomenon that frequently occurs during vegetation growth and hinders the water transport process from the root to the leaf, thus affecting the absorption of nutrients from the soil, inhibiting the growth of the root system and the aboveground parts of the vegetation, and eventually reducing the growth and biomass of the vegetation [11,12]. In addition, air pollution, such as tropospheric ozone, is phytotoxic to plants, and together with VPD modulates stomata opening, ultimately reducing yield [10].
The global surface temperature has increased by approximately 0.2 °C per decade over the past 30 years, accompanied by an increase in saturation vapor pressure. However, the actual vapor pressure is affected by humidity and increases at a different rate from the temperature, causing a gradual increase in the difference between the saturation and actual vapor pressures [13]. Some studies predict an exponential increase in global VPD in the future, with a relative magnitude that far exceeds the projected changes in precipitation and soil moisture [14,15]. The effect of a continuously increasing VPD on terrestrial vegetation growth has attracted increasing attention [16,17,18,19]. The satellite-based results at large scales show that vegetation productivity responses to a high VPD could be complicated. For example, in most of the wettest parts of Amazon rainforest, vegetation photosynthesis and productivity tend to increase with rising VPD [20], and there are also some wetter areas where VPD exhibits a negative effect. In terms of crop impacts, an elevated VPD negatively affected maize yields in the United States [21]; however, the increased VPD in the drylands of Central Asia promotes cropland growth [22]. Furthermore, the increased risk of impaired vegetation biomass with decreased stomatal conductance caused by a high VPD is reflected in many arid and semi-arid regions worldwide [23,24,25,26]. Therefore, the relevance of VPD to vegetation is more sensitive to the dry conditions of the climatic zone in the region where the vegetation grows.
The Yellow River Basin occupies an important position in China’s ecological security strategy pattern, as it spans four climatic zones, namely, arid, semi-arid, semi-humid, and humid, with various atmospheric moisture states. This vast-area basin is characterized by a diverse range of natural vegetation and the distribution of numerous man-made irrigated crops planted on 15% of China’s arable land. Therefore, the Yellow River Basin is a suitable and typical study area for exploring the effects of atmospheric moisture changes on vegetation. However, targeted research in this area remains insufficient. Using the leaf area index (LAI) and meteorological data from the Yellow River Basin collected over nearly 40 years, we explore the spatiotemporal changes and effects of VPD on vegetation during the growing season. The objectives of this study are as follows: (1) to clarify the spatiotemporal dynamics of atmospheric moisture and vegetation in the Yellow River Basin from 1982 to 2019; (2) to investigate the differences among the effects of VPD on different vegetation types in different climatic zones.
2. Materials and Methods
2.1. Data
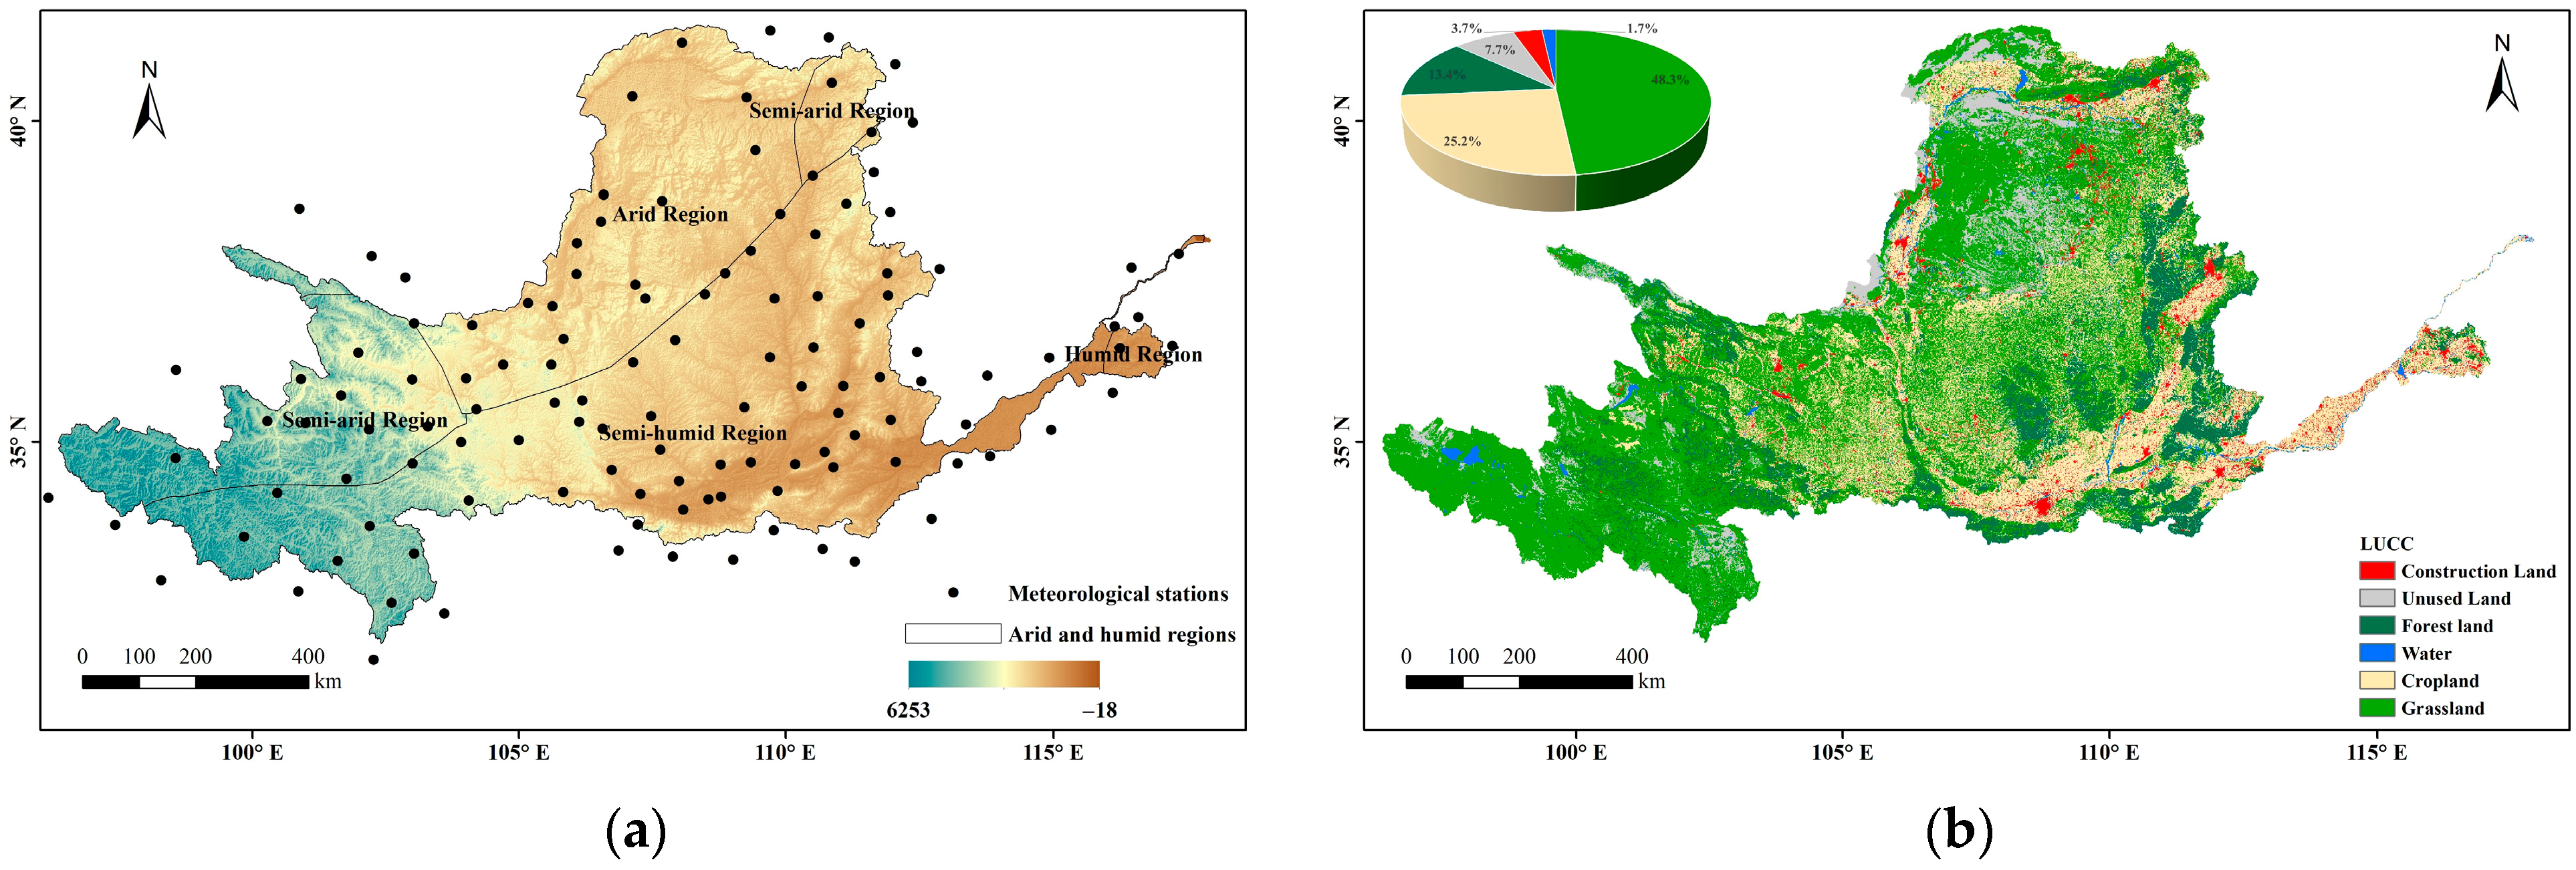
The VPD was calculated from the temperature and relative humidity data derived from the basic meteorological data of 125 ground-based meteorological observation stations in and around the Yellow River Basin from 1982 to 2019 (http://cdc.cma.gov.cn/ (accessed on 6 March 2024)) (Figure 1a). The vegetation dynamics were characterized with GLOBMAP LAI Version 3, which provided a consistent long-term LAI product at 8 km resolution on Geographic grid via quantitative fusion of Moderate Resolution Imaging Spectroradiometer (MODIS) and historical Advanced Very High Resolution Radiometer (AVHRR) data (https://www.resdc.cn (accessed on 14 March 2024)). To focus on the relationship between vegetation and atmospheric moisture, we selected the growth phase of vegetation (April–October) as the annual study period. We also used the land use cover data (Figure 1b) from the Resource and Environmental Science Data Centre of the Chinese Academy of Sciences (http://www.resdc.cn/ (accessed on 17 March 2024)). The climate was divided into four zones—arid, semi-arid, semi-humid, and humid—based on three levels of multi-year average precipitation (200 mm, 400 mm, and 800 mm).
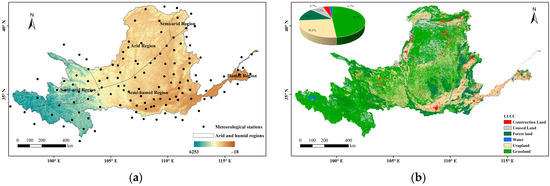
Figure 1.
Overview of the Yellow River Basin ((a) topography and meteorological station; (b) land use).
2.2. Methods
2.2.1. Vapor Pressure Deficit Calculation
VPD was calculated as the difference between the saturated water vapor pressure and the actual water vapor pressure at a given temperature (Equation (1)). The saturated and actual vapor pressures ( and , respectively) were calculated as functions of temperature and relative humidity by Equations (2) and (3), respectively:
where T and are the temperature and relative humidity, respectively, measured at the station.
2.2.2. Calculation of the Spatiotemporal Variation in VPD and LAI
The temporal variations in the annual mean VPD and LAI during the growing season in the Yellow River Basin were estimated from linear trends. Spatial variation in VPD was characterized through ArcGIS interpolation of the VPD calculation results during the annual growth season at each meteorological station. The spatial resolution was consistent with the LAI product (8 km). The spatial distribution changes in VPD were determined at five time nodes (1982, 1990, 2000, 2010, and 2019). In addition, the spatial variation in LAI was analyzed through a combined Theil–Sen estimator and Mann–Kendall test.
The calculation principle is as follows:
where and are data samples, is the median of the slopes of the calculated n (n − 1)/2 data combinations, and > 0 indicates that the time series shows an increasing trend; otherwise, it indicates a weakening trend.
The Mann–Kendall test was performed as follows:
The value at the α = 0.05 confidence level (|| = 1.96) of the two-tailed test divides the changes into four categories: Significant Increase (Sign-I, Z ≥ 1.96), Slight Increase (Slig-I, 1.96 > Z > 0), Significant Decrease (Sign-D, −1.96 ≥ Z), and Slight Decrease (Slig-D, 0 > Z > −1.96).
2.2.3. Effects of VPD on Vegetation
To examine the general change in vegetation responses to VPD, we analyzed the spatiotemporal relationship between LAI anomaly and VPD during the growing season for each grid cell over the Yellow River Basin from 1982 to 2019. LAI anomaly was used to remove the effect of seasonality, and we calculated the LAI anomaly based on z-score of LAI using the following formula:
where denotes an LAI anomaly for the month j in year i; denotes the averaged LAI of month j over 1982–2019; stands for the standard deviation of LAI for month j over 1982–2019.
Spearman rank correlation coefficients (r-values) between LAI anomaly and VPD were used to represent the vegetation and VPD relationship. Grid cells with significant positive and negative correlations (p < 0.05) between LAI anomaly and VPD were defined as grid cells associated with the promotion and inhibition of vegetation growth, respectively. The grid cells were categorized into three vegetation and four climatic zones to properly quantify the spatial distributions of the promotion and inhibition of growth.
To quantify the spatiotemporal dynamics of growth promotion and inhibition regions over the past nearly four decades, we analyzed the trends in correlation coefficients between LAI anomaly and VPD with 5-year and 10-year moving windows on each grid cell using the linear trend test. Lengthening the moving window reduced the total number of time-series points and the time-point-to-time-point fluctuations, thereby highlighting any potential long-term trends. Therefore, the presented results are primarily based on the 10-year moving window analysis. To analyze the area changes associated with growth promotion and inhibition in the Yellow River Basin, we determined the trends in the areal percentage associated with promotion/inhibition through a 10-year moving window using a linear trend analysis.
3. Results
3.1. Spatiotemporal Variation in VPD
3.1.1. Time-Varying Characteristics of VPD
The interannual variation process of VPD in the Yellow River Basin was determined from the annual mean VPD during the growing season (Figure 2). We defined the representative annual mean of VPD during the growing season as Anag_VPD for brevity. The overall VPD obviously increased at 0.043 · (10a)−1, consistent with the long-term trend in Northwest China and worldwide [27].
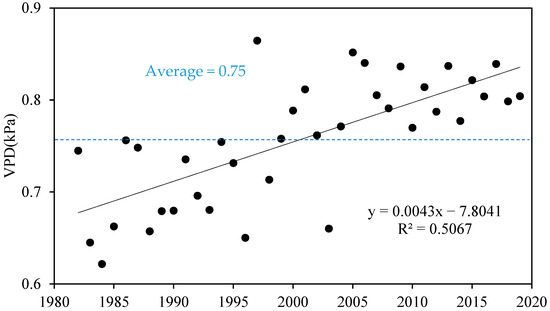
Figure 2.
The interannual dynamic of annual mean VPD during the growing season in the Yellow River Basin.
3.1.2. Characterization of Spatial Variation in VPD
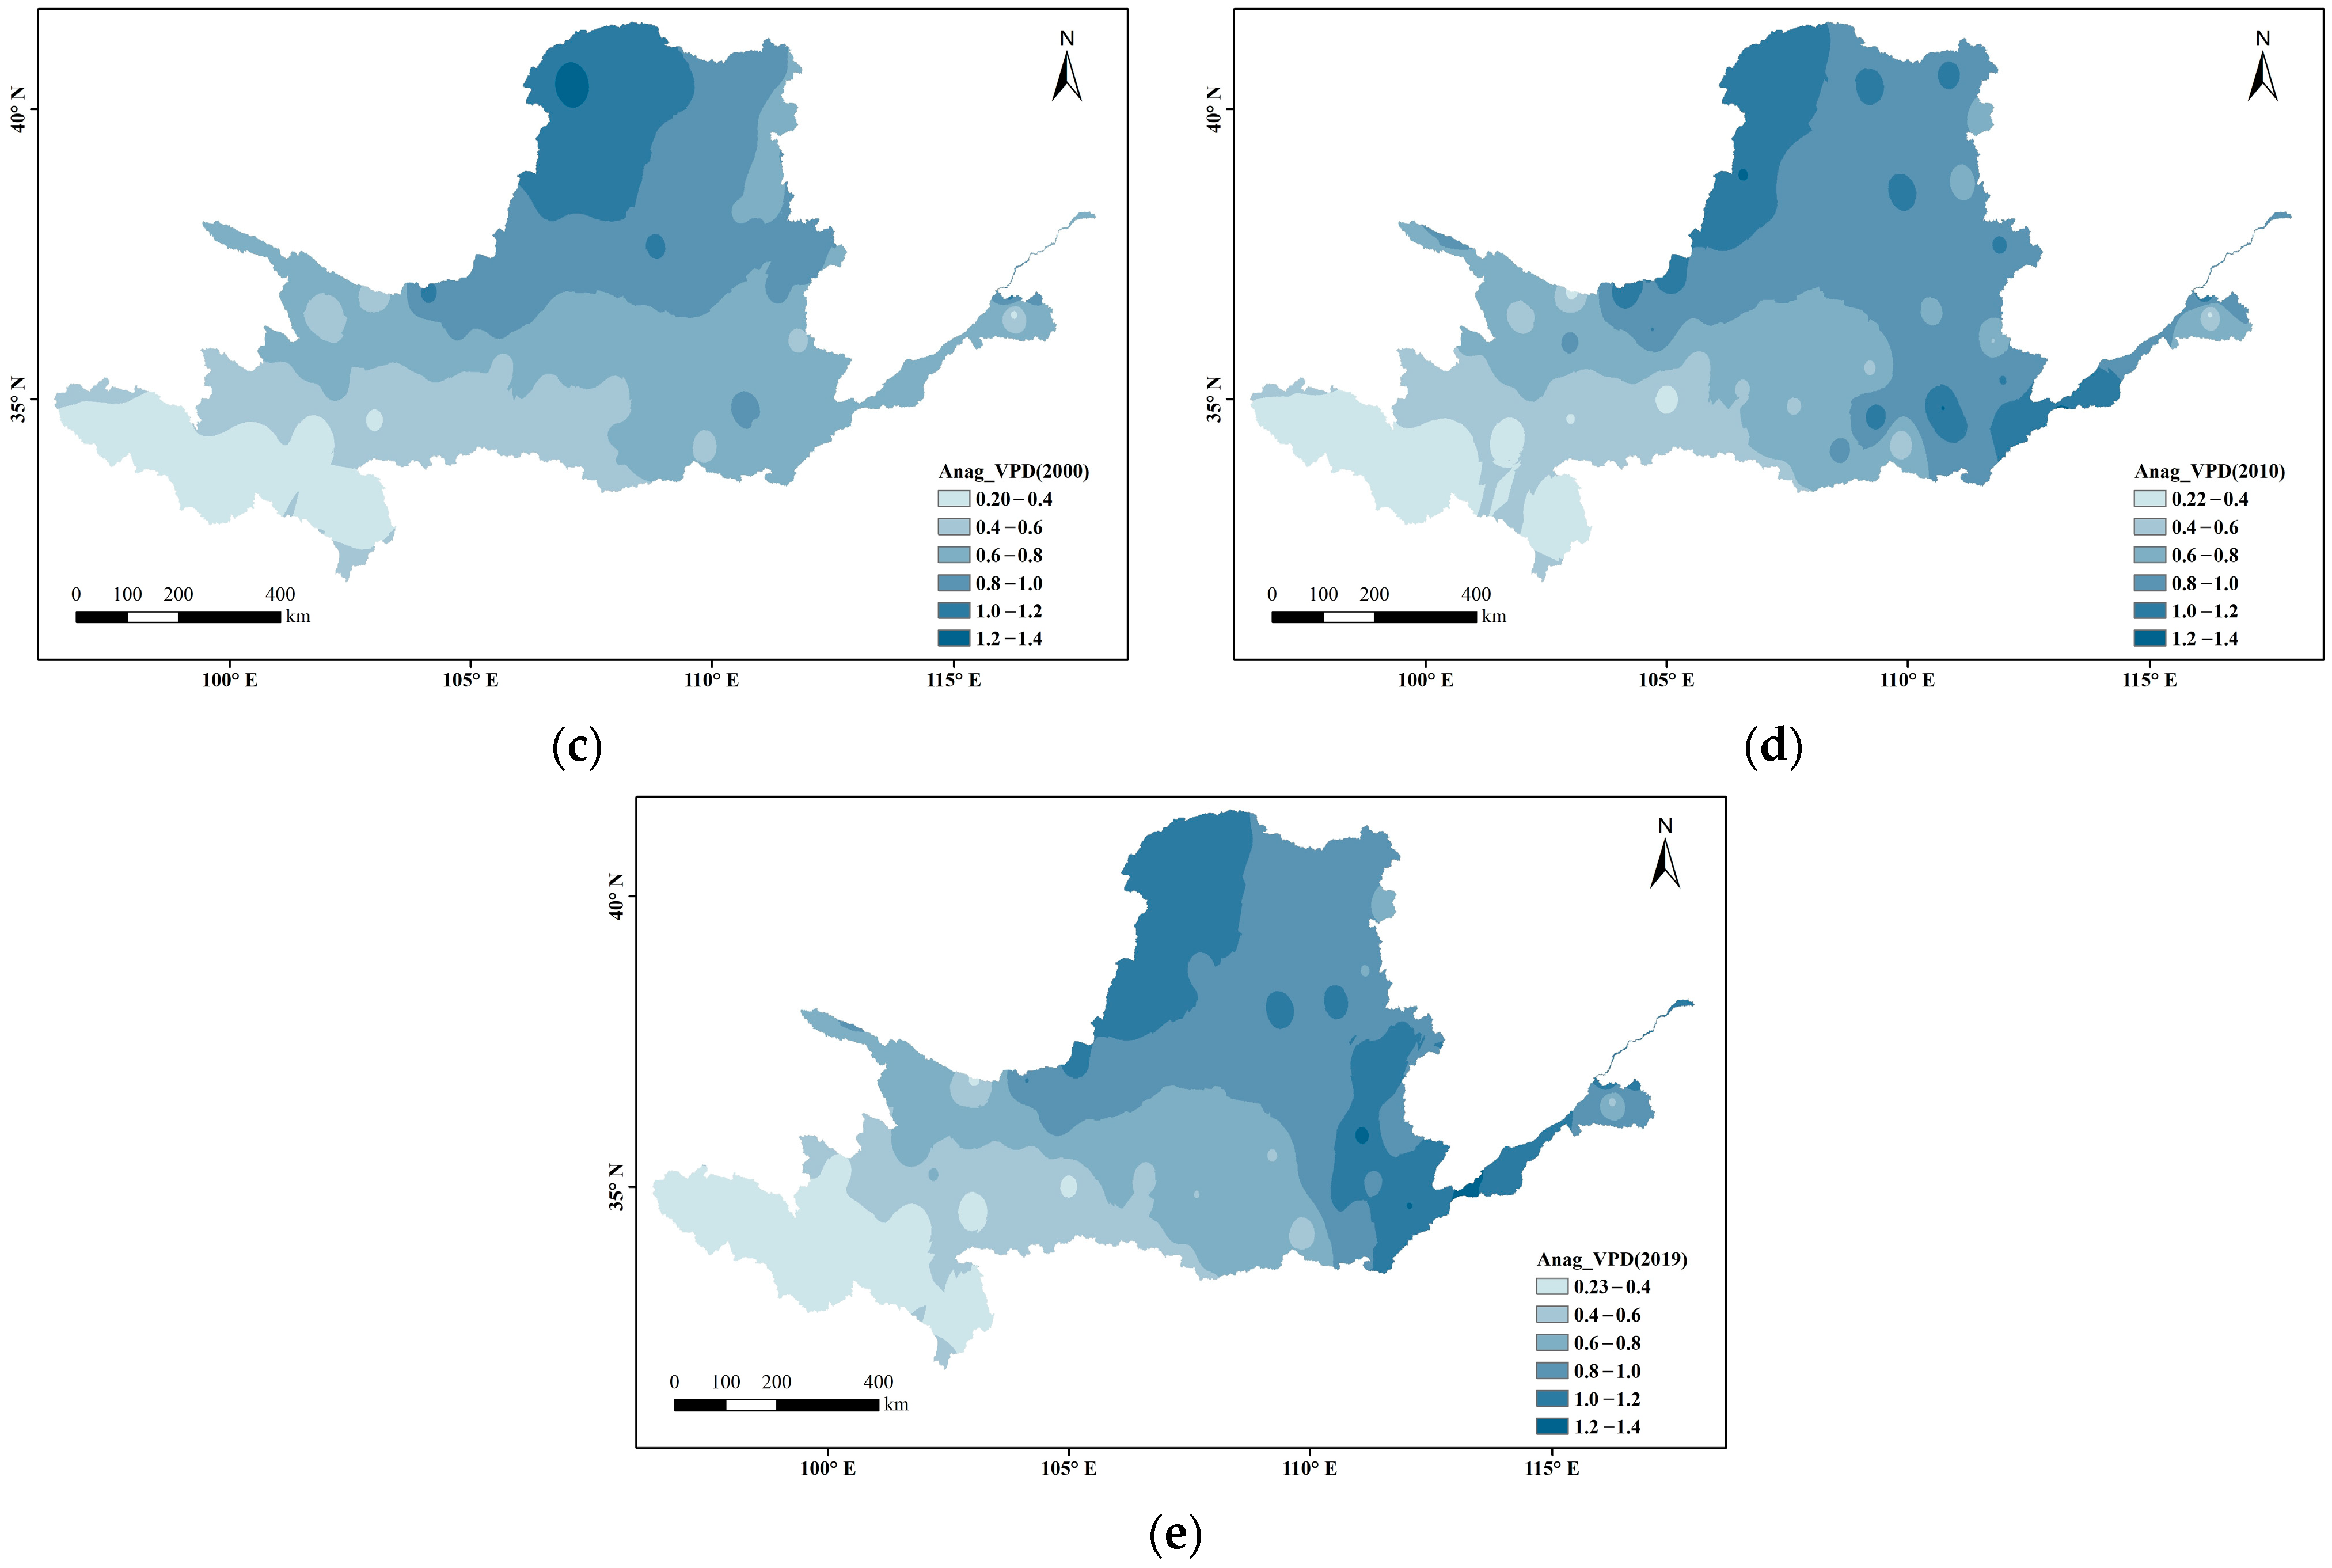
Figure 3 shows the spatial variations in VPD at every 10 years divided into 0.2 intervals. Overall, the VPD in the Yellow River Basin s gradually increased from west to east and radiated outward from its source (the arid region), where the VPD was highest. In the ecologically fragile areas upstream, the VPD has remained relatively stable (below 0.8) during the past nearly 40 years (below 0.4 in the source area of the Yellow River). In the Loess Plateau and downstream areas, the VPD generally increased, showing a local breakthrough of 1.2.
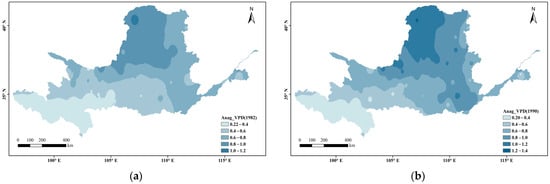
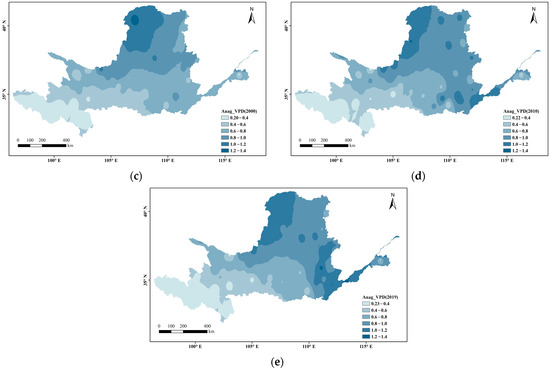
Figure 3.
Spatial distribution changes in VPD during the growing season in the Yellow River Basin ((a) 1982; (b) 1990; (c) 2000; (d) 2010; (e) 2019).
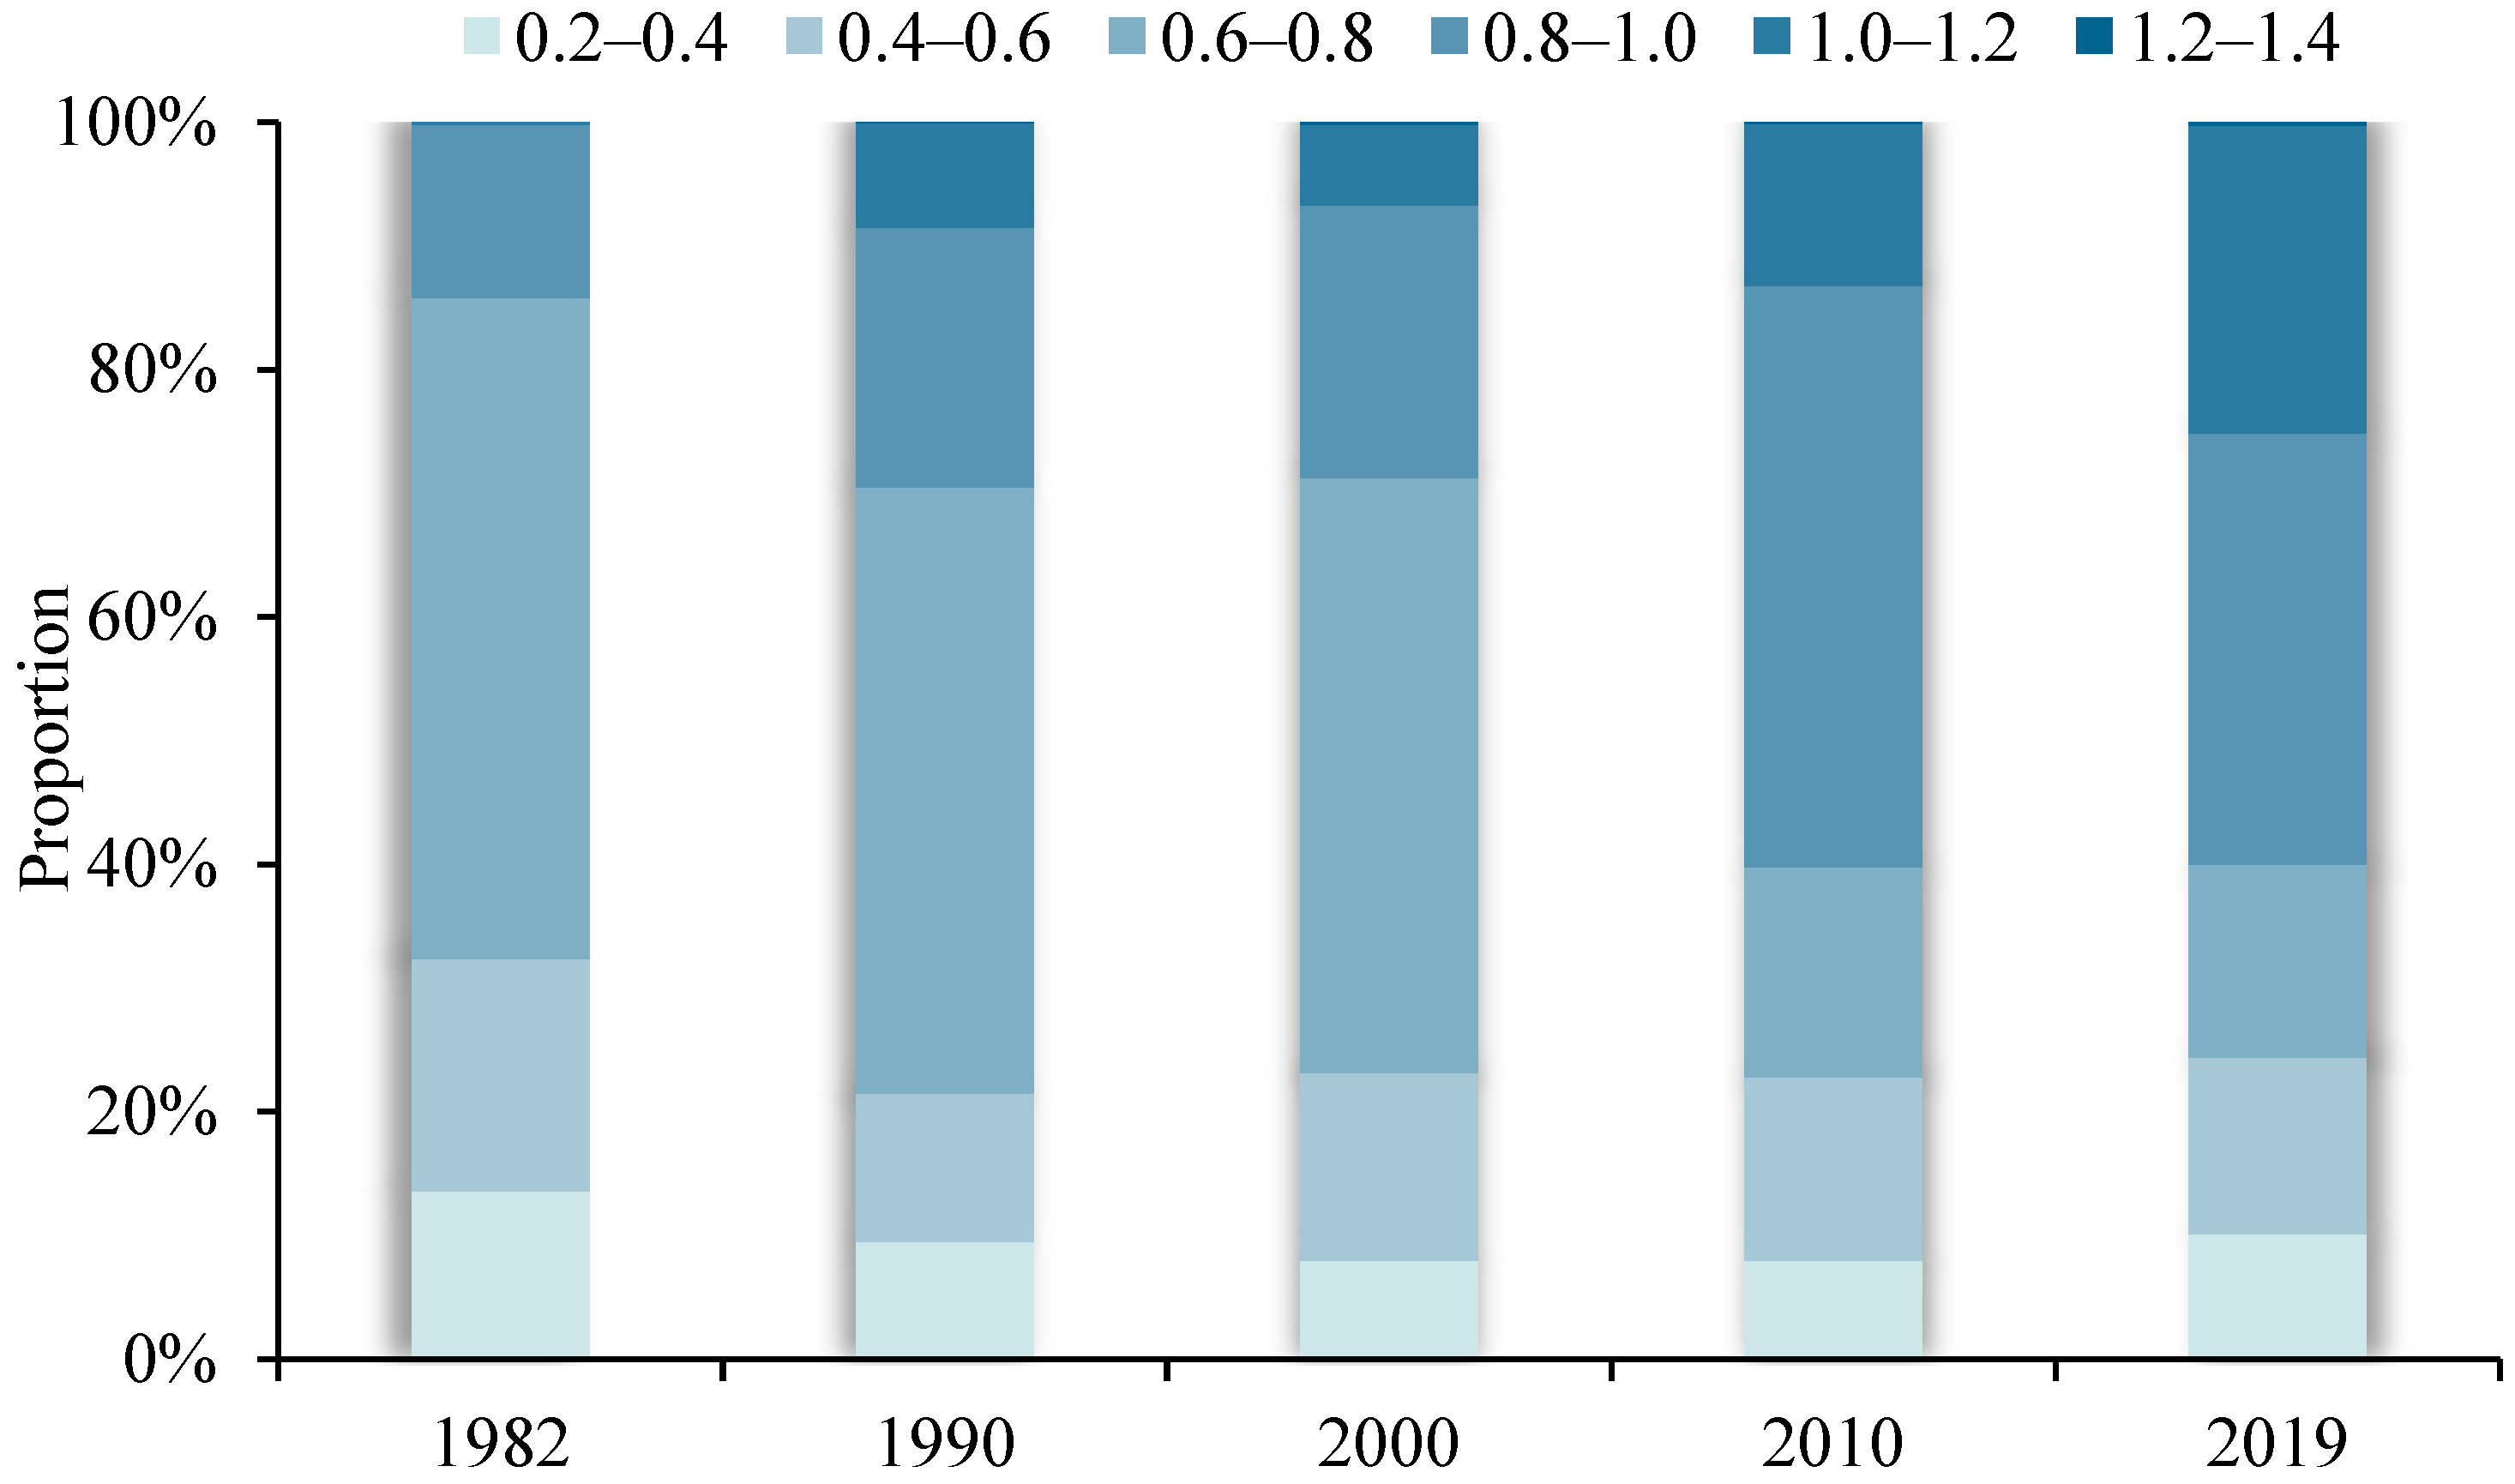
Figure 4 shows the changing proportions of different VPD intervals over the past nearly 40 years. Within the absolute main body, the VPD spatially ranged between 0.2 and 1.2. During the study period, the 0.2–0.4 spatial range remained relatively stable (~9%), the 0.4–0.6 spatial range slightly decreased, the 0.6–0.8 spatial range significantly decreased (by 38% between 1982 and 2019), the 0.8–1.0 and 1.0–1.2 spatial ranges rose significantly (by 21% and 25%, respectively), and the 1.2–1.4 spatial range, although a relatively small percentage, broke through the 0 value and shows an overall upward trend.
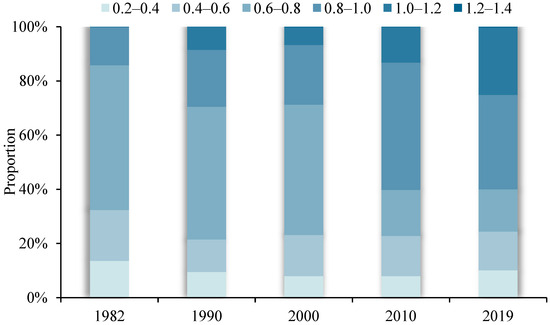
Figure 4.
The proportion of each interval of VPD spatial distribution in different years in the Yellow River Basin.
3.2. Spatiotemporal Variations in LAI
3.2.1. Time-Varying Characteristics of LAI
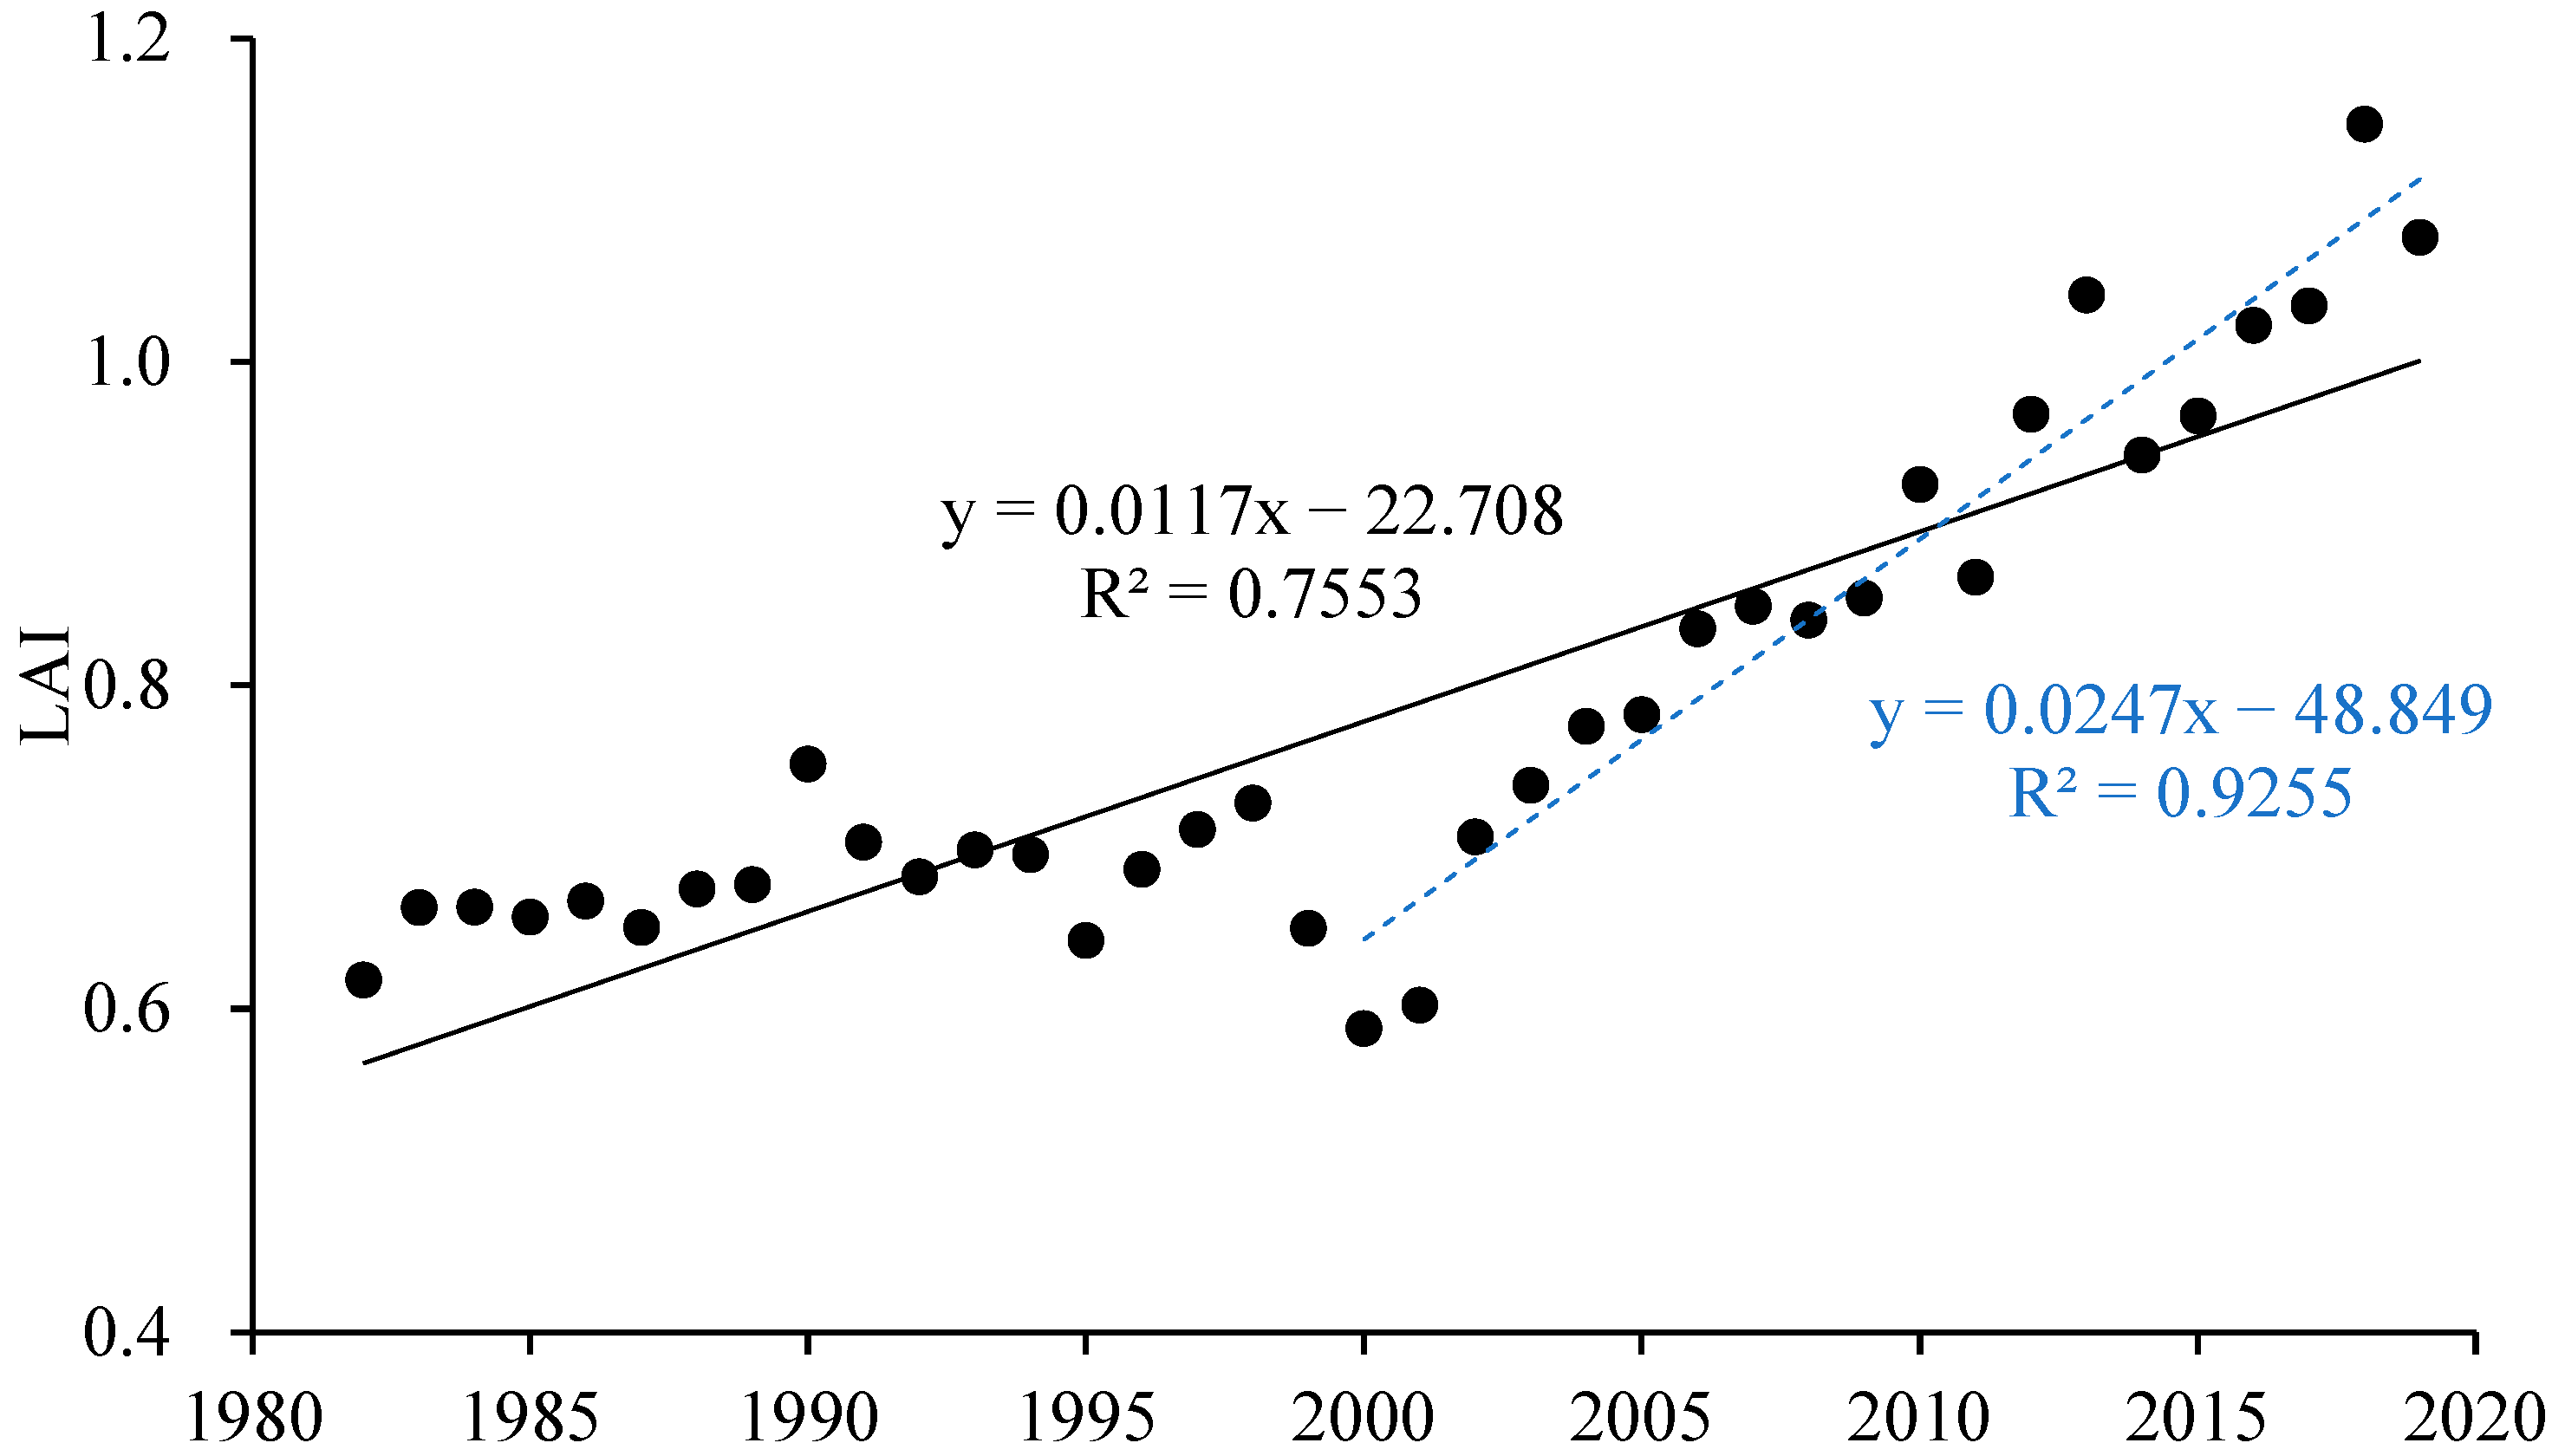
The annual average LAI in the growing season increased overall (Figure 5, R2 = 0.7553) but obviously decreased during the severe droughts in 2000. After the large-scale return of farmland to forest began in 2000, the terrestrial vegetation cover improved and the LAI shows a significant increasing trend (R2 = 0.9255).
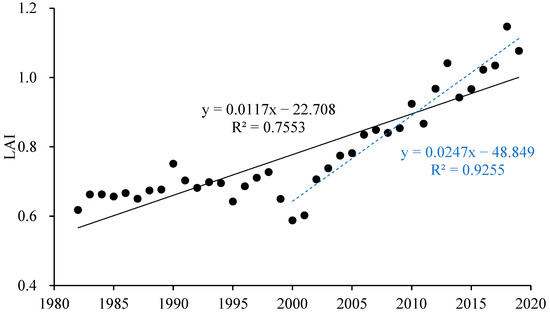
Figure 5.
The interannual dynamic of annual mean LAI during the growing season in the Yellow River Basin (black solid line represents the overall trend in the annual average LAI in the growing season of the Yellow River Basin from 1982 to 2019; blue dashed line represents the trend after the large-scale return of farmland to forest began in 2000).
3.2.2. Characterization of Spatial Variation in LAI
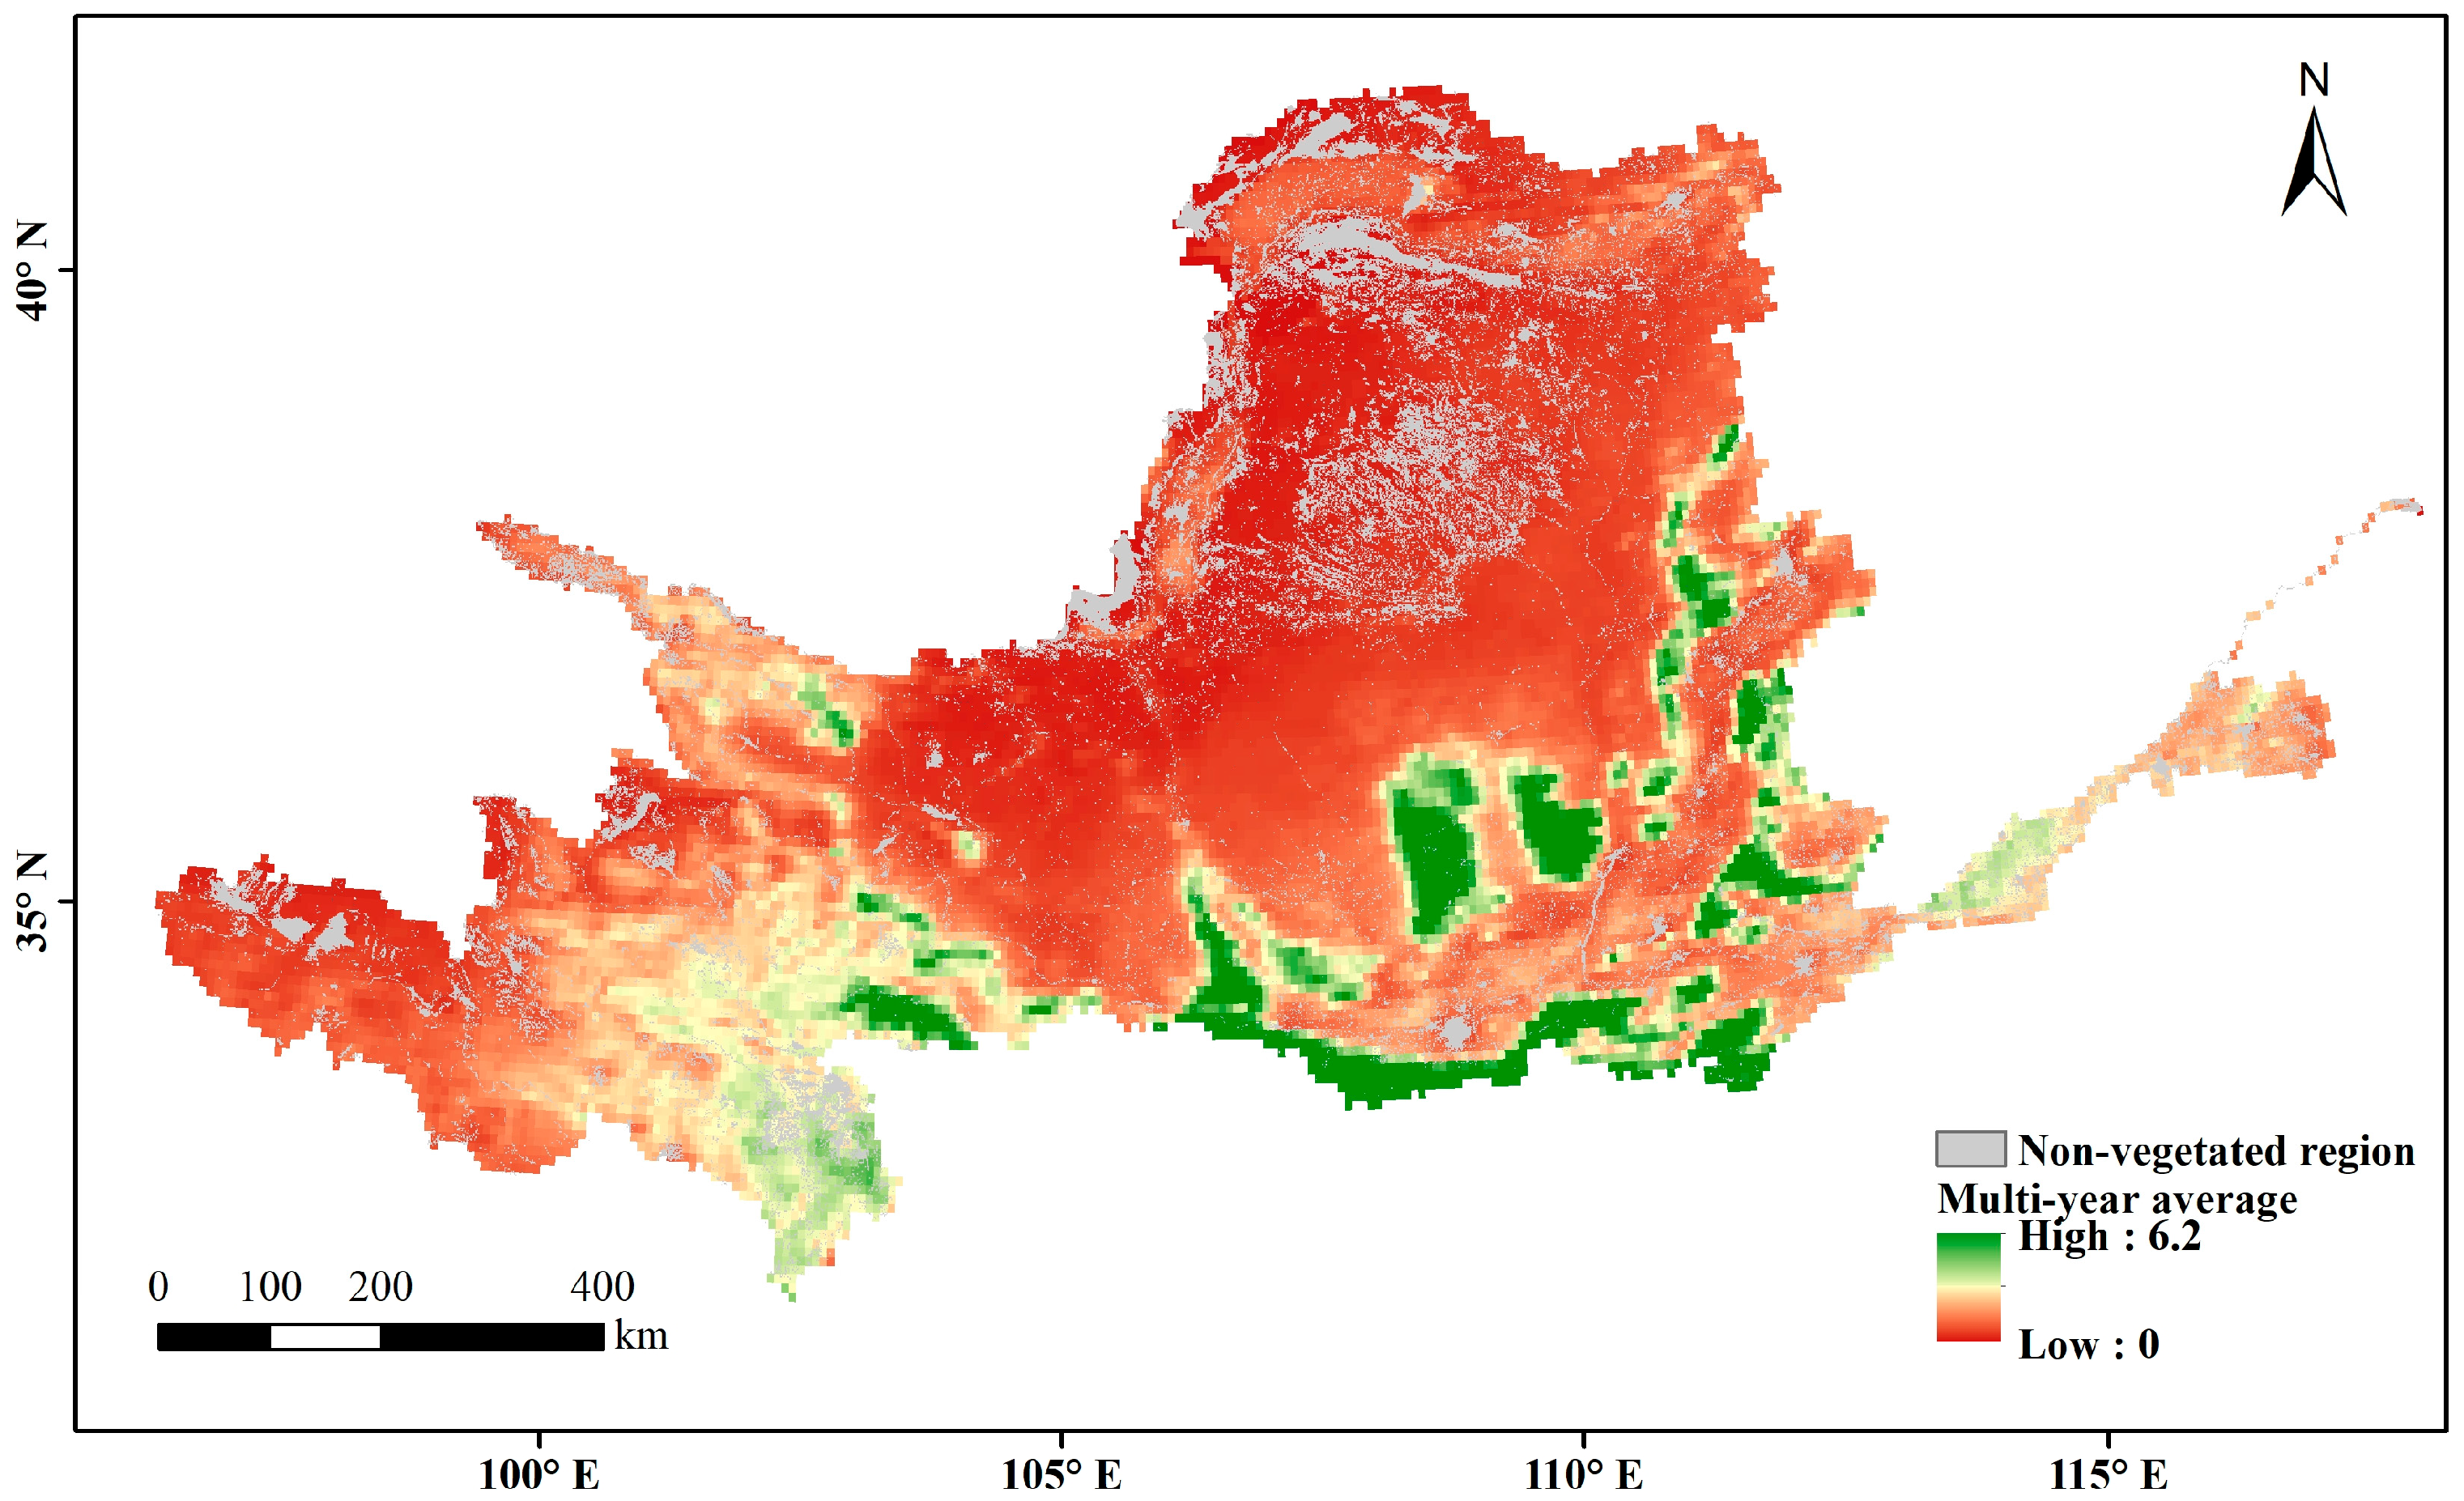
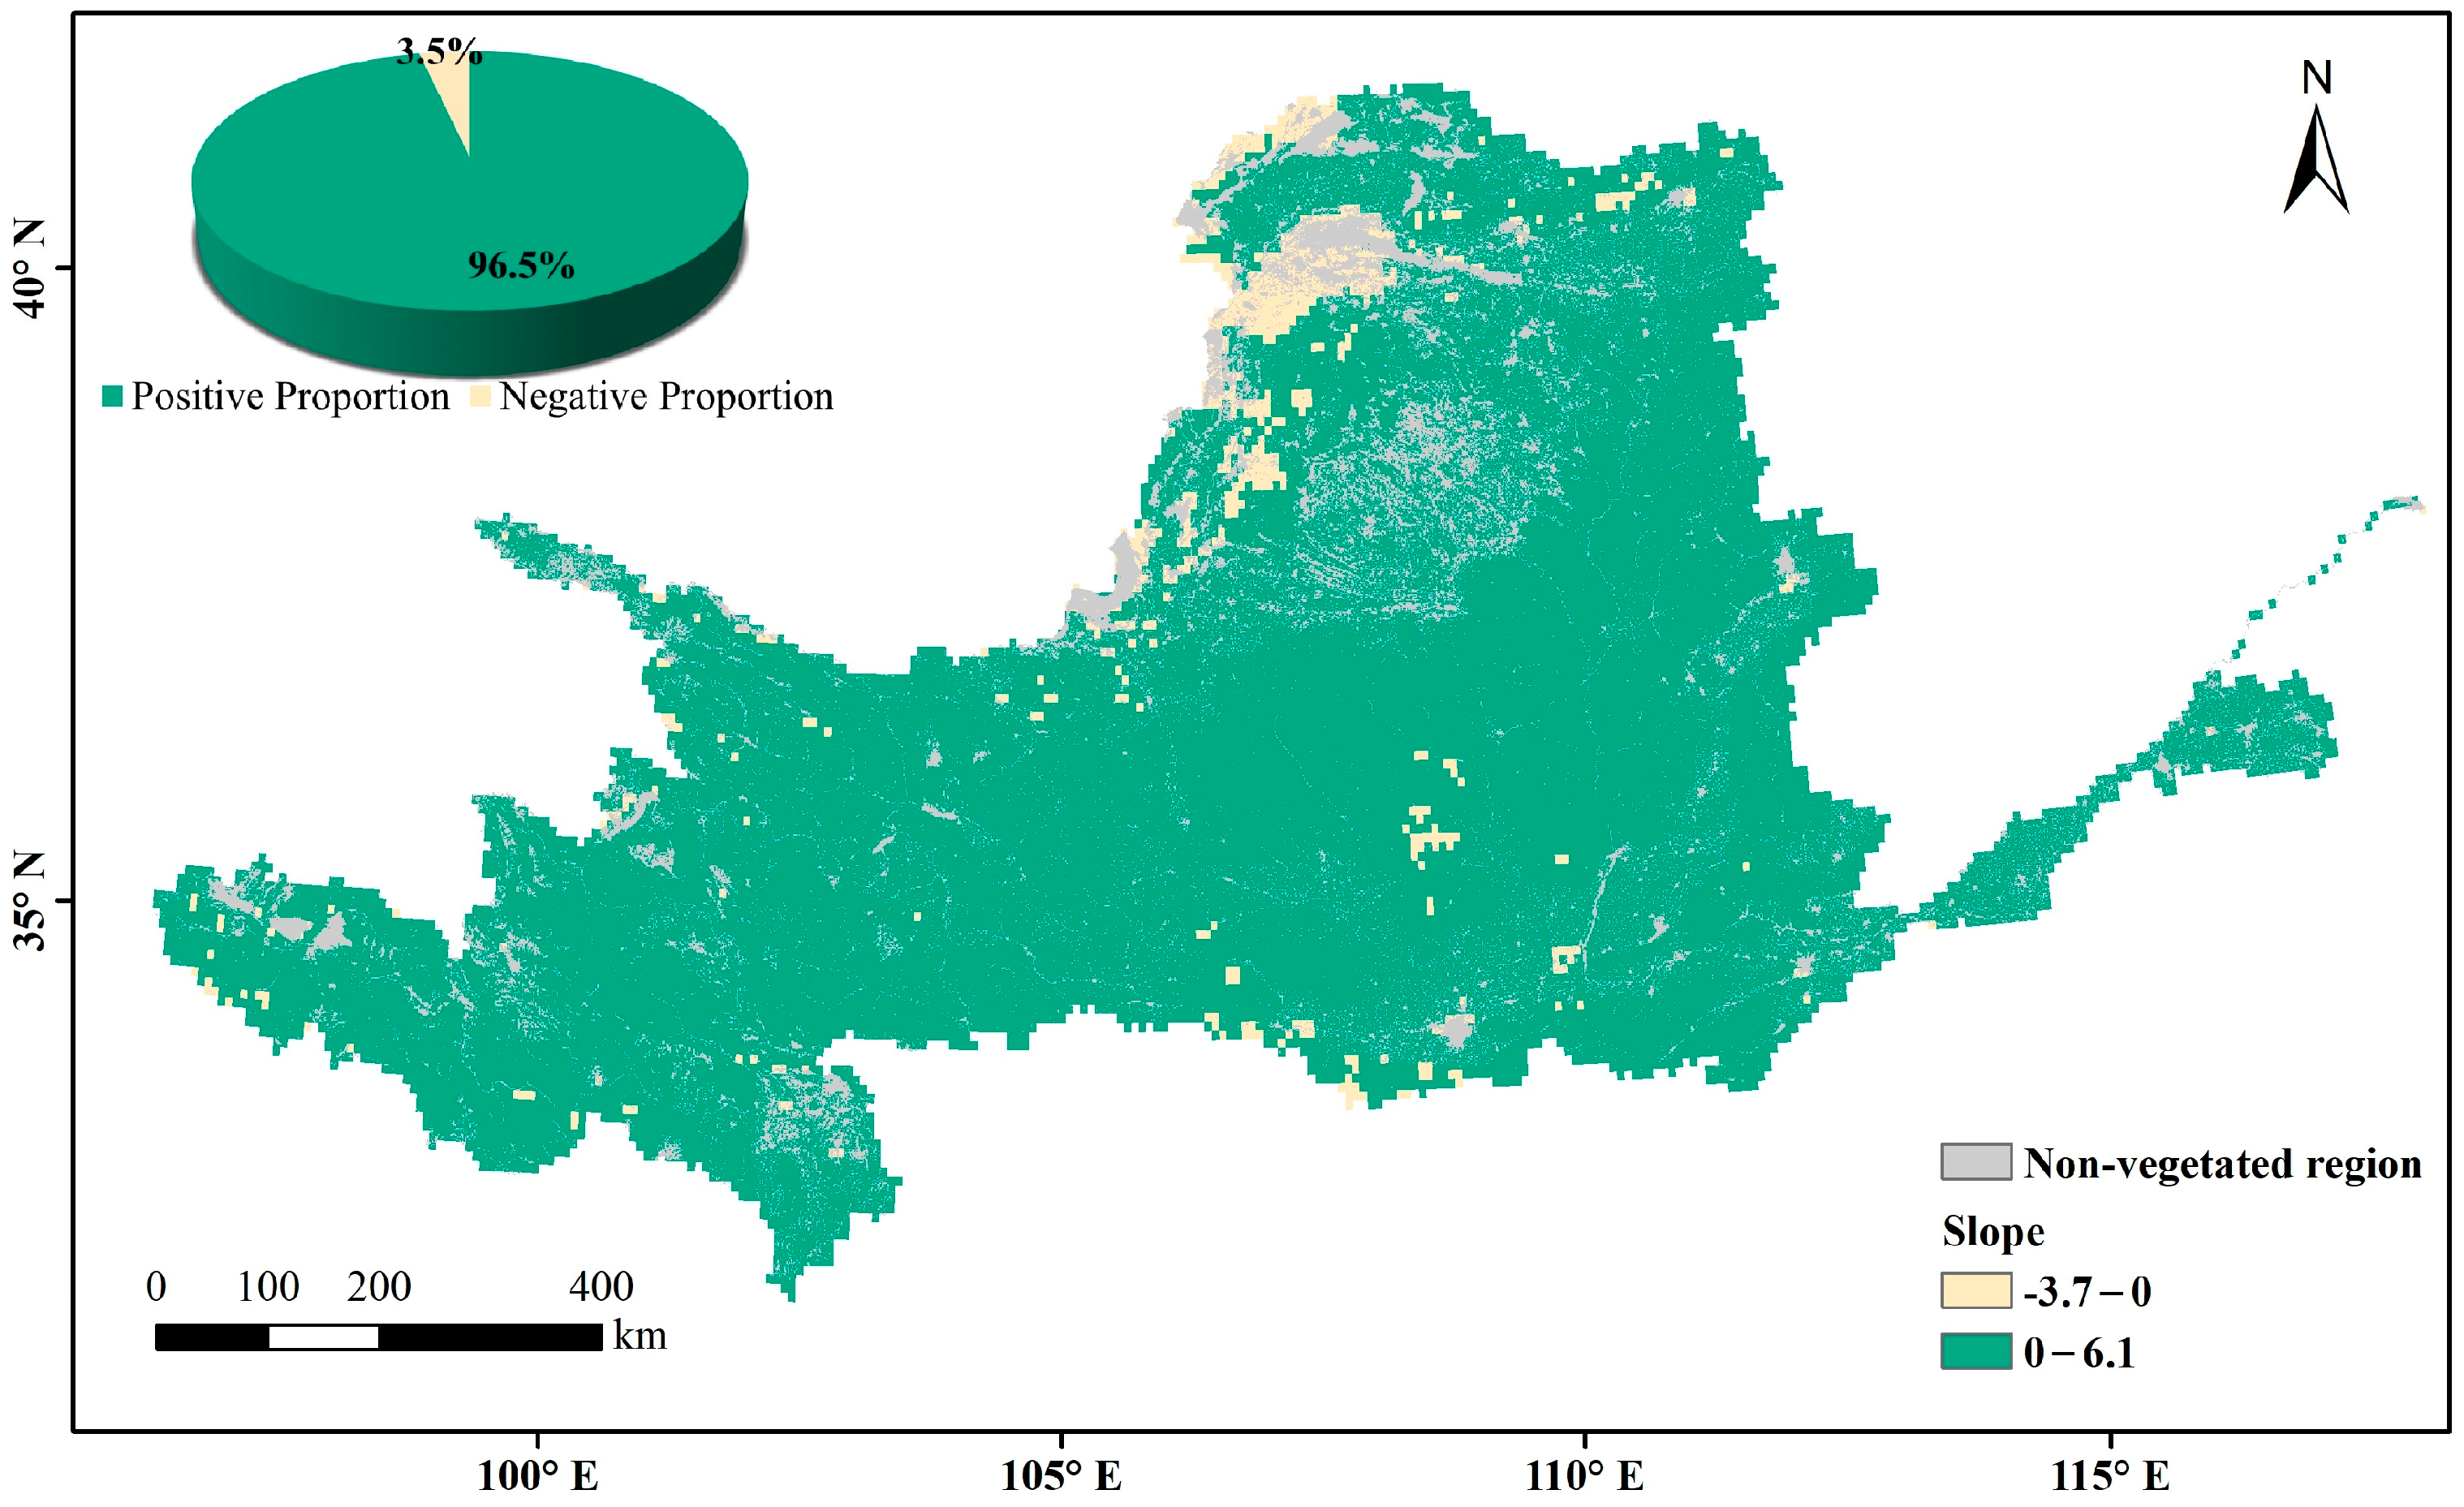
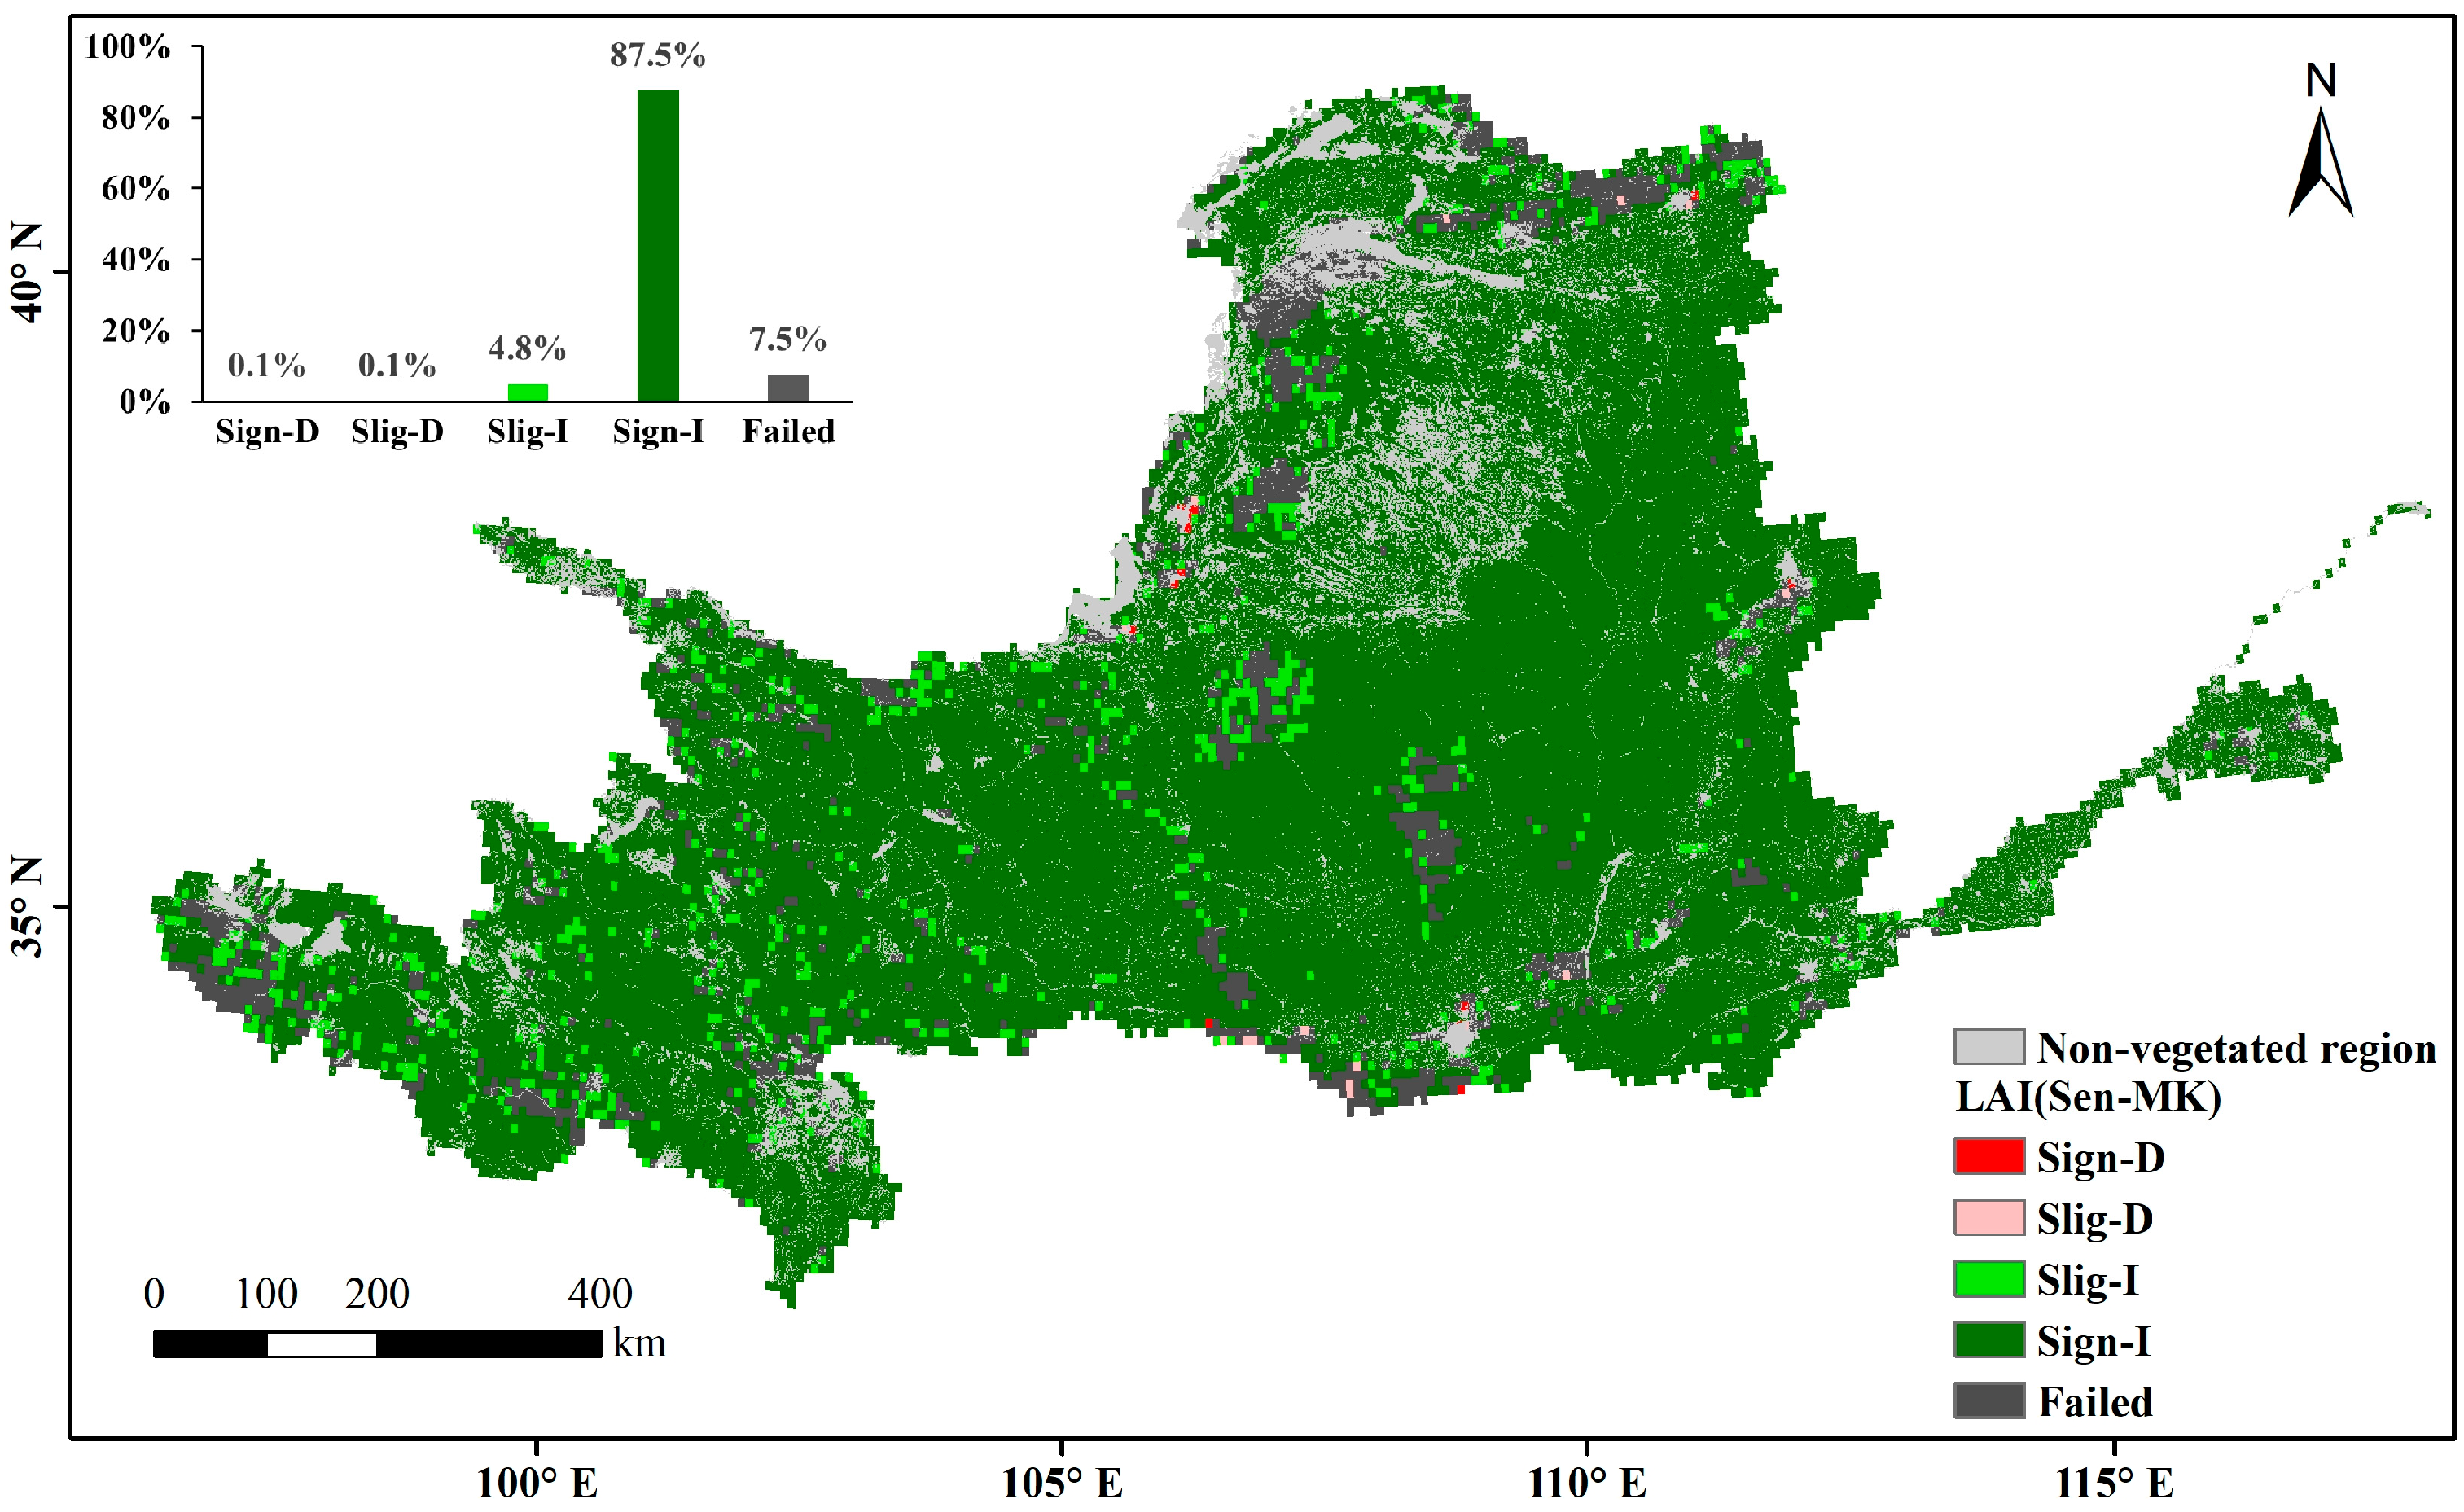
The multi-year average LAI in the Yellow River Basin during the growing season over the past nearly 40 years represents the overall changes in vegetation cover. The non-vegetation-covered areas (distribution areas of construction land, water, and unused land) are the gray regions in Figure 6. High values are mainly found in woodland-type areas whereas low values are mainly found in arid and semi-arid regions, where vegetation survives in poor environments and has a relatively low growth cover. In areas with a high vegetation cover of arable land and upstream grassland, the multi-year averages range between those of woodland and arid regions. Through a slope analysis of the multi-year averages during the growing season, the positive-trend area was found to account for 96.5% of the vegetation cover area on the raster scale (Figure 7). A significance calculation revealed that 92.3% of the vegetation cover area in the Yellow River Basin is trending in the desired direction, with a sporadic decrease in human-activity gathering areas such as Ningxia and Shaanxi. The places failing the test are mainly distributed in unutilized-land-type areas such as deserts and wastelands (Figure 8).
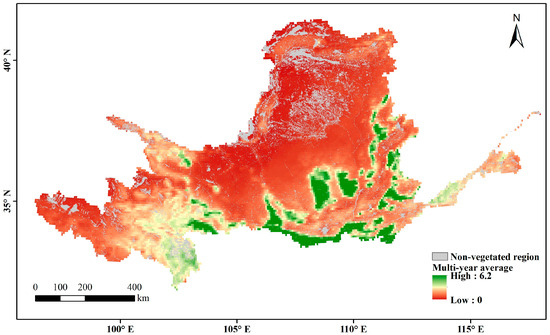
Figure 6.
Spatial distribution of multi-year average LAI during the growing season in the Yellow River Basin.
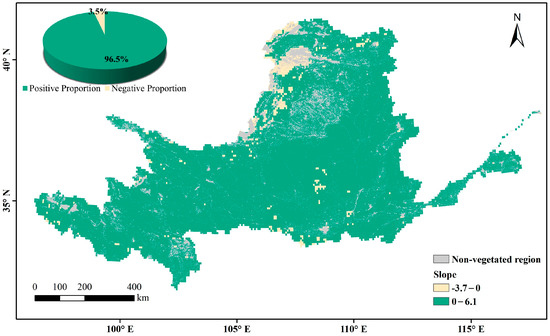
Figure 7.
Trends in annual average LAI in the Yellow River Basin.

Figure 8.
Significant changes in annual average LAI during the growing season in the Yellow River Basin (Significant Decrease (Sign-D), Slight Decrease (Slig-D), Slight Increase (Slig-I), Significant Increase (Sign-I)).
3.3. Differences in the Effects of VPD on Vegetation
3.3.1. Correlation between VPD and Vegetation
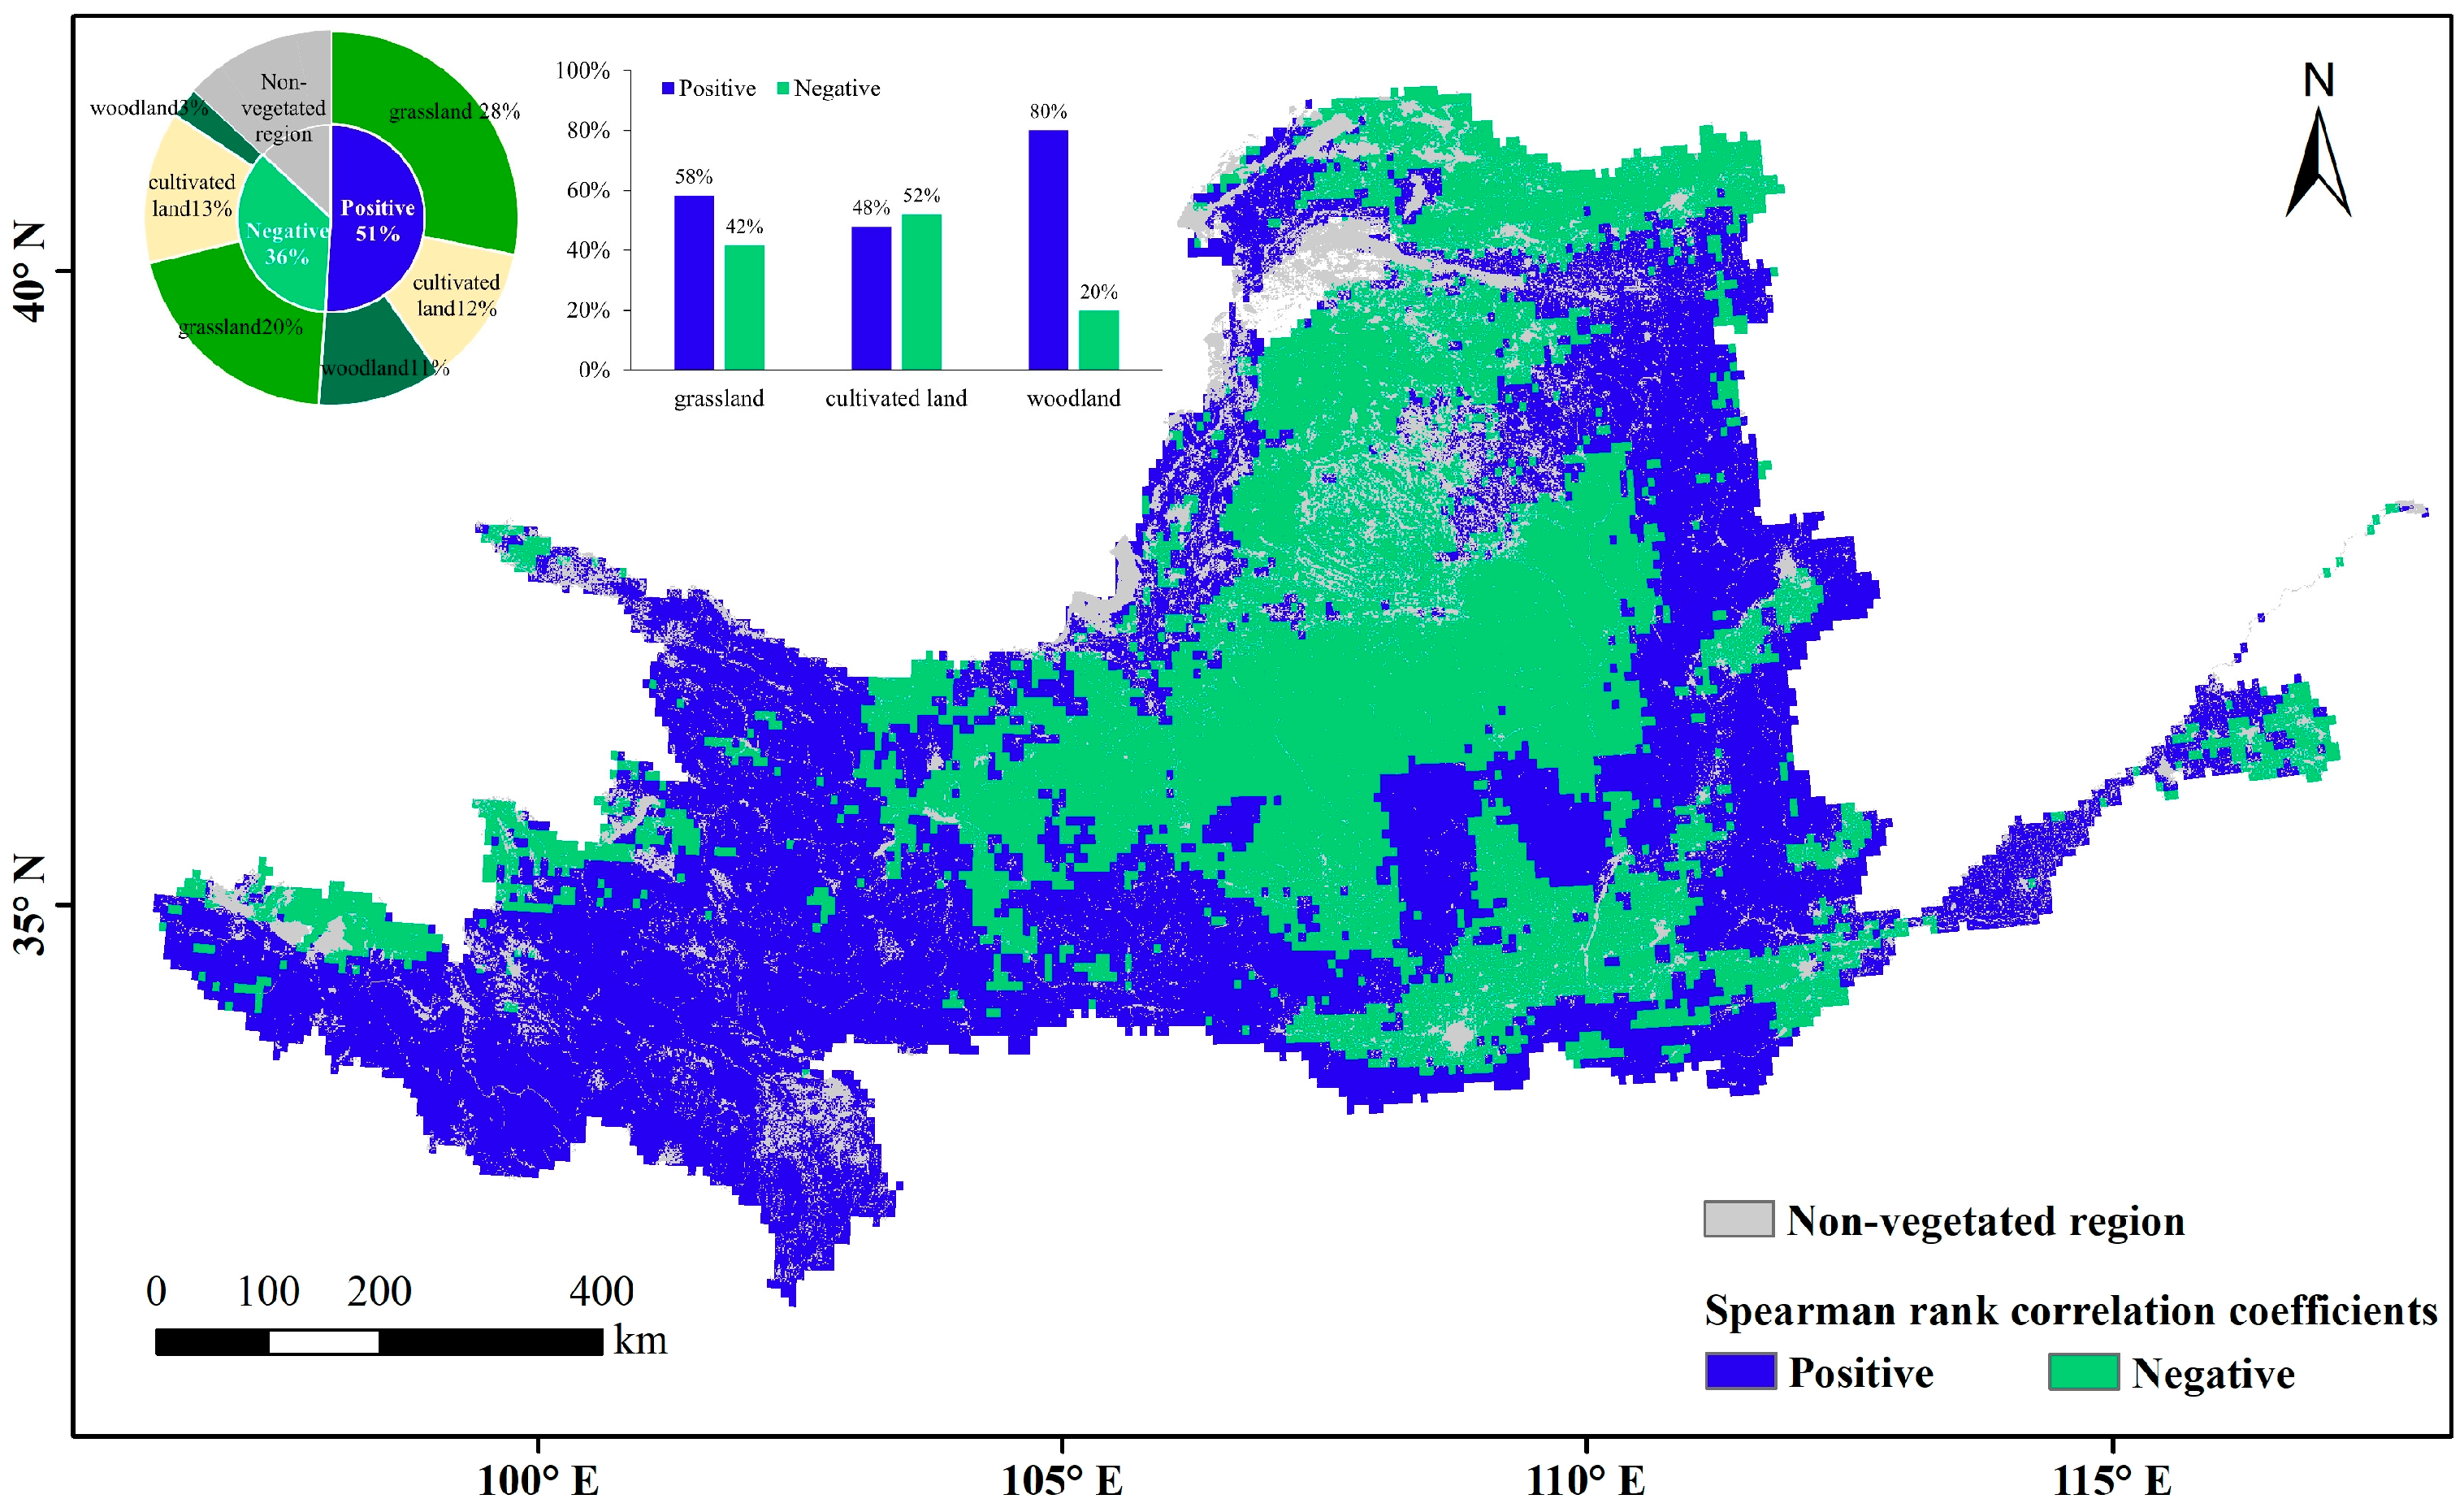
Vegetation occupies 87% of the area of the Yellow River Basin, including 48% grassland, 25% cropland, and 14% woodland. These vegetation types are distributed through all four climatic zones. The water effect of natural vegetation in humid regions was not analyzed because the proportions of both the humid regions in the Yellow River Basin and the natural vegetation in humid regions are small. Overall, the area facilitated by VPD was 1.4 times larger than the area inhibited by VPD. The effects of VPD differed among the vegetation types (Figure 9). Based on the relative proportions of the Spearman rank correlation coefficients of the three vegetation types (Table 1), the facilitating relevance of VPD was highest for woodland, followed by grassland and cropland. On cropland, the facilitating effect was exceeded by the inhibiting effect.

Figure 9.
Spatial distribution of spearman rank correlation coefficients between LAI anomaly and VPD.

Table 1.
Distribution-proportion Spearman rank correlation coefficients between the VPD and LAI anomaly (%).
The correlations of the three vegetation types were heterogeneous in different climatic zones. The VPD mainly promoted the growth of grassland vegetation in the upper reaches of the plateau, where the altitude exceeds 3000 m above sea level (belonging to semi-arid and semi-humid regions) and natural grassland is concentrated, and in the grassland zone in the gully area of the Loess Plateau (belonging to semi-humid regions). The highest inhibitory effects of VPD were mainly distributed in the grassland zones of Yinshan Mountain and the Maowuosu sandland (belonging to arid and semi-arid regions), and in the grassland-cultivated land of the Loess Plateau (belonging to semi-arid and semi-humid regions). The promotional relevance of VPD to cropland was mainly apparent in the western part of the Ningxia and Hetao irrigation zones in arid regions, the central part of the irrigation district of the downstream Yellow River (belonging to semi-humid regions). The inhibition effect was distributed in the interspersed distribution zone of cropland and grassland on the Loess Plateau (belonging to semi-arid and semi-humid regions), and on the Fen-wei Plain (belonging to semi-humid regions). The promotional relevance of VPD to woodland, which is more obvious than its relevance to the other vegetation types, is centrally distributed in the semi-humid region of the woodland zone in the gully area of the Loess Plateau and is dispersed in high-altitude woodland zones such as the upper Qilian Mountains.
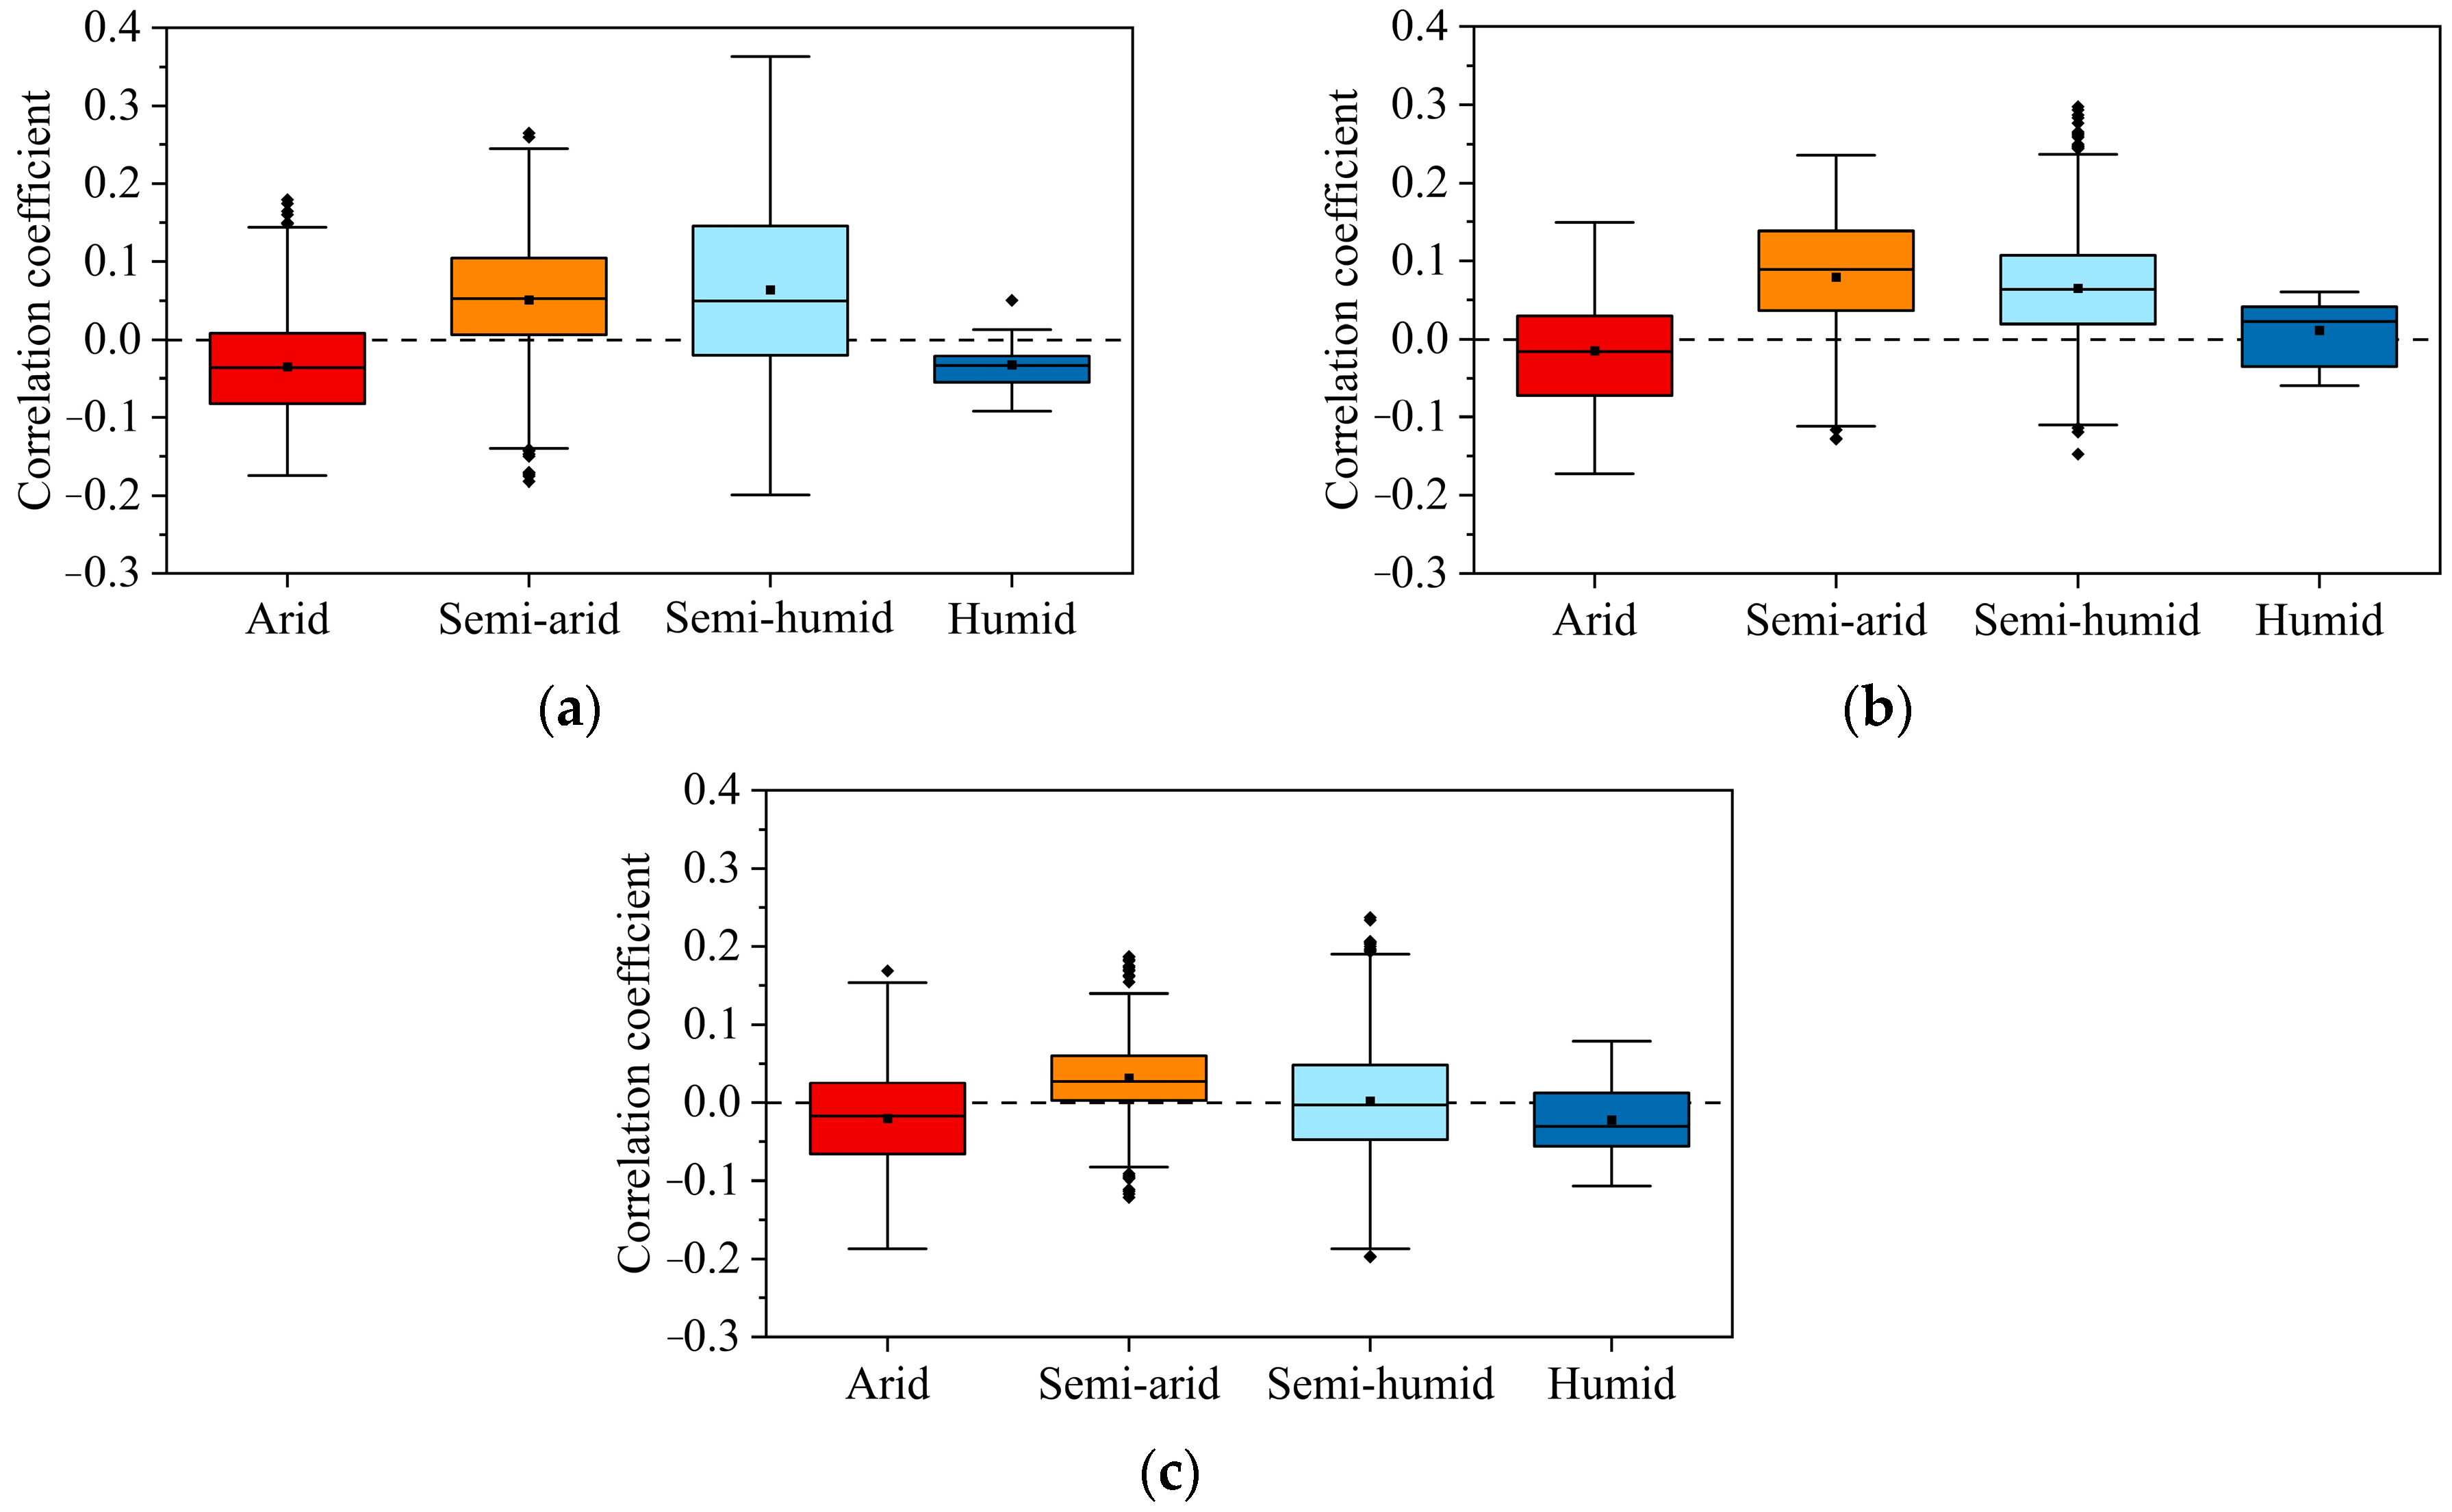
The distribution patterns of Spearman rank correlation coefficients between the three vegetation types and VPD were generally consistent in different climatic zones (Figure 10). Positive correlations exceeded negative correlations in semi-arid and semi-humid regions, with the exception of cropland in semi-humid regions. In the arid region, positive correlation distributions of the three vegetation types were outnumbered by negative correlations. Judging from the spatial correlation distribution and the distribution pattern of the box plots, whether VPD promotes or inhibits the growth of vegetation is largely related to the climatic zone of the vegetation. That is, the relevance of VPD to vegetation is more strongly influenced by differences among the climatic zones of the vegetation than by differences among the vegetation types themselves.
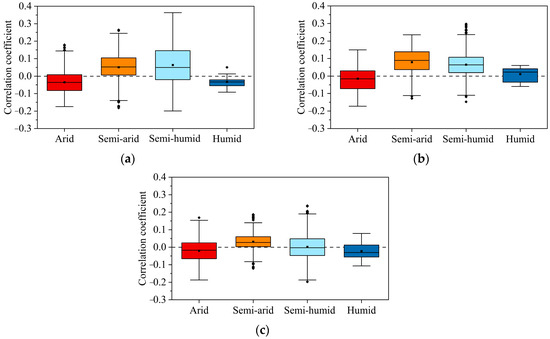
Figure 10.
Statistical distributions of spearman rank correlation coefficients for arid, semi-arid, semi-humid, and humid regions, respectively ((a) grassland, (b) woodland, (c) cultivated land).
3.3.2. Increasing Effects of VPD on Vegetation
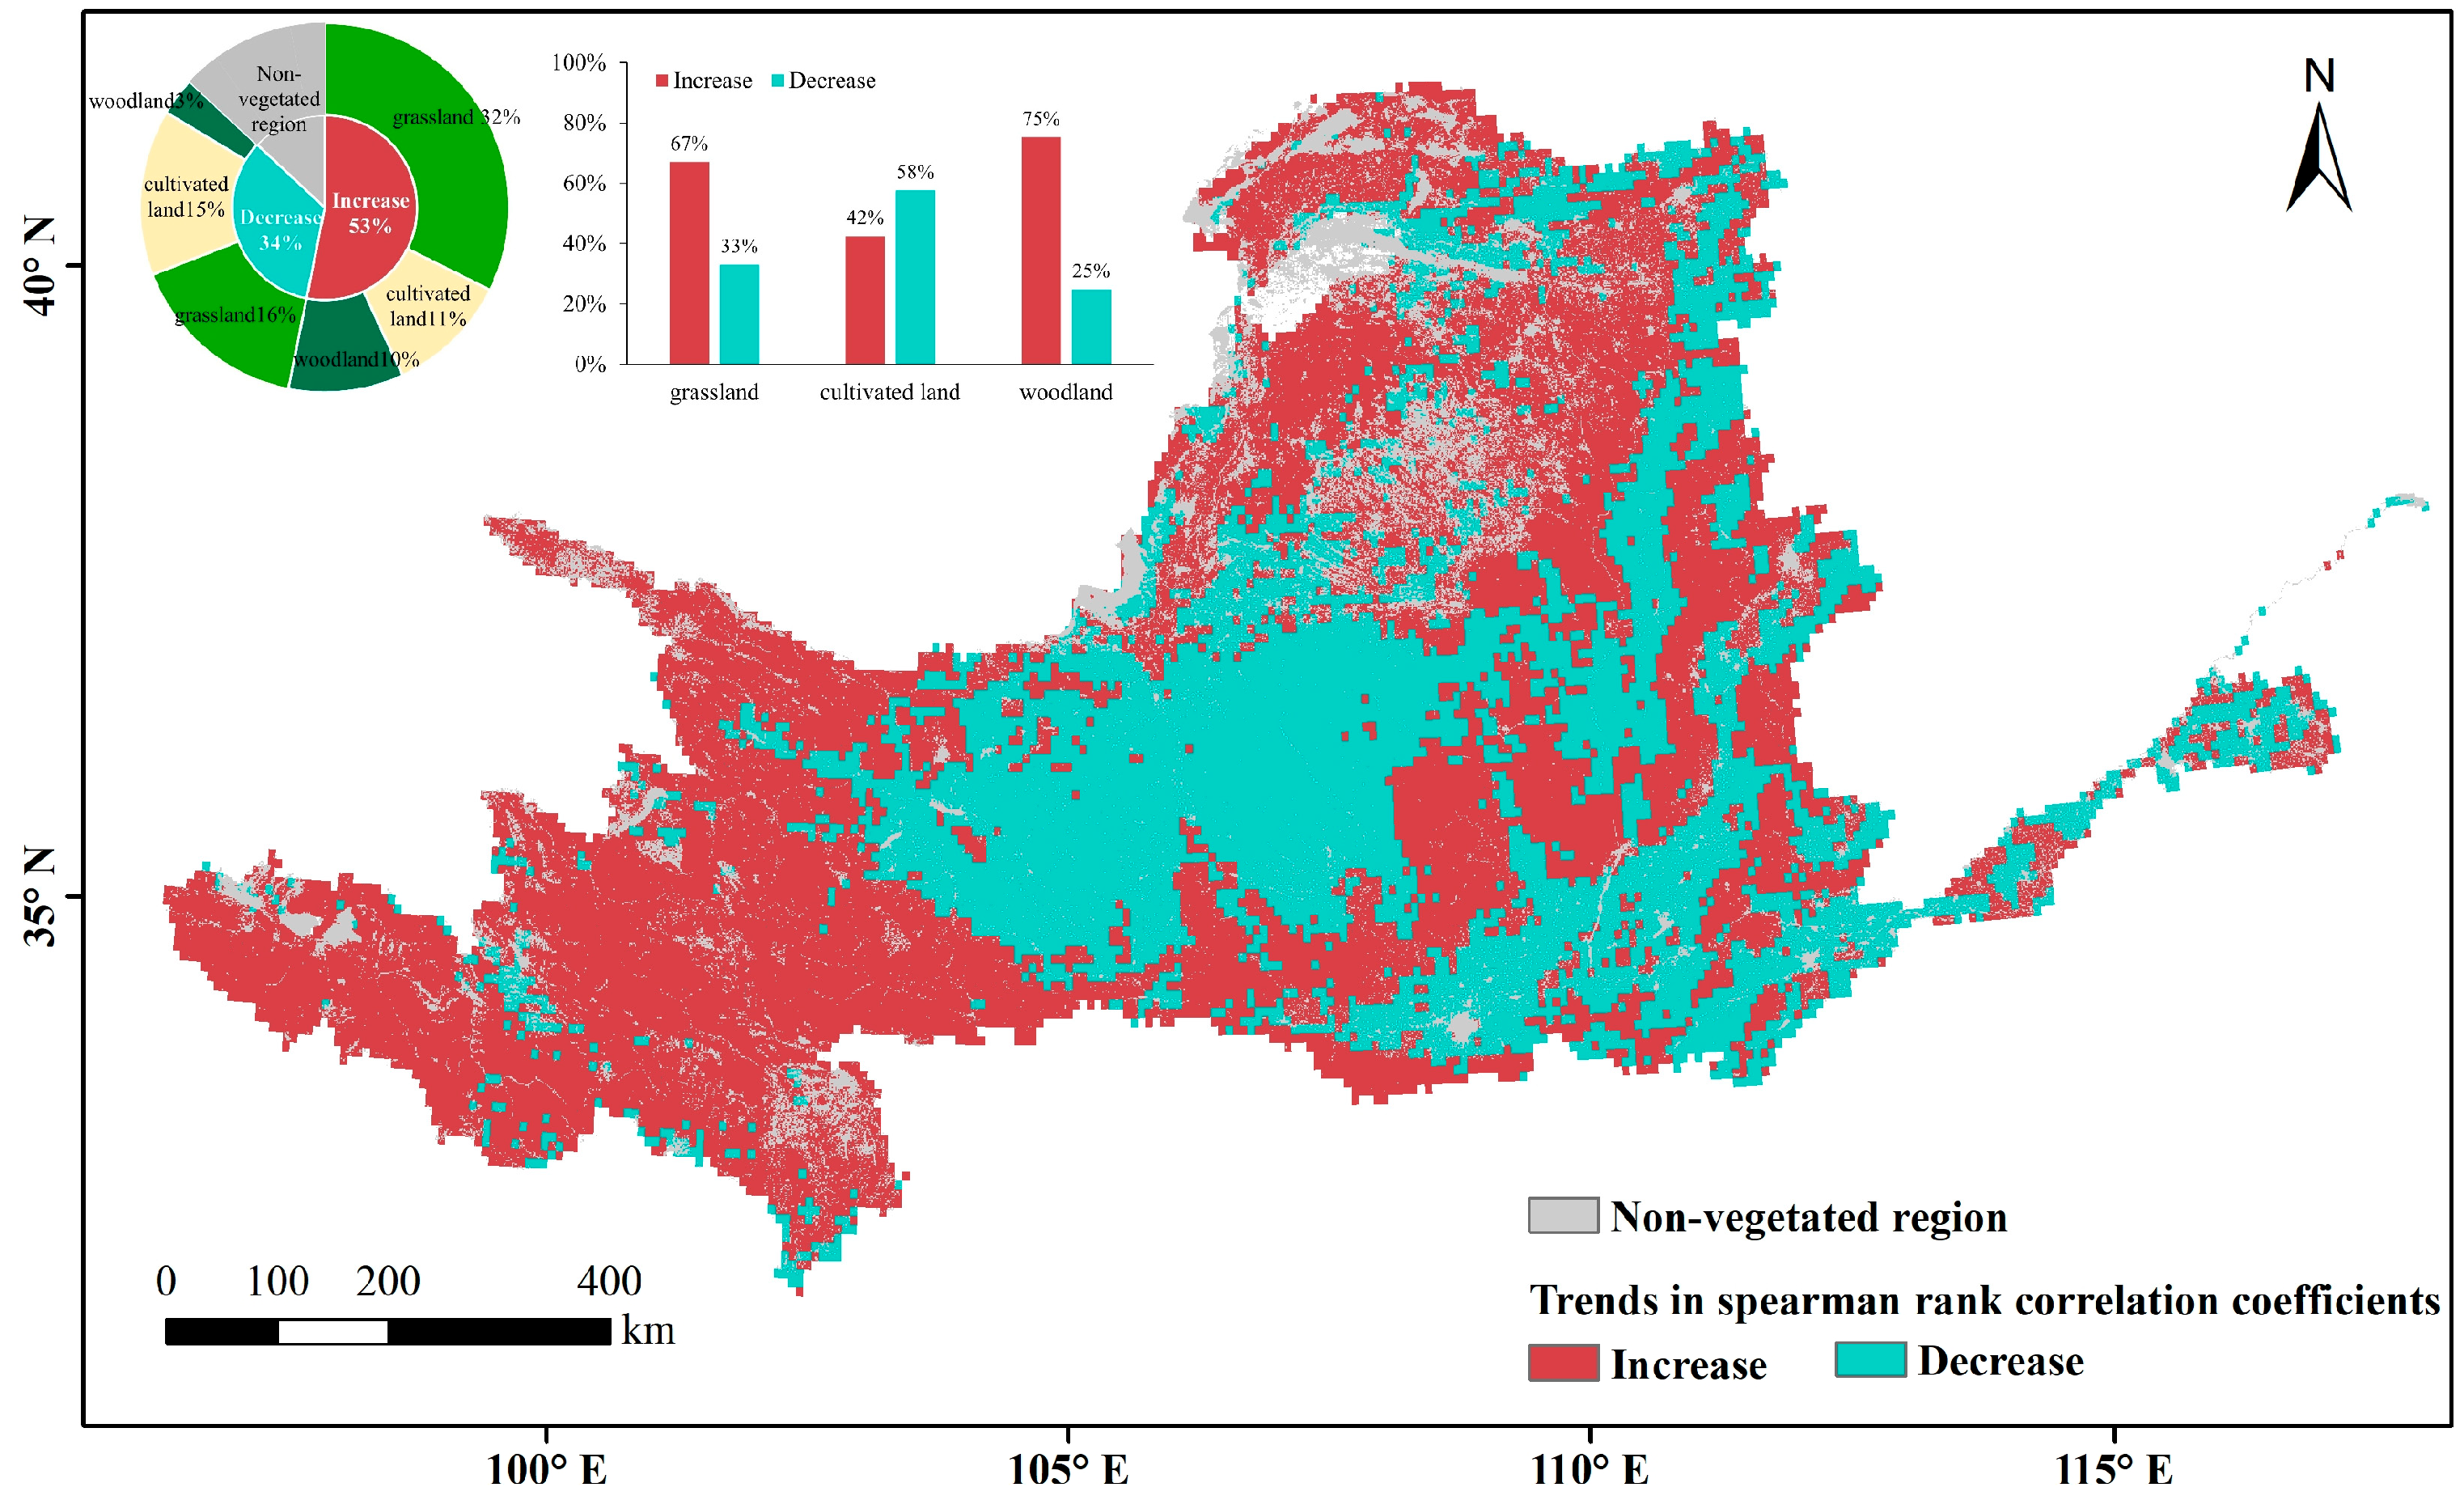
The area where VPD’d effects on vegetation show an increasing trend is greater than the area where effects are decreased (Figure 11), consistent with the trend of the 10-year moving average (Figure 12). On the raster scale, the proportion of areas with significantly stronger correlations increased significantly (p < 0.05) while that of the areas with significantly weaker correlations fluctuated and slightly decreased overall. These results confirm the increasingly positive relevance of VPD to vegetation. The change trends of the effects mainly depend on vegetation type: specifically, the relevance of VPD is strengthened for natural vegetation (grassland and woodland) and weakened for cropland vegetation.

Figure 11.
Spatial distribution of trends in spearman rank correlation coefficients using 10-year moving windows.

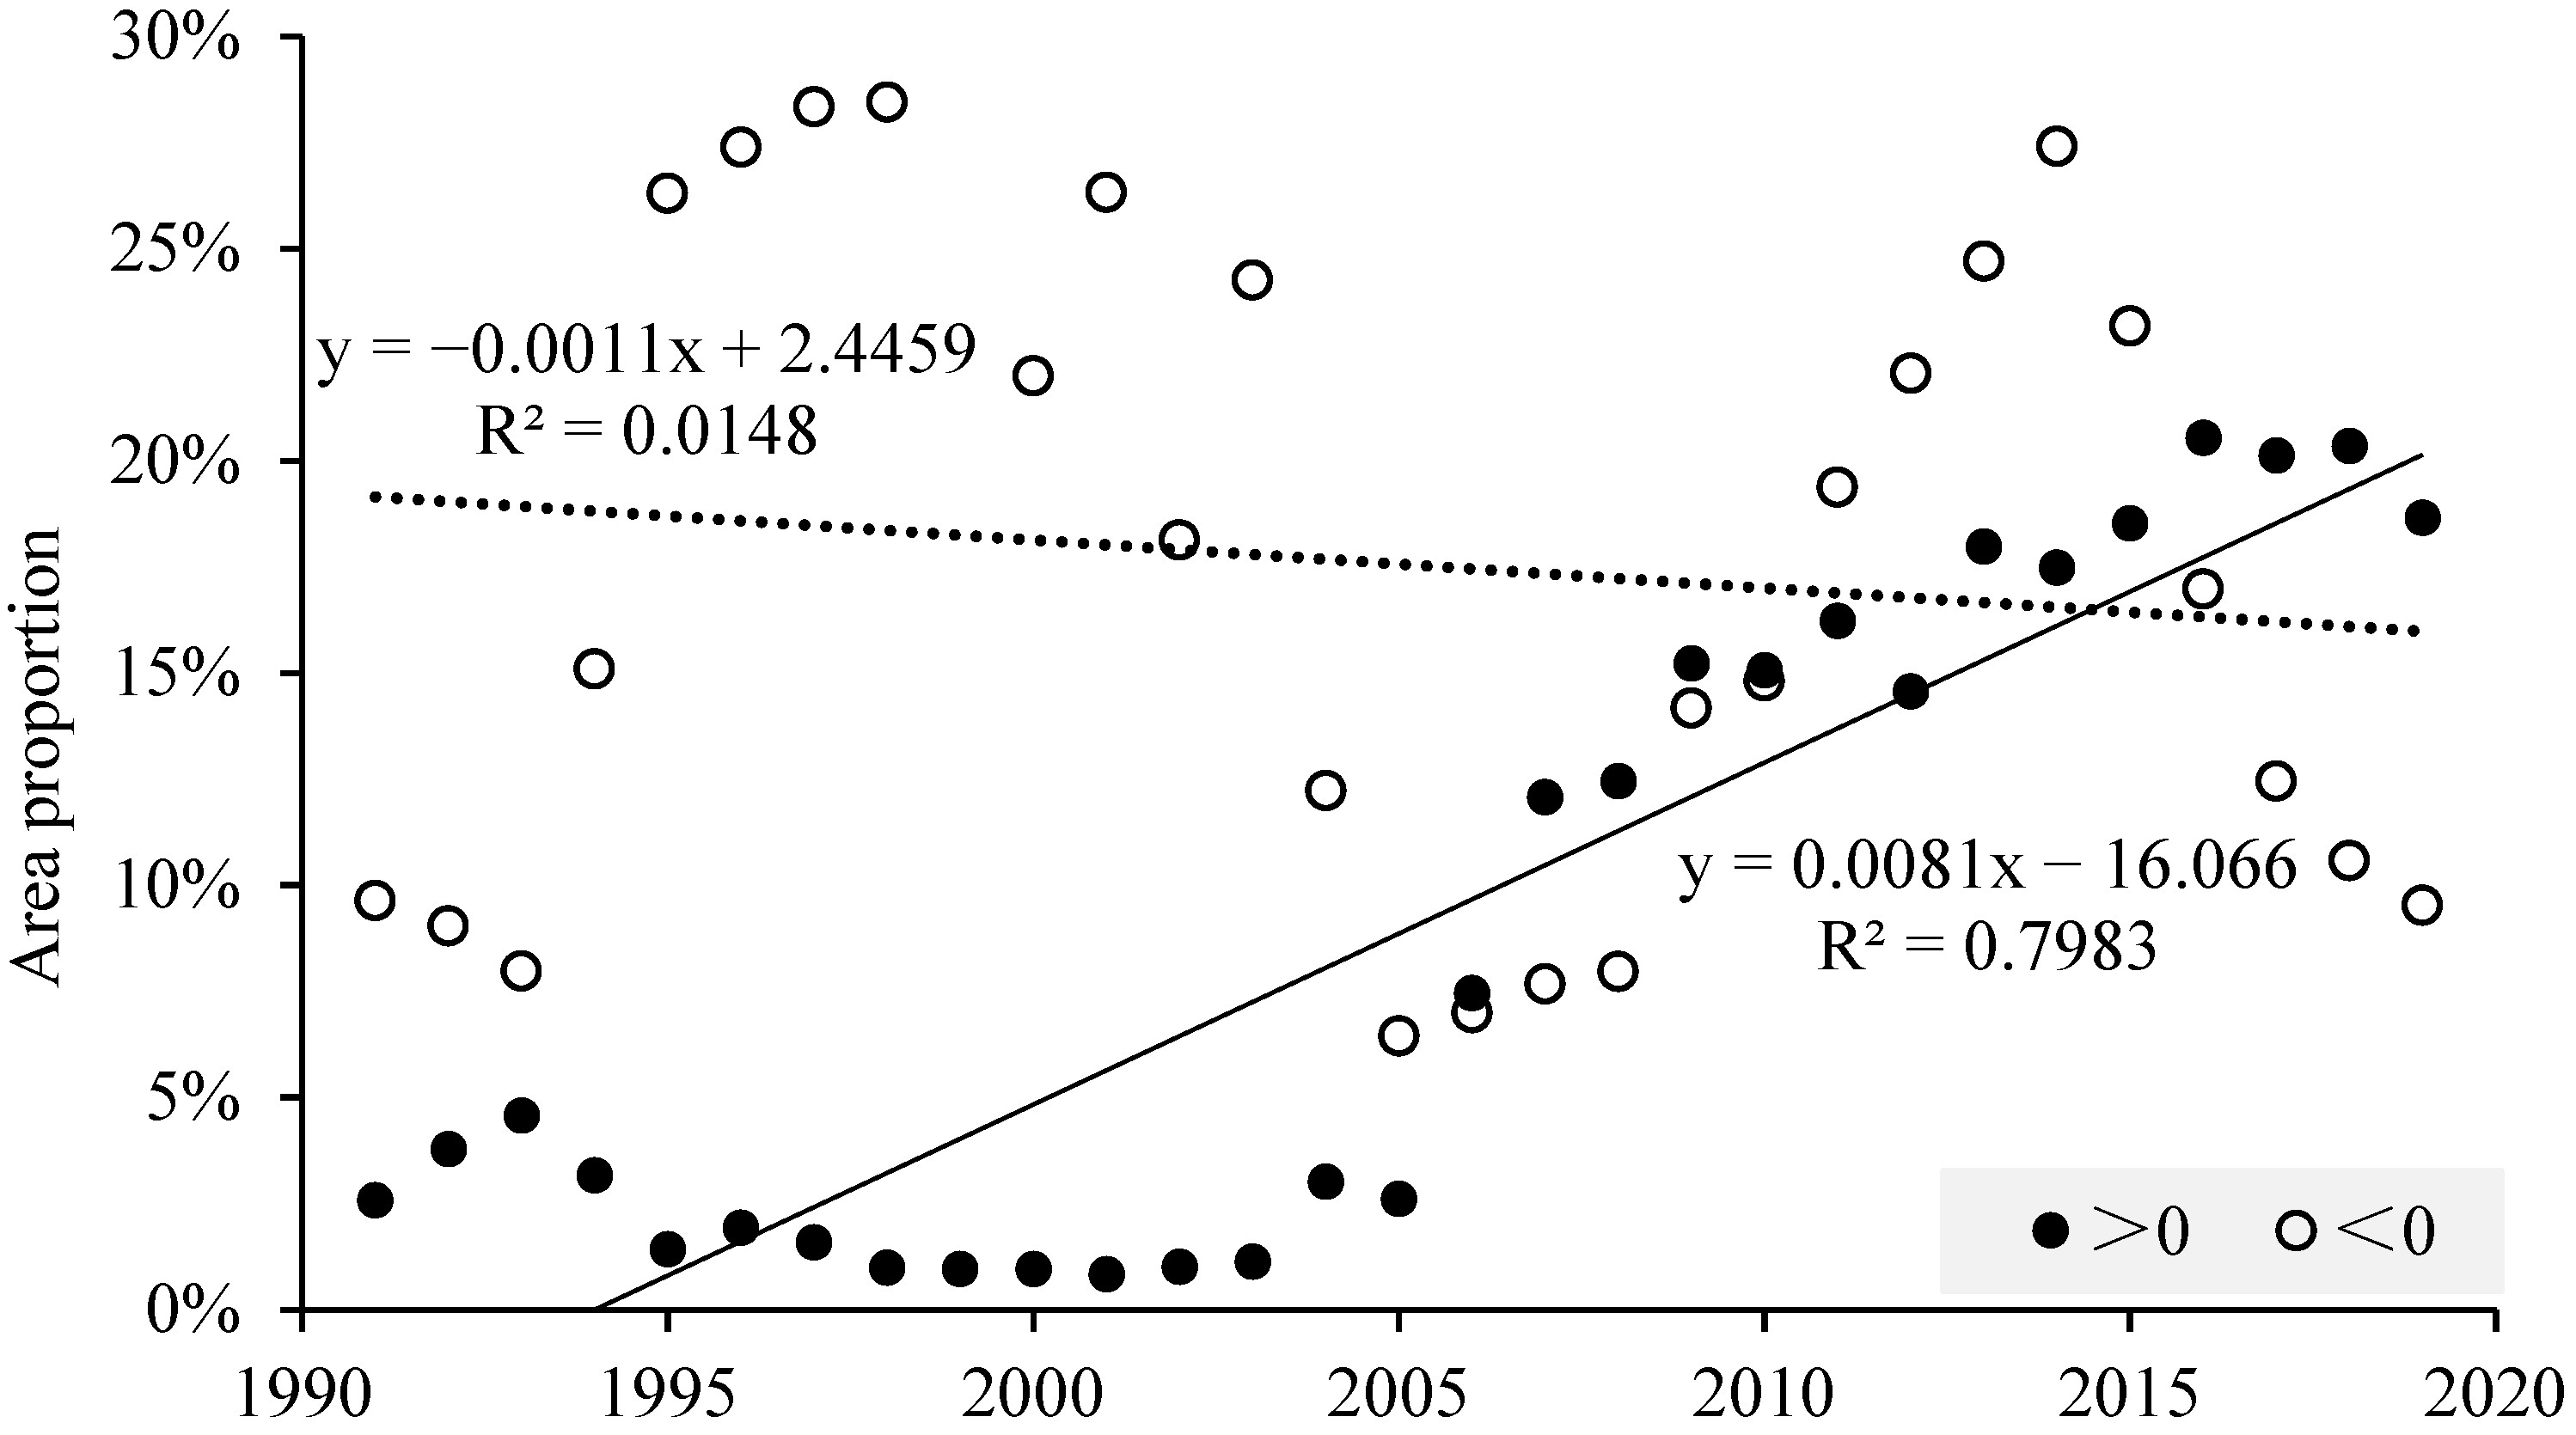
Figure 12.
Temporal trends of significant changes in percentage areas associated with promotion and inhibition using 10-year moving windows (the solid circles greater than 0 represent the proportion of the area of rasters that exhibit a positive correlation trend for a given 10-year sliding average (i.e., the slope is greater than 0) and pass a test of significance; the hollow circles less than 0 represent a negative correlation trend; the solid and dashed lines indicate the linear trend lines for the solid and hollow data, respectively).
Combining these results with those of the Spearman rank correlation coefficients, the VPD has continuously promoted the growth of forest and grassland in most parts of the Yellow River Basin but has continuously inhibited the growth of grassland vegetation in the Maowusu sandland in the arid region. VPD promotion of crop growth shows an increasing trend in the north–central part of the arid region, while VPD inhibition of crop growth shows a weakening trend in the semi-humid region.
4. Discussion
In recent years, the response of vegetation growth to changes in atmospheric moisture has attracted much attention. Microscale studies have revealed that whereas moderate VPD promotes vegetation growth, excessive VPD reduces stomatal conductance and inhibits vegetation growth, and these conclusions have become widely recognized. Herein, we investigated the different effects of VPD on vegetation growth from long-term series data at the watershed scale, considering the climatic zoning and vegetation types, and obtaining interesting findings. Aligning with the global VPD trend against a climate-warming background [11,28], the VPD in the Yellow River Basin has significantly increased and radiated outward from its central sites (the arid region). Overall, the VPD has facilitated vegetation growth in the Yellow River Basin and shows a significantly increasing trend in the basin overall. The coefficient of determination of the linearly trending 10-year moving windows correlation reached 0.7983.
The effects of VPD on vegetation differed among the vegetation types in different climatic zones. In general, the enhancement relevance of VPD exceeded the inhibitory effect in natural forest grasslands, but the opposite was observed in irrigation areas. Moreover, the VPD exerted a significantly higher promotional effect on natural forest grassland than on irrigation crops. The inhibitory relevance of VPD on grasslands in the Yellow River Basin is concentrated mainly in Inner Mongolia; when the effects of VPD on the gross primary productivity (GPP) of vegetation in China were studied, it was similarly found that the VPD inhibits the GPP mainly in grassland vegetation in Inner Mongolia [29]. In contrast, the VPD promotes the growth of alpine grasslands in the upper reaches of the Yellow River Basin, where the atmospheric water vapor conditions are relatively humid. Because VPD was dominant in regulating water use efficiency variations in alpine natural vegetation ecosystems [30], it can effectively promote plant germination and growth, ultimately improving vegetation productivity in cold regions [31].
The VPD usually promotes the growth of irrigation crops in the arid region of the Yellow River Basin but inhibits crop growth in semi-humid regions. This finding probably reflects the different effects of VPD in different climates. At a higher VPD, crops grown in arid regions can access sufficient soil water content to maintain a higher transpiration rate, thus lowering the effects of VPD on leaf stomatal conductance and vegetative photosynthesis [32]. The intensities of these effects showed an increasing trend in arid regions, most obviously in the Ningxia and Hetao irrigation districts, which are important mega-irrigation districts in China. The effects of atmospheric moisture on crops in arid regions are becoming increasingly prominent as such crops are safeguarded by anthropogenic interventions (e.g., irrigation). These findings of heterogeneity reveal that the relevance of VPD to vegetation growth (promotional or inhibitory) is more related to the climatic zoning of the vegetation than to vegetation types.
In the climate-warming environment, the global VPD is predicted to continue its present increase. The atmospheric moisture changes will likely cause frequent and persistent droughts, and the most severe changes are expected in arid regions. When the VPD increases to a certain threshold, its facilitating effect may convert to an inhibiting effect that reduces the productivity of vegetation in arid regions, such as by greatly increasing the mortality rate of forests [33] and significantly reducing food production [34]. Crops in arid regions require a good water-security strategy, and the relevance of VPD to crop growth in irrigated arid regions should be considered in food-security measures. Nevertheless, the growth of crops in arid regions is mainly ensured through soil-moisture assessments and timely irrigation. The relevance of VPD to crop growth in arid regions should be incorporated into the establishment of irrigation systems, further ensuring crop growth and improving the efficiency of water use. Similar suggestions have been made in the development of corn irrigation plans in Nebraska, USA, which aim to maintain crop yields while reducing irrigation water usage. The authors of that study attempted to reproduce the co-regulation pattern of VPD and soil moisture on crop growth using a validated hydraulically driven eco-system model [35]. Therefore, by considering the relevance of VPD on the growth process of crops in dryland areas, we could lessen the threat of drought events on crops growing in irrigation areas, and enhance humans’ resilience to drought-stricken agricultural production in dryland areas.
However, as climatic factors exert complex effects on terrestrial vegetation ecosystems [36], more spatial and temporal data are needed to accurately assess the relevance of VPD to vegetation growth. In addition, we need to further explore the VPD effect thresholds of different vegetation based on continuous monitoring and specialized experiments [32]. By elucidating the response mechanisms of different vegetation productivities to VPD under wet and dry conditions, we could better understand the role of VPD in terrestrial vegetation ecosystems.
5. Conclusions
A continued increase in VPD is already an inevitable trend in the future, which is a fact that must be faced in the sustainable development of vegetation ecosystems. Observing the response of terrestrial vegetation to changes in the atmospheric moisture status is necessary for minimizing the adverse effects of climate change. In this study, we explored the spatiotemporal variations in VPD and LAI during the growing season and elucidated the different effects of VPD on vegetation. The results are summarized as follows: (1) the VPD and LAI in the Yellow River Basin have both increased over the past nearly 40 years, with the VPD increasing radially outward from the arid regions while the vegetation develops well over most of the whole basin; (2) at the whole-basin scale, the area of VPD that is positively correlated with vegetation growth is greater than the area of negative correlation, and this overall trend is increasing significantly; (3) the VPD exerts heterogeneous effects on different vegetation in different climatic zones, and these heterogeneity findings suggest that the effects of VPD on vegetation are more influenced by differences among the climatic zones of the vegetation than by differences in the vegetation types themselves. Hence, we recommend that the effects of VPD be included in the future development of strategies for safeguarding vegetation over large spatial scales, especially those of crops and ecologically fragile natural vegetation in arid regions.
Author Contributions
Conceptualization, X.J. and Y.H.; methodology, X.J. and Y.F.; validation, H.W.; investigation, H.W. and Q.J.; resources, X.J. and Y.F.; data curation, L.Y.; writing—original draft preparation, X.J. and Y.F.; writing—review and editing, Y.H. and M.Z.; funding acquisition, Y.H. All authors have read and agreed to the published version of the manuscript.
Funding
This research was funded by National Natural Science Foundation of China (U2243226 and U2243601) and Special Basic Research Fund for Central Public Research Institutes (HKY-JBYW-2024-09).
Institutional Review Board Statement
Not applicable.
Informed Consent Statement
Not applicable.
Data Availability Statement
Data will be available on request.
Conflicts of Interest
The authors declare no conflicts of interest.
References
- Song, Y.; Jiao, W.; Wang, J.; Wang, L. Increased global vegetation productivity despite rising atmospheric dryness over the last two decades. Earths Future 2022, 10, 1–16. [Google Scholar] [CrossRef]
- Sanginés de Cárcer, P.; Vitasse, Y.; Peñuelas, J.; Jassey, V.E.J.; Buttler, A.; Signarbieux, C. Vapor-pressure deficit and extreme climatic variables limit tree growth. Glob. Change Biol. 2018, 24, 1108–1122. [Google Scholar] [CrossRef] [PubMed]
- Vicca, S.; Balzarolo, M.; Filella, I.; Granier, A.; Herbst, M.; Knohl, A.; Longdoz, B.; Mund, M.; Nagy, Z.; Pintér, K.; et al. Remotely-sensed detection of effects of extreme droughts on gross primary production. Sci. Rep. 2016, 6, 28269. [Google Scholar] [CrossRef] [PubMed]
- Konings, A.G.; Williams, A.P.; Gentine, P. Sensitivity of grassland productivity to aridity controlled by stomatal and xylem regulation. Nat. Geoence 2017, 10, 284–288. [Google Scholar] [CrossRef]
- Wen, R.; Jiang, P.; Qin, M.; Jia, Q.; Cong, N.; Wang, X.; Meng, Y.; Yang, F.; Liu, B.; Zhu, M.; et al. Regulation of NDVI and ET negative responses to increased atmospheric vapor pressure deficit by water availability in global drylands. Front. For. Glob. Chang. 2023, 6, 1164347. [Google Scholar] [CrossRef]
- Zhou, S.; Zhang, Y.; Williams, A.P.; Gentine, P. Projected increases in intensity, frequency, and terrestrial carbon costs of compound drought and aridity events. Sci. Adv. 2019, 5, 1–8. [Google Scholar] [CrossRef]
- Carnicer, J.; Barbeta, A.; Sperlich, D.; Coll, M.; Peñuelas, J. Contrasting trait syndromes in angiosperms and conifers are associated with different responses of tree growth to temperature on a large scale. Front. Plant Sci. 2013, 4, 1–19. [Google Scholar] [CrossRef] [PubMed]
- McDowell, N.; Pockman, W.T.; Allen, C.D.; Breshears, D.D.; Cobb, N.; Kolb, T.; Plaut, J.; Sperry, J.; West, A.; Williams, D.G.; et al. Mechanisms of plant survival and mortality during drought: Why do some plants survive while others succumb to drought. New Phytol. 2008, 178, 719–739. [Google Scholar] [CrossRef]
- Di, K.; Hu, Z.; Wang, M.; Cao, R.; Liang, M.; Wu, G.; Chen, R.; Hao, G.; Zhao, Y. Recent greening of grasslands in northern China driven by increasing precipitation. J. Plant Ecol. 2021, 14, 843–853. [Google Scholar] [CrossRef]
- Agyei, T.; Juráň, S.; Ofori-Amanfo, K.K.; Šigut, L.; Urban, O.; Marek, M.V. The impact of drought on total ozone flux in a mountain Norway spruce forest. J. For. Sci. 2020, 66, 280–287. [Google Scholar] [CrossRef]
- Liu, L.; Teng, Y.; Wu, J.; Zhao, W.; Liu, S.; Shen, Q. Soil water deficit promotes the effect of atmospheric water deficit on solar-induced chlorophyll fluorescence. Sci. Total Environ. 2020, 720, 137408. [Google Scholar] [CrossRef] [PubMed]
- Yinglan, A.; Wang, G.; Liu, T.; Xue, B.; Kuczera, G. Spatial variation of correlations between vertical soil water and evapotranspiration and their controlling factors in a semi-arid region. J. Hydrol. 2019, 574, 53–63. [Google Scholar] [CrossRef]
- Mao, K.; Chen, J.; Li, Z.; Ma, Y.; Song, Y.; Tan, X.; Yang, K. Global water vapor content decreases from 2003 to 2012: An analysis based on MODIS data. Chin. Geogr. Sci. 2017, 27, 1–7. [Google Scholar] [CrossRef]
- Novick, K.A.; Ficklin, D.L.; Stoy, P.C.; Williams, C.A.; Christopher Oishi, G.B.A.; Papuga, S.A.; Blanken, P.D.; Noormets, A.; Sulman, B.N.; Scott, R.L.; et al. The increasing importance of atmospheric demand for ecosystem water and carbon fluxes. Nat. Clim. Chang. 2016, 6, 1023–1027. [Google Scholar] [CrossRef]
- Williams, A.P.; Allen, C.D.; Macalady, A.K.; Griffin, D.; Woodhouse, C.A.; Meko, D.M.; Swetnam, T.W.; Rauscher, S.A.; Seager, R.; Grissino-Mayer, H.D.; et al. Temperature as a potent driver of regional forest drought stress and tree mortality. Nat. Clim. Chang. 2012, 3, 292–297. [Google Scholar] [CrossRef]
- Yuan, W.; Zheng, Y.; Piao, S.; Ciais, P.; Lombardozzi, D.; Wang, Y.; RYU, Y.; Chen, G.; Dong, W.; Hu, Z.; et al. Increased atmospheric vapor pressure deficit reduces global vegetation growth. Sci. Adv. 2019, 5, 1396–1418. [Google Scholar] [CrossRef] [PubMed]
- Massmann, A.; Gentine, P.; Lin, C. When does vapor pressure deficit drive or reduce evapotranspiration? J. Adv. Model. Earth Syst. 2019, 11, 3305–3320. [Google Scholar] [CrossRef] [PubMed]
- Wion, A.P.; Weisberg, P.J.; Pearse, I.S.; Redmond, M.D. Aridity drives spatiotemporal patterns of masting across the latitudinal range of a dryland conifer. Ecography 2020, 43, 569–580. [Google Scholar] [CrossRef]
- Lu, H.; Qin, Z.; Lin, S.; Chen, X.; Chen, B.; He, B.; Wei, J.; Yuan, W. Large influence of atmospheric vapor pressure deficit on ecosystem production efficiency. Nat. Commun. 2022, 2022, 1653. [Google Scholar] [CrossRef]
- Green, J.K.; Berry, J.; Ciais, P.; Zhang, Y.; Gentine, P. Amazon rainforest photosynthesis increases in response to atmospheric dryness. Sci. Adv. 2020, 6, abb7232. [Google Scholar] [CrossRef]
- Hsiao, J.; Swann, A.L.S.; Kim, S.H. Maize yield under a changing climate: The hidden role of vapor pressure deficit. Agric. For. Meteorol. 2019, 279, 107692. [Google Scholar] [CrossRef]
- Yu, T.; Jiapaer, G.; Bao, A.; Zheng, G.; Zhang, J.; Li, X.; Yuan, Y.; Huang, X.; Umuhoza, J. Disentangling the relative effects of soil moisture and vapor pressure deficit on photosynthesis in dryland Central Asia. Ecol. Indic. 2022, 137, 108698. [Google Scholar] [CrossRef]
- Feng, X.; Dawson, T.; Ackerly, D.; Santiago, L.S.; Thompson, S.E. Reconciling seasonal hydraulic risk and plant water use through probabilistic soil-plant dynamics. Glob. Chang. Biol. 2017, 23, 3758–3769. [Google Scholar] [CrossRef] [PubMed]
- Pivovaroff, A.L.; Pasquini, S.C.; De Guzman, M.E.; Alstad, K.P.; Stemke, J.S.; Santiago, L.S. Multiple strategies for drought survival among woody plant species. Funct. Ecol. 2016, 30, 517–526. [Google Scholar] [CrossRef]
- Sevanto, S.; McDowell, N.G.; Dickman, L.T.; Pangle, R.; Pockman, W.T. How do trees die? A test of the hydraulic failure and carbon starvation hypotheses. Plant Cell Environ. 2014, 37, 153–161. [Google Scholar] [CrossRef] [PubMed]
- Barigah, T.S.; Charrier, O.; Douris, M.; Bonhomme, M.; Herbette, S.; Améglio, T.; Fichot, R.; Brignolas, F.; Cochard, H. Water stress-induced xylem hydraulic failure is a causal factor of tree mortality in beech and poplar. Ann. Bot. 2013, 112, 1431–1437. [Google Scholar] [CrossRef] [PubMed]
- Grossiord, C.; Buckley, T.N.; Cernusak, L.A.; Novick, K.A.; Poulter, B.; Siegwolf, R.T.W.; Sperry, J.S.; McDowell, N.G. Plant responses to rising vapor pressure deficit. New Phytol. 2020, 226, 1550–1566. [Google Scholar] [CrossRef] [PubMed]
- Fang, Z.; Zhang, W.; Brandt, M.; Abdi, A.M.; Fensholt, R. Globally increasing atmospheric aridity over the 21st century. Earth’s Future 2022, 10, e2022EF003019. [Google Scholar] [CrossRef]
- Wu, X.; Zhang, R.; Bento, V.A.; Leng, S.; Qi, J.; Zeng, J.; Wang, Q. The effect of drought on vegetation gross primary productivity under different vegetation types across China from 2001 to 2020. Remote Sens. 2022, 14, 4658. [Google Scholar] [CrossRef]
- Wu, X.; Li, X.; Chen, Y.; Bai, Y.; Tong, Y.; Wang, P.; Liu, H.; Wang, M.; Shi, F.; Zhang, C.; et al. Atmospheric water demand dominates daily variations in water use efficiency in alpine meadows, northeastern Tibetan Plateau. J. Geophys. Res. Biogeosci. 2019, 124, 2174–2185. [Google Scholar] [CrossRef]
- You, Y.; Wang, S.; Pan, N.; Ma, Y.; Liu, W. Growth stage-dependent responses of carbon fixation process of alpine grasslands to climate change over the Tibetan Plateau, China. Agric. For. Meteorol. 2020, 291, 108085. [Google Scholar] [CrossRef]
- Zhong, Z.; He, B.; Wang, Y.; Chen, H.; Chen, D.; Fu, Y.; Chen, Y.; Guo, L.; Deng, Y.; Huang, L.; et al. Disentangling the effects of vapor pressure deficit on northern terrestrial vegetation productivity. Sci. Adv. 2023, 9, eadf3166. [Google Scholar] [CrossRef] [PubMed]
- Eamus, D.; Boulain, N.; Cleverly, J.; Breshears, D.D. Global change-type drought-induced tree mortality: Vapor pressure deficit is more important than temperature per se in causing decline in tree health. Ecol. Evol. 2013, 3, 2711–2729. [Google Scholar] [CrossRef] [PubMed]
- Lobell, D.B.; Hammer, G.L.; McLean, G.; Messina, C.; Roberts, M.J.; Schlenker, W. The critical role of extreme heat for maize production in the United States. Nat. Clim. Chang. 2013, 3, 497–501. [Google Scholar] [CrossRef]
- Zhang, J.; Guan, K.; Peng, B.; Pan, M.; Zhou, W.; Jiang, C.; Kimm, H.; Franz, T.E.; Grant, R.F.; Yang, Y.; et al. Sustainable irrigation based on co-regulation of soil water supply and atmospheric evaporative demand. Nat. Commun. 2021, 12, 5549. [Google Scholar] [CrossRef]
- Lian, X.; Piao, S.; Chen, A.; Wang, K.; Li, X.; Buermann, W.; Huntingford, C.; Peñuelas, J.; Xu, H.; Myneni, R.B. Seasonal biological carryover dominates northern vegetation growth. Nat. Commun. 2021, 12, 983. [Google Scholar] [CrossRef]


Disclaimer/Publisher’s Note: The statements, opinions and data contained in all publications are solely those of the individual author(s) and contributor(s) and not of MDPI and/or the editor(s). MDPI and/or the editor(s) disclaim responsibility for any injury to people or property resulting from any ideas, methods, instructions or products referred to in the content. |
© 2024 by the authors. Licensee MDPI, Basel, Switzerland. This article is an open access article distributed under the terms and conditions of the Creative Commons Attribution (CC BY) license (https://creativecommons.org/licenses/by/4.0/).