Article

Research on Multi-Objective Optimization of Shield Tunneling Parameters Based on Power Consumption and Efficiency

1
School of Civil Engineering, Central South University, Changsha 410075, China
2
State Key Laboratory of Shield Machine and Boring Technology, Zhengzhou 450001, China
3
China Railway Tunnel Group Co., Ltd., Guangzhou 511458, China
*
Authors to whom correspondence should be addressed.
Sustainability 2024, 16(14), 6152; https://doi.org/10.3390/su16146152
Submission received: 19 June 2024 / Revised: 11 July 2024 / Accepted: 16 July 2024 / Published: 18 July 2024

Abstract

:
The shield tunneling method is commonly used in the development and construction of underground spaces, and the adjustment of its parameters is a crucial part of shield construction. However, there are relatively few studies on optimizing tunneling parameters from a sustainable perspective, with a focus on energy saving and emission reduction. This study addresses this gap by combining engineering geological conditions with shield machine propulsion parameters in a specific section of metro construction in China. By aiming to reduce power consumption and improve efficiency, an improved particle swarm optimization algorithm based on the concept of Pareto optimal solutions was employed to optimize the tunneling parameters. The results demonstrated that the optimized parameters reduced power consumption and improved efficiency. This validates the feasibility of the optimization scheme and its potential for broader applications in sustainable underground construction.

1. Introduction

As urban population density continues to rise, traffic congestion becomes increasingly severe, making the development of underground transportation networks an inevitable solution. The complex ground conditions in cities often make open-cut methods impractical for tunnel construction. The shield tunneling method, with its high degree of mechanization, labor-saving benefits, and minimal impact on the surface environment, has thus been widely adopted for many underground projects.
However, shield machines, being large-scale equipment, consume a significant amount of energy and produce emissions during tunneling, posing considerable challenges in terms of cost control, construction schedule adherence, and environmental protection. In the face of global carbon emission concerns, reducing tunneling power consumption has become a critical goal in shield construction. Nonetheless, reducing power consumption may lead to a decrease in construction efficiency. Therefore, balancing power consumption and efficiency through the optimization of tunneling parameters presents a significant challenge.
Tunneling parameters reflect the specific conditions during construction, including geological conditions and shield posture. Many researchers have explored the information embedded in these parameters to identify directions for optimizing shield construction. With the rapid development of big data technology, integrating big data and intelligent algorithms into the engineering sector has become a popular research focus. Li Xue et al. [1] analyzed the characteristics and main influencing factors of shield tunneling thrust, proposing a mechanical mathematical modeling method based on field tunneling parameters and dimensional theory, thereby improving thrust calculation accuracy. Zhang Yakun et al. [2] developed a set of dimensionless, multi-objective tunneling performance evaluation indicators that could be used to match intelligent shield operation systems, providing a framework for intelligent parameter optimization. Wu Huiming et al. [3] utilized large volumes of construction data to build models using support vector machine algorithms to predict shield posture and optimize construction parameters. Zhang Z.L. et al. [4] addressed the shortcomings of traditional machine learning methods that require a large number of training samples by constructing a data-driven and physics-informed neural network model (PINN) to predict tunneling-induced surface settlement, aiming to enhance the intelligence of surface settlement control during shield tunnel construction. Men Yanqing et al. [5] defined tunneling efficiency from the perspective of tunneling power consumption and proposed methods for analyzing and evaluating this efficiency. Lee H.L. et al. [6] employed an ARIMAX-based walk forward (WF) prediction method to evaluate the performance of two different tunnel boring machines (TBMs), showing that the ARIMAX-based WF could provide reasonable operating conditions and time-varying data for TBMs, which could be used to make decisions that improved excavation performance. Cardu M. et al. [7] collected significant technical and mechanical parameters from numerous tunnels and performed statistical analysis using Microsoft Excel 2016, developing predictive models that estimated construction time during the preliminary design stage and evaluated the mechanical and operational parameters of TBMs. Xu Li et al. [8] proposed a new architecture for predicting TBM responses using a 2D convolutional neural network (2D-CNN) with dual input strategies, overcoming the traditional models’ inability to learn the impacts of control parameters, thus providing a foundation for timely optimization of TBM control parameters during tunneling. Wang H. et al. [9] considered several important performance aspects of TBMs during tunneling and used a differential evolution algorithm to solve multi-objective optimization problems. Gokceoglu C. et al. [10] predicted TBM performance by utilizing geological and geotechnical parameters along the tunnel and basic TBM parameters with a random forest algorithm, achieving favorable results. Agrawal A.K. et al. [11] considered five main process control parameters, including machine control parameters, cutter design parameters, and rock physical parameters. By analyzing cutter penetration rates and wear, they determined optimal values for thrust and torque to control cutter wear while maintaining an acceptable TBM penetration rate. Vieira J.T. et al. [12] optimized robust models and material removal rate deterministic models through evolutionary multi-objective methods, finding that multi-objective robust evolutionary results were superior to scalarization methods used for comparison purposes.
Currently, research on optimizing shield tunneling parameters focuses mainly on prediction, aiming to guide subsequent parameter selection by analyzing relationships among key parameters. However, studies that explore optimization opportunities from successful tunneling parameters are relatively rare, particularly those targeting power consumption and efficiency. Therefore, this study aims to reduce tunneling power consumption and enhance efficiency by applying an improved particle swarm optimization (PSO) algorithm combined with Pareto optimality principles. By exploring optimization directions from existing data and considering the multi-factor constraints of tunneling and geological parameters, this study seeks to develop a method for optimizing shield tunneling parameters that addresses both power consumption and efficiency.

2. Parameters

2.1. Power Consumption and Efficiency Calculation Methods

Power consumption of shield tunneling mainly consists of thrust power consumption and cutting power consumption [13]. The calculation methods are as follows:
P t o t a l = P t h r u s t + P c u t t i n g
P t h r u s t = F t h r u s t × v t h r u s t
P c u t t i n g = T × ω = 2 π T n
where P t o t a l is the total power consumption of shield tunneling, P t h r u s t and P c u t t i n g are the power consumed by thrust and cutting respectively. F t h r u s t , V t h r u s t are the thrust force and thrust velocity of a specific ring, and T , n are the torque and rotational speed of the cutterhead for that ring.
The efficiency of shield tunneling is typically evaluated by the penetration rate [14], which is calculated as follows:
E p = h p = v t h r u s t n
where E p is the tunneling efficiency and h p is the penetration rate (mm/r).
By optimizing the shield tunneling parameters involved in these formulas, we aim to reduce power consumption while improving tunneling efficiency, achieving optimal performance in shield construction.

2.2. Data Selection

Tunneling parameters directly influence efficiency calculations, but they are also affected by geological parameters. From the data extracted from the shield machine, we can obtain total thrust force, cutterhead torque, cutterhead rotational speed, and thrust speed. Integrating the geological data, we identified a total of 26 geological parameters that needed to be filtered to determine the key parameters for analyzing and evaluating tunneling efficiency, thereby enhancing the specificity and efficiency of the analysis.
The relationships between geological parameters can be evaluated using correlation analysis. Using Python 3.12.4. and the Seaborn library, a heatmap was generated to show the correlations among geological parameters (Figure 1). In the heatmap, the darker colors indicate stronger positive correlations, while lighter colors indicate stronger negative correlations. The heatmap revealed strong correlations among geological parameters that reflect the properties of the tunneling soil layer and significant correlations among some geological parameters reflecting the properties of the overlying soil layer.
The relationships between geological and tunneling parameters can be analyzed using supervised learning. A random forest algorithm [15] was employed for supervised learning to analyze the relationships between tunneling parameters (total thrust force, cutterhead torque, cutterhead rotational speed, and thrust speed) and geological parameters. Although the random forest itself does not directly calculate correlation coefficients, it helps us more specifically analyze the geological parameters that have a significant impact on the tunneling parameters by evaluating the influence of geological parameters on tunneling parameters and ranking them by importance. The results indicated that the top four key geological parameters were depth, density of the overlying soil, geological engineering classification of the overlying soil, and density of the excavation soil. According to the correlation analysis, density strongly correlated with other parameters, reflecting the engineering properties of both the overlying and excavation layers. The geological engineering classification [16] consists of six levels, ranging from I to VI: loose soil, common soil, hard soil, soft rock, medium-hard rock, and hard rock. This classification reflects the excavation difficulty and the uniaxial saturated compressive strength of the soil layers. Since the geological engineering classification of the overlying soil can be derived from parameters such as density and compressive strength, and considering the correlations among geological parameters and the results of supervised learning, depth, density of the overlying soil, and density of the tunneling soil were ultimately selected as the three key geological parameters for analyzing and evaluating power consumption and efficiency.

3. Project Overview

3.1. Section Division

The project under study was a section of Line 6 of the Changsha Metro. Based on the characteristics of the overlying soil layers in this section, it was divided into three major sections: A, B, and C. The specifics are as follows:
Section A: The overlying layer mainly consisted of slate and fill soil, with a high density, mostly between 2080 and 2100 kg/m3.
Section B: The overlying layer contained some silty clay, resulting in a slight decrease in density.
Section C: The overlying layer was predominantly silty clay, with the presence of gravel layers, and an average density of approximately 2000 kg/m3.
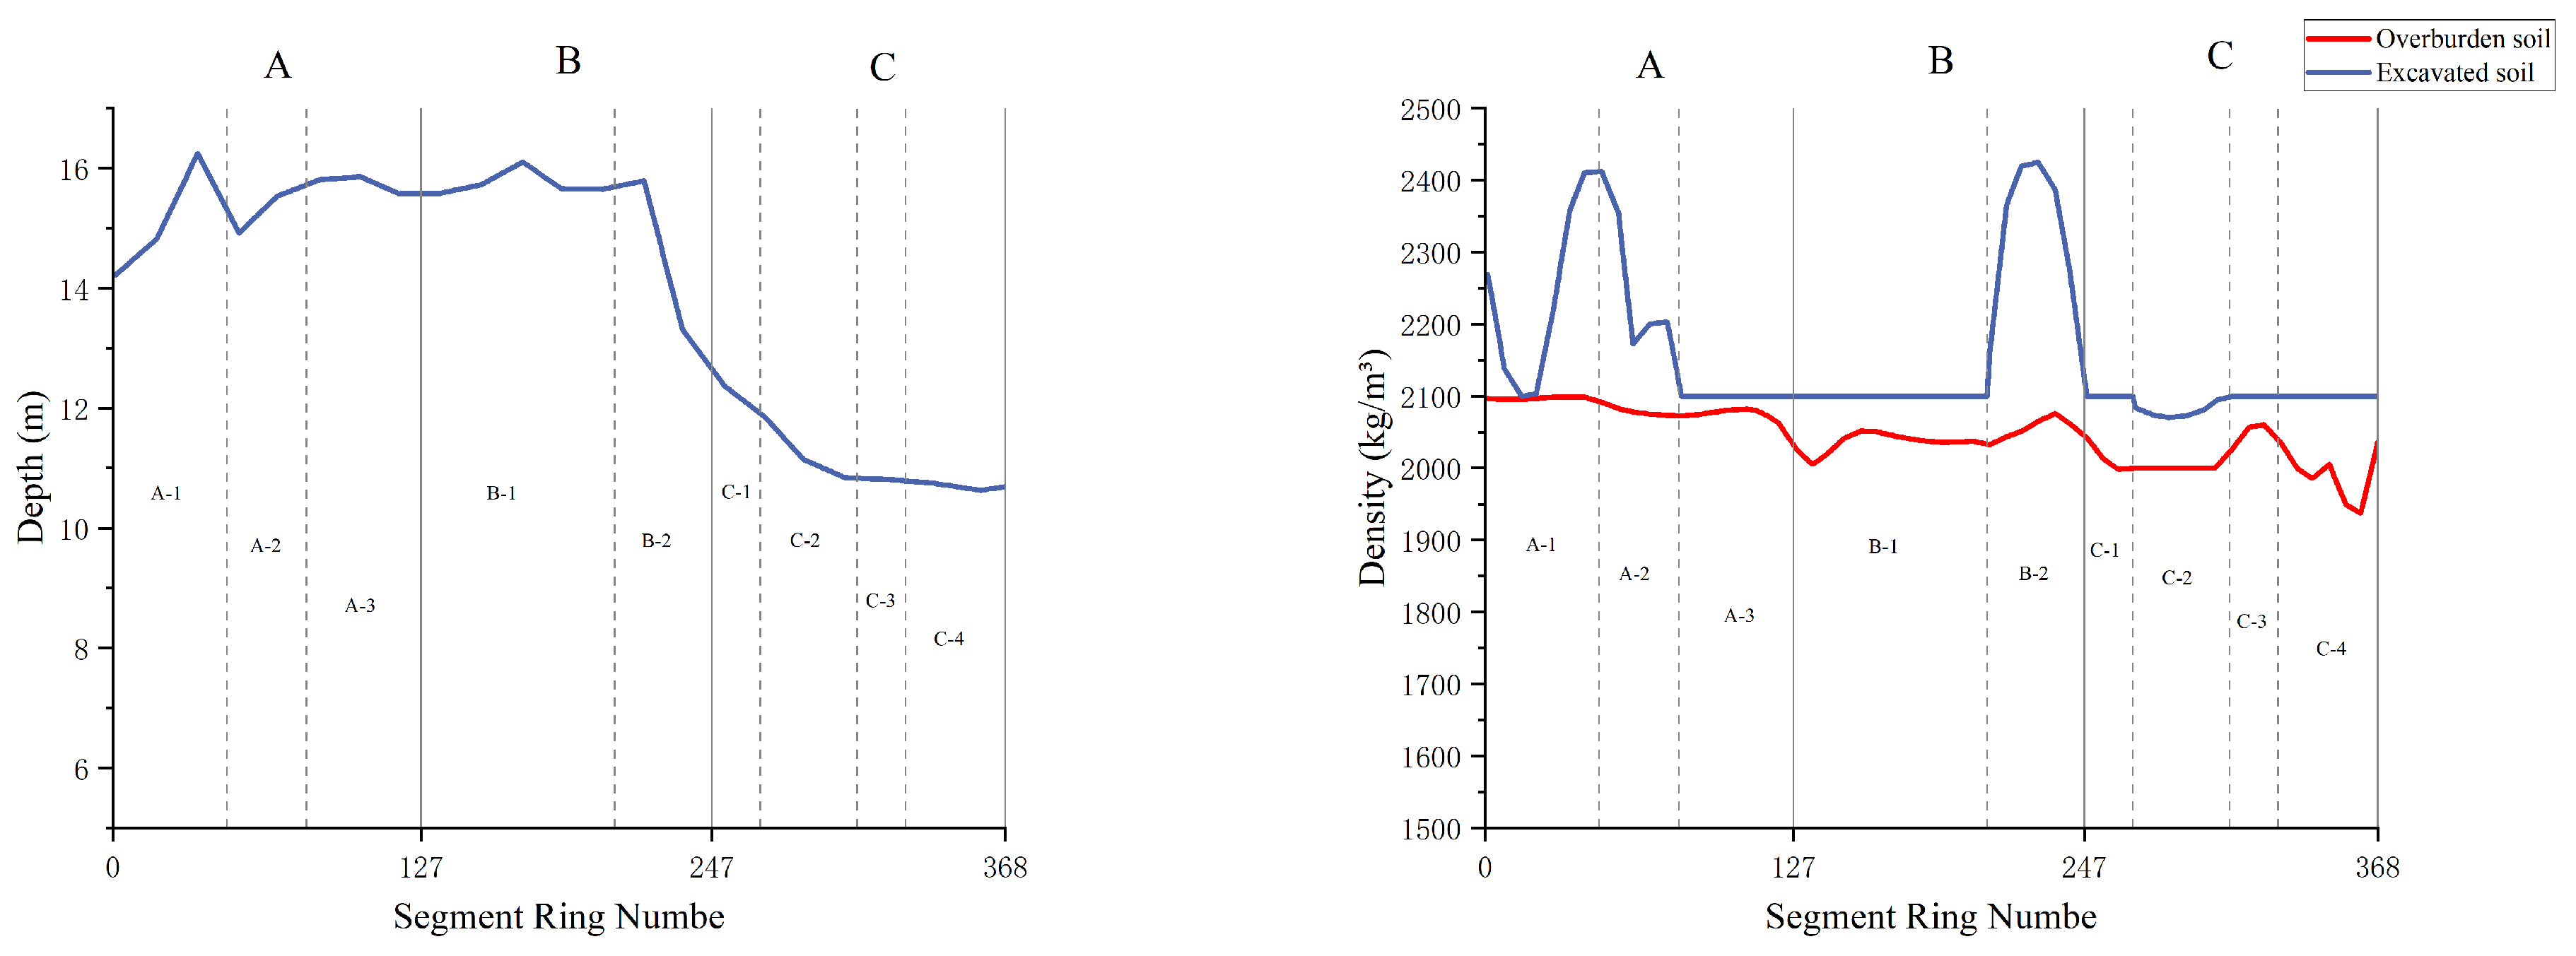
Considering the variations in depth, overlying soil layers, and tunneling soil layers, a more detailed subdivision of the major sections was conducted. The specific divisions are shown in Table 1, and the trends in geological parameters are illustrated in Figure 2.
In Section A, the depth ranged from 14.2 to 16.3 m, with significant variation in depth in subsection A-1. The density of the tunneling soil layer varied greatly in subsections A-1 and A-2, while the overlying soil layer showed minor variations. In subsection A-3, the tunneling soil layer was uniform, but the overlying soil layer varied significantly compared to the previous two subsections.
In Section B, subsection B-1 showed minor depth variations, and the tunneling soil layer was uniform, consisting of highly weathered slate. In subsection B-2, the depth variation was larger, and the tunneling soil layer consisted of a composite of highly weathered slate and moderately weathered slate, with significant density variations and a standard deviation of 92.24 kg/m3.
Section C had an overall shallower depth, ranging from 10.6 to 12.6 m. Except for subsection C-2, the other three subsections had uniform tunneling soil layers. In subsection C-2, the tunneling soil layer was composite, but the density variation was small, with a standard deviation of 8.92 kg/m3.

3.2. Tunneling Parameters for Each Section

The average tunneling parameters for each section are shown in Table 2, with power consumption and efficiency illustrated in Figure 3, Figure 4 and Figure 5. In Section A, the average tunneling efficiency ranged from 19 to 28 mm/r, but the highest total power consumption among all sections. The tunneling efficiency was medium to low and fluctuated significantly. In Section B, the total power consumption was moderate, with an average tunneling efficiency similar to that of Section A, ranging from 19 to 28 mm/r, but with a more stable tunneling efficiency. Section C had the lowest total power consumption, but an average tunneling efficiency ranging from 27 to 33 mm/r, which was the highest among the three sections.

4. Parameter Optimization

4.1. Optimization Model Selection

Low power consumption and high efficiency are somewhat contradictory goals. Therefore, in parameter optimization, it is necessary to consider both energy saving and efficiency through multi-objective optimization to determine the optimal range and direction of parameter adjustments. The Pareto optimality method [17] can yield multiple feasible solutions, each of which cannot be improved in any optimization objective without deteriorating another objective. Key concepts in this context are Pareto solutions, the Pareto optimal set, and the Pareto front.
The distribution of solutions obtained from multi-objective optimization is shown in Figure 6. Suppose there are two solutions, A and B. If solution A performs better than solution B in all optimization objectives, then A is said to dominate B. Furthermore, if there is no other solution that dominates A, then A is a non-dominated solution, also known as a Pareto solution. These non-dominated solutions collectively form the Pareto optimal set, and in the objective space, they constitute the Pareto front. All solutions on the Pareto front are not dominated by any solutions outside the front.
In addition, the following indicators can be used to measure the condition and quality of the Pareto solution:
The size of the Pareto optimal set: Refers to the number of solutions in the Pareto solution set. Theoretically, if the design variables in an optimization problem are continuous, the ideal Pareto optimal set contains an infinite number of non-dominated solutions. However, in engineering applications, it is not necessary to find all the non-dominated solutions, and common optimization algorithms can usually only find a limited number of Pareto optimal solutions. The size of the Pareto optimal set directly determines the number of solutions available for reference.
The diversity of Pareto solutions: The distribution of non-dominant solutions on the Pareto front can be used to describe the diversity of Pareto solutions. The solutions obtained by the algorithm are limited, so it is necessary to ensure the diversity of the solutions. If the distribution of the solutions is relatively uniform, the calculated Pareto front will be closer to the real Pareto front. At the same time, ensuring the diversity of multi-objective optimization results can also ensure that the best-performing solution can be sought to the greatest extent.
The determination of the best result in the Pareto optimal set: Ideally, every non-dominated solution can be the final target solution because it is already the best choice without compromising other optimization objectives. However, in engineering practice, to ensure the certainty of parameter selection, it is necessary to select the best solution from many non-dominated solutions. There are many methods and criteria for selecting the best solution from the Pareto solution set. In WSM [18], the most well-known and simplest method is adopted to complete the selection of the only solution. If there are m optimization objectives and n non-dominated solutions, when the optimization objectives are minimized, the optimal choice of the non-dominated solutions should satisfy the following formula:
R s c o r e = m i n i 1,2 , , n j = 1 m w j F i j
where, R s c o r e is the weighted sum score of the best solution in the non-dominated solution set (the solution with the smallest total score is the optimal solution); F i j is the normalized value of the i -th solution in the nondominated solution set on the j -th objective component; and W j 0 is the set weight of the j -th optimization objective. The solution-finding process (taking two-dimensional space as an example) is shown in Figure 7. Firstly, it is necessary to clarify the importance of the two optimization objectives and determine the corresponding weight value based on this. Secondly, the values of the two optimization objectives are standardized to obtain the standardized values of each Pareto solution on the two objective components. Finally, according to the weights and standardized values, each Pareto solution R s c o r e is calculated, and thus the optimal choice of Pareto solution is set.

4.2. Selection of Multi-Objective Optimization Algorithm

The particle swarm optimization [19] algorithm has the advantages of easy concept understanding, easy control of key parameters, and easy realization of optimization results in global optimization. The traditional particle swarm optimization algorithm can only solve the single-objective optimization problem. In order to expand the application scope of the algorithm and solve more practical engineering problems, the multi-objective particle swarm optimization algorithm is improved based on the original algorithm, which performs well in solving the multi-objective optimization problem. The particle in the algorithm has only two properties, namely, velocity and position. Each particle independently searches for the optimal solution in the space and records it as the current individual extreme value P b e s t . It determines the current group’s optimal solution G b e s t according to the density distance, and then updates the inertia weight. On this basis, all particles adjust their own speed and position according to the current individual extreme value P b e s t and the current group’s optimal solution G b e s t , calculates the fitness of the particle swarm, and updates the Pareto solution set. After repeated adjustments, the final optimal solution is obtained.
The algorithm steps are shown in Figure 8:
The formula of its particle renewal rate is:
v i t + 1 = w v i t + c 1 r 1 p i x i t + c 2 r 2 p g x i t x i t + 1 = x i + v i t + 1
Among them, X i is the parameter to be optimized, and the expected result is guaranteed by repeated iteration; W is the inertia factor, which is the weight of the velocity of the previous generation of particles; v i is the speed of each generation of particles; P i is the current individual extreme value of the i -th particle; P g is the current global optimal solution; c 1 = c 2 is the learning factor, which takes value in the interval of [0, 4]; and r 1 and r 2 are random numbers distributed over the interval [0, 1].
Compared with the traditional particle swarm optimization (PSO) algorithm, multi-objective particle swarm optimization (MOPSO) has the following differences:
Objective handling: Traditional PSO is designed for single-objective optimization problems, where only one objective function needs to be optimized. MOPSO, on the other hand, is designed for multi-objective optimization problems, handling multiple objective functions simultaneously with the goal of finding a set of Pareto optimal solutions.
Solution evaluation and selection: In traditional PSO, the fitness value of each particle is determined by a single objective function, and particles move towards the current global best position (a single solution). MOPSO uses the concept of Pareto dominance to evaluate the quality of solutions, storing non-dominated solutions in an external repository, with particles moving towards a set of non-dominated solutions.
Storage mechanism: Traditional PSO typically maintains information about the current best solution and does not store historical information. MOPSO employs an external repository (or secondary population) to store historically non-dominated solutions, helping to guide the particles’ flight direction.
In the shield tunneling parameter optimization process, after the population initialization, each particle represents a possible combination of shield tunneling parameters. The fitness value of each particle is evaluated by calculating the total energy consumption and efficiency of the shield tunneling. An external repository updated and maintained through Pareto dominance relationships is used to store non-dominated solutions. During the velocity update, non-dominated solutions from the external repository are introduced as references to guide the flight direction of other particles to adapt to multi-objective optimization. Additionally, a mutation operation is introduced to prevent the algorithm from falling into local optima. These operations can more effectively approximate the Pareto optimal solutions of the problem, balancing the reduction of energy consumption and the improvement of efficiency to solve multi-objective optimization problems effectively.

4.3. Optimization Results

The power consumption of shield tunneling consisted of thrust power consumption and cutting power consumption, while tunneling efficiency is represented by the penetration rate. The key tunneling parameters involved include total thrust force, cutterhead torque, thrust speed, and cutterhead rotational speed. Considering the characteristics of the optimization algorithm and multi-objective decision-making methods, in constructing the model, the tunneling efficiency was negated and the minimum value was obtained to ensure the optimization results. The final multi-objective optimization mathematical model was determined using the following formula:
P t o t a l = P t h r u s t + P c u t t i n g m i n P t o t a l x = P t h r u s t + P c u t t i n g E p s . t . F m i n F F m a x T m i n T T m a x n m i n n n m a x v m i n v v m a x
The key parameter settings of the optimization algorithm are shown in Table 3:
Also, using the WSM method, we looked for the best choice from the Pareto solution set. Firstly, normalization was carried out to convert the two target vectors of each solution in the Pareto solution set into standardized values. Secondly, the weights of the two indicators were clarified. In this paper, the importance of both was the same, so the weights were set to 0.5. Therefore, the best choice in the Pareto solution conformed to the following formula:
R s c o r e = m i n i 1,2 , , n 0.5 × F i P + 0.5 × F i E
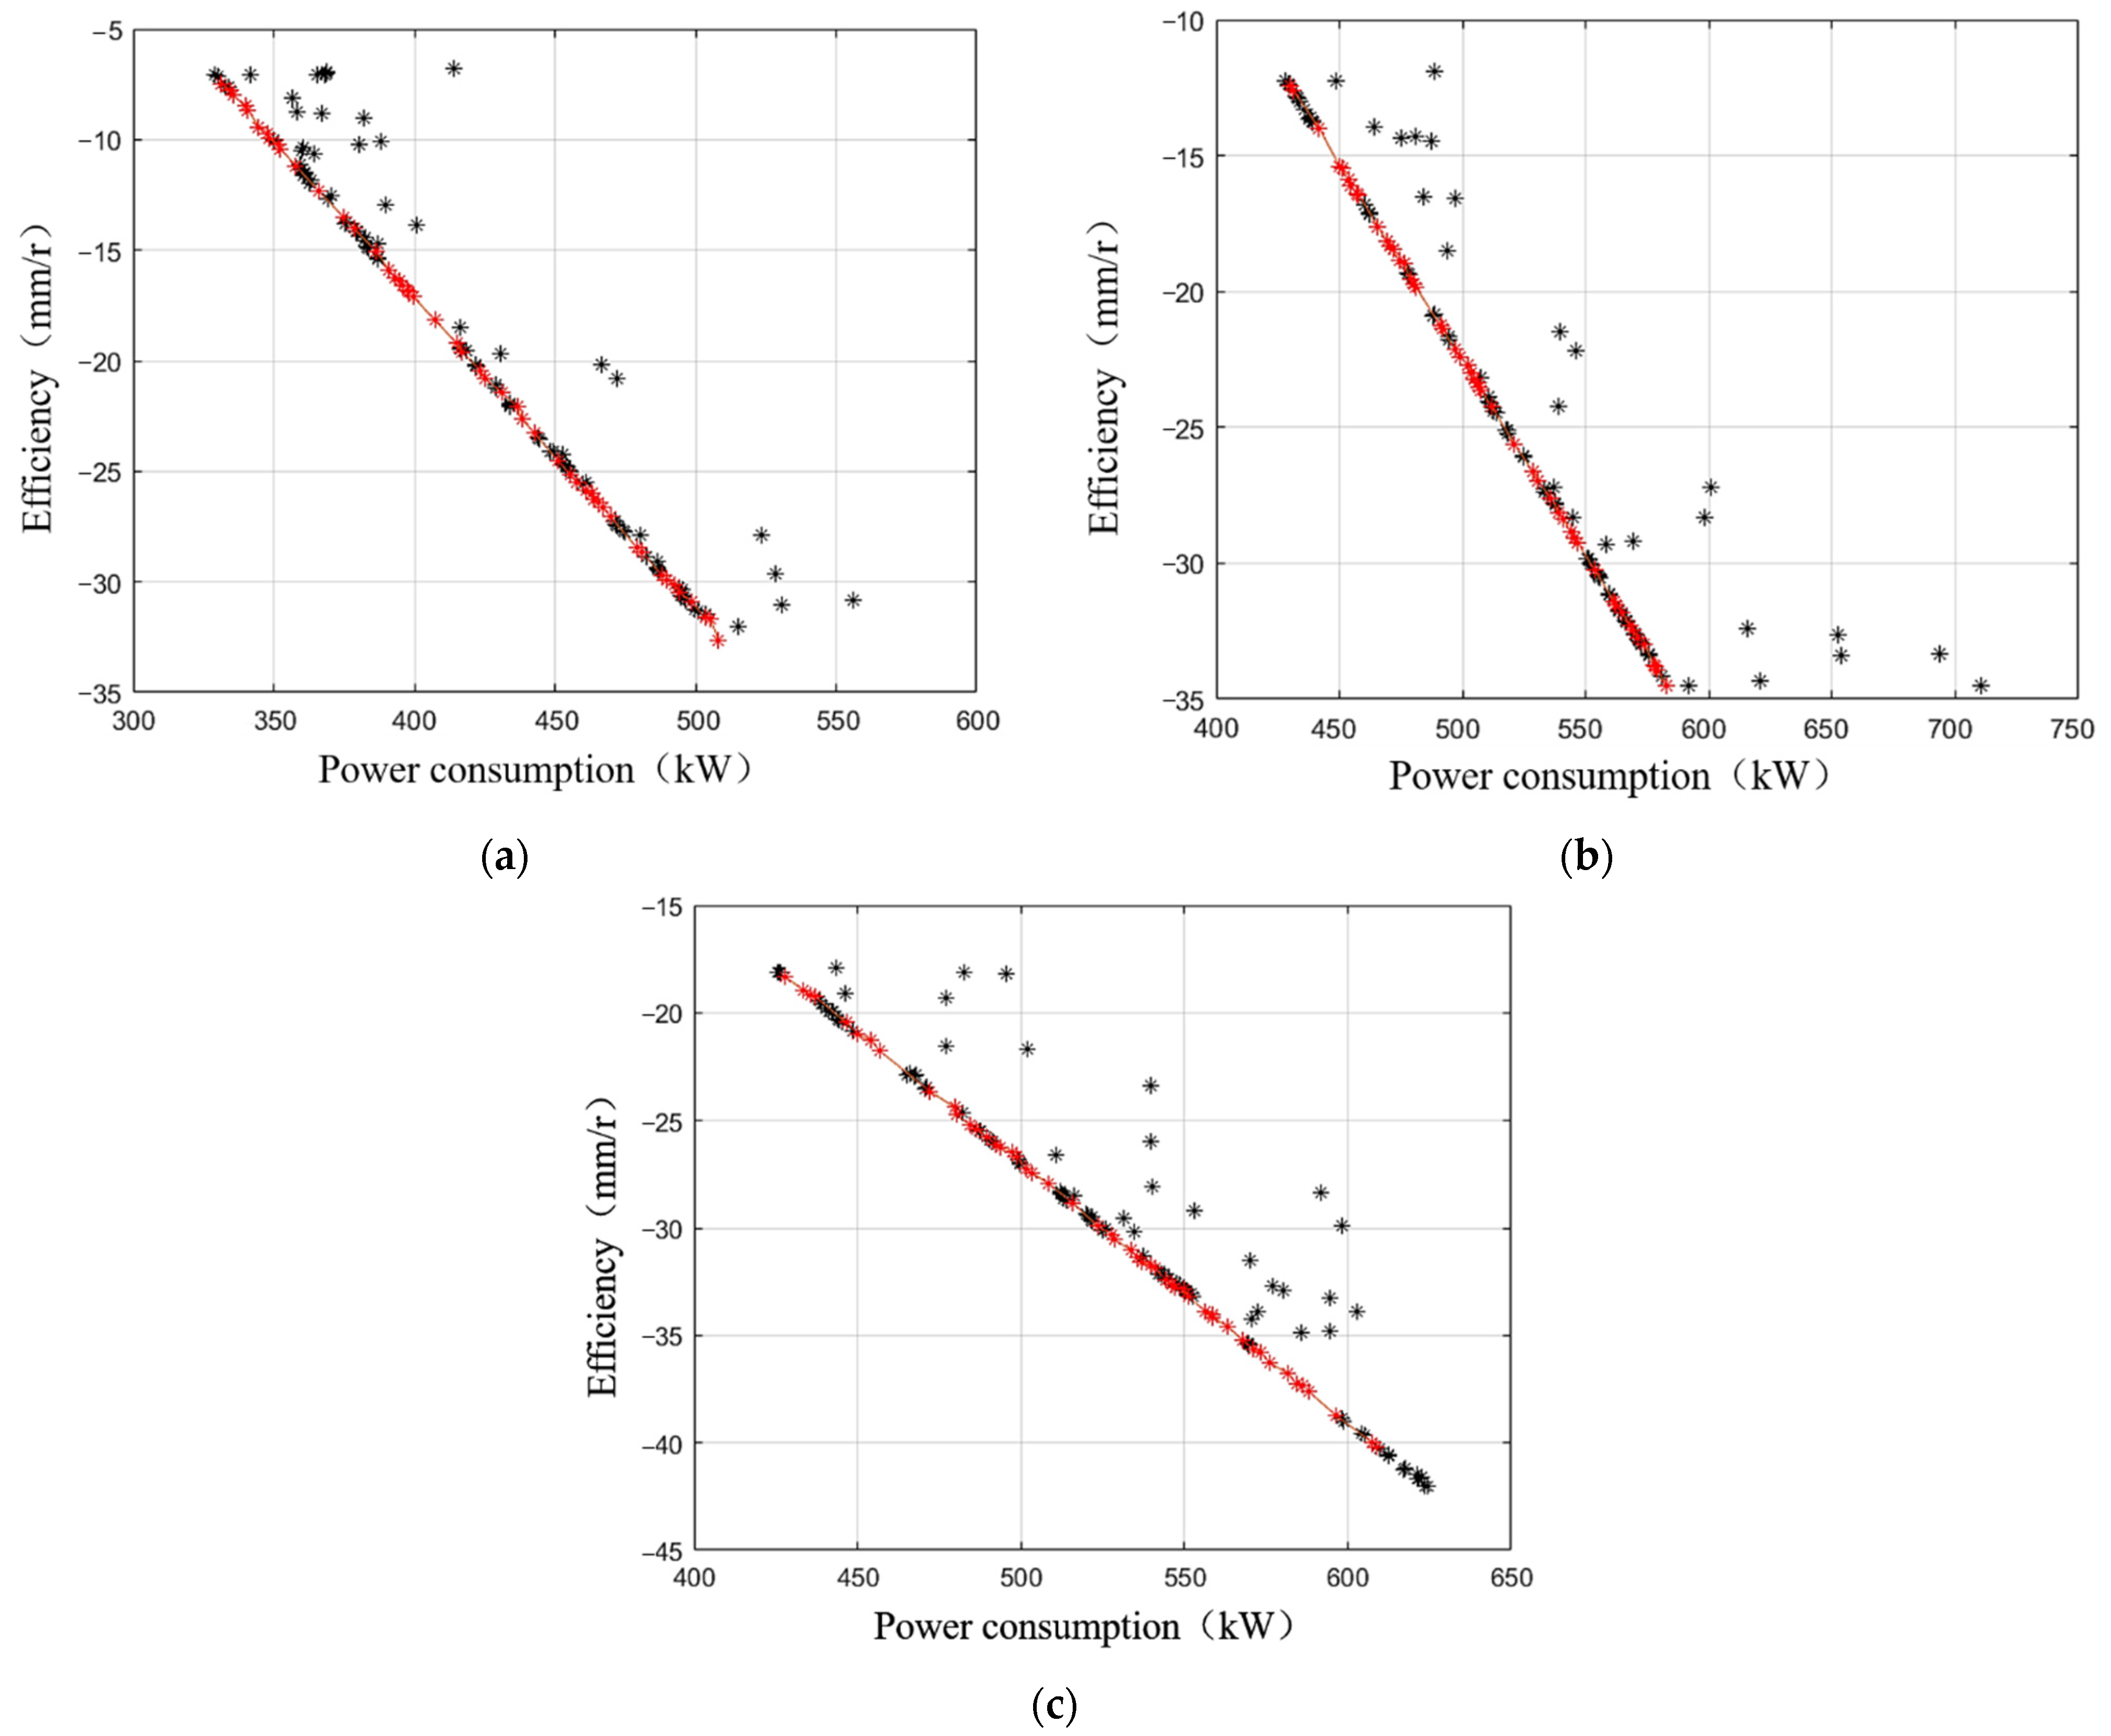
The optimization results for the three subsections in Section A are shown in Figure 9. The horizontal axis represents the shield tunneling power consumption while the vertical axis represents the negated tunneling efficiency. The red dots indicate non-dominated solutions, also known as Pareto solutions, which collectively form the Pareto front. The black dots represent dominated solutions. From the distribution of points in the optimization results, it was evident that the non-dominated solutions were evenly distributed along the Pareto front, indicating that the quality of the solutions in the Pareto optimal set was satisfactory.
Theoretically, each non-dominated solution could be considered as the final result. However, in practical engineering applications, it is necessary to select an optimal solution from the many Pareto solutions. The weighted sum method (WSM) was used to determine the optimal solution, where the solution with the smallest score is considered the best. The optimal parameter values for Section A are shown in Table 4:
Similarly, the distribution of solutions for Sections B and C is shown in Figure 10, and the parameter values are listed in Table 5.
Although the tunneling parameters corresponding to the optimal solution could be obtained, only thrust and rotational speed were actively controllable parameters. In contrast, thrust speed and torque, which are involved in power consumption and efficiency calculations, are influenced by multiple factors such as geological conditions. Therefore, these parameters could not be directly used as optimization recommendations and required multi-parameter fitting to obtain values that better reflect actual excavation conditions.
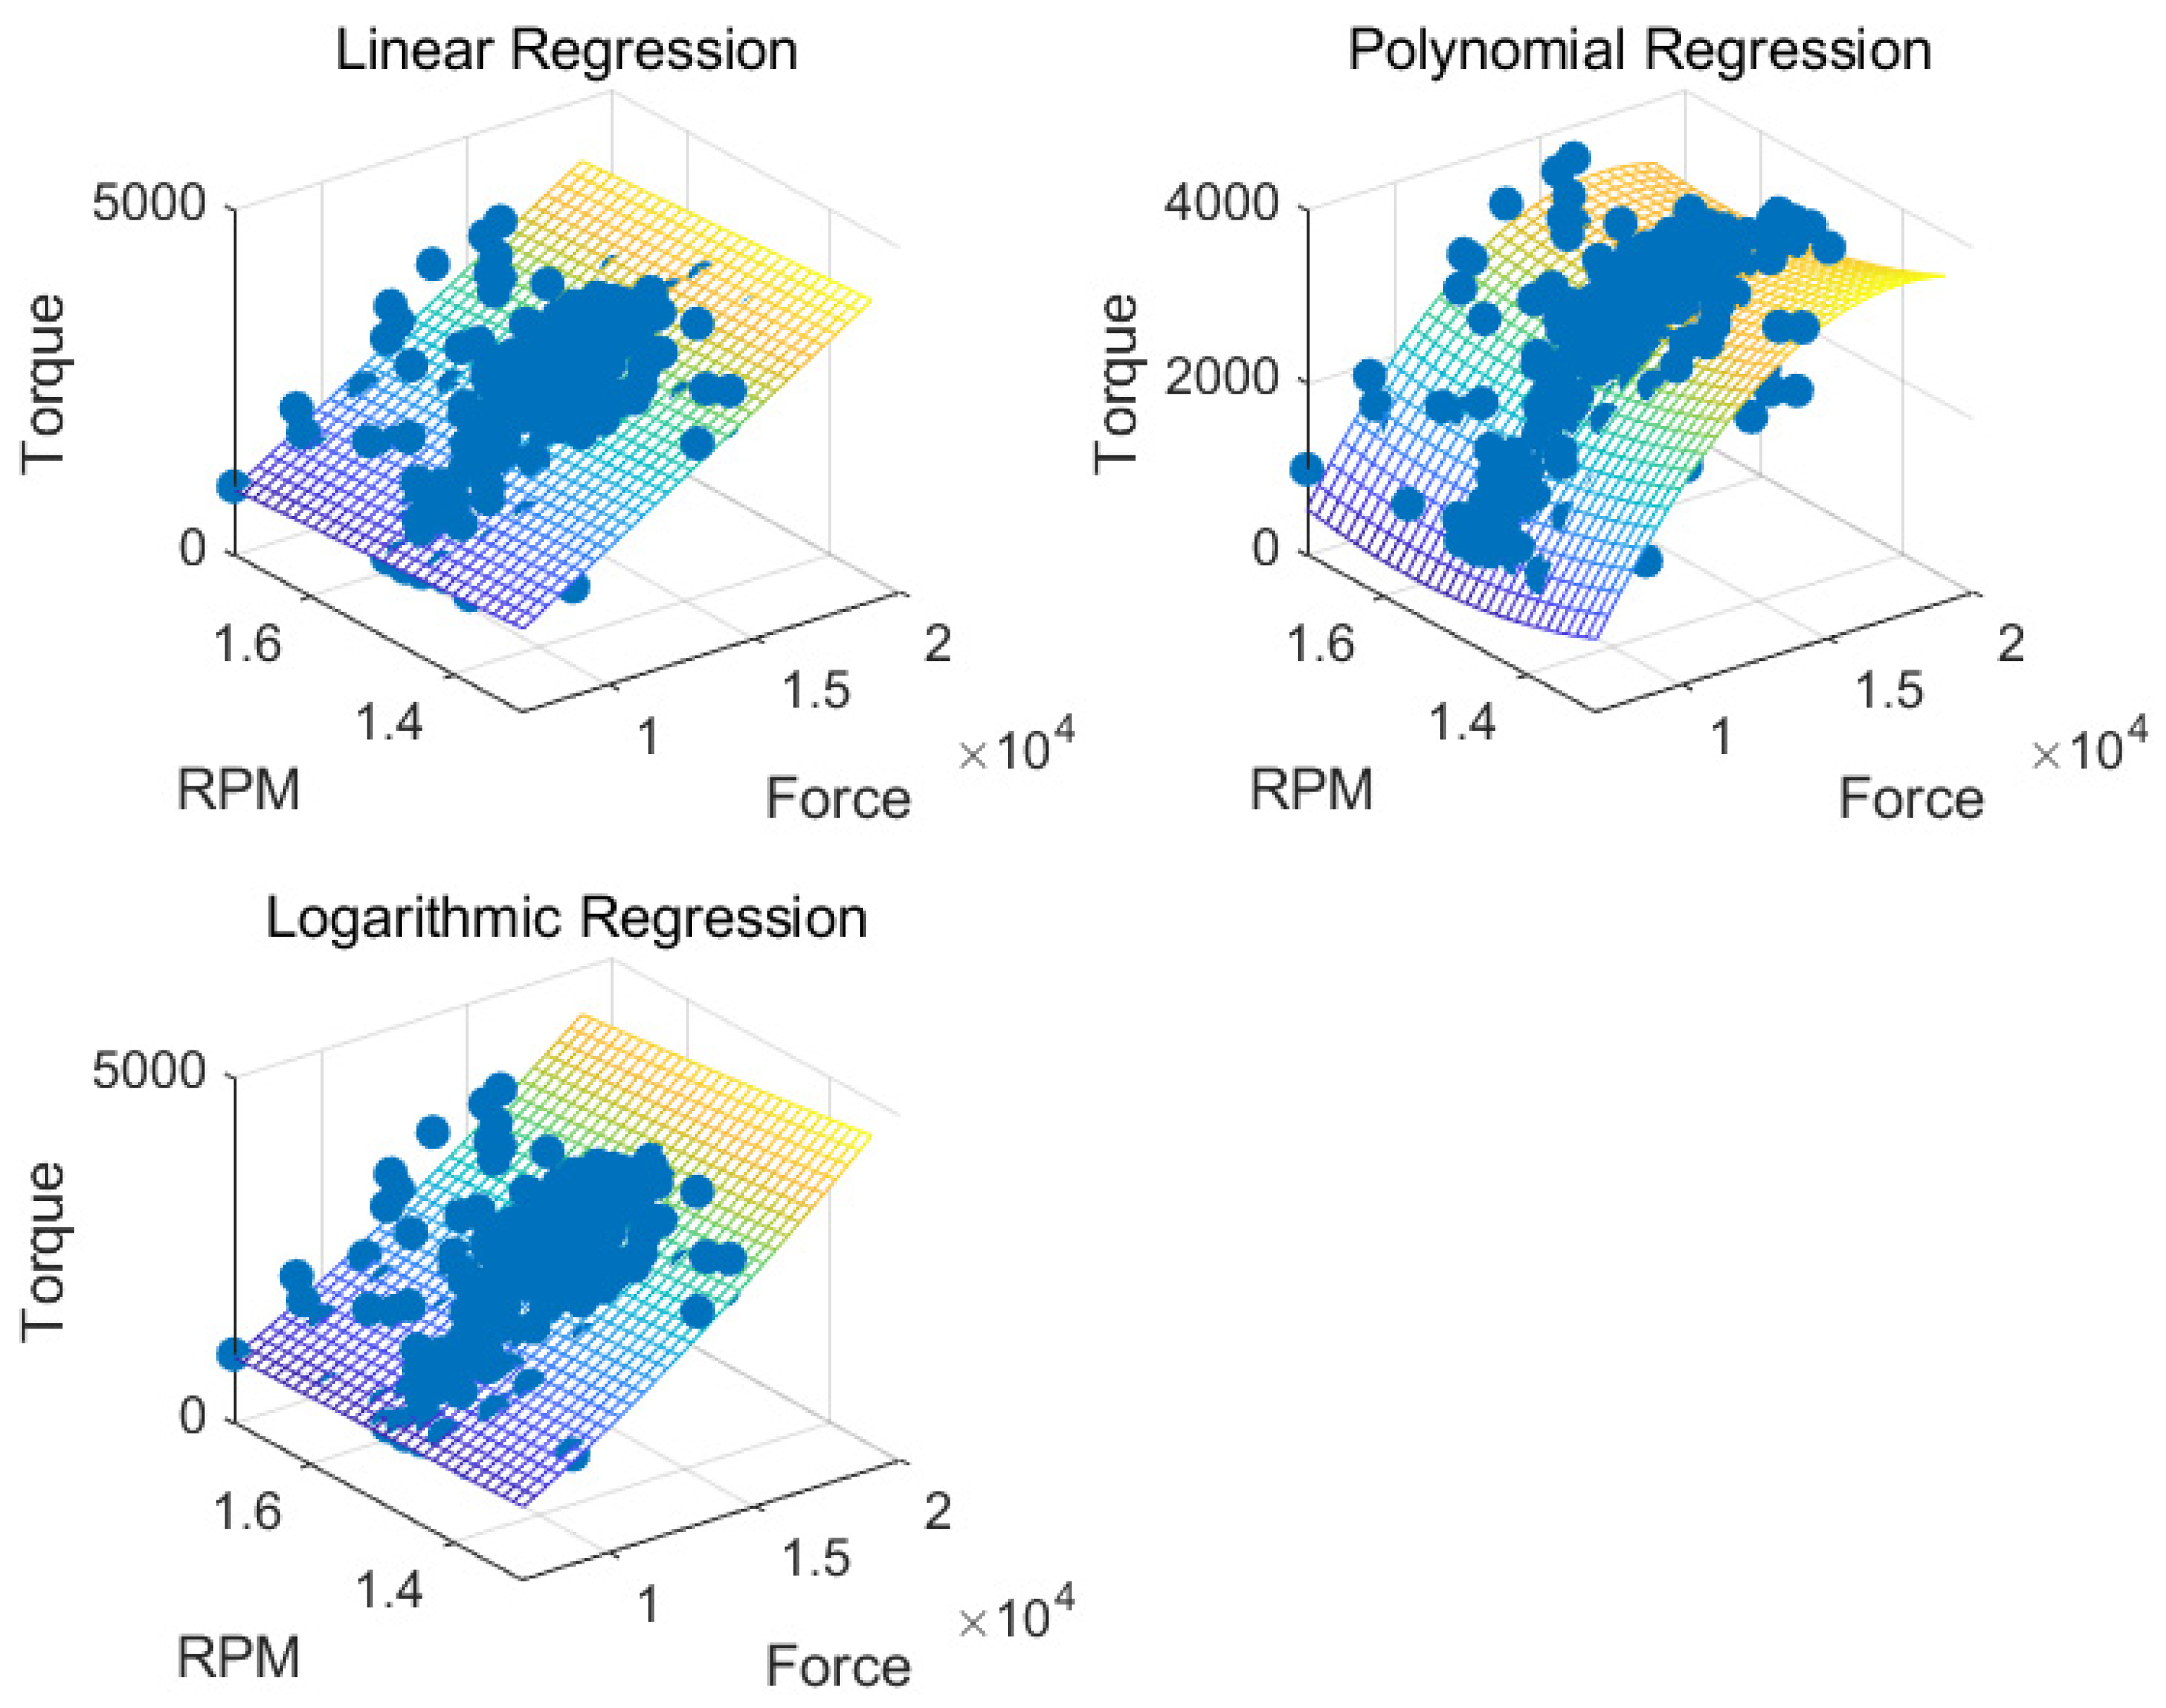
Initially, thrust and cutterhead rotational speed were used to fit thrust speed and torque separately. Figure 11 shows the dual-parameter fitting for thrust speed, with a linear regression goodness of fit of 0.21, polynomial regression goodness of fit of 0.24, and logarithmic regression goodness of fit of 0.20, indicating poor fitting results. In the dual-parameter regression for cutterhead torque (Figure 12), the linear regression goodness of fit was 0.58, polynomial regression goodness of fit was 0.64, and logarithmic regression goodness of fit was 0.61, demonstrating better performance than the fitting for thrust speed. Additionally, the figures illustrate a more significant correlation between torque and thrust.
The higher fitting degree of torque is primarily attributable to the fact that higher thrust typically necessitates the shield machine to overcome greater soil resistance, and a higher rotational speed implies that the cutterhead cuts more soil within a given time frame, both of which contribute to an increase in torque. The relationship between thrust speed and the other two parameters was less pronounced compared to torque. Increases in thrust and rotational speed can reduce the difficulty of breaking hard rock, thereby making the cutting process smoother and enhancing crushing efficiency. However, due to the overall characteristics of the rock layer, the thrust speed may not see significant improvement.
Although the torque regression model performed better than the thrust speed model, the fitting degree remained moderate, indicating that thrust and rotational speed alone do not fully account for these variations. Other contributing factors, such as the density of the overlying soil layer, depth, and the density of the tunneling layer, must also be considered. Consequently, machine learning methods were employed to fit the relationships between these key computational parameters (thrust speed and torque) and other relevant parameters. Out of 368 ring data points, 10 rings from each of Sections A, B, and C (a total of 30 rings) were selected for validation, and the remaining 338 rings were used for training the regression model.
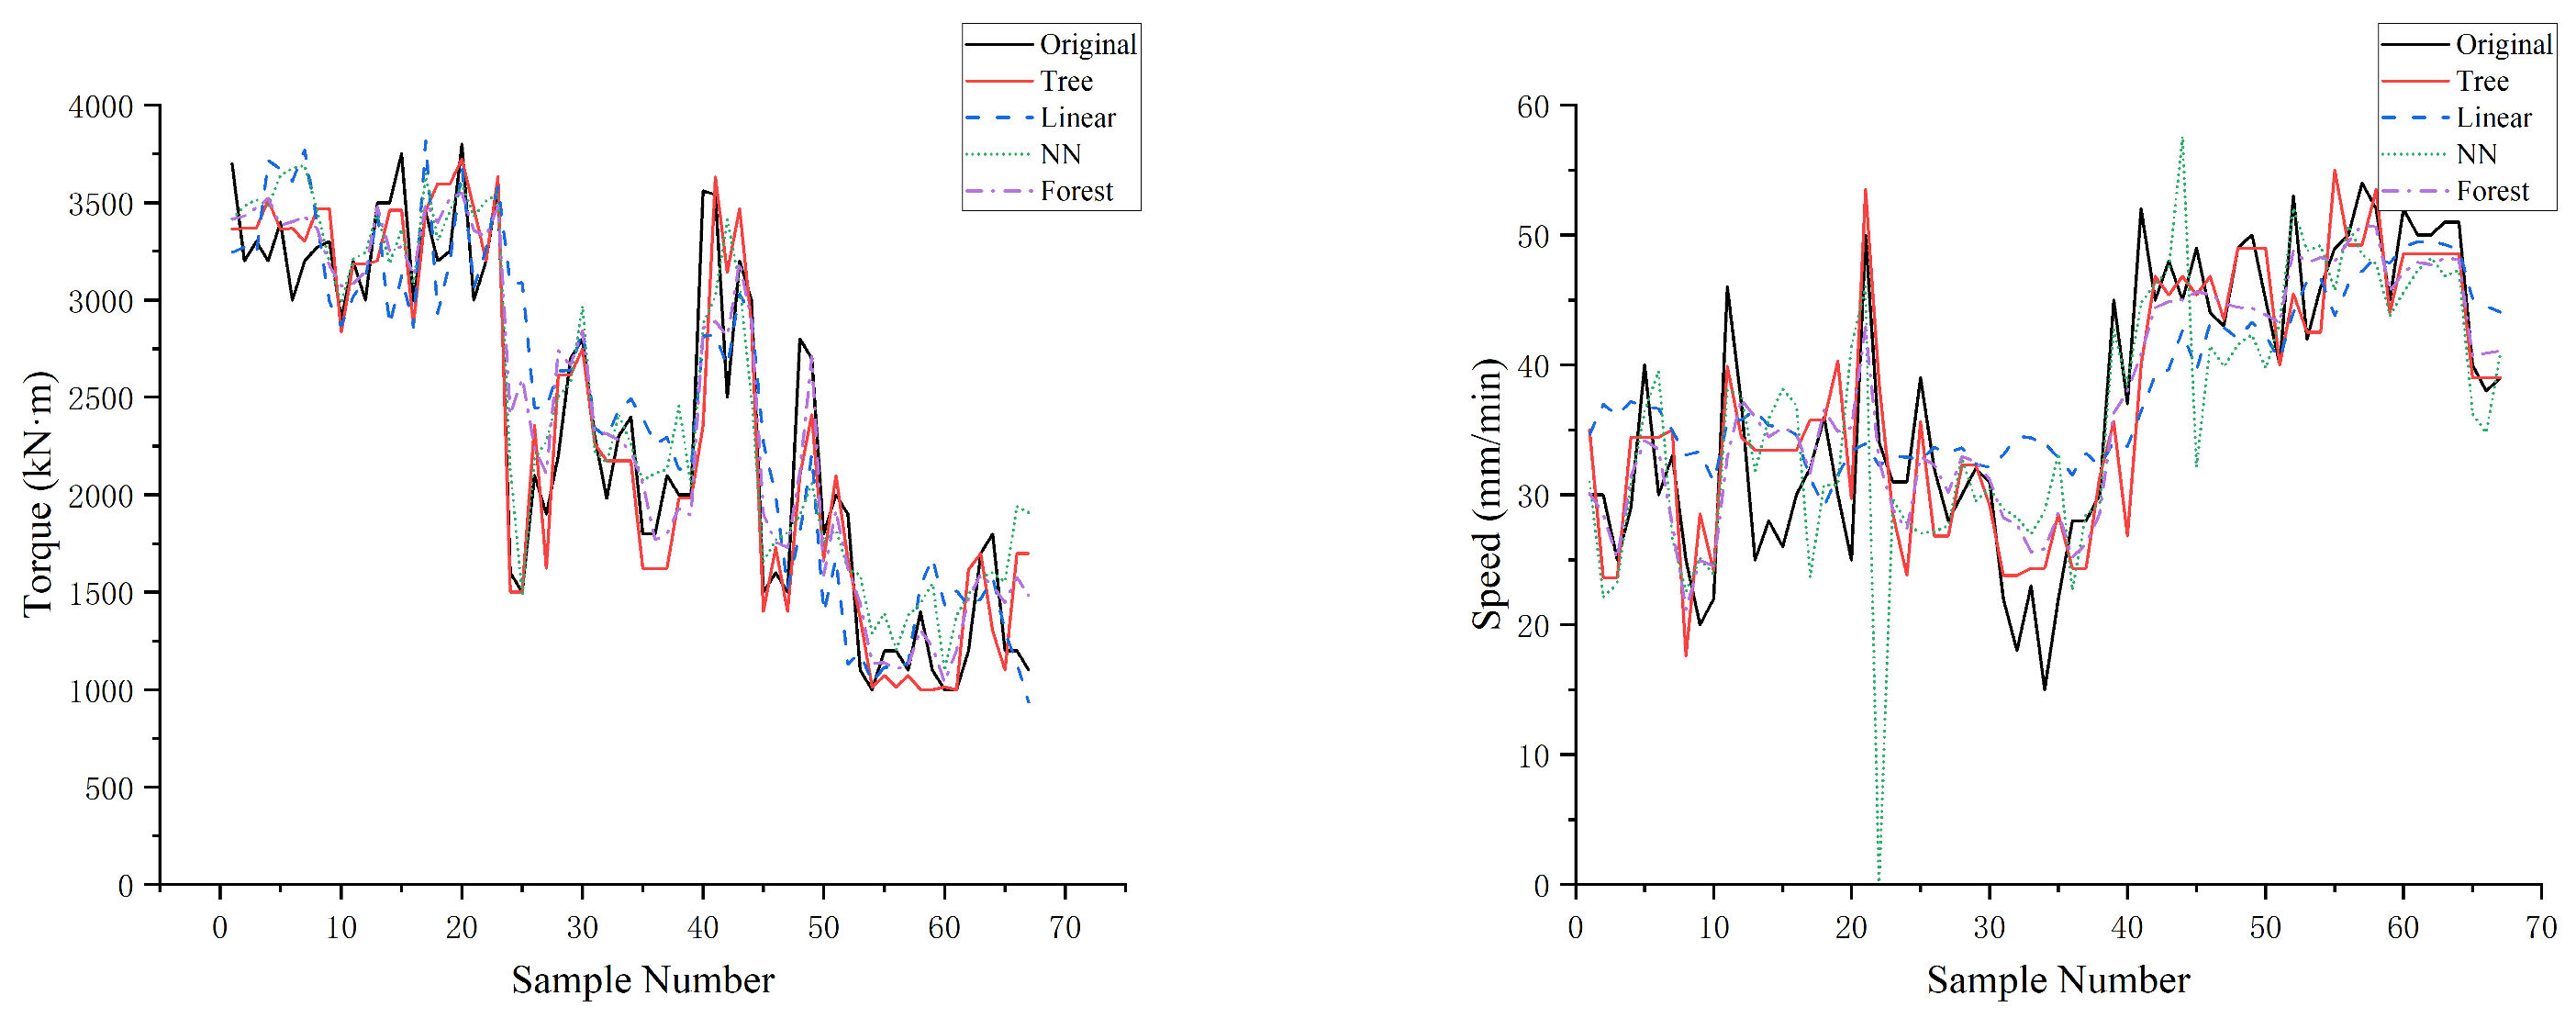
Figure 13 shows the fitting results of different machine learning algorithms for thrust speed and torque. For thrust speed, decision tree regression showed the highest correlation (RMSE = 0.791), followed by random forest (RMSE = 0.786), while neural network regression (RMSE = 0.479) and linear regression (RMSE = 0.358) performed poorly. In the torque regression analysis, decision tree regression had a correlation of 0.875, random forest regression had a correlation of 0.886, neural network regression had an RMSE of 0.837, and linear regression had a correlation of 0.728. Using the high goodness-of-fit decision tree regression model, the thrust speed and torque of the previously selected 30-ring data were predicted and compared with actual engineering data (Figure 14). Although there were some discrepancies between the predicted and actual data, the overall trends were relatively consistent, reflecting the relationships between speed, torque, and other parameters. Therefore, the parameter relationships obtained from decision tree regression were applied to the parameter optimization based on the Pareto optimal solution.
The final optimal tunneling parameters for each section are shown in Table 6. From the table, it can be seen that after considering the constraints among the parameters, the values of the passive parameters, torque and thrust speed, differ from those given by the Pareto optimal algorithm.
To demonstrate the necessity and effectiveness of parameter optimization, the energy consumption and efficiency of shield tunneling were calculated using the optimized parameters. The results are recorded in Table 7, and the comparison of thrust and torque before and after optimization is shown in Figure 15.
The optimization results indicate that the optimization schemes for Section A effectively control power consumption and efficiency. In subsections A-1 and A-2, the tunneling layers consisted of highly weathered slate and moderately weathered slate, with significant differences in the properties of the two soil types, resulting in uneven hardness. Therefore, it is advisable to reduce the relevant parameters to lower the thrust speed, ensuring safe and stable shield tunneling. Subsection A-3 had a single tunneling layer with relatively simple geological conditions. The highly weathered slate was a soft rock with developed joints and fractures, making the rock mass fragmented and conducive to shield tunneling. Adjusting the tunneling parameters might achieve better performance in terms of energy consumption and efficiency.
There were several anomalies in the data. In subsection B-1, the variation in parameters such as depth, overlying soil layer, and tunneling soil layer was minimal, resulting in a relatively low complexity of the construction environment. The optimization data showed a reduction in both energy consumption and efficiency, but the decrease in efficiency was less significant than that in power consumption. This is likely due to the relatively simple and homogeneous geological conditions, leading to a lower environmental complexity, which makes it challenging for the optimization algorithm to significantly improve efficiency without affecting power consumption.
In subsection B-2, both the overlying soil layer and the tunneling soil layer exhibited substantial changes. The tunneling layer was a composite of highly weathered slate and moderately weathered slate. The shield machine encountered significant variation in frictional resistance, making cutterhead cutting difficult. As a result, the optimization showed little change in thrust but an increase in predicted torque. The significant geological changes and composite tunneling layers introduced high variability, making consistent improvements through optimization challenging.
In subsection C-4, fluctuations in the density of the overlying layer led to results similar to those in subsection B-2, with predicted torque being higher, resulting in increased power consumption. However, overall, Section C had a shallower depth, softer tunneling layer lithology, complete weathering, and highly fragmented rocks, which were conducive to shield tunneling. Consequently, the overall power consumption and efficiency were better than those of other sections.
The optimized tunneling parameters demonstrated a certain degree of effectiveness in reducing power consumption and improving tunneling efficiency. Although there was some variability, the overall optimization method proved feasible. Especially when considering the multiple relationships between geological and tunneling parameters, the prediction results were more consistent with the trends observed in the field.

5. Discussion

This study aimed to optimize shield tunneling parameters with a focus on reducing power consumption and increasing efficiency. By applying a multi-objective particle swarm optimization algorithm combined with Pareto optimality principles, significant improvements were achieved. The optimized results, compared to the original scheme, demonstrated a notable reduction in power consumption and an increase in efficiency, validating the feasibility of the optimization approach. The specific conclusions are as follows:
  • The multi-objective particle swarm optimization algorithm combined with Pareto optimality principles was used to optimize the tunneling parameters. By employing the weighted sum method (WSM) to select the optimal solution from Pareto solutions, ideal tunneling power consumption and efficiency values under different geological conditions were successfully obtained. After optimization, Section A’s power consumption decreased by approximately 12%, with a 15% increase in efficiency; Section B’s power consumption decreased by about 10%, with an 8% increase in efficiency; and Section C’s power consumption decreased by about 20%, with an 18% increase in efficiency.
  • It was found that cutterhead torque had a higher correlation with thrust and rotational speed, both of which are actively controllable parameters. Therefore, when rapid torque adjustment is needed, prioritizing thrust adjustment can more effectively control power consumption and efficiency.
  • The parameter values obtained from the Pareto optimal solutions, based on existing data, showed some differences from the predicted values that considered constraints among parameters. These Pareto optimal solutions need to be refined to achieve more accurate evaluations of power consumption and efficiency. Specific adjustment methods include machine learning fitting and re-analysis of parameter relationships.
  • In the context of reducing energy consumption and increasing efficiency, the optimized tunneling parameters showed reductions in thrust and cutterhead rotational speed settings. This adjustment strategy is valuable for subsequent projects, providing a significant reference for parameter decision-making in similar projects.
The optimization method’s unique feature lies in discovering optimization spaces from existing data. In conventional shield tunneling projects, tunneling parameters are set and adjusted mainly considering excavation success and safety during the advance, rarely considering power consumption and efficiency. As a result, tunneling parameters may cover a wide range of energy efficiency, from low to high power consumption and from low to high efficiency, leaving significant space for optimization. After obtaining optimization results, state adjustments can be made during the current normal tunneling process to quickly control energy consumption and efficiency. Predictive parameter adjustments may rely on models based on high-power consumption tunneling states, necessitating future methods to balance efficiency and energy consumption.
Despite the significant results, some limitations remain. First, the constraints among parameters are difficult to quantify with expressions, resulting in the current method’s limited transferability. Second, the amount of data used for fitting was relatively small, with only 368 ring data points, of which 30 were used for validation. This may have led to suboptimal data-fitting relationships. Third, the applicability of the model under specific geological conditions and its complexity still require further research.
All optimization processes are based on data from already successfully excavated sections. The original data ensured excavation safety, and the equipment wear was within normal ranges. Therefore, the optimized data, compared to the pre-optimized data, has almost no impact on the hardware. However, parameter optimization focusing solely on efficiency and energy consumption may unintentionally reduce safety margins. For example, reducing thrust to lower energy consumption could lead to insufficient support against soil pressure, potentially causing face instability. Thus, comprehensive considerations and dynamic adjustments of the parameter settings are necessary in actual engineering practice. Since the project has ended, it is impossible to validate the optimized data in real engineering scenarios, which is also a limitation of this study and a point that needs to be addressed in future research.
Future improvements will focus on data volume and model complexity to enhance optimization effectiveness and transferability:
  • Expand data collection: Collect a larger scale of shield tunneling data and incorporate different geological parameters to ensure the applicability and stability of the optimization method in various environments.
  • Introduce other optimization algorithms: Incorporate other optimization algorithms, such as differential evolution and multi-objective genetic algorithms, and conduct comparative studies to further improve the optimization results.
  • Consider more geological parameters: When performing multi-parameter fitting, account for the impact of more geological parameters to improve fitting accuracy. Transform the influence of geological parameters on tunneling conditions into standardized values to quantify the interrelationships among the parameters, thereby enhancing the transferability of the optimization method.
  • Conduct more field verifications and adjustments: The optimization results need to undergo more field verification and adjustments. Combine the requirements of project management with factors such as mechanical equipment wear to specifically analyze and dynamically adjust the parameters.

Author Contributions

Project administration, W.W.; data curation, J.Q.; investigation, H.F.; writing—original draft, H.S.; resources, Y.L.; writing—review and editing, W.W. and X.Z.; visualization, X.Z. and J.Q. All authors have read and agreed to the published version of the manuscript.

Funding

This research was funded by The Project of State Key Laboratory of Shield Machine and Boring Technology, grant number SKLST-2019-K09.

Institutional Review Board Statement

Not applicable.

Informed Consent Statement

Not applicable.

Data Availability Statement

Data are contained within the article.

Conflicts of Interest

Y.L. was employed by the China Railway Tunnel Group Co., Ltd. The remaining authors declare that the research was conducted in the absence of any commercial or financial relationships that could be construed as a potential conflict of interest.

References

  1. Li, X.; Wu, J.; Guo, Q.; Xiang, Q.; Geng, F. Calculation model of thrust of shield tunneling based on dimensional theory. Chin. J. Undergr. Space Eng. 2022, 18, 573–577. [Google Scholar]
  2. Zhang, Y.K.; Gong, G.F.; Yang, H.Y.; Chen, Y.X.; Chen, G.L. Towards autonomous and optimal excavation of shield machine: A deep reinforcement learning-based approach. J. Zhejiang Univ.-Sci. A 2022, 23, 458–479. [Google Scholar] [CrossRef]
  3. Wu, H.; Chang, J.; Li, G.; Zhang, D.; Huang, H. Prediction of driving posture and optimization of construction parameters for shield based on support vector machine. Tunn. Constr. 2021, 41, 11–18. [Google Scholar]
  4. Zhang, Z.; Pan, Q.; Zhang, W.; Huang, F. Prediction of surface settlements induced by shield tunnelling using physics-informed neural networks. Eng. Mech. 2024, 41, 1–13. [Google Scholar]
  5. Men, Y.; Wang, Y.; Zhou, J.; Liao, S.; Zhang, K. Measurement and analysis on EPB shield machine tunneling efficiency in Jinan composite stratum. China Civ. Eng. J. 2019, 52, 110–119. [Google Scholar]
  6. Lee, H.L.; Song, K.I.; Qi, C.; Kim, J.S.; Kim, K.S. Real-time prediction of operating parameter of TBM during tunneling. Appl. Sci. 2021, 11, 2967. [Google Scholar] [CrossRef]
  7. Cardu, M.; Catanzaro, E.; Farinetti, A.; Martinelli, D.; Todaro, C. Performance analysis of tunnel boring machines for rock excavation. Appl. Sci. 2021, 11, 2794. [Google Scholar] [CrossRef]
  8. Li, X.; Yao, M.; Yuan, J.D.; Wang, Y.J.; Li, P.Y. Deep learning characterization of rock conditions based on tunnel boring machine data. Undergr. Space 2023, 12, 89–101. [Google Scholar] [CrossRef]
  9. Wang, H.; Wang, J.; Zhao, Y.; Xu, H. Tunneling parameters optimization based on multi-objective differential evolution algorithm. Soft Comput. 2021, 25, 3637–3656. [Google Scholar] [CrossRef]
  10. Gokceoglu, C.; Bal, C.; Aladag, C.H. Modeling of tunnel boring machine performance employing random forest algorithm. Geotech. Geol. Eng. 2023, 41, 4205–4231. [Google Scholar] [CrossRef]
  11. Agrawal, A.K.; Murthy VM, S.R.; Chattopadhyaya, S.; Raina, A.K. Prediction of TBM disc cutter wear and penetration rate in tunneling through hard and abrasive rock using multi-layer shallow neural network and response surface methods. Rock Mech. Rock Eng. 2022, 55, 3489–3506. [Google Scholar] [CrossRef]
  12. Vieira, J.T.; Pereira RB, D.; Freitas, S.A.; Lauro, C.H.; Brandão, L.C. Multi-objective robust evolutionary optimization of the boring process of AISI 4130 steel. Int. J. Adv. Manuf. Technol. 2021, 112, 1745–1765. [Google Scholar] [CrossRef]
  13. Guo, W.; Li, N.; Wang, L. Evaluation method of EPB shield excavation performance. J. Tianjin Univ. 2012, 45, 379–385. [Google Scholar]
  14. Luo, H.; Chen, Z.; Gong, G.; Zhao, Y.; Jing, L.; Wang, C. Advance rate of TBM based on field boring data. J. Zhejiang Univ. (Eng. Sci.) 2018, 52, 1566–1574. [Google Scholar]
  15. Gregorutti, B.; Michel, B.; Saint-Pierre, P. Correlation and variable importance in random forests. Stat. Comput. 2017, 27, 659–678. [Google Scholar] [CrossRef]
  16. GB 50307-2012; Code for Geotechnical Investigations of Urban Rail Transit. MOHURD: Beijing, China, 2012.
  17. Ishizaka, A.; Siraj, S. Are multi-criteria decision-making tools useful? An experimental comparative study of three methods. Eur. J. Oper. Res. 2018, 264, 462–471. [Google Scholar] [CrossRef]
  18. Lin, C.; Gao, F.L.; Bai, Y.C. An intelligent sampling approach for metamodel-based multi-objective optimization with guidance of the adaptive weighted-sum method. Struct. Multidiscip. Optim. 2018, 57, 1047–1060. [Google Scholar] [CrossRef]
  19. Xia, X.; Tang, Y.; Wei, B.; Zhang, Y.; Gui, L.; Li, X. Dynamic multi-swarm global particle swarm optimization. Computing 2020, 102, 1587–1626. [Google Scholar] [CrossRef]
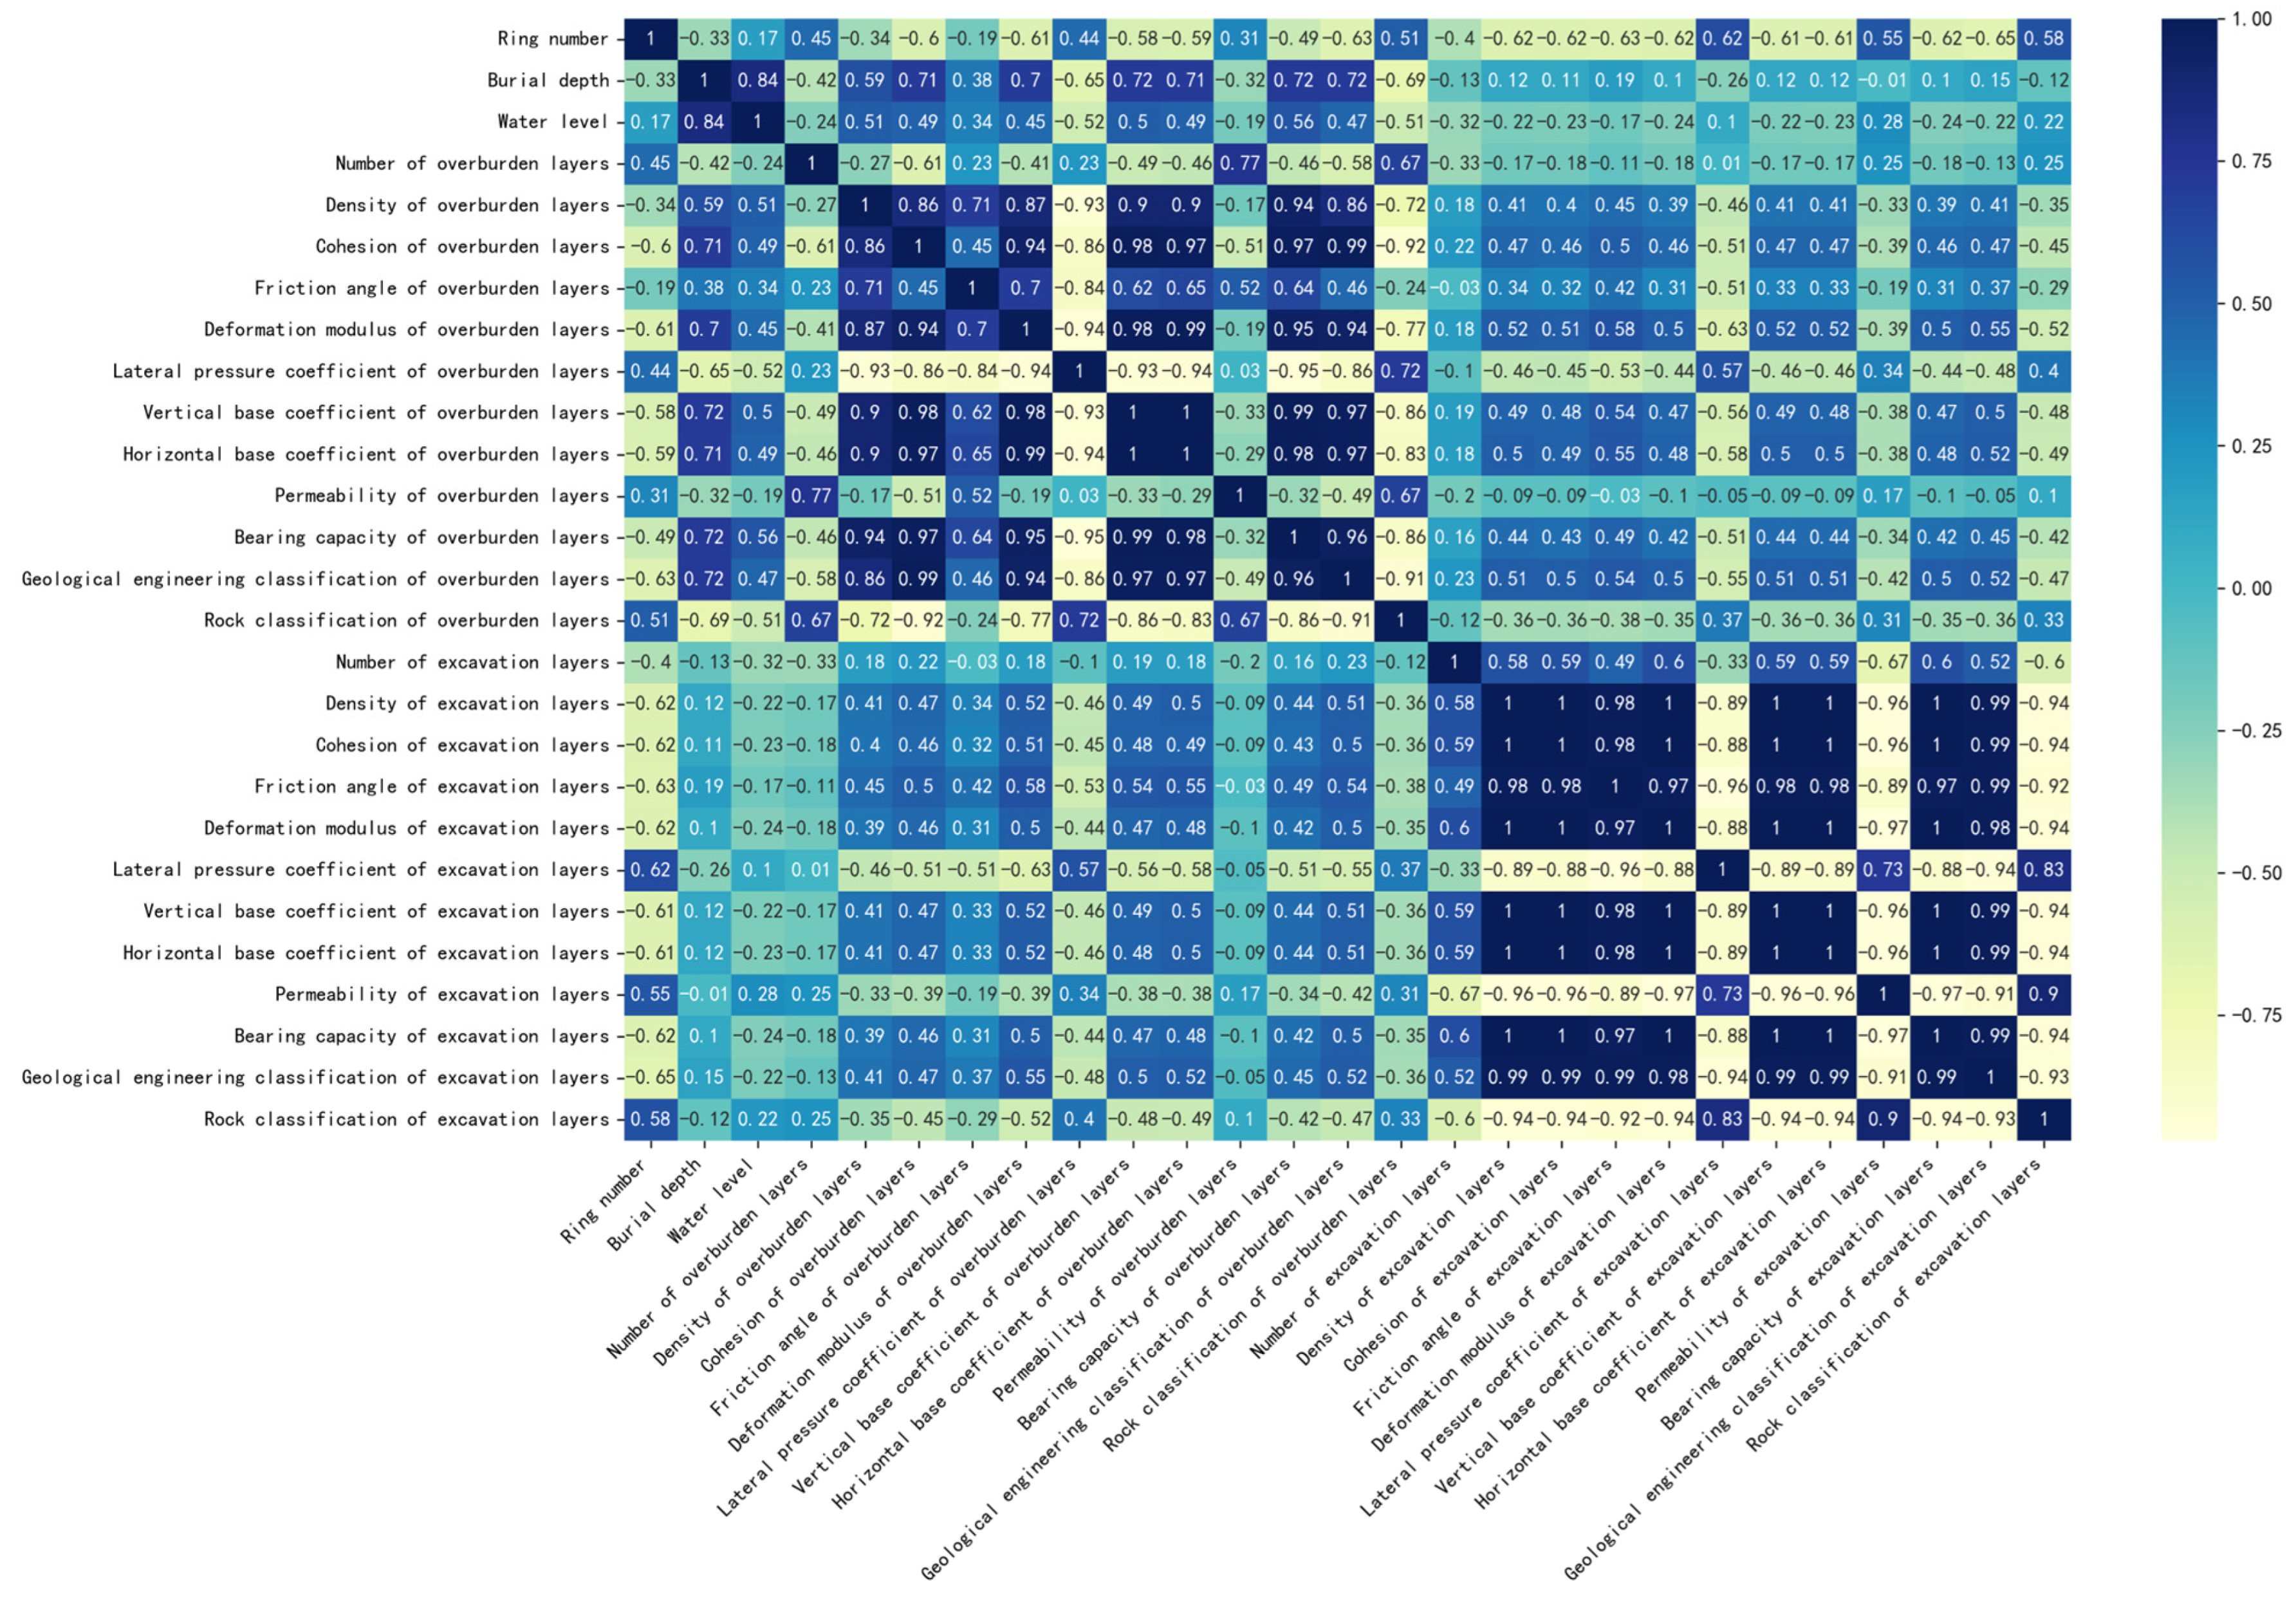
Figure 1. Geological Parameter Correlation Heatmap.
Sustainability 16 06152 g001
Figure 2. Geological Parameters.
Sustainability 16 06152 g002
Figure 3. Power Consumption and Efficiency Variations in Section A.
Sustainability 16 06152 g003
Figure 4. Power Consumption and Efficiency Variations in Section B.
Sustainability 16 06152 g004
Figure 5. Power Consumption and Efficiency Variations in Section C.
Sustainability 16 06152 g005
Figure 6. Schematic Diagram of the Dominant and Non-dominant Solutions.
Sustainability 16 06152 g006
Figure 7. Schematic Diagram of Pareto Optimal Solution.
Sustainability 16 06152 g007
Figure 8. Schematic Diagram of Steps of Multi-objective Particle Swarm Optimization Algorithm.
Sustainability 16 06152 g008
Figure 9. Distribution of Multi-objective Optimization Solutions in Section A. (a) Distribution of Solutions in Section A-1. (b) Distribution of Solutions in Section A-2. (c) Distribution of Solutions in Section A-3.
Sustainability 16 06152 g009
Figure 10. Distribution of Multi-objective Optimization Solutions in Sections B and C. (a) B-1. (b) B-2. (c) C-1. (d) C-2. (e) C-3. (f) C-4.
Sustainability 16 06152 g010
Figure 11. Thrust Speed Dual-Parameter Fitting.
Sustainability 16 06152 g011
Figure 12. Torque Dual-Parameter Fitting.
Sustainability 16 06152 g012
Figure 13. Machine Learning Fitting Results.
Sustainability 16 06152 g013
Figure 14. Comparison of Actual Values and Predicted Values.
Sustainability 16 06152 g014
Figure 15. Comparison Before and After Optimization.
Sustainability 16 06152 g015
Table 1. Section Division.
SectionsSection NumberRing Number RangeOverlying Soil LayerExcavation Soil Layer
A11–47Completely weathered slate
Highly weathered slate
Moderately weathered slate
248–80Plain fill
Completely weathered slate
Highly weathered slate
Moderately weathered slate
381–127Plain fill
Completely weathered slate
Highly weathered slate
B1128–207Plain fill
Silty clay
Completely weathered slate
Highly weathered slate
2208–247Plain fill
Completely weathered slate
Highly weathered slate
Moderately weathered slate
C1248–267Plain fill
Silty clay
Completely weathered slate
Highly weathered slate
2268–307Silty clay
Completely weathered slate
Highly weathered slate
3308–327Silty clay
Completely weathered slate
Highly weathered slate
4328–368Plain fill
Silty clay
Boulders
Completely weathered slate
Highly weathered slate
Table 2. Tunneling Parameters for Each Section.
SectionThrust Force
(kN)
Torque
(kN·m)
Rotation Speed
(r/min)
Thrust Speed
(mm/min)
A-114,58733901.5128.57
A-213,71033281.4934.67
A-315,16234121.4841.38
B-112,52922591.5129.15
B-211,53526741.4841.35
C-111,15022541.5144.80
C-2890514701.4949.10
C-3847511751.5247.65
C-410,37614241.5141.00
Table 3. Parameters of Multi-objective Particle Swarm Optimization Algorithm.
Parameter NameParameter Value
Initial population number50
Maximum number of iterations200
Learning Factor c12
Learning Factor c22
Initial value of inertia weight0.9
Inertial weight end value0.4
Pareto solution set size50
Table 4. Pareto Optimal Parameter Values for Section A.
SectionThrust Force
(kN)
Torque
(kN·m)
Rotation Speed
(r/min)
Thrust Speed
(mm/min)
A-113,00030001.4128.25
A-212,00027001.3922.10
A-311,50029001.3838.23
Table 5. Pareto Optimal Parameter Values for Sections B and C.
SectionThrust Force
(kN)
Torque
(kN·m)
Rotation Speed
(r/min)
Thrust Speed
(mm/min)
B-1900011001.4128.84
B-211,00014001.4036.37
C-110,00011001.4240.16
C-2900010001.4342.80
C-3800010001.4141.16
C-4900012001.4538.56
Table 6. Optimal Tunneling Parameters for Each Section.
SectionThrust Force
(kN)
Torque
(kN·m)
Rotation Speed
(r/min)
Thrust Speed
(mm/min)
A-113,00031861.4134.43
A-212,00031861.3933.43
A-311,50034631.3846.25
B-1900012501.4120.00
B-211,00028751.4040.00
C-110,00017291.4249.00
C-2900010001.4353.50
C-3800010711.4148.56
C-4900017001.4541.83
Table 7. Comparison of Power Consumption and Efficiency Before and After Optimization.
SectionTotal Power Consumption (kW)Tunneling Efficiency (mm/r)
OriginalOptimizedOriginalOptimized
A-1542.8477.618.924.4
A-2530.5470.223.124.1
A-3542.6509.127.833.5
B-1363.0187.519.314.2
B-2422.2428.627.928.6
C-1364.6265.129.734.5
C-2236.5157.733.037.4
C-3192.4164.531.634.4
C-4232.2264.327.228.8
Disclaimer/Publisher’s Note: The statements, opinions and data contained in all publications are solely those of the individual author(s) and contributor(s) and not of MDPI and/or the editor(s). MDPI and/or the editor(s) disclaim responsibility for any injury to people or property resulting from any ideas, methods, instructions or products referred to in the content.