Article

Construction and Optimization of Urban and Rural Ecological Security Patterns Based on Ecological Service Importance in a Semi-Arid Region: A Case Study of Lanzhou City

School of Architecture and Urban Planning, Lanzhou Jiaotong University, Lanzhou 730000, China
*
Author to whom correspondence should be addressed.
Sustainability 2024, 16(14), 6177; https://doi.org/10.3390/su16146177
Submission received: 17 May 2024 / Revised: 11 July 2024 / Accepted: 15 July 2024 / Published: 19 July 2024

Abstract

:
The construction of ecological security patterns has become a crucial approach to assessing ecosystem health and integrity and is essential for achieving sustainable and high-quality development in both urban and rural areas. Using Lanzhou City as an example, our study employed the InVEST model, ecological service importance evaluation, and hotspot analysis to classify ecological sources. Additionally, ecological corridors were identified and optimized using the least resistance model and circuit theory. The identified corridor pattern was further analyzed using space syntax and neural networks to determine the influences of various factors. This framework can be applied to the circular construction of corridors. Our findings revealed a three-stage differentiation trend in the importance of ecosystem services. Ecological source areas and corridors were densely distributed in the northwest of Lanzhou. The optimized ecological source area increased from 2914.1 km2 to 4542.5 km2, raising its proportion in the study area from 22.2% to 34.7%. The total number of corridors after optimization was 217, spanning a 2657.3 km length. The Gaolan Mountain area had the highest current density, whereas the ecological barrier area was mainly distributed in the northwest of Yongdeng County and the north of Yuzhong County. The spatial syntax index indicated significant potential reachability between the Honggu area and the northwest area. Finally, using neural network perceptrons to simulate ecosystem service functions, our findings revealed that habitat quality showed the best fit under single-dependent-variable prediction, followed by water yield, with soil conservation showing a poor fit. Under three-dependent-variable prediction conditions, population factors had the greatest impact on ecosystem services, while slope had the least impact. Therefore, it is important to promote the construction of green infrastructure in the northwest and southeast, improve the connectivity of ecological corridors in Honggu District, and adopt corresponding spatial corridor optimization strategies according to different ecological needs. Collectively, our findings provide a theoretical and practical basis for the construction and optimization of urban and rural ecological security patterns in the semi-arid region of Lanzhou.

1. Introduction

The recent rise in worldwide temperatures due to global warming has severely impacted people’s productivity, their daily lives, and even their physical and mental health [1]. The ecological security pattern (ESP) is an important indicator of the health and integrity of ecosystems [2], playing a crucial role in achieving sustainable and high-quality urban development and improving human wellbeing. At their core, ecological security strategies seek to optimize ecosystem patterns to ensure the sustainable development of human society [3]. Rapid urbanization increases the urbanized land area and reduces natural space, leading to a decline in ecosystem service functions such as carbon storage, habitat quality, and soil erosion control [4,5]. Human activities are among the main factors affecting the ecological risks in regional landscapes. According to the Intergovernmental Science-Policy Platform on Biodiversity and Ecosystem Services (IPBES), the benefits that humans derive from ecosystems tend to decrease as urbanization accelerates [6], resulting in an increasing risk related to the supply and demand of ecosystem services in many regions [7].
Changes in landscape morphology and urban connectivity alter the structure and function of ecosystems, affecting regional ecological security [8]. Recently, territorial spatial governance has shifted from managing individual ecosystems to the integrated management of regional ecosystems [9]. Developing and managing ecological security patterns can provide scientific guidance for large-scale land spatial planning [10,11], reducing the fragmentation of ecologically important land and habitats caused by the disorderly expansion of urban areas. Constructing an ecological security pattern effectively maintains the integrity of ecosystem structures and processes, ensuring environmental control and sustainable protection of the ecology of mountains, rivers, forests, fields, lakes, and grasslands [12].
The regional ecological security pattern primarily focuses on patch stability and landscape connectivity in ecological source areas [10]. Urban and rural construction relies on selecting ecological sources, developing resistance surfaces, and identifying corridors. The minimum cumulative resistance (MCR) method reflects the potential channels of species migration, intuitively showing the integrity and systematic characteristics of the ecosystem [13]. MCR provides a suitable means for constructing urban and rural regional ecological security patterns. However, MCR does not account for ecological dynamics during the actual construction process, highlighting the need for optimization through integration with other theories. Currently, research related to the ecological security pattern mainly focuses on county and city administrative spaces or watershed scales [14]. However, the scale of spatial ecological restoration has steadily evolved from improving local ecosystem health to shaping multi-scale ecological security patterns [12]. Research on ecological security patterns from the perspective of rural–urban integration can address issues that cannot be resolved at the urban scale [15], reducing the impact of administrative boundaries on the continuity of natural ecosystem sources and corridors.
The existing research on urban and rural areas has largely focused on the ecological carrying capacity of these areas [16] or the correlation between urbanization and ecosystem services [4]. System dynamics models can be used to simulate the spatial changes in ecology–production–living space under different development scenarios in urban and rural areas. Moreover, an evaluation system for water ecological security in urban and rural areas can be established using the pressure–state–response (PSR) framework [17]. Nevertheless, although recent research on ecological security patterns has provided important scientific guidance for regional landscape pattern optimization and large-scale urban planning [18], few studies have explored landscape pattern optimization and protection measures in semi-arid urban and rural areas. The Yellow River in Lanzhou and other river basins in the region contribute greatly to the conservation of biodiversity and water resources, offering significant ecosystem service value. However, the coordination between urbanization and the environment in this region is low, and the area faces serious environmental problems, such as water shortages and air pollution. Therefore, there is an urgent need for detailed scientific research on conservation measures tailored to the characteristics and challenges of the city’s development.
At present, the relevant studies are mainly concentrated in developed areas, and there is a lack of ecological corridor optimization studies in semi-arid areas of Northwest China. Regarding ecological source identification, how to choose the representative index has become a difficult problem. In terms of source extraction and ecological corridor optimization construction, a variety of methods are generally used based on experience. Regarding spatial network analysis, ecological network construction lacks spatial traffic flow analysis, and a combination of network analysis and space syntax can solve this problem to some extent. As for the construction of the optimized ecological network, most of the existing published papers use analyses in combination with ecological protection or development planning, and the question of how to dynamically integrate ecological planning and implementation still represents a difficult problem. Therefore, it is representative and typical to study the optimization of an ecological corridor in Lanzhou City, which is located in the semi-arid area of Northwest China. In summary, this study sought to construct and optimize urban and rural ecological security patterns, taking Lanzhou as an example. To this end, we identified the ecological source by analyzing the importance of ecosystem services, establishing the resistance surface using relevant impact factors, and defining the ecological corridor based on the MCR model. Furthermore, our study innovatively couples hotspot analysis with circuit theory and optimizes key impact factors using neural network analysis, thus establishing a novel framework for corridor construction. This study expands the theory of ecological security pattern construction and is significant in the restoration of key urban ecosystems, establishing a clear and stable human–nature coupling system for ecology–production–living space and ensuring the sustainable development of various regions. Collectively, the findings of this study provide crucial information and a valuable basis for urban planning and policy formulation.

2. Materials and Methods

2.1. Overview of the Research Area

Lanzhou is the capital city of Gansu Province, comprising 5 districts and 3 counties and covering an area of 13,100 km2. By the end of 2022, Lanzhou’s resident population had reached 4,415,300. This city is located in the center of Gansu Province (102°36′–104°35′ E, 35°34′–37°00′ N), bordering Wuwei City, Yinbai City, Dingxi City, and the Linxia Hui Autonomous Prefecture. The central and western regions of Lanzhou are relatively flat, whereas the northeast exhibits a relatively steep geomorphology. The Yellow River passes through the southwest and eventually flows to the northeast, contributing to a warm continental climate. The city covers a total area of 13,100 km2, with an urban area of 2031.8 km2. The altitude in the study area ranges from 1398 to 3681 m. The predominant land use type is grassland, and the main urban areas are distributed in a belt along the river (Figure 1). Due to its geographical location, Lanzhou faces serious ecological and urban renewal challenges.

2.2. Data Sources

The administrative division and NDVI data were obtained from the Resources and Environmental Science and Data Center of the Chinese Academy of Sciences. DEM data were acquired from NASA, and the land use data based on Landsat image interpretation were provided by Professor Huang Xin’s team at Wuhan University. Data on the distribution of soil organic matter in China were sourced from the Spatial and Temporal Three-Level Environmental Big Data Platform. China’s soil dataset, monthly potential evapotranspiration, precipitation, and soil erosion factor K data were obtained from the National Tibetan Plateau Scientific Data Center. Population grid data were derived from WorldPop, whereas GDP data were obtained from the literature (Table 1).

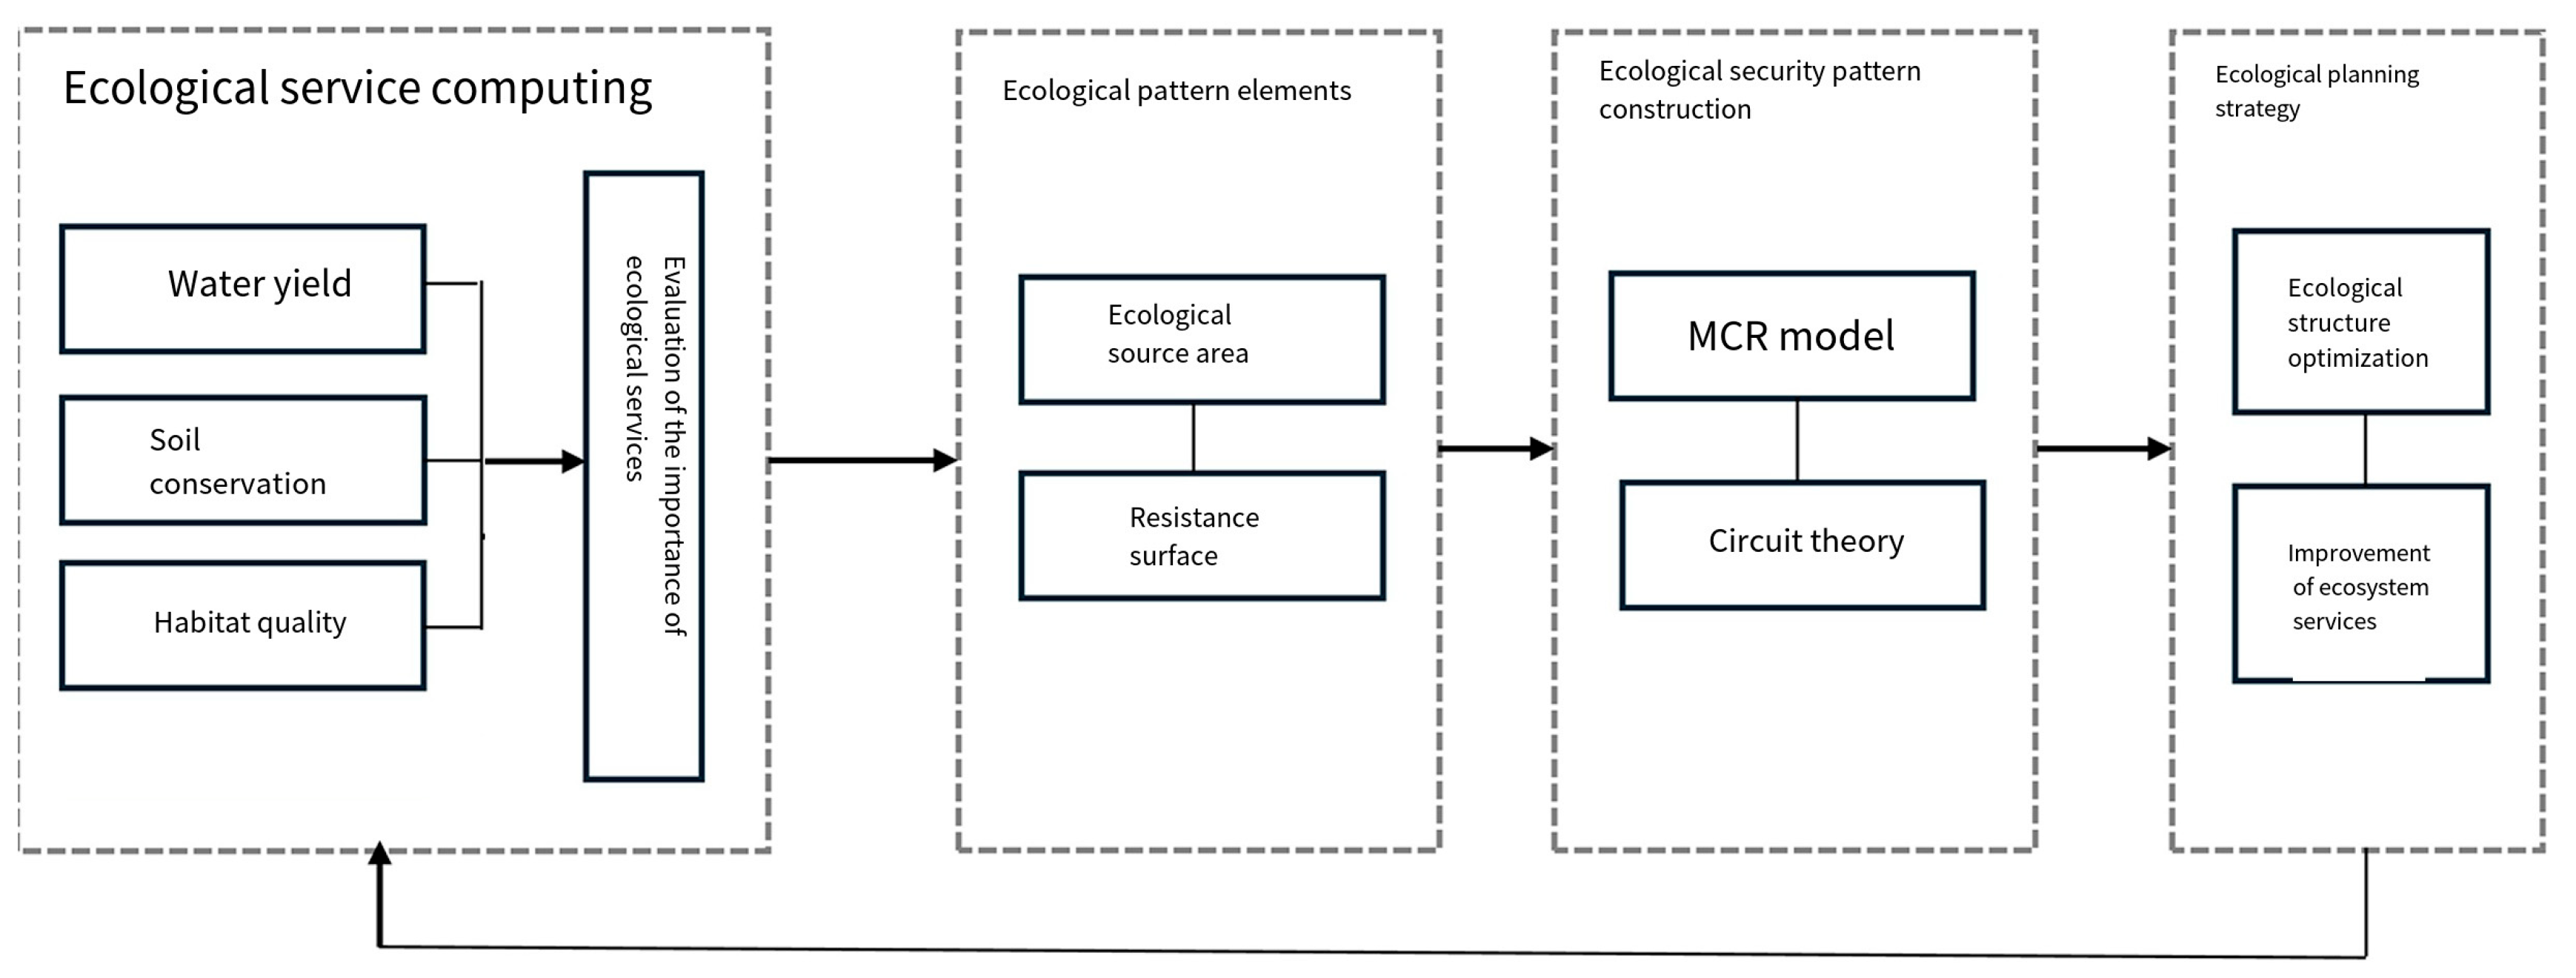
2.3. Research Framework

By identifying the importance of regional ecosystem services in urban and rural areas, highly important areas providing ecosystem services were designated as regional ecological service sources based on hotspot analysis, and assessments were conducted based on the size of the ecological source areas in each region. Additionally, a minimum resistance model was established to identify the ecological corridor in this region, which was then optimized using circuit theory to obtain the ecological security pattern for urban and rural areas. Based on this security pattern, the importance of the influencing factors was analyzed using a neural network. The resistance surface impact factors were then adjusted (either supplemented, reduced, or corrected) based on different needs, thereby establishing the ecological security pattern for different scenarios in a cycle. The establishment of an ecological security pattern on the scale of urban and rural areas can guide the optimization of ecological–production–living space and the governance of the mountain–river–forest–field–lake–grassland system in the study area. This approach provides key insights into the importance of ecosystem service functions and ecological functions, thus enabling their management (Figure 2).

2.4. Research Methods

An ecological source area is defined as the main habitat for species survival and dispersion and forms the foundation for developing an ecological security pattern [11]. Some studies have directly identified the core areas of nature reserves or forest parks as the source areas of ecological security [19]. Gansu is a highly biodiverse area, whereas Lanzhou is an ecologically fragile region. Soil and water conservation, along with biodiversity protection, are the most crucial ecosystem service functions in this area. We assume that water production and soil and water conservation can represent ecological support and supply services in Lanzhou, which is located in the semi-arid region of Northwest China. Habitat quality directly affects the biological flow in Lanzhou, which is an important biological migration transition area in Northwest China. Therefore, water yield, soil and water conservation, and habitat quality can represent the service functions of Lanzhou. Based on the InVEST model, three indices were selected to evaluate the importance of ecosystem services: water yield, soil conservation, and habitat quality. This model effectively assesses ecological service functions. The three aforementioned factors were analyzed according to their spatial overlap based on geographic information system (GIS) data. Using the quantile grading method, these three factors were divided into four grades: not important, moderately important, more important, and important. The detailed calculation process is described in the sections below.

2.4.1. Water Yield

The water production module in the InVEST model is based on the Budyko coupled hydrothermal balance principle [20], which incorporates the influence of spatial differences, such as soil permeability and the evapotranspiration of different land use types, on runoff. This module constructs a suitable model and quantitatively estimates water supply capacity in grid units [21] using the following formula:
Y x i = 1 A E T X I P X × P x
where Yxi is the annual water yield on grid x when the land use type is i (mm); Px is the average annual precipitation of grid x (mm); and AETxi is the actual annual mean evapotranspiration (mm).
A E T x i P x = 1 + P E T x i P x 1 + P E T x i P x W x 1 W x
P E T x i = K c l i × E T o x
W x = Z A W C x P x + 1.25
In Equations (2)–(4), PETxi is the annual mean potential evapotranspiration (mm) on grid x when the land use type is i; Wx is the non-physical parameter of soil properties in natural climate; AWCx is the effective soil moisture content of grid x (mm); and Z is the tensor coefficient, a seasonal constant with values ranging from 1 to 30. By analyzing data from hydrology stations and the related literature [22] in the study area, this study continuously adjusts the tensor coefficient to achieve the optimal evaluation result. This optimal evaluation result represents one of the basic conditions for evaluating ecological importance.

2.4.2. Soil Conservation

In the InVEST model, soil conservation is calculated by subtracting the potential soil erosion under natural vegetation protection (RKLS) from the actual soil erosion under artificial management and conservation measures (USLE). This is represented in Formula (5) below.
S C = R K L S U S L E
R K L S = R × K × L S
U S L E = R × K × L S × C × P
In Equations (6) and (7), R represents the rainfall erosivity, calculated using the monthly calculation formula [23], K is the soil erodibility factor, calculated using the EPIC model and corrected using established correction methods [24,25], LS is the slope length gradient factor, C is the mulch-management factor, which is the ratio of soil loss in continuously lightly tilled vegetation land or a management field to that in recreational land under the same environmental conditions [26], and P is the soil conservation measure factor, which is the ratio of soil loss in slope-cultivated land with soil and water conservation measures to that without any measures under the same environmental conditions [27,28].

2.4.3. Habitat Quality

This module of the InVEST model mainly determines the habitat quality distribution and degradation distribution in the study area by considering the sensitivity of different land types to each threat source and habitat threat density data and assesses biodiversity based on the habitat quality level, as follows:
Q x j = H j ( 1 D x j z D x j z + K z )
In Formula (8), Qxj represents the habitat quality score of grid x in land use type j; Hj is the habitat suitability; K is the semi-satiety parameter. This study is based on the InVEST model manual, which provides a key basis for assessing ecological importance, in addition to setting threat factors and sensitivities according to relevant references [29,30].

2.4.4. Construction of Ecological Source Area and Resistance Surface

Based on the results of the InVEST evaluation and the analytic hierarchy process, we assessed the importance and resistance surface of ecological services. The ecological source area was extracted using hotspot analysis. The process is described in the equations below:
G i * = j = 1 n W i , j X j X ¯ j = 1 n W i , j s n j = 1 n W i , j 2 j = 1 n W i , j 2 n 1
X ¯ = j = 1 n X j n
S = j = 1 n X j 2 n X ¯ 2
In Equations (9)–(11), i represents the central element, j denotes all the elements in the neighborhood, Xj represents the attribute value of the JTH element in the neighborhood, wi and j represent the spatial distance between the elements i and j, and n is the total number of elements in the neighborhood.

2.4.5. MCR Minimum Resistance Surface Model

Using the MCR model, the minimum cost distance between two ecological source points was calculated to gauge the minimum resistance value of the flow and ecological diffusion for various landscape elements during outward expansion. This process aids in determining the connectivity and accessibility between source points [31]. ArcGIS was employed to build the minimum cost path, and Equation (12) was utilized to derive the minimum cumulative resistance models for different ecological corridors:
M C R = f j = n i = m D i j × R i
where MCR is the minimum resistance value, Dij is the spatial distance of species from source to landscape unit, Ri is the ecological impedance coefficient of landscape unit I, and f is the positive correlation between the minimum cumulative resistance and ecological processes.

2.4.6. Circuit Theory

An ecological corridor is a linear space that connects important ecological patches, serving as the primary channel for biological migration [32]. Our study employed circuit theory to identify ecological corridors [33]. In this theory, species are likened to electrons, the landscape is likened to a conductance plane, and landscape types more conducive to species diffusion are assigned lower resistance values. This model helps address the limitations of studying ecological flow within corridors compared to the MCR model. The formula is as follows:
I = V / R e f f
where I represents the current, V represents the voltage, and Reff is the resistance of one or more conductors. As the number of circuit paths increases and the corresponding current rises, Reff in a parallel circuit decreases, serving as an indicator of spatial isolation between ecological source areas. A higher value for I correlates with a greater probability of species or gene migration [34]. The corridor’s boundary can be established by calculating the cumulative resistance threshold between the two ecological sources [32]. Utilizing the obstacle point area and pinch point area obtained from circuit theory, an optimal ecological pattern area can be determined.

2.4.7. Space Syntax

Space syntax can be utilized to analyze and validate network indicators based on corridor identification. Corridors fundamentally serve a traffic function, and the centrality index of the traffic network is a crucial variable. This network index relies on proximity to the center (MED) [35], which is the reciprocal of the space syntax integration. This is described in the following equation:
C n r a = k 1 a b d a b
where dab represents the number of pedestrian traffic links from a to b, and b < r is the threshold radius, which is a subset of the network diameter n; k represents the total number of starting points in the range of r. This metric is essentially the inverse of the average number of networked connections from the beginning of a to all starting points within a specified radius, r. Therefore, the higher the value, the closer that starting point is to the average distance of all starting points within radius r, and the degree of proximity to the center is also considered an unweighted indicator of reachability under network design conditions.
The index of our corridor network is based on intermediate centrality (BTE) [35] (i.e., space syntax choice), which is expressed as follows:
B 0 r = p q I p q o
where, if a road connection o is on the shortest path within the radius r connecting p and q, then, I p q o = 1. Thus, B 0 r calculates the total number of these shortest paths, also known as geodesic.

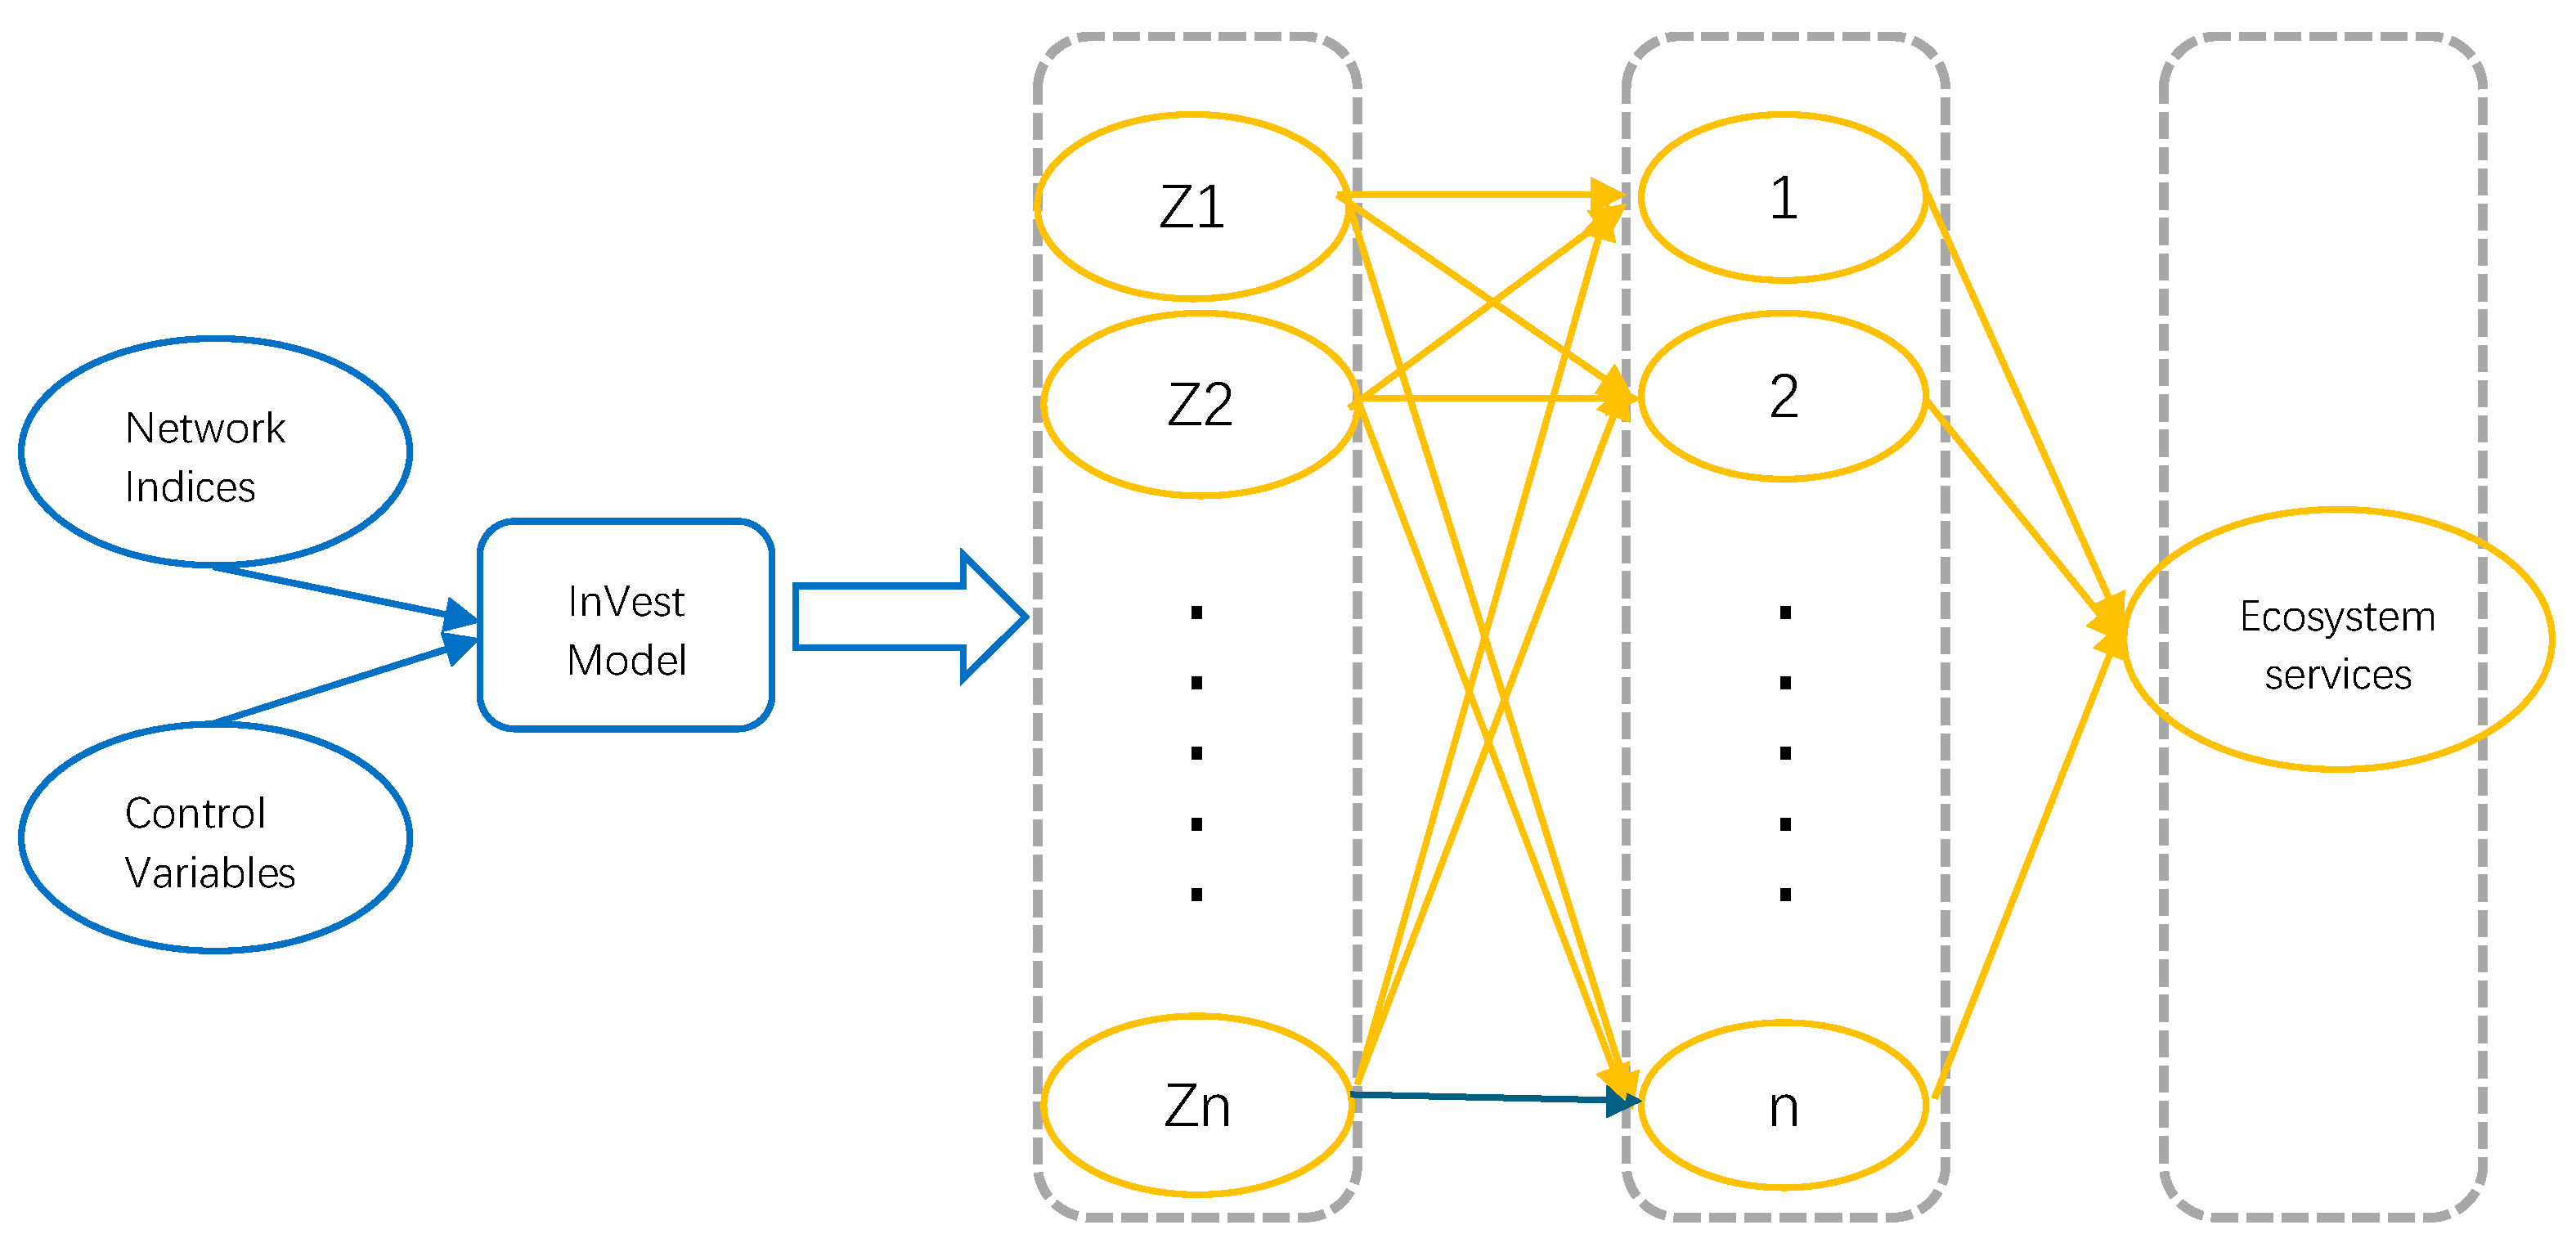
2.4.8. Artificial Neural Network (ANN)

To address the limitations of linear research and data constraints, our study employed artificial neural network (ANN) analysis. Unlike methods that consider only continuous past data, ANN can capture the effects of nonlinear changes. The ANN framework comprises three layers: the input layer, the hidden layer, and the output layer. The factors influencing ecosystem service functioning are denoted by Z = (Z1, Z2, ..., Zm). Specifically, the entire ecosystem service forecasting process adheres to the following functional form,
E S = G n w n × F n m w n m × Z m
where ES represents the simulation of the ecosystem service, and the output representation provides the weight to the m-th input node, which is used to compute the n-th hidden node. In the equation, w n m m w n m × Z m is the weighted sum of all the information for the N-th hidden node in the input layer. Once again, w n denotes the weight assigned to the N-th hidden node. The functions G(*) and (*) are activation functions of the output node and the N-th hidden node, respectively. ANN demonstrates good performance, F n , when the activation functions are consistent throughout the process [36], as analyzed based on the hyperbolic tangent function in this paper (Figure 3).

3. Results

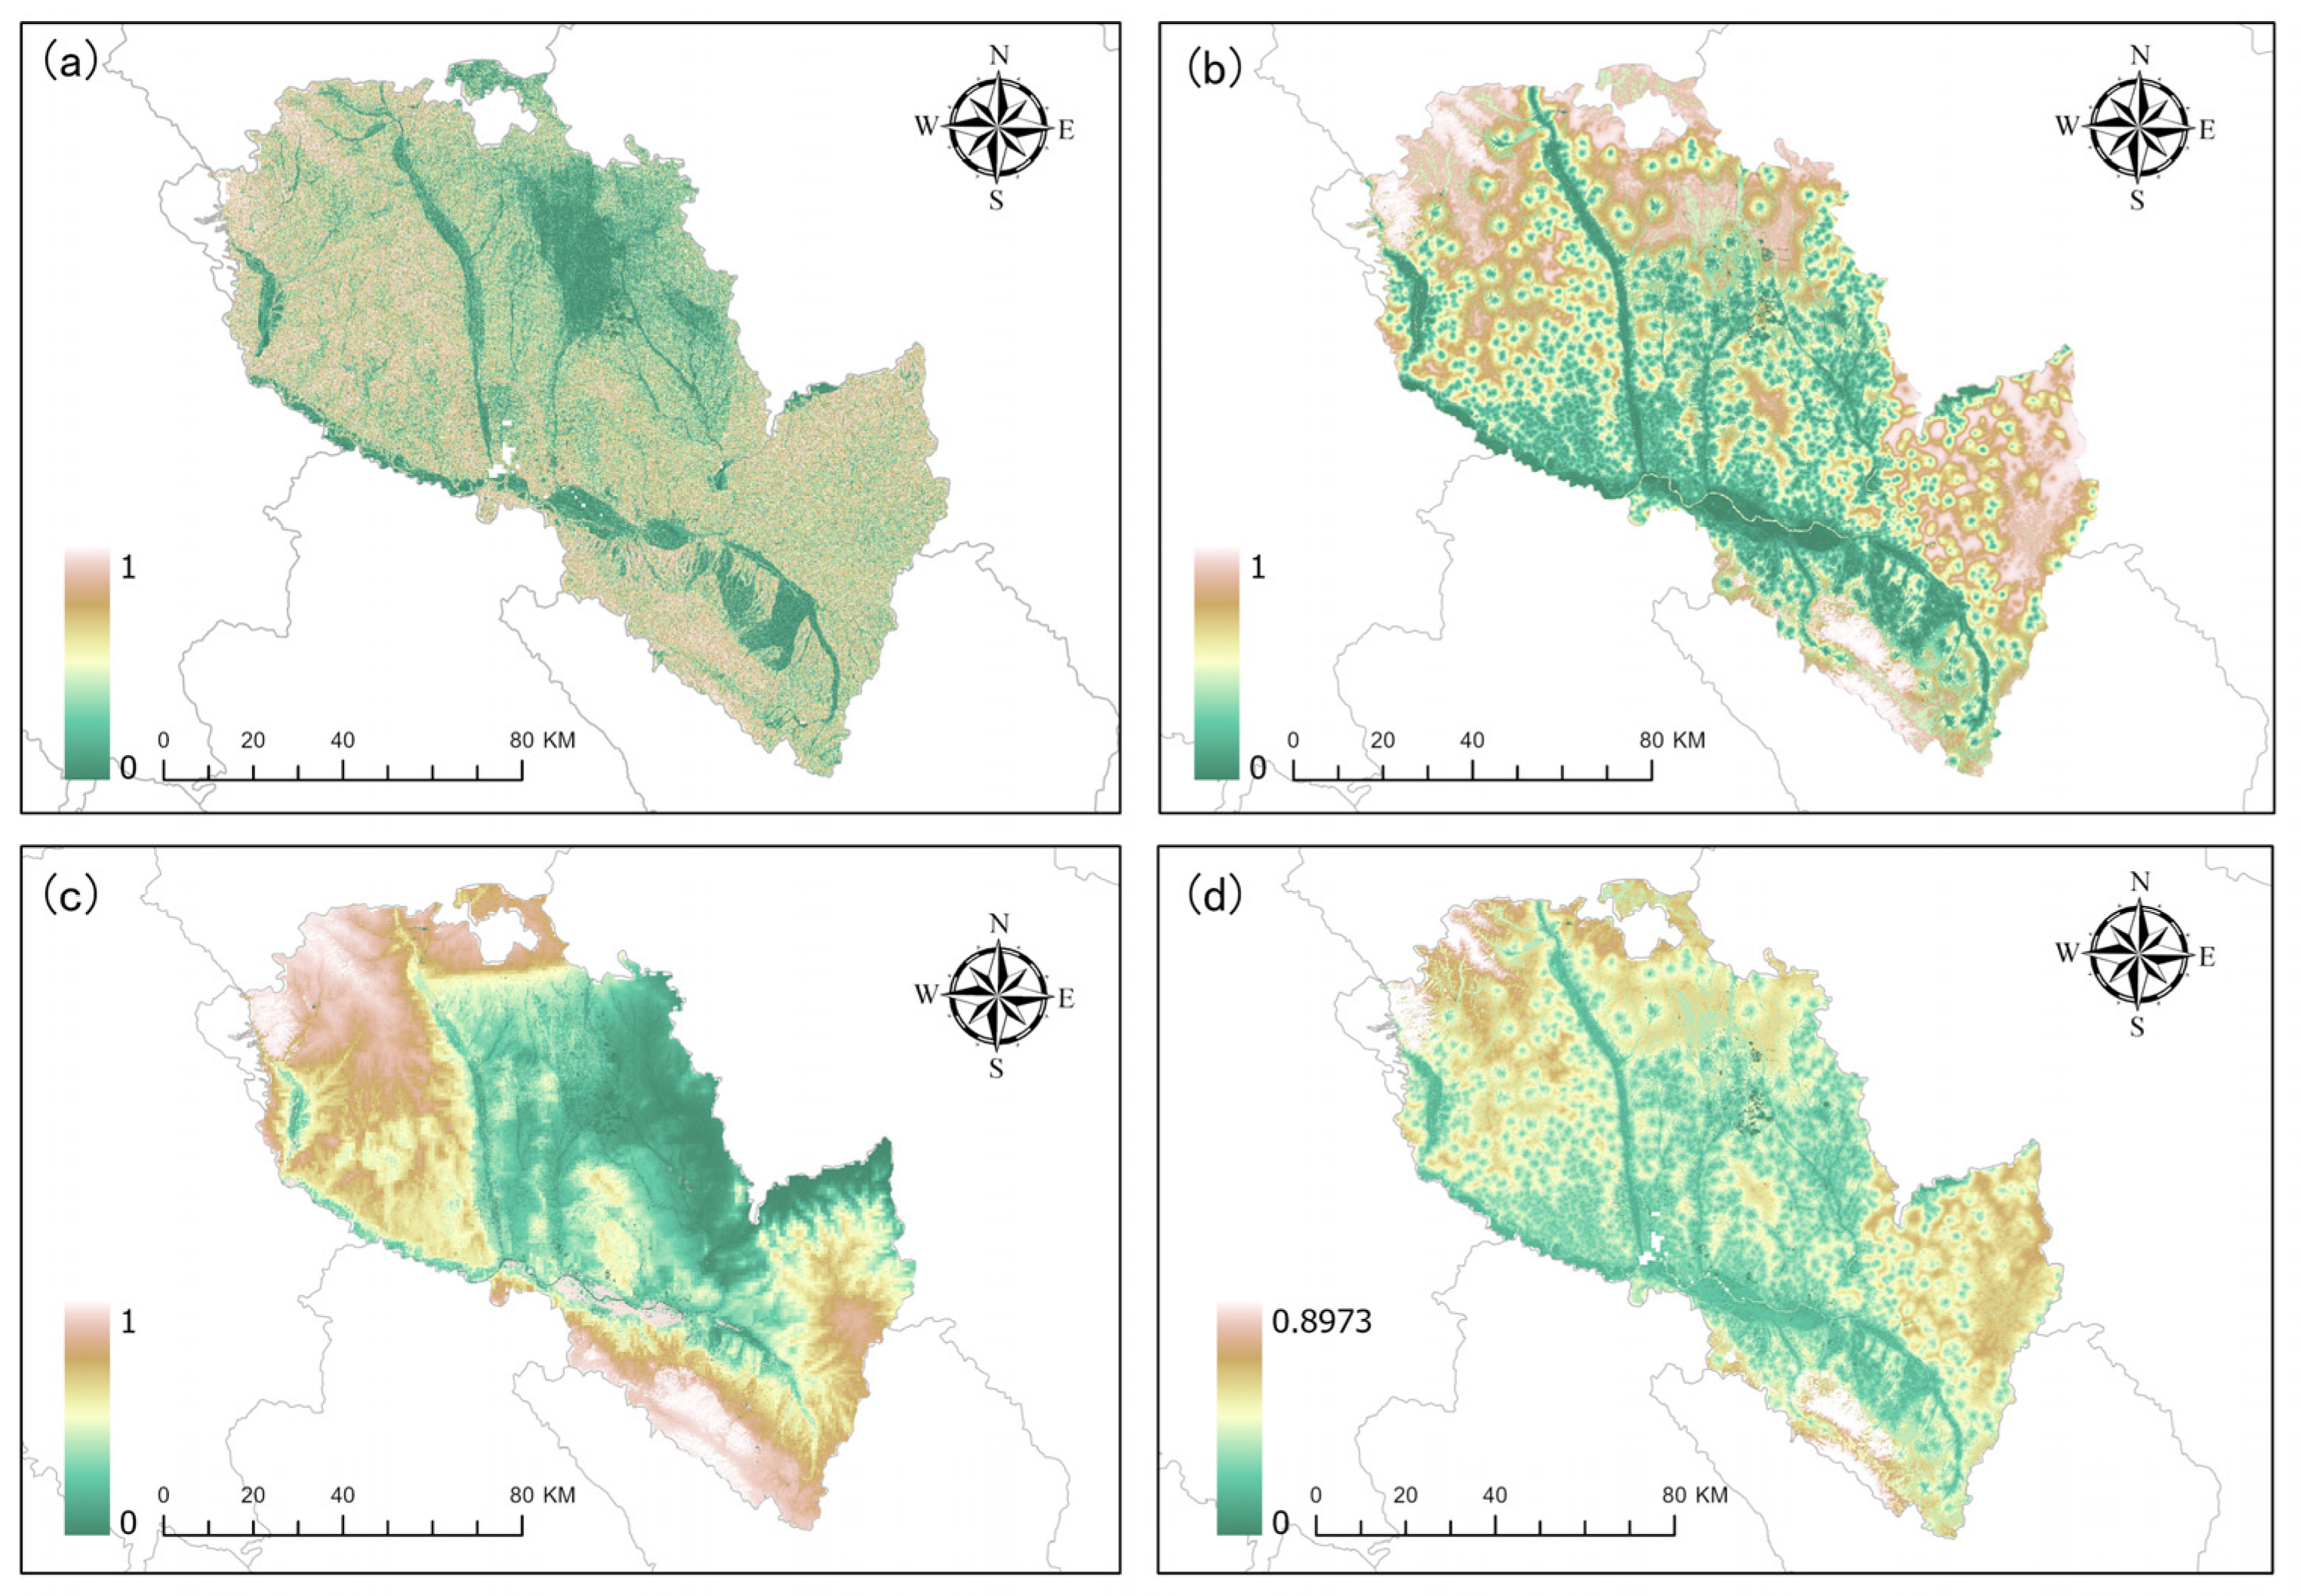
3.1. Ecosystem Service Function Evaluation

Using the InVEST model, water yield, soil conservation, and habitat quality functions in both urban and rural areas of Lanzhou were assessed. These three functions underwent normalization and grading prior to downstream analyses. Histogram equalization was employed for symbolic representation, where a represents water yield, b represents habitat quality, c represents soil conservation, and d symbolizes the result weighted by the importance of ecological services (Figure 4). Water yield was predominantly distributed in the urban area and the northwest of Lanzhou, with a more even distribution in other areas. The highest values for habitat quality in the study area were concentrated in the northwest, northeast, and southeast regions. Low values for soil conservation function were mainly observed in the middle of the study area, while high values were found in the northwest and southeast regions. The overall difference was substantial, indicating a three-stage distribution pattern. The importance of ecosystem services was significantly influenced by habitat quality.

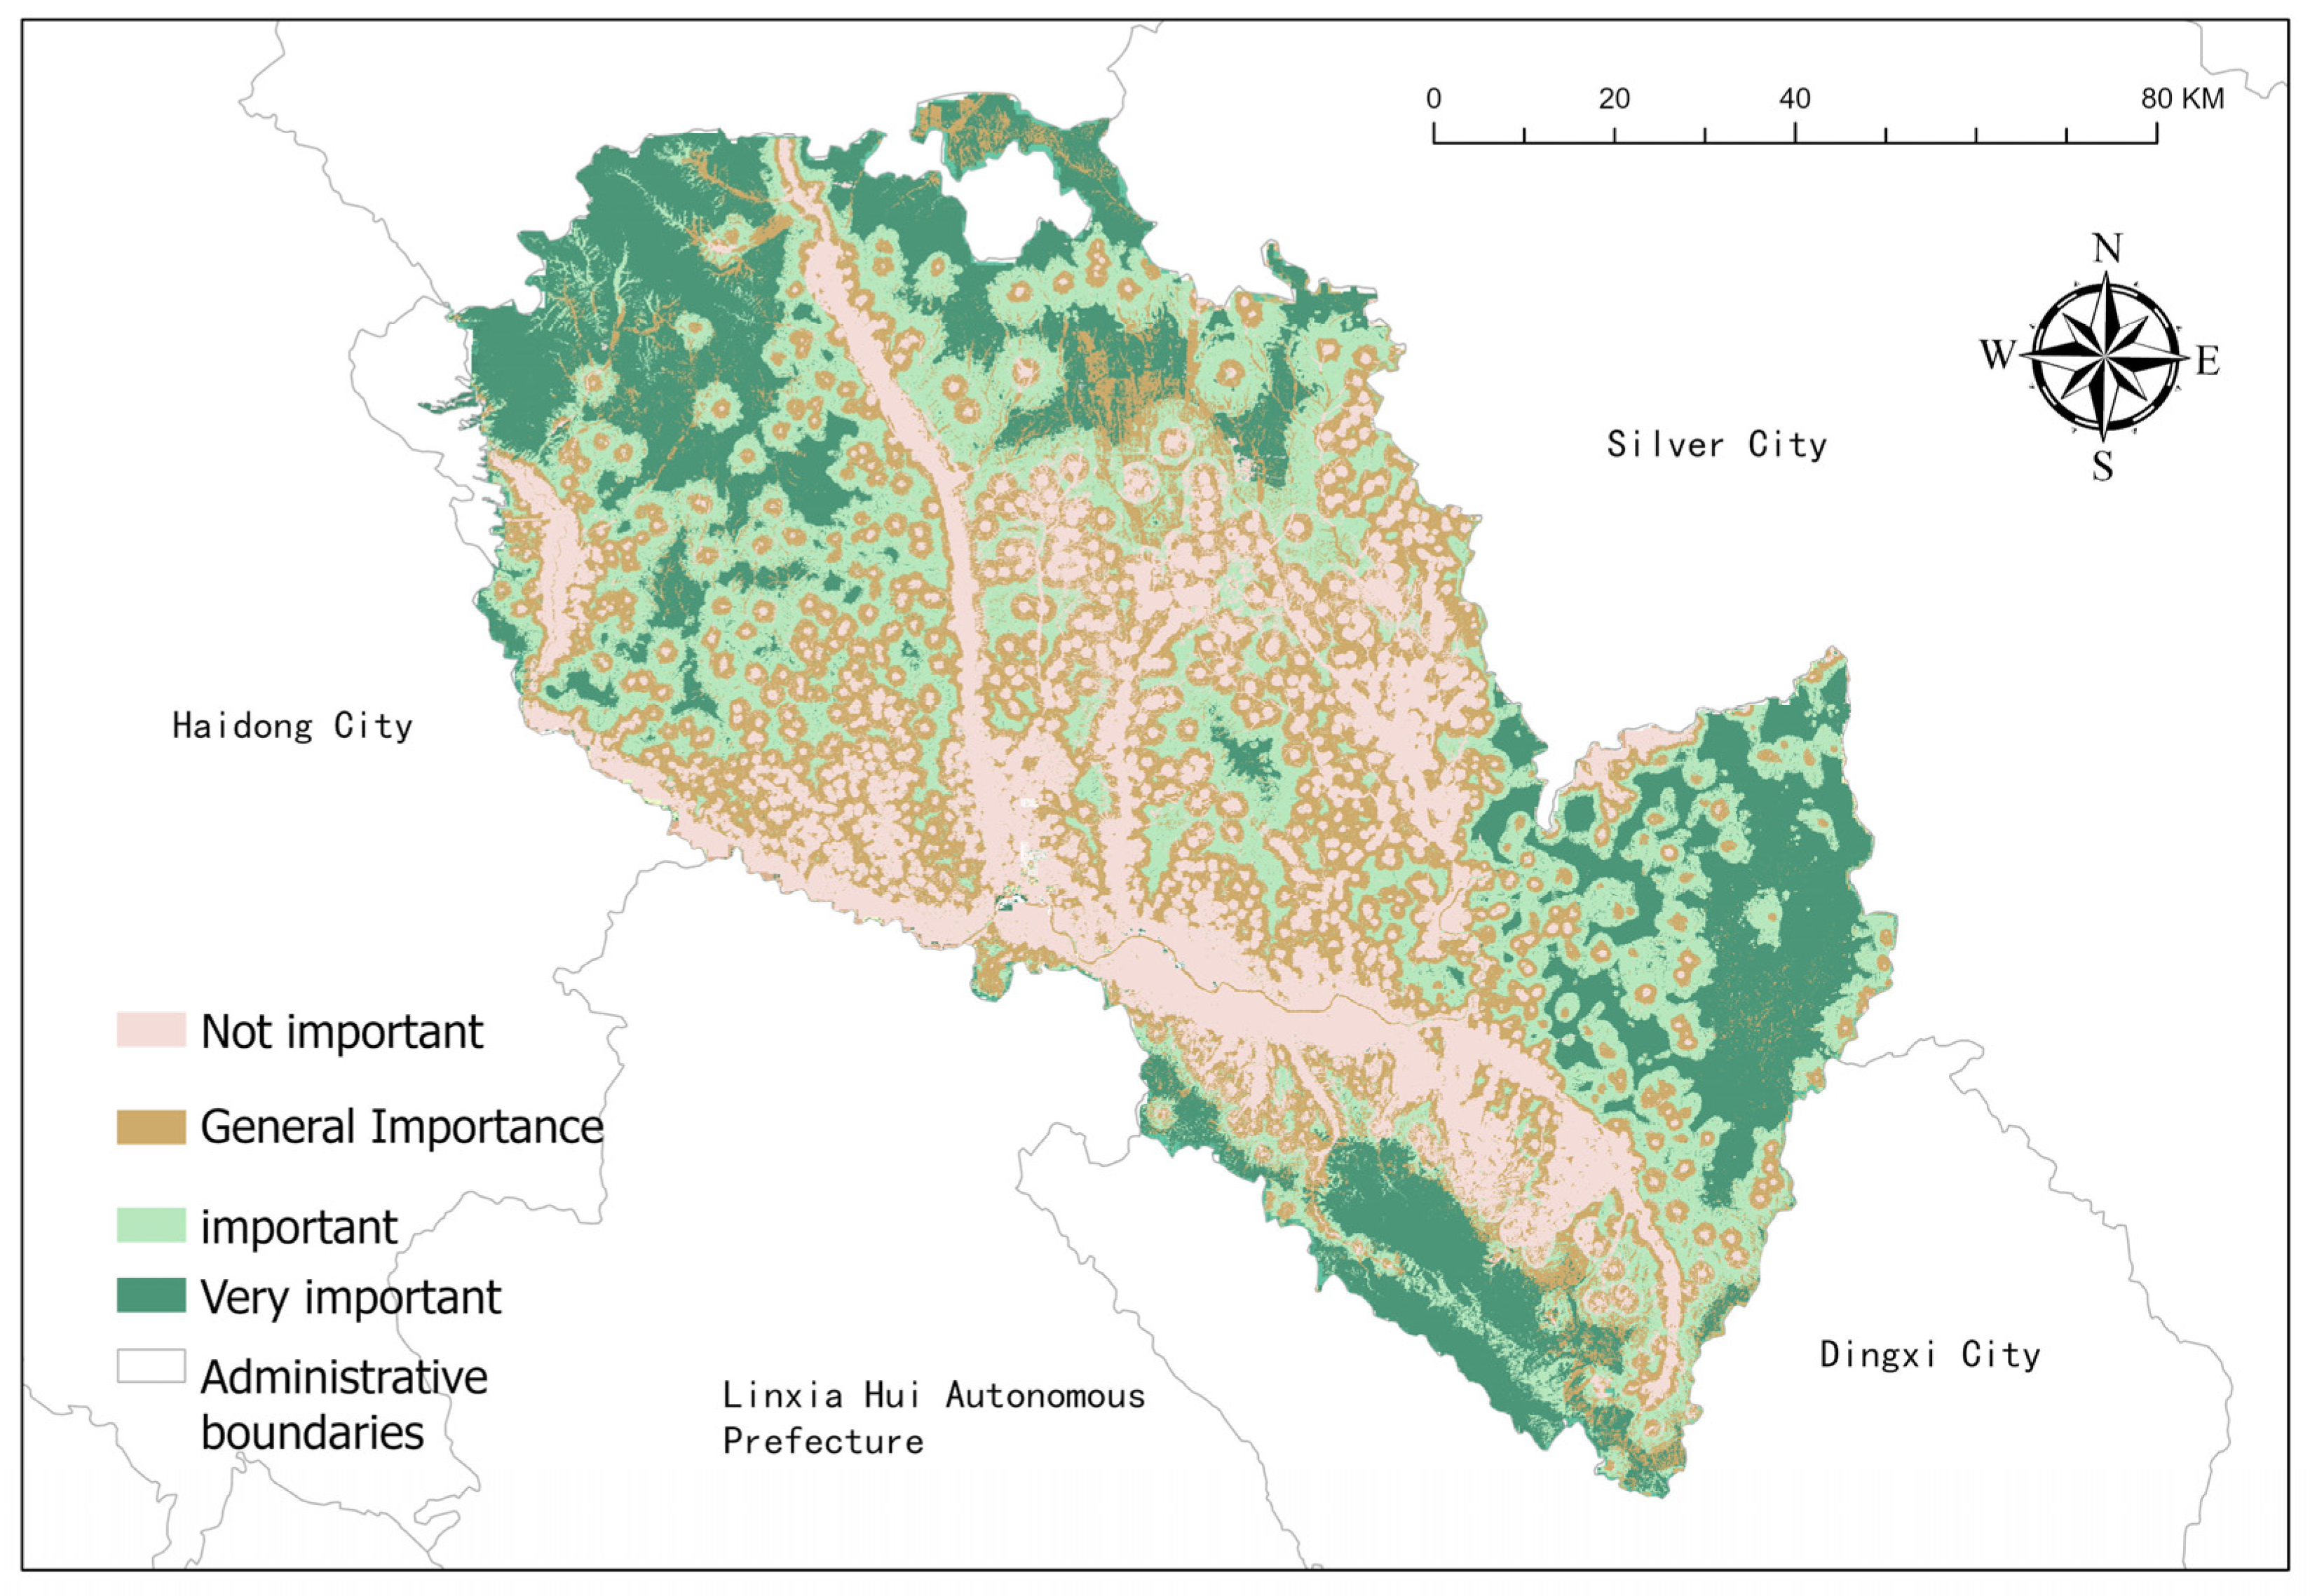
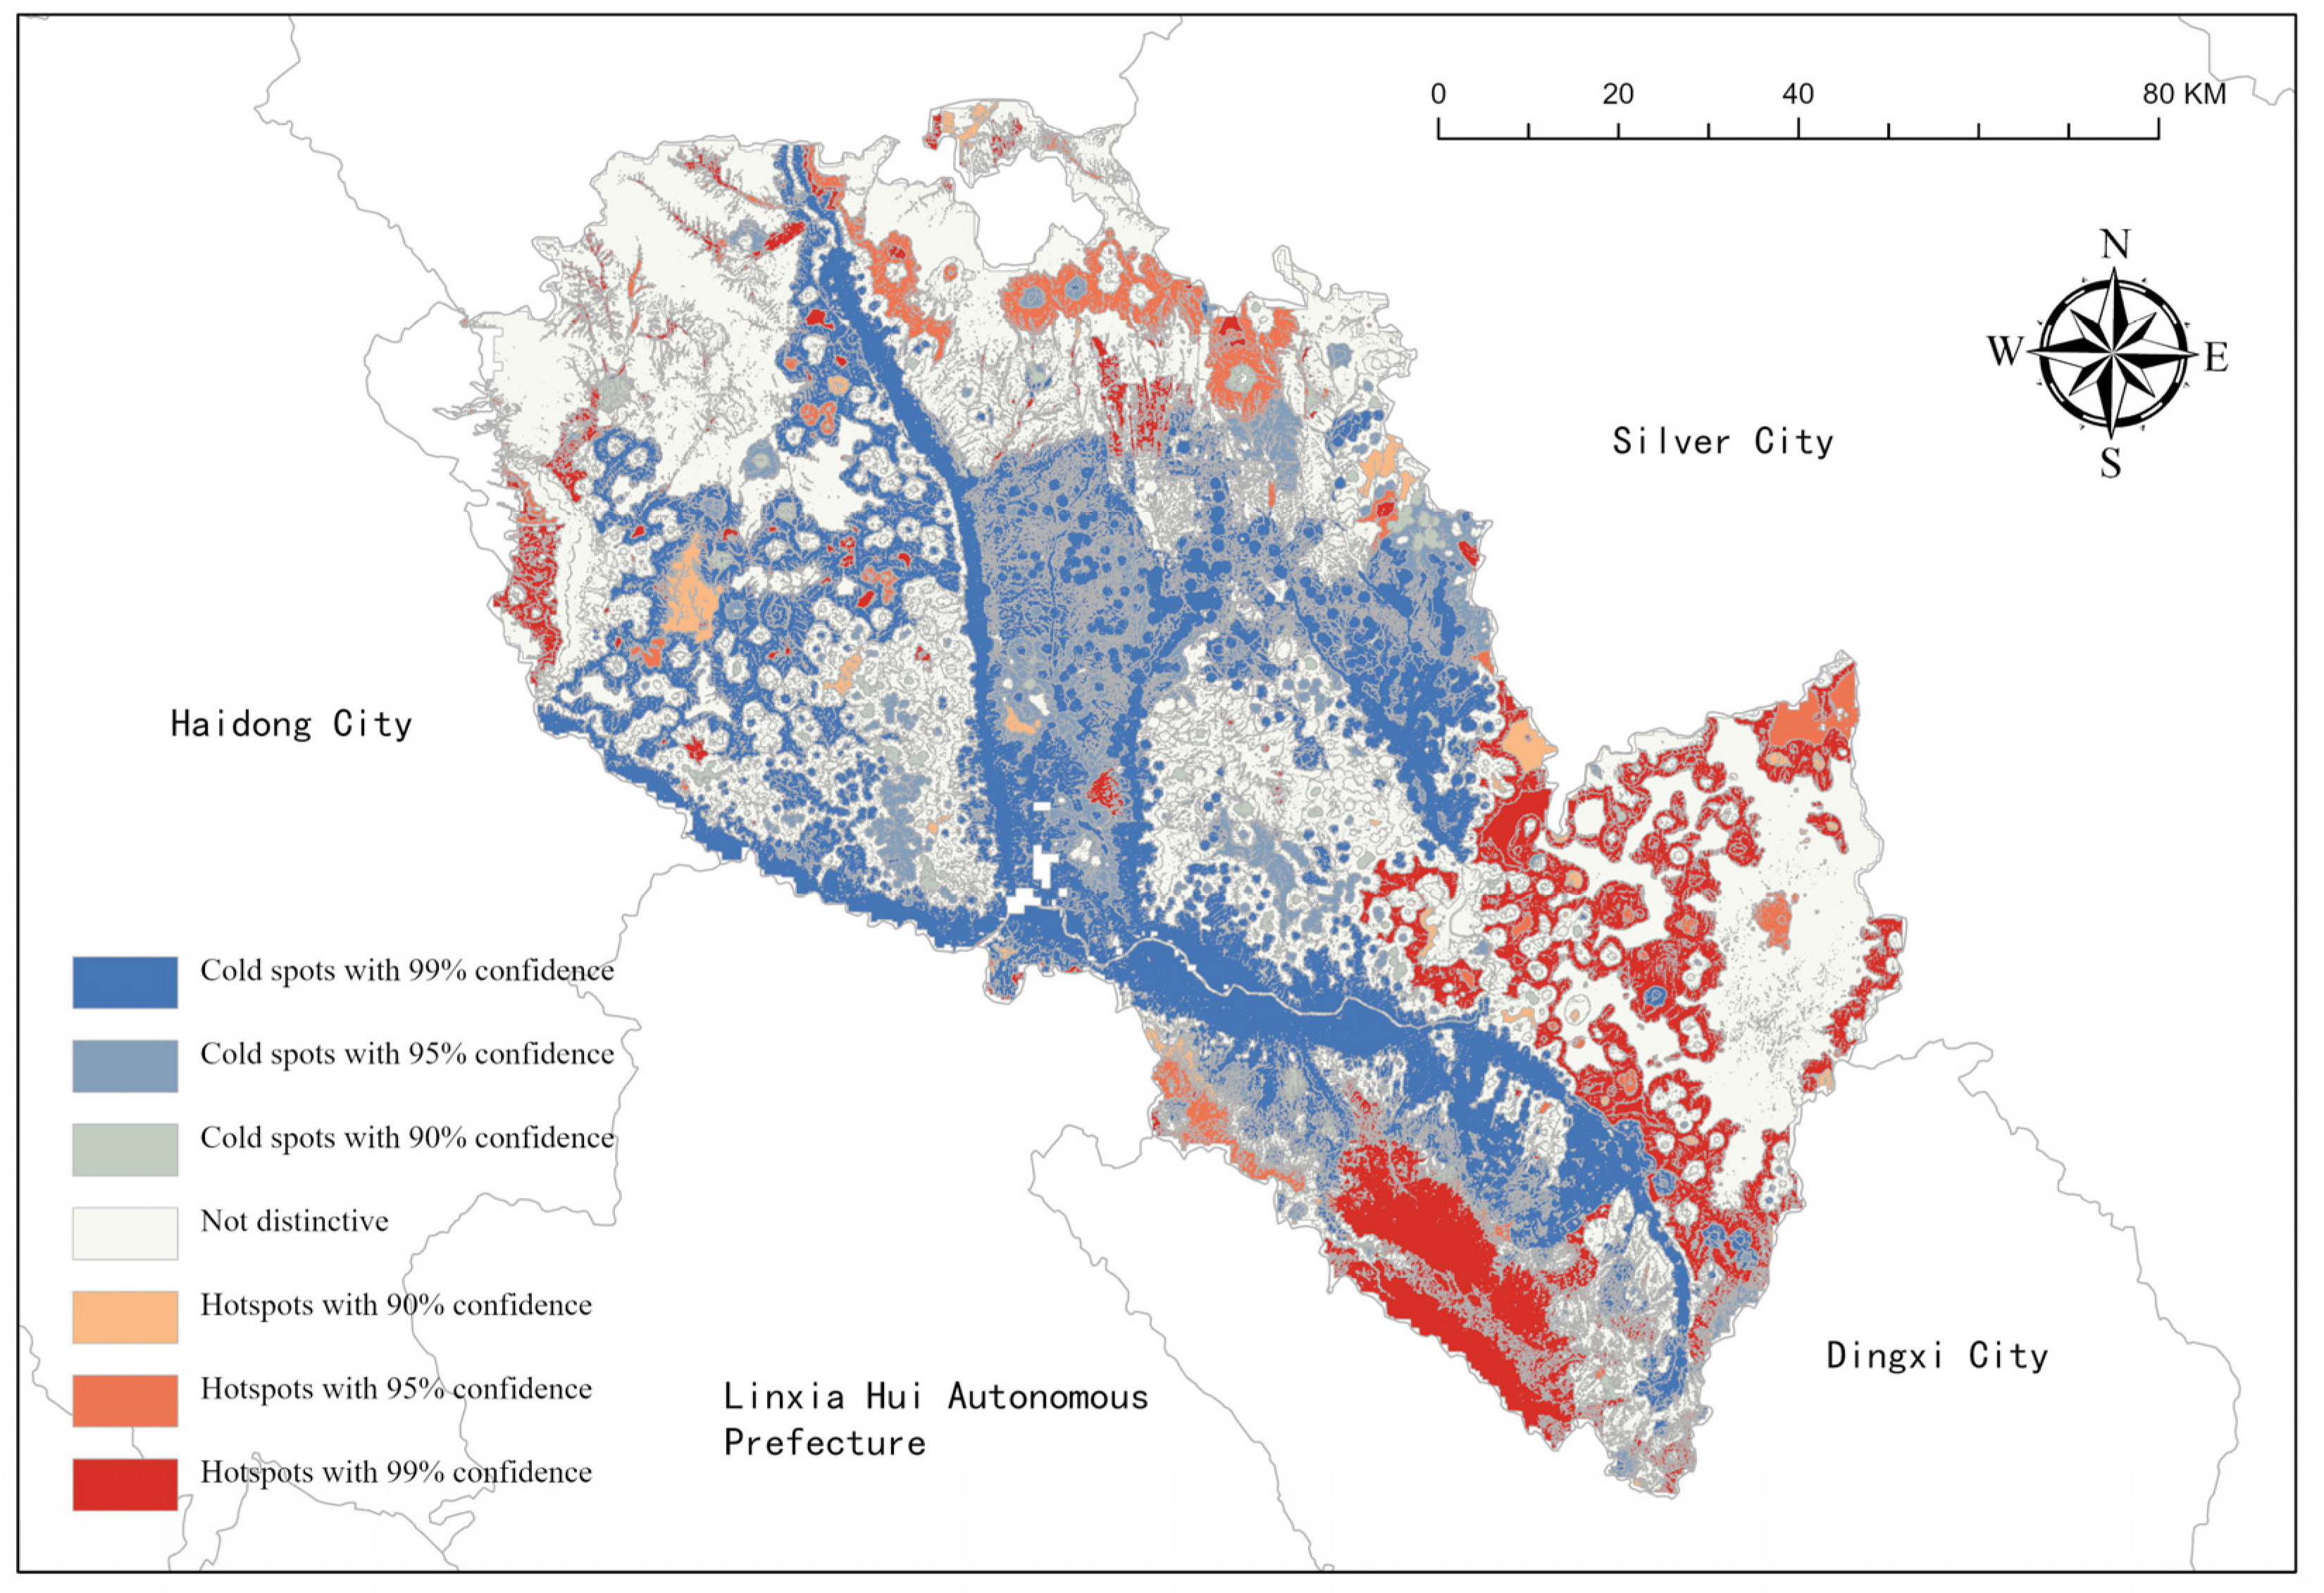
3.2. Evaluation and Classification of Ecosystem Service Importance

The importance assessment of the ecosystem was further graded, categorizing the overall function of the study area into four levels: not important, less important, important, and very important. Upon grading, our findings revealed that the ecological importance of the study area in the northeast increased compared to the evaluation based solely on individual functions. The area categorized as a ‘very important’ ecological source area had a coverage of 24.9% (Figure 5).

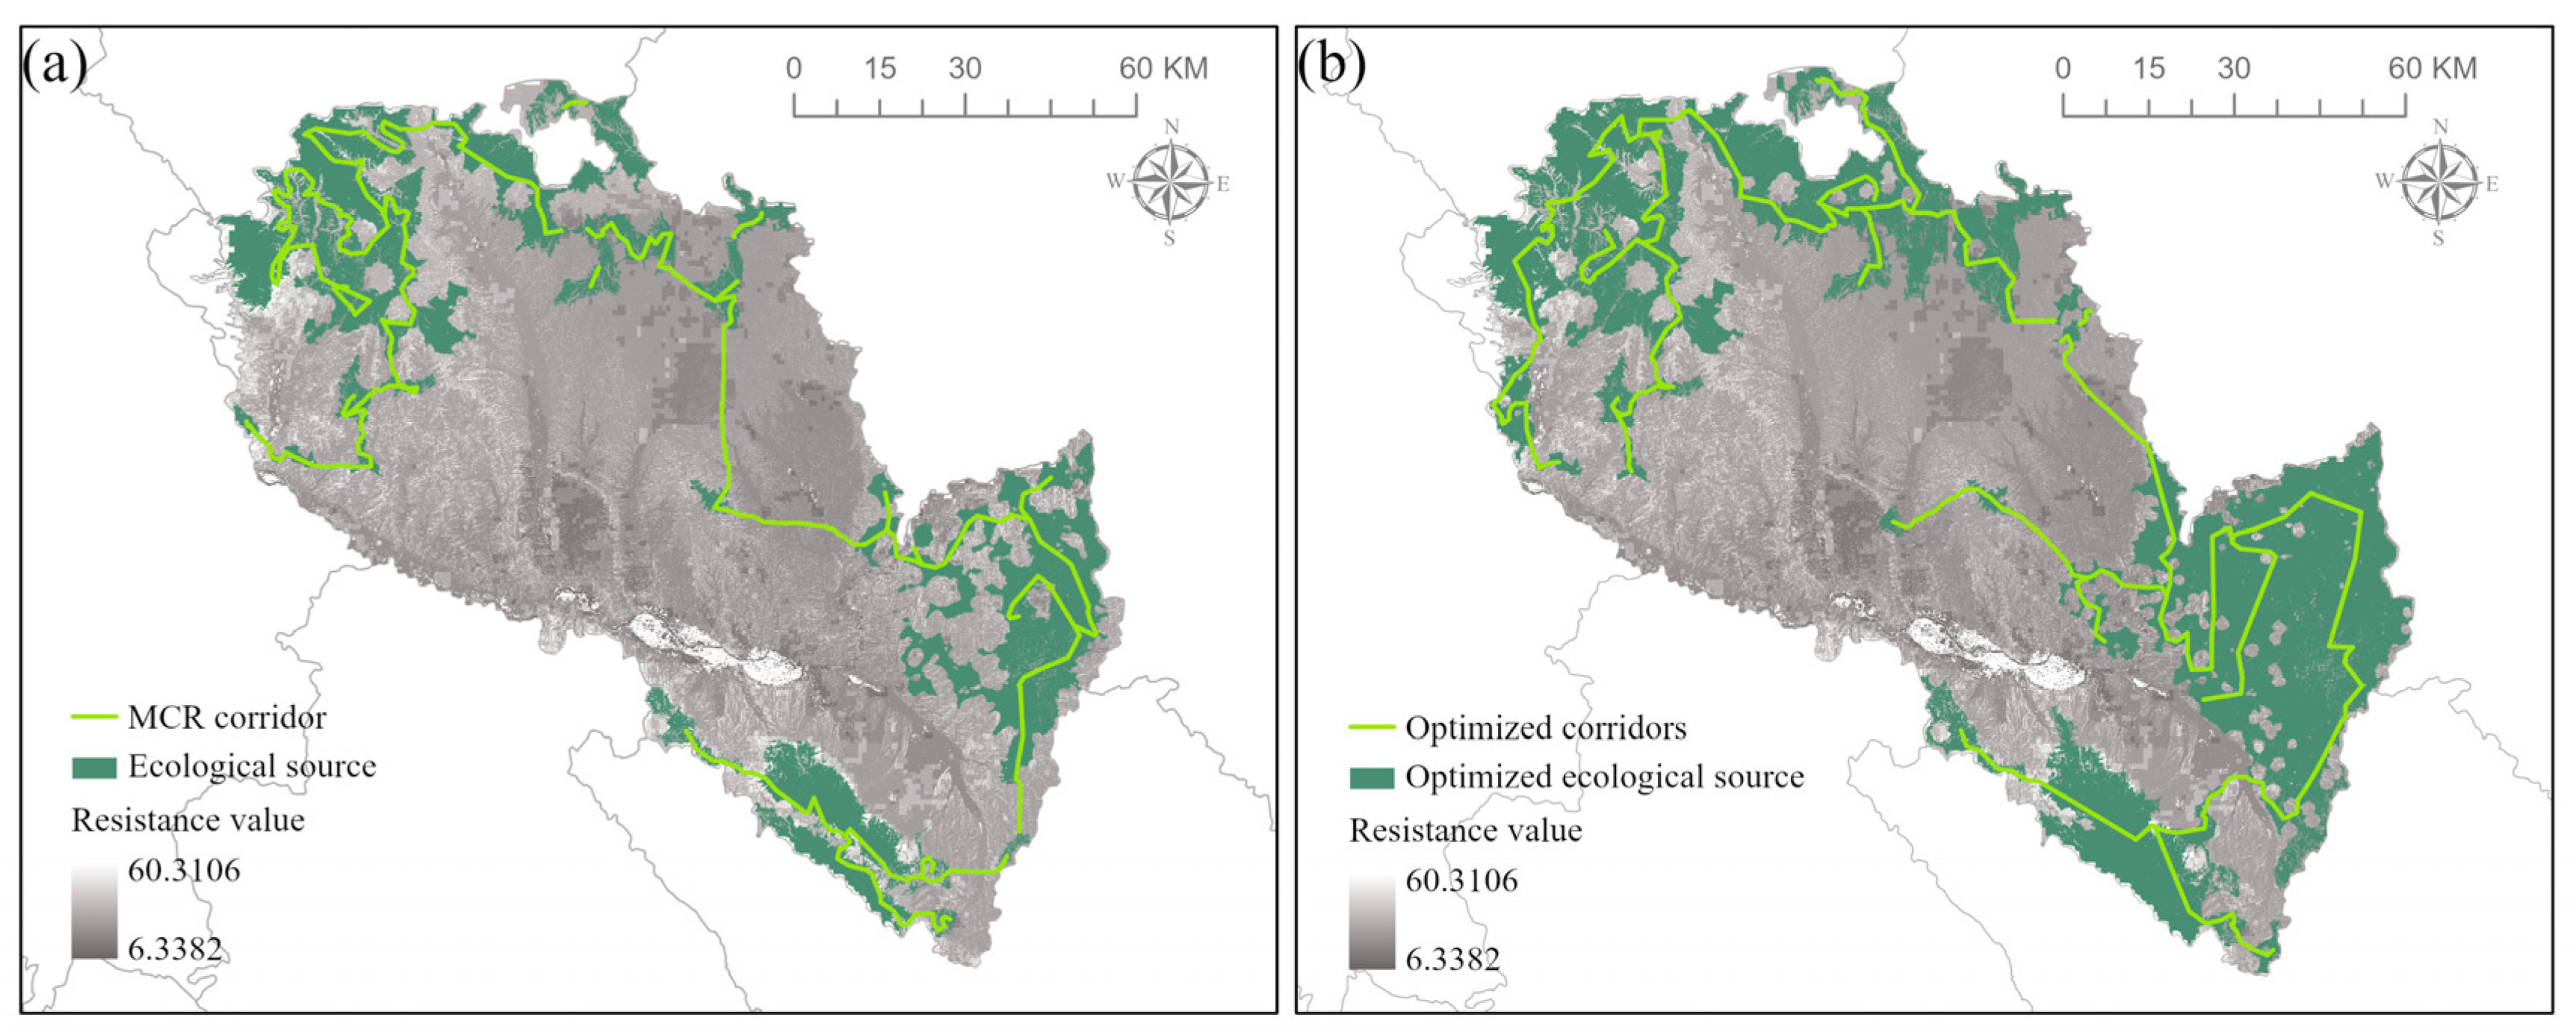
3.3. Optimization of Ecological Source Area

Combining the evaluation results for the original ecological importance differentiation, hotspot analysis of the study area was optimized using GIS. Hotspot areas with a confidence degree greater than 90% were extracted, while source areas with an area less than 10 km2 were eliminated (Figure 6). A total of 19 ecological source areas were identified in the optimized study, primarily distributed in the northwestern Honggu District of Lanzhou, the southwestern part of Yongdeng County, the area of Gaolan Mountain, and the southern part of Yuzhong County. The coverage of the optimized ecological source area increased from 2914.1 km2 to 4542.5 km2, representing an increase in proportion from 24.9% to 34.7% of the study area (Figure 6).

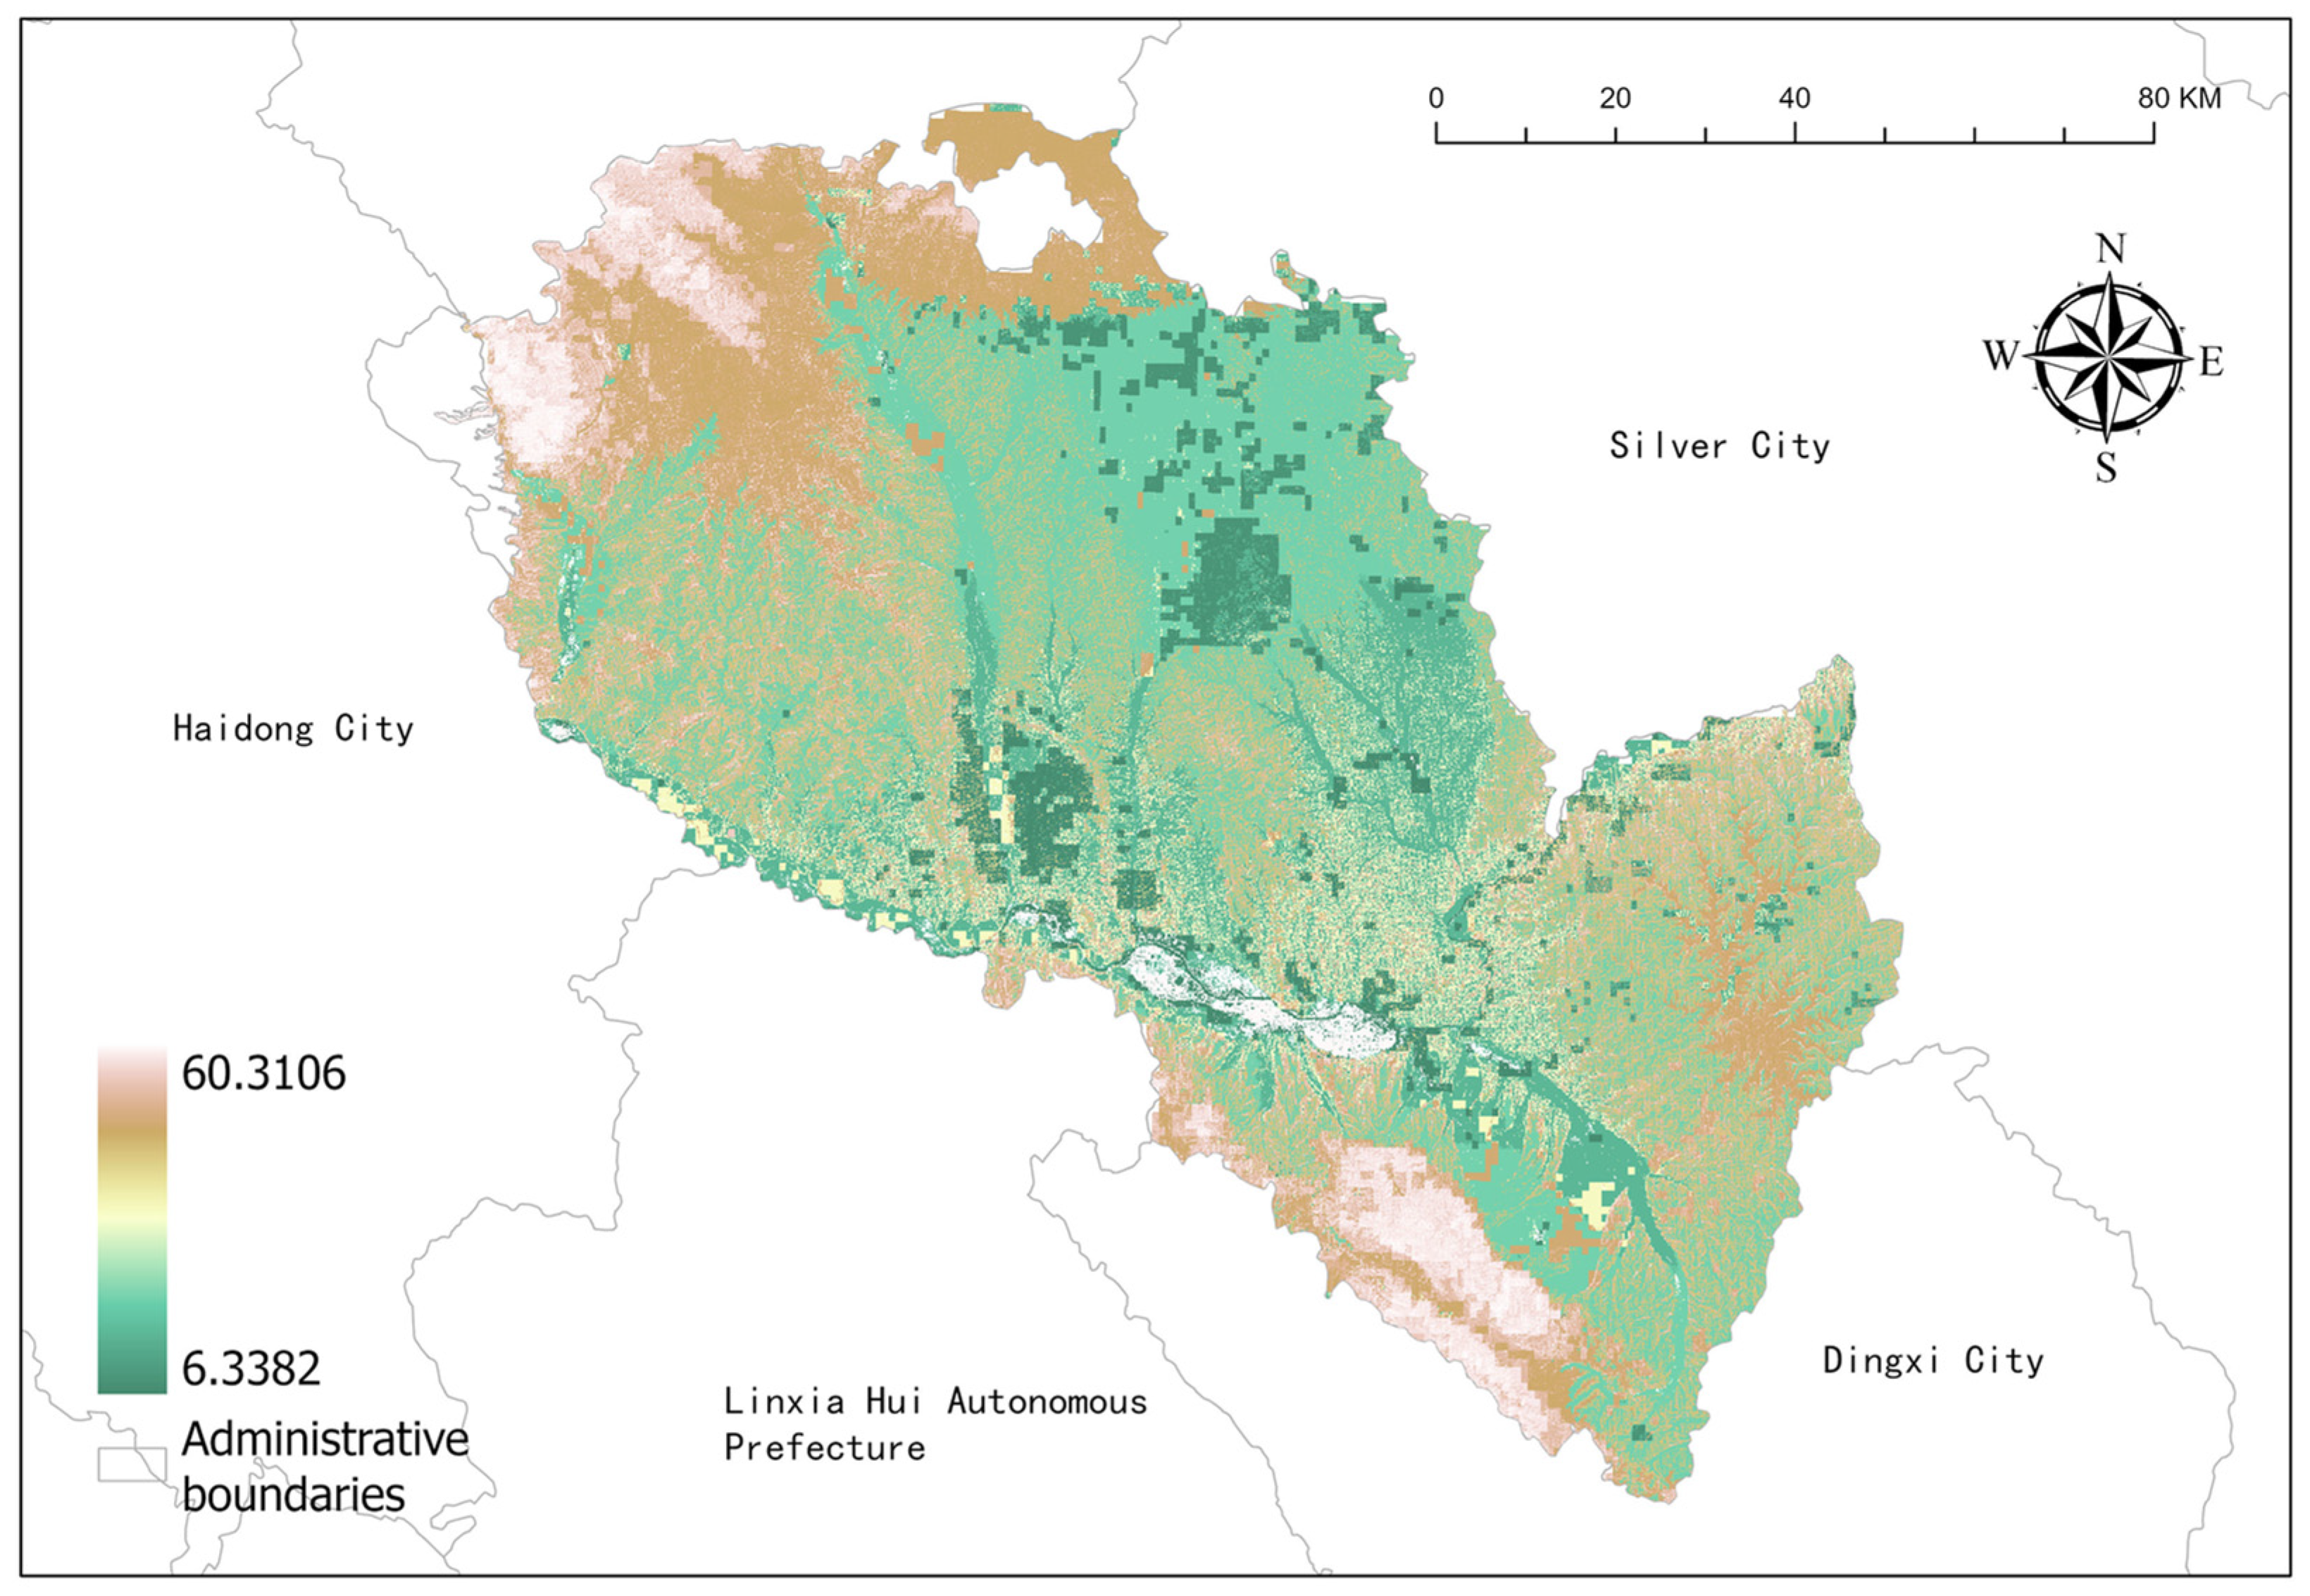
3.4. Construction of Ecological Resistance Surface

A resistance surface weight evaluation system was constructed based on the analytic hierarchy process (Table 2). The resistance coefficients of each factor were categorized into five different levels, and the quantile grading method was employed to reclassify them into five levels. Subsequently, the resistance surface was generated through a weighted superposition comprehensive calculation based on the analytic hierarchy process (Figure 7). Our findings revealed that sections with high ecological importance along the urban belt, particularly in the northwest and southeast, exhibit higher resistance values. Conversely, sections with low resistance values were predominantly distributed along the periphery of the urban area and in the north of the entire study area.

3.5. Construction and Optimization of Ecological Security Pattern

3.5.1. MCR Ecological Corridor

Based on the calculation of the original ecological source area, 24 corridors totaling 1048.6 km were identified by consensus. After extracting the optimized ecological source area, 18 corridors totaling 1135 km were established based on the MCR model, representing an increase in corridor length of 8.2%. Figure 8a depicts the corridor layout prior to optimization, whereas Figure 8b illustrates the corridors after optimization. The optimized corridors are primarily distributed within the ecological source area, dividing the entire area into five zones, including Gaolan County, Yongdeng County, Honggu District, three districts in the main downtown area, and two districts in Yuzhong.

3.5.2. Circuit Model Corridor

Ecological corridors were reconstructed in the study area using circuit theory, selecting the same ecological source area and resistance surface as in the MCR model. The northwest corridor is relatively densely distributed, primarily outside the ecological source area. The overall corridor configuration exhibits a network layout, with our analyses identifying 199 corridors with a total length of 1522.3 km. After optimization, the total number of corridors increased to 217, covering 2657.3 km (Figure 9a).
The ecological barrier point area is characterized by high resistance values for ecological flow within the corridor (Figure 9b), whereas the ecological pinch point area features a high density of ecosystem service flow (Figure 9c). Our findings revealed that ecological barrier areas were mainly located in the northwest of Lanzhou City, with dense distributions in the middle and discontinuous distributions in the south of Yuzhong County. The two areas with the highest barrier point values are shown in Figure 9d,e. The Gaolan Mountain area in the middle and Yuzhong County in the southeast were identified as areas with high current density. Conversely, Honggu District and Yongdeng County in the northwest exhibit low current density. The two areas with the highest current density are depicted in Figure 9f,g.

3.5.3. Space Syntax Analysis

Based on an analysis radius range of 10 km and 100 km (verified by multiple radius analyses), the space syntax analysis of the simulated corridors revealed that, for a 10 km radius, the MED (proximity) of the corridors showed the highest value in Honggu District and the lowest value at the edges of each ecological source area (Figure 10a). For a 100 km radius, the high-value areas were primarily concentrated in Honggu District and the northern part of Yuzhong County (Figure 10b). Under the global analysis radius, proximity was higher in the northwest and southeast regions and lower in the middle (Figure 10c). Regarding the BTE (intermediate centrality), for a 10 km radius, the high-value area of the corridor was located in the central Gaolan Mountain zone (Figure 10d). For a 100 km radius, the high-value area was concentrated in the section connecting the urban area with Yuzhong County (Figure 10e). Under the global analysis radius, the urban area increased its connection with Honggu District and the northwest (Figure 10f).

3.5.4. Neural Network Analysis

Based on the ecological network constructed using circuit theory, neural network analysis was conducted by incorporating space syntax indices, other influencing factors, and ecological service functions. This approach aimed to determine how adjustments to spatial indices impact ecosystem services, thereby allowing for targeted optimization and the construction of the spatial pattern.
The simulation of ecosystem service functions using neural network perceptrons revealed that habitat quality had the best fit when predicting a single dependent variable, followed by water yield and soil conservation, which had poorer fits. When simulating two and three ecosystem service functions, similar conclusions were generally drawn. Under the three-dependent-variable scenario, the R2 value for habitat quality decreased from 0.556 to 0.493, the R2 value for water yield increased from 0.502 to 0.913, and the R2 value for soil conservation increased from 0.241 to 0.530. When habitat quality and water yield were used as dependent variables, the fitting level of habitat quality increased to 0.664 and that of water yield increased to 0.941. When habitat quality and soil conservation were used as dependent variables, the fitting levels for habitat quality and soil conservation decreased to 0.523 and 0.278, respectively. When water yield and soil conservation were used as dependent variables, their fitting levels decreased to 0.796 and 0.351, respectively, compared to the single-dependent-variable scenario (Table 3).
Figure 11 presents a scatter plot of the actual and predicted values of each variable, indicating that the model fit was better under bivariate conditions, followed by trivariate conditions, and, finally, single-dependent-variable conditions. The simulation level was poor when soil conservation was involved, whereas the model fit was high when water yield and habitat quality were involved.

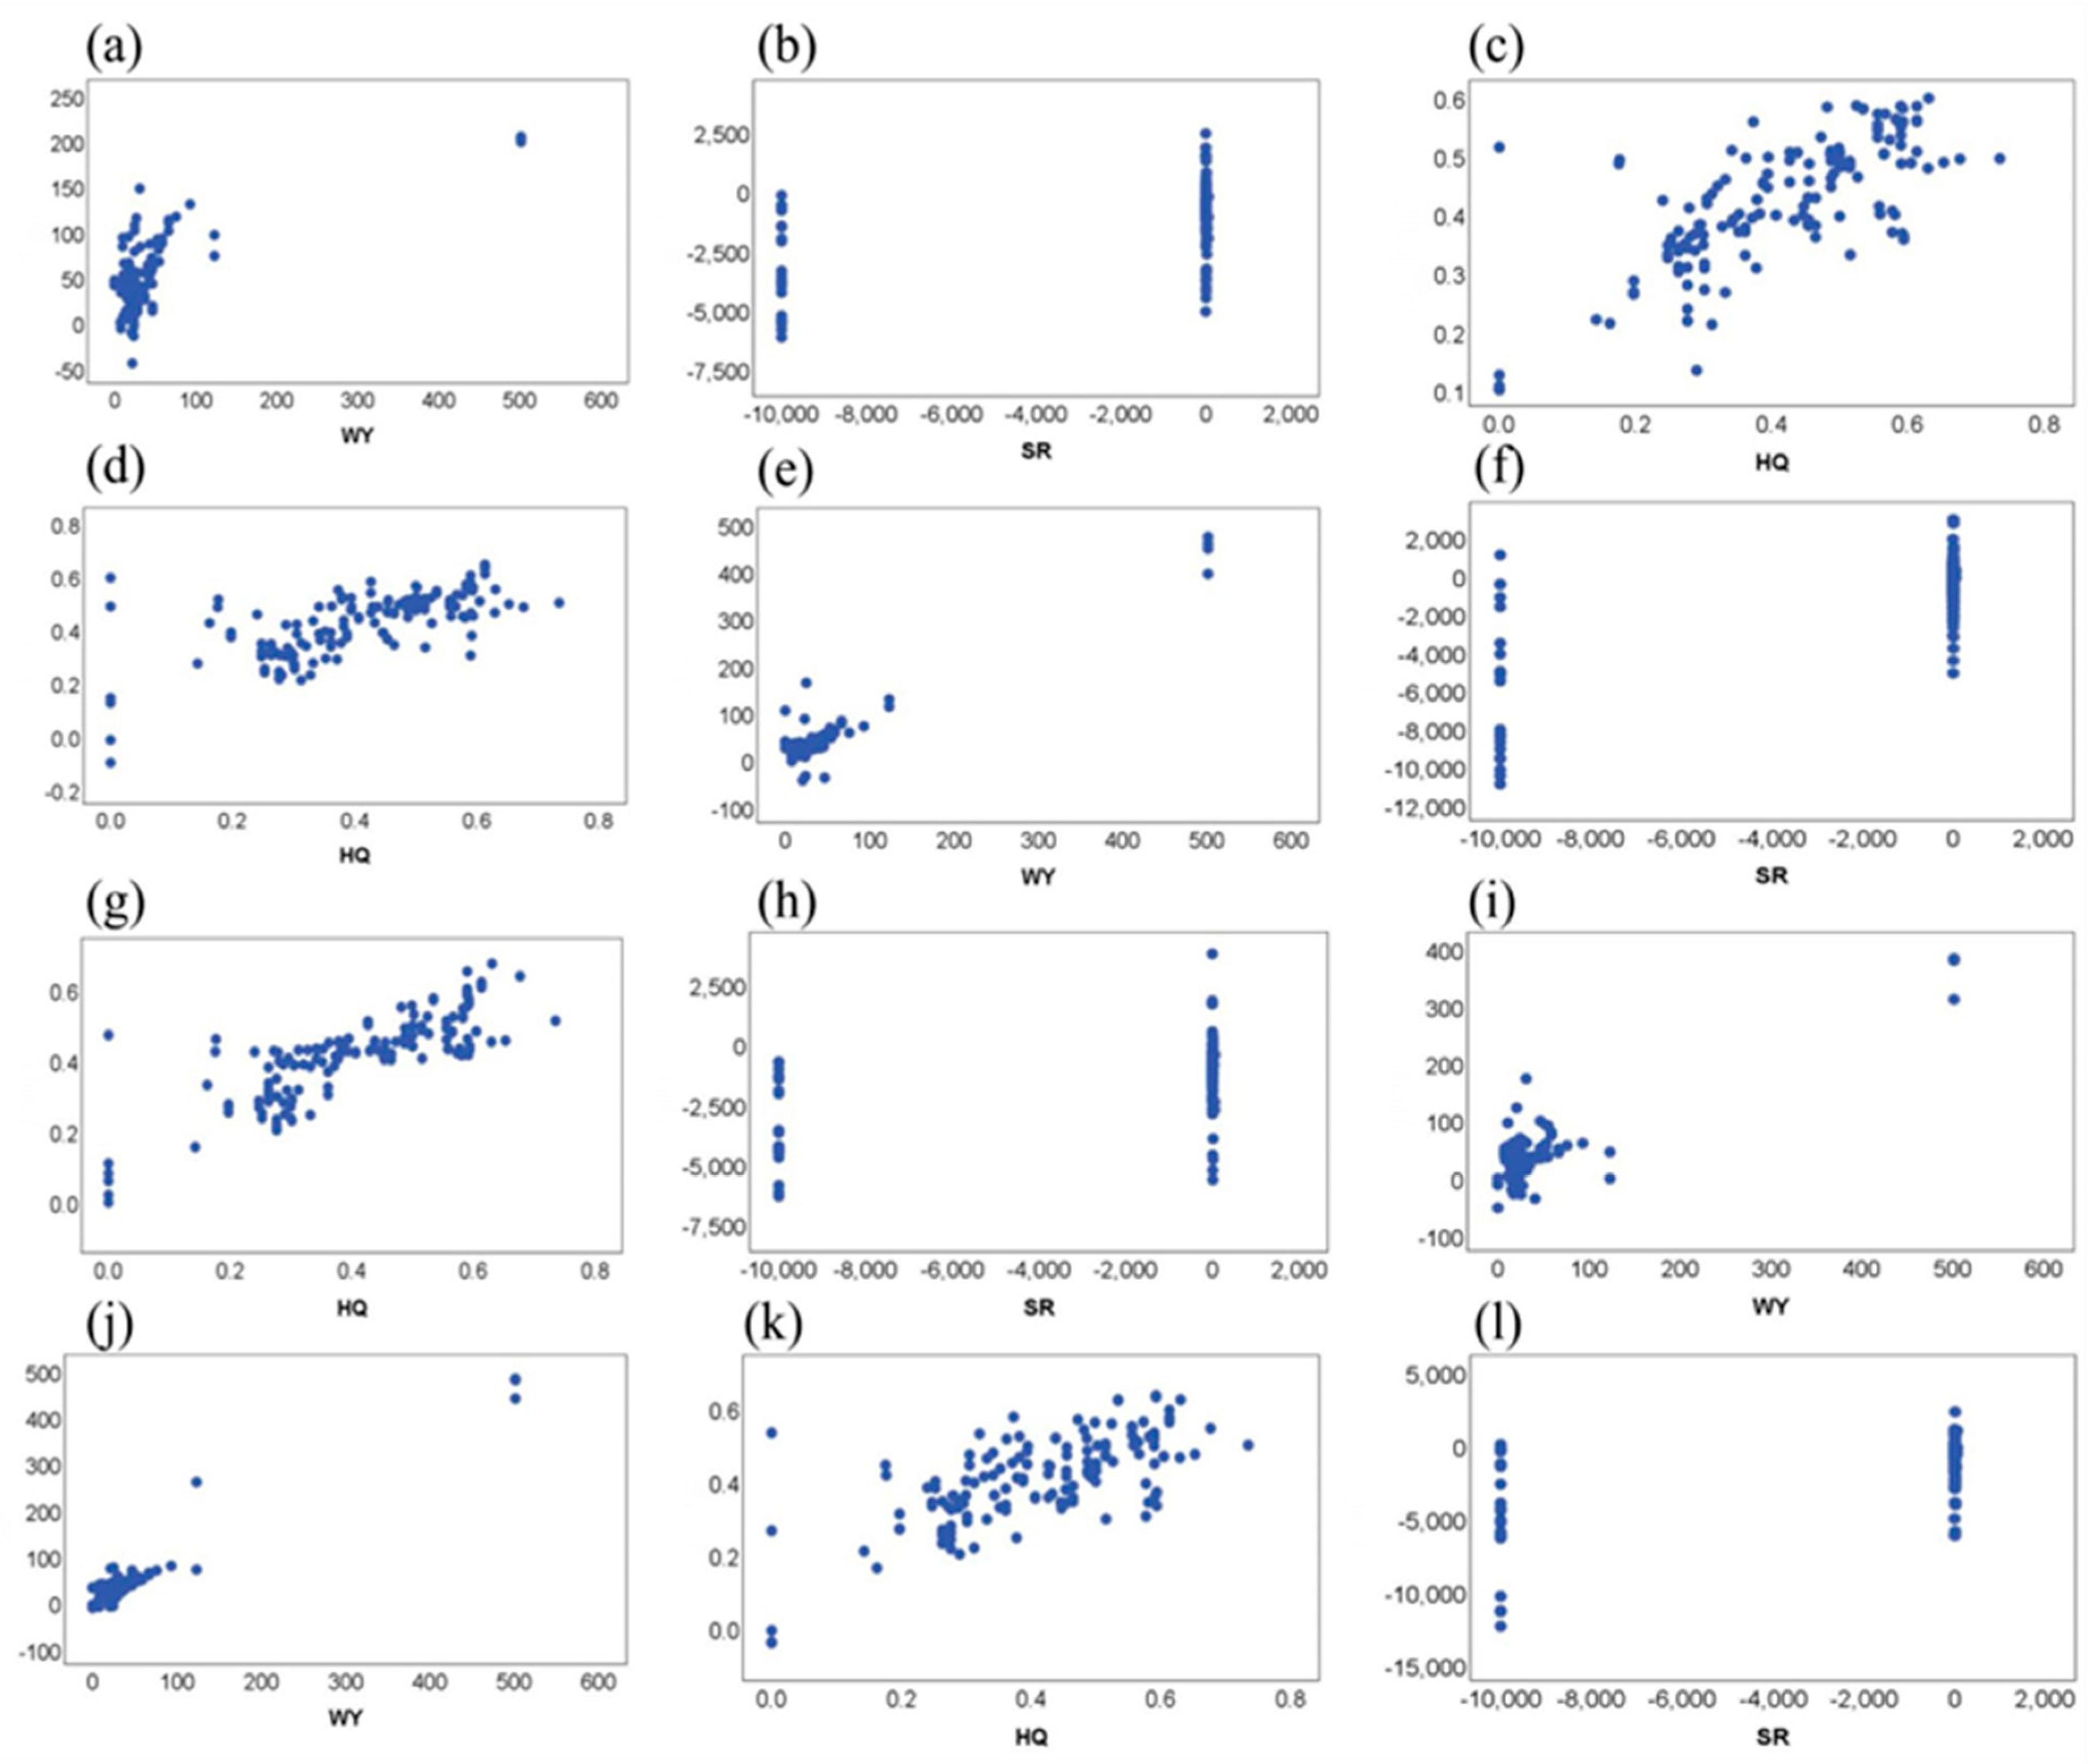
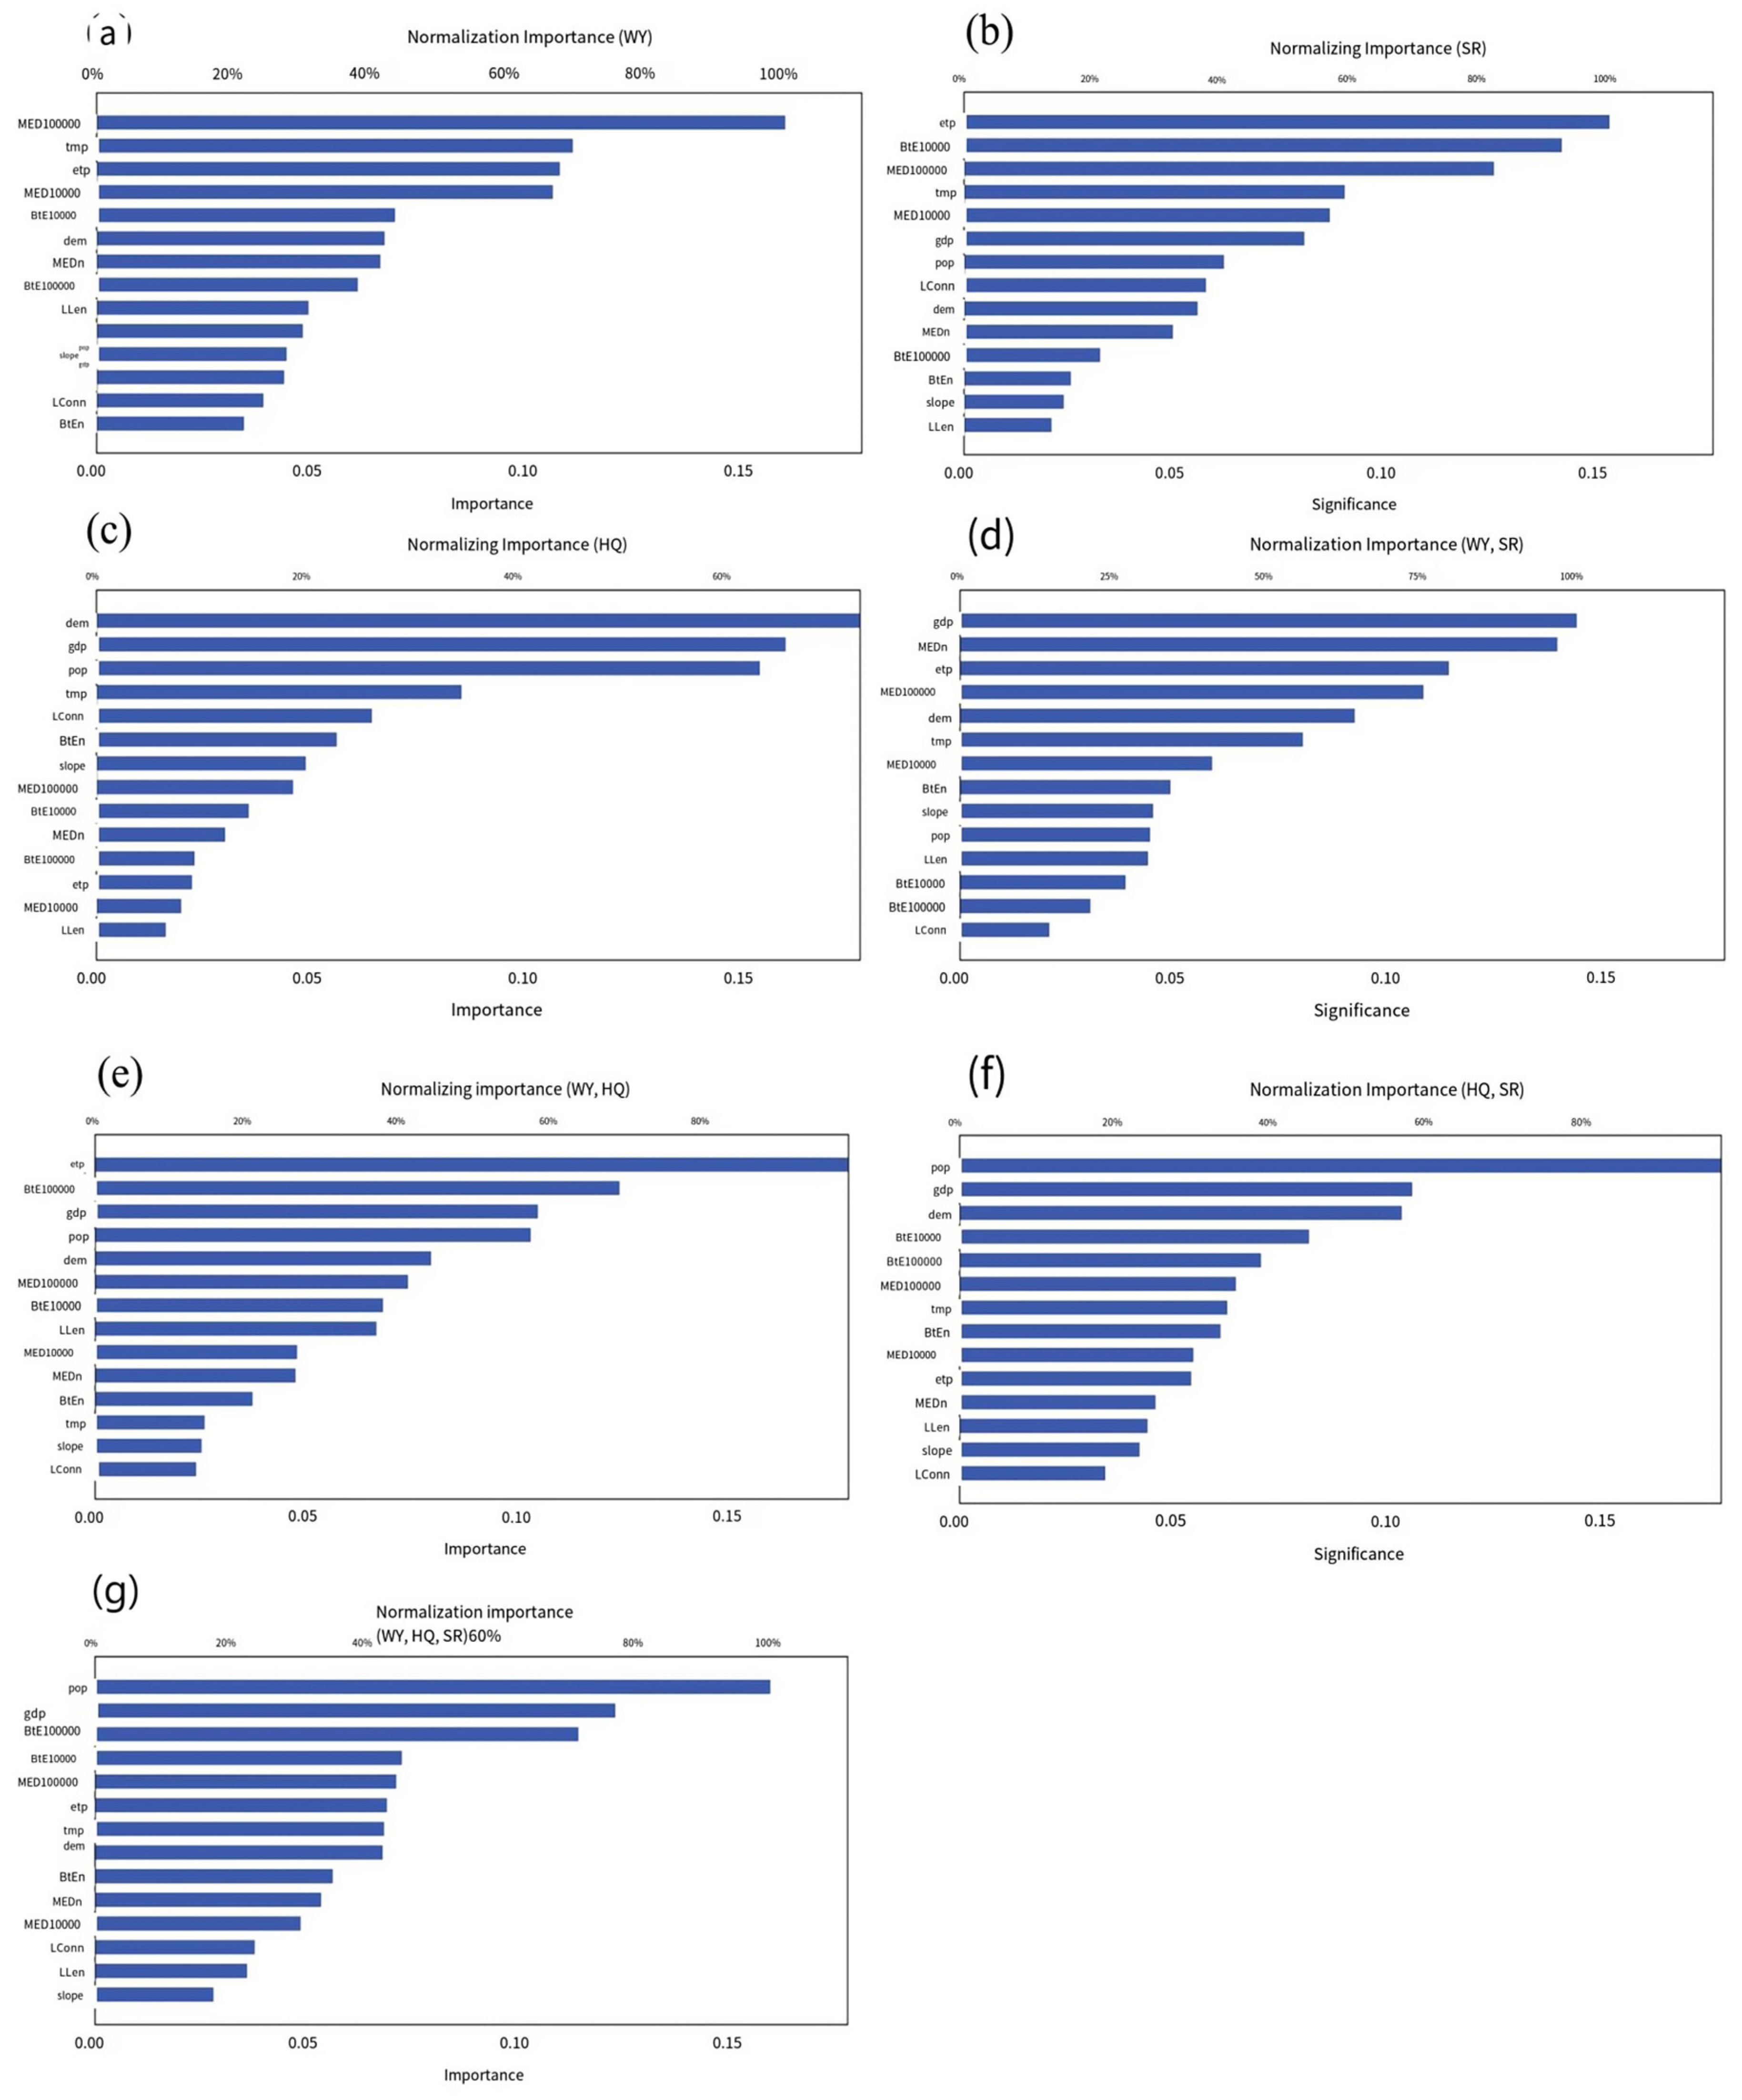
3.5.5. Importance Analysis of Influence Factors

Regarding dependent variables, the analysis of the importance of ecological services based on the SDNA platform combined with space syntax index factors and other environmental factors revealed notable differences (Figure 12). Under the condition of a single dependent variable, when the dependent variables were water yield, soil conservation, and habitat quality, the proximity centrality (MED), evapotranspiration (ETP), and elevation of the 100 km corridor had the greatest impact on ecosystem services, while BTEn (betweenness centrality) and LLen (line length) had the least impact (Figure 12a–c). When the dependent variables were water yield and soil conservation, GDP had the greatest impact, and LConn (connection value) had the least impact (Figure 12d). When the dependent variables were water yield and habitat quality, ETP (evapotranspiration) had the greatest effect, and LConn (connection value) had the least effect (Figure 12e). When the dependent variables were habitat quality and soil conservation, population factors had the greatest influence, and LConn (connection value) had the least influence (Figure 12f). When the three dependent variables were combined, it was concluded that population factors had the greatest impact on ecosystem services, while slope had the least impact (Figure 12g).

4. Discussion

4.1. Optimization of Ecological Security Pattern Identification Framework

After optimization based on hotspot analysis, the resistance cost of the ecological corridor was reduced by 26.8%. The optimized corridor, based on circuit theory, compensates for the deficiencies of MCR theory in addressing the influence of ecological flow. Comparative analysis of the MCR model and circuit model corridors reveals that circuit theory is more suitable for corridor construction at different scales, but it cannot effectively identify features within the ecological source area. Conversely, MCR can serve as a reference for the overall ecological security pattern, but it is insufficient in identifying features outside the ecological flow and ecological source area. Therefore, circuit theory can be used to supplement and optimize corridor identification. Based on these outcomes, space syntax indices and other factors combined with neural network analysis were used to optimize the resistance surface and modify the original pattern. This framework demonstrates that the influence of different factors on ecological security patterns can be established cyclically.
Our findings demonstrated that the importance of ecosystem services in urban and rural areas of Lanzhou presents a three-stage distribution trend, with higher importance in the northwest and southeast and lower importance in the middle. This finding aligns with the study of high-ecological-sensitivity areas that provide crucial ecosystem services. Different natural conditions and social developments contribute to the spatial heterogeneity of regional development, resulting in an imbalance in the supply and demand of regional ecosystem services [7,15]. Ecosystem services and sensitivity assessments can inform and support decision-makers, highlighting their implications for the establishment of management priorities [37]. Regional landscape planning should rationally allocate landscape resources according to local topography and spatial characteristics to enhance ecological security [38]. Moreover, land managers in areas with important ecosystem service functions and ecologically sensitive areas must strengthen land management implementation [39]. The development and protection of corridors and ecological source areas should be prioritized in the Gaolan Mountain zone, the northwest of Yongdeng County, and the south of Yuzhong County, all of which are areas exhibiting ecological pinch points and barriers in our study. Similarly, additional efforts are needed to advance the construction of green infrastructure and enhance urban resilience in the aforementioned regions [13]. Neural network analyses revealed that the importance of different influencing parameters varies, and therefore the weight of resistance factors should be adjusted according to the actual demands of each region to achieve the circular construction of corridors.

4.2. The Role of Ecological Security Patterns in Spatial Planning

The goal of spatial planning is to manage and coordinate any imbalances in regional development, integrate habitat spaces, and enhance the effectiveness of ecological networks [40]. In the study area, there is a spatial mismatch between ecological sources and ecological corridors. Currently, the main ecological resources and corridors in urban and rural areas of Lanzhou are concentrated in the northwest, central, and southeastern parts of the city. The northwest region exhibited a large number of ecological barriers and low ecological flow density, whereas the southeast region featured few ecological barriers with high ecological flow density. To address this imbalance, the development of urban and rural space in the southeast should be conducted in a way that protects the northwest and central parts and reduces ecological barriers. In the central part of the urban and rural area, ecological resource development in the Yellow River basin should be further strengthened. Moreover, additional efforts should be made to accelerate the ecological development of national parks, enhance in situ biodiversity protection, and reasonably conduct ex situ protection. National park protection and restoration projects can be implemented to protect endangered species and their habitats while improving the spatial connectivity of the entire urban and rural region [41]. Multipurpose greenways integrating biodiversity conservation, culture, and recreation should also be developed to restore critical habitats and wastelands and improve biodiversity conservation networks [42,43].
Current ecological conservation and restoration studies in the semi-arid region of Northwest China lack the diagnosis and identification of key areas from the perspective of ecosystem integrity and structural connectivity. For the areas involving railway and highway ecological break points to be repaired in Lanzhou City, relevant improvement facilities should be constructed according to local conditions, such as tubular culverts, culverts under bridges, and “street overpasses” and other wildlife passages to ensure the smooth flow of wildlife. In addition, dynamic monitoring of channels should be carried out to eliminate interference factors in time. The rapid expansion of cities often leads to a series of ecological and environmental problems [44], such as the overexploitation of natural resources, a reduction in ecological land, and the decline of ecological functions. Rapid urbanization not only reduces the ecosystem service supply in urban areas but also affects the energy flow and coupling of the ecosystem around the city [45]. Emphasis should be placed on strengthening the connections between the main urban areas of Lanzhou and Yuzhong County. With the increase in the area and number of ecological source areas, improved corridor connectivity can promote energy flow and species diffusion between the two cities.
As the primary units of urbanization, cities play a significant role in exploring important ecological functional areas and processes across the country and in constructing ecological security patterns. Therefore, studies have increasingly focused on city-scale assessment to explore ecological security patterns [39]. The spatial syntax index of the ecological corridor network is also significantly related to the internal flow function of the ecosystem. In Lanzhou, analysis combined with neural networks shows that the fitting effect of the neural network model for two ecological functions is good. Under the two-dependent-variable condition, population, GDP, and evapotranspiration are important factors affecting ecological functions. Therefore, targeted strategies must be adjusted based on different scenarios. For example, when the dependent variables are water yield and soil conservation, proximity to the center of the corridor can be strengthened to enhance the ecological service function. When the dependent variables are water yield and habitat quality, the selection centrality of the 100 km corridor can be strengthened to enhance ecological service functions. Therefore, different plans should be implemented based on the actual development needs of each region to effectively address the ecological and environmental challenges posed by rapid urbanization.
In the future, ecological management institutions should be established in urban and rural areas to coordinate the relevant objectives of ecological protection based on the current status of urban ecological protection and guide industrial transfer within these areas [46]. The spatial conflict between ecological protection and economic development can be addressed through the integration of landscape ecological spaces into industrial agglomeration spaces [13]. It is essential that we strengthen ecological compensation in highly sensitive ecological areas and coordinate urban ecological joint prevention and control from the perspective of spatial layout [47]. Optimizing the landscape pattern of urban and rural areas and jointly managing the environment is also crucial. Landscape planners and land managers need to consider the spatial scale of ecosystem service supply and demand, as well as the development and optimization of ecological resources and corridors. This approach can provide more ecosystem services, reduce the carbon footprint of a region, and benefit many more people [48]. The carrying capacity of the regional environment is an important limiting factor for the coordinated development of urban and rural areas [49]. Currently, China’s urban and rural areas are in a stage of rapid development, highlighting the need to address the environmental protection issues arising from the previous single-urban-development mode, improve the carrying capacity, and balance ecological protection with economic development [44]. The loss and degradation of ecosystem services threaten regional ecological security [50]. To improve the efficiency of urban and rural spatial use, many factors such as industry, spatial layout, and ecological corridors need to be considered [51]. An ecological security pattern is not only conducive to guiding the rational distribution of urban and rural areas but is also crucial for improving their resilience and sustainable development [52]. Building a large-scale ecological security pattern across administrative boundaries is of great significance for the comprehensive management of mountains, rivers, forests, fields, lakes, and grasslands [10]. Such an approach aids in the formulation of multi-level ecological security policies and the identification of the ecological space bottom line under stable urban economic and social development.

4.3. Deficiencies of Ecological Security Pattern Construction

Similarly, the construction of an ecological space network in urban and rural areas is equally important. Therefore, the connection between green spaces in urban development areas and external corridors requires further study. High-density urban development intensifies the vulnerability of the urban ecological environment. One mitigation measure is to identify and connect shady places in streets to form a “cool network”. For example, to adapt to climate change, New York City launched the Cool Neighborhoods NYC initiative in 2017, which aims to reduce heat vulnerability through infrastructure and community services, strengthen social networks, and mitigate the health impacts of heat [53]. Therefore, the large-scale ecological security pattern outside the city should be combined with the lower-level ecological network inside the city, allowing internal and external ecosystem services to operate harmoniously. In future studies, economic and social development factors should be incorporated to explore the construction of internal sources and corridor optimization in urban and rural areas, balancing ecosystem service supply and demand, to establish a joint prevention and control mechanism, and to strengthen the comprehensive management of urban and rural areas.

5. Conclusions

In this study, we identified the importance of ecosystem service functions in the urban and rural areas of Lanzhou City. Here, we delineated regional ecological sources and used hotspot analysis, minimum resistance models, and circuit theory to optimize ecological corridors, thereby establishing the ecological security pattern for these areas. By further combining space syntax and neural networks, the corridor pattern was optimized and analyzed, revealing various influencing factors, which were then cycled to enhance the corridor. Our study innovatively optimized the theoretical research framework for urban and rural regional ecological security patterns, providing practical applications for improving ecosystem service functions and optimizing the “ecology–production–life” space.
Our findings revealed a three-stage differentiation trend in the importance of ecosystem service functions. Nineteen important ecological sources were identified, covering an area of 4542.5 km2, accounting for 34.7% of the study area. A total of 217 corridors were optimized, encompassing a total length of 2657.3 km. The Gaolin Mountain area and Yuzhong County in the southeast exhibited high current density, whereas Honggu District and Yongdeng District in the northwest showed low current density. Ecological barrier areas were mainly distributed in the northwest of Lanzhou City, exhibiting dense distribution in the middle region and a more sparse distribution in the south of Yuzhong County. The spatial syntax index indicated significant potential reachability between Honggu District and the northwest area. In single-dependent-variable predictions, habitat quality showed the best fit, followed by water yield, with soil conservation showing a poor fit. In three-dependent-variable predictions, population factors had the greatest impact on ecosystem services, slope had the least impact, and space syntax indicators varied under different dependent variable conditions. Traffic elements in ecological corridors connect urban and rural areas. Green infrastructure in corridors, such as waterways, greenways, wetlands, parks, forests, farms, and other protected areas, can be built according to the influence of spatial syntax indicators, and ecological break points can be determined by combining the network of traffic facilities to repair their adverse effects. This can enhance ecological services and connectivity, to achieve overall environmental sustainability in both urban and rural areas.
Collectively, our findings highlight the need to strengthen green infrastructure in the northwest and southeast, enhance the connectivity of ecological corridors between the Lanzhou urban area and Yuzhong County, and focus on protecting and enhancing the ecological functions of ecologically sensitive areas in Honggu District. Different spatial corridor optimization strategies should be adopted according to varying ecological needs, and different ecological security patterns must be established based on different influencing factors. In other similar semi-arid-area cities, key ecological break points can be selected and corresponding regional ecological restoration strategies can be proposed in combination with the research framework and characterization indicators in this paper and the actual local geographical situation.

Author Contributions

X.W.: Conceptualization, Methodology, Writing—original draft, Writing—review and editing, Supervision. X.T.: Conceptualization, Writing—review and editing, Supervision. J.S.: Investigation, Software, Validation, Data Management. P.D.: Writing—review and editing, Supervision. All authors have read and agreed to the published version of the manuscript.

Funding

This work was supported by the Divergence of Transformation Paths and Planning Paradigms of Emerging Industrial Cities in Northwest China Led by the “156 Projects” of Soviet Aid to China (1949–2019) [52068040] and a grant for research on the landscape planning of tourism parks in cold and arid agricultural areas from the perspective of “rural revitalization” [2020035].

Institutional Review Board Statement

Not applicable.

Informed Consent Statement

Not applicable.

Data Availability Statement

Data are contained within the article.

Acknowledgments

Wang Xiyun and Shi Jin contributed equally to this work. We thank our teachers and group members for their guidance. We would also like to sincerely thank Tang Xianglong and his student group for their efforts.

Conflicts of Interest

The authors declare no conflicts of interest.

References

  1. Chau, P.H.; Chan, K.C.; Woo, J. Hot weather warning might help to reduce elderly mortality in Hong Kong. Int. J. Biometeorol. 2009, 53, 461–468. [Google Scholar] [CrossRef] [PubMed]
  2. Chen, J.; Wang, S.; Zou, Y. Construction of an ecological security pattern based on ecosystem sensitivity and the importance of ecological services: A case study of the Guanzhong Plain urban agglomeration. China Ecol. Indic. 2022, 136, 108688. [Google Scholar] [CrossRef]
  3. Chen, L.; Sun, R.; Sun, T.; Yang, L. Construction of ecological security pattern in urban agglomerations: Conceptual analysis and theoretical consideration. Acta Ecol. Sin. 2021, 41, 4251–4258. [Google Scholar]
  4. Ouyang, X.; Tang, L.; Wei, X.; Li, Y. Spatial interaction between urbanization and ecosystem services in Chinese urban agglomerations. Land Use Policy 2021, 109, 105587. [Google Scholar] [CrossRef]
  5. Chen, M.; Liu, W.; Lu, D. Challenges and the way forward in China’s new-type urbanization. Land Use Policy 2016, 55, 334–339. [Google Scholar] [CrossRef]
  6. Bongaarts, J. IPBES, 2019. Summary for policymakers of the global assessment report on biodiversity and ecosystem services of the Intergovernmental Science-Policy Platform on Biodiversity and Ecosystem Services. Popul. Dev. Rev. 2019, 45, 680–681. [Google Scholar] [CrossRef]
  7. Maron, M.; Mitchell, M.G.; Runting, R.K.; Rhodes, J.R.; Mace, G.M.; Keith, D.A.; Watson, J.E. Towards a Threat Assessment Framework for Ecosystem Services. Trends Ecol. Evol. 2017, 32, 240–248. [Google Scholar] [CrossRef] [PubMed]
  8. Ma, L.; Bo, J.; Li, X.; Fang, F.; Cheng, W. Identifying key landscape pattern indices influencing the ecological security of inland river basin: The middle and lower reaches of Shule River Basin as an example. Sci. Total Environ. 2019, 674, 424–438. [Google Scholar] [CrossRef]
  9. Kukkala, A.S.; Moilanen, A. Ecosystem services and connectivity in spatial conservation prioritization. Landsc. Ecol. 2016, 32, 5–14. [Google Scholar] [CrossRef]
  10. Fu, B.; Liu, Y. The theories and methods for systematically understanding land resource. Chin. Sci. Bull. 2019, 21, 2172–2179. [Google Scholar]
  11. Yu, K. Security patterns and surface model in landscape ecological planning. Landsc. Urban Plan. 1996, 4, 1–17. [Google Scholar] [CrossRef]
  12. Fu, B. Several Key Points in Territorial Ecological Restoration. Bull Chin. Acad. Sci. 2021, 36, 64–69. [Google Scholar]
  13. Dai, L.; Liu, Y.; Luo, X. Integrating the MCR and DOI models to construct an ecological security network for the urban agglomeration around Poyang Lake, China. Sci. Total Environ. 2021, 754, 141868. [Google Scholar] [CrossRef] [PubMed]
  14. Xiong, S.; Qin, C.; Yu, L.; Lu, L.; Guan, Y.; Wan, J.; Li, X. Methods to identify the boundary of ecological space based on ecosystem service functions and ecological sensitivity: A case study of Nanning city. Acta Ecol. Sin. 2018, 38, 7899–7911. [Google Scholar]
  15. Dong, J.; Peng, J.; Xu, Z.; Liu, Y.; Wang, X.; Li, B. Integrating regional and interregional approaches to identify ecological security patterns. Landsc. Ecol. 2021, 4, 2151–2164. [Google Scholar] [CrossRef]
  16. Gao, Q.; Fang, C.; Liu, H.; Zhang, L. Conjugate evaluation of sustainable carrying capacity of urban agglomeration and multi-scenario policy regulation. Sci. Total Environ. 2021, 785, 147373. [Google Scholar] [CrossRef] [PubMed]
  17. Huang, Q.; Peng, B.; Elahi, E.; Wan, A. Evolution and Driving Mechanism of Ecological Security Pattern: A Case Study of Yangtze River Urban Agglomeration. Integr. Environ. Assess. Manag. 2021, 17, 573–583. [Google Scholar] [CrossRef] [PubMed]
  18. Fang, C.; Yu, D. Urban agglomeration: An evolving concept of an emerging phenomenon. Landsc. Urban Plan. 2017, 162, 126–136. [Google Scholar] [CrossRef]
  19. Li, X.; Li, S.; Zhang, Y.; O’Connor, P.J.; Zhang, L.; Yan, J. Landscape Ecological Risk Assessment under Multiple Indicators. Land 2021, 10, 739. [Google Scholar] [CrossRef]
  20. Marlatt, W.E.; Budyko, M.I.; Miller, D.H. Climate and life. J. Range Manag. 1975, 28, 160. [Google Scholar] [CrossRef]
  21. Lu, L.; Ren, T.; Li, S.; Han, Y. Analysis on Spatio-temporal Variation of Water Supply in Dalian City Based on InVEST Model. Bull Soil Water Conserv. 2019, 39, 144–150. [Google Scholar]
  22. Dou, M. Spatio-Temporal Variation of Water Production Function and its Influencing Factors in Hengduan Mountain Region Based on InVEST Model. Ph.D. Thesis, Lanzhou Jiaotong University, Gansu, China, 2018. [Google Scholar]
  23. Wischmeier, W.H.; Smith, D.D. Predicting Rainfall-Erosion Losses from Cropland East of the Rocky Mountains; Department of Agriculture: Washington, DC, USA, 1965.
  24. Williams, J.R. The erosion-productivity impact calculator (EPIC) model: A case history. Philos. Trans. R. Soc. London. Ser. B Biol. Sci. 1990, 329, 421–428. [Google Scholar] [CrossRef]
  25. Zhang, K.L.; Shu, A.P.; Xu, X.L.; Yang, Q.K.; Yu, B. Soil erodibility and its estimation for agricultural soils in China. J. Arid Environ. Regul. 2008, 72, 1002–1011. [Google Scholar] [CrossRef]
  26. Zhang, Y.; Yuan, J.; Liu, B. Advance in researches on vegetation cover and management factor in the soil erosion prediction model. Ying Yong Sheng Tai Xue Bao J. Appl. Ecol. 2002, 13, 1033–1036. [Google Scholar]
  27. Yang, Z. Study on Soil Loss Equation of Cultivated Slopeland in Northeast Mountain Region of Yunnan Province. Bull. Soil Water Conserv. 1999, 19, 1–9. [Google Scholar]
  28. Liu, Q.; Zhao, Y.; Zhang, X.; Buyantuev, A.; Niu, J.; Wang, X. Spatiotemporal Patterns of Desertification Dynamics and Desertification Effects on Ecosystem Services in the Mu Us Desert in China. Sustainability 2018, 10, 589. [Google Scholar] [CrossRef]
  29. Xie, Y. Temporal and Spatial Changes of Ecosystem Services in Bailong River Basin, Gansu Province based on InVEST Model; Lanzhou University: Gansu, China, 2015. [Google Scholar]
  30. Xu, B.; Liu, Y.; Dong, Y.; Zhu, G.; Zhang, Y.; Lu, Z.; Zou, S. Habitat quality assessment in Lanzhou area based on InVEST model. J. Desert Res. 2019, 41, 120–129. [Google Scholar]
  31. Knaapen, J.P.; Scheffer, M.; Harms, B. Estimating habitat isolation in landscape planning. Landsc. Urban Plan. 1992, 23, 1–16. [Google Scholar] [CrossRef]
  32. Huang, L.; Wang, J.; Fang, Y.; Zhai, T.; Cheng, H. An integrated approach towards spatial identification of restored and conserved priority areas of ecological network for implementation planning in metropolitan region. Sustain. Cities Soc. 2021, 69, 102865. [Google Scholar] [CrossRef]
  33. McRae, B.H.; Dickson, B.G.; Keitt, T.H.; Shah, V.B. Using circuit theory to model connectivity in ecology, evolution, and conservation. Ecology 2008, 89, 2712–2724. [Google Scholar] [CrossRef]
  34. Peng, J.; Yang, Y.; Liu, Y.; Du, Y.; Meersmans, J.; Qiu, S. Linking ecosystem services and circuit theory to identify ecological security patterns. Sci. Total Environ. 2018, 644, 781–790. [Google Scholar] [CrossRef] [PubMed]
  35. Brede, M. Networks—An Introduction; Newman, M.E.J., Ed.; Oxford University Press: Oxford, UK, 2012; 772p, ISBN-978-0-19-920665-0. [Google Scholar]
  36. Patuelli, R.; Reggiani, A.; Nijkamp, P.; Schanne, N. Neural networks for regional employment forecasts: Are the parameters relevant? J. Geogr. Syst. 2011, 13, 67–85. [Google Scholar] [CrossRef]
  37. Hooper, T.; Beaumont, N.; Griffiths, C.; Langmead, O.; Somerfield, P.J. Assessing the sensitivity of ecosystem services to changing pressures. Ecosyst. Serv. 2017, 24, 160–169. [Google Scholar] [CrossRef]
  38. Rao, Y.; Dai, J.; Dai, D.; He, Q.; Wang, H. Effect of Compactness of Urban Growth on Regional Landscape Ecological Security. Land 2021, 10, 848. [Google Scholar] [CrossRef]
  39. Peng, J.; Zhao, H.J.; Liu, Y.X.; Wu, J.S. Research progress and prospect on regional ecological security pattern construction. Geogr. Res. 2017, 4, 407–419. [Google Scholar]
  40. Peng, J.; Liu, Y.; Corstanje, R.; Meersmans, J. Promoting sustainable landscape pattern for landscape sustainability. Landsc. Ecol. 2021, 36, 1839–1844. [Google Scholar] [CrossRef]
  41. Patten, D.T. The role of ecological wisdom in managing for sustainable interdependent urban and natural ecosystems. Landsc. Urban Plan. 2016, 155, 3–10. [Google Scholar] [CrossRef]
  42. Pena, S.B.; Abreu, M.M.; Teles, R.; Espírito-Santo, M.D. A methodology for creating greenways through multidisciplinary sustainable landscape planning. J. Environ. Manag. 2010, 91, 970–983. [Google Scholar] [CrossRef] [PubMed]
  43. Teng, M.; Wu, C.; Zhou, Z.; Lord, E.; Zheng, Z. Multipurpose greenway planning for changing cities: A framework integrating priorities and a least-cost path model. Landsc. Urban Plan. 2011, 103, 1–14. [Google Scholar] [CrossRef]
  44. Chuanglin, F. Construction of urban agglomerations and metropolitan areas in China under the new development pattern. Econ. Geogr. 2021, 41, 1–7. [Google Scholar]
  45. Zhu, Y.G.; Reid, B.J.; Meharg, A.A.; Banwart, S.A.; Fu, B.J. Optimizing Peri-URban Ecosystems (PURE) to re-couple urban-rural symbiosis. Sci. Total Environ. 2017, 586, 1085–1090. [Google Scholar] [CrossRef] [PubMed]
  46. Ren, Y.; Fang, C.; Lin, X.; Sun, S.; Li, G.; Fan, B. Evaluation of the eco-efficiency of four major urban agglomerations in coastal eastern China. J. Geogr. Sci. 2019, 29, 1315–1330. [Google Scholar] [CrossRef]
  47. Yang, Y.; Cai, Z. Ecological security assessment of the Guanzhong Plain urban agglomeration based on an adapted ecological footprint model. J. Clean. Prod. 2019, 260, 120973. [Google Scholar] [CrossRef]
  48. Baro, F.; Gomez-Baggethun, E.; Haase, D. Ecosystem service bundles along the urban-rural gradient: Insights for landscape planning and management. Ecosyst. Serv. 2017, 24, 147–159. [Google Scholar] [CrossRef]
  49. Chuanglin, F.; Xuegang, C.; Longwu, L. Coupling loop theory and coupler regulation between urbanization and ecological environment. Acta Geogr. Sin. 2019, 74, 2529–2546. [Google Scholar]
  50. Bojie, F.; Hanqin, T.; Fulu, T.; Zhao, W.W.; Wang, S. Progress of the impact of global change on ecosystem services. Basic Sci. China 2019, 22, 25–30. [Google Scholar]
  51. Fang, C. The basic law of the formation and expansion in urban agglomerations. J. Geogr. Sci. 2019, 29, 1699–1712. [Google Scholar] [CrossRef]
  52. Yaoyao, C.; Zhijun, L.; Song, Q. Construction of ecological security pattern based on ecological sensitivity and ecological network in Nanchang City. Res. Soil Water Conserv. 2021, 28, 342–349. [Google Scholar]
  53. Zhang, L.Z.; Qing, A.L.; Cui, M.Y.; Zeng, W.X. Between the In-between: A Design Study of “Cool Network” Based on 3D Accessibility. J. Landsc. Archit. 2022, 29, 109–114. [Google Scholar]
Figure 1. Overview of the study area 1. (a) Study location, (b) land use and land cover, and (c) study location elevation (in meters).
Sustainability 16 06177 g001
Figure 2. Research framework 2.
Sustainability 16 06177 g002
Figure 3. Neural network framework.
Sustainability 16 06177 g003
Figure 4. Ecosystem service function importance assessment for ecosystem services 3. (a) represents water yield, (b) represents habitat quality, (c) represents soil conservation, and (d) symbolizes the result weighted by the importance of ecological services.)
Sustainability 16 06177 g004
Figure 5. Evaluation and classification of ecosystem service importance.
Sustainability 16 06177 g005
Figure 6. Analysis of hotspots in important ecological source areas.
Sustainability 16 06177 g006
Figure 7. Analysis of ecological resistance surface 4.
Sustainability 16 06177 g007
Figure 8. Corridor optimization based on MCR model. (a) shows the ecological corridor before the optimization, and (b) shows the optimized ecological corridor.
Sustainability 16 06177 g008
Figure 9. Ecological security pattern optimized based on circuit theory.(a) represents the optimized ecological corridor; (b) represents the ecological barrier point; (c) represents the ecological grip point; (dg) represent the key areas.
Sustainability 16 06177 g009
Figure 10. Corridor space syntax analysis under different analysis radii 5. (ac) represent MED at different analysis radii; (df) represent BTE at different analysis radii.
Sustainability 16 06177 g010
Figure 11. Neural network analysis (note: (ac) are single-dependent-variable predictions; (di) are bivariate predictions; and (jl) are trivariate predictions).
Sustainability 16 06177 g011
Figure 12. Importance analysis of neural networks. (ac) represent the effects of water yield, soil retention, and habitat quality; (df) represent the effects of water yield and soil retention, water yield and habitat quality, habitat quality, and soil retention; (g) indicates the effects of three functions.
Sustainability 16 06177 g012
Table 1. Sources of data 1.
Dataset NameData SourceIndicator Factor
Administrative division dataResources and Environmental Science and Data CenterStudy area scope
Annual 30 m land cover products in ChinaProfessor Huang Xin’s team at Wuhan University, interpreted based on Landsat imagesLand use
ASTER GDEM v3NASADEM
China’s monthly potential evapotranspiration datasetNational Tibetan Plateau Scientific Data CenterPotential evapotranspiration
Chinese Soil Dataset from the World Soil Database (HWSD) (V1.1)National Tibetan Plateau Scientific Data CenterOrganic carbon content
Soil organic matter dataset in ChinaSpatiotemporal three-level environmental big data platformOrganic matter content
Monthly precipitation data for ChinaNational Tibetan Plateau Scientific Data CenterAverage annual precipitation
NDVI data
Population raster data
GDP data
China soil erosion factor K
Resource Environmental Science and Data Center
WorldPop
Scientific Data
National Tibetan Plateau Scientific Data Center
Vegetation Index
Population
GDP
Soil erosion factor K
Table 2. Resistance surface weights 2.
Drag FactorWeight ValueDrag Coefficient
HighHigherEqualLowerLow
land use0.370061002015105
plant0.218231007040205
dem0.14405806040205
slope0.267659060402010
Table 3. Model R square 3.
Dependent VariableR2Dependent VariableR2Dependent VariableR2Dependent VariableR2
Water yield0.502Water yield, soil conservation, habitat quality0.493 (habitat quality)Habitat quality, water yield0.664 (Habitat quality)Habitat quality, soil conservation0.278 (soil conservation)
Soil conservation0.241Water yield, soil conservation, habitat quality0.913 (water yield)Habitat quality, water yield0.941 (water yield)Water yield, soil conservation0.796 (water yield)
Habitat quality0.556Water yield, soil conservation, habitat quality0.530 (soil conservation)Habitat quality, soil conservation0.523 (Habitat quality)Water yield, soil conservation0.351 (soil conservation)
Disclaimer/Publisher’s Note: The statements, opinions and data contained in all publications are solely those of the individual author(s) and contributor(s) and not of MDPI and/or the editor(s). MDPI and/or the editor(s) disclaim responsibility for any injury to people or property resulting from any ideas, methods, instructions or products referred to in the content.

