Article

Forecasting Future Vegetation Dynamics under SSP/RCP Pathways under Spatially Changing Climate and Human Activities Conditions

1
Hubei Water Resources Research Institute, Wuhan 430070, China
2
Hubei Soil and Water Conservation Engineering Research Center, Wuhan 430070, China
3
College of Resources and Environment, Huazhong Agricultural University, Wuhan 430070, China
*
Author to whom correspondence should be addressed.
Sustainability 2024, 16(14), 6188; https://doi.org/10.3390/su16146188
Submission received: 14 May 2024 / Revised: 25 June 2024 / Accepted: 13 July 2024 / Published: 19 July 2024
(This article belongs to the Section Sustainable Forestry)

Abstract

:
Vegetation dynamics result from the interaction between human activities and climate change. Numerous studies have investigated the contributions of human activities and climate change to vegetation cover dynamics using statistical methods. However, these studies have not focused much on the spatially non-stationary effects of human activities on vegetation cover changes and future trends. Taking the Three Gorges Reservoir (TGR) area as the case study area, it was divided into 32 combinations by considering the spatially varying effects of five factors related to human activity and climate change, including gross domestic product (GDP), population, land use change, precipitation, and temperature. Regression in terms of pixels was then performed for each combination at the pixel scale. The result showed that from 2001 to 2020, the annual average normalized digital vegetation index (NDVI) in the TGR area exhibited an upward trend (slope = 0.0051, p < 0.01), with the mean NDVI increasing from 0.53 to 0.64. Compared with the regression with climate variables, the proposed model improved the R 2 value from 0.2567 to 0.6484, with the p-value in the t-test reduced from 0.2579 to 0.0056. It indicated that changes in vegetation were dominated by human activities and climate change in 48.77% and 3.19% of the TGR area, respectively, and 43.70% of the vegetation coverage was dominated by both human activities and climate change. This study also predicted the future NDVI according to the shared socioeconomic pathways (SSPs) and representative concentration pathway (RCP) scenarios provided by the Intergovernmental Panel on Climate Change. It suggests that, assuming future regional policies are the same as the historical policies in the TGR, the SSP5–8.5 scenario would have the highest and fastest growth in average NDVI, with the average NDVI increasing from 0.68 to 0.89, because of the large increase in the GDP, lower population in this scenario, and adequate hydrothermal conditions.

1. Introduction

Vegetation coverage stands as a critical determinant, shaping the intricate dynamics of the terrestrial ecosystem [1,2], and is significantly contributable to the global cycles of carbon, water, and energy [3,4,5]. Globally, satellites have detected a discernible greening signal on Earth across the previous 35 years [6,7]. Similar research outcomes were academically affirmed within the context of China [8,9]. As reported, the vegetation in China has shown a growing trend since the 1980s [10]. Simultaneously, urban areas experience vegetation degradation [11]. It is believed that both climate change and human activity are synergistically responsible for the dynamic alterations in vegetation [12].
The impact of climate change on vegetation cover has always been a hot topic in international environmental change research. Through long-term observations and model analysis, researchers around the world have revealed the various impacts of climate change on vegetation cover, growth cycle, distribution of vegetation types, and ecosystem functions [13,14]. With global warming, terrestrial ecosystems are undergoing significant changes, and vegetation coverage is increasing comprehensively [15]. For example, Li et al.’s research pointed out that climate warming in China has also promoted vegetation growth, but its impact on vegetation growth exhibits significant spatial heterogeneity, with a promoting effect in the eastern monsoon region and less obvious effects in the arid and semi-arid areas in the northwest [16]. This indicates that climate change has spatial heterogeneity in its impact on vegetation dynamics, meaning that there are significant differences in the response of vegetation in different regions to climate fluctuations.
In recent years, more and more evidence has shown that it is insufficient to assess changes in vegetation cover solely from the perspective of climate change. Since the 1980s, about 3% of global vegetation distribution has been altered by human activities, and human-induced changes in vegetation have occurred worldwide [17]. Human activities have directly or indirectly altered the types of land cover, affecting vegetation distribution and ecosystem services. China has implemented a comprehensive array of expansive ecological policies aimed at addressing environmental challenges and promoting sustainable resource management, such as the Grain for Green Program (GGP) and the Natural Forest Protection Program (NFPP) [18,19], which are thought to have beneficial impacts on the dynamics of vegetation coverage [20]. For example, the establishment of the China Nature Reserve’s Three River Source Region and the implementation of the Ecological Protection and Restoration Project (EPRP) have greatly enhanced the amount of vegetation. From 2001 to 2018, the enhanced vegetation index (EVI) significantly increased in about 26.02% of the region [21] owing to ecological restoration and vegetation greening of karst landforms in southwestern China, where the contribution of human factors increased from 65% to 77% [22].
At the same time, China has been experiencing a rapid urbanization process, with urban land expansion and farmland expansion [23,24,25]. A study reported a global net loss of 0.8 million k m 2 of forest area and an increase in the area used for agriculture worldwide (i.e., 1.0 million k m 2 of cropland and 0.9 million k m 2 of pasture/rangeland) from 1960 to 2019 [26]. In China, a large amount of cropland has been expanded by encroaching on grasslands and forests to compensate for the disappearance of cropland caused by urbanization [27]. Furthermore, Sun et al. [28] found that peri-urban vegetation degradation ensued as a consequence of the accelerated urbanization process, marked by the quick growth of towns and cities in the Haihe River Basin, China. Several studies revealed that the urbanization intensity in the majority of urban agglomerations in China demonstrated an inverse correlation with the normalized digital vegetation index (NDVI), as evidenced by scholarly investigations (Zheng et al. [20], Liu et al. [29]; Luo et al. [30]; Zhang et al. [31]). According to these studies, China’s vegetation coverage is negatively impacted by human activities.
The influence of human activities on changes in vegetation cover is intricate and multifaceted, with both positive and negative impacts occurring simultaneously. Owing to the absence of extended long time series and grid-scale human activity data, currently, researchers evaluate human activities’ contributions to vegetation coverage by residual analysis based on long-term climate change and vegetation cover change datasets and their relationship [32]. Some studies have used comparison methods for different phases [33,34,35] to quantify the contributions made by different human activities to the vegetation coverage. Some studies have adopted county-level statistical data to quantify human activities and their impacts on county-level average vegetation coverage changes [36,37]. In summary, existing studies have confirmed that changes in vegetation are significantly impacted by human activities, in addition to climate change [38,39]. However, these methods ignore either the different contributions of individual human activities or the spatially varying consequences of human activities.
The spatial heterogeneity of human activities makes it challenging to quantify how changes in vegetation cover are caused by human activities. Human activities, like the increase in population, urban expansion, economic development, and ecological restoration, possess a considerable degree of spatial variability [40]. These human activities have spatially varying impacts on air pollution, biological diversity, and the greening of vegetation [21,22]. Researchers have realized and quantified the dynamics of vegetation in different spatial locations and the impacts of climate variables on vegetation changes that vary across space [41]. For example, Lei and Peters [42] used a spatial regression technique to investigate the link between climatic factors and NDVI in the northern Great Plains of the United States (1989–1993). Similar studies were conducted in China. For example, Gao et al. [43] used the geographically weighted regression model to investigate the spatial distribution, dynamic properties, and responsiveness of the NDVI to climate factors from 1982 to 2013.
Although many scholars have declared and presented the spatially varied effects of climate change on vegetation alterations, not much research has been conducted to amplify human activities’ spatially varying impacts on vegetation dynamics at the pixel scale and in a long-term framework. To face this gap, it is essential to disentangle the individual impacts of all types of human activities, for example, managing land usage, developing ecological programs and population growth, on the vegetation coverage by considering their spatially varying impacts on vegetation changes. Furthermore, because the system is full of spatial heterogeneity, challenges exist in forecasting future green cover trends. Some studies have forecasted future vegetation changes by considering climate change and global warming [44,45] or using historical temporal trends [20].
This study aimed to fill these research gaps by considering an important ecological source region, the Three Gorges Reservoir (TGR) area in China, as a case study, which has experienced spatially varying human activities, such as vegetation restoration projects, urbanization, cropland increase, economic development, and population growth. This study aims to (1) reveal the spatially changing vegetation coverage trends in this complex system, (2) quantify the contributions of individual human activities and climate factors to vegetation changes by considering spatial heterogeneity, and (3) predict future vegetation changes under various climatic conditions and socioeconomic development scenarios. The results of this investigation will offer a theoretical framework for developing vegetation restoration policies to achieve sustainable regional development in China.

2. Study Area and Data Sources
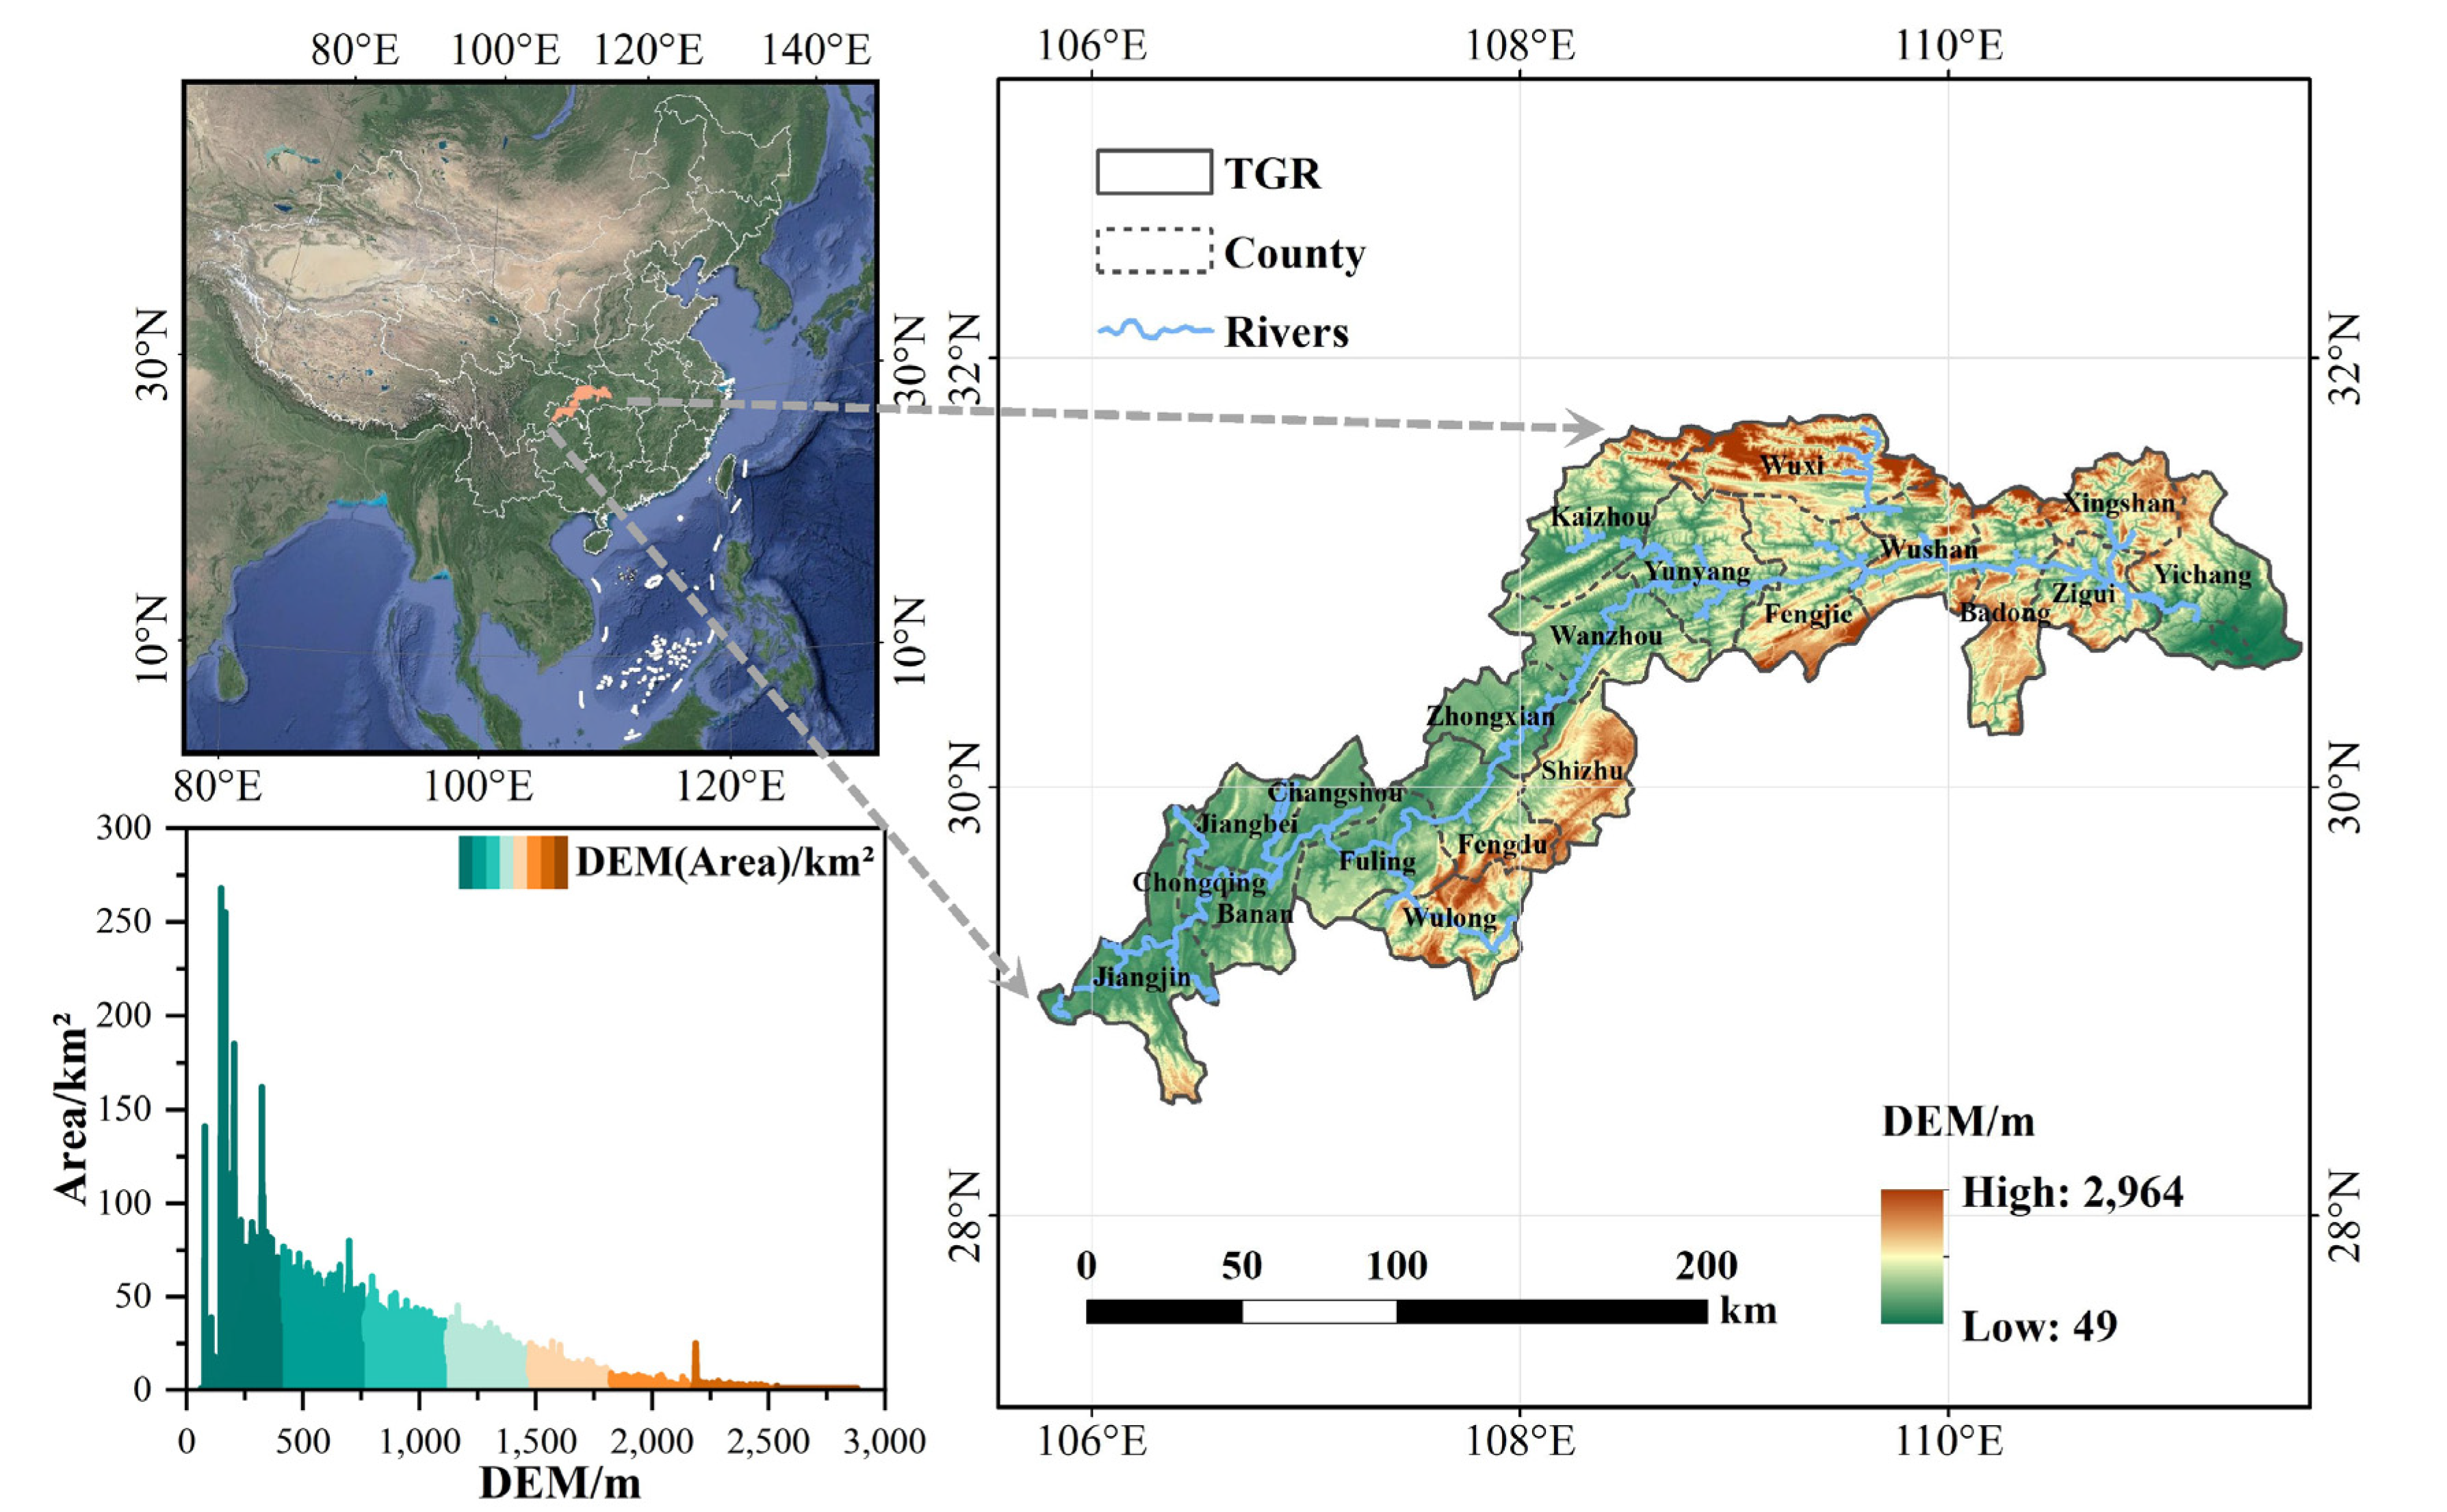
2.1. Study Area

The TGR area is located at the junction of Hubei Province and Chongqing City in China (Figure 1), with an area of approximately 58,000 k m 2 and having a total of 26 districts and counties. According to the seventh national population census, the total population of the TGR area was 22.26 million in 2020 [46]. The TGR area experiences a subtropical monsoon, with rainy summers and dry winters [47]. It is a typical mountainous river reservoir area with complex terrain and diverse landforms. The eastern part of the reservoir is covered by high and steep mountains, whereas the western part is covered by hills and plains [48]. The TGR region is abundant in diverse natural assets, encompassing a variety of ecosystems and environmental riches, and has high biodiversity. There are 6088 species of vascular plants in a diverse forest structure [49].
In the TGR area, both adverse and beneficial effects on vegetation coverage caused by humans exist. As an important ecological source area, the Chinese government has initiated expansive ecological conservation projects, exemplified by the GGP in the area, with the primary aim of alleviating regional soil erosion problems [50]. From 1999 to 2016, the GGP area in the TGR area achieved 2118.47 k m 2 , which reduced the area of soil erosion by 2196 k m 2 [51]. However, with improvements in local economic levels, the construction of dams, reservoir impoundment, and rapid urbanization that have unfolded in the TGR area [52], human activities have also had a number of detrimental effects on vegetation covering. The urban land in the reservoir area increased from approximately 304.07 k m 2 in 1995 to 1830.48 k m 2 by 2020 [53]. In the period spanning 1995 to 2015, residential land expansion led to the conversion of approximately 234 k m 2 of paddy fields, 275 k m 2 of dry land, 69 k m 2 of forest land, and 32 k m 2 of grassland [54,55].

2.2. Data Sources and Process

This study incorporated multiple datasets, with a first emphasis on the NDVI datasets obtained from MODIS. MODIS-MOD13Q1 for the TGR area was used to present the dynamics of vegetation [56]. The data had a temporal resolution of 16 d and a spatial resolution of 250 m, covering the years 2001 to 2020. The data are available on the official USGS website (https://lpdaac.usgs.gov/, accessed on 1 September 2022) with two images of h27v05 and h27v06 being downloaded. The data were preprocessed by format conversion, projection, resampling, and clipping to obtain the monthly average NDVI and then synthesized into the annual mean NDVI.
The dataset containing the spatial distribution of climate factors, including the monthly average temperature (with a unit of 0.1 °C) and monthly average precipitation (with a unit of 0.1 mm), was obtained from the National Tibetan Plateau Data Center for the period 2001–2020, with a spatial resolution of 0.0083333° (~1 km) (https://data.tpdc.ac.cn/home, accessed on 10 September 2022) [57]. The annual mean precipitation (Pre) and temperature (Tem) were calculated from the monthly dataset using Python 3.7.
The datasets of gross domestic product (GDP), population density, and land use change were also collected to represent human activities. GDP represents the total value of all goods and services produced within a country’s borders in a specific time period, serving as a key indicator of a nation’s socioeconomic development level [58]. The GDP dataset on the pixel level with a 1 km resolution from 2000 to 2019 was obtained from https://doi.org/10.6084/m9.figshare.17004523.v1, accessed on 15 September 2022 [59], which was calibrated by the actual growth in nighttime light data. This dataset was used and verified based on previous studies [60]. Furthermore, by referring to the exchange rate between CNY and USD in 2017 (the average exchange rate for the year was USD 1 to CNY 6.7518), the GDP dataset was converted into millions of CNY using a grid calculator. Because the data for 2020 were not provided, we first collected the GDP growth rate for districts and counties in the TGR area using statistical data for 2020 and 2019, and the growth rate for each district or county was multiplied by the spatial distribution of the GDP value for 2019 to achieve the GDP value for 2020. To ensure the accuracy of the datasets, we extracted the annual changing trend of GDP from 2001 to 2020 from the statistical yearbooks and then adjusted the grid GDP dataset with the annual changing trend.
The spatial distribution of population density (Pd) data was obtained from the LandScan Global 2019 dataset of the Oak Ridge National Laboratory (https://landscan.ornl.gov/, accessed on 15 September 2022) [61]. The LandScan datasets provide an ambient population count with a resolution of 30 arcseconds (~1 k m 2 ). To ensure the accuracy of the datasets, we calculated the trend of population changes from 2001 to 2020 using statistical yearbooks and then adjusted the Landscan data with the trends.
The land use data of MCD12Q1 were retrieved from https://ladsweb.modaps.eosdis.nasa.gov/, accessed on 20 September 2022, which encompassed 17 distinct land use types, with a spatial resolution of 500 m [62]. To focus on the vegetation coverage, we reclassified the 17 original types of land use into four major classes: forest, grassland, cropland, and built-up land. Many studies have considered the vegetation coverage in different land uses. For example, Du et al. [63] focused on the vegetation cover changes in the urban areas in China and showed that the average NDVI for all urbanized areas of all cities significantly decreased. Similarly, the vegetation coverage in other land uses, such as forest [64] and grassland [65], has been widely studied. Therefore, by referring to existing studies, we built an index of Mixed Coverage Dynamics (MCD) to reflect the potential impact of land use on vegetation coverage. Based on the vegetation coverage on the major land uses proposed by existing studies, weights of 1, 0.8, 0.5, and 0.2 were assigned for forests, grasslands, farmland, and built-up land, respectively. Because there are no permanent wetlands, permanent snow and ice, or barren areas in the TGR and the water body does not include vegetation, we combined these land uses into one type and assigned a weight of 0.
  M C D n ( i , j ) = s u m ( W u ) 4
where M C D n ( i , j ) is an index to reflect the impact of land use on the vegetation coverage in the nth year with a resolution of 1 km; u is a scale for the location of ( ( i 1 ) × 2 + 1 , ( j 1 ) × 2 + 1 ) , ( ( i 1 ) × 2 + 1 , ( j 1 ) × 2 + 2 ) , ( ( i 1 ) × 2 + 2 , ( j 1 ) × 2 + 1 ) , and ( ( i 1 ) × 2 + 2 , ( j 1 ) × 2 + 2 ) in the land use dataset with a resolution of 500 m; W u is the weight at the location according to land uses, with a resolution of 500 m. See Table 1.

3. Methods

3.1. Disentangling the Human and Climate Contributions

3.1.1. Slope Analysis and Correlation Analysis

Slope analysis via the linear regression model was used to represent the long-term trends of vegetation coverage in the TGR area [12,18,68]. Correlation analysis was applied to conduct an analysis of the correlation between the annual average NDVI and annual average various factors, including annual average GDP, population density, Mixed Coverage Dynamics, temperature, and precipitation, at each grid point [69,70,71].

3.1.2. Multivariate Linear Regression Analysis for Different Combinations

Usually, a spatially constant regression is used to identify the repercussions of anthropogenic activities and climatic shifts on alterations in vegetation patterns. In regions with coupled human and natural systems, some places are impacted merely by climate or by human activities, while others are affected by both climate and humans. Therefore, a spatially varying multivariate regression analysis was conducted at the pixel scale.
We identified combinations of all factors at the grid scale. Specifically, the Pearson correlation coefficient was calculated for the NDVI and each factor at the pixel scale. Only the drivers that were significantly associated with NDVI (p < 0.05) were selected to make sure the selected variables were statistically correlated and significant.
Finally, to address the potential multi-collinearity problem, the selected variables were evaluated by the variance inflation factor (VIF). Every variable with a VIF higher than 10 was removed from the combination [72,73,74]. This process does not occur if the VIF of each variable is less than 10. Thus, the multi-collinearity problem in the regression can be reduced to some extent. Multivariate regression analysis was conducted on each grid with the combinations as independent variables.

3.1.3. Contribution Disentangling

The contributions of climate factors (Pre and Tem) and human activities (GDP, Pd, and MCD) to changes in NDVI were calculated by pixel-scale varying multivariate regression using MATLAB R2020b. To determine each factor’s contribution, the following equation was utilized [37]:
θ s l o p e = C P r e + C T e m + C G D P + C P d + C M C D + e
                                                                                                  ( N D V I P r e ) × ( P r e n ) + ( N D V I T e m ) × ( T e m n ) + ( N D V I G D P ) × ( G D P n ) + ( N D V I P d ) × ( P d n ) ! + ( N D V I M C D ) × ( M C D n ) + e
where θ s l o p e is the long-term NDVI trend at grid level; C P r e , C T e m , C G D P , C P d , and C M C D are the contributions of precipitation, temperature, GDP, population growth, and land use changes to annual NDVI changes in the TGR area, respectively; n is the number of study periods, which is 20 years in this study. The contribution of each factor can be calculated by N D V I P r e × P r e n , N D V I T e m × T e m n , N D V I G D P × G D P n , N D V I P d × P d n , and N D V I M C D × M C D n where N D V I P r e , N D V I T e m , N D V I G D P , N D V I P d , and N D V I M C D are the slopes of multivariate linear regression between NDVI and variables; P r e n , T e m n , G D P n , P d n , and M C D n can be considered as the slopes of linear regression for variables against time at the pixel scale [9,18,37]; e represents the system error when estimating the contributions using Equation (3), which includes the contributions of factors that are not involved in the regression.

3.2. Building Future Scenarios According to RCP/SSP

To predict future vegetation changes, future scenarios with socioeconomic development, including GDP growth, population, and Land Use and Land Cover (LULC) along with climate change, were assigned. As the Intergovernmental Panel on Climate Change released five shared socioeconomic pathways (SSP) storylines [75,76]. Therefore, this study sets future scenarios within the framework of SSP scenarios, including SSP1–2.6, SSP2–4.5, and SSP5–8.5. Previous research included thorough explanations of SSP scenarios. SSP1–2.6 outlines sustainable development and climate goals via global cooperation, technology, and green growth, successfully mitigating climate change [77]. SSP2–4.5 depicts stable population growth, with efforts to tackle climate change via energy efficiency, cleaner sources, and policies [75,78]. SSP5–8.5 predicts a future reliant on fossil fuels with limited mitigation, leading to increased temperatures and profound impacts on nature and society [79]. For socioeconomic development, future GDP and population datasets were obtained from the SSP Public Database (Version 2.0) (https://tntcat.iiasa.ac.at/SspDb, accessed on 1 October 2022), which presents national changes in GDP and the population of China every five years from 2020 to 2070. We calibrated the data using local historical data according to Equations (4) and (5):
C n k = x n k x n k 1
y n k , i , j = y n k 1 , i , j × C n k
where C n k is the increasing rate of national data for the n t h SSPs storyline in the k t h year; x n k represents the GDP value of the population in the storyline and specific year for the whole of China; y n k , i , j represents the GDP value or population at the spatial grid of location ( i , j ) for the TGR area.
For the LULC dataset, the Land Use Harmonization (LUH2) provides future land use patterns under the SSP and representative concentration pathway (RCP) framework, sourced from http://luh.umd.edu/, accessed on 10 October 2022. However, the LUH2 dataset maintains a coarse spatial resolution, which is difficult to use at the urban level. Therefore, we used a dataset derived from LUH2 (Liao et al. [80]) with a resolution of 1 km and six land use types for 2015–2100 under the SSP-RCP scenarios.
For future climate change, global circulation models (GCMs) under the Coupled Model Intercomparison Project phase 6 (CMIP6) [81,82] were selected as the future data source. Table 2 lists basic information, including the institution or country and the resolution of the six GCMs from the CMIP6. To standardize the resolution of GCMs with historical observational data, a bilinear interpolation method was employed. This method facilitated the interpolation of historical meteorological grid data and GCMs data at a resolution of 0.05°. A robust empirical quantile mapping (RQUANT) method was used to calibrate the GCM data, based on historical meteorological grid data [83]. The calibration results were resampled into grid data at a resolution of 0.0083333° (~1 km). Finally, the average values of the six GCMs were calculated using a multi-model ensemble (MME) [84] to reduce uncertainty, and the final future climate grid data were obtained for the TGR area.

4. Results

4.1. Temporal Changing Trends for Vegetation Cover in the TGR Area

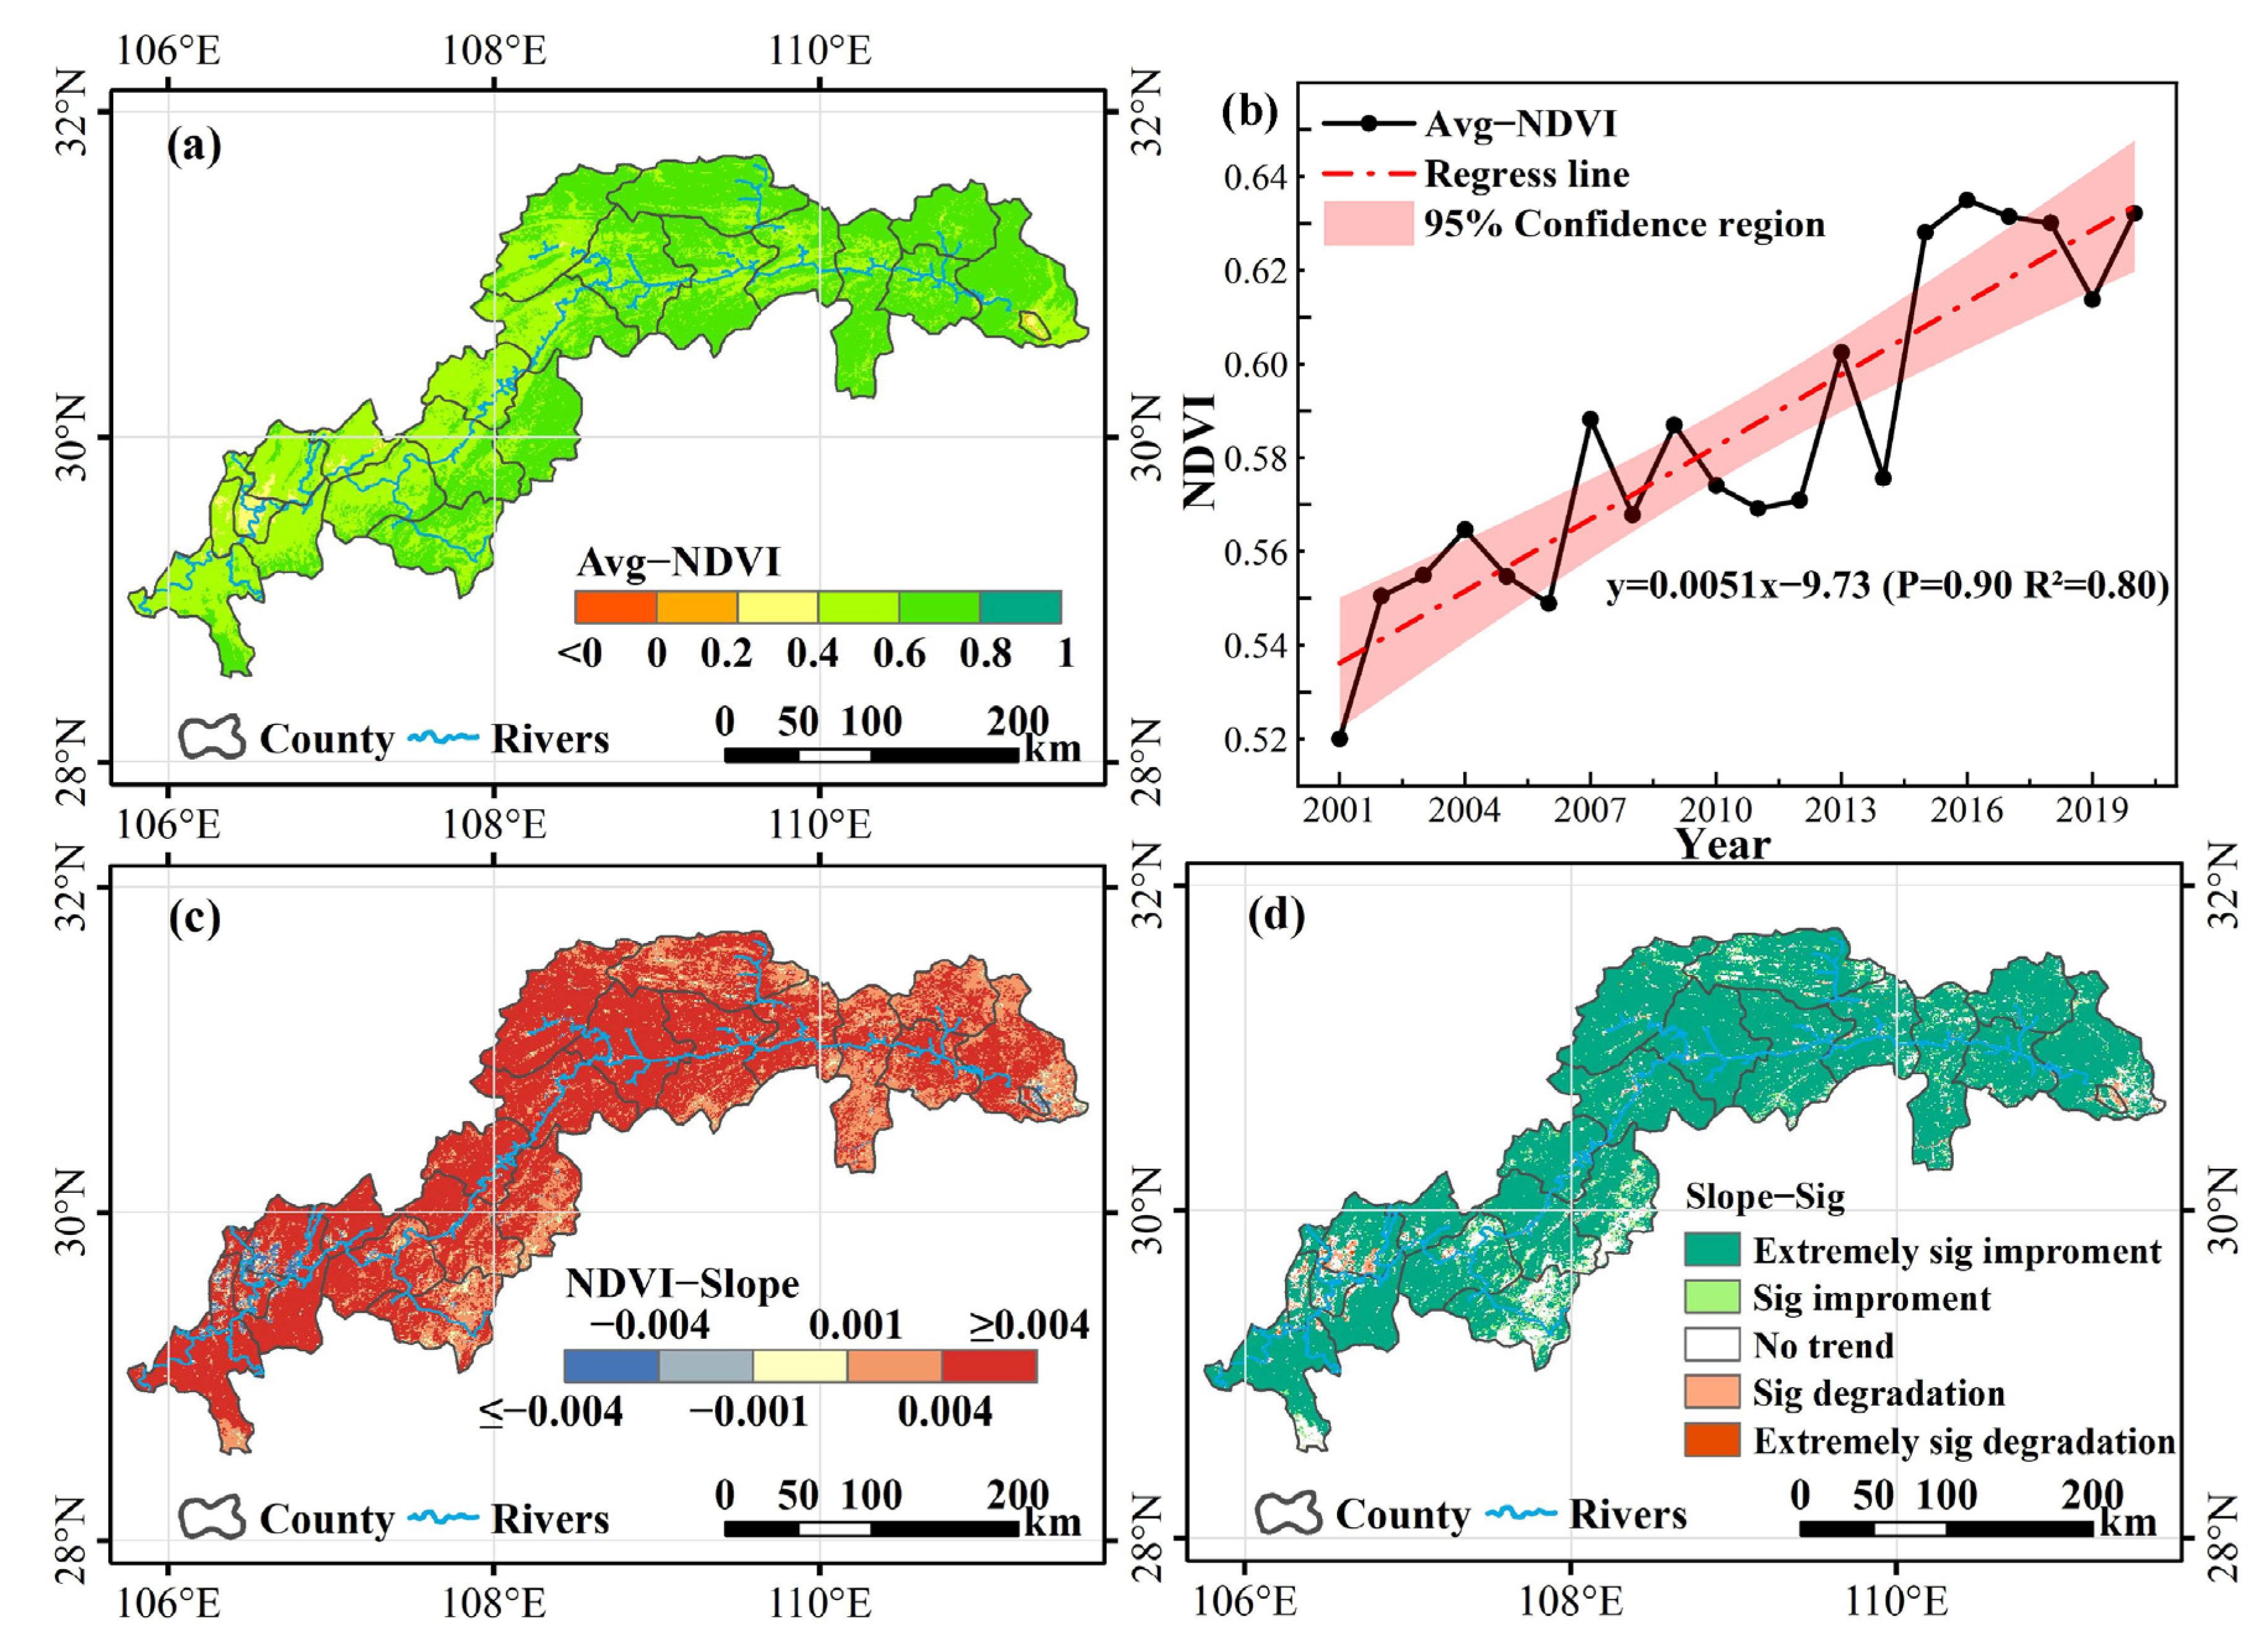
4.1.1. Temporal Trends of Changes in NDVI in the TGR Area from 2001 to 2020

The TGR area’s NDVI displayed a notable rising trend over time, from 2001 to 2020. Specifically, from 0.53 in 2001 to 0.64 in 2020, the yearly average NDVI grew, representing a 20.75% increase. According to the trend analysis, the annual average NDVI experienced a significant increasing trend, with a slope of 0.0051 and p < 0.01, as shown in Figure 2a,b.
In terms of spatial distribution, the annual average NDVI showed a gradually increasing pattern from southwest to northeast. High annual average NDVI values were mainly found in the TGR’s southern and northeastern mountainous regions (Figure 2a), with a maximum value of 0.80, whereas low annual average NDVI values were mainly found in the TGR’s metropolitan regions (Figure 2a).
We classified the study area into five groups according to the temporally changing slopes of the annual average NDVI from 2001 to 2020 [28,85] (Figure 2c and Table 3). It was found that more than 70% of the TGR area exhibited significant improvements, whereas only 3.15% of the TGR experienced degradation, including severe degradation and slight degradation. Based on spatial distribution, degradation mainly occurred in cities, such as the Chongqing core urban area, Jiangbei District, Wanzhou County, Kaizhou County, and Yunyang County, as well as the eastern part of Zigui County and Yichang County.

4.1.2. Temporal Changing Trends of Potential Factors in the TGR Area during 2001–2020

To clarify the driving mechanism of vegetation cover changes in the TGR area, five driving factors related to human activities and climate change were collected from 2001 to 2020. As Figure 3a shows, 99.96% of the TGR area experienced GDP growth. From 2001 to 2020, the GDP increased from 1.63 million RMB/ k m 2 to 21.92 million RMB/ k m 2 , with a significant positive temporal changing trend (slope = 0.64, p < 0.01). Spatially, the most rapid GDP growth occurred in and around the urban areas [86]. Urban development has strong economic side effects in terms of increasing rural employment opportunities, promoting rural infrastructure construction, and facilitating urban–rural interaction and coordination [86]. Therefore, the urban area and its surrounding area in the TGR area presented a GDP growth trend. On the other hand, the GDP growth in mountainous regions is not as robust as that in urban areas.
Due to the integrated progress of regional environmental rehabilitation efforts and the process of urban development [87], the average MCD in the TGR area experienced a slight upward trend with an increasing changing rate of 0.0002/a and 50.77% of the TGR area (Figure 3b). It was probably caused by the grain for green policies (with sloping cropland converted to forest land or grassland) in the northern and central southern regions of the TGR area. In these areas, the MCD increased from 0.7453 to 0.7508 between 2001 and 2020. In contrast, the MCD surrounding the urban area has trended to decrease over the last two decades. For example, the MCD in the core area of Chongqing decreased from 0.52 in 2001 to 0.46 in 2020.
For population data, the changes represent residents’ relocation policies and urbanization processes in the TGR area [88]. Pd increased from 237.53 person/ k m 2 in 2001 to 285.45 person/ k m 2 in 2020, with an increase of 20.17% (slope = 3.03, p < 0.01). Specifically, 29.44% of the TGR area experienced a significant increase in Pd, which was also located in and around the urban areas, such as Chongqing city, Yichang city, and Wanzhou city. In central Chongqing city, the Pd increased from 2332.34 person/ k m 2 to 4182.13 person/ k m 2 from 2001 to 2020 (Figure 3c).
For climate change factors, the TGR area’s average yearly precipitation during the last two decades was 1019.89 mm, with a slight increase from 781.49 mm in 2001 to 1162.33 mm in 2020 (slope = 6.38, p < 0.05). Spatially, the western and southern regions showed a more obvious increase in precipitation than the eastern and northern regions. The average temperature in the TGR was approximately 15.57 °C during 2001–2020, and no obvious changing rate was detected for the annual average temperature throughout the last 20 years (Figure 3e). However, a significant increase in annual temperature can still be found in high-altitude environments in the northern and southern areas of the TGR. Our findings regarding temperature changes are in line with other research for the TGR area [89].

4.1.3. Spatial Correlations between NDVI and Potential Factors

Variations and potential variables for NDVI changes should be considered before constructing the regression model. A correlation analysis was conducted at the pixel scale from 2001 to 2020. The results showed that in significantly correlated regions, the mean correlation coefficients between GDP, MCD, Pd, Pre, Tem, and NDVI were 0.74, 0.19, 0.17, 0.60, and 0.47, respectively. This implies that there is a higher correlation between vegetation change and human activities than that between vegetation change and climate change. This is probably due to the less significant changes in climate factors over the past 20 years, which weakened their correlations with NDVI changes from a time-series analysis perspective.
As Figure 4a shows, 87.08% of the TGR experienced a positive and significant correlation between GDP and NDVI, which is consistent with earlier research’s findings [90]. As the GDP increases, the government becomes wealthier, and more financial investment is used to promote the regional ecological environment, such as ecological restoration [91]. On the other hand, 1.84% of the TGR area experienced a negative and significant correlation between GDP and NDVI, and the majority is located in the handover between the Chongqing urban area and the Jiangbei district.
Correlation between the MCD and NDVI showed that 48.30% of the TGR region was positively correlated, with most being GGP regions. In contrast, 35.72% of the TGR showed a negative correlation. For example, in areas, such as the handover between the Chongqing urban area and the Banan District, Jiangjin District, Kaizhou County, Wanzhou County, and Yunyang County, although the MCD decreased owing to urbanization, the annual NDVI increased from 2001 to 2020 (Figure 4b). This negative connection has several causes. Climate change factors, along with other human activity factors, have a synergistic impact on NDVI changes in the TGR area, which affects the correlation between MCD and NDVI. Furthermore, to show that the MCD increase can increase the regional NDVI, we extracted statistical data of the afforestation area for Hubei province and Chongqing city from the “China Forestry Statistical Yearbook” for 2002–2019. The statistical data are presented in Figure 5, along with the forest area extracted from LULC datasets and the annual average NDVI. The results showed that the NDVI changing trend was consistent with the afforestation area and that the MCD is a potential driving factor for NDVI changes.
As Figure 4c shows, in 57.46% of the TGR area, the Pd and NDVI were positively corelated, including the core urban areas of Chongqing, Jiangling District, Banan District, and other urban areas. Current research has confirmed that, in regions with rapid economic development in China, changes in population density are, to some extent, positive for NDVI changes [92]. In 45.18% of the TGR area, Pd and NDVI were negatively correlated. These areas are primarily found in Chongqing’s metropolitan regions. Owing to the migration of the population to major urban centers, the expansion of urban areas takes up space for vegetation growth, leading to a decrease in the NDVI.
Changes in the NDVI were favorably associated with the climatic parameters, occupying 93.67% and 75.12% of the regions for precipitation and temperature, respectively. Specifically, the western region of the TGR is a plain area and is likely to collect rainwater, resulting in a positive correlation between the NDVI and Pre. The positive correlation between the NDVI and the Tem factor was concentrated in the southern and northern parts of the TGR region. Due to their high height and notable temperature variations, these two locations are better suited for the growth of vegetation [33,93].

4.2. Disentangling Human and Climate Factors on Vegetation Cover Changes in the TGR Area

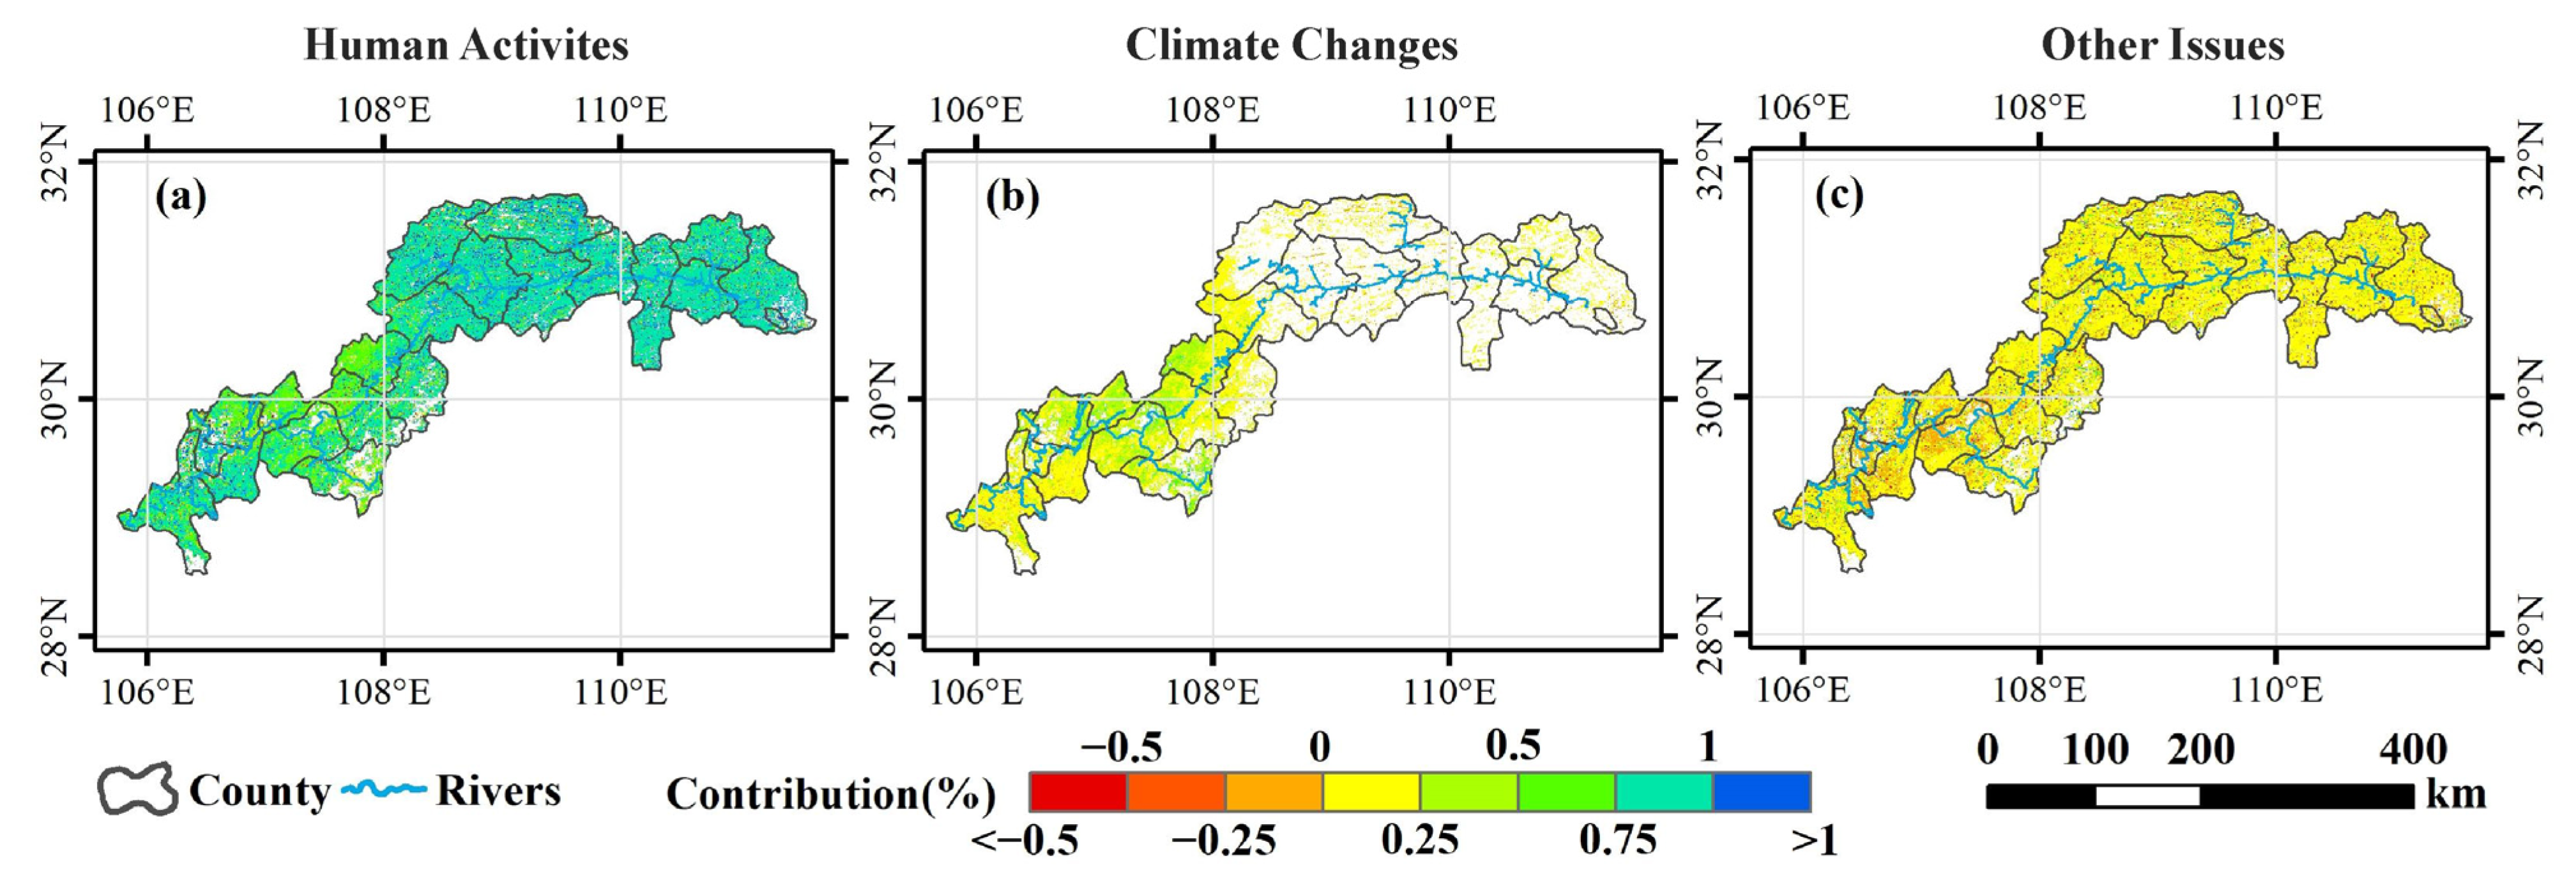
4.2.1. Spatially Varying Contributions of Human and Climate Factors

According to the proposed zoning method, the research region was classified into three types: the area mainly dominated by human activities (HR), climate factors (CR), and both human activities and climate factors (HCR). Specifically, there were 32 combinations of five human activities and climate factors (Figure 6c). In the HR area, seven combinations accounted for 48.77% of the TGR, the majority of which were located in the TGR area’s hinterland and tail regions. Since the building of the Three Gorges Dam, human activities have had a relatively large impact, whereas climate change was not significant in these areas. In the CR area, three combinations accounted for 3.19% of the TGR area, most of which are located in the high-altitude mountainous areas of the southern and eastern parts of the tail of the reservoir area. In the HCR area, 21 combinations accounted for 43.70% of the TGR area, mainly located at the head of the TGR area, where the synergic impacts of human activities and climate change were detected. In addition, 4.34% of the regions selected in this study showed a non-significant relationship between NDVI and human activities or climate change (Figure 6a,b). Therefore, these regions were excluded.

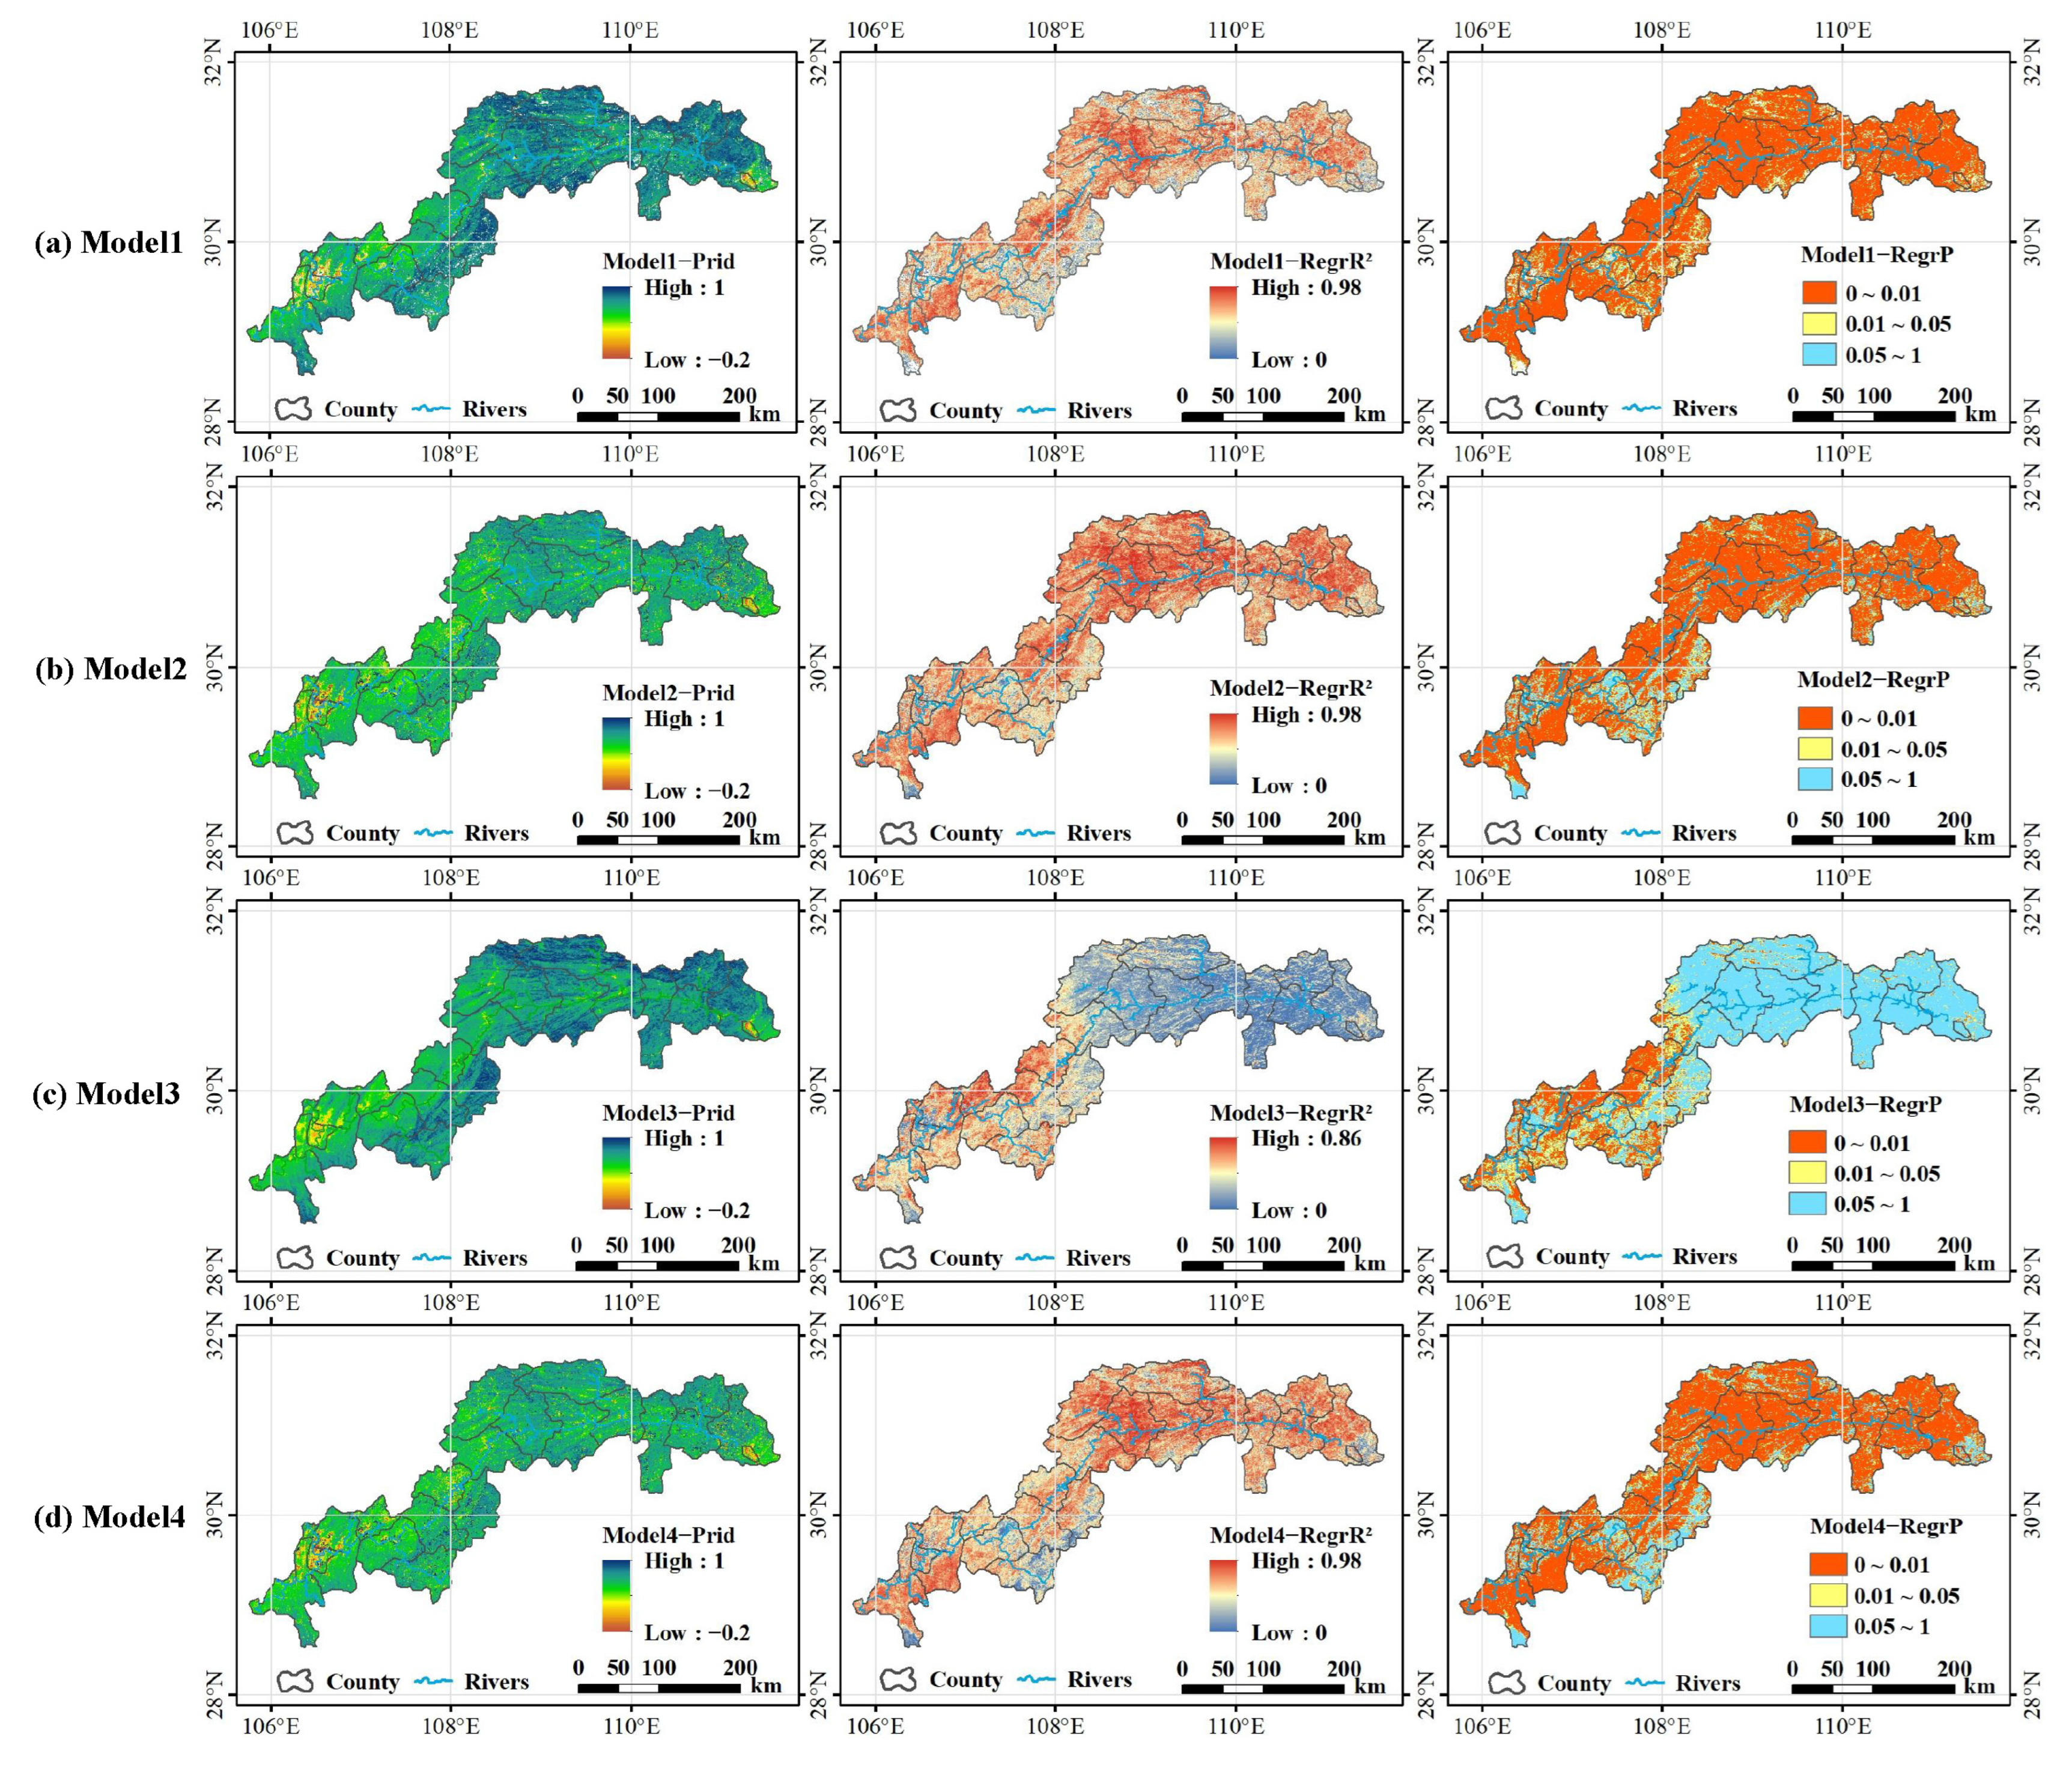
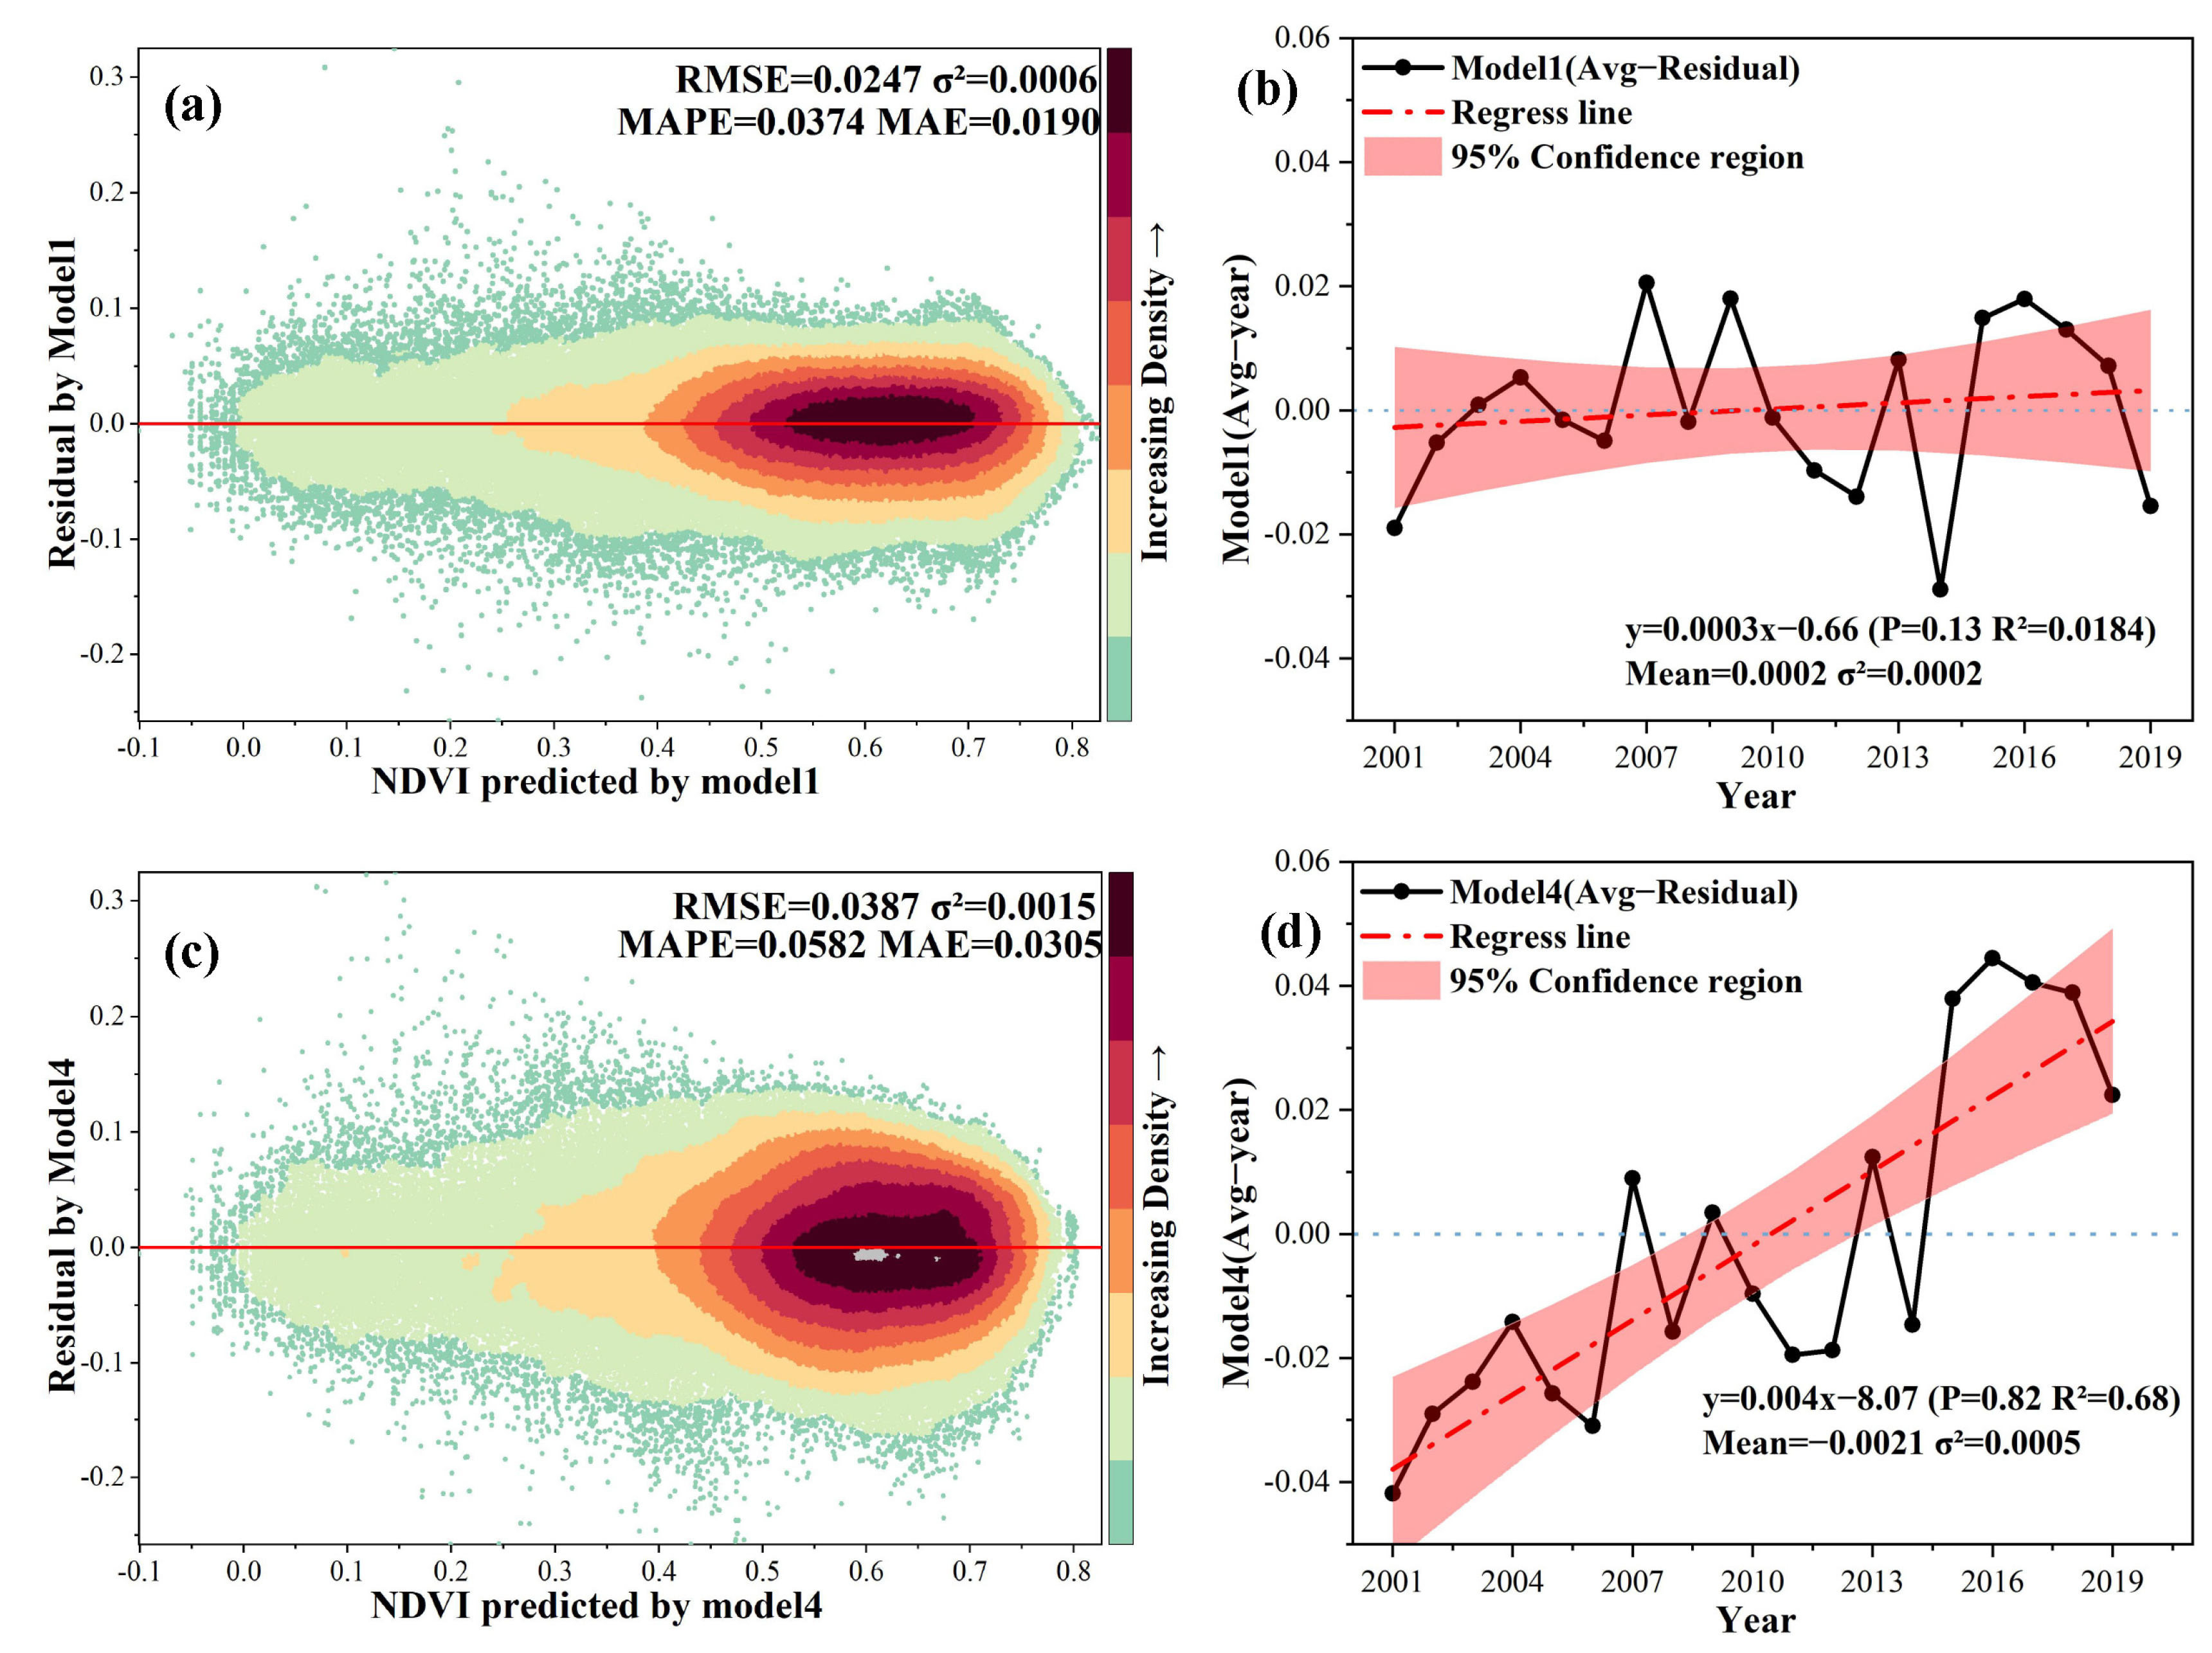
4.2.2. Model Validation

To validate the method used in our study, first, the multivariate linear regression was compared with random forest regression, K-Nearest Neighbor (KNN) regression, Backpropagation (BP) neural network regression, and Support Vector Machine (SVR) regression. Thus, 20 grids in the study area were randomly selected, and the data of these grids during 2001 to 2019 were used as the test set, while the data from 2020 served as the validation set. The results suggested that even the random forest experienced the highest R square and the lowest errors. However, the multivariate linear regression performed best in terms of the predicted NDVI value in 2020. This confirmed the goodness of the multivariate linear regression in our study.
Then, the multivariate linear regression was applied for the whole study area on the pixel scale. Based on the combinations of influencing factors at the pixel scale, multivariate linear regressions were conducted on the NDVI and its related influencing factors from 2001 to 2020 at the pixel scale, with different independent variables used for each pixel. The results showed that 91.14% of the pixels maintained an R 2 value exceeding 0.9, with p < 0.05. This indicates that the regression hypothesis is acceptable.
To verify the feasibility of our zoning combination method, we designed four regression models for comparison: Models 1, 2, 3, and 4. Model 1 represented the proposed method. Model 2 assumed that both human activities and climate change affect vegetation cover, with all influencing factors as independent variables. Models 3 and 4 assumed that either climate change or human activities impact regional vegetation changes, with climate change and human activity factors as the independent variables in the regression model, respectively.
Using historical data from 2001 to 2019 at the pixel scale, the predicted NDVI in 2020 and R 2 and P for Models 1–4 are presented in Figure 7. The results suggested that the average R 2 values for Models 1–4 were 0.6418, 0.6142, 0.2567, and 0.5945, respectively. The results showed that 94.26%, 87.69%, and 84.99% of the predicted NDVI by Models 1, 2, and 4 were statistically significant (p < 0.05), while only 36.82% of the predicted NDVI by Model 3 was statistically significant (p < 0.05), respectively. The pixel-scale R 2 and p-values suggest that Models 1, 2, and 4 are better for long-term vegetation dynamic analysis.
Finally, due to the spatial heterogeneity of human activities and climate change, we analyzed the residuals of Models 1 and 4 (Figure 8). The Root Mean Square Error (RMSE) was 0.0247 ( σ 2 = 0.0006), Mean Absolute Percentage Error (MAPE) was 0.0374, and Mean Absolute Error (MAE) was 0.0190 for Model 1. The RMSE was 0.0387 ( σ 2 = 0.0015), MAPE was 0.0582, and MAE was 0.0305 for Model 4. Furthermore, from 2001 to 2019, the annual residual of Model 4 exhibited a significantly increasing trend (Figure 8d). This suggests that Model 4 is not temporally stable. On the other hand, the annual residuals from 2001 to 2019 by Model 1 were randomly distributed, with no significant changing trends.
In summary, Model 1 proposed in this study dominates the other three models in terms of representing the TGR area’s temporal and spatial variability in vegetation changes.

4.2.3. Contributions of Human and Climate Factors

The contributions of human activities, climate change, and other issues to interannual changes of NDVI were estimated to be 0.0046/a (83.06%), 0.0006/a (9.84%), and 0.0003/a (7.10%), respectively, in the TGR area from 2001 to 2020 (Figure 9). Compared with climate change, human activity stands out as the primary catalyst for vegetation changes during the last two decades, which is similar to the quantitative analysis of human activity and climate change in the Yangtze River Basin conducted by Qu et al. [18] using the same method. The positive contributions of human activity and climate change factors accounted for 87.10% and 40.96%, respectively, in the TGR region.
Among all human activity factors, GDP had the greatest contribution to the annual changing trends in NDVI. GDP showed a positive contribution to the NDVI interannual changes in 58.63% of the study area. Land use changes and population changes also contributed positively to NDVI changes, but their positive contributions accounted for less than 25% of the TGR area. Regarding climate change factors, the contribution of precipitation was gathered in the southwest TGR, while the contribution of temperature was gathered in the south and northeast of the area.

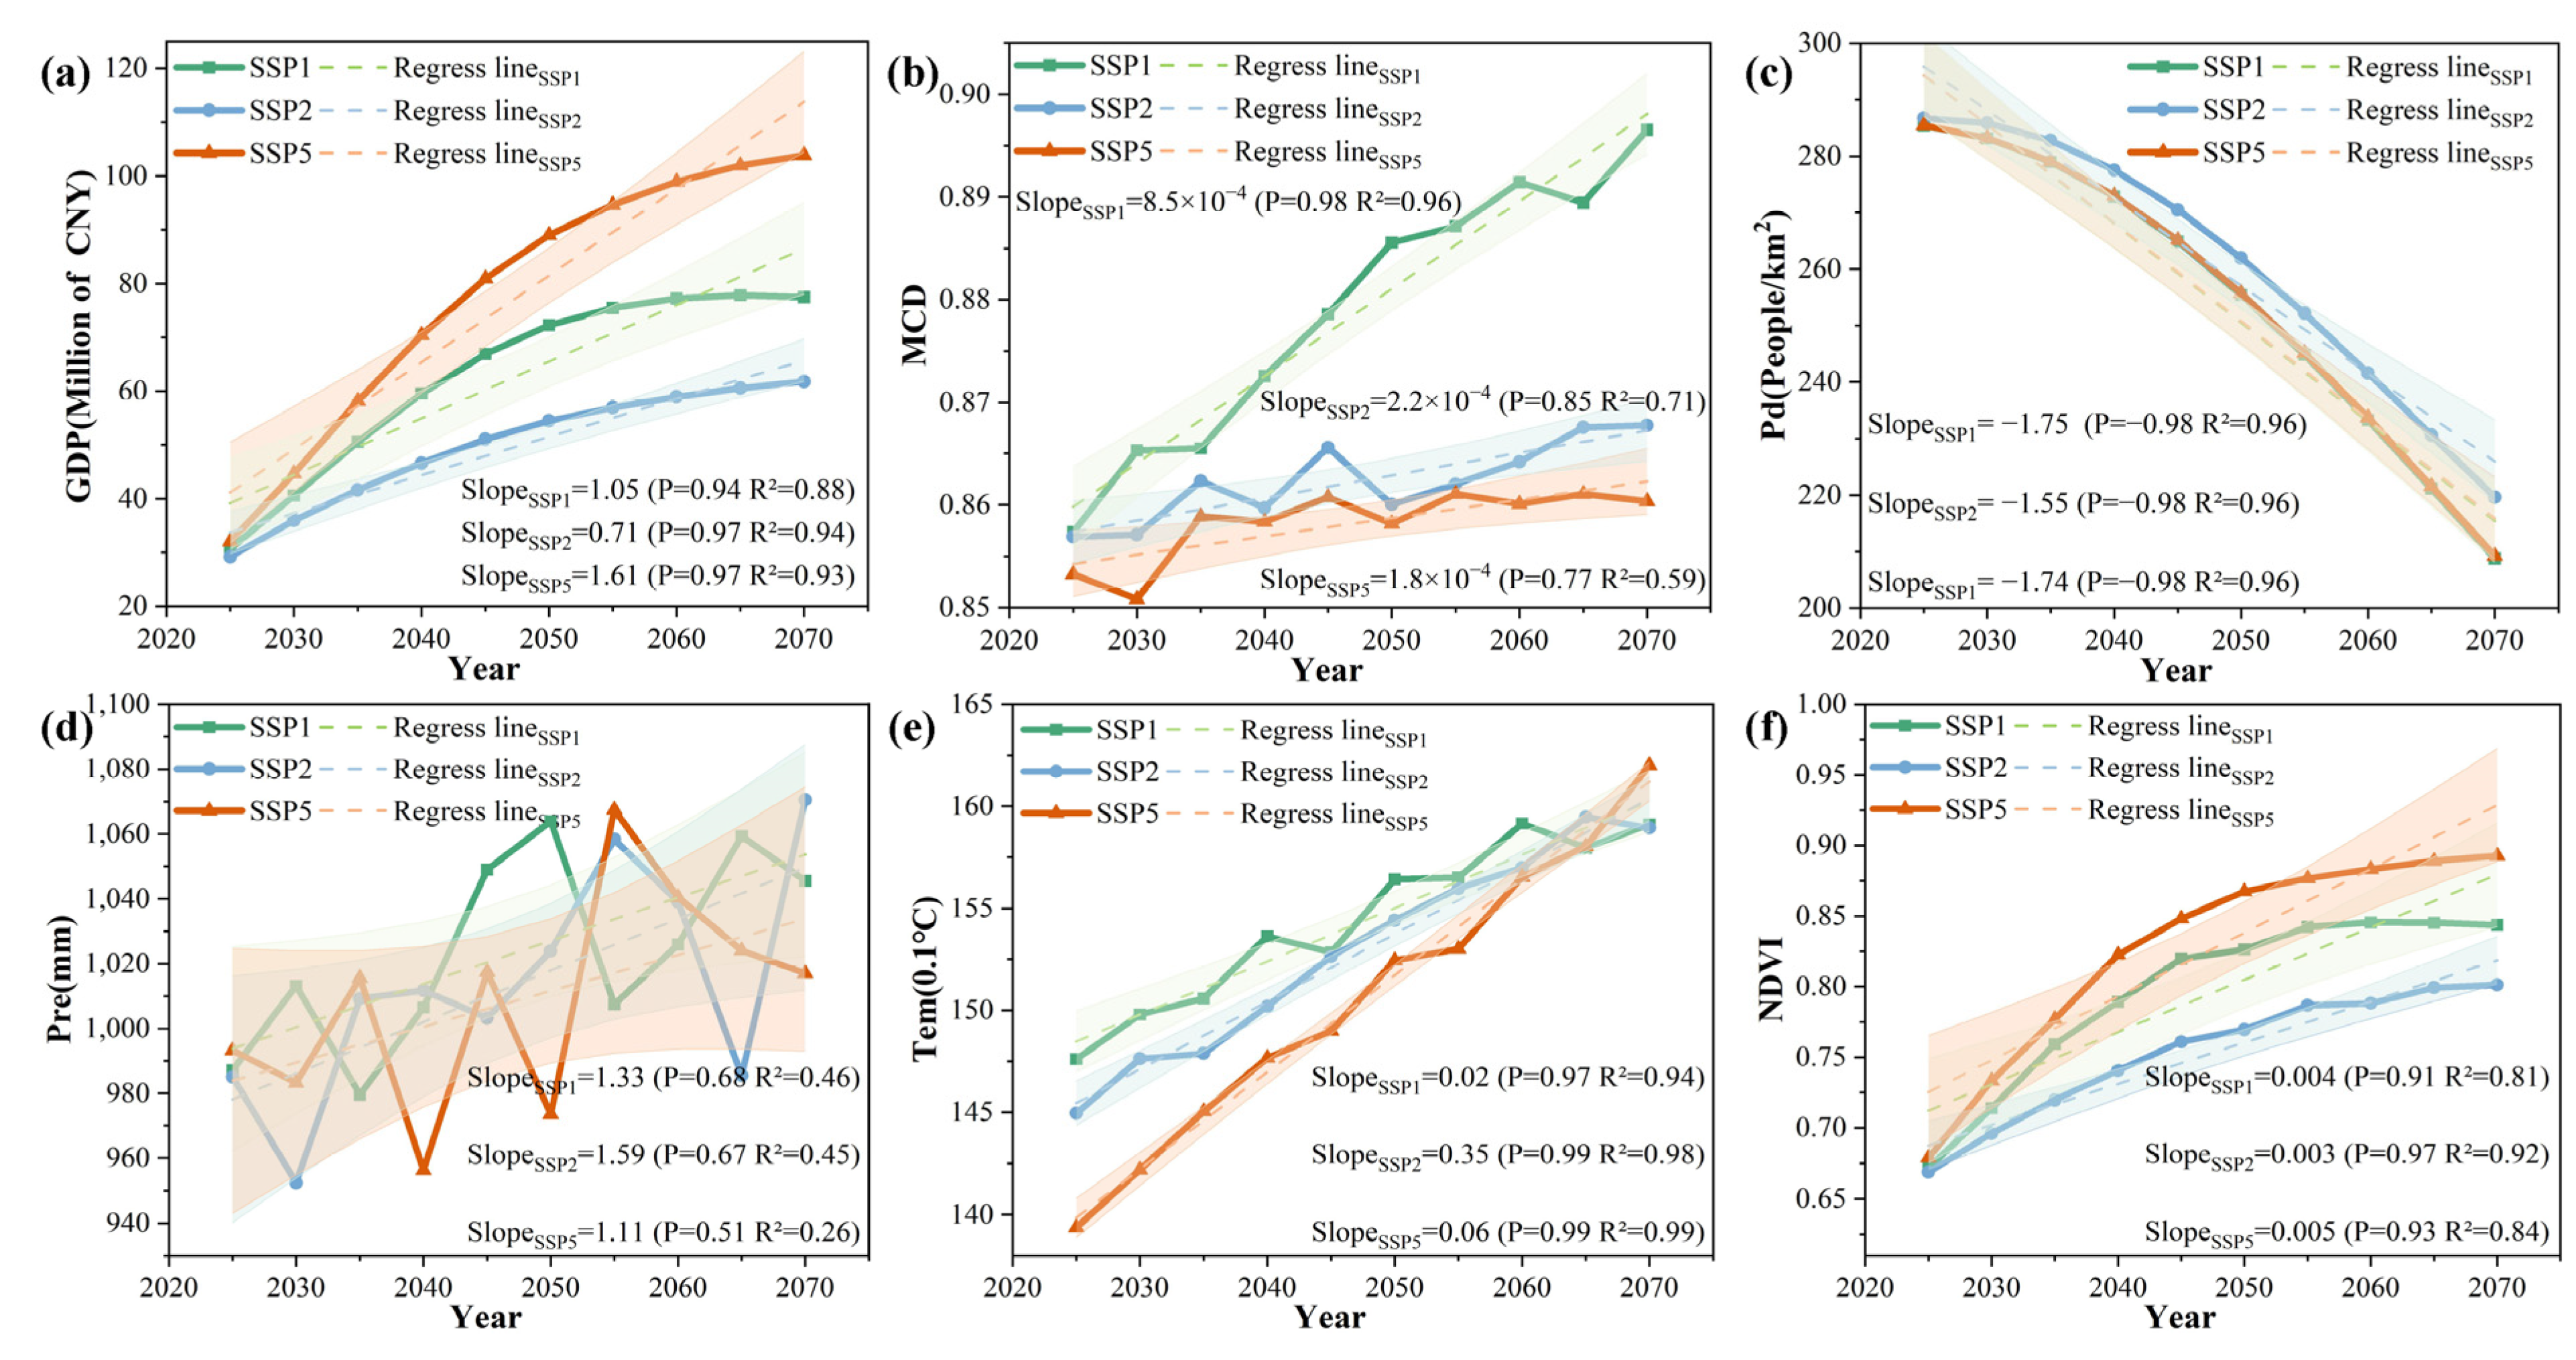
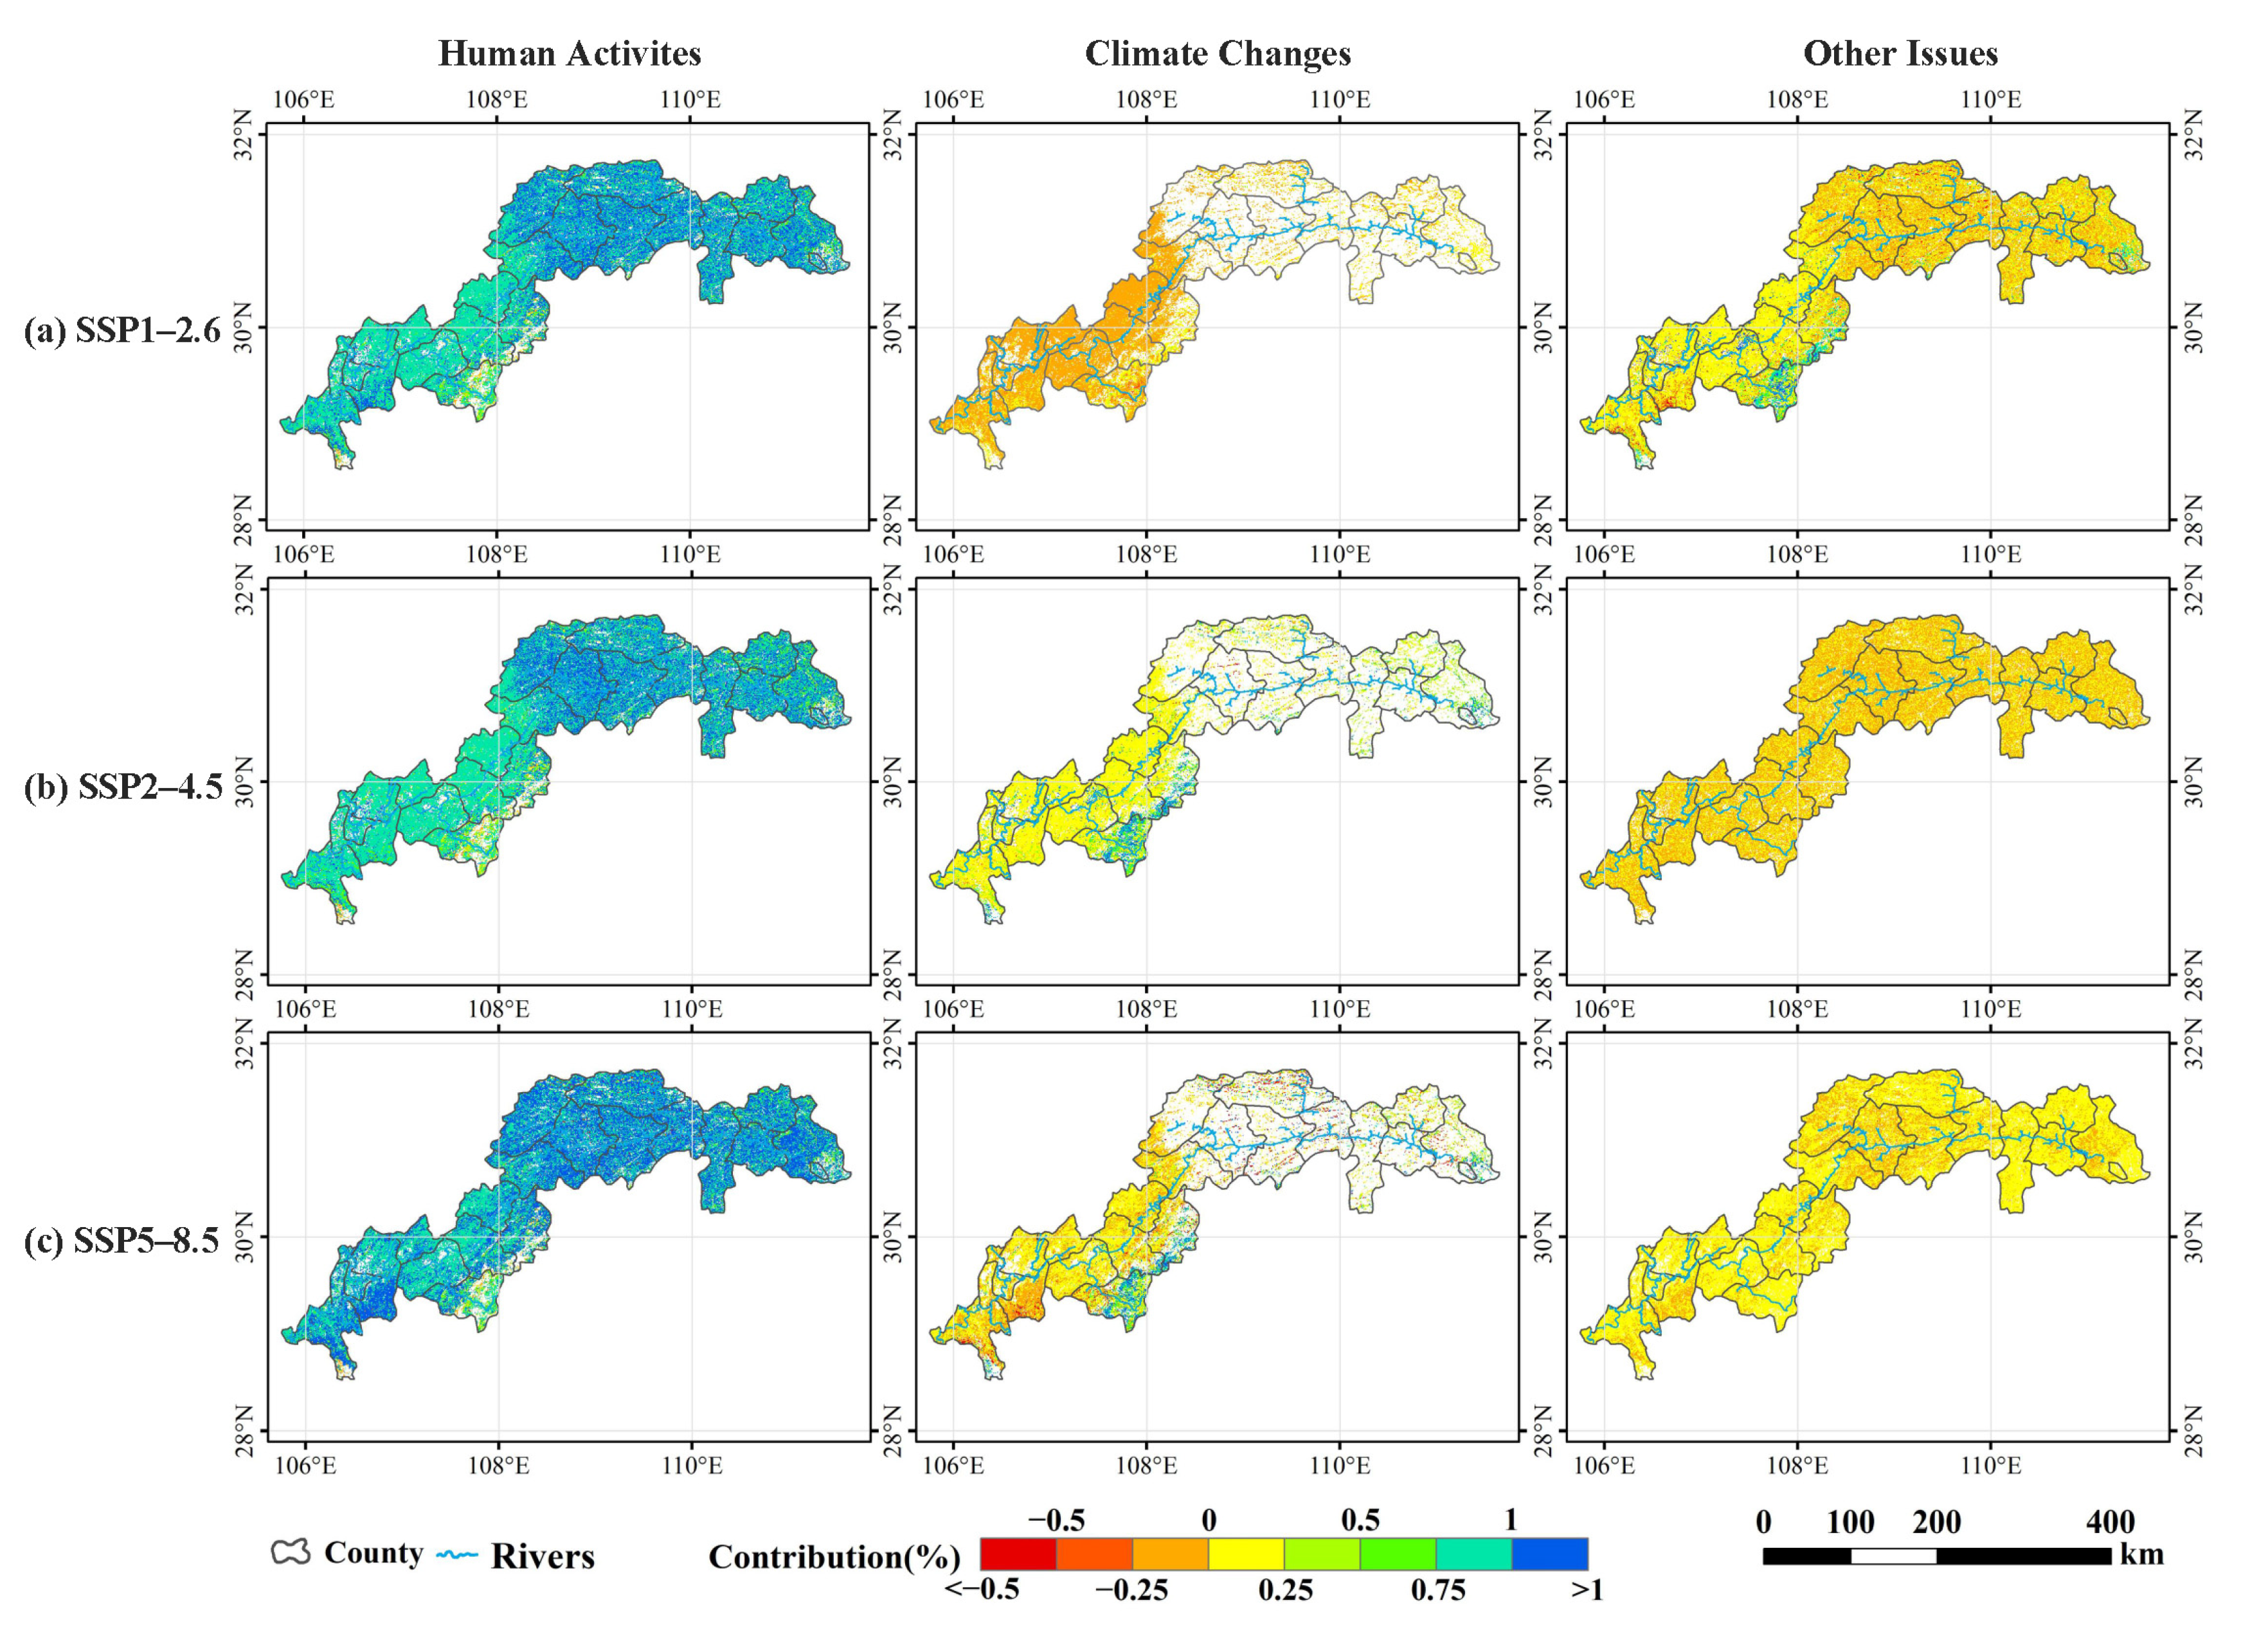
4.3. Future Vegetation Cover Changing under SSP/RCP Scenarios in the TGR Area

We forecasted the future vegetation changes from 2021 to 2070 in the TGR area under SSP1–2.6, SSP2–4.5, and SSP5–8.5. Under different SSP scenarios, the regional GDP increases as society and the economy develop (Figure 10a). Specifically, the scenario with the biggest GDP gain would be SSP5–8.5, but this growth is propelled by the extraction of non-renewable energy sources and high energy-consuming lifestyles [94]. Similarly, the MCD in the TGR area also shows an increasing trend under all SSP scenarios. Because SSP1–2.6 is a sustainable and green development scenario and requires more natural land use, the MCD in SSP1–2.6 shows sustained and rapid growth. On the other hand, the MCD is relatively stable, with a slight increase in SSP2–4.5 and SSP5–8.5 (Figure 10b).
For Pd, it shows downward trends (Figure 10c) under all SSP scenarios. For example, in the SSP1–2.6 scenario, Pd would experience an average annual decrease of 26.86%. The population decrease in China in the future was also confirmed by several recent studies [95,96].
For Pre and Tem in the TGR area, both show a trend of fluctuating growth (Figure 10d,e). This indicates that the fluctuation in rainfall over the next 50 years may be relatively large, and as a result, the overall temporal change trend may not be significant. In contrast, Tem has a strong positive correlation with time changes in the future. We estimated that, in the next 50 years, the annual mean temperature of the region could increase by 1.15 °C, 1.40 °C, and 2.26 °C under SSP1–2.6, SSP2–4.5, and SSP5–8.5, respectively.
Under the synthetic influence of the multiple factors mentioned above, the future NDVI has a general upward tendency, growing quickly between 2020 and 2050 and then experiencing slow growth from 2050 to 2070 in all SSP scenarios. The specific temporal changes in annual NDVI under the three scenarios are shown in Figure 10f. The SSP5–8.5 scenario was estimated to experience the fastest NDVI growth rate in the future, followed by SS1–2.6 and SSP2–4.5, with NDVI increasing from 0.68 to 0.89 over the next 50 years.
Based on Equations (4) and (5) and the above prediction results, we also predicted the future contributions of human activities to NDVI under the scenarios of SSP1–2.6, SSP2–4.5, and SSP5–8.5 as 93.98%, 90.19%, and 97.78%, respectively. For the three scenarios, the contributions of climate change are −0.15%, 9.95%, and 3.98%, respectively. The contributions of other issues are 6.17%, −0.14%, and −1.76% (Figure 11).
Our results indicate that in the rapidly developing SSP5–8.5 scenario, human activities have the highest contribution to NDVI, and in the green sustainable SSP1–2.6 scenario, climate change has the lowest contribution to NDVI. For the SSP2–4.5 scenario, where an intermediate road was adopted, the contributions are most in line with historical development trends.

5. Discussion

A pixel-scale regression model was proposed in this study to quantify the spatially varying drivers of the NDVI in the TGR area from 2001 to 2020. Specifically, we used a regional combination method and classified the regions into three types: HR, CR, and HCR. This clarified that in the TGR area, the different zones were impacted by changing human activity factors and climate change factors. Furthermore, the future changing trends in NDVI were predicted under socioeconomic development and climate change scenarios. We discuss these results from the following three perspectives.

5.1. The Continuous Growth of Vegetation Cover Is Driven by Both Human Activity and Climate Change Factors

Over the last two decades, there was an overall trend toward increased vegetation coverage in the TGR region, with the annual mean NDVI increasing from 0.53 in 2001 to 0.64 in 2020. Zhang et al. [6] discovered that between 2001 and 2015, there was a substantial upward trend in the yearly worldwide NDVI (0.22%, p < 0.001). Piao et al. [97] also reached a similar conclusion based on the leaf area index (LAI). For the TGR area, Tian et al. [33] detected that the NDVI exhibiting a marked upward trend comprised 82.01% of the annual maximum NDVI from 1998 to 2018. According to research on the TGR for 1982–2020, the NDVI varied very steadily (0.0022 y e a r 1 ) over the study period [34].
The increasing green in the TGR area is driven by both human activities and climate change, which explained 83.06% and 9.84% of the overall changes in the NDVI, respectively. A similar conclusion was reached in a study on the Loess Plateau, with contributions from humans and climates of 72.89% and 28.11%, respectively [98]. This synergy of humans and climates has been validated by several studies conducted at various scales [32,99]. It is important to remember that human activities are causing climate change [100], and, in turn, the global climate change may alter regional human activities. For instance, many regional land use change simulations are based on future global climate change scenarios [101]. Therefore, it is important to consider the interactions between human activities and climate change in future policymaking processes [102]. China’s ecological restoration policies have been confirmed to contribute profoundly to the increase in regional vegetation coverage [103,104]. Meanwhile, the national territory spatial planning in China proposes strict limitations on urban expansion and the preservation of natural resources [105]. These regulations will be combined with future climate change because the ecological benefits of these regulations will be changed under different climate scenarios.

5.2. Human Activities Present a Spatially Varying Impact on Regional Vegetation Coverage

Our research revealed that the effects of human activities on plant cover vary significantly across different geographical scales. Specifically, the total contributions of human activities to interannual changes in NDVI were estimated to be 0.0046/a (83.06%) in the TGR area from 2001 to 2020. While GDP, Pd, and MCD characterize the intensity and spatial location of human activities from the perspectives of economic development, society, and land use change, respectively, the results suggested that GDP had the greatest contribution to the annual changing trends in NDVI, and land use change and population change also contributed positively to NDVI changes. However, the impact of GDP, land use change, and population on the changes in NDVI varied in space (Figure 9). This suggested the economic development and vegetation restoration would positively impact the vegetation coverage changes in non-urban areas. On the contrary, in urban areas, high GDP may be negatively correlated with the vegetation coverage increase, which is consistent with existing studies [63]. Prior research also demonstrated that human activity usually presents clear spatial heterogeneity characteristics [106,107]. We concluded that the influence of human activities on regional vegetation cover varies spatially. Ren et al. [108], regarding the Jilin Province, suggested that LULC human activities primarily contributed to the degradation of vegetation cover. However, in the Loess Plateau, China, the LULC caused by ecological repair initiatives has promoted regional vegetation coverage in the previous 20 years [109,110]. Similarly, the contributions of rapid economic and population density development to vegetation coverage may differ in different places. In the Pearl River Delta of China, a positive correlation exists between NDVI and economic growth (GDP, population) [90]. In contrast, a study conducted for residential neighborhoods in southeastern Australia reported an inverse quadratic relationship between plant cover and the density of residential housing within neighborhoods [111].
These spatial differences in the driving mechanism of vegetation coverage changes represent the phenomenon of spatial heterogeneity [112] and the first law of geography [113]. Quantifying and describing this spatial heterogeneity are an important approach to explain the patterns and reasons for regional vegetation changes, which would facilitate the formulation of appropriate policies.

5.3. Regional Vegetation Coverage Increases under Future SSP-RCP Scenarios

Possible future changes in vegetation coverage between 2020 and 2070 under the SSP-RCP scenarios were estimated. Recently, a new framework combining SSPs and RCP was proposed to depict the possible future for socioeconomic and climate change scenarios [76,114]. Numerous fields have used these scenarios as future scenarios, including future agroecological suitability [115], extreme weather [116,117], and land use patterns [118]. For future vegetation coverage forecasting, there has also been extensive usage of the RCP climate change scenarios [45,119,120]. Employing multiple CMIP5 models for the projection of future rainfall, Gong et al. [119] estimated the existence of a favorable relationship in most of China’s dry regions between future plant growth and precipitation. Liu et al. [45] found that both in the current situation and in the RCP4.5 future climate change scenario, the vegetation coverage will experience insignificantly or significantly increasing trends for more than 80% of Southwest China in 2050.
These studies generally have similar conclusions as our study; that is, the future vegetation cover may experience an overall continuous increase. However, these studies mainly considered climate change factors under RCP scenarios, which may ignore how human activities affect the coverage of vegetation. Our study simultaneously combined the synergistic impact of climate change and human activities under the SSP scenarios. However, uncertainties still exist in our predicted vegetation coverage results due to the following two reasons. First, we selected only two indicators, annual average precipitation and temperature, to reflect future climate change. Although these two indicators can characterize the overall trend of climate change, multiple climate change factors impact the regional vegetation coverage [9] such as extreme regional climates. Second, although we adjusted the SSP’s scenarios according to the historical situation of the TGR area, future alterations in regional policies were not considered in the scenarios. Future government policies, including ecological restoration policies such as the GGP [121], territory spatial planning [105], and regional development strategic goals, usually present significant uncertainties. Consequently, these uncertainties alter the region’s future development pathways, causing the actual development pathways to deviate from SSP scenarios. In this study, we assumed that the regional policies will be consistent with historical policies, and the future prediction was carried out under this assumption.

5.4. Limitations

There are many limitations and uncertainties in this study. First, the future vegetation and regional vegetation coverage is determined by multiple factors [122,123], and these factors may vary in different regions. In this study, we collected only five factors owing to the limitations in obtaining data for a long period at the pixel scale. Future studies may involve the collection of additional data to refine and construct the model, because an increasing number of long-term datasets will be available in the future due to the development of geographic data acquisition, storage, and processing [124]. Second, in this study, we built future scenarios merely from the aspects of socioeconomic development and climate change but assumed future regional policies would be constant. In the future, more detailed and specific scenarios can be established in conjunction with regional policies to increase the availability of possibilities under the scenarios. Finally, multi-sourced datasets were used in this study, with varying resolutions and accuracies. Even though we preprocessed these data to maintain consistency to some extent, uncertainties still exist. Taking the datasets representing vegetation coverage as an example, some existing studies have confirmed the different performances of current and future AVHRR, MODIS, and VIIRS land surface monitoring satellites, which is caused by their sensor-specific characteristics [125,126]. In the application of the conclusion and results of this study, the uncertainties should be carefully considered.

6. Conclusions

Long-term remote sensing image data reveal that the vegetation in the TGR region has grown steadily during the last 20 years, and the contribution of climate and human activities to this growth is approximately 1:5. Ecosystem restoration initiatives, such as the GGP in the region, make a major positive contribution to vegetation growth; the positive effects of regional economic and population growth on vegetation cover occur in different locations. When the regional vegetation changes, human activities exhibit significant spatial heterogeneity in plants’ restoration and suppression. According to future development scenarios of human socioeconomic development and climate change realized by the SSP-RCP scenarios, the TGR area’s vegetation coverage will keep growing. However, this result did not consider alterations in government policies, which may cause possible pathways to deviate from the actual situation. Overall, the prediction results can provide information on the overall alterations to the local vegetation cover and their spatial differences under the future synergistic influences of climates and humans.

Author Contributions

W.Y.: Funding acquisition, writing—original draft; X.S.: investigation, methodology, formal analysis, visualization, writing—editing, writing—review; L.L.: data curation; B.Y.: investigation; X.C.: data curation, validation; Z.L.: methodology; W.C.: software; W.Z.: conceptualization, methodology, writing—editing. All contributed to the manuscript and agree to its submission. All authors have read and agreed to the published version of the manuscript.

Funding

This research was funded by the National Natural Science Foundation of China under grant nos. U2240222 and Major Science and Technology Project of the Ministry of Water Resources, China under grant nos. SKS-2022091.

Institutional Review Board Statement

Not applicable.

Informed Consent Statement

Not applicable.

Data Availability Statement

All data generated or analyzed during the current study are presented in this article. I confirm that I have described the download address of the data source in the study and listed the references of the data sources in the References section.

Acknowledgments

The authors would like to thank the Data Central, Institute of Geographic Sciences and Natural Resources Research, Chinese Academy of Sciences, for providing the land use datasets.

Conflicts of Interest

The authors declare no conflict of interest.

References

  1. Simonich, S.L.; Hites, R.A. Importance of vegetation in removing polycyclic aromatic hydrocarbons from the atmosphere. Nature 1994, 370, 49–51. [Google Scholar] [CrossRef]
  2. Arneth, A. Uncertain future for vegetation cover. Nature 2015, 524, 44–45. [Google Scholar] [CrossRef] [PubMed]
  3. Franklin, J.; Serra-Diaz, J.M.; Syphard, A.D.; Regan, H.M. Global change and terrestrial plant community dynamics. Proc. Natl. Acad. Sci. USA 2016, 113, 3725–3734. [Google Scholar] [CrossRef] [PubMed]
  4. Fu, B.J.; Wang, S.; Liu, Y.; Liu, J.B.; Liang, W.; Miao, C.Y. Hydrogeomorphic Ecosystem Responses to Natural and Anthropogenic Changes in the Loess Plateau of China. Annu. Rev. Earth Planet. Sci. 2017, 45, 223–243. [Google Scholar] [CrossRef]
  5. Sun, R.; Chen, S.H.; Su, H.B. Climate Dynamics of the Spatiotemporal Changes of Vegetation NDVI in Northern China from 1982 to 2015. Remote Sens. 2021, 13, 187. [Google Scholar] [CrossRef]
  6. Zhang, Y.L.; Song, C.H.; Band, L.E.; Sun, G.; Li, J.X. Reanalysis of global terrestrial vegetation trends from MODIS products: Browning or greening? Remote Sens. Environ. 2017, 191, 145–155. [Google Scholar] [CrossRef]
  7. Alkama, R.; Forzieri, G.; Duveiller, G.; Grassi, G.; Liang, S.L.; Cescatti, A. Vegetation-based climate mitigation in a warmer and greener World. Nature Commun. 2022, 13, 606. [Google Scholar] [CrossRef]
  8. Wu, Z.T.; Wu, J.J.; Liu, J.H.; He, B.; Lei, T.J.; Wang, Q.F. Increasing terrestrial vegetation activity of ecological restoration program in the Beijing-Tianjin Sand Source Region of China. Ecol. Eng. 2013, 52, 37–50. [Google Scholar] [CrossRef]
  9. Zheng, K.; Wei, J.Z.; Pei, J.Y.; Cheng, H.; Zhang, X.L.; Huang, F.Q.; Li, F.M.; Ye, J.S. Impacts of climate change and human activities on grassland vegetation variation in the Chinese Loess Plateau. Sci. Total Environ. 2019, 660, 236–244. [Google Scholar] [CrossRef]
  10. Peng, S.; Chen, A.; Xu, L.; Cao, C.; Fang, J.; Myneni, R.B.; Pinzon, J.E.; Tucker, C.J.; Piao, S. Recent change of vegetation growth trend in China. Environ. Res. Lett. 2011, 6, 044027. [Google Scholar] [CrossRef]
  11. Yang, K.; Sun, W.Z.; Luo, Y.; Zhao, L. Impact of urban expansion on vegetation: The case of China (2000–2018). J. Environ. Manag. 2021, 291, 112598. [Google Scholar] [CrossRef] [PubMed]
  12. Ge, W.Y.; Deng, L.Q.; Wang, F.; Han, J.Q. Quantifying the contributions of human activities and climate change to vegetation net primary productivity dynamics in China from 2001 to 2016. Sci. Total Environ. 2021, 773, 145648. [Google Scholar] [CrossRef] [PubMed]
  13. Hu, X.; Jiang, L.; Shi, F.; Li, X.; Zhang, S.; Zhao, Y.; Ma, Y.; Gao, Z.; Bai, Y. Intensified drought enhances coupling between vegetation growth and pregrowing season precipitation in the drylands of the Silk Road Economic Belt. J. Geophys. Res. 2021, 126, e2020JG005914. [Google Scholar] [CrossRef]
  14. Liu, X.; Zhang, B.; Henry, B.; Zhang, J.; Grace, P. Assessing the impact of historical and future climate change on potential natural vegetation types and net primary productivity in Australian grazing lands. Rangeland J. 2017, 39, 387–400. [Google Scholar] [CrossRef]
  15. Gao, X.; Zhu, J.; Zeng, X.; Zhang, M.; Dai, Y.; Ji, D.; Zhang, H. Changes in global vegetation distribution and carbon fluxes in response to global warming: Simulated results from IAP-DGVM in CAS-ESM2. Adv. Atmos. Sci. 2022, 39, 1285–1298. [Google Scholar] [CrossRef]
  16. Li, C.; Chen, J.; Wu, X.; Zhou, M.; Wei, Y.; Liu, Y.; Liu, L.; Peng, L.; Dou, T.; Li, L. Persistent effects of global warming on vegetation growth are regulated by water in China during 2001–2017. J. Clean Prod. 2022, 381, 135198. [Google Scholar] [CrossRef]
  17. Zhang, X.; Huang, X. Human disturbance caused stronger influences on global vegetation change than climate change. PeerJ 2019, 7, e7763. [Google Scholar] [CrossRef] [PubMed]
  18. Qu, S.; Wang, L.C.; Lin, A.W.; Yu, D.Q.; Yuan, M.X.; Li, C.A. Distinguishing the impacts of climate change and anthropogenic factors on vegetation dynamics in the Yangtze River Basin, China. Ecol. Indic. 2020, 108, 105724. [Google Scholar] [CrossRef]
  19. Chen, S.S.; Wen, Z.F.; Zhang, S.L.; Huang, P.; Ma, M.H.; Zhou, X.; Liao, T.; Wu, S.J. Effects of long-term and large-scale ecology projects on forest dynamics in Yangtze River Basin, China. Forest Ecol. Manag. 2021, 496, 119463. [Google Scholar] [CrossRef]
  20. Zheng, K.Y.; Tan, L.S.; Sun, Y.W.; Wu, Y.J.; Duan, Z.; Xu, Y.; Gao, C. Impacts of climate change and anthropogenic activities on vegetation change: Evidence from typical areas in China. Ecol. Indic. 2021, 126, 107648. [Google Scholar] [CrossRef]
  21. He, X.H.; Yu, Y.P.; Cui, Z.P.; He, T. Climate Change and Ecological Projects Jointly Promote Vegetation Restoration in Three-River Source Region of China. Chinese Geogr. Sci. 2021, 31, 1108–1122. [Google Scholar] [CrossRef]
  22. Qiao, Y.; Jiang, Y.; Zhang, C. Contribution of karst ecological restoration engineering to vegetation greening in southwest China during recent decade. Ecol. Indic. 2021, 121, 107081. [Google Scholar] [CrossRef]
  23. Chen, G.Z.; Li, X.; Liu, X.P.; Chen, Y.M.; Liang, X.; Leng, J.Y.; Xu, X.C.; Liao, W.L.; Qiu, Y.A.; Wu, Q.L.; et al. Global projections of future urban land expansion under shared socioeconomic pathways. Nature Commun. 2020, 11, 537. [Google Scholar] [CrossRef] [PubMed]
  24. Li, G.D.; Fang, C.L.; Li, Y.J.; Wang, Z.B.; Sun, S.A.; He, S.W.; Qi, W.; Bao, C.; Ma, H.T.; Fan, Y.P.; et al. Global impacts of future urban expansion on terrestrial vertebrate diversity. Nature Commun. 2022, 13, 1628. [Google Scholar] [CrossRef]
  25. Tang, L.; Ke, X.; Chen, Y.; Wang, L.; Zhou, Q.; Zheng, W.; Xiao, B. Which impacts more seriously on natural habitat loss and degradation? Cropland expansion or urban expansion? Land. Degrad. Dev. 2020, 32, 946–964. [Google Scholar] [CrossRef]
  26. Winkler, K.; Fuchs, R.; Rounsevell, M.; Herold, M. Global land use changes are four times greater than previously estimated. Nat. Commun. 2021, 12, 2501. [Google Scholar] [CrossRef] [PubMed]
  27. Liu, Q.; Zhu, C.; Tian, H.; Qiao, R.; Liu, X. Spatio-temporal changes in cultivated land and their influencing factors in China based on MODIS data. J. Lanzhou Univ. Nat. Sci. 2022, 58, 689–697. [Google Scholar] [CrossRef]
  28. Sun, Y.L.; Shan, M.; Pei, X.R.; Zhang, X.K.; Yang, Y.L. Assessment of the impacts of climate change and human activities on vegetation cover change in the Haihe River basin, China. Phys. Chem. Earth 2020, 115, 102834. [Google Scholar] [CrossRef]
  29. Liu, Y.X.; Wang, Y.L.; Peng, J.; Du, Y.Y.; Liu, X.F.; Li, S.S.; Zhang, D.H. Correlations between Urbanization and Vegetation Degradation across the World’s Metropolises Using DMSP/OLS Nighttime Light Data. Remote Sens. 2015, 7, 2067–2088. [Google Scholar] [CrossRef]
  30. Luo, Y.; Sun, W.; Yang, K.; Zhao, L. China urbanization process induced vegetation degradation and improvement in recent 20 years. Cities 2021, 114, 103207. [Google Scholar] [CrossRef]
  31. Zhang, L.; Yang, L.; Zohner, C.M.; Crowther, T.W.; Li, M.C.; Shen, F.X.; Guo, M.; Qin, J.; Yao, L.; Zhou, C.H. Direct and indirect impacts of urbanization on vegetation growth across the world’s cities. Sci. Adv. 2022, 8, eabo0095. [Google Scholar] [CrossRef] [PubMed]
  32. Wang, J.; Wang, K.L.; Zhang, M.Y.; Zhang, C.H. Impacts of climate change and human activities on vegetation cover in hilly southern China. Ecol. Eng. 2015, 81, 451–461. [Google Scholar] [CrossRef]
  33. Tian, M.; Zhou, J.; Jia, B.; Lou, S.; Wu, H. Impact of Three Gorges Reservoir Water Impoundment on Vegetation–Climate Response Relationship. Remote Sens. 2020, 12, 2860. [Google Scholar] [CrossRef]
  34. Zhang, S.; Ye, L.; Huang, C.; Wang, M.; Yang, Y.; Wang, T.; Tan, W. Evolution of vegetation dynamics and its response to climate in ecologically fragile regions from 1982 to 2020: A case study of the Three Gorges Reservoir area. Catena 2022, 219, 106601. [Google Scholar] [CrossRef]
  35. Luo, K. Contribution of ecological conservation programs and climate change to hydrological regime change in the source region of the Yangtze River in China. Reg. Environ. Chang. 2022, 22, 10. [Google Scholar] [CrossRef]
  36. Chen, C.; Li, T.J.; Sivakumar, B.; Li, J.Y.; Wang, G.Q. Attribution of growing season vegetation activity to climate change and human activities in the Three-River Headwaters Region, China. J. Hydroinform 2020, 22, 186–204. [Google Scholar] [CrossRef]
  37. Naeem, S.; Zhang, Y.Q.; Zhang, X.Z.; Tian, J.; Abbas, S.; Luo, L.L.; Meresa, H.K. Both climate and socioeconomic drivers contribute to vegetation greening of the Loess Plateau. Sci. Bull. 2021, 66, 1160–1163. [Google Scholar] [CrossRef] [PubMed]
  38. Li, J.J.; Peng, S.Z.; Li, Z. Detecting and attributing vegetation changes on China’s Loess Plateau. Agr. Forest Meteorol. 2017, 247, 260–270. [Google Scholar] [CrossRef]
  39. Shi, Y.; Jin, N.; Ma, X.L.; Wu, B.Y.; He, Q.S.; Yue, C.; Yu, Q. Attribution of climate and human activities to vegetation change in China using machine learning techniques. Agr. Forest Meteorol. 2020, 294, 108146. [Google Scholar] [CrossRef]
  40. Lao, X.; Gu, H.Y.; Yu, H.C.; Xiao, F. Exploring the Spatially-Varying Effects of Human Capital on Urban Innovation in China. Appl. Spat. Anal. Polic. 2021, 14, 827–848. [Google Scholar] [CrossRef]
  41. Gao, X.; Huang, X.; Lo, K.; Dang, Q.; Wen, R. Vegetation responses to climate change in the Qilian Mountain Nature Reserve, Northwest China. Glob. Ecol. Conserv. 2021, 28, e01698. [Google Scholar] [CrossRef]
  42. Lei, J.; Peters, A.J. A spatial regression procedure for evaluating the relationship between AVHRR-NDVI and climate in the northern Great Plains. Int. J. Remote Sens. 2004, 25, 297–311. [Google Scholar] [CrossRef]
  43. Gao, J.; Jiao, K.; Wu, S. Investigating the spatially heterogeneous relationships between climate factors and NDVI in China during 1982 to 2013. J. Geogr. Sci 2019, 29, 1597–1609. [Google Scholar] [CrossRef]
  44. Overpeck, J.T.; Rind, D.; Goldberg, R. Climate-induced changes in forest disturbance and vegetation. Nature 1990, 343, 51–53. [Google Scholar] [CrossRef]
  45. Liu, H.; Jiao, F.; Yin, J.; Li, T.; Gong, H.; Wang, Z.; Lin, Z. Nonlinear relationship of vegetation greening with nature and human factors and its forecast - A case study of Southwest China. Ecol. Indic. 2020, 111, 106009. [Google Scholar] [CrossRef]
  46. Liu, Y.; Qu, L. Land Use Pattern Change and Human-earth System Evolution in Three Gorges Reservoir Area in Recent 30 Years. Resour. Environ. Yangtze Basin 2022, 31, 1664–1676. [Google Scholar]
  47. Li, Q.; Liu, X.; Zhong, Y.; Wang, M.; Shi, M. Precipitation Changes in the Three Gorges Reservoir Area and the Relationship with Water Level Change. Sensors 2021, 21, 6110. [Google Scholar] [CrossRef]
  48. Teng, M.; Huang, C.; Wang, P.; Zeng, L.; Zhou, Z.; Xiao, W.; Huang, Z.; Liu, C. Impacts of forest restoration on soil erosion in the Three Gorges Reservoir area, China. Sci. Total Environ. 2019, 697, 134164. [Google Scholar] [CrossRef]
  49. Cheng, r.; Ren, m. The Preliminary Research of Forest Vegetation Classified System in the Three Gorge Researvior Area. Environ. Exploit. 1999, 14, 4. [Google Scholar]
  50. Wu, C.; Zhou, Z.; Xiao, W.; Wang, P.; Teng, M.; Huang, Z. Estimation of soil erosion in the Three Gorges Reservoir Area of China using RUSLE, remote sensing and GIS. J. Food Agric. Environ. 2011, 9, 728–734. [Google Scholar]
  51. Xu, X.; Yang, G.; Tan, Y.; Liu, J.; Zhang, S.; Bryan, B. Unravelling the effects of large-scale ecological programs on ecological rehabilitation of China’s Three Gorges Dam. J. Clean. Prod. 2020, 256, 120446. [Google Scholar] [CrossRef]
  52. Chu, L.; Sun, T.; Wang, T.; Li, Z.; Cai, C. Evolution and Prediction of Landscape Pattern and Habitat Quality Based on CA-Markov and InVEST Model in Hubei Section of Three Gorges Reservoir Area (TGRA). Sustainability 2018, 10, 3854. [Google Scholar] [CrossRef]
  53. Xiao, Y.; Xiao, Q.; Xiong, Q.; Yang, Z. Effects of Ecological Restoration Measures on Soil Erosion Risk in the Three Gorges Reservoir Area Since the 1980s. Geohealth 2020, 4, e2020GH000274. [Google Scholar] [CrossRef] [PubMed]
  54. Xiong, Y.; Zhou, J.; Chen, L.; Jia, B.; Sun, N.; Tian, M.; Hu, G. Land Use Pattern and Vegetation Cover Dynamics in the Three Gorges Reservoir (TGR) Intervening Basin. Water 2020, 12, 2036. [Google Scholar] [CrossRef]
  55. Xue, Z.; Jiang, M.; Zhang, Z.; Wu, H.; Zhang, T. Land Use Carbon Emission Pattern and Carbon Compensation in Three Gorges Reservoir Area During 1980-2021. Bull. Soil Water Conserv. 2023, 43, 300–306. [Google Scholar]
  56. He, X.; Zhang, F.; Cai, Y.; Tan, M.L.; Chan, N.W. Spatio-temporal changes in fractional vegetation cover and the driving forces during 2001-2020 in the northern slopes of the Tianshan Mountains, China. Environ. Sci. Pollut. R 2023, 30, 75511–75531. [Google Scholar] [CrossRef] [PubMed]
  57. Zhang, S.; Bai, X.; Zhao, C.; Tan, Q.; Luo, G.; Wu, L.; Xi, H.; Li, C.; Chen, F.; Ran, C.; et al. China’s carbon budget inventory from 1997 to 2017 and its challenges to achieving carbon neutral strategies. J. Clean Prod. 2022, 347, 130966. [Google Scholar] [CrossRef]
  58. Li, Y.; Sun, Y.; Li, J.; Gao, C. Socioeconomic drivers of urban heat island effect: Empirical evidence from major Chinese cities. Sustain. Cities Soc. 2020, 63, 102425. [Google Scholar] [CrossRef]
  59. Chen, J.; Gao, M.; Cheng, S.; Hou, W.; Song, M.; Liu, X.; Liu, Y. Global 1 km × 1 km gridded revised real gross domestic product and electricity consumption during 1992–2019 based on calibrated nighttime light data. Sci. Data 2022, 9, 202. [Google Scholar] [CrossRef] [PubMed]
  60. Zhu, E.; Wang, Y.; Yuan, X. Changes of terrestrial water storage during 1981-2020 over China based on dynamic-machine learning model. J. Hydrol. 2023, 621, 129576. [Google Scholar] [CrossRef]
  61. Tremblay, J.C.; Ainslie, P.N. Global and country-level estimates of human population at high altitude. Proc. Natl. Acad. Sci. USA 2021, 118, e2102463118. [Google Scholar] [CrossRef]
  62. Caula, R.H.; de Oliveira-Junior, J.F.; Gois, G.d.; Delgado, R.C.; Gomes Pimentel, L.C.; Teodoro, P.E. Nonparametric statistics applied to fire foci obtained by meteorological satellites and their relationship to the MCD12Q1 product in the state of Rio de Janeiro, Southeast Brazil. Land. Degrad. Dev. 2017, 28, 1056–1067. [Google Scholar] [CrossRef]
  63. Du, J.; Fu, Q.; Fang, S.; Wu, J.; He, P.; Quan, Z. Effects of rapid urbanization on vegetation cover in the metropolises of China over the last four decades. Ecol. Indic. 2019, 107, 105458. [Google Scholar] [CrossRef]
  64. Maselli, F. Monitoring forest conditions in a protected Mediterranean coastal area by the analysis of multiyear NDVI data. Remote Sens. Environ. 2004, 89, 423–433. [Google Scholar] [CrossRef]
  65. Piao, S.; Mohammat, A.; Fang, J.; Cai, Q.; Feng, J. NDVI-based increase in growth of temperate grasslands and its responses to climate changes in China. Global Environ. Chang. 2006, 16, 340–348. [Google Scholar] [CrossRef]
  66. Peng, S. 1-km monthly precipitation dataset for China (1901–2022). Earth Syst. Sci. Data 2019, 11, 1931–1946. [Google Scholar] [CrossRef]
  67. Peng, S. 1-km Monthly Mean Temperature Dataset for China (1901–2022); National Tibetan Plateau Data Center: Beijing, China, 1901. [Google Scholar] [CrossRef]
  68. Jiang, L.; Jiapaer, G.; Bao, A.; Guo, H.; Ndayisaba, F. Vegetation dynamics and responses to climate change and human activities in Central Asia. Sci. Total Environ. 2017, 599-600, 967–980. [Google Scholar] [CrossRef]
  69. Lin, X.; Niu, J.; Berndtsson, R.; Yu, X.; Zhang, L.; Chen, X. NDVI dynamics and its response to climate change and reforestation in northern China. Remote Sens. 2020, 12, 4138. [Google Scholar] [CrossRef]
  70. Liu, Y.; Tian, J.; Liu, R.; Ding, L. Influences of climate change and human activities on NDVI changes in China. Remote Sens. 2021, 13, 4326. [Google Scholar] [CrossRef]
  71. Song, Y.; Ma, M. A statistical analysis of the relationship between climatic factors and the Normalized Difference Vegetation Index in China. Int. J. Remote Sens. 2011, 32, 3947–3965. [Google Scholar] [CrossRef]
  72. Zuur, A.F.; Ieno, E.N.; Smith, G.M. Analysing Ecological Data; Springer: Berlin/Heidelberg, Germany, 2007; Volume 680. [Google Scholar]
  73. Montgomery, D.C.; Peck, E.A.; Vining, G.G. Introduction to Linear Regression Analysis; John Wiley & Sons: Hoboken, NJ, USA, 2021. [Google Scholar]
  74. Kuo, Y.M.; Chang, F.J. Dynamic factor analysis for estimating ground water arsenic trends. J. Environ. Qual. 2010, 39, 176–184. [Google Scholar] [CrossRef]
  75. O’Neill, B.C.; Kriegler, E.; Ebi, K.L.; Kemp-Benedict, E.; Riahi, K.; Rothman, D.S.; van Ruijven, B.J.; van Vuuren, D.P.; Birkmann, J.; Kok, K.; et al. The roads ahead: Narratives for shared socioeconomic pathways describing world futures in the 21st century. Global Environ. Chang. 2017, 42, 169–180. [Google Scholar] [CrossRef]
  76. Riahi, K.; van Vuuren, D.P.; Kriegler, E.; Edmonds, J.; O’Neill, B.C.; Fujimori, S.; Bauer, N.; Calvin, K.; Dellink, R.; Fricko, O.; et al. The Shared Socioeconomic Pathways and their energy, land use, and greenhouse gas emissions implications: An overview. Global Environ. Chang. 2017, 42, 153–168. [Google Scholar] [CrossRef]
  77. Cook, B.I.; Mankin, J.S.; Marvel, K.; Williams, A.P.; Smerdon, J.E.; Anchukaitis, K.J. Twenty-first century drought projections in the CMIP6 forcing scenarios. Earths Future 2020, 8, e2019EF001461. [Google Scholar] [CrossRef]
  78. Dellink, R.; Chateau, J.; Lanzi, E.; Magne, B. Long-term economic growth projections in the Shared Socioeconomic Pathways. Global Environ. Chang. 2017, 42, 200–214. [Google Scholar] [CrossRef]
  79. Mondal, S.K.; Huang, J.; Wang, Y.; Su, B.; Zhai, J.; Tao, H.; Wang, G.; Fischer, T.; Wen, S.; Jiang, T. Doubling of the population exposed to drought over South Asia: CMIP6 multi-model-based analysis. Sci. Total Environ. 2021, 771, 145186. [Google Scholar] [CrossRef]
  80. Liao, W.; Liu, X.; Xu, X.; Chen, G.; Liang, X.; Zhang, H.; Li, X. Projections of land use changes under the plant functional type classification in different SSP-RCP scenarios in China. Sci. Bull. 2020, 65, 1935–1947. [Google Scholar] [CrossRef]
  81. Deng, j. Assessment of Air Temperature Simulations in China by CMIP6 Multi-Models. Open J. Nature Sci. 2021, 09, 198–207. [Google Scholar] [CrossRef]
  82. Jin, C.; Jiang, C.; Zhang, X. Evaluation and Projection of Temperature in Southwestern China by CMIP6 Models. Chin. J. Agrometeorol. 2022, 43, 597–611. [Google Scholar] [CrossRef]
  83. Enayati, M.; Bozorg-Haddad, O.; Bazrafshan, J.; Hejabi, S.; Chu, X. Bias correction capabilities of quantile mapping methods for rainfall and temperature variables. J. Water Clim. Chang. 2021, 12, 401–419. [Google Scholar] [CrossRef]
  84. Ning, L.; Bradley, R.S. Snow occurrence changes over the central and eastern United States under future warming scenarios. Sci. Rep. 2015, 5, 17073. [Google Scholar] [CrossRef] [PubMed]
  85. Han, J.; Huang, Y.; Zhang, H.; Wu, X. Characterization of elevation and land cover dependent trends of NDVI variations in the Hexi region, northwest China. J. Environ. Manag. 2019, 232, 1037–1048. [Google Scholar] [CrossRef] [PubMed]
  86. Liu, Y.; Lu, S.; Chen, Y. Spatio-temporal change of urban-rural equalized development patterns in China and its driving factors. Rangeland J. 2013, 32, 320–330. [Google Scholar] [CrossRef]
  87. Li, F.; Zhou, W.; Shao, Z.; Zhou, X. Effects of ecological projects on vegetation in the Three Gorges Area of Chongqing, China. J. Mt. Sci. 2022, 19, 121–135. [Google Scholar] [CrossRef]
  88. Heming, L.; Rees, P. Population displacement in the Three Gorges reservoir area of the Yangtze River, central China: Relocation policies and migrant views. Int. J. Popul. Geogr. 2000, 6, 439–462. [Google Scholar] [CrossRef]
  89. Wang, H.; Xiao, W.; Zhao, Y.; Wang, Y.; Hou, B.; Zhou, Y.; Yang, H.; Zhang, X.; Cui, H. The Spatiotemporal Variability of Evapotranspiration and Its Response to Climate Change and Land Use/Land Cover Change in the Three Gorges Reservoir. Water 2019, 11, 1739. [Google Scholar] [CrossRef]
  90. Hu, M.; Xia, B. A significant increase in the normalized difference vegetation index during the rapid economic development in the Pearl River Delta of China. Land. Degrad. Dev. 2019, 30, 359–370. [Google Scholar] [CrossRef]
  91. Sheng, J.; Han, X.; Zhou, H. Spatially varying patterns of afforestation/reforestation and socio-economic factors in China: A geographically weighted regression approach. J. Clean. Prod. 2017, 153, 362–371. [Google Scholar] [CrossRef]
  92. Mueller, T.; Dressler, G.; Tucker, C.J.; Pinzon, J.E.; Leimgruber, P.; Dubayah, R.O.; Hurtt, G.C.; Böhning-Gaese, K.; Fagan, W.F. Human land-use practices lead to global long-term increases in photosynthetic capacity. Remote Sens. 2014, 6, 5717–5731. [Google Scholar] [CrossRef]
  93. Cui, Y. Preliminary estimation of the realistic optimum temperature for vegetation growth in China. Environ. Manage 2013, 52, 151–162. [Google Scholar] [CrossRef]
  94. Juzbašić, A.; Ahn, J.B.; Cha, D.H.; Chang, E.C.; Min, S.K. Changes in heat stress considering temperature, humidity, and wind over East Asia under RCP8.5 and SSP5-8.5 scenarios. Int. J. Climatol. 2022, 42, 6579–6595. [Google Scholar] [CrossRef]
  95. He, X.; Song, M.; Qu, J.; Guo, Y.; Cao, H.; Sun, R.; Liu, G.-H.; Shen, Y. Basic and translational aging research in China: Present and future. Protein Cell 2019, 10, 476–484. [Google Scholar] [CrossRef] [PubMed]
  96. Luo, Y.; Su, B.; Zheng, X. Trends and Challenges for Population and Health during Population Aging—China, 2015–2050. China Cdc Wkly. 2021, 3, 593. [Google Scholar] [CrossRef] [PubMed]
  97. Piao, S.; Yin, G.; Tan, J.; Cheng, L.; Huang, M.; Li, Y.; Liu, R.; Mao, J.; Myneni, R.B.; Peng, S. Detection and attribution of vegetation greening trend in China over the last 30 years. Global Chang. Biol. 2015, 21, 1601–1609. [Google Scholar] [CrossRef] [PubMed]
  98. Shi, S.; Yu, J.; Wang, F.; Wang, P.; Zhang, Y.; Jin, K. Quantitative contributions of climate change and human activities to vegetation changes over multiple time scales on the Loess Plateau. Sci. Total Environ. 2021, 755, 142419. [Google Scholar] [CrossRef] [PubMed]
  99. Tong, S.; Zhang, J.; Ha, S.; Lai, Q.; Ma, Q. Dynamics of Fractional Vegetation Coverage and Its Relationship with Climate and Human Activities in Inner Mongolia, China. Remote Sens. 2016, 8, 776. [Google Scholar] [CrossRef]
  100. Hulme, M.; Barrow, E.M.; Arnell, N.W.; Harrison, P.A.; Johns, T.C.; Downing, T.E. Relative impacts of human-induced climate change and natural climate variability. Nature 1999, 397, 688–691. [Google Scholar] [CrossRef]
  101. Wang, Z.; Li, X.; Mao, Y.; Li, L.; Wang, X.; Lin, Q. Dynamic simulation of land use change and assessment of carbon storage based on climate change scenarios at the city level: A case study of Bortala, China. Ecol. Indic. 2022, 134, 108499. [Google Scholar] [CrossRef]
  102. Jiang, H.; Xu, X.; Guan, M.; Wang, L.; Huang, Y.; Jiang, Y. Determining the contributions of climate change and human activities to vegetation dynamics in agro-pastural transitional zone of northern China from 2000 to 2015. Sci Total Environ 2020, 718, 134871. [Google Scholar] [CrossRef]
  103. Sun, W.; Song, X.; Mu, X.; Gao, P.; Wang, F.; Zhao, G. Spatiotemporal vegetation cover variations associated with climate change and ecological restoration in the Loess Plateau. Agr. Forest Meteorol. 2015, 209, 87–99. [Google Scholar] [CrossRef]
  104. Li, G.; Sun, S.; Han, J.; Yan, J. Impacts of Chinese Grain for Green program and climate change on vegetation in the Loess Plateau during 1982–2015. Sci. Total Environ. 2019, 660, 177–187. [Google Scholar] [CrossRef]
  105. Liu, Y.; Zhou, Y. Territory spatial planning and national governance system in China - ScienceDirect. Lup 2021, 102, 105288. [Google Scholar] [CrossRef]
  106. Li, H.; Peng, J.; Liu, Y.; Hu, Y.n. Urbanization impact on landscape patterns in Beijing City, China: A spatial heterogeneity perspective. Ecol. Indic. 2017, 82, 50–60. [Google Scholar] [CrossRef]
  107. Han, R.; Feng, C.; Xu, N.; Guo, L. Spatial heterogeneous relationship between ecosystem services and human disturbances: A case study in Chuandong, China. Sci. Total Environ. 2020, 721, 137818. [Google Scholar] [CrossRef]
  108. Ren, Y.; Zhang, F.; Zhao, C.; Cheng, Z. Attribution of climate change and human activities to vegetation NDVI in Jilin Province, China during 1998–2020. Ecol. Indic. 2023, 153, 110415. [Google Scholar] [CrossRef]
  109. Zhao, A.; Zhang, A.; Lu, C.; Wang, D.; Wang, H.; Liu, H. Spatiotemporal variation of vegetation coverage before and after implementation of Grain for Green Program in Loess Plateau, China. Ecol. Eng. 2017, 104, 13–22. [Google Scholar] [CrossRef]
  110. Sun, R.; Chen, S.; Su, H.; Hao, G. Spatiotemporal variation of vegetation coverage and its response to climate change before and after implementation of Grain for Green Project in the Loess Plateau. In Proceedings of the 2019 Ieee International Geoscience and Remote Sensing Symposium (IGARSS 2019), Yokohama, Japan, 28 July–2 August 2019; IEEE: Piscataway, NJ, USA, 2019; pp. 9546–9549. [Google Scholar]
  111. Luck, G.W.; Smallbone, L.T.; O’Brien, R. Socio-Economics and Vegetation Change in Urban Ecosystems: Patterns in Space and Time. Ecosystems 2009, 12, 604–620. [Google Scholar] [CrossRef]
  112. Pickett, S.T.; Cadenasso, M.L. Landscape ecology: Spatial heterogeneity in ecological systems. Science 1995, 269, 331–334. [Google Scholar] [CrossRef]
  113. Sui, D.Z. Tobler’s first law of geography: A big idea for a small world? Ann. Am. Assoc. Geogr. 2004, 94, 269–277. [Google Scholar] [CrossRef]
  114. Eyring, V.; Bony, S.; Meehl, G.A.; Senior, C.A.; Stevens, B.; Stouffer, R.J.; Taylor, K.E. Overview of the Coupled Model Intercomparison Project Phase 6 (CMIP6) experimental design and organization. Geosci. Model. Dev. 2016, 9, 1937–1958. [Google Scholar] [CrossRef]
  115. Yao, L.; Zhou, H.; Yan, Y.; Su, Y. Projection of suitability for the typical agro-ecological types in Central Asia under four SSP-RCP scenarios. Eur. J. Agron. 2022, 140, 126599. [Google Scholar] [CrossRef]
  116. Peng, L.; Li, Z. Ensemble Flood Risk Assessment in the Yangtze River Economic Belt under CMIP6 SSP-RCP Scenarios. Sustainability 2021, 13, 12097. [Google Scholar] [CrossRef]
  117. Su, B.; Huang, J.; Mondal, S.K.; Zhai, J.; Wang, Y.; Wen, S.; Gao, M.; Lv, Y.; Jiang, S.; Jiang, T.; et al. Insight from CMIP6 SSP-RCP scenarios for future drought characteristics in China. Atmos. Res. 2021, 250, 105375. [Google Scholar] [CrossRef]
  118. Liu, H.; Liu, Y.; Wang, C.; Zhao, W.; Liu, S. Landscape pattern change simulations in Tibet based on the combination of the SSP-RCP scenarios. J. Environ. Manag. 2021, 292, 112783. [Google Scholar] [CrossRef] [PubMed]
  119. Gong, X.; Du, S.; Li, F.; Ding, Y. Study of mesoscale NDVI prediction models in arid and semiarid regions of China under changing environments. Ecol. Indic. 2021, 131, 108198. [Google Scholar] [CrossRef]
  120. Chen, Z.; Liu, H.; Xu, C.; Wu, X.; Liang, B.; Cao, J.; Chen, D. Deep learning projects future warming-induced vegetation growth changes under SSP scenarios. Adv. Clim. Chang. Res. 2022, 13, 251–257. [Google Scholar] [CrossRef]
  121. Delang, C.O.; Yuan, Z. China’s Grain for Green Program; Springer International Publishing: Cham, Switzerland, 2015. [Google Scholar]
  122. Soepboer, W.; Sugita, S.; Lotter, A.F. Regional vegetation-cover changes on the Swiss Plateau during the past two millennia: A pollen-based reconstruction using the REVEALS model. Quat. Sci. Rev. 2010, 29, 472–483. [Google Scholar] [CrossRef]
  123. Leprieur, C.; Kerr, Y.; Mastorchio, S.; Meunier, J. Monitoring vegetation cover across semi-arid regions: Comparison of remote observations from various scales. Int. J. Remote Sens. 2000, 21, 281–300. [Google Scholar] [CrossRef]
  124. Graham, M.; Shelton, T. Geography and the future of big data, big data and the future of geography. Dialogues Hum. Geogr. 2013, 3, 255–261. [Google Scholar] [CrossRef]
  125. Van Leeuwen, W.J.; Orr, B.J.; Marsh, S.E.; Herrmann, S.M. Multi-sensor NDVI data continuity: Uncertainties and implications for vegetation monitoring applications. Remote Sens. Env. 2006, 100, 67–81. [Google Scholar] [CrossRef]
  126. Skakun, S.; Justice, C.O.; Vermote, E.; Roger, J.-C. Transitioning from MODIS to VIIRS: An analysis of inter-consistency of NDVI data sets for agricultural monitoring. Int. J. Remote Sens. 2018, 39, 971–992. [Google Scholar] [CrossRef] [PubMed]
Figure 1. The location of the study area along with the DEM of the study area.
Sustainability 16 06188 g001
Figure 2. Spatial distributions of NDVI and its changing trends for the TGR area from 2001 to 2020: (a) twenty–year annual mean NDVI, (b) inter–annual variations in the NDVI from 2001 to 2020, (c) the spatial distributions of the trends in NDVI changes at pixel scale, and (d) significant (p–value < 0.05) trends in NDVI changes at pixel scale.
Sustainability 16 06188 g002
Figure 3. The annual mean, changing trends, significance, and inter–annual variations of human activities and climate factors in the TGR area from 2001 to 2020, for (a) GDP, (b) land use changes, (c) population, (d) precipitation, and (e) temperature.
Sustainability 16 06188 g003
Figure 4. The Pearson correlation between NDVI and its driving factors. (ae) show the spatial distribution of Pearson correlation between NDVI with GDP, MCD, Pd, Pre, and Tem, respectively, and (f) shows the box plots of Pearson correlation coefficients with p < 0.05.
Sustainability 16 06188 g004
Figure 5. The afforestation area in the TGR area along with the changes in annual mean NDVI.
Sustainability 16 06188 g005
Figure 6. The classification for HR, CR, and HCR areas in the TGR region: (a) the spatial distributions for HR, CR, and HCR areas, (b) the proportion for each classification, and (c) combinations for HR, CR, and HCR areas.
Sustainability 16 06188 g006
Figure 7. A comparison of the predicative annual mean NDVI value, the R2 value, and the significance of the models for (a) Model 1, (b) Model 2, (c) Model 3, and (d) Model 4.
Sustainability 16 06188 g007
Figure 8. Residuals of Models 1 and 4: (a) and (c) show the plots of residuals under different predicted NDVI values, (b) and (d) show the temporal changes of annual mean residuals for Models 1 and 4, respectively.
Sustainability 16 06188 g008
Figure 9. Contributions of (a) human activities, (b) climate changes, and (c) other issues to the interannual changes of NDVI in the TGR area from 2001 to 2020.
Sustainability 16 06188 g009
Figure 10. Future temporal changes in (a) GDP, (b) MCD, (c) Pd, (d) Pre, (e) Tem, and (f) the simulated changes in NDVI from 2021 to 2070 under SSP1–2.6, SSP2–4.5, and SSP5–8.5 in the TGR area.
Sustainability 16 06188 g010
Figure 11. Contributions of human activities, climate change, and other issues to the interannual changes of NDVI under (a) SSP1–2.6, (b) SSP2–4.5, and (c) SSP5–8.5 in the TGR area from 2021 to 2070.
Sustainability 16 06188 g011
Table 1. The data sources used in this study.
DatasetsSourcesDescriptions
NDVIhttp://modis.gsfc.nasa.gov/, accessed on 1 September 2022MODIS-MOD13Q1 NDVI data set for TGR (2001–2020, 1 km resolution)
Monthly average precipitation (Pre)Peng [66]1-km monthly precipitation dataset for China (2001–2020, 1 km resolution)
Monthly average
Temperature (Tem)
Peng [67]1-km monthly maximum temperature dataset for China (2001–2020, 1 km resolution)
Gross Domestic Product (GDP)Chen et al. [59]Global revised real gross domestic product based on calibrated nighttime lighting data (2001–2020, 1 km resolution)
Population density (Pd)https://landscan.ornl.gov/, accessed on 15 September 2022LandScan Global countries-China (2001–2020, 1 km resolution)
Mixed Coverage Dynamics (MCD)https://ladsweb.modaps.eosdis.nasa.gov/search/, accessed on 20 September 2022MODIS MCD12Q1 land-use data set for TGR area (2001–2020, 500 m resolution)
Table 2. Basic information on the six GCMs from CMIP6 used in this study.
ModelInstitution/CountrySpatial Resolution
ACCESS-CM2Australian Community Climate and Earth System Simulator (Australia)144 × 192
BCC-CSM2-MRBeijing Climate Center (China)320 × 160
CAMS-CSM1-0Chinese Academy of Sciences-Earth System Model (China)320 × 160
CMCC-CM2-SR5Fondazione Centro Euro-Mediterraneo sui Cambiamenti Climatici (Italy)288 × 192
CMCC-ESM2Fondazione Centro Euro-Mediterraneo sui Cambiamenti Climatici (Italy)288 × 192
INM-CM5-0Institute for Numerical Mathematics, Russian Academy of Science (Russia)180 × 120
Table 3. The statistics of trends in NDVI changes for the TGR area during 2001–2020.
NDVI Variation TrendGradeArea
(km2)
Proportion
(%)
Significant
(km2)
Not Significant
(km2)
Slope ≤ −0.004Severe degradation12861.65%1176110
−0.004 < Slope < −0.001Slight degradation 11721.50%248924
−0.001 ≤ Slope ≤ 0.001Basically unchanged22542.89%02259
0.001 < Slope < 0.004Slight improvement18,54523.79%14,0854460
Slope ≥ 0.004Significant improvement54,71270.17%54,67339
Disclaimer/Publisher’s Note: The statements, opinions and data contained in all publications are solely those of the individual author(s) and contributor(s) and not of MDPI and/or the editor(s). MDPI and/or the editor(s) disclaim responsibility for any injury to people or property resulting from any ideas, methods, instructions or products referred to in the content.

