Article

Microplastic Distribution Characteristics Considering the Marine Environment Based on Surface Seawater Quality Parameters in Southern Sea of Korea, 2019

1
Department of Ocean Integrated Science, College of Fisheries & Ocean Science, Chonnam National University, Yeosu 59626, Republic of Korea
2
Faculty of Environmental & Symbiotic Science, Prefectural University of Kumamoto, Kumamoto 862-8502, Japan
3
Wando Regional Office, National Fishery Products Quality Management Service, Wando 59116, Republic of Korea
4
Best Environmental Technology Co., Ltd., Yeosu 59661, Republic of Korea
*
Author to whom correspondence should be addressed.
Sustainability 2024, 16(15), 6272; https://doi.org/10.3390/su16156272
Submission received: 30 April 2024 / Revised: 12 July 2024 / Accepted: 16 July 2024 / Published: 23 July 2024
(This article belongs to the Special Issue Pollution, Toxicology and Sustainable Solutions in Aquatic System)

Abstract

:
The present study determined the microplastic distributions in the surface water of the Southern Sea of Korea (SS01–SS09) in September 2019, depending on three groups (Groups A, B, and C) categorized via the principal component analysis and cluster analysis using the water quality parameters (water temperature, salinity, pH, dissolved oxygen, suspended particulate matter, and chlorophyll-a). The microplastic samples in the surface water were collected using a 300 μm-mesh neuston net. The microplastic abundance ranged from 0.10 to 5.08 (average 0.71 ± 1.64) particles/m3 in the entire sampling area. Median values in Groups A (SS01, SS02, and SS07), B (SS05, SS08, and SS09), and C (SS03, SS04, and SS06) were 0.14 ± 0.02, 0.12 ± 0.14, and 0.17 ± 2.85 particles/m3, respectively, and there were no statistically significant differences (p < 0.050). However, it was highlighted that the most considerably numerous microplastic abundance in SS04 (5.08 particles/m3) revealed relatively high water temperatures distinguished from other sampling areas. Polystyrene, consisting mainly of expanded polystyrene, was the predominant polymer type, accounting for 81.5% in Groups A, 84.4% in B, and 97.0% in C. The particle size in Group C (average 3.11 ± 1.08 mm) was statistically larger (p < 0.001) than those of Groups A (average 0.71 ± 1.06 mm) and B (average 0.98 ± 1.22 mm). Only fragment and sheet shapes were found in all the sampling points and the former, which consisted of the secondary microplastics regardless of the groups, was the dominant type. The fragment composition gradually increased from 77.3% in Group A, 96.7% in B, to 99.1% in C. However, the strategy studies should be investigated in the foreseeable future to supplement the current study limitations, such as verifying the effect of the Yangtze River and the Tsushima warm current, and seasonal fluctuation.

1. Introduction

Microplastics (MPs) are defined as plastic pieces smaller than 5 mm [1] and are divided into primary and secondary MPs depending on their origins. Primary MPs refer to a piece of plastic initially manufactured in a small size to add to household and industrial products such as sunscreen, cleanser scrub, and insect repellent and secondary MPs refer to a small piece of plastic caused by the weathering of large plastics through physical and chemical reactions in the environment [2,3].
Plastics are inexpensive, lightweight, highly durable, and corrosion-resistant and have excellent thermal and electrical insulating properties [4,5]. Global production of plastic explosively increased from 2 million tons in 1950 to at least 400 million tons in 2022 [6,7] and the OECD (Organization for Economic Co-operation and Development) expects it to reach 13.19 billion tons in 2050 [8]. It is estimated that approximately 10% of the produced plastics enter the ocean each year [9]. These emitted plastics are weathered into secondary MPs, which are smaller in size, leading to increases in the number of particles [10,11]. Therefore, marine MPs have been shown to increase in proportion to plastic production [12,13]. It is expected that approximately 15 to 51 trillion plastic particles, including expanded polystyrene (EPS) with an average density of 0.016 g/cm3, float in the global surface water [14].
The potential ecological risks of MPs in the marine environment are largely divided into physical and chemical characteristics. With regard to the physical characteristics, MPs are small in size and can be consumed by fish, shellfish, and small plankton. They can also damage organism bodies, causing digestive tract perforation and intestinal obstruction [15].
Regarding chemical characteristics, the emitted plastics weathered under marine environments could adsorb heavy metals, hydrophobic chemicals, and persistent organic pollutants, e.g., mercury, cadmium, lead, polycyclic aromatic hydrocarbons (PAHs), and perfluorinated compounds (PFCs) [16]. Even if such hazardous chemicals exist in low concentrations in the marine environment, they could be detected in plastics at concentrations several times higher than in the marine environment as they absorb and accumulate into the plastics [10]. Since the smaller the particle size, the larger the specific surface area, MPs can accumulate high pollutant levels, increasing the toxicological risk of harmful chemicals to marine organisms and humans as vector effects [17,18].
In addition, various plasticizers, flame retardants, antioxidants, and heat/ultraviolet stabilizers, which are added to improve processing ease and functionality in the plastic manufacturing process, may be eluted into the environment during the plastic decomposition process [19,20]. The additives can act as toxic substances to marine organisms [21]. Therefore, the need for continuous monitoring of MPs in the marine environment is emphasized [22].
Meanwhile, the Southern Sea of Korea is geographically adjacent to Korea, China, and Japan and is a sea area connecting the Yellow Sea in the west, the northeastern part of the East China Sea in the south, and the East Sea in the east, having complex oceanographic characteristics [23]. According to Yeh and Kim [24], in summer, a specific low salinity distribution and stratification appear due to the effects of water masses such as the Yangtze River influence [25], Tsushima warm current water [26], Yellow Sea bottom cold water [27], and the coastal waters of the Yellow Sea [28] along with the river water that flows into the Southern Sea of Korea from the Yeongsan River and Seomjin River [29]. The nutrients necessary for biological growth are satisfied by the inflow of water masses with different characteristics [30] and freshwater originating from land [31]. Accordingly, various marine organisms inhabit the Southern Sea of Korea based on its high essential productivity [32], and active fishery activities are entailed, including fishery farming on fish, shellfish, and seaweeds [33].
According to Riccardo and Philippe [34], sea areas with active fishery industry and human activities are evaluated as sea areas with a high potential for MPs to occur. The plastics generated from fishing activities can enter the ocean through various routes [35], and their abundance increases over time [36]. Accordingly, MP studies in the Korean coastal waters have been continuously investigated [37,38,39,40,41] and studies on the distribution of MPs in the surrounding Yangtze River coast and East China Sea affecting the Southern Sea have also continued [42,43,44,45]. However, most of the previous studies on MP distribution did not consider seawater characteristics or evaluated sea areas only with water temperature and salinity [46,47,48]; very few studies revealed the distribution characteristics of MPs according to marine environmental characteristics.
This study investigated water quality factors (water temperature, salinity, pH, dissolved oxygen (DO), suspended particulate matter (SPM), and chlorophyll-a (Chl-a)) in the Southern Sea of Korea for principal component analysis and cluster analysis. These statistical analyses divided the sea area according to similar sea area characteristics and determined the distribution characteristics of MPs in each divided sea area. This study is expected to determine the specific characteristics of quantitative (numerical abundance) and qualitative (polymer type, size, and shape) MP distributions based on the characteristics of the water quality environment. This will provide insights as a basal study for further microplastic research investigating open seawaters.

2. Materials and Methods

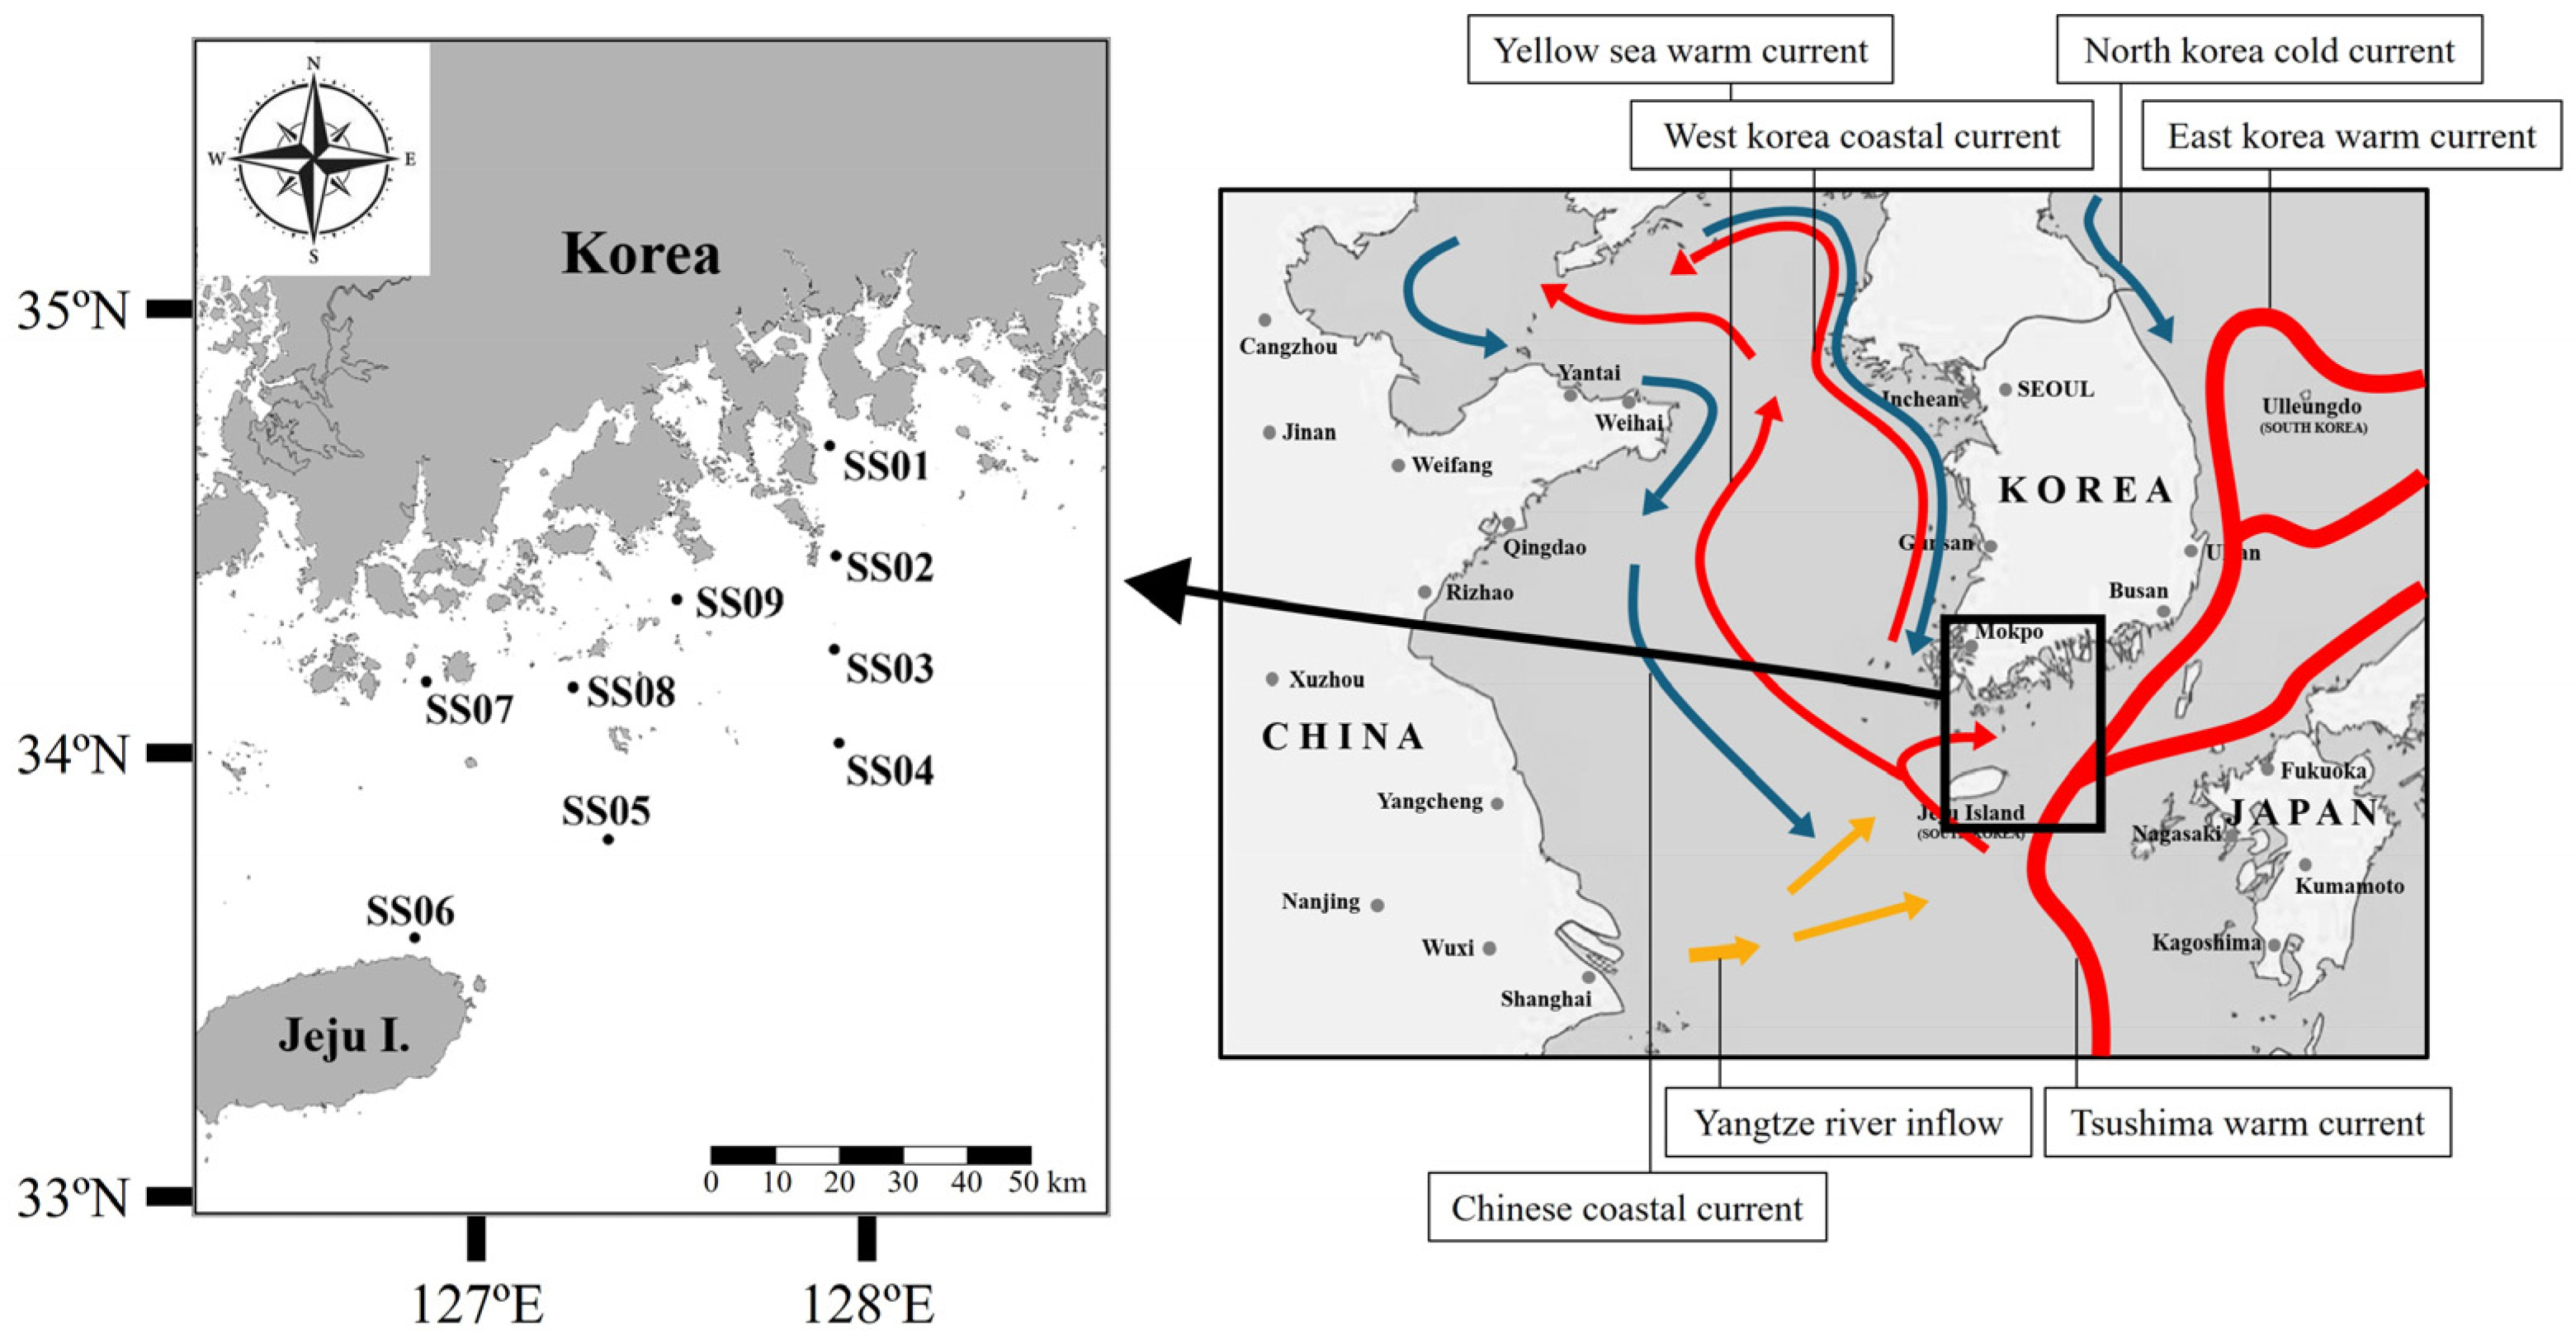
2.1. Study Area and Sampling Methods

Samples were collected at 9 sampling points in the Southern Sea of Korea from the 16–17 September 2019 using the Chonnam National University training ship Saedongbaek-ho (Table S1, Figure 1).

2.2. Water Quality Parameters

Water temperature, salinity, pH, and DO were vertically measured in real-time from the surface to the bottom of the water at each sampling point using Conductivity–Temperature–Depth (CTD SBE 19, Sea-bird Electronic, Bellevue, Washington, DC, USA) installed on the vessel. The data were collected with 0.1 m of water depth intervals and they were integrated as 1.0 m intervals.
In total, 2 L of surface seawater samples were collected at 0.5 m depth using the Rosettes Water Sampler (OCEANTEST EQUIPMENT INC, Fort Lauderdale, FL, USA) to analyze SPM and Chl-a. They were transferred into the aseptic sample bottles and stored immediately in the freezer (−20 °C) installed on the vessel. The collected water samples were transported to the laboratory using an ice box. After thawing completely, the SPM and Chl-a were analyzed in compliance with the Official Standard Measurement Methods for Marine Environment [50].
SPM was analyzed using a GF/F filter (Glass microfiber filter, Whatman, Maidstone, UK) pretreated before analysis. The filter pretreatment underwent the process of drying the GF/F filter washed in ultrapure water at 100–110 °C for 2 h using a dryer (LDO-150F, LabTech, Hopkinton, MA, USA) and, thereafter, cooling it in a desiccator for 24 h. The total weight of the dried filter was measured using an electronic scale (PAG214, OHAUS, Columbus, OH, USA) and then the dried filter was stored in a desiccator until the next step. In total, 500 mL of the sample was filtered through the prepared GF/F filter, dried at 100–110 °C for 2 h, cooled in a desiccator for 24 h, and the weight after the filtering was measured. The amount of suspended particulate matter was calculated from the difference in dry weight before and after sample filtration [50].
For Chl-a, 500 mL of the sample was filtered through filter paper (membrane filter, ADVANTEC, Taipei, Taiwan) according to the acetone extraction method and 10 mL of 90% (v/v) acetone was added thereafter to extract the pigment in a cool dark place for 24 h. Thereafter, the sample was subject to centrifugation at 3000 rpm for 15 min using a centrifuge (VS-5500i, VISION SCIENTIFIC, Daejeon, Republic of Korea); only the supernatant was taken and its absorbance was measured at wavelengths of 630 nm, 645 nm, 663 nm, and 750 nm with a spectrophotometer (UV-1800, Shimazu, Kyoto City, Kyoto Prefecture, Japan). Based on the measured absorbance, the amounts of Chl-a were calculated according to the Official Standard Measurement Methods for Marine Environment [50].

2.3. Microplastics

2.3.1. Sample Collection

To collect plastics floating on the seawater surface, a catamaran Neuston net (David/Hempel Neuston net Model 300, Hydro-Bios, Altenholz, Germany) with a 70 cm wide and 20 cm high entrance and a mesh size of 300 μm was used. The sampling was carried out for 15 min at an average speed of 2 knots while separating and towing the catamaran Neuston net using a winch on the side of the ship to minimize the influence of waves generated at the bow [51]. In addition, to calculate the amount of plastics existing in the sea area, a flow meter (model 438-115, Hydro-Bios, Germany) was installed at the entrance of the Neuston net to quantitatively measure the amount of filtered seawater. The collected samples were stored frozen at −20 °C along with seawater samples to prevent deterioration and transported to the laboratory.

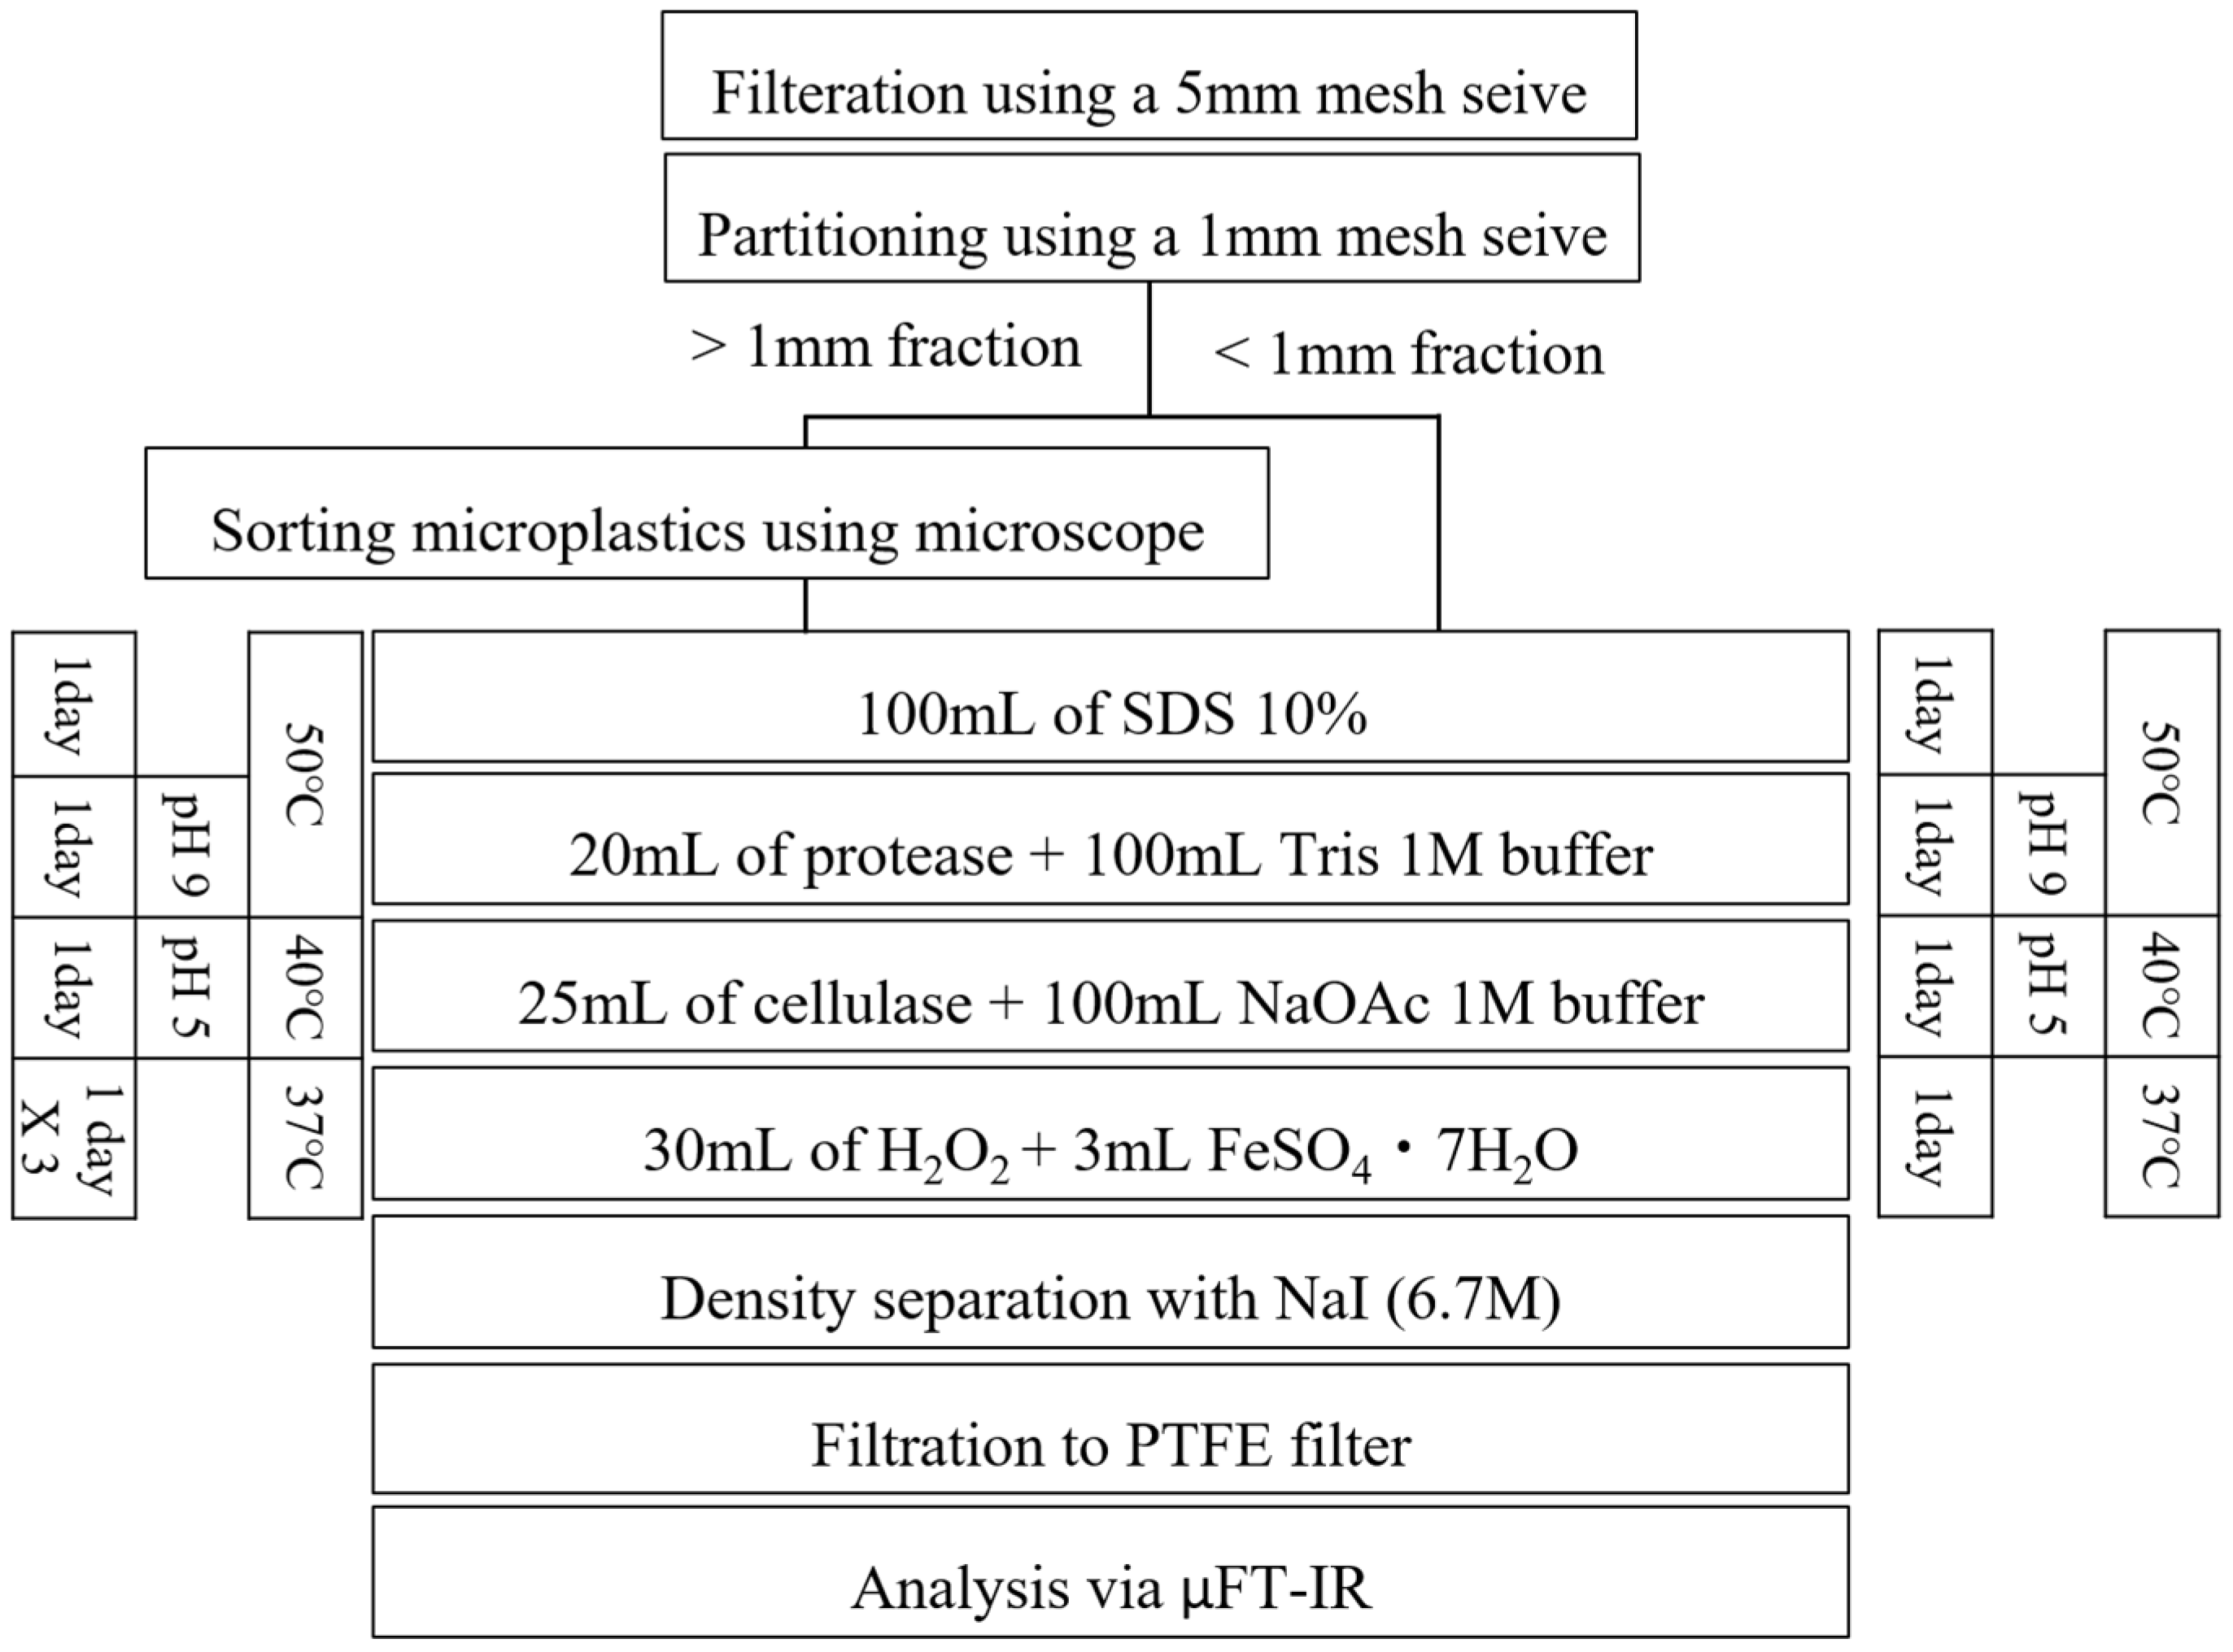
2.3.2. Pretreatment Procedures

The surface water samples for microplastics were sieved before analysis using a 5 mm sieve, which is the reference size for MPs, and sieved again thereafter using a 1 mm sieve to preferentially select those MPs that can be macroscopically collected using a microscope.
In seawater, not only MPs but also various organic substances exist, and such organic substances can act as a factor interfering with MPs analysis [52]. To solve such a problem, many previous studies have used methods to analyze MPs after removing organic matter using acids, alkalis, oxidizing solutions, etc. [53,54,55]. However, it has been reported that methods such as these can destroy some polymers with low pH resistance, such as polystyrene (PS) [56], and cause damage to the plastic surface [57]. Since the unnecessary loss of MPs occurs during the pretreatment process [58], an organic matter decomposition method using enzymes with relatively low loss was proposed [59] and it was modified and used in this study.
Pretreatment using enzymes was carried out according to the flow chart (Figure 2). Before the pretreatment, all the equipment that would be in contact with the sample was washed with 35% ethanol and ultrapure water to minimize direct and indirect contamination; only one stainless metal filter (diameter 47 mm, pore diameter 100 μm) was used per sampling point during all pretreatment processes. After each enzymatic decomposition step was completed, the residue remaining on the metal filter was put back into the sample container using ultrapure water and the washed metal filter was reused to filter the samples. At the filtration, all instruments were thoroughly rinsed with ultrapure water to exclude interference from enzymes and reagents from previous steps. The filtered sample was then placed back in the container before the next step was carried out. A hot plate (HTP352AA, ADVANTEC, Taipei, Taiwan) was used to maintain the appropriate temperature and a mercury thermometer was used to check the solution temperature.
For enzyme treatment for organic matter decomposition, 100 mL of 10% Sodium Dodecyl Sulfate (SDS), Protease A-01 (subtilisin, Wolfenbüttel, Germany), and 1 M phosphate-buffered saline (PBS) with the pH adjusted to 9.0 by adding sodium hydroxide (NaOH), Cellulase TXL (EC 3.2.14, ASA Spezialenzyme GmbH, Wolfenbüttel, Germany), and 1 M PBS with the pH adjusted to 5.0 by adding hydrochloric acid (HCl) were used [59].
First, 10% SDS was used to increase the efficiency of organic matter removal before enzymatic treatment, as it softens the residues of zooplankton and phytoplankton to increase the contact areas [59]. The samples were cultured for 24 h at 50 °C using 100 mL of 10% SDS. Protease, used in primary enzymatic treatment, promotes the decomposition of planktonic residues by dissolving protein chains [59]. Protease A-01 (subtilisin, Wolfenbüttel, Germany) was used, which has optimal activity conditions at pH 9.0 and 50 °C [59]. Therefore, 1 M PBS with the pH adjusted to 9.0 by adding NaOH was prepared. In total, 20 mL protease and 100 mL of PBS were added to the sample and mixed and the mixed sample was incubated at 50 °C for 24 h. Cellulase, used in the secondary enzyme treatment, promotes the decomposition of phytoplankton cell walls and other plant residues. Cellulase TXL (EC 3.2.14, ASA Spezialenzyme GmbH, Wolfenbüttel, Germany) was used, which has optimal activity conditions at pH 5.0 and 40 °C [59]. Therefore, 1 M PBS with the pH adjusted to 5.0 by adding HCl was prepared, 25 mL of cellulase and 100 mL of PBS were added and mixed with the sample, and the mixed sample was incubated at 40 °C for 24 h. Thereafter, to remove residual organic matter in the sample, Fenton oxidation was carried out by mixing 50 mL of hydrogen peroxide (H2O2) and 0.070 mg of FeSO4·7H2O with the mixture; in the case of samples larger than 1 mm that have large amounts of organic matter, Fenton oxidation was repeated three times.
After organic matter digestion, density separation was performed using 6.7 M NaI solution with a density of 1.6 g/cm3. In general, the separatory funnel used for density separation has the risk of making MPs become caught between the stop and cock. Therefore, in this study, the overflow density separation method proposed by Konechnaya et al. [60] was modified and employed. The sample and NaI were placed in a 100 mL cylindrical sample container with a narrow mouth and deep depth and were then shaken for 1 min so that the sample would be mixed well with the NaI. Thereafter, the container was left in a previously cleaned storage box for 24 h to separate the precipitate and MPs using density difference. To collect the separated MPs in the upper layer, a stainless-steel plate was placed at the bottom and 6.7 M NaI was dropped with a Pasteur pipette so that the MPs would float and overflow. When it was expected that the MPs had completely overflowed, the outside of the sample container was washed and the MPs on the stainless-steel plate were filtered through a 20 μm metal filter (Omnipore membrane filter, Merck Millipore Ltd., Tullagreen, Ireland). For accurate collection, this step was repeated three times and each metal filter was stored in a desiccator until the last repetition.
After three density separations, 200 mL of distilled water and a metal filter were put into each beaker and all particles were made to float through ultrasonic treatment (AU-166C, Aiwa Medical Industry Co., Ltd., Tokyo, Japan) for 15 min. The particles were made to pass through a metal tube with a diameter of 8 mm, filtered through 100 μm PTFE (polytetrafluoroethylene) filter paper, and stored on a cleaned Petri slide (PetriSlides, Merck, Darmstadt, Germany) to prevent direct or indirect contamination until analysis.

2.3.3. Microplastic Polymer Identification

Various methods have been proposed to identify the materials of MPs, such as visual identification, using analysis equipment [61]. The naked eye can identify particles larger than 1 mm with a microscope and tweezers. On the contrary, visual identification is difficult for particles smaller than 1 mm, as there is a potential to damage the sample and drag the experimental time [44].
Therefore, in this study, FT-IR (Fourier Transform Infrared Spectroscopy) (Cary 630 FTIR Spectrometer, Agilent, CA, USA), equipped with the universal diamond ATR (Attenuated Total Internal Reflection) sampling mode, was used for particles larger than 1 mm. For particles smaller than 1 mm, micro-FT-IR (Nicolet iN10 MX Infrared Microscope, ThermoFisher, Waltham, MA, USA) with the MCT (Mercury Cadmium Telluride) detector equipped with particle tracking mode was used. All analysis conditions for ATR FT-IR and iN10 MX FT-IR were used identically with a spectral resolution of 4 cm−1 in the 4000–650 cm−1 spectral range.
The spectra acquired using FT-IR ATR were compared with the ATR library database provided by MicroLab software version 5.3.0 (MicroLab software, Agilent, Santa Clara, CA, USA) and the spectra acquired using iN10 MX FT-IR were compared with the library database provided by OMNIC software version 9.8.286 (OMNIC software, ThermoFisher, Waltham, MA, USA) as well as the spectra of nine commercial plastics (polypropylene (PP), polyethylene (PE), polystyrene (PS), polyamide (PA), polyurethane (PU), polyethylene terephthalate (PET), and polyvinylchloride (PVC)). Among the acquired spectra, only those with at least 70% similarity to the library were recorded as having detected MPs.

2.3.4. Microplastic Size and Shape Measurement

A representative method of measuring the size of irregularly shaped particles through a microscope is the Feret diameter measurement method [62]. Feret diameter is measured with the vertical distances between two parallel lines bordering the sides of the particle and the longest Feret diameter is used as the maximum Feret diameter [63]. In this study, the sizes of all MPs were measured using the maximum Feret diameters.
MPs were classified into size groups: 0.1–0.5 mm, 0.5–1 mm, 1–2 mm, 2–3 mm, 3–4 mm, and 4–5 mm. Since the maximum length of particles that can pass through a 300 μm mesh is about 0.42 mm [62], 0.5 mm was set as the reference size, and MPs larger than 1 mm, which is the boundary between micro and milli, were detected in large quantities; the particles were classified in units of 1 mm.
The sizes of particles larger than 1 mm were measured using a stereoscopic zoom microscope (3.0–15.0 magnifications, SMZ25, Nikon, Tokyo, Japan) equipped with NIS-Elements BR software version 5.30.00 [Build 1531] (Nikon, Tokyo, Japan) and the size of particles smaller than 1 mm were measured using OMNIC’s graduated ruler tool in the iN10 MX FT-IR software version 9.8.286.
Shape classification of MPs was performed simultaneously with size measurement. Shapes were classified into fragments, fibers, spheres, sheets, and pellets [64].

2.3.5. QA/QC

All experimental tools were washed before use to exclude indirect contamination and experiments were performed quickly in the fume hood to minimize airborne contamination. The three blank samples containing 250 mL of ultrapure water were treated according to the same procedures as the sample analysis. Only one tiny polyethylene particle (41 μm) was found in the one blank test and no particles were found in the other two blank tests. Although these were considerably lower than the particle numbers discovered in the samples, the present study regarded the particles <100 μm as likely to be derived from atmospheric contamination and thus excluded the size <100 μm for the illustration.
Polyethylene (density 0.94 g/mL at 25 °C, average size 125 μm, Sigma Aldrich, St. Louis, MO, USA) was inspected to check the recovery rate. Briefly, the 0.05 mg of 125 μm polyethylene particles, mixed with ultrapure water, were filtered through 100 μm PTFE filter paper and rinsed with sufficient ultrapure water. Immediately after filtration, the particle numbers were counted with the stereomicroscope and a tweezer. After pretreatment with enzymatic processes following the above experimental procedure, it was filtered through a new 100 μm PTFE filter paper and immediately counted again. It was performed three times repeatedly to increase reliability. Before pretreatment, 34, 26, and 46 polyethylene particles were counted and the estimated recovery rate after the experimental procedure was regarded as acceptable at 95.8 ± 27.3%.
In addition, in order to check the physical and chemical changes that may occur on the surface of MPs after undergoing a pretreatment process using enzymes, PS commercial products and PS with sizes not smaller than 1 mm detected in marine samples were compared and analyzed. A Scanning Electron Microscope (SEM) (JCM-6000, JEOL, Tokyo, Japan) equipped with software Ver. 2.4 was used to check physical changes and, as a result of the analysis, no changes were identified before and after pretreatment (Figure S1). The FT-IR ATR was used to check chemical changes. The spectra of PS measured before and after pretreatment were compared and, as a result, no clear difference was identified (Figure S2).

2.4. Statistical Analysis

Statistical analyses such as the normality test, comparisons of median values, principal component analysis, and cluster analysis were conducted using SPSS 20.0 (SPSS Statistics, IBM, Armonk, NY, USA) and the significance level was set to 0.05 for all statistical tests. The normality was evaluated using the Shapiro–Wilk test and the median value comparisons were verified using the Kruskal–Wallis test.
Principal component analysis (PCA) and cluster analysis were employed to group the sampling points based on the water quality parameters. The entire variable (i.e., six water quality parameters) was standardized using the Equation (1) before the analyses were executed [65].
S t a n d a r d   s c o r e   ( Z ) = x μ σ
where x is the measured value in each variable, μ is the average value of each variable, and σ is the standard deviation of each variable.
In the PCA analysis, principal components with eigenvalues >1 were extracted from variables using the varimax rotation (Table S2). Only two principal components were extracted with a cumulative contribution rate of 71.4%, which satisfies the generally utilized proportion of 70% [66,67,68,69]. The cluster analysis was performed using the Ward method based on the Euclidean distances [70].

3. Results

3.1. Water Quality Parameter

The water temperature of the surface sea area was 24.16 ± 0.81 (range: 22.43–25.22) °C on average and was shown to be the highest at SS04; salinity was 31.36 ± 0.17 (range: 31.08–31.63) psu on average and was shown to be the highest at SS02. The DO concentration was shown to be 8.71 ± 0.07 (range: 8.55–8.77) mg/L on average and was shown to be the highest at SS04. The SPM level was shown to be 5.41 ± 1.3 (range: 3.43–7.43) mg/L on average and was high at SS01 and SS07 (7.43 mg/L, 7.14 mg/L). The Chl-a concentration was shown to be 1.12 ± 0.43 (range: 0.59–1.78) μg/L on average and was shown to be high at SS01 and SS07 (1.74 μg/L, 1.78 μg/L), identically to SPM. Detailed water quality parameter analysis results can be found in Table S3 and Figure S3.

3.2. Microplastics

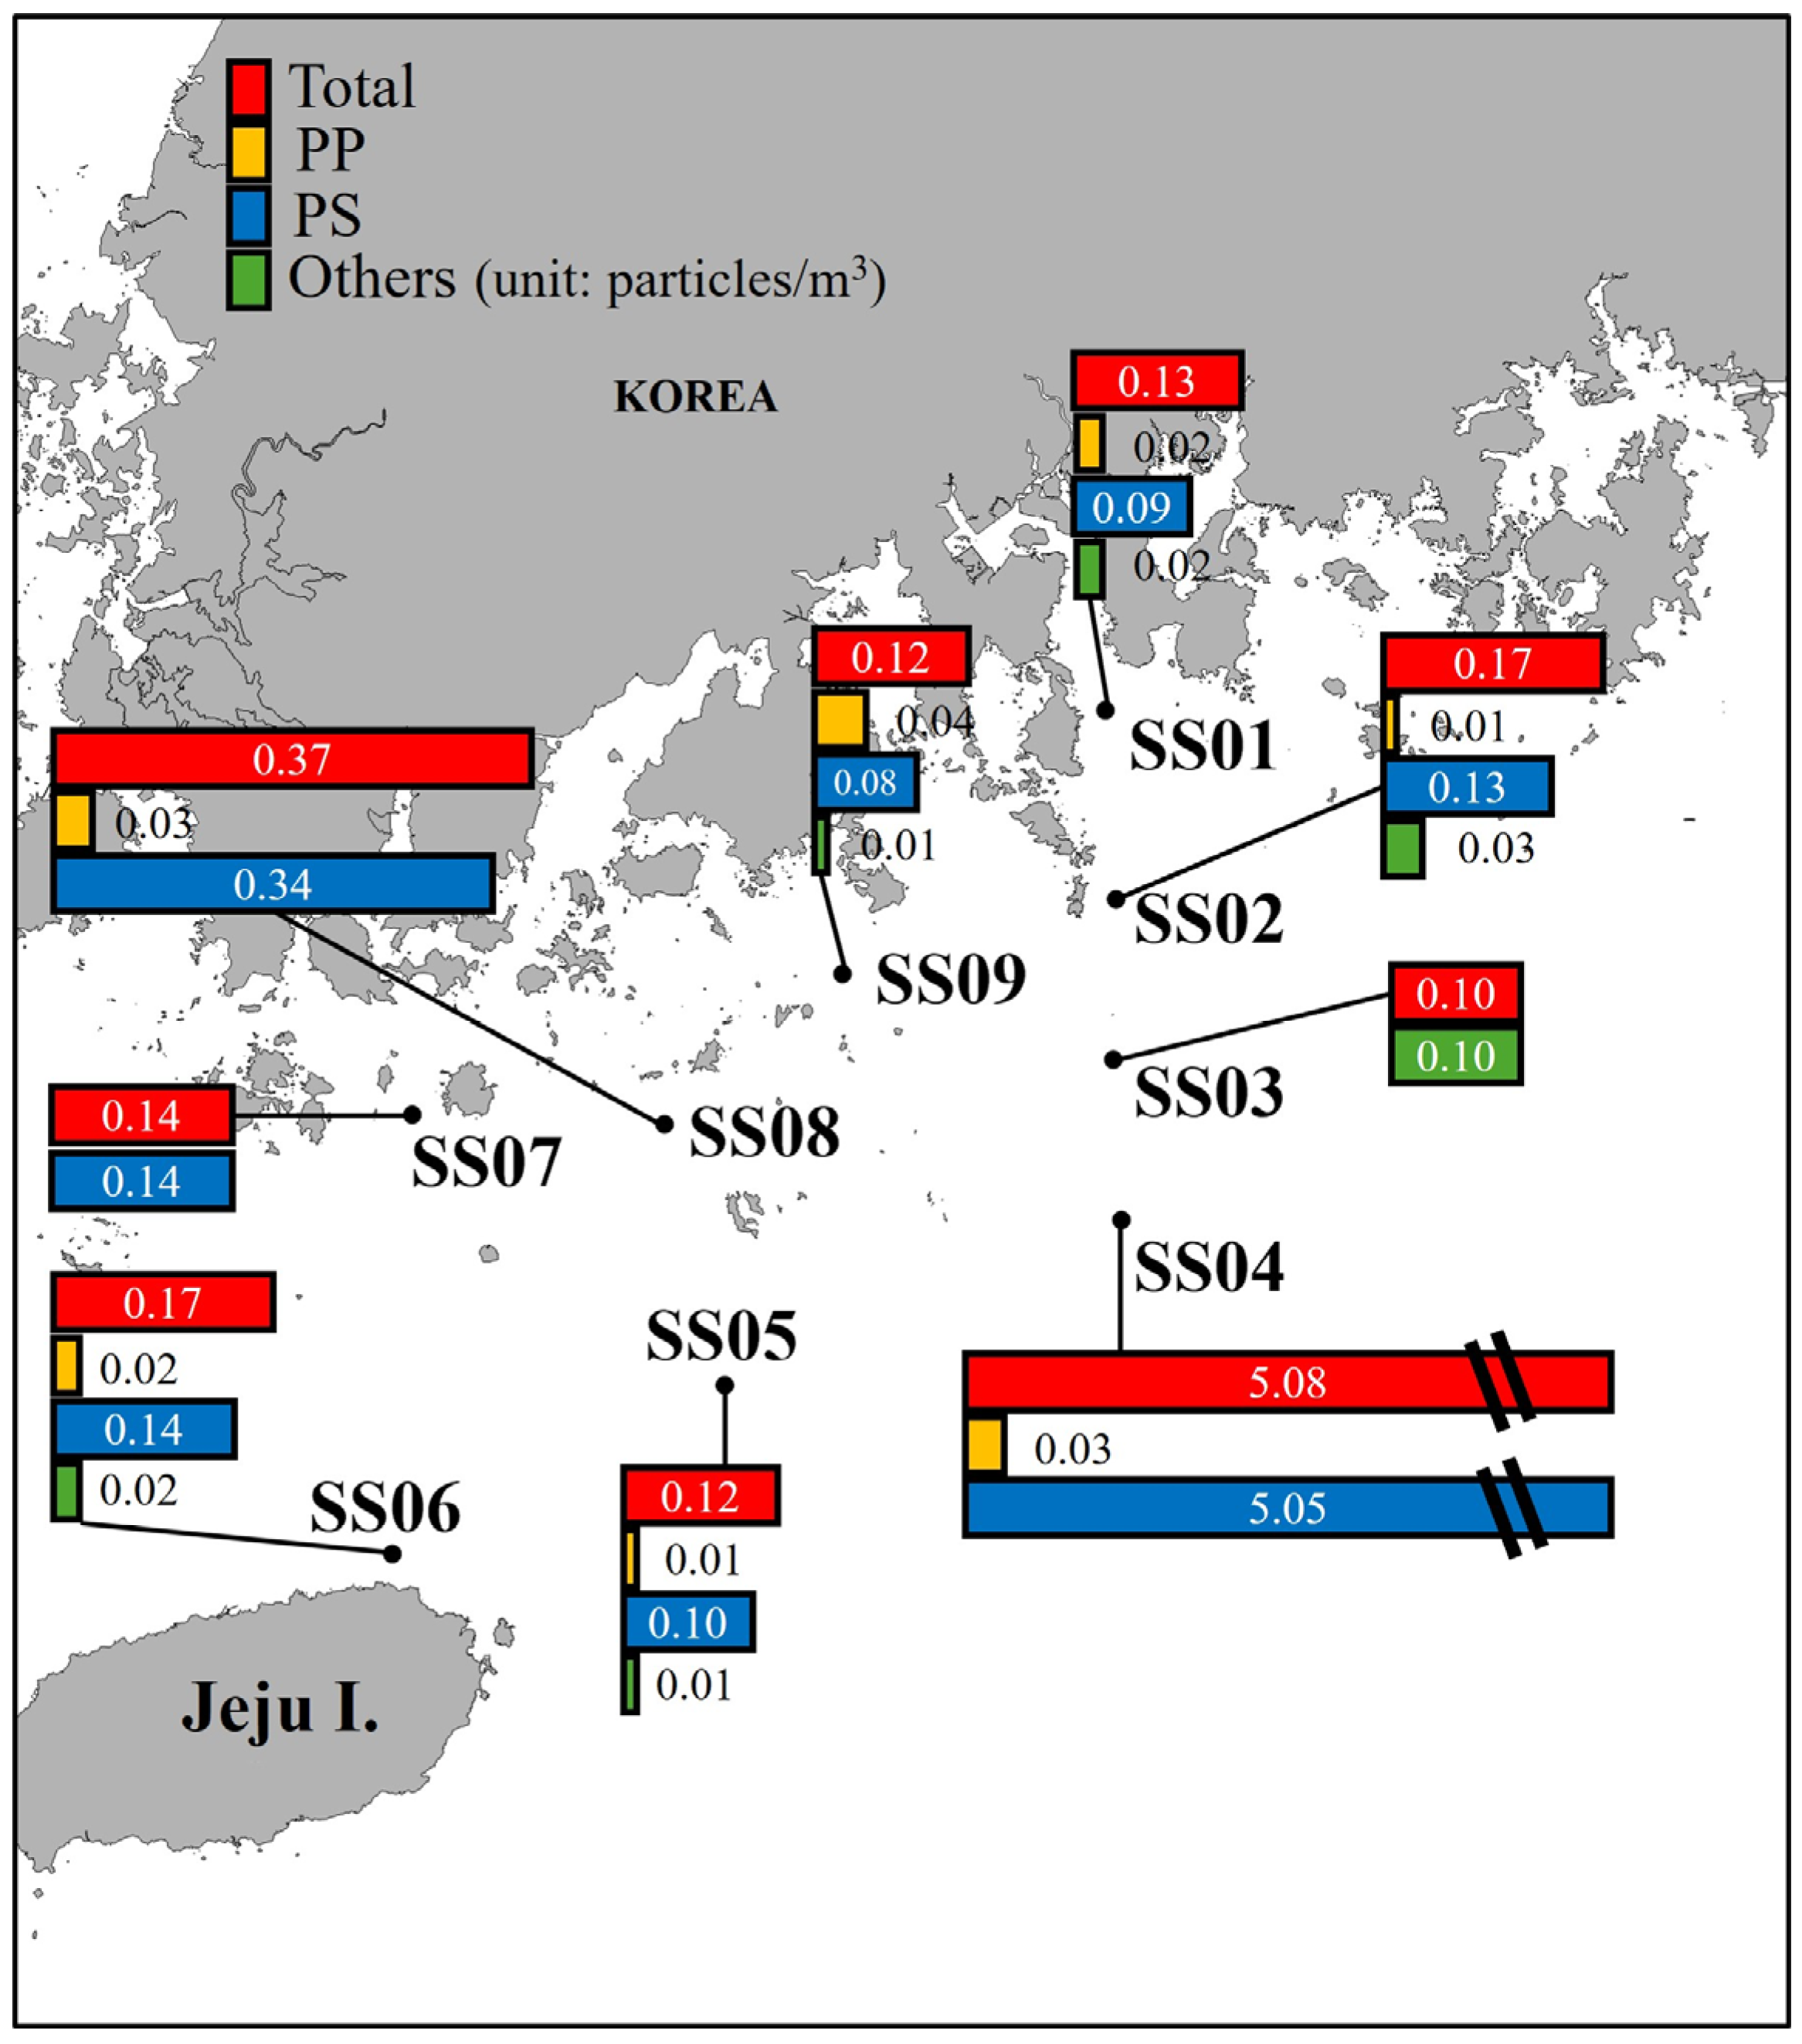
3.2.1. Microplastic Abundance

MPs in surface seawater were detected at all sampling points (Table 1, Figure 3). Representative-detected MPs are shown in Figure 4. The average abundance of MPs in the sea area was 0.71 ± 1.64 particles/m3 (n = 9, range: 0.10–5.08 particles/m3). The SS04 indicated the highest MP abundance as 5.08 particles/m3, accounting for 79.4% of the sum of MP abundances from the entire sampling area (total 6.39 particles/m3, n = 9).

3.2.2. Microplastic Polymers

Six polymer types (PP, PE, PS, nylon, PVC, and butyl acrylate) were detected using the FT-IR inspection (Figure 5). PS accounted for 94.72%, the most considerable portion of all materials, with 6.06 particles/m3, followed by PP (0.15 particles/m3, 2.31%) and butyl acrylate (0.11 particles/m3, 1.75%). In particular, among the materials detected at SS04, which showed the highest abundance of MPs, PS was dominant, accounting for 99.49% with 5.05 particles/m3. In addition, butyl acrylate was detected only at SS02 and SS03, showing a high detected amount of 74.14% at SS03.

3.2.3. Microplastic Size

Except for the 0.5–1 mm size group, all MPs size groups were detected (Figure 5). The 1 mm or larger size groups were dominant, accounting for 92.21% of the entire MPs, and among them, the 3–4 mm group accounted for 33.33% of the entire MPs. In the case of SS04, which showed the largest number of detected MPs, the 3–4 mm size group was also detected most often (36.37%), followed by the 4–5 mm size group (30.74%).

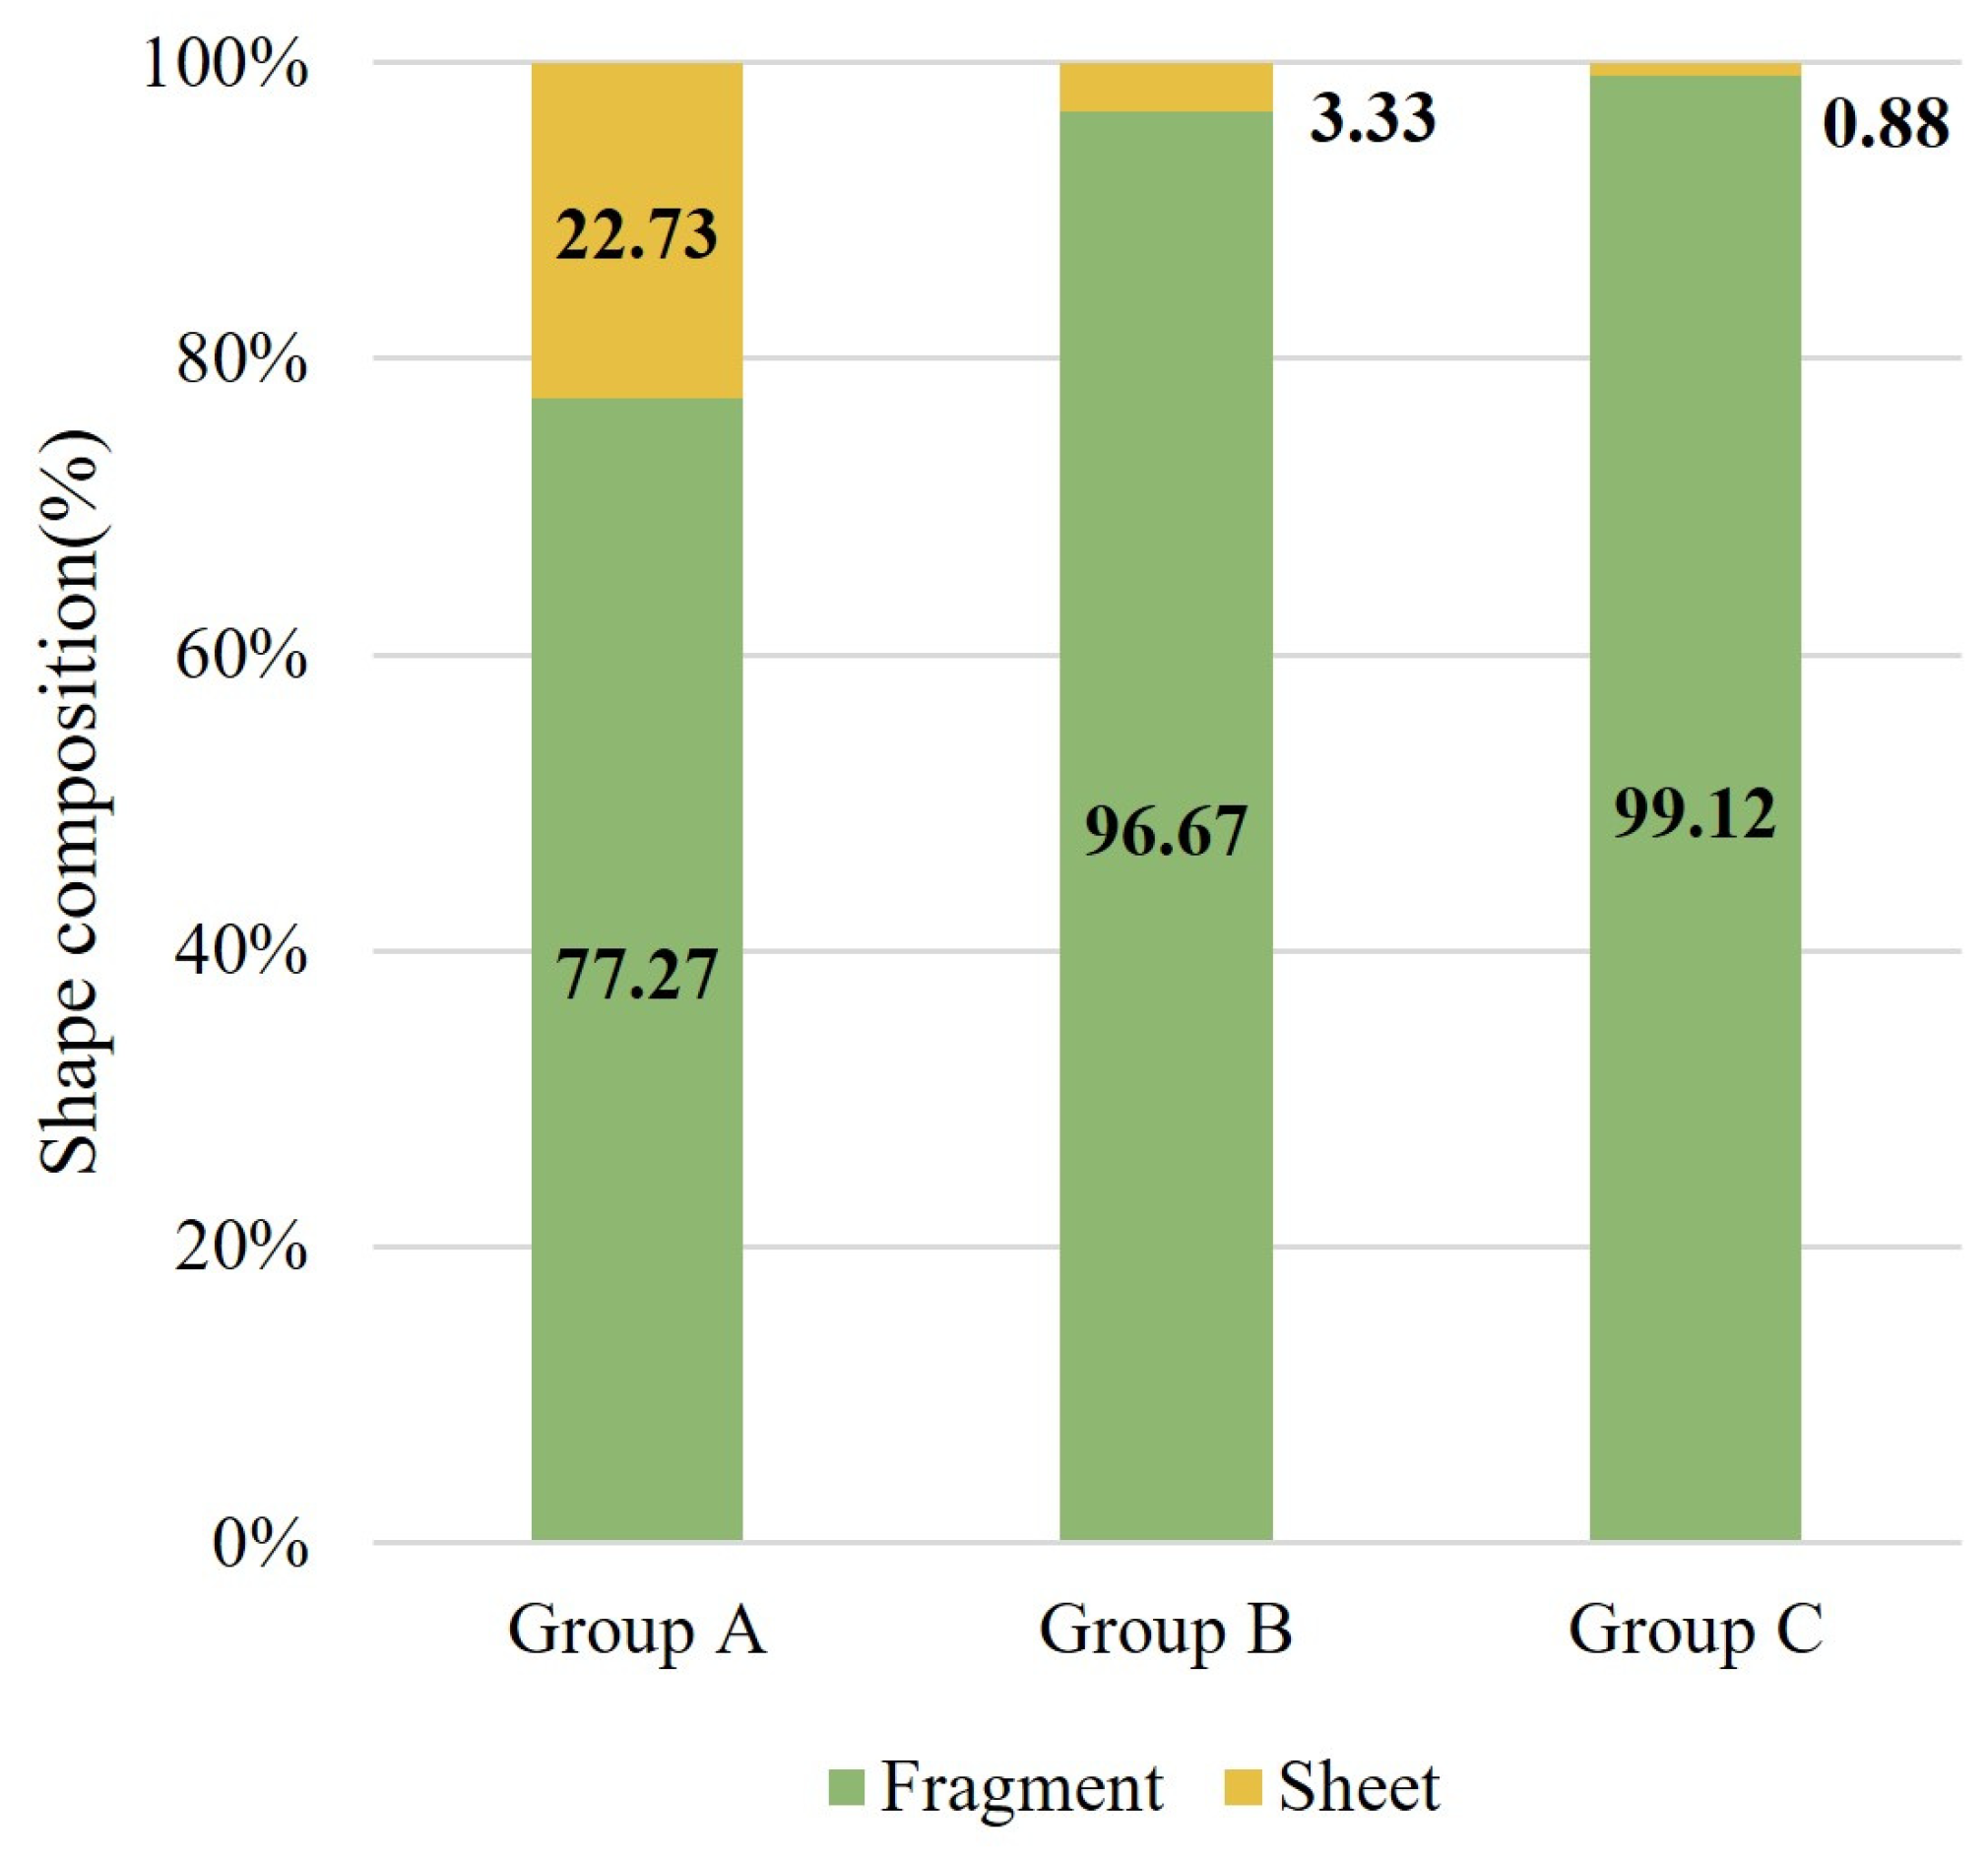
3.2.4. Microplastic Shapes

Only two types of MPs (fragment and sheet) appeared in the detected MPs (Figure 5). In particular, fragments were considerably dominant at 98.35% in the entire sampling area and the ratio of sheets was shown to be 1.65%. SS07 showed the highest portion of the sheet composition ratio (66.67%), followed by SS02 (21.74%) and SS01 (16.67%); these sampling areas are close to the mainland. SS03, SS08, and SS09 reached 100% of fragment composition, followed by SS04 (99.80%).
Most of the detected PS had similar shapes and white fragments were dominant. In most cases, relatively irregularly shaped particles were detected rather than spherical shapes. In addition, all of the butyl acrylate that was observed at SS02 and SS03 was yellow. In the case of nylon, only brown fragments were detected and in the case of PVC, only blue fragments were detected.

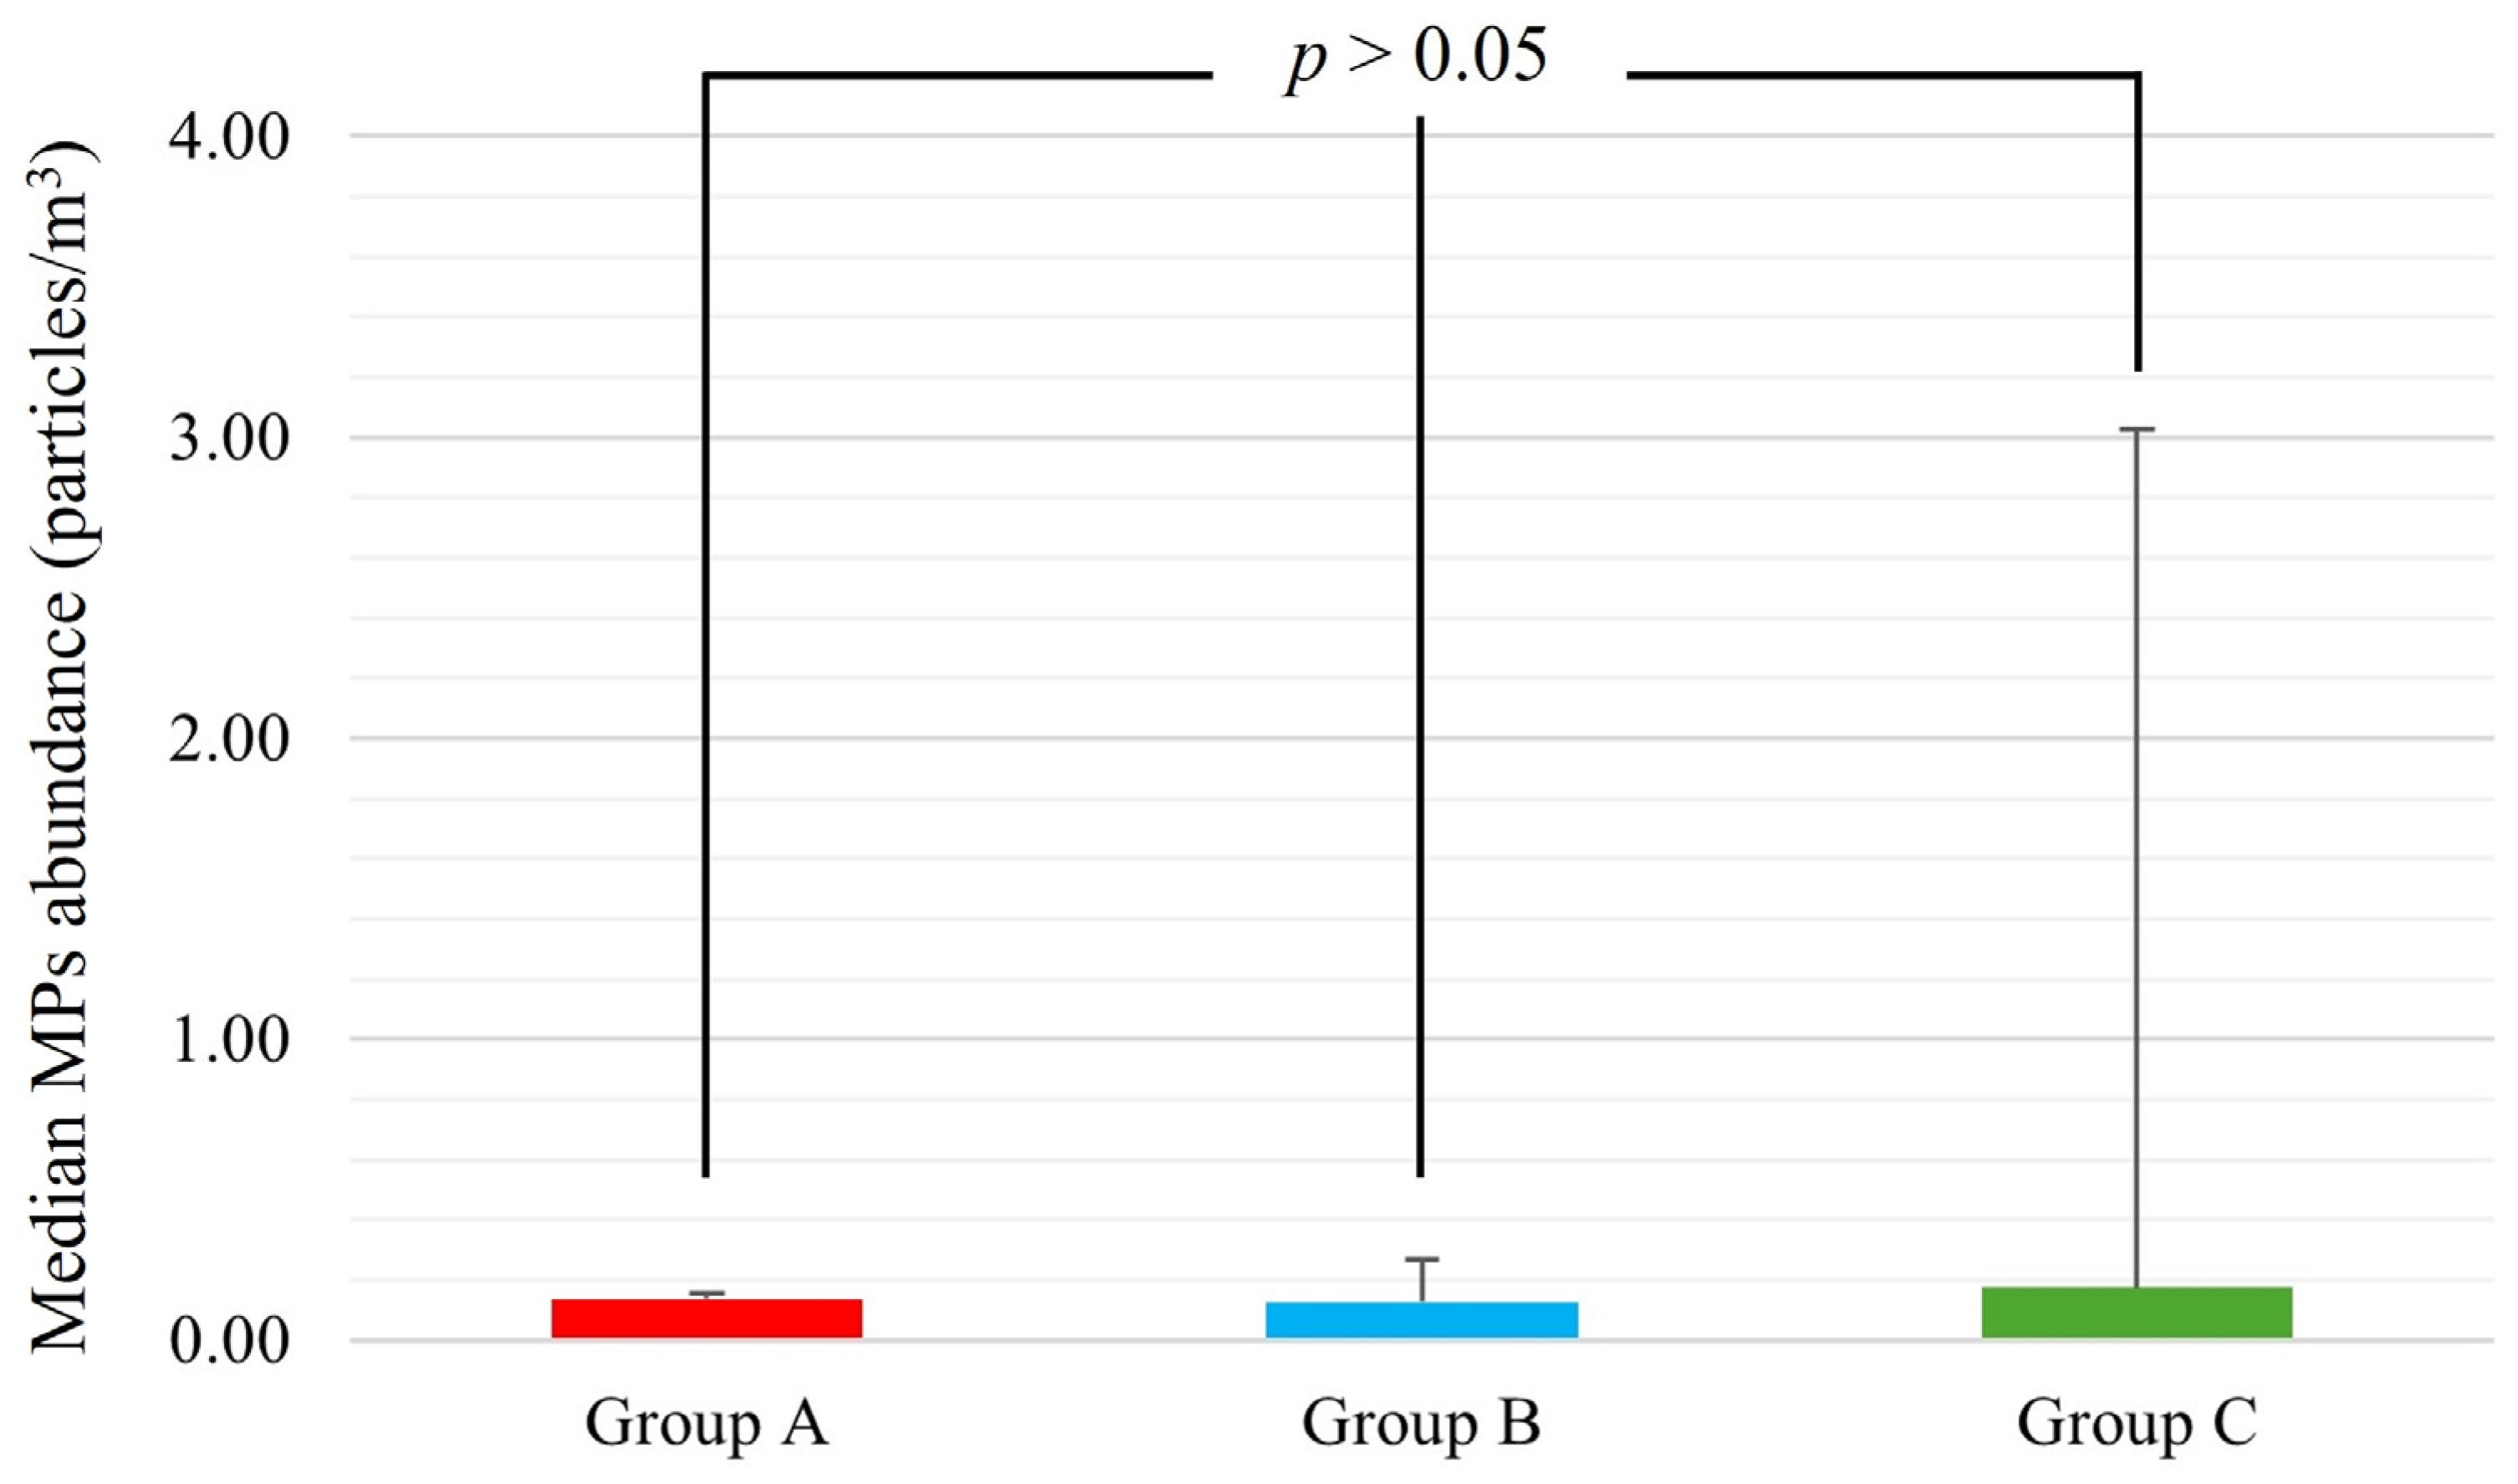
3.3. Principal Component Analysis and Cluster Analysis

Principal component analysis was conducted to identify the marine environmental characteristics of the Southern Sea of Korea in 2019 and the two principal components with a cumulative contribution rate of 71.4% were extracted in the analysis (Table S2, Figure 6).
In the loading plot, in the case of the first principal component (PC1), which explains the sea area with 35.8%, strong positive correlations were shown by water temperature, salinity, pH, and dissolved oxygen. In the case of the second principal component (PC2, 35.6%), strong positive correlations were shown by SPM and Chl-a.
Based on the foregoing, according to the results of score plot and cluster analyses, the sampling points were divided into three groups, Groups A, B, and C; SS01, SS02, and SS07 adjacent to land as Group A, sampling points SS05, SS08, and SS09 as Group B, and SS03, SS04, and SS06 as Group C (Figure 7).

4. Discussion

4.1. Sea Area Characteristics

Group A, including SS01, SS02, and SS07, was primarily determined by PC2 because PC1 contributed to SS01 and SS02 but not SS07. This implies that Group A had high phytoplankton reproduction, interpreted by SPM and Chl-a factors. These sampling points in Group A are located near the mainland and the nutrients might have been provided through the rivers, resulting in the propagation of phytoplankton.
Sampling points SS05, SS08, and SS09, located in the central parts of the study areas, revealed relatively lower water temperature, salinity, pH, and dissolved oxygen than adjacent sampling points, as shown by the negative contribution of PC1; they were grouped into Group B.
There is an argument that the emitted water from the Yangtze River in the summer season under massive rainfall may be distributed in this area [71]. Theoretically, typhoons could mix the vertical water column in the open sea, resulting in an upwelling of high-salinity water from the bottom to surface water [72]. Indeed, Typhoon No. 13 (LINGLING, maximum wind speed 54.4 m/s) occurred in the study area on 7 September 2019, 10 days before the sample collection. This fact may be one of the reasons why the average salinity (31.21 psu) in this study was higher than the ranges of the Yangtze effluent waters (<31 psu) [71]. However, this study did not trace the water mass of the Yangtze River effluent based on the narrow salinity ranges and the limited study area toward the Korean Peninsula.
The sampling points in the outside parts of the study area (SS03, SS04, and SS06) are categorized into Group C. PC1 primarily and positively contributed to this group, which was observed with relatively high water temperature and salinity, pH, and dissolved oxygen. The water temperature and salinity ranged from 24.43 to 25.22 (avg. 24.16 ± 0.81) °C and from 31.08 to 31.63 (avg. 31.36 ± 0.17) psu, respectively. These satisfied the range that several researchers argued in the Tsushima surface warm current (below 50 m of water depth) as >13.2 °C in water temperature and >30 psu in salinity [73]. The Tsushima warm current moves north from the East China Sea and passes through the Jeju and the current study sea areas to the East Sea [74,75]. This implies that the current may be the primary carrier of microplastics in Group C [76]. In the vertical water temperature distribution, there was explicitly high-temperature water from 0 to approximately 30 m of water depth in SS04 (Figure S4). The Tsushima warm current may be illuminated further outside from SS04.
The strategy studies should be investigated in the foreseeable future to verify the hypothesis on the effect of the Yangtze River and the Tsushima warm current in this study area, including the further open sea areas, such as the East China Sea and the Yellow Sea. Moreover, this study investigated one season in 2019 and various seasonal investigations should be supplemented in further strategy studies.

4.2. Microplastic Characteristics

4.2.1. Microplastic Abundance

MP abundance in the seawater varies depending on the characteristics of the study area, such as coastal water and open sea [77,78]. For instance, human activities, population and climate, sea currents, and winds are highlighted as the determining factors for MP distribution in coastal and open seas, respectively [79,80].
The Southern Sea of Korea has the most massive number and extent of fishery farms in the domestic [81,82]. The annually generated plastic waste in 1 km2 of a fishery farm reached approximately 18,795.5 particles [83], indicating that massive plastic contamination is expected in the Southern Sea of Korea. Indeed, the high MP abundance was revealed as 1146 and 2362 particles/m3 in Deukryang Bay and Gwangyang Bay [40,84], which are expected to be the primary MP origins for Group A of the present study.
Additionally, there was approximately 280 mm of precipitation in the study area in September 2019, which is quite a lot considering that the annual average recorded was 126 mm [85]. This huge precipitation may induce the MP transportation from land and coastal bay to the study area.
Minutely, MP abundance in Group A (p = 0.463) followed the normal distribution, but Groups B (p < 0.001) and C (p = 0.023) did not (Shapiro–Wilk test, n = 3). The ranges in Groups A, B, and C were 0.13–0.17 (median 0.14 ± 0.02) particles/m3, 0.12–0.37 (median 0.12 ± 0.14) particles/m3, and 0.10–5.08 (median 0.17 ± 2.85) particles/m3, respectively (Figure 8).
Although the considerably high MP abundance was revealed in the SS04, the median values in the three groups were not significantly different in the nonparametric median comparison (Kruskal–Wallis test, n = 3, p = 0.863). However, a one-order of magnitude higher MP abundance in SS04 (5.08 particles/m3) than in other sampling points (0.10–0.37 particles/m3) is significantly notable. Spatial and vertical water temperature distribution indicated that SS04 showed relatively higher rates than other sampling areas (Figures S3 and S4), implicating a possibility of Tsushima warm current effects. Eo et al. [86] reported that a thermohaline front is formed at the boundary bordered by the coastal water of the Southern Sea of Korea, the Tsushima warm current, and the Jeju gyre current. This resulted in Tsushima’s warm current water not entering the coast of Korea and flowing to the Strait of Korea [86].
In addition, there is an argument about the MP transportation from the Yangtze River, China, in summer to the East China Sea [43]. Iwasaki et al. [87] simulated MP transportation near the current study area to the Pacific Ocean through the Japanese coast. This suggests that the studies on MPs in the Southern Sea of Korea are not just issues for Korea or a single country but also play an essential role in identifying marine plastic pollution on a global scale as MPs flowing from East Asia by the Kuroshio Current through Korea–China–Japan to the Pacific Ocean and Garbage Island [88,89,90].

4.2.2. Microplastics Polymer

The predominant MP polymer type in the whole sampling point was PS, accounting for 81.5%, 84.4%, and 97.0% of the polymer composition in Groups A, B, and C, respectively (Figure 9). The most considerable portion (90.8%) of PS was observed as expanded polystyrene (EPS), commonly known as styrofoam, which is frequently adopted in fishery industries [91].
The EPS is produced using expandable PS particles for household appliances, construction, and other uses [92]. It is more vulnerable to external forces than other polymers [93], resulting in its wide presence in marine environments [94,95]. The high percentage of EPS in this study is consistent with the previous report, which revealed excessive EPS particles on the beaches of the Southern Sea of Korea derived from fishery farming [96]. This tendency was also found in the 70% and 20% of plastic litter generated in China Yangtze [97] and Zhejiang [98] rivers, respectively, which may be transported via sea current to the East China Sea and the present study area.
Butyl acrylate was detected only in SS02 and SS03 near Gwangyang Bay, a primary domestic port with numerous offshore structures and frequent ship movements [99,100,101]. It is one of the ingredients for antifouling paints, which is coated on the ship to prevent attached organisms and improve vessel speed and economics [102,103]. There are reports on the toxicity of butyl acrylate itself and the additives eluted from the decomposition process [104,105,106]. The present study is suggestive of the risk of non-targeted marine organisms due to the butyl acrylate [107].
Nylons observed in the SS01 in Group A and SS09 in Group B are generally used for garments, particularly washing machines, and fishing activities such as monofilament and fishing gear [108]. PVC in SS01 in Group A could be used as household products or materials to construct offshore structures [109,110].
Interestingly, PE was not the primary polymer type in this study, contrary to other studies. PE is susceptible to breaking down into small particles and frequently exists in various environmental matrices [62]. However, this study employed a relatively large mesh size (300 μm) to collect surface water samples and it might not be suitable to collect the tiny MPs [111]. For instance, PP and PE were (67%) the dominant MP types collected by 20 μm in the surface water in the East China Sea, with characteristics similar to those of the present study [44].
Studies on the origins and fates of microplastics in this open sea area are minimal because of limited accessibility, relatively large research projects, a massive vessel, and professional human resources. As mentioned earlier, this study also has a limitation in the extent of the study area and further strategy studies are required to trace the origin of microplastics based on the marine environment characteristics for a broader sea area than the present study area.

4.2.3. Microplastic Size

Groups A and B mainly showed MPs of sizes smaller than 1 mm (avg. Group A: 0.71 ± 1.06 mm, Group B: 0.98 ± 1.22 mm), while Group C (avg. 3.11 ± 1.08 mm) showed relatively many particles larger than 1 mm. The particle size of Group C was statistically distinguished from Groups A and B (Kruskal–Wallis test, n = 3, Bonferroni post hoc, p-value < 0.001), while Groups A and B were not (Figure 10).
In general, MPs found in coastal waters are weathered and fragmented by physical and chemical factors and the particle sizes become smaller as the distance from the land source increases [112]. On the contrary, the size distribution of plastics detected at SS04, which is closest to the open sea, was in the range of 3–4 mm, as many relatively large particles appeared. Shamskhany et al. [113] reported a tendency for relatively large MPs of sizes between 2 and 4 mm to appear predominantly in open surface seawater, consistent with this study.
There is an argument that the smaller the MP, the easier it is to form a biofilm, leading to an increase in sinking [114]. This argument implicates the possibility that MPs with small particle sizes settled over time due to a biofilm and that only relatively large particles remained to reach the study area in the transportation from the remote sea into the Southern Sea via the Tsushima warm current.
Meanwhile, Jeong et al. [62] reported that 96.7% of MPs may have been underestimated in the 355 μm mesh compared to the 100 μm mesh. The number of MPs is determined by the minimum Feret diameter and the maximum size of particles passing through the mesh [115,116]. This study might underestimate numerous MPs, which are smaller than the mesh.
Moreover, the relatively small plastics collected in the current study compared to the maximum Feret diameter indicate that mesh clogging occurred during sample collection [62]. The large size of the mesh in this study was employed to avoid net clogging, which is pointed out as the primary factor disrupting sample collection in the marine environment [22,62]; but, clogging was inevitable.

4.2.4. Microplastic Shape

The fragment shape was a predominant type, gradually increasing the composition from Group A to C (Figure 11).
The butyl acrylate fragment that might be derived from the ship movements was observed only at the entrance of Gwangyang Bay (SS02 and SS03). Additionally, most detected PS were identified as EPS and have similar characteristics, such as 2–3 mm size, white color, and fragment shape. The EPS is expected to originate from the large-scale EPS buoy based on easily degradable traits [112].
The surfaces of the collected EPS particles were irregular rather than spherical. Irregularly shaped MPs may have slower sinking speeds than spherical ones when the particle size is assumed to be the same [117], resulting in MPs that are irregularly shaped floating in the surface layer. The irregular surface suggests that secondary MPs formed by weathering in the marine environment are more prevalent than primary MPs regardless of the grouped sea areas based on the marine characteristics in this study.
Meanwhile, while fibrous plastics were observed to be dominant in existing marine surface waters [117,118,119], they were not found in this study. Fibrous MPs are easy to bend and entangle and have mesh selections that are different from other shapes [62,120]. The sampling method used to collect MPs using large meshes may have underestimated the fibers [62,120]. Open sea, with low presence amount, net clogging, and overflowing can be enumerated as other factors disrupting the fibrous collection in the large mesh size [62,116]. It is necessary to determine the MP distribution characteristics to reflect more diverse shapes and small sizes using the bulk water sampling method [44].

5. Conclusions

The microplastic distribution characteristics were determined depending on the water characteristics in the Southern Sea of Korea in the summer of 2019. The study area was categorized into three groups. MP abundance in each group was not statistically significant. Notably, there was excessive MP abundance in SS04 that might be derived from the Tsushima warm current. Expanded polystyrene was the predominant polymer type in the entire group and polyethylene was rarely observed, which was inconsistent with previous studies. Particle size in Group C was statistically larger than in Groups A and B. Biofilm forming onto relatively small particles is expected to render them as sinkable faster than large ones. The fragment composition ascended from Group A toward C, while the sheet portion descended. The secondary MPs were dominant in the study area regardless of the groups.

Supplementary Materials

The following supporting information can be downloaded at https://www.mdpi.com/article/10.3390/su16156272/s1. Figure S1: Before (Upper) and after (Down) comparison using SEM on Polyethylene; Figure S2: Before (Upper) and after (Down) comparison using ATR FT-IR on Polyethylene; Figure S3: Results of the spatial (a) Water Temperature (Temp.), (b) Salinity (Sal.), (c) pH, (d) Dissolved Oxygen (DO), (e) Suspended Particulate Matter (SPM), (f) Chlorophyll-a (Chl-a) distributions on the surface water in Southern sea of Korea.; Figure S4: Water temperature as a function of depth at and around sampling point 4; Table S1: Coordinates of the sampling point; Table S2: Results of eigen value, proportion and accumulative proportion of Principal Component Analysis (PCA); Table S3: Descriptive statistics of water quality parameter.

Author Contributions

Conceptualization, K.Y.K., H.H.J., J.H.K., Y.I. and H.S.C.; methodology, K.Y.K., H.H.J., J.H.K., C.R.C., H.Y.S., Y.I. and H.S.C.; validation, K.Y.K. and H.H.J.; formal analysis, K.Y.K., H.H.J. and B.K.M.; investigation, H.H.J. and B.K.M.; data curation, K.Y.K. and H.H.J.; writing—original draft preparation, K.Y.K. and H.H.J.; writing—review and editing, K.Y.K., H.H.J., B.K.M., C.R.C. and H.S.C.; visualization, K.Y.K. and H.H.J.; supervision, H.S.C.; project administration, H.S.C.; funding acquisition, C.R.C., H.Y.S., Y.I. and H.S.C. All authors have read and agreed to the published version of the manuscript.

Funding

This research was financially supported by the Institute of Civil-Military Technology Cooperation funded by the Defense Acquisition Program Administration and Ministry of Trade, Industry and Energy of the Korean government, under grant No. 22-DC-EL-06.

Institutional Review Board Statement

Not applicable.

Informed Consent Statement

Not applicable.

Data Availability Statement

Data are contained within the article.

Acknowledgments

This research was supported by Basic Science Research Program through the National Research Foundation of Korea (NRF) funded by the Ministry of Education (RS-2023-0024799240982119420001) and Korea Institute of Marine Science and Technology Promotion (KIMST) funded by the Ministry of Oceans and Fisheries, Korea (RS-2018-KS181192).

Conflicts of Interest

Author Chon Rae Cho was employed by the company Best Environmental Technology Co., Ltd. The remaining authors declare that the research was conducted in the absence of any commercial or financial relationships that could be construed as a potential conflict of interest.

References

  1. Arthur, C.; Baker, J.E.; Bamford, H.A. Proceedings of the International Research Workshop on the Occurrence, Effects, and Fate of Microplastic Marine Debris, 9–11 September 2008; University of Washington Tacoma: Tacoma, WA, USA, 2009. Available online: https://repository.library.noaa.gov/view/noaa/2509 (accessed on 29 April 2024).
  2. Duis, K.; Coors, A. Microplastics in the aquatic and terrestrial environment: Sources (with a specific focus on personal care products), fate and effects. Environ. Sci. Eur. 2016, 28, 2. [Google Scholar] [CrossRef] [PubMed]
  3. Guzzetti, E.; Sureda, A.; Tejada, S.; Faggio, C. Microplastic in marine organism: Environmental and toxicological effects. Environ. Toxicol. Pharmacol. 2018, 64, 164–171. [Google Scholar] [CrossRef] [PubMed]
  4. Andrady, A.L.; Neal, M.A. Applications and societal benefits of plastics. Philos. Trans. R. Soc. B Biol. Sci. 2009, 364, 1977–1984. [Google Scholar] [CrossRef] [PubMed]
  5. Thompson, R.C.; Moore, C.J.; Vom Saal, F.S.; Swan, S.H. Plastics, the environment and human health: Current consensus and future trends. Philos. Trans. R. Soc. B Biol. Sci. 2009, 364, 2153–2166. [Google Scholar] [CrossRef] [PubMed]
  6. Law, K.L. Plastics in the marine environment. Annu. Rev. Mar. Sci. 2017, 9, 205–229. [Google Scholar] [CrossRef] [PubMed]
  7. Valavanidis, A. Plastic Pollution, Unsustainable Environmental Problem? Industry and academic research must co-operate to short out the pervasive global problem of plastic waste. Sci. Rev. 2024, 1, 1–42. [Google Scholar]
  8. OECD. Global Plastics Outlook: Policy Scenarios to 2060; OECD Publishing: Paris, France, 2022. [Google Scholar] [CrossRef]
  9. Wang, S.; Chen, H.; Zhou, X.; Tian, Y.; Lin, C.; Wang, W.; Zhou, K.; Zhang, Y.; Lin, H. Microplastic abundance, distribution and composition in the mid-west Pacific Ocean. Environ. Pollut. 2020, 264, 114125. [Google Scholar] [CrossRef] [PubMed]
  10. Andrady, A.L. The plastic in microplastics: A review. Mar. Pollut. Bull. 2017, 119, 12–22. [Google Scholar] [CrossRef] [PubMed]
  11. Shim, W.J.; Hong, S.H.; Eo, S.E. Marine Microplastics: Abundance, Distribution, and Composition. Microplastic Contamination in Aquatic Environments; Elsevier: Amsterdam, The Netherlands, 2018; pp. 1–26. [Google Scholar] [CrossRef]
  12. do Sul JA, I.; Costa, M.F. The present and future of microplastic pollution in the marine environment. Environ. Pollut. 2014, 185, 352–364. [Google Scholar] [CrossRef] [PubMed]
  13. Xanthos, D.; Walker, T.R. International policies to reduce plastic marine pollution from single-use plastics (plastic bags and microbeads): A review. Mar. Pollut. Bull. 2017, 118, 17–26. [Google Scholar] [CrossRef] [PubMed]
  14. Van Sebille, E.; Wilcox, C.; Lebreton, L.; Maximenko, N.; Hardesty, B.D.; Van Franeker, J.A.; Eriksen, M.; Eriksen, D.; Galgani, F.; Law, K.L. A global inventory of small floating plastic debris. Environ. Res. Lett. 2015, 10, 124006. [Google Scholar] [CrossRef]
  15. Wright, S.L.; Thompson, R.C.; Galloway, T.S. The physical impacts of microplastics on marine organisms: A review. Environ. Pollut. 2013, 178, 483–492. [Google Scholar] [CrossRef] [PubMed]
  16. Ashton, K.; Holmes, L.; Turner, A. Association of metals with plastic production pellets in the marine environment. Mar. Pollut. Bull. 2010, 60, 2050–2055. [Google Scholar] [CrossRef] [PubMed]
  17. Benson, N.U.; Fred-Ahmadu, O.H. Occurrence and distribution of microplastics-sorbed phthalic acid esters (PAEs) in coastal psammitic sediments of tropical Atlantic Ocean, Gulf of Guinea. Sci. Total Environ. 2020, 730, 139013. [Google Scholar] [CrossRef] [PubMed]
  18. Ramirez MM, B.; Caamal, R.D.; von Osten, J.R. Occurrence and seasonal distribution of microplastics and phthalates in sediments from the urban channel of the Ria and coast of Campeche, Mexico. Sci. Total Environ. 2019, 672, 97–105. [Google Scholar] [CrossRef] [PubMed]
  19. Thompson, R.C.; Olsen, Y.; Mitchell, R.P.; Davis, A.; Rowland, S.J.; John, A.W.; McGonigle, D.; Russell, A.E. Lost at sea: Where is all the plastic. Science 2004, 304, 838. [Google Scholar] [CrossRef] [PubMed]
  20. Zimmermann, L.; Göttlich, S.; Oehlmann, J.; Wagner, M.; Völker, C. What are the drivers of microplastic toxicity? Comparing the toxicity of plastic chemicals and particles to Daphnia magna. Environ. Pollut. 2020, 267, 115392. [Google Scholar] [CrossRef] [PubMed]
  21. Groh, K.J.; Backhaus, T.; Carney-Almroth, B.; Geueke, B.; Inostroza, P.A.; Lennquist, A.; Leslie, H.A.; Maffini, M.; Slunge, D.; Trasand, L. Overview of known plastic packaging-associated chemicals and their hazards. Sci. Total Environ. 2019, 651, 3253–3268. [Google Scholar] [CrossRef] [PubMed]
  22. Michida, Y.; Chavanich, S.; Chiba, S.; Cordova, M.R.; Cozsar Cabanas, A.; Glagani, F.; Hagmann, P.; Hinata, H.; Isobe, A.; Kershaw, P.; et al. Guidelines for Harmonizing Ocean Surface Microplastic Monitoring Method, Version 1.1; Ministry of the Environment, Japan: Tokyo, Japan, 2019. [CrossRef]
  23. Choi, M.H.; Seo, H.S.; Kim, D.S. A Study on the Distribution of Summer Water Temperatures of the Central Coast of the Southern Sea of Korea Using Numerical Experimentation. J. Korean Soc. Mar. Environ. Saf. 2017, 23, 83–90. [Google Scholar] [CrossRef]
  24. Yeh, S.W.; Kim, C.H. Recent warming in the Yellow/East China Sea during winter and the associated atmospheric circulation. Cont. Shelf Res. 2010, 30, 1428–1434. [Google Scholar] [CrossRef]
  25. Bae, S.W.; Kim, D.S. Understanding the flow properties by a numerical modeling in the South Sea of Korea. J. Korean Soc. Mar. Environ. Saf. 2012, 18, 295–307. [Google Scholar] [CrossRef]
  26. Lee, C.I.; Cho, K.D.; Choe, Y.K. Spatial Variation of the Polar Front in relation to the Tsushima Warm Current in the East sea. Korean Environ. Sci. Soc. 2003, 12, 943–948. [Google Scholar] [CrossRef]
  27. Jang, S.T.; Lee, J.; Kim, C.H.; Jang, C.; Jang, Y.S. Movement of Cold Water Mass in the Northern East China Sea in Summer. Korean Soc. Ocean. 2011, 16, 1–13. [Google Scholar] [CrossRef]
  28. Jung, S.W.; Park, J.K.; Jeong, D.H.; Lim, D.I. Seasonal Changes in Water Masses and Phytoplankton Communities in the Western Part of South Coastal Waters, Korea. Korean J. Environ. Biol. 2012, 30, 328–338. [Google Scholar] [CrossRef]
  29. Yang, Y.J.; Kim, S.H.; Rho, H.K. A Study on the Temperature Fronts observed in the South—West Sea of Korea and the Northern Area of the East China Sea. Korean J. Fish. Aquat. Sci. 1998, 31, 695–706. [Google Scholar]
  30. Yoon, S.C.; Youn, S.H.; Whang, J.D.; Suh, Y.S.; Yoon, Y.Y. Long-term variation in ocean environmental conditions of the northern East China Sea. J. Korean Soc. Mar. Environ. Energy 2015, 18, 189–206. [Google Scholar] [CrossRef]
  31. Yoon, Y.H.; Park, J.S.; Soh, H.Y.; Hwang, D.J. A Characteristics of Thermohaline Structure and Phytoplankton Community from Southwestern Parts of the East China Sea during Early Summer, 2004. Korean Soc. Mar. Environ. Energy 2005, 8, 100–110. [Google Scholar] [CrossRef]
  32. Lee, H.G.; Kang, T.W.; Oh, J.H.; Min, W.G.; Rho, H.S.; Kim, D.S. Distributional Characteristics of the Meiobenthic Community in Gamak Bay in the South Sea, Korea. Korean Assoc. Ocean. Sci. Technol. Soc. 2011, 34, 79–90. [Google Scholar] [CrossRef]
  33. Yoon, Y.H. Characteristics on spatial distributions of phytoplankton communities in relation to water masses in the western South Sea, Korea in early autumn 2021. Korean J. Environ. Biol. 2021, 39, 559–572. [Google Scholar] [CrossRef]
  34. Pravettoni, R.; Rekacewicz, P. Global Linkages—A Graphic Look at the Changing Arctic (Rev.1). 2019. Available online: https://www.grida.no/resources/13339 (accessed on 29 April 2024).
  35. Lusher, A.; Hollman, P.; Mendoza-Hill, J. Microplastics in Fisheries and Aquaculture: Status of Knowledge on Their Occurrence and Implications for Aquatic Organisms and Food Safety; Fisheries and Aquaculture Technical Paper No. 615; FAO: Rome, Italy, 2017; Available online: https://www.proquest.com/docview/1932298451/abstract/C03F2A1029C94777PQ/1?accountid=27782&sourcetype=Scholarly%20Journals (accessed on 29 April 2024).
  36. Kumar, S.; Singh, E.; Mishra, R.; Kumar, A.; Caucci, S. Utilization of plastic wastes for sustainable environmental management: A review. ChemSusChem 2021, 14, 3985–4006. [Google Scholar] [CrossRef] [PubMed]
  37. Cho, Y.; Shim, W.J.; Jang, M.; Han, G.M.; Hong, S.H. Abundance and characteristics of microplastics in market bivalves from South Korea. Environ. Pollut. 2019, 245, 1107–1116. [Google Scholar] [CrossRef] [PubMed]
  38. Kang, J.H.; Kwon, O.Y.; Shim, W.J. Potential threat of microplastics to zooplanktivores in the surface waters of the Southern Sea of Korea. Arch. Environ. Contam. Toxicol. 2015, 69, 340–351. [Google Scholar] [CrossRef] [PubMed]
  39. Kwon, O.Y.; Kang, J.H.; Shim, W.J.; Hong, S.H. Distributional Characteristics of Microplastics in the Coastal Waters in East Sea of Korea; The Korean Society of Oceanography: Jeju, Republic of Korea, 2015; pp. 228–230. Available online: https://sciwatch.kiost.ac.kr/handle/2020.kiost/25159 (accessed on 29 April 2024).
  40. Kwon, O.Y.; Kang, J.H.; Shim, W.J.; Hong, S.H. Distributional Characteristics of Microplastics in the Coastal Waters in South Sea, Korea; The Korean Society of Oceanography: Jeju, Republic of Korea, 2016; p. 246. Available online: https://sciwatch.kiost.ac.kr/handle/2020.kiost/24460 (accessed on 29 April 2024).
  41. Kwon, O.Y.; Kang, J.H.; Hong, S.H.; Shim, W.J. Spatial distribution of microplastic in the surface waters along the coast of Korea. Mar. Pollut. Bull. 2020, 155, 110729. [Google Scholar] [CrossRef]
  42. Huang, Y.; Chen, M.; Wang, Z.; Jiang, L.; Fan, S.; Zheng, R.; Yu, X. Impacts of terrestrial input on the distribution characteristics of microplastics in the East China Sea characterized by chromophoric dissolved organic matter (CDOM) analysis. Sci. Total Environ. 2022, 838, 156599. [Google Scholar] [CrossRef] [PubMed]
  43. Isobe, A.; Uchida, K.; Tokai, T.; Iwasaki, S. East Asian seas: A hot spot of pelagic microplastics. Mar. Pollut. Bull. 2015, 101, 618–623. [Google Scholar] [CrossRef] [PubMed]
  44. Min, B.K.; Jeong, H.H.; Ju, M.J.; Ko, U.; Dae, K.H.; Kim, H.J.; Cho, C.R.; Soh, H.Y.; Ishibashi, Y.; Cho, H.S. Baseline Study on Microplastic Distribution in the Open Surface Waters of the Korean Southwest Sea. Water 2023, 15, 2393. [Google Scholar] [CrossRef]
  45. Xiong, W.; Mei, X.; Mi, B.B.; Yang, H.; Han, Z.Z.; Zhang, Y.; Lü, W.C. Current status and cause analysis of microplastic pollution in sea areas in China. China Geol. 2022, 5, 160–170. [Google Scholar] [CrossRef]
  46. Horton, A.A.; Barnes, D.K. Microplastic pollution in a rapidly changing world: Implications for remote and vulnerable marine ecosystems. Sci. Total Environ. 2020, 738, 140349. [Google Scholar] [CrossRef] [PubMed]
  47. La Daana, K.K.; Officer, R.; Lyashevska, O.; Thompson, R.C.; O’Connor, I. Microplastic abundance, distribution and composition along a latitudinal gradient in the Atlantic Ocean. Mar. Pollut. Bull. 2017, 115, 307–314. [Google Scholar] [CrossRef]
  48. Lusher, A. Microplastics in the marine environment: Distribution, interactions and effects. In Marine Anthropogenic Litter; Springer: Cham, Switzerland; Amsterdam, The Netherlands, 2015; pp. 245–307. [Google Scholar] [CrossRef]
  49. Korean Hydrographic and Oceanographic Agency. Schematic Mapas of Surface Currents in the Neighboring Seas of Korea. Available online: http://www.khoa.go.kr/SynapDocViewServer/viewer/doc.html?key=53b9a09d8cc861900190c6222ac80e35&convType=img&convLocale=ko_KR&contextPath=/SynapDocViewServer (accessed on 29 April 2024).
  50. Ministry of Oceans and Fisheries. Official Standard Measurement Methods for Marine Environment. Available online: https://www.law.go.kr/admRulLsInfoP.do?admRulSeq=2000000109042#AJAX (accessed on 29 April 2024).
  51. GESAMP. Guidelines for the Monitoring and Assessment of Plastic Litter and Microplastics in the Ocean; Kershaw, P.J., Turra, A., Galgani, F., Eds.; GESAMP Joint Group of Experts on the Scientific Aspects of Marine Environmental Protection: London, UK, 2019; 130p. [Google Scholar] [CrossRef]
  52. Chae, D.H.; Kim, I.S.; Song, Y.K.; Kim, S.W.; Kim, S.K. Development of Analytical Method for Microplastics in Seawater. Korean Soc. Oceanogr. 2014, 19, 88–98. [Google Scholar] [CrossRef]
  53. Gong, J.; Xie, P. Research progress in sources, analytical methods, eco-environmental effects, and control measures of microplastics. Chemosphere 2020, 254, 126790. [Google Scholar] [CrossRef] [PubMed]
  54. Martinho, S.D.; Fernandes, V.C.; Figueiredo, S.A.; Delerue-Matos, C. Microplastic pollution focused on sources, distribution, contaminant interactions, analytical methods, and wastewater removal strategies: A review. Int. J. Environ. Res. Public Health 2022, 19, 5610. [Google Scholar] [CrossRef] [PubMed]
  55. Stock, F.; Kochleus, C.; Bänsch-Baltruschat, B.; Brennholt, N.; Reifferscheid, G. Sampling techniques and preparation methods for microplastic analyses in the aquatic environment—A review. TrAC Trends Anal. Chem. 2019, 113, 84–92. [Google Scholar] [CrossRef]
  56. Cole, M.; Webb, H.; Lindeque, P.K.; Fileman, E.S.; Halsband, C.; Galloway, T.S. Isolation of microplastics in biota-rich seawater samples and marine organisms. Sci. Rep. 2014, 4, 4528. [Google Scholar] [CrossRef] [PubMed]
  57. Claessens, M.; Van Cauwenberghe, L.; Vandegehuchte, M.B.; Janssen, C.R. New techniques for the detection of microplastics in sediments and field collected organisms. Mar. Pollut. Bull. 2013, 70, 227–233. [Google Scholar] [CrossRef] [PubMed]
  58. Hurley, R.R.; Lusher, A.L.; Olsen, M.; Nizzetto, L. Validation of a method for extracting microplastics from complex, organic-rich, environmental matrices. Environ. Sci. Technol. 2018, 52, 7409–7417. [Google Scholar] [CrossRef]
  59. Löder, M.G.; Imhof, H.K.; Ladehoff, M.; Löschel, L.A.; Lorenz, C.; Mintenig, S.; Mintenig, S.; Piehl, S.; Primpke, S.; Schrank, I.; et al. Enzymatic purification of microplastics in environmental samples. Environ. Sci. Technol. 2017, 51, 14283–14292. [Google Scholar] [CrossRef] [PubMed]
  60. Konechnaya, O.; Lüchtrath, S.; Dsikowitzky, L.; Schwarzbauer, J. Optimized microplastic analysis based on size fractionation, density separation and μ-FTIR. Water Sci. Technol. 2020, 81, 834–844. [Google Scholar] [CrossRef] [PubMed]
  61. Shim, W.J.; Hong, S.H.; Eo, S.E. Identification methods in microplastic analysis: A review. Anal. Methods 2017, 9, 1384–1391. [Google Scholar] [CrossRef]
  62. Jeong, H.H.; Kusano, T.; Addai-arhin, S.; Nugraha, W.C.; Novirsa, R.; Dinh, Q.P.; Shirosaki, T.; Fujita, E.; Kameda, Y.; Cho, H.S.; et al. Differences in microplastic distributions on the surface freshwater collected using 100–and 355–μm meshes. Environ. Monit. Contam. Res. 2022, 2, 22–34. [Google Scholar] [CrossRef]
  63. Walton, W.H. Feret‘s statistical diameter as a measure of particle size. Nature 1948, 162, 329–330. [Google Scholar] [CrossRef]
  64. Espiritu, E.Q.; Dayrit SA, S.; Coronel AS, O.; Paz NS, C.; Ronquillo PI, L.; Castillo VC, G.; Enriquez, E.P. Assessment of quantity and quality of microplastics in the sediments, waters, oysters, and selected fish species in key sites along the bombong estuary and the coastal waters of ticalan in San Juan, Batangas. Philipp. J. Sci. 2019, 148, 789–816. [Google Scholar]
  65. Jeong, H.H.; Choi, S.D.; Cho, H.S. Characteristics of Hypoxic Water Mass Occurrence in the Northwestern Gamak Bay, Korea, 2017. J. Korean Soc. Mar. Environ. Saf. 2021, 27, 708–720. [Google Scholar] [CrossRef]
  66. Zeinalzadeh, K.; Rezaei, E. Determining spatial and temporal changes of surface water quality using principal component analysis. J. Hydrol. Reg. Stud. 2017, 13, 1–10. [Google Scholar] [CrossRef]
  67. Wu, G.; Li, J.; Luo, W. Spatial distribution, source apportionment, and assessment of marine water quality parameters in the Bohai Sea, China. Mar. Pollut. Bull. 2023, 195, 115526. [Google Scholar] [CrossRef] [PubMed]
  68. Hammoumi, D.; Al-Aizari, H.S.; Alaraidh, I.A.; Okla, M.K.; Assal, M.E.; Al-Aizari, A.R.; Moshab, M.S.; Chakiri, S.; Bejjaji, Z. Seasonal Variations and Assessment of Surface Water Quality Using Water Quality Index (WQI) and Principal Component Analysis (PCA): A Case Study. Sustainability 2024, 16, 5644. [Google Scholar] [CrossRef]
  69. Haag, I.; Westrich, B. Processes governing river water quality identified by principal component analysis. Hydrol. Process. 2002, 16, 3113–3130. [Google Scholar] [CrossRef]
  70. Jeong, H.; Kang, Y.; Cho, H. C, N, and P mass balances in the bottom seawater–surface sediment Interface in the reducing environment due to anoxic water of Gamak Bay, Korea. Water 2022, 14, 2244. [Google Scholar] [CrossRef]
  71. Heo, M.Y.; Choi, Y.C. Formation and characteristics of ocean fronts at the East China Sea in southwestern sea area from Jeju Island, summer. J. Korean Soc. Mar. Environ. Energy 2004, 7, 64–69. [Google Scholar]
  72. Jang, S.T.; Lee, J.H.; Hong, C.S. Mixing of sea waters in the northern part of the East China Sea in Summer. Korean Soc. Ocean. 2007, 12, 390–399. [Google Scholar]
  73. Hur, H.B.; Jacobs, G.A.; Teague, W.J. Monthly variations of water masses in the Yellow and East China Seas, November 6, 1998. J. Oceanogr. 1999, 55, 171–184. [Google Scholar] [CrossRef]
  74. Hyun, K.H.; Pang, I.C.; Lee, J.H.; Rho, H.K. Water Mass Analysis in the East China Sea in Summer and the Northward Route of the Tsushima Current. Mar. Sci. Inst. Jeju Natl. Univ. 1997, 21, 85–101. [Google Scholar]
  75. Cho, K.D.; Yun, J.H. In Summer, the Origin of Tsushima Warm Current Water in Western Channel of the Korea Strait (1)—On the Water in Surface Layer. Korean Soc. Fish. Ocean Technol. 1990, 26, 184–191. [Google Scholar]
  76. Min, S.H.; Kim, D.H.; Yoon, H.J. Temporal and Spatial Analysis of SST in the Northeast Asian Seas Using NOAA/AVHRR data. Korea Inst. Inf. Commun. Eng. 2010, 14, 2818–2826. [Google Scholar] [CrossRef]
  77. Graca, B.; Szewc, K.; Zakrzewska, D.; Dołęga, A.; Szczerbowska-Boruchowska, M. Sources and fate of microplastics in marine and beach sediments of the Southern Baltic Sea—A preliminary study. Environ. Sci. Pollut. Res. 2017, 24, 7650–7661. [Google Scholar] [CrossRef] [PubMed]
  78. Kaberi, H.; Tsangaris, C.; Zeri, C.; Mousdis, G.; Papadopoulos, A.; Streftaris, N. Microplastics along the shoreline of a Greek island (Kea isl., Aegean Sea): Types and densities in relation to beach orientation, characteristics and proximity to sources. In Proceedings of the 4th International Conference on Environmental Management, Engineering, Planning and Economics (CEMEPE) and SECOTOX Conference, Mykonos Island, Greece, 24–28 June 2013; pp. 197–202. Available online: https://www.researchgate.net/publication/258437407 (accessed on 29 April 2024).
  79. Pedrotti, M.L.; Petit, S.; Elineau, A.; Bruzaud, S.; Crebassa, J.C.; Dumontet, B.; Martí, E.; Gorsky, G.; Cózar, A. Changes in the floating plastic pollution of the Mediterranean Sea in relation to the distance to land. PLoS ONE 2016, 11, e0161581. [Google Scholar] [CrossRef] [PubMed]
  80. He, W.; Wang, X.; Zhang, Y.; Zhu, B.; Wu, H. Adsorption behavior of aged polystyrene microplastics (PSMPs) for manganese in water: Critical role of hydrated functional zone surrounding the microplastic surface. J. Environ. Chem. Eng. 2022, 10, 109040. [Google Scholar] [CrossRef]
  81. Statistics Korea, General Survey of Agriculture and Fisheries. Fishery Value and Farm Area by Food Species. 2020. Available online: https://kosis.kr/statHtml/statHtml.do?orgId=101&tblId=DT_1FS15121 (accessed on 29 April 2024).
  82. National Institute of Environmental Research. National Pollution Survey Report. (11-1480523-000429-10); NIER: Paris, France, 2021. [Google Scholar]
  83. Lee, J.M.; Jang, Y.C.; Hong, S.Y.; Lee, J.S.; Kim, K.S.; Choi, H.J.; Hong, S.W. A Study on the Annual Inflow and Its Control of Styrofoam Buoy Debris in Oyster Aquaculture Farm in Gyeongnam. Korea Ocean. Policy Res. 2016, 31, 55–79. [Google Scholar] [CrossRef]
  84. Kwon, O.Y.; Kang, J.H.; Shim, W.J.; Hong, S.H. Distribution of Microplastics in the Yellow and South Sea; The Korean Society of Oceanography: Jeju, Republic of Korea, 2018; p. 1. Available online: https://sciwatch.kiost.ac.kr/handle/2020.kiost/22952 (accessed on 29 April 2024).
  85. Korea Meteorological Administration, Weather Data Open Portal. National Climate Data Quality Analysis Annual Report. Available online: https://data.kma.go.kr/stcs/grnd/grndRnList.do?pgmNo=69 (accessed on 29 April 2024).
  86. Eo, S.E.; Hong, S.H.; Song, Y.K.; Han, G.M.; Seo, S.; Shim, W.J. Prevalence of small high-density microplastics in the continental shelf and deep sea waters of East Asia. Water Res. 2021, 200, 117238. [Google Scholar] [CrossRef]
  87. Iwasaki, S.; Isobe, A.; Kako, S.I.; Uchida, K.; Tokai, T. Fate of microplastics and mesoplastics carried by surface currents and wind waves: A numerical model approach in the Sea of Japan. Mar. Pollut. Bull. 2017, 121, 85–96. [Google Scholar] [CrossRef]
  88. Chen, Q.; Reisser, J.; Cunsolo, S.; Kwadijk, C.; Kotterman, M.; Proietti, M.; Slat, B.; Ferrari, F.F.; Schwarz, A.; Levivier, A.; et al. Pollutants in plastics within the North Pacific subtropical gyre. Environ. Sci. Technol. 2018, 52, 446–456. [Google Scholar] [CrossRef] [PubMed]
  89. Leal Filho, W.; Havea, P.H.; Balogun, A.L.; Boenecke, J.; Maharaj, A.A.; Ha’apio, M.; Hemstock, S.L. Plastic debris on Pacific Islands: Ecological and health implications. Sci. Total Environ. 2019, 670, 181–187. [Google Scholar] [CrossRef] [PubMed]
  90. Uhrin, A.V.; Hong, S.; Burgess, H.K.; Lim, S.; Dettloff, K. Towards a North Pacific long-term monitoring program for ocean plastic pollution: A systematic review and recommendations for shorelines. Environ. Pollut. 2022, 310, 119862. [Google Scholar] [CrossRef] [PubMed]
  91. Chan, H.H.; Not, C. Variations in the spatial distribution of expanded polystyrene marine debris: Are Asian’s coastlines more affected? Environ. Adv. 2023, 11, 100342. [Google Scholar] [CrossRef]
  92. Ferrándiz-Mas, V.; García-Alcocel, E. Durability of expanded polystyrene mortars. Constr. Build. Mater. 2013, 46, 175–182. [Google Scholar] [CrossRef]
  93. Song, Y.K.; Hong, S.H.; Eo, S.; Han, G.M.; Shim, W.J. Rapid production of micro-and nanoplastics by fragmentation of expanded polystyrene exposed to sunlight. Environ. Sci. Technol. 2020, 54, 11191–11200. [Google Scholar] [CrossRef] [PubMed]
  94. Davis, W., III; Murphy, A.G. Plastic in surface waters of the Inside Passage and beaches of the Salish Sea in Washington State. Mar. Pollut. Bull. 2015, 97, 169–177. [Google Scholar] [CrossRef] [PubMed]
  95. Mattsson, K.; Björkroth, F.; Karlsson, T.; Hassellöv, M. Nanofragmentation of expanded polystyrene under simulated environmental weathering (thermooxidative degradation and hydrodynamic turbulence). Front. Mar. Sci. 2021, 7, 578178. [Google Scholar] [CrossRef]
  96. Eo, S.E.; Hong, S.H.; Song, Y.K.; Lee, J.; Lee, J.; Shim, W.J. Abundance, composition, and distribution of microplastics larger than 20 μm in sand beaches of South Korea. Environ. Pollut. 2018, 238, 894–902. [Google Scholar] [CrossRef]
  97. Yu, X.; Huang, W.; Wang, Y.; Wang, Y.; Cao, L.; Yang, Z.; Dou, S. Microplastic pollution in the environment and organisms of Xiangshan Bay, East China Sea: An area of intensive mariculture. Water Res. 2022, 212, 118117. [Google Scholar] [CrossRef]
  98. Yang, Q.; Wang, Y.; Ma, L.; Chen, S.; Zeng, J.; Dong, H.; Yang, H.; Bai, H.; Liu, R.; Huang, W. A comprehensive evaluation of microplastic pollution in the Xiangshan Bay of China with special reference to seasonal variation. Sci. Total Environ. 2023, 873, 162350. [Google Scholar] [CrossRef] [PubMed]
  99. De Mora, S.J.; Stewart, C.; Phillips, D. Sources and rate of degradation of tri (n-butyl) tin in marine sediments near Auckland, New Zealand. Mar. Pollut. Bull. 1995, 30, 50–57. [Google Scholar] [CrossRef]
  100. Kim, H.J. Distribution Characteristics of Organotin Compounds in Sediments inside Harbors of Jeju Island. Doctoral Dissertation, Jeju National University, Jeju, Republic of Korea, 2002. Available online: https://oak.jejunu.ac.kr/handle/2020.oak/18006 (accessed on 29 April 2024).
  101. Mo, S.W. The Behavioral Analysis of the Trading Volumes of Gwangyang Port: Comparison with Incheon and Pyeongtaek-Dangjin Port. Korea Port Econ. Assoc. 2012, 28, 111–125. [Google Scholar]
  102. Turner, A. Marine pollution from antifouling paint particles. Mar. Pollut. Bull. 2010, 60, 159–171. [Google Scholar] [CrossRef] [PubMed]
  103. Watermann, B.T.; Daehne, B.; Sievers, S.; Dannenberg, R.; Overbeke, J.C.; Klijnstra, J.W.; Heemken, O. Bioassays and selected chemical analysis of biocide-free antifouling coatings. Chemosphere 2005, 60, 1530–1541. [Google Scholar] [CrossRef] [PubMed]
  104. Wei, S.; Miao, J.; Li, Y.; Li, Y.; Wang, X.; Pan, L.; Li, Y.; Wu, J.; Lin, Y. Toxic effect of p-chloroaniline and butyl acrylateon Nannochloropsis Oculata based on water samples from two sea areas. Environ. Toxicol. Pharmacol. 2021, 83, 103582. [Google Scholar] [CrossRef] [PubMed]
  105. Alzieu, C. Biological Effects of Tributyltin on Marine Organisms in Tributyltin: Case Study of an Environmental Contaminant; De Mora, S., Ed.; Cambridge Environmental Chemistry Series; Cambridge University Press: Cambridge, UK, 1996; pp. 167–211. [Google Scholar] [CrossRef]
  106. Amara, I.; Miled, W.; Slama, R.B.; Ladhari, N. Antifouling processes and toxicity effects of antifouling paints on marine environment. A review. Environ. Toxicol. Pharmacol. 2018, 57, 115–130. [Google Scholar] [CrossRef] [PubMed]
  107. Ohji, M.; Takeuchi, I.; Takahashi, S.; Tanabe, S.; Miyazaki, N. Differences in the acute toxicities of tributyltin between the Caprellidea and the Gammaridea (Crustacea: Amphipoda). Mar. Pollut. Bull. 2002, 44, 16–24. [Google Scholar] [CrossRef] [PubMed]
  108. An, Y.; Kajiwara, T.; Padermshoke, A.; Van Nguyen, T.; Feng, S.; Mokudai, H.; Masaki, T.; Takigawa, M.; Van Nguyen, T.; Masunaga, H.; et al. Environmental Degradation of nylon, poly (ethylene terephthalate)(PET), and poly (vinylidene fluoride)(PVDF) fishing line fibers. ACS Appl. Polym. Mater. 2023, 5, 4427–4436. [Google Scholar] [CrossRef]
  109. Tibbetts, J.; Krause, S.; Lynch, I.; Sambrook Smith, G.H. Abundance, distribution, and drivers of microplastic contamination in urban river environments. Water 2018, 10, 1597. [Google Scholar] [CrossRef]
  110. Phuong, N.N.; Poirier, L.; Lagarde, F.; Kamari, A.; Zalouk-Vergnoux, A. Microplastic abundance and characteristics in French Atlantic coastal sediments using a new extraction method. Environ. Pollut. 2018, 243, 228–237. [Google Scholar] [CrossRef] [PubMed]
  111. Conkle, J.L.; Báez Del Valle, C.D.; Turner, J.W. Are we underestimating microplastic contamination in aquatic environments? Environ. Manag. 2018, 61, 1–8. [Google Scholar] [CrossRef] [PubMed]
  112. Onink, V.; Kaandorp, M.L.; van Sebille, E.; Laufkötter, C. Influence of particle size and fragmentation on large-scale microplastic transport in the Mediterranean Sea. Environ. Sci. Technol. 2022, 56, 15528–15540. [Google Scholar] [CrossRef]
  113. Shamskhany, A.; Li, Z.; Patel, P.; Karimpour, S. Evidence of microplastic size impact on mobility and transport in the marine environment: A review and synthesis of recent research. Front. Mar. Sci. 2021, 8, 760649. [Google Scholar] [CrossRef]
  114. Hu, L.; Fu, J.; Wang, S.; Xiang, Y.; Pan, X. Microplastics generated under simulated fire scenarios: Characteristics, antimony leaching, and toxicity. Environ. Pollut. 2021, 269, 115905. [Google Scholar] [CrossRef]
  115. Abeynayaka, A.; Kojima, F.; Miwa, Y.; Ito, N.; Nihei, Y.; Fukunaga, Y.; Yashima, Y.; Itsubo, N. Rapid sampling of suspended and floating microplastics in challenging riverine and coastal water environments in Japan. Water 2020, 12, 1903. [Google Scholar] [CrossRef]
  116. Tokai, T.; Uchida, K.; Kuroda, M.; Isobe, A. Mesh selectivity of neuston nets for microplastics. Mar. Pollut. Bull. 2021, 165, 112111. [Google Scholar] [CrossRef] [PubMed]
  117. Kaiser, D.; Estelmann, A.; Kowalski, N.; Glockzin, M.; Waniek, J.J. Sinking velocity of sub-millimeter microplastic. Mar. Pollut. Bull. 2019, 139, 214–220. [Google Scholar] [CrossRef] [PubMed]
  118. Anderson, P.J.; Warrack, S.; Langen, V.; Challis, J.K.; Hanson, M.L.; Rennie, M.D. Microplastic contamination in lake Winnipeg, Canada. Environ. Pollut. 2017, 225, 223–231. [Google Scholar] [CrossRef] [PubMed]
  119. Baldwin, A.K.; Corsi, S.R.; Mason, S.A. Plastic debris in 29 Great Lakes tributaries: Relations to watershed attributes and hydrology. Environ. Sci. Technol. 2016, 50, 10377–10385. [Google Scholar] [CrossRef] [PubMed]
  120. Barrows, A.P.; Neumann, C.A.; Berger, M.L.; Shaw, S.D. Grab vs. neuston tow net: A microplastic sampling performance comparison and possible advances in the field. Anal. Methods 2017, 9, 1446–1453. [Google Scholar] [CrossRef]
Figure 1. The representative sea currents in the summer around the Korean Peninsula were suggested by the Korean Hydrographic and Oceanographic Agency [49] and sampling maps on the Southern Sea of Korea (Sampling points SS01–SS09, 16–19 September 2019); The red, blue, and yellow dash lines are the warm and cold sea currents, and Yangtze River inflow, respectively.
Sustainability 16 06272 g001
Figure 2. The flowchart of the modified microplastic pretreatment method in this study.
Sustainability 16 06272 g002
Figure 3. Spatial distribution of microplastic numerical abundances in the Southern Sea of Korea in Summer, 2019.
Sustainability 16 06272 g003
Figure 4. The detected representative microplastic images in the present study ((a,b) polystyrene; (c,d) polypropylene; (e) polyvinyl chloride; and (f) nylon).
Sustainability 16 06272 g004
Figure 5. The microplastic polymer, size, and shape compositions in the entire sampling area.
Sustainability 16 06272 g005
Figure 6. The results of the loading plot (a) and score plots (b) in principal component analysis and cluster analysis (c).
Sustainability 16 06272 g006
Figure 7. The study area was categorized into three groups (Groups A, B, and C) based on the principal component analysis and cluster analysis results.
Sustainability 16 06272 g007
Figure 8. The results of the median MP abundance in Groups A, B, and C (n = 3).
Sustainability 16 06272 g008
Figure 9. The results of averaged microplastic polymer compositions in Groups A, B, and C (n = 3).
Sustainability 16 06272 g009
Figure 10. The results of the detected microplastic particle size in Groups A, B, and C.
Sustainability 16 06272 g010
Figure 11. The results of the averaged microplastic shape compositions in Groups A, B, and C.
Sustainability 16 06272 g011
Table 1. The numerical microplastic abundance, size, and shape compositions in the Southern Sea of Korea in Summer 2019.
Sampling
Point
MPs Abundance (Particles/m3) *MPs Size (%)MPs Shape (%) **
PPPEPSNylonPVCButyl
Acrylate
Total0.1–0.5 mm0.5–1 mm1–2 mm2–3 mm3–4 mm4–5 mmFragmentSheet
SS010.02ND0.090.010.01ND0.1394.445.56NDNDNDND83.3316.67
SS020.01ND0.13NDND0.030.1756.52ND8.7013.0421.74ND78.2621.74
SS03ND0.02NDNDND0.080.1015.38ND7.6923.0815.3838.46100.00ND
SS040.03ND5.05NDNDND5.080.51ND5.7426.6436.3730.7499.800.20
SS050.010.010.10NDNDND0.1245.83ND4.1733.3312.504.1787.5012.50
SS060.020.020.14NDNDND0.1796.97ND3.03NDNDND87.8812.12
SS07NDND0.14NDNDND0.14100.00NDNDNDNDND33.3366.67
SS080.03ND0.34NDNDND0.371.89ND3.7720.7533.9639.62100.00ND
SS090.04ND0.080.01NDND0.1246.15NDND15.3815.3823.08100.00ND
MinNDNDNDNDNDND0.100.51NDNDNDNDND33.33ND
Max0.040.025.050.010.010.085.08100.005.568.7033.3336.3739.62100.0066.67
Mean0.020.020.760.010.010.060.7150.860.623.6914.6915.0415.1285.5714.43
SD0.010.011.640.010.000.031.6439.861.853.2912.4913.8917.6321.2821.28
* Only the detected polymer types (PP, PE, PS, nylon, PVC, and butyl acrylate) are shown. ** Only the observed shapes (fragment and sheet) are shown. ND: not detected.
Disclaimer/Publisher’s Note: The statements, opinions and data contained in all publications are solely those of the individual author(s) and contributor(s) and not of MDPI and/or the editor(s). MDPI and/or the editor(s) disclaim responsibility for any injury to people or property resulting from any ideas, methods, instructions or products referred to in the content.

