Abstract
Green finance policy has emerged as a powerful driver for sustainable development worldwide, which has arisen at the top of the political agenda. Drawing on resource allocation theory, this study empirically investigates whether and how green finance policy affects corporate environmental responsibility in achieving sustainable development goals on a micro level. Taking China’s green finance reform and innovation (GFRI) pilot policy as a quasi-natural experiment, this paper employs the difference-in-differences model to investigate the impact of green finance policy on corporate environmental responsibility. The evidence shows that the GFRI policy significantly promotes corporate environmental responsibility. The results hold robust after a series of checks such as parallel trend examination, placebo test, exclusion of other policies, and alternative variable measurement. Moreover, this study explores the potential mechanism channels from the perspective of resource allocation theory. Specifically, green finance policy ultimately accelerates corporate environmental responsibility through financing capacity and environmental protection supervision. The heterogeneity analysis shows that the positive impact of the GFRI policy on corporate environmental responsibility is more pronounced for companies in areas with superior green development, strong law enforcement, and higher levels of pollution. The above findings indicate that the formal institution of government-led green financial policy can positively affect corporate environmental responsibility, with regional green development and law enforcement factors enhancing the effectiveness of these policies. Furthermore, the level of local pollution further intensifies the corporate sensibility to such policy effects. Overall, our study sheds light on the significant role of green financial policy in fostering a sustainable economy, helping reconcile the mixed evidence on the financial function of green finance policy on the firm level.
1. Introduction
Corporate environmental responsibility has gained widespread recognition as a pivotal component of business strategies worldwide [1]. The integration of environmentally responsible practices not only aligns organizations with societal expectations but also opens up substantial opportunities for long-term growth and competitive advantage [2,3]. In this context, green finance policies have emerged as a powerful force driving corporate strategies for sustainable development and have arisen at the top of the political agenda in developed countries [4], which also conveys a positive signal and brings about green finance revolutions in emerging markets. Moreover, the increasing academic interest in corporate green development over the past two decades highlights the need to comprehend the effectiveness of green policy [5,6,7,8,9]. Nevertheless, considering the disparities in economic structures and financial systems, along with the social and cultural norms between countries, the policy-making procedures and political landscapes in different countries are diverse [10]. Due to the absence of deeply entrenched environmental awareness [10], the responsiveness of the companies from emerging markets to green policies exhibits distinctive characteristics when compared to those in developed countries [11].
Current research focuses on the outcome of green policies on corporate sustainable development, including pollution treatment [12], technology innovation [13,14,15], energy consumption [16], etc. However, one assumption which underlies those studies is that corporate environmental strategies guarantee certain results, while sustainable efforts actually last for ages and decent outcomes may not be observed in the first few years. Therefore, an adequate environmental evaluation of the efforts trying to achieve a sustainable target should be proposed. In this paper, we focus on corporate environmental responsibility as a means of evaluating the environmental endeavors undertaken by companies, as opposed to the research emphasizing green innovation or green total factor productivity [17,18] which values the outcomes.
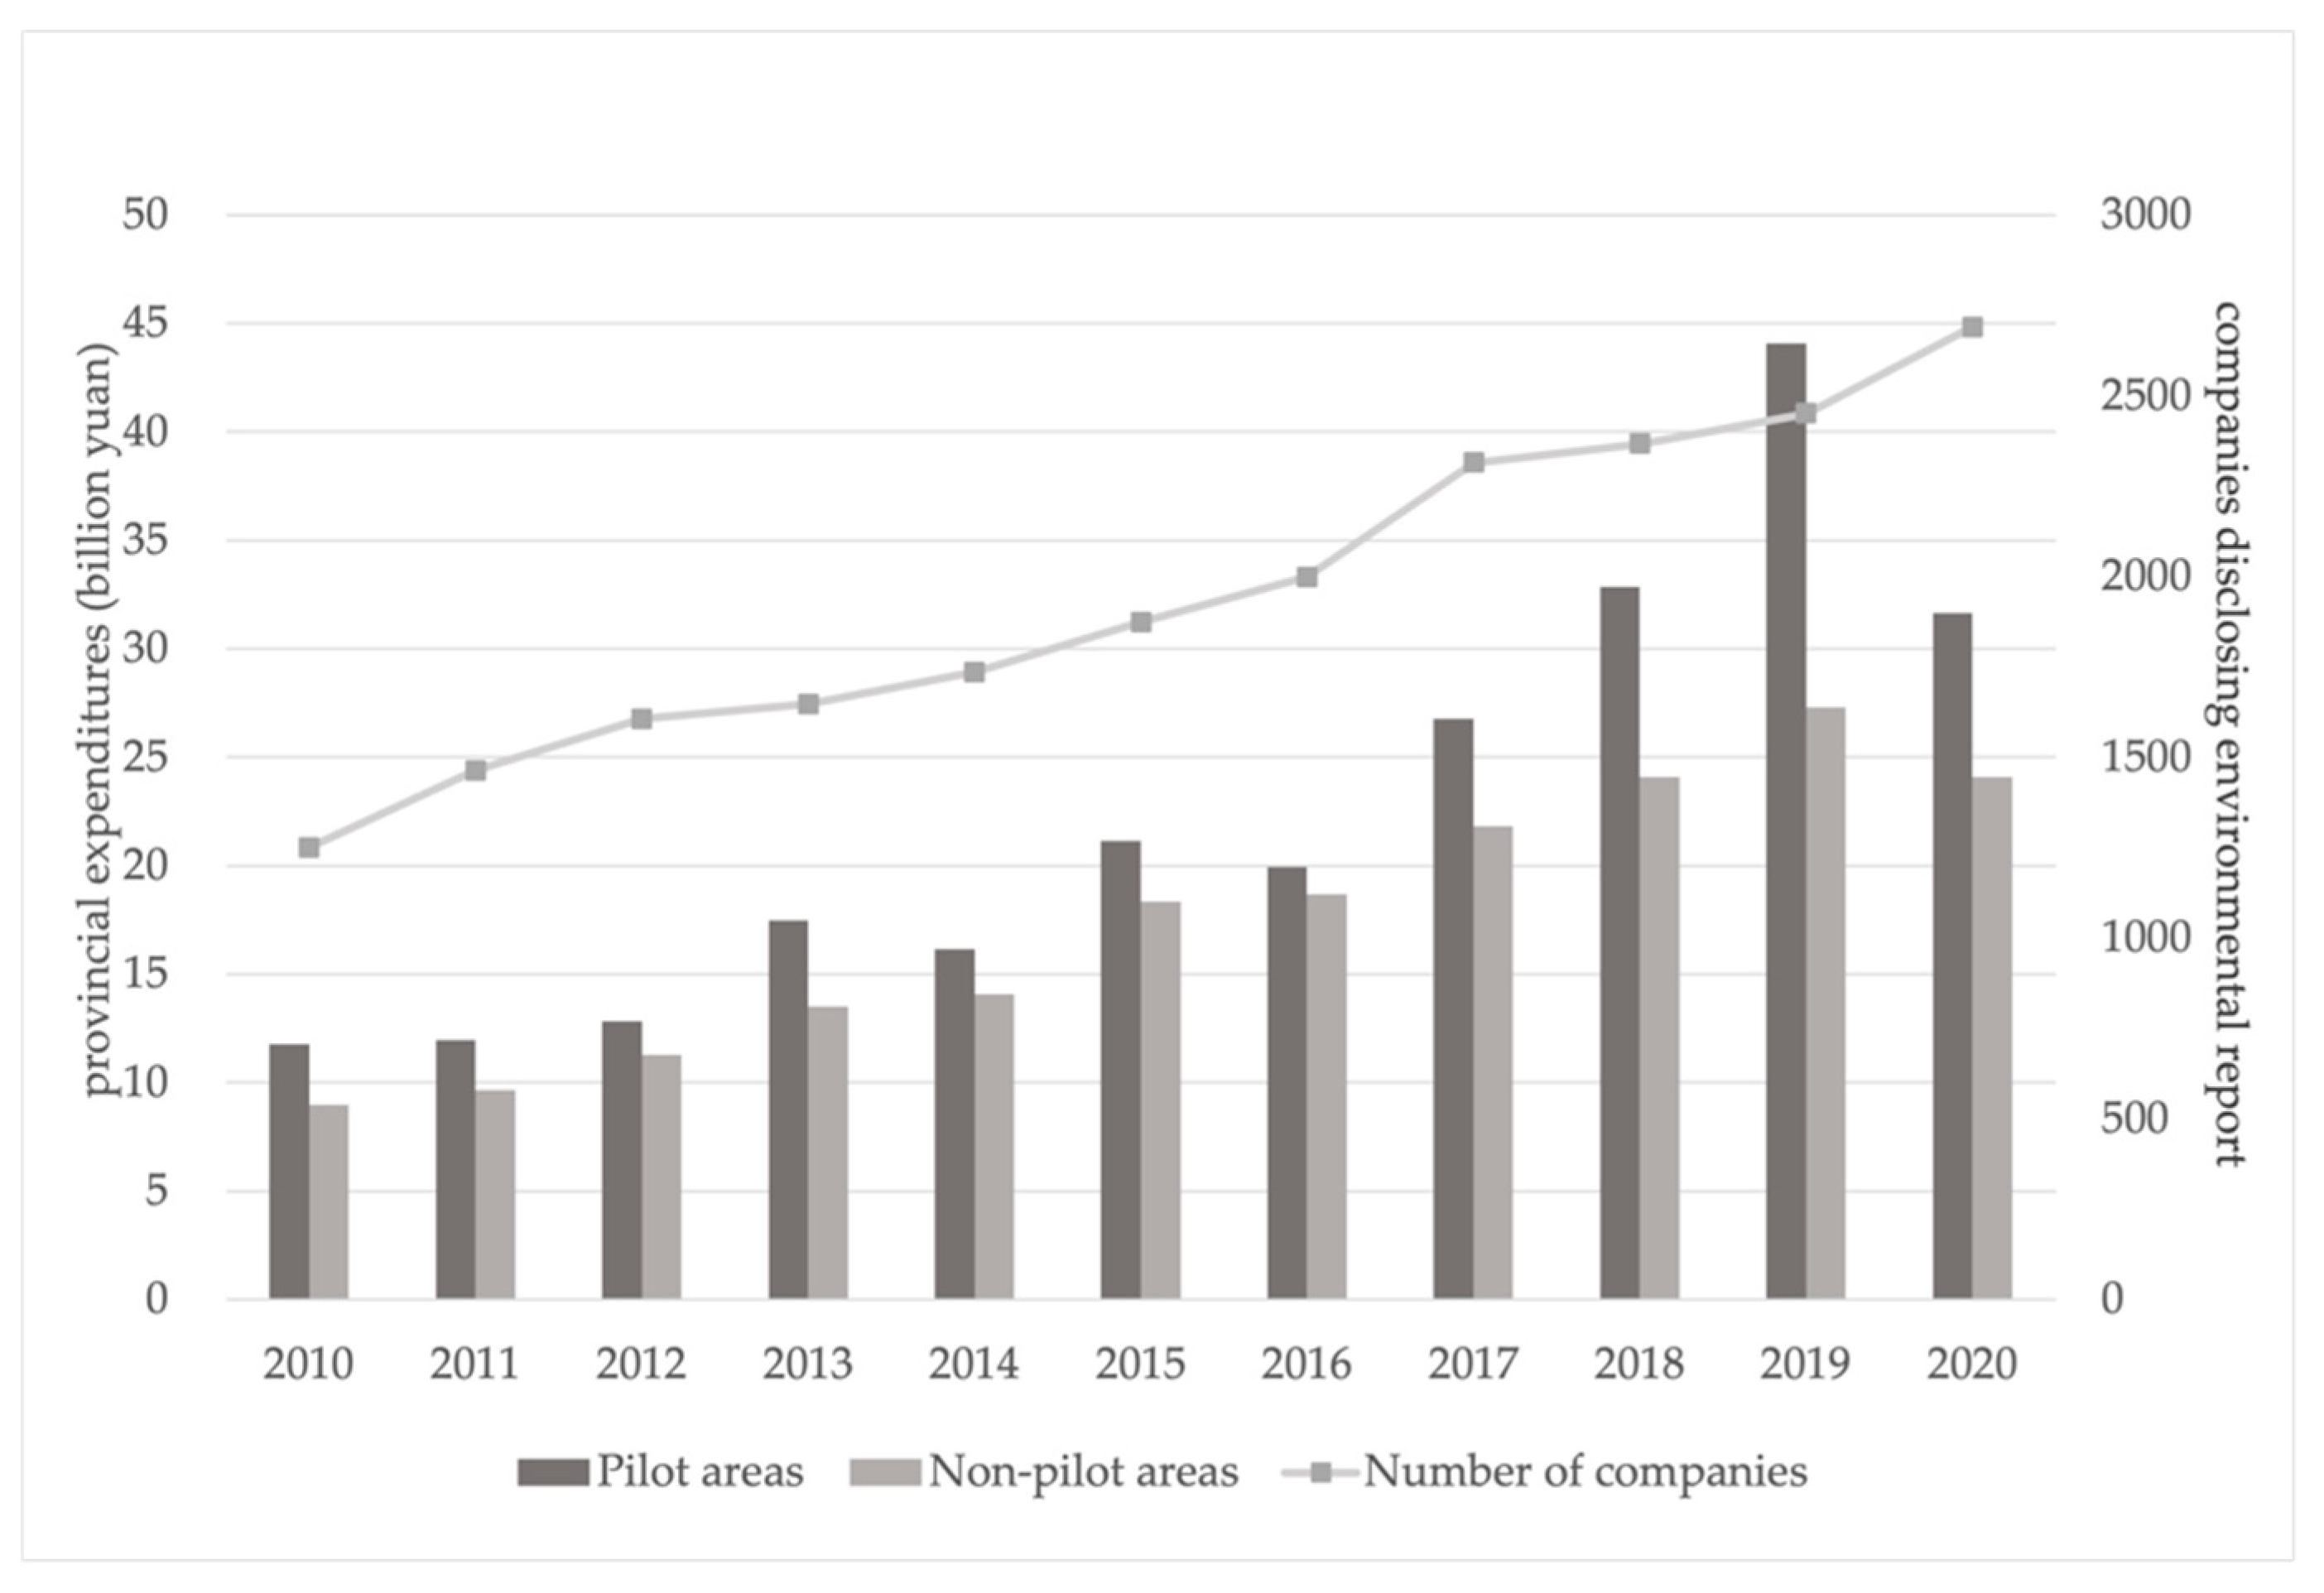
China has been proactively exploring the path to promote sustainable development and implemented a series of green policies. In June 2017, the Chinese State Council approved the establishment of initial Green Finance Reform and Innovation (GFRI) pilot zones, aiming to provide an essential framework that aligns financial resources with environmental objectives and fosters the advancement of green development. The main methods include promotion of green financial instruments, establishment of green financial service platform, and anticipation of financial risk, which garnered substantial recognition from both the central and local governing bodies [19]. As depicted in Figure 1, following the initiation of GFRIs in 2017, the pilot region observed a notable surge in environmental protection expenditures. Given that both pilot and non-pilot regions have demonstrated a consistent upward trend in these expenditures, corporate environmental disclosures as exhibited in the line chart also underwent a substantial increase in 2017, underscoring the shared commitment to green initiatives from both governmental and corporate entities since then. In light of the situation, this paper investigates the impact of the GFRI policy on the corporate level, based on a quasi-natural experiment which provides an ideal setting to isolate the causality.
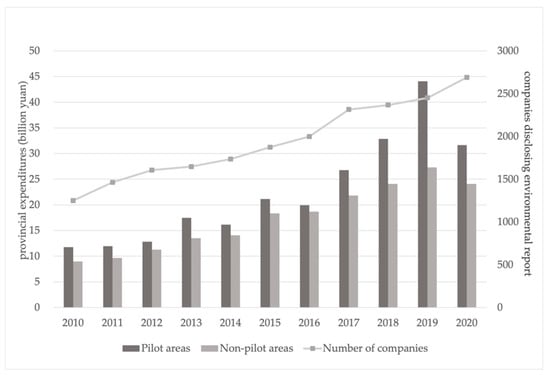
Figure 1.
Time trend of regional environmental protection expenditures and companies disclosing environmental information.
We draw a sample of Chinese A-share listed industrial companies from 2013 to 2020 and use a difference-in-differences (DID) approach to reveal the real effect of GFRI policies on a corporate level. Our research primarily concentrates on industrial corporates as major consumers of resources and emitters of pollutants. We have adopted corporate green investment as a measurement to effectively capture the timely and comprehensive assessment of corporate endeavors in promoting corporate environmental responsibility, encompassing both short-term and long-term initiatives. We investigate the possible channel through which the GFRI policies accelerate corporate environmental responsibility. Additionally, we assess the effects of industry-specific and regional factors on corporate environmental responsibility and conduct heterogeneities tests. These results provide reliable evidence that the GFRI policy has significantly accelerated industrial corporate environmental responsibility, especially in areas featuring higher levels of green development, enforcement, or greater pollution. Simultaneously, the results provide insights for further green transition improvement.
This paper shed lights on the real effect of green financial policy on corporate environmental responsibility from the perspective of resource allocation. According to resources allocation theory, financial decisions can be directly affected by the distribution of limited resources among varying needs or uses. When green finance policy comes into effect, it modifies the corporate landscape by presenting financial incentives and potential regulatory risks, thereby altering corporate decisions regarding resource allocation. In this context, corporates might start prioritizing green investments, effectively allocating more resources towards environmental responsibility. Earlier literature has mainly focused on specific financial instruments including green credit policy, green bond policy and a carbon emission trading pilot [6,7,20], lacking a comprehensive analysis of regional green financial policy. Our work filled the gap by testing the corporate response to GFRIs, a policy initiative consisting of diverse green finance instruments, to explore novel avenues.
Moreover, our findings spotlight the function of green-related regulation in promoting corporate environmental responsibility by influencing companies’ access to external financing, consistent with the literature supporting the governance effect of green finance policy [14,21], which contends that green finance policy can serve as a market-oriented regulating tool to prompt companies to engage in environmental practices. The recent literature has presented noteworthy connections between environmental policy and investment as well as financing decisions [9], which closely aligns with the focus and relevance of our research. In addition to the existing body of research [22], our paper sheds light on corporate financial strategies by emphasizing how economic incentives prompt industrial corporates to adapt their financial approaches and allocate increased investments towards pollution control and green production initiatives in response to amplified regulatory pressure and costs.
The remaining chapters are organized as follows. Section 2 introduces the background of green finance development, the policy of GFRIs, and the development of hypotheses. Section 3 presents the empirical design framework. Section 4 reports the main results, mechanism examination, heterogeneity analysis, and robustness check. Section 5 summarizes the conclusions.
2. Institutional Background and Hypothesis Development
2.1. Green Finance Development in China
In the past few decades, developed economies have made remarkable progress in the establishment of strong and all-encompassing green financial systems [4]. This evolution can be traced back to the 1970s, when the notion of green finance started to gain popularity. Over time, the range of green finance subjects has broadened from merely commercial banks to include entities such as insurance companies, fund companies, and governments. The expansion indicates the growing acknowledgement of the importance of incorporating environmental considerations into financial decision-making processes. During the past decades, the Chinese government has allocated serious consideration to green finance development [23]. Although starting relatively later than some developed economies, China has been rapidly catching up by promulgating a series of green finance policies to keep up with the pace of the global green revolution since 2007 and formally establishing a national framework putting forward the Guiding Opinions on Building a Green Financial System in 2016 [15]. This dynamic development provides a rich and evolving context for studying the impact and effectiveness of green finance policies on corporate behavior and environmental responsibility from an emerging market.
Despite the achievements in green finance in China, there are also potential drawbacks to consider. A primary concern is the lack of standardized criteria for evaluating the environmental performance of companies [11]. The absence of a clear definition of ‘green’ companies or industries has led to instances of greenwashing, eroding the trust of financial institutions and investors in corporate environmental responsibility. In fact, Chinese companies have faced up with notable obstacles in the greening way. The current focus of green financial instruments primarily revolves around green credit and green bonds, with limited diversification in areas such as fund allocation, insurance, trusts, and related sectors. Furthermore, the availability of green financial derivatives is notably constrained. Given this situation, although green finance policies are primarily implemented at the national level, the inconsistency in regional infrastructure and regulatory frameworks poses notable challenges for effective implementation in certain regions.
2.2. Pilot Zones for Green Finance Reforms and Innovations (GFRIs)
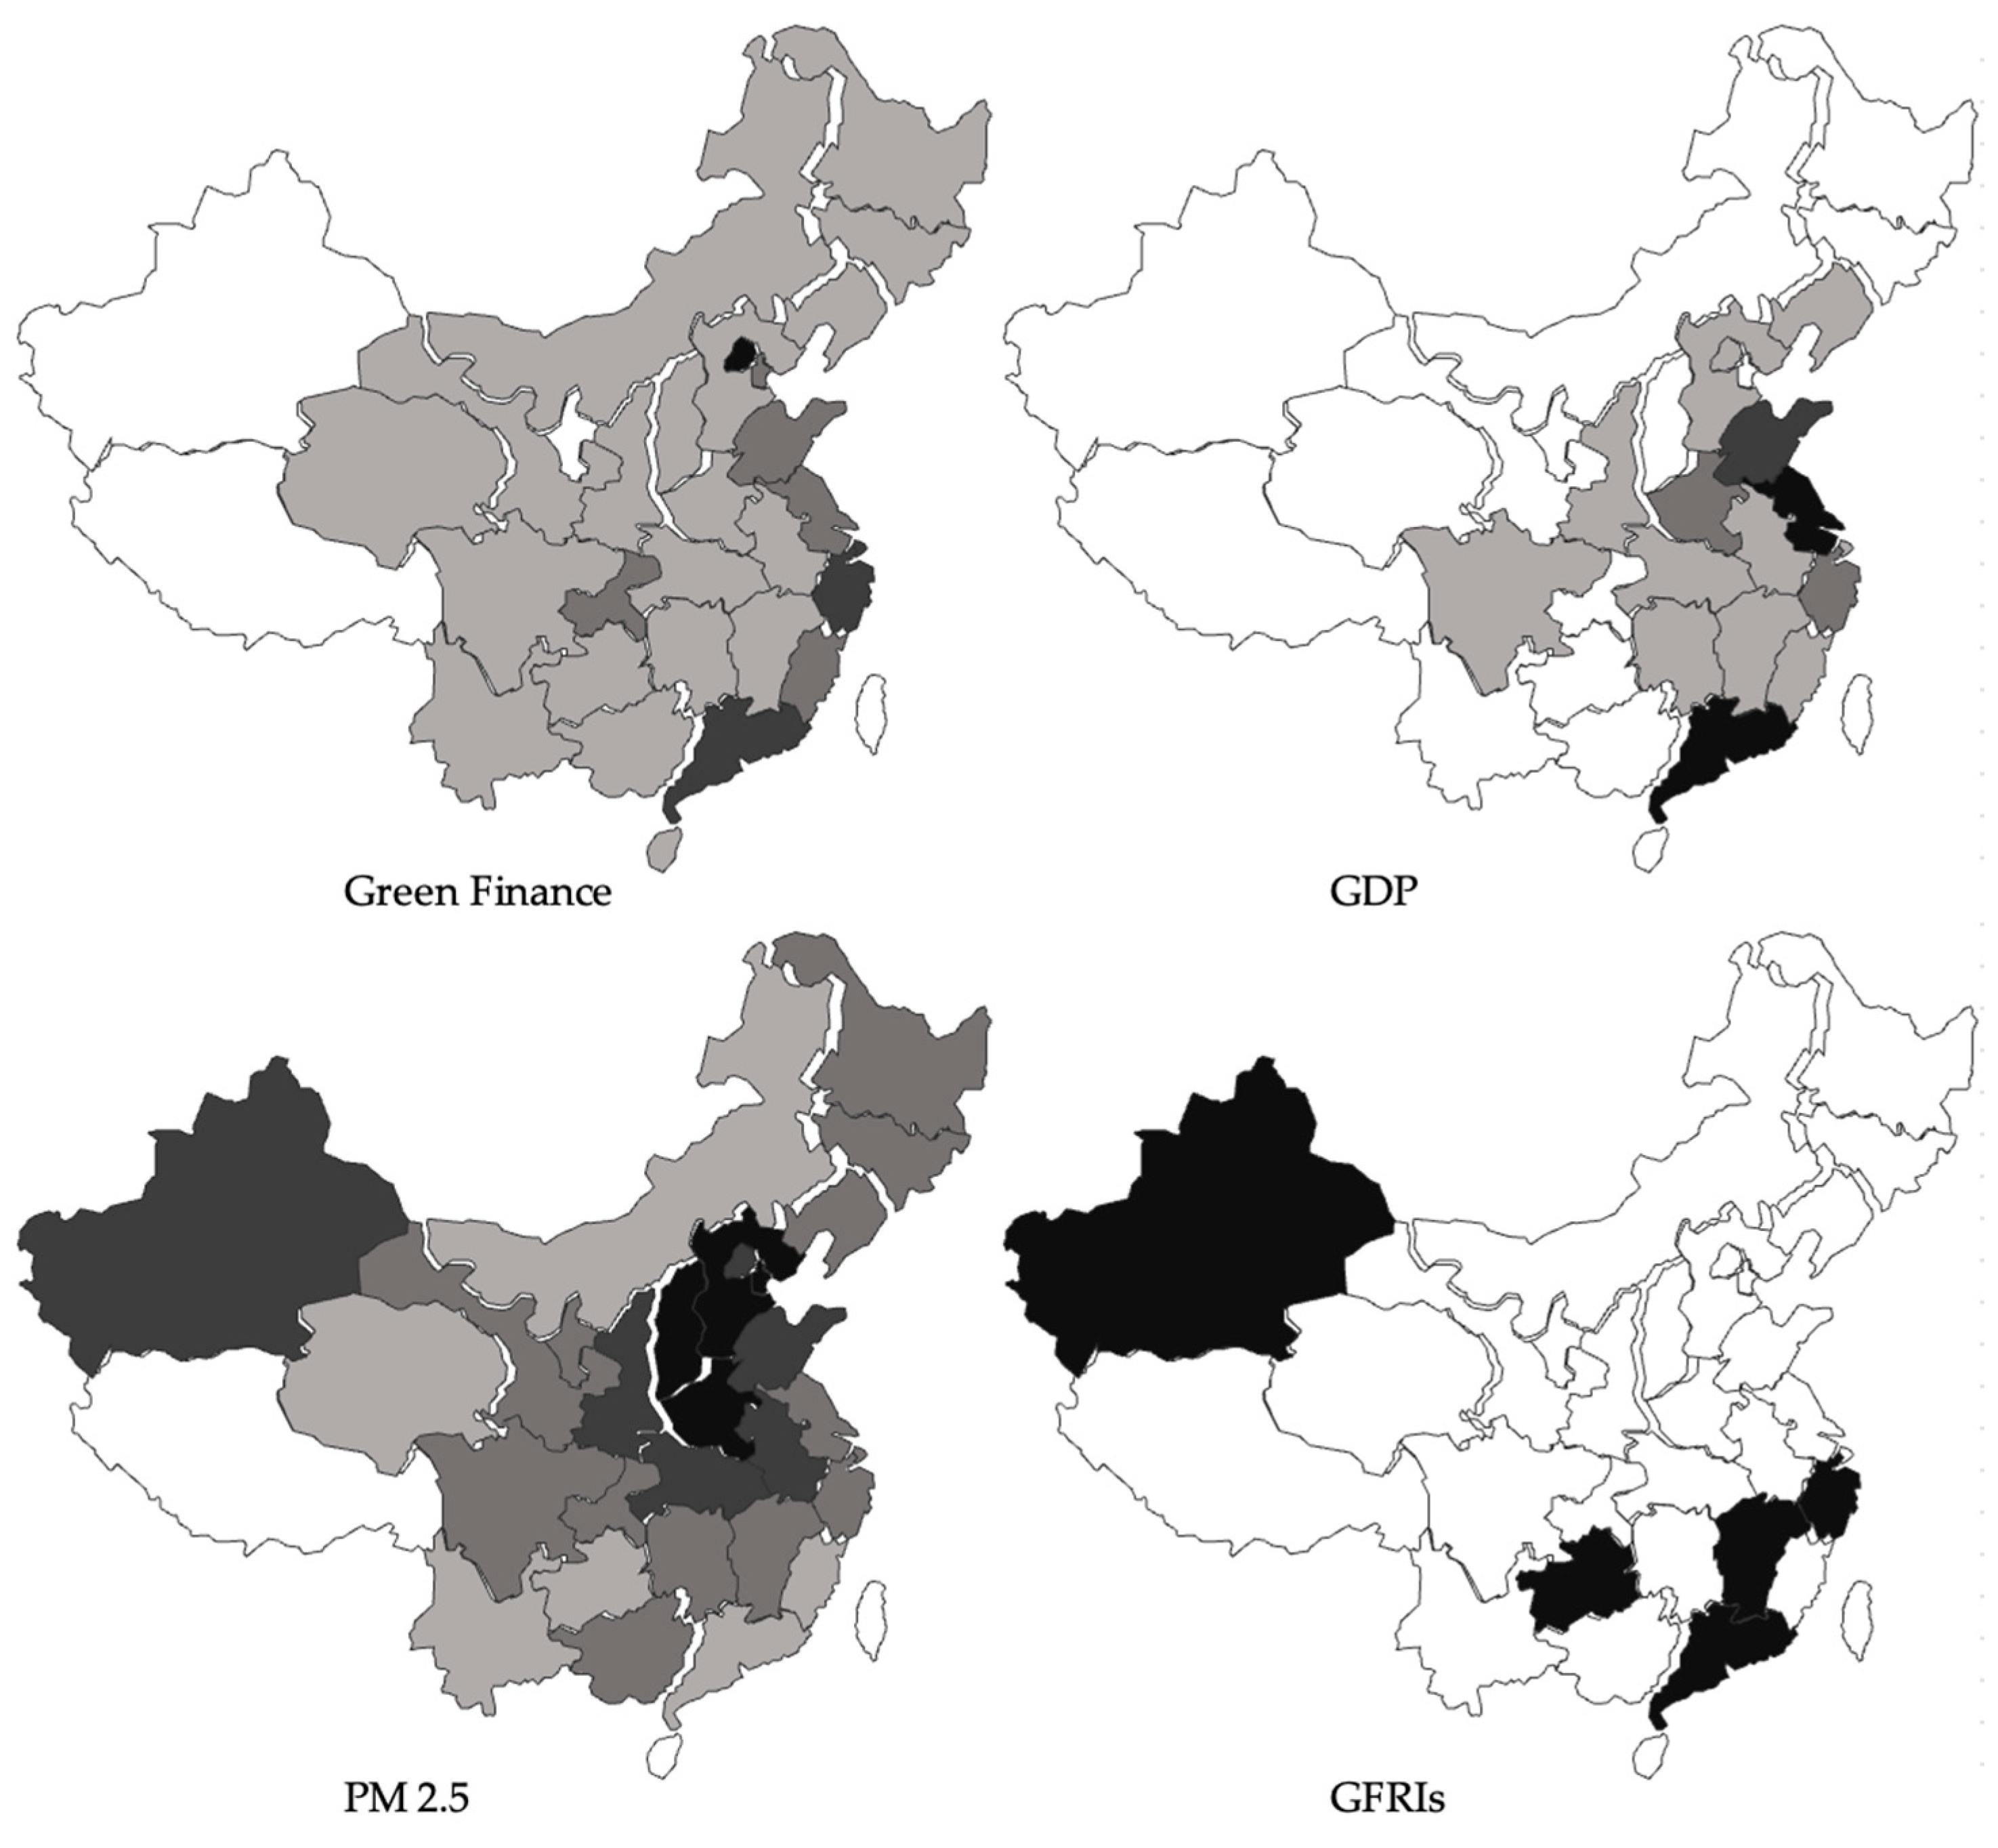
In June 2017, The State Council authorized the establishment of the initial batch of the Green Finance Reform and Innovation pilot zones in Zhejiang, Jiangxi, Guangdong, Guizhou, and Xinjiang. The first batch of pilot zones refers to the eight pilot zones within five provinces established in 2017. The primary goal of the GFRI policy is to accelerate the green development in those pilot areas through financial support, including green finance departments and environmental rights (such as emission rights, water rights, and energy use rights), trading markets establishment, formal green financial services promotion, and green financial risk prevention. Certain funds are set up to support green industry and projects and technology development, and discount interest subsidies for green loans are provided to reduce the financing costs of companies. The Finance Bureau of the Guangdong Pilot Zone annually allocates over 1 billion yuan in green funds, with a 30% premium subsidy awarded to companies participating in green reimbursement initiatives. The first graph of Figure 2 presents a comprehensive overview of the progression of green finance development, encapsulated within an aggregated index that encompasses green credit, investment, bonds, insurance, funds, support mechanisms, and rights and interests. Additionally, Figure 2 depicts the evolution with trends in regional GDP, pollution levels (specifically, the average PM2.5 concentration), and the geographical distribution of Green Finance Reform and Innovation Zones (GFRIs) across mainland China. Notably, a divergence emerges between regions boasting high GDP and those demonstrating advanced green finance development, indicating that superior economic development does not inherently lead to corresponding advancements in green finance. Furthermore, the pilot zones encompass provinces with varying levels of economic development, pollution, green finance development, and geographical characteristics. Consequently, the criteria for establishing GFRIs are not primarily rooted in financial performance or pollution assessments. This approach can be seen as an exogenous shock to the industrial sector within the GFRIs, as it disrupts the existing norm by introducing new regulatory frameworks, incentives, and standards for environmental sustainability and green finance innovation. In response, industrial companies operating within GFRIs may need to reassess their operational strategies, invest in cleaner technologies, and adopt more eco-friendly practices, ultimately contributing to the overall shift towards a greener and more sustainable economy. Moreover, this study excludes the two experimental zones established in Gansu Province in 2019 and Chongqing City in 2022 from its empirical sample due to potential interfering factors associated with their establishment. Consequently, this paper primarily focuses on examining the effects of the first batch of pilot zones, which exemplify a tentative approach towards reform and innovation in green finance, as initiated by the State Council.

Figure 2.
The distribution of GFRIs and PM2.5, GDP, and green finance development. Note: This figure reflects the data from mainland China in 2017. Darker shades indicate a higher level of green finance development, provincial GDP, and air pollution (PM2.5) in the first three images. In the last image, the black blocks indicate the first batch of GFRIs that are approved.
Compared with other environmental regulatory tools, the GFRIs policy positively promotes the development of local green finance, including economic incentives for green financial talents, reduction in green industry financing costs, and optimization of resource allocation for pilot units. The GFRIs policy not only actively promotes the growth of green credit and bonds through financial support for green industries but also help to construct credit environment information platforms and foster the development of green insurance. In line with their respective advantages, each pilot zone adopts diverse green financial products. These initiatives collectively contribute to the advancement of sustainable finance and the promotion of environmentally friendly practices.
2.3. The GFRIs Policy and Corporate Environmental Responsibility
As China’s first pilot financial environment regulation policy and the first green finance policy directly formulated by the central government, the GFRIs policy holds significant importance in the eyes of both central and local governments. Consequently, the establishment of GFRIs in pilot zones carries substantial symbolic weight in promoting the development of a green economy and gathered attention from local governments and the public towards environmental concerns. As the major polluters, industrial companies suffer especially severe supervision from the public. Once they participate in the transformation of clean production lines, implement terminal pollution control measures, and adopt various pollution prevention and control practices, industrial companies can effectively enhance their environmental image and reputation while simultaneously strengthening their competitive edge in promoting green practices [24,25,26]. Properly crafted environmental standards can trigger innovation and improve resource productivity, leading to positive investment outcomes. Specifically, the literature shows that corporates with an excellent social image can obtain tax incentives and economic subsidies from the government, loan guarantees from financial institutions, and investment preferences from green institutional investors, thus enriching their financing channels [27].
Several researchers have empirically proved that GFRIs can foster the growth of local economies by advancing local green technology [28] and improving the ecological environment [29,30]. At a microeconomic level, research has demonstrated that GFRIs can impact company decisions too. For instance, Sun et al. [31] conducted a DID examination and found that GFRI policies exert a positive influence on the innovation of corporate green technology. Furthermore, Shi et al. [32], by studying a sample of heavy-polluting enterprises in China, concludes that GFRIs alter debt financing from the perspective of resource allocation. Lei and Yu [33] indicate that GFRIs exert a positive impact on corporate ESG performance. Additionally, it was observed that market participants, particularly institutional investors, play a crucial role in bolstering this policy effect. The primary focus of this paper is not to investigate the specific functions of financial tools, but rather to examine the response of industrial corporates under green finance policy. In this study, we have chosen to use corporate environmental responsibility as a metric to evaluate the total green efforts arising from sustainable development. This approach allows us to mitigate the potential bias that could arise from concentrating on aspects like green innovation, government subsidies, or participation in green financial derivative instruments, as not all green initiatives are guaranteed to yield satisfactory results. This study puts forward the following hypothesis:
Hypothesis 1 (H1):
The GFRIs policy had a positive effect on the corporate environmental responsibility of industrial companies.
Corporate environmental responsibility generates environmental benefits, including improvements in the ecological environment, reductions in greenhouse gas emissions, mitigation of environmental pollution, and enhancements in energy efficiency. However, the costs associated with achieving these environmental benefits are often borne by the corporates through increased production and operational costs. Organizations, to a large extent, have to adjust their behavior based on the need and scarcity of the resources they depend on. Nevertheless, the decision-making process of companies regarding corporate environmental responsibility is also closely intertwined with their financial and operational conditions [34,35]. In the short term, corporate environmental responsibility has a strong positive externality [36], greatly influencing financial resource allocation decisions. Nofsinger et al. [27] shows that although the environmental problems of corporates will increase the cost of capital, the green advantages of corporates alone are not sufficient to mitigate these costs. As a result, companies may have limited motivation to adopt green practices for their limited financial resource.
In China, one of the biggest obstacles for corporates to achieving corporate environmental responsibility is financial problems. Evidence has shown that financial incentives are crucial for companies to engage in corporate environmental responsibility [37]. As a result, actions have been taken in GFRI areas to support green projects and ease financial constraints, including green project confirmation process standardization, environmental information disclosure supervision, and special green fund establishment. The allocation of funds determines the extent to which companies participate in sustainable governance and investment. According to the resource allocation theory, green finance policy essentially facilitates the redistribution of a company’s financial resources with a notable emphasis on enhancing their corporate environmental responsibility. Firstly, this policy compels companies to reassess and shapeshift their financial strategies, directing their resources towards more eco-friendly and sustainable endeavors. This is in line with the findings of Pizzi et al. [38], who argue for a shift from linear production and consumption processes to circular ones that incorporate financial, natural, and social capital. Secondly, green finance policy creates a favorable financing environment for companies in the pilot area. By offering incentives and implementing regulations that promote environmentally responsible practices, these policies assist in attracting and streamlining financial resources in the direction of sustainability. Green finance policy aids in bolstering their financial capacity which, in turn, drives further commitment to their corporate environmental responsibility. Lastly, a balance is reached between financial performance and environmental policies as noted by Redondo Alamillos and De Mariz [4] and Xu and Kim [39]. Thus, with strong financial performance incentivized by green finance policy, companies are likely to prioritize corporate environmental responsibility, leading to a positive cyclical effect. De Miguel and Pindado [40] hold the view that corporates with limited free cash flow encounter challenges in terms of internal capital availability, resulting in insufficient investment capacity. The corporate environmental responsibility activities typically exhibit characteristics such as long cycles, high capital requirements, and substantial risk, necessitating greater reliance on long-term debt financing to provide the necessary financial support. In addition, Temiz [41] argues that corporate environmental performance significantly reduces the cost of corporate debt. Enhancements in financing capacity result in a reduction in the cost of corporate environmental responsibility, thereby fostering the intention of corporates’ green development. So, we proposed the following hypothesis:
Hypothesis 2 (H2):
The GFRIs policy accelerates the corporate environmental responsibility of industrial companies through financing capacity.
Several studies have explored the driving factors of corporate green development [42]. Some attribute the driving force behind ecological innovation to regulatory pressure from multiple stakeholders. Hojnik and Ruzzier [1] concluded that regulation and the market primarily propel ecological innovation. Corporates experiencing financial constraints and poor operational performance lack the necessary financial resources to invest in green initiatives, despite facing pressure to conform to environmental legitimacy [13,35]. On one hand, the GFRIs policy can essentially help allocate financial resources in a way that incentivizes companies to undertake environmentally responsible actions without becoming financially strained. On the other hand, the green finance policy also aids in clarifying green regulations. This promotes a better understanding and implementation of sustainable practices in the industry. The Green Finance Reforms and Innovations (GFRIs) utilize a unique dual supervision strategy, incorporating both a command-and-control approach and financial regulation for evaluating and imposing green standards. As posited by Moffette et al. [18], such an amalgamation of green measures effectively keeps corporate behavior in check. This dual supervision system significantly diminishes information asymmetry, fostering a more transparent and effective allocation of resources within and outside companies, thereby propelling them towards improved environmental responsibility. Further, Heinkel et al. [43] contend that as green investors divest from companies with high pollution levels, these companies face a surge in capital costs. In particular, the GFRIs implement differentiated tax rates for green and high-polluting companies as a significant factor affecting industrial companies’ cost of capital [44]. Under strict environmental regulations, highly polluting companies are urged to undertake a green transition to circumvent fines and penalties. Companies displaying green efforts are rewarded with enhanced reputation and social capital [45], in turn fueling further corporate commitment towards environmental responsibility. Therefore, GFRIs serve a crucial role as an external governance tool, promoting sustainable corporate governance by allocating resources efficiently in favor of environmental responsibility. So, we proposed the following hypothesis:
Hypothesis 3 (H3):
The GFRIs policy accelerates the corporate environmental responsibility of industrial companies through environmental protection supervision.
To provide a robust foundation for the fundamental analysis of this study, we have constructed a comprehensive theoretical framework in Figure 3 that encapsulates the core deductions and hypotheses developed throughout our research. This framework serves as a conceptual map, guiding our investigation into the dynamic effects of the GFRIs policy. By integrating insights from the relevant literature and theoretical perspectives, we have outlined the key variables, interactions, and mechanisms that are expected to influence the policy’s outcomes.
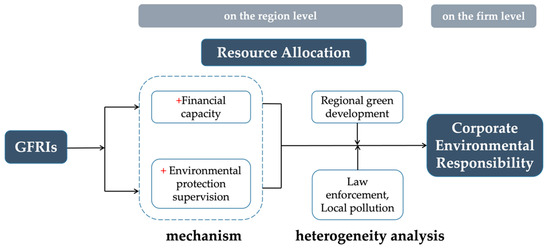
Figure 3.
Research framework. The “+” in the figure represents a positive impact.
3. Empirical Research Design
3.1. Sample and Data
To investigate the relationship between the GFRIs policy and corporate environmental responsibility, we select an initial sample of Chinese-listed companies in the industrial sector from 2013 to 2020. We focus on industrial companies because they are the major energy consumers and pollutant emitters. For the accuracy of the estimation results, this paper narrows the research sample range to industrial corporates following the criteria of China Energy Statistical Yearbook and Guidelines for the Classification of Listed Companies by Industry (2012) following the work of Xu and Li [7].
The data are mainly collected from the following sources: (1) data of corporate environmental responsibility are obtained from the annual financial reports with the breakdown of administrative expenses and the construction in progress, respectively. (2) The environment protection supervision data are from the announcements of the Natural Resources Defense Council. (3) All the financial data of the other variables were obtained from the CSMAR database.
We screen the initial data as follows: (1) we exclude the sample of industrial corporates with ST and *ST; (2) we remove the sample with missing relevant variables. Continuous variables are winsorized at the 1% level to circumvent the effect of outliers. After screening, our final sample consists of 6975 annual observations of 1490 industrial listed companies in 31 provinces.
3.2. Variable Measurement
3.2.1. Dependent Variable
Following the method of Zhang et al. [12], we construct the index for corporate environmental responsibility: (1) we collected corporate-level green expenses under “Administrative expenses” in the annual report. From the line items under this account, we identified the expenditure items related to environmental protection (e.g., sewage, greening, environmental restoration, resource compensation (including mineral resources, soil and water resources, seedlings, and grasslands), environmental assessment, and waste (including solid waste, hazardous waste, and sewage) disposal), and aggregated the annual expenditures as the green expenses of the corporate. (2) Similarly, we collected the annual report on corporate environmental responsibility at the corporate level under “construction in progress”. From the detailed items under this account, we identified investment projects related to environmental protection and sustainable development (e.g., desulfurization and denitrification projects, biomass energy generation projects, sewage treatment, energy conservation, and environmental protection). We summarize this investment growth in that year as the green capital of corporates. (3) The sum of green capital and expenses is used as the proxy for the effort of corporate environmental responsibility. To eliminate scale effects and embellish the data, we refer to Zhang et al. [12] and use total assets to normalize corporate environmental responsibility. Finally, we visualize the normalized corporate environmental responsibility data by multiplying them by 100.
3.2.2. Independent Variable
The primary explanatory factor in this study is the GFRIs policy variable, viewed at the provincial level and represented as post × treat, the interaction of post and treat. post is a time dummy variable that indicates whether a given time period is after the establishment of the GFRIs. It is set to 1 for the years subsequent to the policy’s implementation (i.e., from 2017 to 2020) and is set to 0 for all preceding years. treat is the treatment variable that signifies whether any province was a pioneering adopter of the GFRIs, namely provinces such as Guangdong, Zhejiang, Jiangxi, Xinjiang, and Guizhou. A value of 1 is assigned to these first-mover provinces, while others are designated a 0. Hence, the interaction term post × treat effectively captures the impact of the GFRIs’ policy at a provincial level.
3.2.3. Mechanism Variables
We create the mechanism variables that explain how the GFRIs policy impacts the environmental responsibility of companies. Firstly, to validate our second hypothesis, we evaluate the overall credit level (Lncredit) within the province as a measure of local financing capacity. This is defined as the logarithm of the year-end balance of loans held by financial institutions in the municipal district. Secondly, corresponding to Hypothesis 3, we adopted the use of the ‘Pollution Information Transparency Index’ (PITI) as provided by the Institute of Public and Environmental Affairs (IPE) in their annual report. The PITI is a comprehensive score that reflects the clarity of regulatory data pertaining to pollution sources in various urban locales. It serves as a valuable measure of the local strength of environment protection supervision.
3.2.4. Control Variables
Following existing studies, such as Yu et al. [46] and Lu [47], we control for the following variables to mitigate potential bias: company size (SIZE), financial leverage (LEV), cash holdings (CASH), return on assets (ROA), board size (BOARD), independent director power (IND), company age (AGE), ownership concentration (TOP1), property of ownership (SOE), revenue growth (GROWTH), and regional economy development (GDP). We use these control variables to capture other factors that influence the impact of corporate environmental responsibility decisions. The main variable settings and definitions are shown in Table 1.

Table 1.
Variable definition.
3.3. Empirical Model
The method of Difference-in-Differences (DID), extensively adopted in studies assessing the impact of green financial policies [6,32,48], presents an effective solution to the endogeneity problem. To discern the causal relationship between the green financial policy and corporate environmental responsibility, we take the GFRIs as a quasi-natural experiment, based on a DID framework. The basic regression model we estimate is the following:
CERi,t represents the corporate environmental responsibility of corporate i in year t. posti,t × treati,t represents the net effect of GFRIs policy. CVi,t indicates all control variables in this paper. Year and Industry represent fixed effect of time and industry, respectively. εi,t indicates random error term.
3.4. Summary Statistics
Panel A of Table 2 shows the summary statistics of the main variables in the sample of this study. The mean value of CER is 0.723, which indicates that the overall environmental responsibility of companies operating in the industrial sector is not extensive yet. This implies that there is still considerable room for improvement in companies’ commitment towards environmental responsibility. The standard deviation of CER is 1.605, suggesting that the corporate environmental responsibility level of different companies in the industrial sector varies greatly. According to the statistics of control variables, 44.9% of our sample are state-owned corporates, with an average financial leverage ratio of 0.446, which is consistent with earlier Chinese research [12].
Table 2.
Descriptive statistics.
Panel B of Table 2 reports the mean values of CER by sector in descending order of CER. The CER of corporates in Production and Supply of Water and Manufacture of Measuring Instruments and Machinery sectors is at the top. However, the CER for the corporates in Manufacture of Railway, Ship, Aerospace, and Other Transport Equipment sector is low. These results indicate that heavily polluting corporates are not necessarily taking on a good level of environmental responsibility, which is consistent with our expectations. Moreover, corporate environmental responsibility varies across industries, which supports our decision in a fixed effect model in our subsequent study.
4. Empirical Results
4.1. Main Results
The main results are reported in Table 3. Column 1 shows the basic regression results of the GFRI policy on corporate environmental responsibility. In Column 2, we introduce the control variables in the regression. Column 3 estimates the actual impact of the GFRIs policy on corporate environmental responsibility, taking control variables and year and industry fixed effects into account. The coefficients of the primary explanatory variable post × treat on corporate environmental responsibility (CER), as presented in Columns 1–3, are all highly significant and positive at either a 5% or 1% confidence level. All the above results of our baseline model show that the GFRIs policy has considerably boosted the corporate environmental responsibility among industrial companies in the pilot area. The empirical results align with our expectations and support our hypothesis H1.
Table 3.
GFRIs policy and corporate environmental responsibility in industrial companies.
Moreover, given the vast geographical and economic disparities within China, we conduct a heterogeneity analysis segregating our original sample into the eastern, central, and western regions. This division is crucial as it enables us to capture potential variations in the effectiveness of the GFRIs policy across these distinct economic landscapes, with the results presented in Columns 4–6. Notably, the coefficient of post × treat in Column 4, representing the eastern region, is significantly positive at a 1% confidence level, indicating a markedly positive and pronounced response to the implementation of the GFRIs policy. In contrast, the corresponding coefficients in Columns 5 and 6, pertaining to the central and western regions, respectively, are not statistically significant. The results suggest that the eastern region, known for its advanced industrialization and robust infrastructure, benefits significantly from the policy. Conversely, the lack of statistically significant results in the central and western regions suggests that the policy’s impact may be more nuanced or subdued in these areas. This could be attributed to various factors, including limited infrastructural capabilities, weaker enforcement mechanisms, and lower levels of economic development, which may hinder the full realization of the policy’s potential benefits. Nevertheless, the non-significance of the results in these regions does not necessarily imply the absence of any effect; rather, it calls for a deeper exploration of the underlying factors and challenges that may be specific to these areas. Consequently, our subsequent analysis will delve deeper into the regional heterogeneous effects, aiming to uncover the underlying dynamics specific to each area.
4.2. Heterogeneity Analyses
We have closely examined the impact of GFRIs on the environmental responsibility of industrial companies. However, given the pioneering nature of these financial policies, GFRIs could potentially have inconsistent implications resulting from regional discrepancies. Hence, we undertake an exploration of potential heterogeneity within the context of regional characteristics. These analyses will enable us to investigate and compare distributed responses across industrial companies in consideration of the regional particularities tied to local development. This approach provides a comprehensive insight into our study, thereby reinforcing the credibility of our findings and conclusions.
4.2.1. Green Finance Development
Undoubtedly, the impact of green finance reform, a profound leap forward in the domain of green finance, may stand under the sway of the regional growth level of green finance. High-level development of green finance can pave the way for implementing green finance reforms [49]. Based on this, this study follows Lee and Lee [50] to employ four fundamental indicators with an aim to construct an aggregate regional green finance development index (GF) at the provincial level using the entropy method, including green credit, green investment, green bond, green insurance, and green fund. We divide all samples into two groups: those observations with a high level of green finance development (High-GF) and those with a lower level (Low-GF), based on the annual median of green finance development. Based on the dataset provided, the analysis first introduces the regional green finance development index (GF) and the interactive term of GF and post × treat into the initial model (1). This step is conducted to examine the differences between groups. In the process, the regression is undertaken separately in two distinct subsamples.
According to the results in Column 1 of Table 4, the coefficient of post × treat × GF is significantly positive at the 1% confidence level. This result highlights that as regional green finance development escalates, the promotion effect exerted by the GFRIs policy exhibits corresponding growth. From Columns 2 and 3, we can tell that, compared with regions with lower development levels of green finance, the promotion effect of green finance reform on environmental responsibility is more pronounced in regions with higher development levels of green finance. Fundamental green finance construction in those regions is conducive to the development and implementation of green finance reform, as well as the landing and implementation of innovative green finance policies. Specifically, when the regional green finance development level is high, the local financial institutions and regulatory departments will provide greater emphasis on the growth of green finance, including increasing the publicity and promotion of green finance reform, facilitating the relevant policies to be rationally implemented at regional levels.
Table 4.
Heterogeneity analysis: green finance development.
4.2.2. Environmental Law Enforcement System
The pilot area covers provinces with different characteristics, with great differences in law, culture, and economic development. In this context, we then delve deeper into the diverse impact of the GFRI policies on the corporate environmental responsibilities of industrial companies, viewed through the perspective of the legal regime. For the measurement of the environmental law enforcement system, we use the marketization index, an analytical tool often used by Chinese scholars [11]. Specifically, the marketization index consists of six elements: government–market relationship, development of non-state economy, development of product market, development of factor market, development of market intermediary organizations, and legal environment. We utilize the China Sub-Provincial Marketization Index Report (2016), published by Wang et al. [51], to obtain the indices of “the development of market intermediary organizations and the legal environment” as our proxy for evaluating the environmental law enforcement strength. For this analysis, we have devised a binary variable Law, which is assigned a value of 1 if the combined score for these indices exceeds the yearly average, indicating a favorable condition; otherwise, it takes a value of 0. We regressed in two subsamples following the regression method of the model (1). Table 5 reveals that in groups characterized by superior legal environments, the GFRIs policy coefficient post × treat is significantly positive at the 5% level. In contrast, in groups with inferior legal environments, the coefficient is negative and insignificant. This implies that, within companies operating in regions with weak legal environments, GFRI policies have a greater impact on fostering environmental responsibilities than in companies functioning under robust legal systems.
Table 5.
Heterogeneity analysis: environmental law enforcement system.
Formal environmental regulation and national governance influence behavior at the firm level [12,52]. For companies located in regions with a strong rule of law, environmental regulations exercise a more profound restraining effect. Consequently, industrial companies experience more developmental pressure, leading to a more positive impact on their environmental responsibilities [53]. On the other hand, in regions with a weaker rule of law, and enforcement by the Ministry of Environmental Protection is weak, there is an incomplete execution of green financial policies. This, in turn, dilutes the promotion effect of GFRIs policies on the environmental responsibilities of industrial companies.
4.2.3. Environmental Pollution Level
Following the rigorous theoretical analysis and empirical result presented above, we have verified the robustness of our findings and demonstrated the affirmative impact of green policies on corporate environmental responsibility. Notably, the responsiveness of corporate environmental strategies to the signaling effect of the GFRIs policy varies, which is influenced by the intensified public demand for pollution control [54]. Generally, industrial companies in heavily polluted areas face substantial public pressure, compelling them to augment their environmental responsibilities to alleviate environmental stress, including both policy-driven and public opinion pressures [4,55]. Recent studies have emphasized the significance of regional pollution levels in shaping corporate environmental behavior. For instance, Yu et al. [56] found that companies in highly polluted regions are more likely to adopt proactive environmental measures in response to external policy stimuli. Similarly, Liu et al. [57] demonstrated that the public’s heightened awareness of pollution in severely affected areas drives corporates to enhance their environmental responsibilities. Such research strengthens the motivation behind our exploration of the differential impact of the GFRIs policy based on regional pollution intensity. In this context, we delve deeper into the influence of regional pollution intensity on companies’ environmental responsibilities.
To further investigate this relationship, we sort the original sample into two distinct groups according to the local pollution level (pollute, the natural logarithm of local water waste emission, in million tons) following the work of Xu et al. [10], namely Heavily polluted and Lightly polluted groups, based on the annual pollute median. The results are presented in Table 6. By re-estimating our regression model (1) using these subsamples, we find that in regions with heavy pollution, the coefficient associated with the GFRIs policy is significantly positive at the 5% level. Conversely, in areas with light pollution, the coefficient of the GFRIs policy is statistically significant but negative. This implies that the environmental protection supervisory power of the GFRIs policy is particularly crucial in regions with more severe environmental pollution. Our conclusions align with the findings of Li et al. [58], indicating that regions with higher pollution levels are more inclined to respond to green policies.
Table 6.
Heterogeneity analysis: regional environmental pollution.
4.3. Mechanism Examination
Based on the previous theoretical analysis and empirical tests, we find that the GFRIs policy significantly enhances the corporate environmental responsibility of industrial companies. This section aims to uncover potential channels through which this impact is realized. Following the work by Baron and Kenny in their 1986 intermediation mechanism test, we construct model (2) and (3) along with model (1) to test hypotheses H2 and H3. In these models, Mi,t denotes the intermediating mechanism variable, as in environment protection supervision intensity and credit level of the region in this paper. The remaining variables are consistent with those in model (1).
If the intermediating mechanism holds true, we forecast a significantly positive in model (2). This would suggest that the implementation of the GFRIs policy would result in a substantial increase in the intermediating mechanism variable. Subsequently, a significant positive in model (3) would serve to confirm this intermediating mechanism.
4.3.1. Financing Capacity
According to the hypothesis we proposed in H2, we believe that the GFRIs policy could amplify corporate environmental responsibility by enhancing financing capacity [16]. To empirically support this presumption, we utilize regional credit levels (Lncredit) as the intermediating mechanism variable, and the results of which can be found in Table 7. As it can be observed from Columns 1 through 3 in Table 7, the GFRIs policy has indeed resulted in a substantial increase in the total regional credit level. And, in turn, the city-level financing capacity drives up the corporate environmental responsibility of industrial companies. These findings, therefore, suggest that the GFRIs policy has effectively boosted financial capacity.
Table 7.
Mechanism test: financing capacity.
4.3.2. Environment Protection Supervision
To verify hypothesis H3, we substitute PITI, the proxy of local environment protection supervision with M in model (2) and (3). Table 8 displays our empirical findings. As indicated in Column 2, the estimated coefficient of post × treat is 6.9465, with significance at the 1% level. This suggests that the GFRIs policy has notably amplified environmental regulatory transparency, indicative of improved environment protection supervision. Column 3 reveals that this increased environment protection supervision has significantly enhanced corporate environmental responsibility. These findings align with those of Su et al. [16], who proved that the GFRIs policy can trigger environmental governance effects that mitigate corporate energy consumption intensity.
Table 8.
Mechanism test: environment protection supervision.
4.4. Dynamic Effect Analysis
To gain a deeper understanding of the intricate impacts of the GFRIs policy, we have undertaken a dynamic effect analysis. This approach is essential given the complexity and multifaceted nature of policy implementation, especially when dealing with policies that have the potential to bring about long-term, systemic transformations. Acquiring the recognition that policies often do not yield immediate and straightforward results, but instead exhibit lagged effects that unfold over time, we have elaborated a dynamic effect analysis to offer a clearer and more comprehensive explanation of the impact of GFRIs.
Drawing inspiration from the methodology outlined by He et al. [59], we have developed model (4) with the specific objective of exploring the dynamic effects of the GFRIs policy across a three-year period post implementation. To achieve this, we have incorporated a dummy variable for Yearj, which assumes a value of 1 for the given year under consideration and 0 otherwise. This approach enables us to analyze the policy’s impact year by year, capturing any nuanced changes or trends in its effectiveness over time. All other variables in model (4) remain consistent with those utilized in model (1), ensuring continuity and comparability in our analysis.
Given the multicollinearity issue among the variables Year2018, Year2019, and Year2020, we conducted three distinct regression analyses to investigate the dynamic effect of GFRIs. As evidenced in Table 9, the coefficients associated with the interactions post × treat × Year2018 and post × treat × Year2019 are significantly positive, suggesting that GFRIs has a notable promoting effect on the corporate environmental responsibility of industrial companies in the immediate years following its implementation. However, the coefficient pertaining to post × treat × Year2020 is not significant, indicating that this positive influence gradually diminishes over time. This finding underscores the transient nature of the policy’s impact and highlights the need for continuous monitoring and potential adjustments to maintain its effectiveness in fostering corporate environmental responsibility.
Table 9.
Dynamic effect analysis.
4.5. Robustness Tests
To alleviate any concerns about omitted variable bias or reverse causality, we first tested the parallel trend hypothesis for the double difference test. Second, we refer to Yao et al. [17] to conduct a placebo test using a dummy policy point in time. Third, we try to exclude the potential effect of other environmental policies. Lastly, we use an alternative measurement to replace the indicator for corporate environmental responsibility.
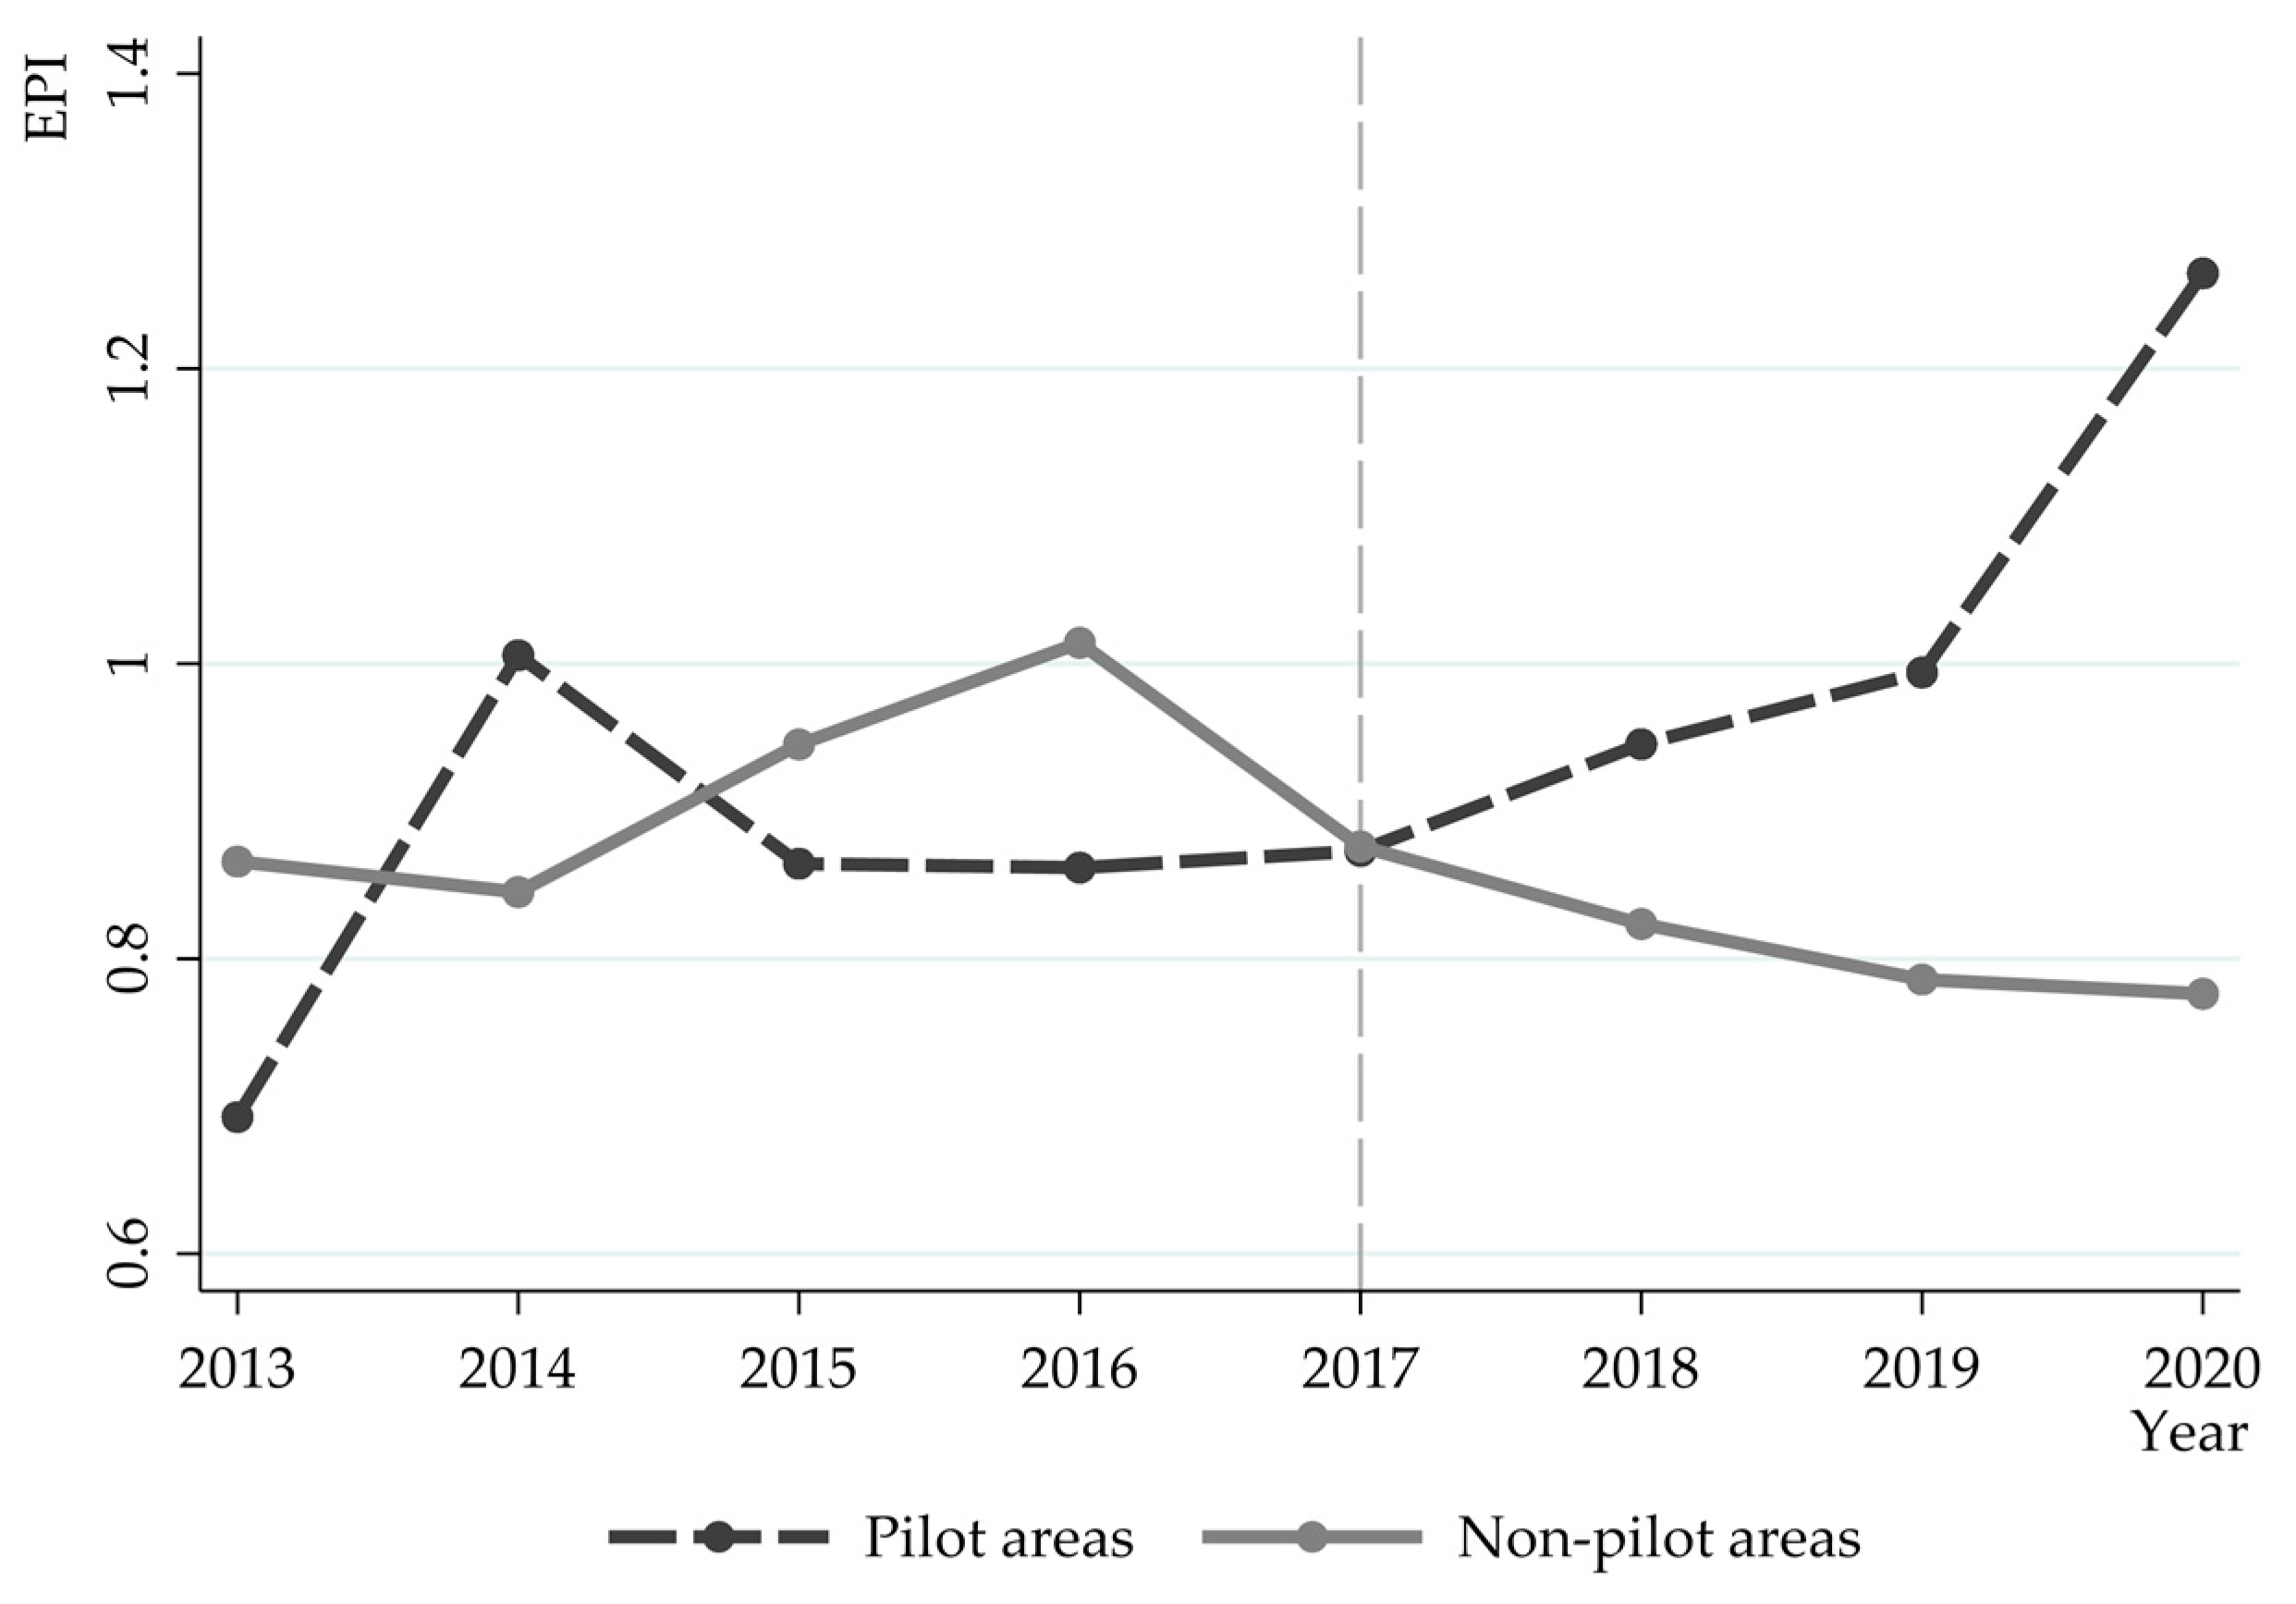
4.5.1. Parallel Trend Assumption
The DID method is employed with the prerequisite that the parallel trend test is upheld, ensuring the test and control groups exhibit similar time trends prior to policy implementation. Therefore, we plot the average growth trend of corporate environmental responsibility of industrial corporates during 2013–2020. The horizontal axis represents the year, while the vertical axis denotes the average corporate environmental responsibility ratio of industrial companies, multiplied by 100. The dashed line indicates industrial corporates in the first pilot province, and the solid line indicates industrial corporates in non-pilot provinces. The entire sample is divided into two periods: before (2013–2016) and after (2017–2020) the implementation of the policy, with 2017, the year of the initial GFRIs pilots, serving as the demarcation point.
Figure 4 reveals that, prior to the policy implementation, the average corporate environmental responsibility of industrial companies exhibited fluctuations within a range of 0.6 to 1, maintaining a generally similar overall trend. However, following the policy’s enforcement, a divergence in the parallel trend became evident. Specifically, industrial companies in the pilot zone exhibit an upward trend in terms of their average corporate environmental responsibility. Conversely, those in the non-pilot zone demonstrated a more stable pattern with a slight downward tendency. Based on these observations, we confirm that our DID model adheres to the parallel trend assumption.
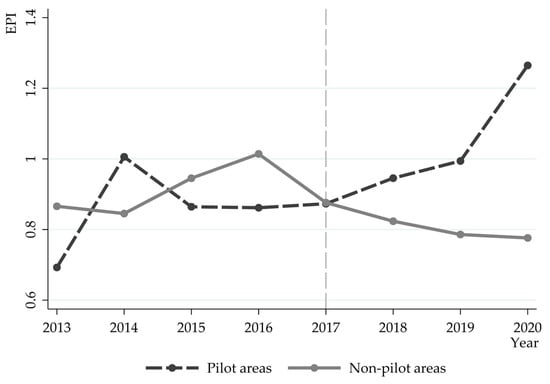
Figure 4.
Average growth trend of corporate environmental responsibility in industrial corporates.
4.5.2. Placebo Test
To mitigate potential effects of other unobservable factors, we performed a placebo test to strengthen the credibility of our findings. Following the methodology outlined in Yao et al. [17], we set 2015 as the hypothetical policy incidence point and analyzed the sample data from 2013 to 2016 based on the model (1). As presented in Table 10, the coefficient of the explanatory variable did_2015 is negative and statistically insignificant. This result indicates there was no significant alteration in the corporate environmental responsibility of industrial companies prior to the anticipated policy shocks, validating the robustness of this study.
Table 10.
Robustness check: placebo test.
Moreover, it is noteworthy that the revised version of the PRC Environmental Protection Law came into effect in January 2015. Given that the placebo test’s hypothetical policy enactment point coincided with this legal milestone, these results can also be interpreted as excluding the potential influence of the new PRC Environmental Protection Law on the corporate environmental responsibility of industrial companies. In addition, Figure 1 illustrates that, from 2015 to 2017, there was no substantial change in the average corporate environmental responsibility of the control group within the pilot areas, further validating that the new PRC Environmental Protection Law did not significantly impact the benchmark regression analysis presented in this paper.
4.5.3. Exclusion of the Effects of Other Policies
Apart from the new environmental laws we mentioned above, the corporate environmental responsibility of industrial corporates may also be affected by other environmental regulatory policies during our study period. For the reliability of the findings in this paper, we conducted an exclusion test for other policies to account for the potential impact of such policies.
Firstly, we considered the third batch of low-carbon city pilots initiated in 2017. To mitigate its influence, we included a dummy variable (LCC) for the third batch of low-carbon cities in our regression model. The empirical result is shown in Column 1 of Table 11. The coefficient of the core explanatory variables post × treat is significantly positive at the 5% level, indicating that the third batch of low-carbon city pilots has no significant effect on the baseline regression results, thus excluding this alternative explanation that the low-carbon city pilots influenced our findings.
Table 11.
Robustness check: exclusion of the effects of other policies.
Secondly, we address the environmental protection fee-to-tax policy that took effect in January 2018. Drawing on the work of Yu et al. [46], we construct an industry pollution dummy variable FTT to study the environmental protection fee-to-tax. We identified heavily polluting companies as the experimental group and non-heavily polluting companies as the control group. To categorize companies, we referenced Li et al. [60] and the Guidelines for Industry Classification of Listed Companies (2012), identifying 15 major industrial categories, including coal, oil, and gas mining, ferrous metal mining, non-ferrous metal mining and selection, and the textile industry, as heavy polluters (industry codes including B06, B07, B08, B09, C17, C19, C22, C25, C26, C28, C29, C30, C31, C32, and D44). Similar to the low-carbon city pilot analysis, we excluded the potential influence of the environmental fee-to-tax policy and present the empirical results in Column 2 of Table 11. Column 2 shows that the coefficient of the explanatory variable post × treat is significantly positive at the 5% level, indicating that the baseline regression results remain robust.
Thirdly, the distinction between the primary objectives of the 12th and 13th Five-Year Plans significantly alters the policy environment. While the 12th Plan prioritizes the prevention and control of air, water, and soil pollution, alongside intensified ecological protection measures, the 13th Plan addresses the challenges of unbalanced, uncoordinated, and unsustainable economic and social development. This shift in objectives marks 2016, the year of the 13th Plan’s environmental project launch, as a pivotal point in the evolution of the policy landscape. To isolate the potential influence of this policy transition, we incorporated a dummy variable Five-Year, representing the pivotal year of 2016, which marked the shift from the 12th to the 13th Five-Year Plan. By excluding the effects associated with this changing point, we present the refined empirical findings in Column 3 of Table 11. Notably, the results in Column 3 demonstrate that the coefficient of the explanatory variable post × treat remains significantly positive at the 5% level, underscoring the robustness of our baseline regression results, even in the context of the changing policy environment.
4.5.4. Alternative Measurement of Corporate Environmental Responsibility
To further verify the robustness of our findings in this paper, we draw inspiration from Zhang et al. [12] and construct two variables, EF and EL, as alternative measurements of corporate environmental responsibility. EL represents corporate green investments, taking the logarithm of annual green cost in yuan while EL represents corporate green capital, taking the logarithm of annual green capital in yuan. We then substitute EF and EL for the original CER in our regression analysis. The results of this re-regression, presented in Table 12, reveal that the coefficients of the core explanatory variable post × treat remain significantly positive at the 5% level. This consistency further underscores the robustness and reliability of our baseline regression findings.
Table 12.
Robustness check: alternative measure of corporate environmental responsibility.
5. Conclusions
In the context of the global energy crisis and escalating climate change, the quest to effectively allocate resources towards low-carbon development has emerged as a critical economic topic. This study holds significant theoretical and practical importance as it delves into the micro-level nuances of China’s green policies, shedding light on their pivotal role in nurturing corporate environmental responsibility. Drawing the sample of industrial listed companies in Shanghai and Shenzhen A-shares from 2013 to 2020, employing a DID model rooted in quasi-natural experiments approved by the GFRIs policy, we find evidence that the GFRIs policy significantly promotes corporate environmental responsibility among industrial companies. After conducting parallel trend tests, excluding the effects of other policies, placebo tests, and changing the measurement for corporate environmental responsibility, these findings still hold. Furthermore, we delve into the underlying channels of this policy and uncover that both financing capacity enhancement and strengthened environmental protection supervision play pivotal roles. Recognizing that the Green Financial Reform and Innovation (GFRI) policies may yield varied outcomes due to regional disparities, we embark on an examination of potential variations rooted in regional characteristics. At the meso-level, our heterogeneity analysis illuminates that the GFRI policy exerts a more profound influence in regions characterized by robust green finance development, solid legal frameworks, and those confronting acute pollution problems.
This study makes a significant contribution by shifting the focus from the macro-level impacts of green policies, which have been extensively documented to reduce environmental pollution [46] and carbon emissions [61], foster green innovation [28], and advance urban green development [19], to the micro-level dynamics that underpin these broader transformations. By doing so, it addresses a gap in the literature by delving into the nuanced effects of green policies on corporate behavior, particularly corporate environmental responsibility, as a pivotal indicator of firms’ genuine commitment to sustainable development. In contrast to previous research that primarily evaluated the success of green policies through tangible metrics such as quantifiable innovations [1,21] and technological advancements [13,23,31], this work innovatively examines the enhancement of companies’ foundational green development efforts from the perspective of resource allocation. Notably, it frames financial capability and the oversight of environmental protection as integral aspects of stakeholder engagement, recognizing that the profound potential of the green revolution transcends mere outcomes and necessitates a relentless pursuit of internalized environmental stewardship practices within organizations. This approach offers a deeper understanding of the sustained transformational processes necessary to advance sustainable business practices.
Our research also provides timely policy recommendations in several aspects. First, this research contributes to the understanding of how government interventions, specifically green policies, can shape corporate behavior and incentivize environmentally sustainable practices. By examining the micro-level effects, it enriches the body of knowledge on the intricate relationship between policy frameworks and corporate decision-making processes, offering insights into the mechanisms that facilitate or hinder the adoption of green practices. Our study highlights the effectiveness of GFRI policies in stimulating corporate sustainability, thus urging the government to further enhance policy implementation oversight, standardize the process of policy construction and implementation, strengthen supervision of law enforcement, and improve the overall quality of the legal system, to guarantee the successful establishment and execution of green finance policies. Secondly, for policymakers, it provides empirical evidence that can inform the design and implementation of more effective green policies, tailored to address regional disparities, and leverage existing strengths to accelerate the transition to a low-carbon economy. Specifically, the government is encouraged to proactively expand the GFRIs pilot zone. The GFRIs pilot policy within specific regions has yielded replicable and scalable successes, which underlines the potential for wider adoption of such a policy towards sustainable objectives. The implementation of such strategies will not only bolster corporate environmental responsibility but also contribute to an economically and socially sustainable future. Lastly, yet importantly, our research takes inspiration from the context of China, and thus contributes a significant body of evidence highlighting the efficacy of green finance policies in emerging markets. This research highlights the collective benefits of fostering a green economy, including improved environmental quality, sustainable economic growth, and enhanced social welfare. By drawing from these realistic scenarios, we can execute pragmatic strategies that cater to the unique characteristics of these markets.
There are still avenues for future research to explore. While our primary focus in this study was on the Chinese market, due to its unique institutional and firm-level characteristics, future research could delve into more detailed analyses from alternative perspectives and across a broader sample. Additionally, leveraging AI technologies to address the issues studied in our work has the potential to yield fascinating insights and innovative solutions. Although we have not ventured into this area in our current study, there is ample room and potential for future research in this exciting direction.
Author Contributions
X.Y.: Formal analysis, Writing—original draft, Writing—review and editing. L.S.: Data curation, Software, Visualization, Writing—original draft. J.X.: Supervision, Funding acquisition, Writing—review and editing. All authors have read and agreed to the published version of the manuscript.
Funding
We are grateful to the National Natural Science Foundation of China for financial support through Grant No: 72072042 and the Accounting Research Project of Guangdong Province in 2023–2024 through Grant No: 20237-06.
Data Availability Statement
Data are available from the authors upon request.
Acknowledgments
We would like to thank the teachers and scholars who contributed their comments and suggestions to this article.
Conflicts of Interest
The authors declare that they have no conflicts of interest. This article does not contain any experiments with human participants or animals performed by any of the authors.
References
- Hojnik, J.; Ruzzier, M. What drives eco-innovation? A review of an emerging literature. Environ. Innov. Soc. Transit. 2016, 19, 31–41. [Google Scholar] [CrossRef]
- Amel-Zadeh, A.; Serafeim, G. Why and how investors use ESG information: Evidence from a global survey. Financ. Anal. J. 2018, 74, 87–103. [Google Scholar] [CrossRef]
- Gillan, S.L.; Koch, A.; Starks, L.T. Firms and social responsibility: A review of ESG and CSR research in corporate finance. J. Corp. Financ. 2021, 66, 101889. [Google Scholar] [CrossRef]
- Redondo Alamillos, R.; De Mariz, F. How can European regulation on ESG impact business globally? J. Risk Financ. Manag. 2022, 15, 291. [Google Scholar] [CrossRef]
- Flammer, C. Corporate green bonds. J. Financ. Econ. 2021, 142, 499–516. [Google Scholar] [CrossRef]
- Liu, X.; Wang, E.; Cai, D. Green credit policy, property rights and debt financing: Quasi-natural experimental evidence from China. Financ. Res. Lett. 2019, 29, 129–135. [Google Scholar] [CrossRef]
- Xu, X.; Li, J. Asymmetric impacts of the policy and development of green credit on the debt financing cost and maturity of different types of corporates in China. J. Clean. Prod. 2020, 264, 121574. [Google Scholar] [CrossRef]
- Li, Z.; Liao, G.; Wang, Z.; Huang, Z. Green loan and subsidy for promoting clean production innovation. J. Clean. Prod. 2018, 187, 421–431. [Google Scholar] [CrossRef]
- Wang, X.; Gao, C. Does green finance policy help to improve carbon reduction welfare performance? Evidence from China. Energy Econ. 2024, 132, 107452. [Google Scholar] [CrossRef]
- Xu, J.; Ye, F.; Li, X. Carbon intensity constraint policy and firm green innovation in China: A quasi-DID analysis. Sustain. Account. Manag. Policy J. 2024, 15, 704–730. [Google Scholar] [CrossRef]
- Yuan, X.; Li, Z.; Xu, J.; Shang, L. ESG disclosure and corporate financial irregularities--evidence from Chinese listed firms. J. Clean. Prod. 2022, 332, 129992. [Google Scholar] [CrossRef]
- Zhang, Q.; Yu, Z.; Kong, D. The real effect of legal institutions: Environmental courts and corporate environmental protection expenditure. J. Environ. Econ. Manag. 2019, 98, 102254. [Google Scholar] [CrossRef]
- Acemoglu, D.; Akcigit, U.; Hanley, D.; Kerr, W. Transition to clean technology. J. Political Econ. 2016, 124, 52–104. [Google Scholar] [CrossRef]
- Aghion, P.; Dechezleprêtre, A.; Hémous, D.; Martin, R.; Reenen, J.V. Carbon taxes, path dependency, and directed technical change: Evidence from the auto industry. J. Political Econ. 2016, 124, 1. [Google Scholar] [CrossRef]
- Zhang, W.; Ke, J.; Ding, Y.; Chen, S. Greening through finance: Green finance policies and firms’ green investment. Energy Econ. 2024, 131, 107401. [Google Scholar] [CrossRef]
- Su, Z.; Guo, Q.; Lee, H.T. Green finance policy and corporate energy consumption intensity: Evidence from a quasi-natural experiment in China. Energy Econ. 2022, 115, 106374. [Google Scholar] [CrossRef]
- Yao, S.; Pan, Y.; Sensoy, A.; Uddin, G.S.; Cheng, F. Green credit policy and corporate performance: What we learn from China. Energy Econ. 2021, 101, 105415. [Google Scholar] [CrossRef]
- Moffette, F.; Skidmore, M.; Gibbs, H.K. Environmental policies that shape productivity: Evidence from cattle ranching in the Amazon. J. Environ. Econ. Manag. 2021, 109, 102490. [Google Scholar] [CrossRef]
- Wang, Y.; Zhao, N.; Lei, X.; Long, R. Green finance innovation and regional green development. Sustainability 2021, 13, 8230. [Google Scholar] [CrossRef]
- Tang, D.Y.; Zhang, Y. Do shareholders benefit from green bonds? J. Corp. Financ. 2020, 61, 101427. [Google Scholar] [CrossRef]
- Berrone, P.; Fosfuri, A.; Gelabert, L.; Gomez-Mejia, L.R. Necessity as the mother of “green” inventions: Institutional pressures and environmental innovations. Strateg. Manag. J. 2013, 34, 891–909. [Google Scholar] [CrossRef]
- Wang, W.L.; Wang, L.J.; Wu, H.T. The impact of energy-consuming rights trading on green total factor productivity in the context of digital economy: Evidence from listed firms in China. Energy Econ. 2024, 131, 107342. [Google Scholar] [CrossRef]
- Liu, Z.; Zheng, S.; Zhang, X.; Mo, L. The impact of green finance on export technology complexity: Evidence from China. Sustainability 2023, 15, 2625. [Google Scholar] [CrossRef]
- Miles, M.P.; Covin, J.G. Environmental marketing: A source of reputational, competitive, and financial advantage. J. Bus. Ethics 2000, 23, 299–311. [Google Scholar] [CrossRef]
- Mohr, L.A.; Webb, D.J. The effects of corporate social responsibility and price on consumer responses. J. Consum. Aff. 2005, 39, 121–147. [Google Scholar] [CrossRef]
- Pedersen, L.H.; Fitzgibbons, S.; Pomorski, L. Responsible investing: The ESG-efficient frontier. J. Financ. Econ. 2021, 142, 572–597. [Google Scholar] [CrossRef]
- Nofsinger, J.R.; Sulaeman, J.; Varma, A. Institutional investors and corporate social responsibility. J. Corp. Financ. 2019, 58, 700–725. [Google Scholar] [CrossRef]
- Irfan, M.; Razzaq, A.; Sharif, A.; Yang, X. Influence mechanism between green finance and green innovation: Exploring regional policy intervention effects in China. Technol. Forecast. Soc. Chang. 2022, 182, 121882. [Google Scholar] [CrossRef]
- Zhang, H.; Wang, Y.; Li, R.; Si, H.; Liu, W. Can green finance promote urban green development? Evidence from green finance reform and innovation pilot zone in China. Environ. Sci. Pollut. Res. 2022, 30, 12041–12058. [Google Scholar] [CrossRef]
- Hou, H.; Zhu, Y.; Wang, J.; Zhang, M. Will green financial policy help improve China’s environmental quality? The role of digital finance and green technology innovation. Environ. Sci. Pollut. Res. 2023, 30, 10527–10539. [Google Scholar] [CrossRef]
- Sun, X.; Zhang, A.; Zhu, M. Impact of Pilot Zones for Green Finance Reform and Innovations on Green Technology Innovations: Evidence from Chinese Manufacturing Corporates. Environ. Sci. Pollut. Res. 2023, 15, 43901–43913. [Google Scholar] [CrossRef]
- Shi, J.; Yu, C.; Li, Y.; Wang, T. Does green financial policy affect debt-financing cost of heavy-polluting corporates? An empirical evidence based on Chinese pilot zones for green finance reform and innovations. Technol. Forecast. Soc. Chang. 2022, 179, 121678. [Google Scholar] [CrossRef]
- Lei, X.; Yu, J. Striving for sustainable development: Green financial policy, institutional investors, and corporate ESG performance. Corp. Soc. Responsib. Environ. Manag. 2024, 31, 1177–1202. [Google Scholar] [CrossRef]
- Qamruzzaman, M.; Wei, J. Investigation of the asymmetric relationship between financial innovation, banking sector development, and economic growth. Quant. Financ. Econ. 2018, 2, 981–1000. [Google Scholar] [CrossRef]
- Huang, Z.; Liao, G.; Li, Z. Loaning scale and government subsidy for promoting green innovation. Technol. Forecast. Soc. Chang. 2019, 144, 148–156. [Google Scholar] [CrossRef]
- Rennings, K.; Ziegler, A.; Ankele, K.; Hoffmann, E. The influence of different characteristics of the EU environmental management and auditing scheme on technical environmental innovations and economic performance. Ecol. Econ. 2006, 57, 45–59. [Google Scholar] [CrossRef]
- He, L.; Chen, L. The incentive effects of different government subsidy policies on green buildings. Renew. Sustain. Energy Rev. 2021, 135, 110123. [Google Scholar] [CrossRef]
- Pizzi, S.; Corbo, L.; Caputo, A. Fintech and SMEs sustainable business models: Reflections and considerations for a circular economy. J. Clean. Prod. 2021, 281, 125217. [Google Scholar] [CrossRef]
- Xu, Q.; Kim, T. Financial constraints and corporate environmental policies. Rev. Financ. Stud. 2022, 35, 576–635. [Google Scholar] [CrossRef]
- De Miguel, A.; Pindado, J. Determinants of capital structure: New evidence from Spanish panel data. J. Corp. Financ. 2001, 7, 77–99. [Google Scholar] [CrossRef]
- Temiz, H. Environmental performance and cost of finance: Evidence from emerging markets. Sustain. Account. Manag. Policy J. 2022, 13, 1229–1250. [Google Scholar] [CrossRef]
- Costa-Campi, M.T.; García-Quevedo, J.; Martínez-Ros, E. What are the determinants of investment in environmental R&D? Energy Policy 2017, 104, 455–465. [Google Scholar]
- Heinkel, R.; Kraus, A.; Zechner, J. The effect of green investment on corporate behavior. J. Financ. Quant. Anal. 2001, 36, 431–449. [Google Scholar] [CrossRef]
- Chava, S. Environmental externalities and cost of capital. Manag. Sci. 2014, 60, 2223–2247. [Google Scholar] [CrossRef]
- Guo, R.; Yuan, Y. Different types of environmental regulations and heterogeneous influence on energy efficiency in the industrial sector: Evidence from Chinese provincial data. Energy Policy 2020, 145, 111747. [Google Scholar] [CrossRef]
- Yu, C.H.; Wu, X.; Zhang, D.; Chen, S.; Zhao, J. Demand for green finance: Resolving financing constraints on green innovation in China. Energy Policy 2021, 153, 112255. [Google Scholar] [CrossRef]
- Lu, J. Can the green merger and acquisition strategy improve the environmental protection investment of listed company? Environ. Impact Assess. Rev. 2021, 86, 106470. [Google Scholar] [CrossRef]
- Xu, A.; Zhu, Y.; Wang, W. Micro green technology innovation effects of green finance pilot policy—From the perspectives of action points and green value. J. Bus. Res. 2023, 159, 113724. [Google Scholar] [CrossRef]
- Mazzucato, M.; Semieniuk, G. Financing renewable energy: Who is financing what and why it matters. Technol. Forecast. Soc. Change 2018, 127, 8–22. [Google Scholar] [CrossRef]
- Lee, C.C.; Lee, C.C. How does green finance affect green total factor productivity? Evidence from China. Energy Econ. 2022, 107, 105863. [Google Scholar] [CrossRef]
- Wang, X.; Fan, G.; Yu, J. Marketization Index of China’s Provinces: NERI Report 2016; Social Sciences Academic Press: Beijing, China, 2017. [Google Scholar]
- Mooneeapen, O.; Abhayawansa, S.; Khan, N.M. The influence of the country governance environment on corporate environmental, social and governance (ESG) performance. Sustain. Account. Manag. Policy J. 2022, 13, 953–985. [Google Scholar] [CrossRef]
- Han, S.R.; Li, P.; Xiang, J.J.; Luo, X.H.; Chen, C.Y. Does the institutional environment influence corporate social responsibility? Consideration of green investment of corporates—Evidence from China. Environ. Sci. Pollut. Res. 2020, 29, 12722–12739. [Google Scholar] [CrossRef] [PubMed]
- Qiang, Y.; Tang, Y.; Wang, C. Green Finance Advancement and Its Impact on Urban Haze Pollution in China: Evidence from 283 Cities. Sustainability 2024, 16, 4455. [Google Scholar] [CrossRef]
- Gu, Y.; Ho, K.C.; Yan, C.; Gozgor, G. Public environmental concern, CEO turnover, and green investment: Evidence from a quasi-natural experiment in China. Energy Econ. 2021, 100, 105379. [Google Scholar] [CrossRef]
- Yu, S.; Xu, L.; Du, P.; Qin, Z.; Zhong, Q.; Zhao, T. The impact of air pollution on corporate environmental information disclosure–Evidence from heavy pollution industries in China. Financ. Res. Lett. 2024, 59, 104793. [Google Scholar]
- Liu, Z.; Kong, L.; Xu, K. The impact of public environmental preferences and government environmental regulations on corporate pollution emissions. J. Environ. Manag. 2024, 351, 119766. [Google Scholar] [CrossRef]
- Li, L.; Ma, S.; Zheng, Y.; Ma, X.; Duan, K. Do regional integration policies matter? Evidence from a quasi-natural experiment on heterogeneous green innovation. Energy Econ. 2022, 116, 106426. [Google Scholar] [CrossRef]
- He, Y.; Zhu, X.; Zheng, H. The influence of environmental protection tax law on total factor productivity: Evidence from listed firms in China. Energy Econ. 2022, 113, 106248. [Google Scholar] [CrossRef]
- Li, B.; Xu, L.; McIver, R.; Wu, Q.; Pan, A. Green M&A, legitimacy and risk-taking: Evidence from China’s heavy polluters. Account. Financ. 2020, 60, 97–127. [Google Scholar]
- Brown, J.R.; Martinsson, G.; Thomann, C. Can environmental policy encourage technical change? Emissions taxes and R&D investment in polluting corporates. Rev. Financ. Stud. 2022, 35, 4518–4560. [Google Scholar]

Disclaimer/Publisher’s Note: The statements, opinions and data contained in all publications are solely those of the individual author(s) and contributor(s) and not of MDPI and/or the editor(s). MDPI and/or the editor(s) disclaim responsibility for any injury to people or property resulting from any ideas, methods, instructions or products referred to in the content. |
© 2024 by the authors. Licensee MDPI, Basel, Switzerland. This article is an open access article distributed under the terms and conditions of the Creative Commons Attribution (CC BY) license (https://creativecommons.org/licenses/by/4.0/).