
Modelling the Mechanical Effect of Salt Weathering on Historical Sandstone Blocks through Microdrilling

Abstract
:1. Introduction
2. Experimental Work
3. Results and Discussion
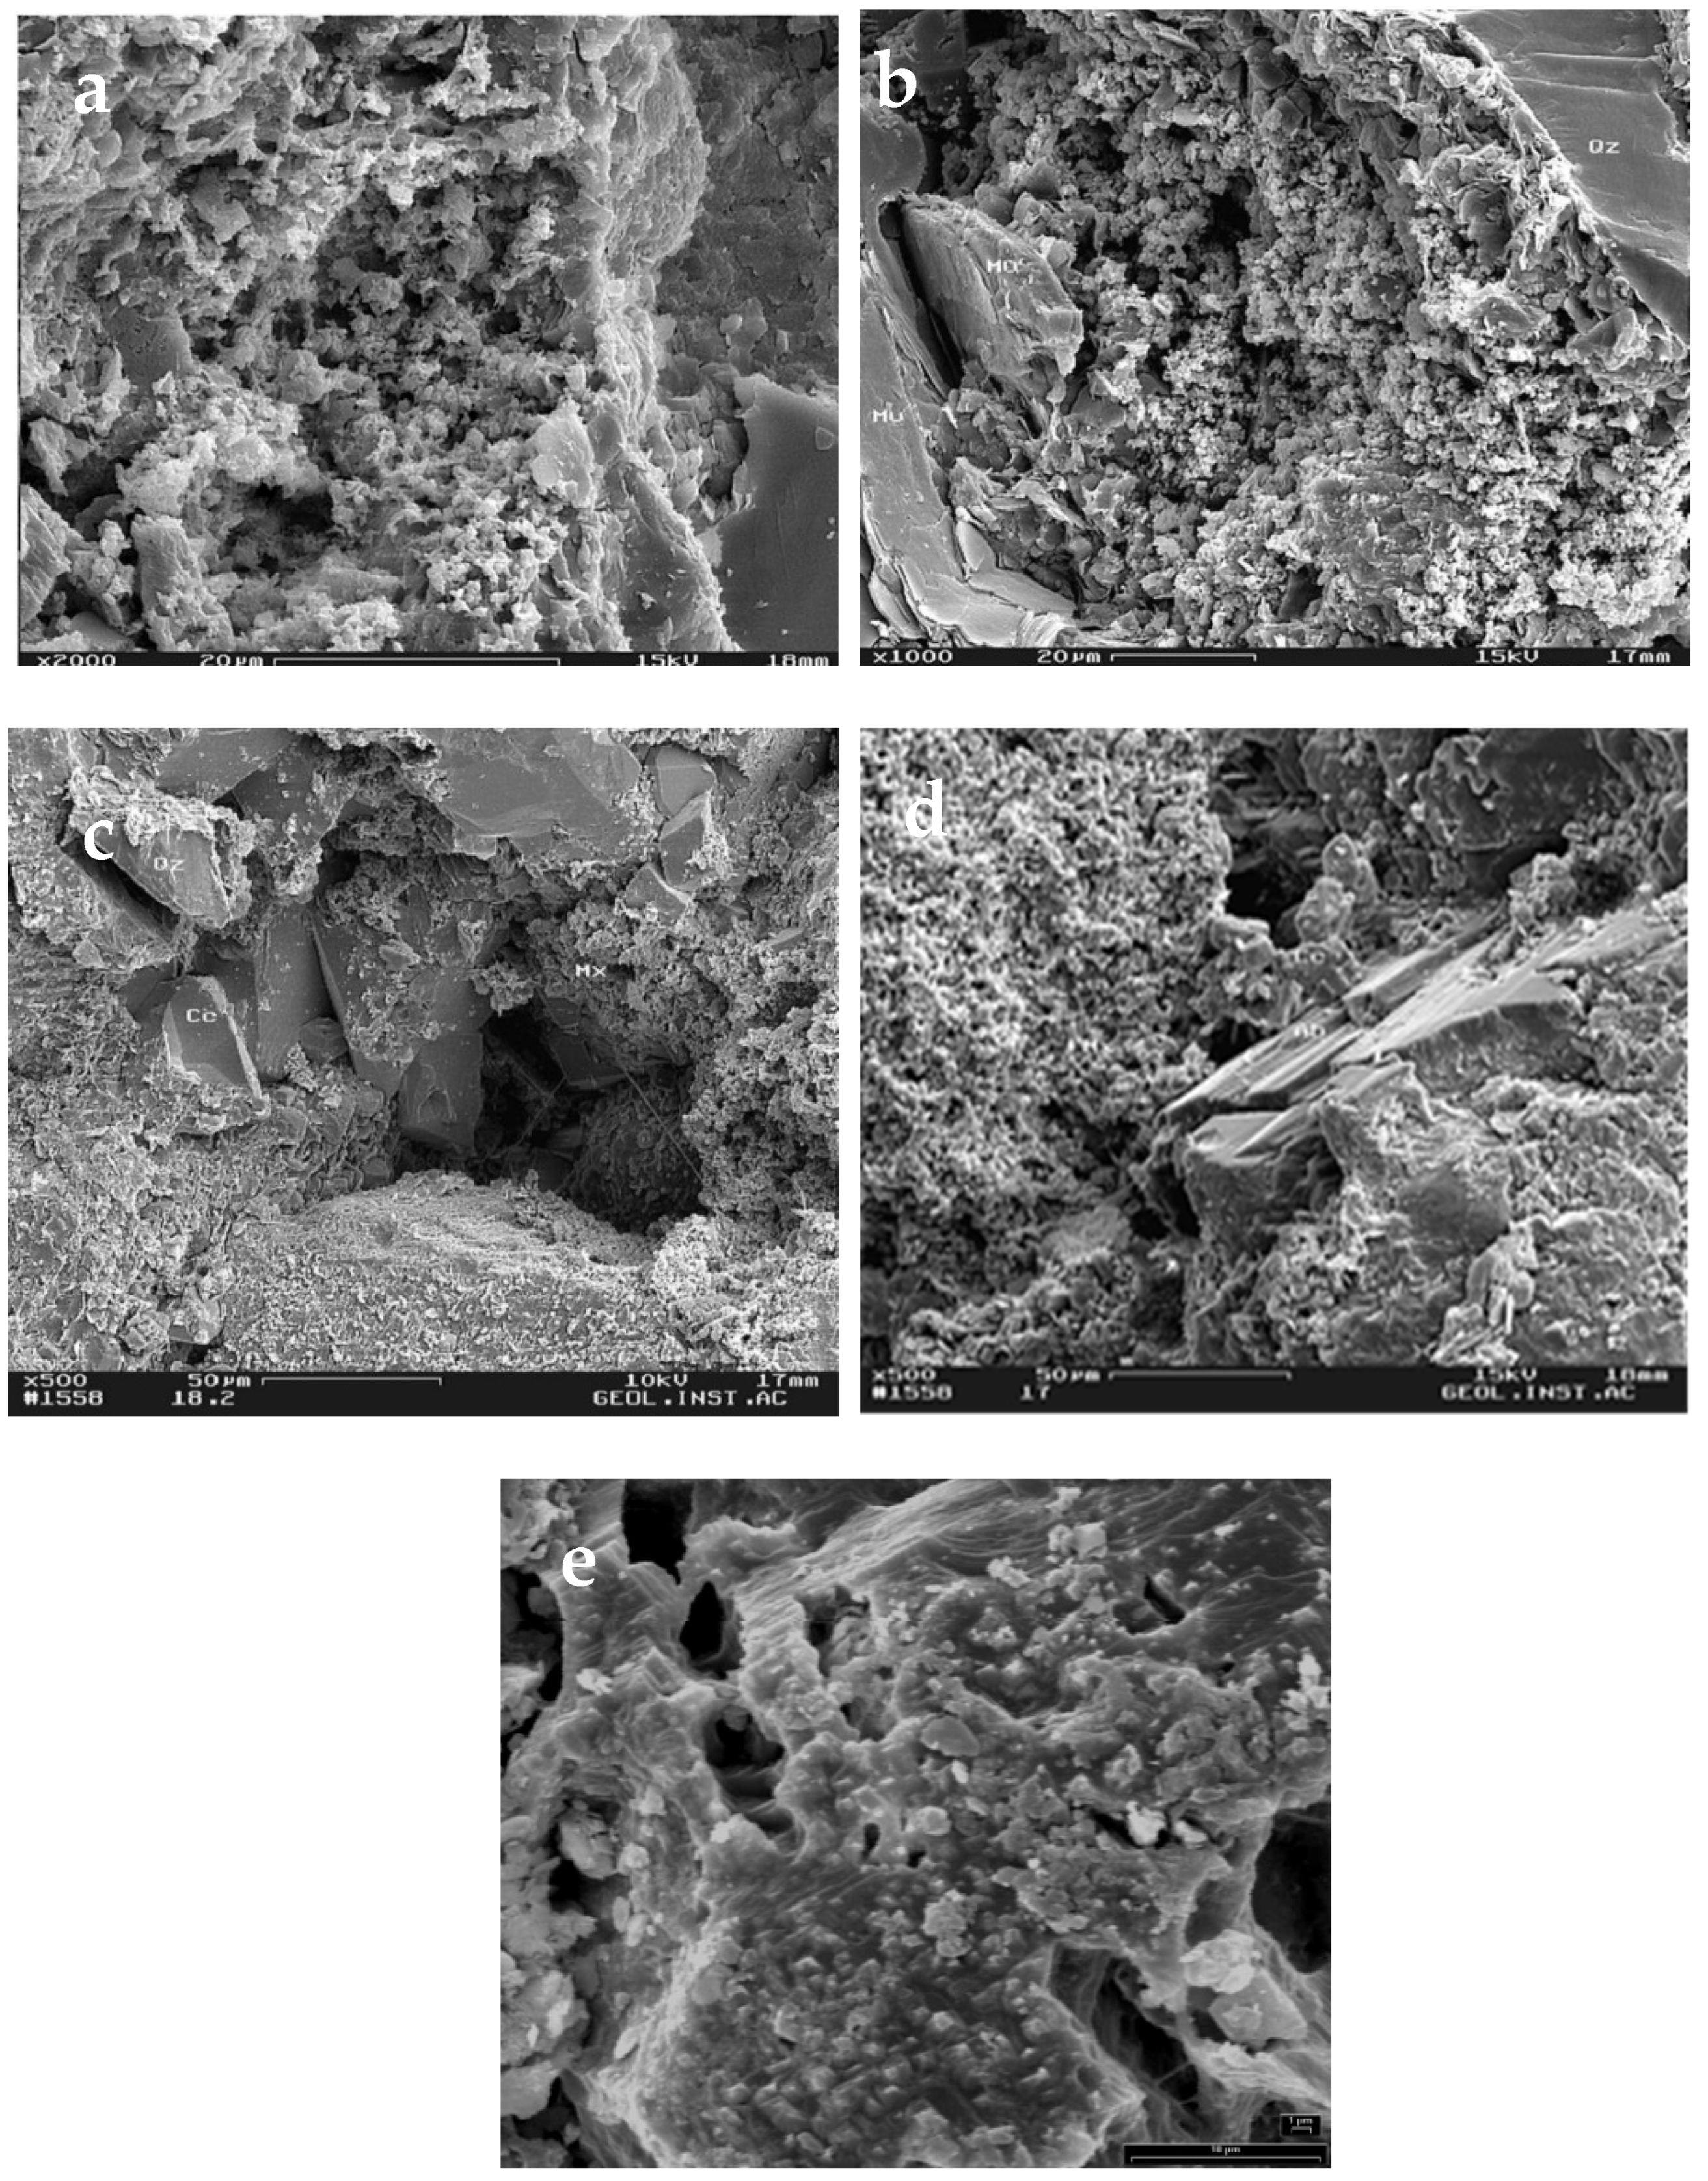
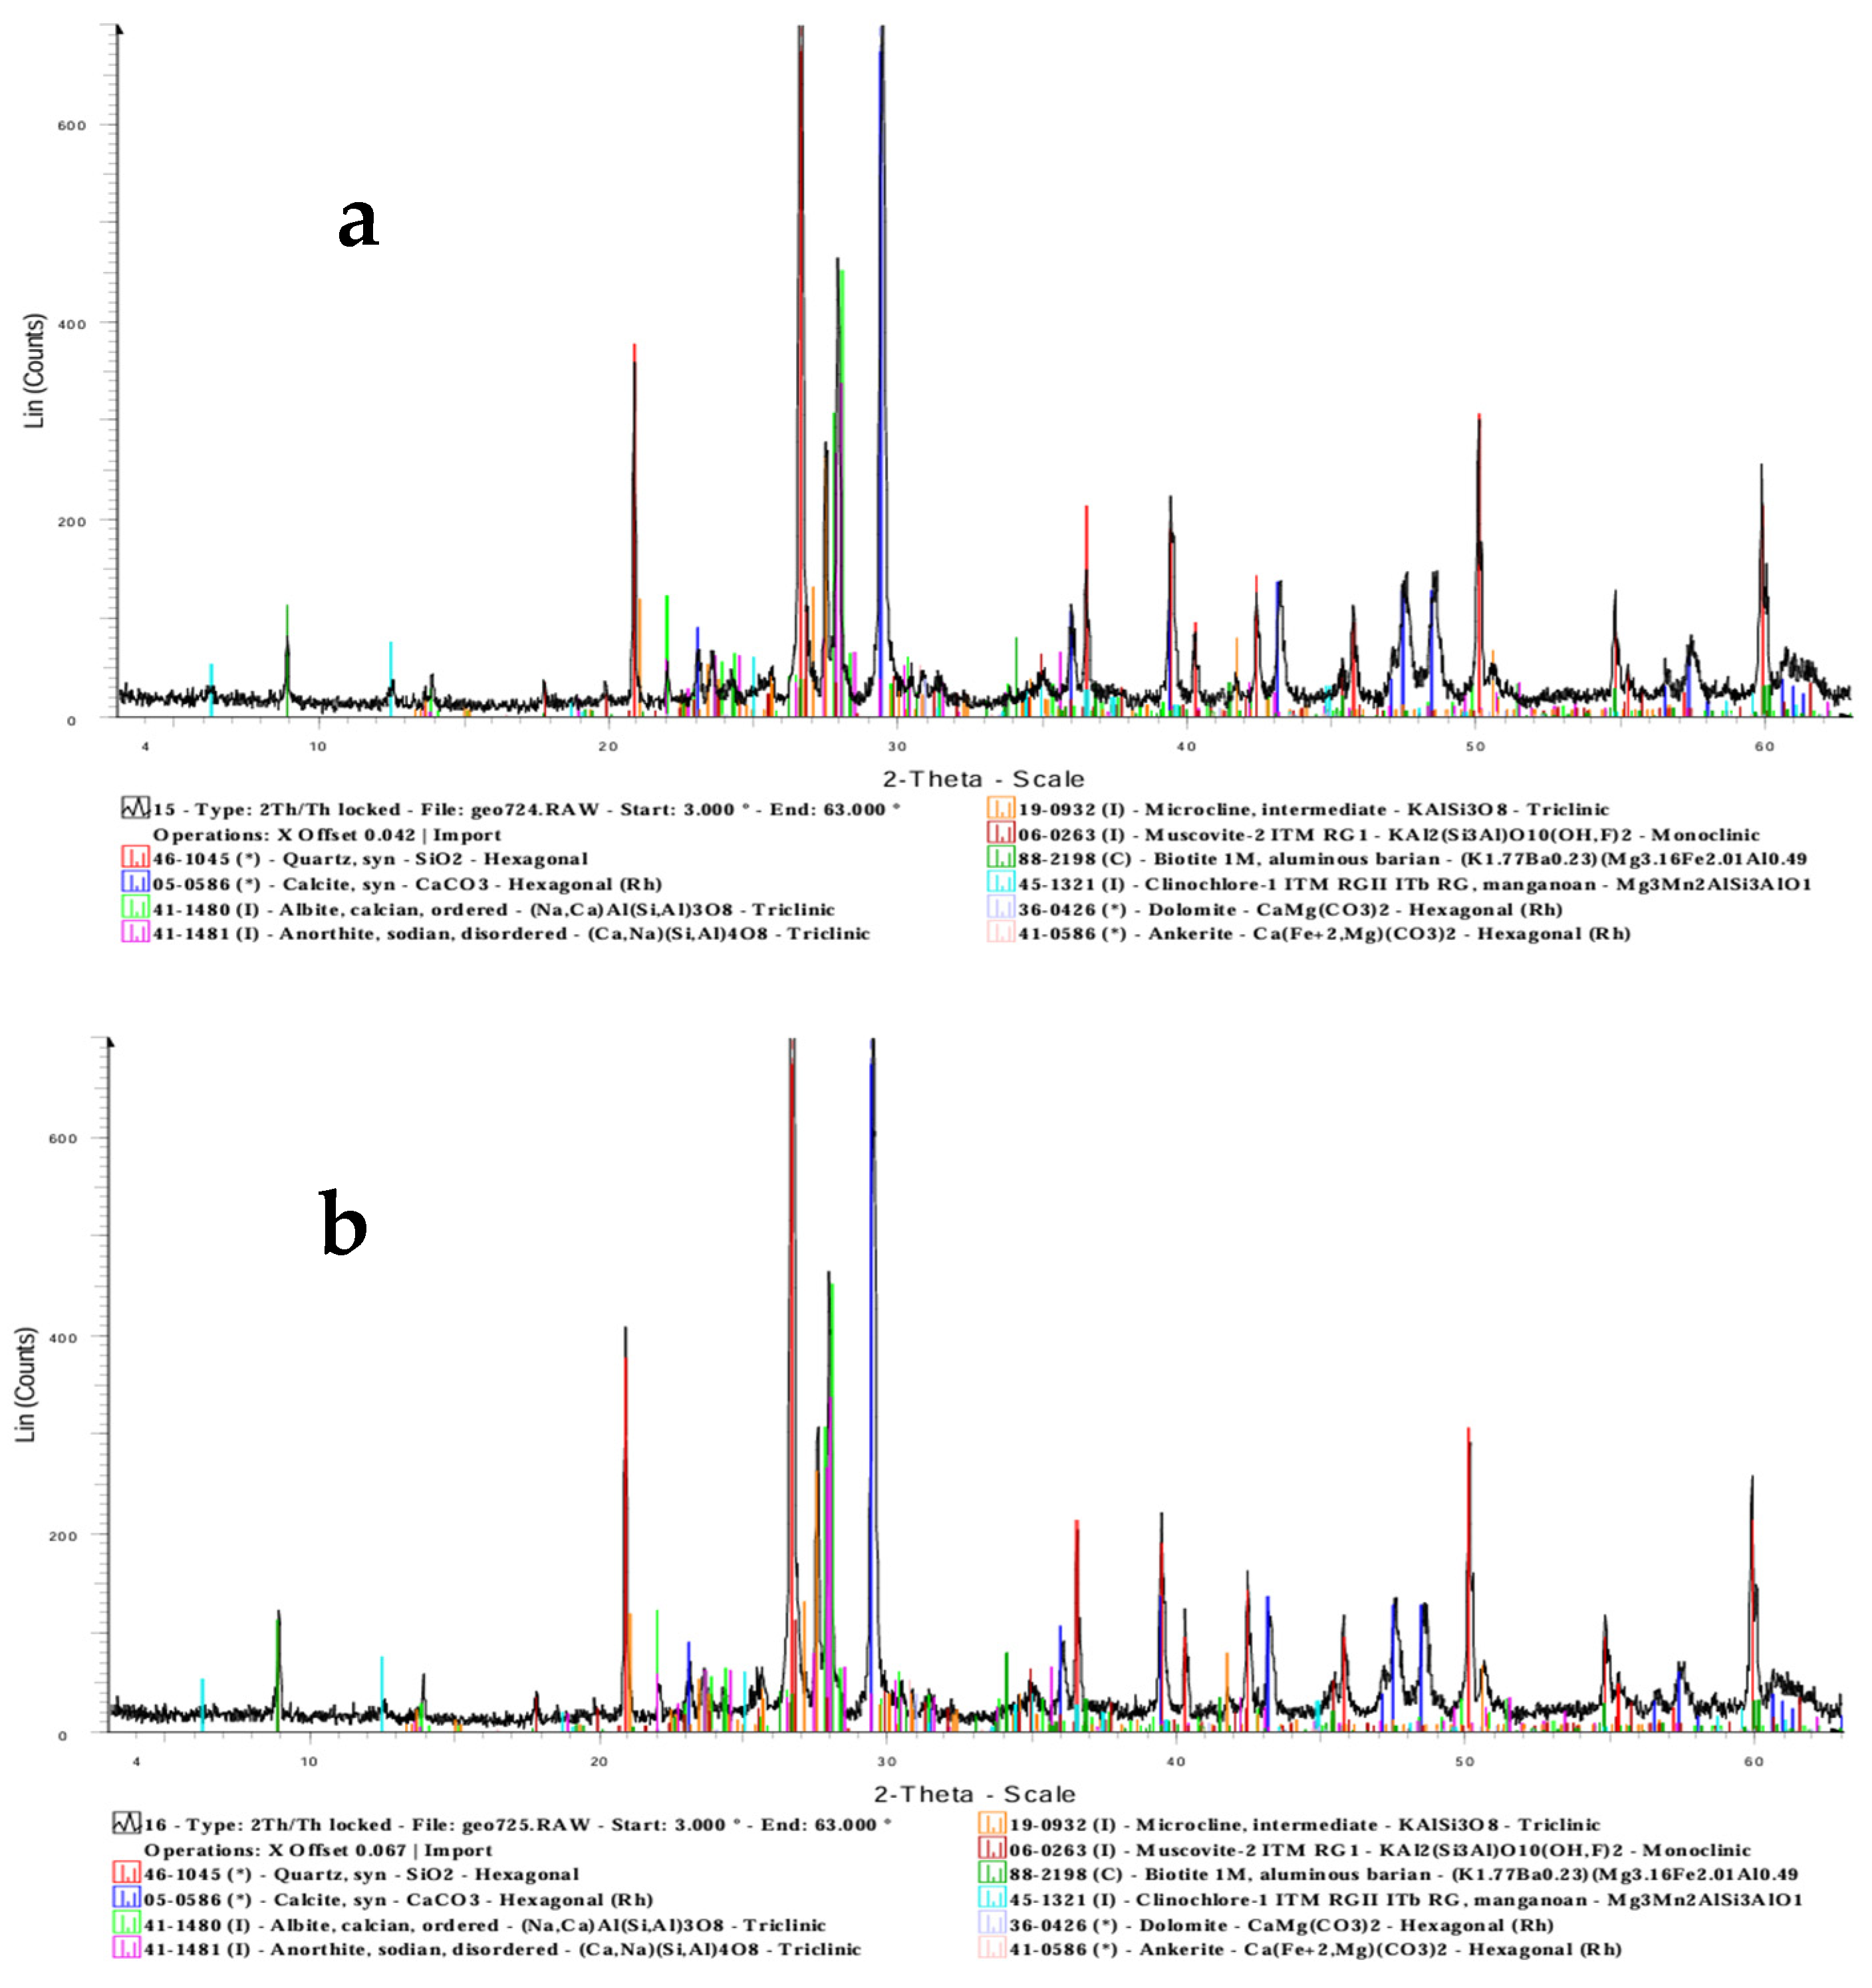
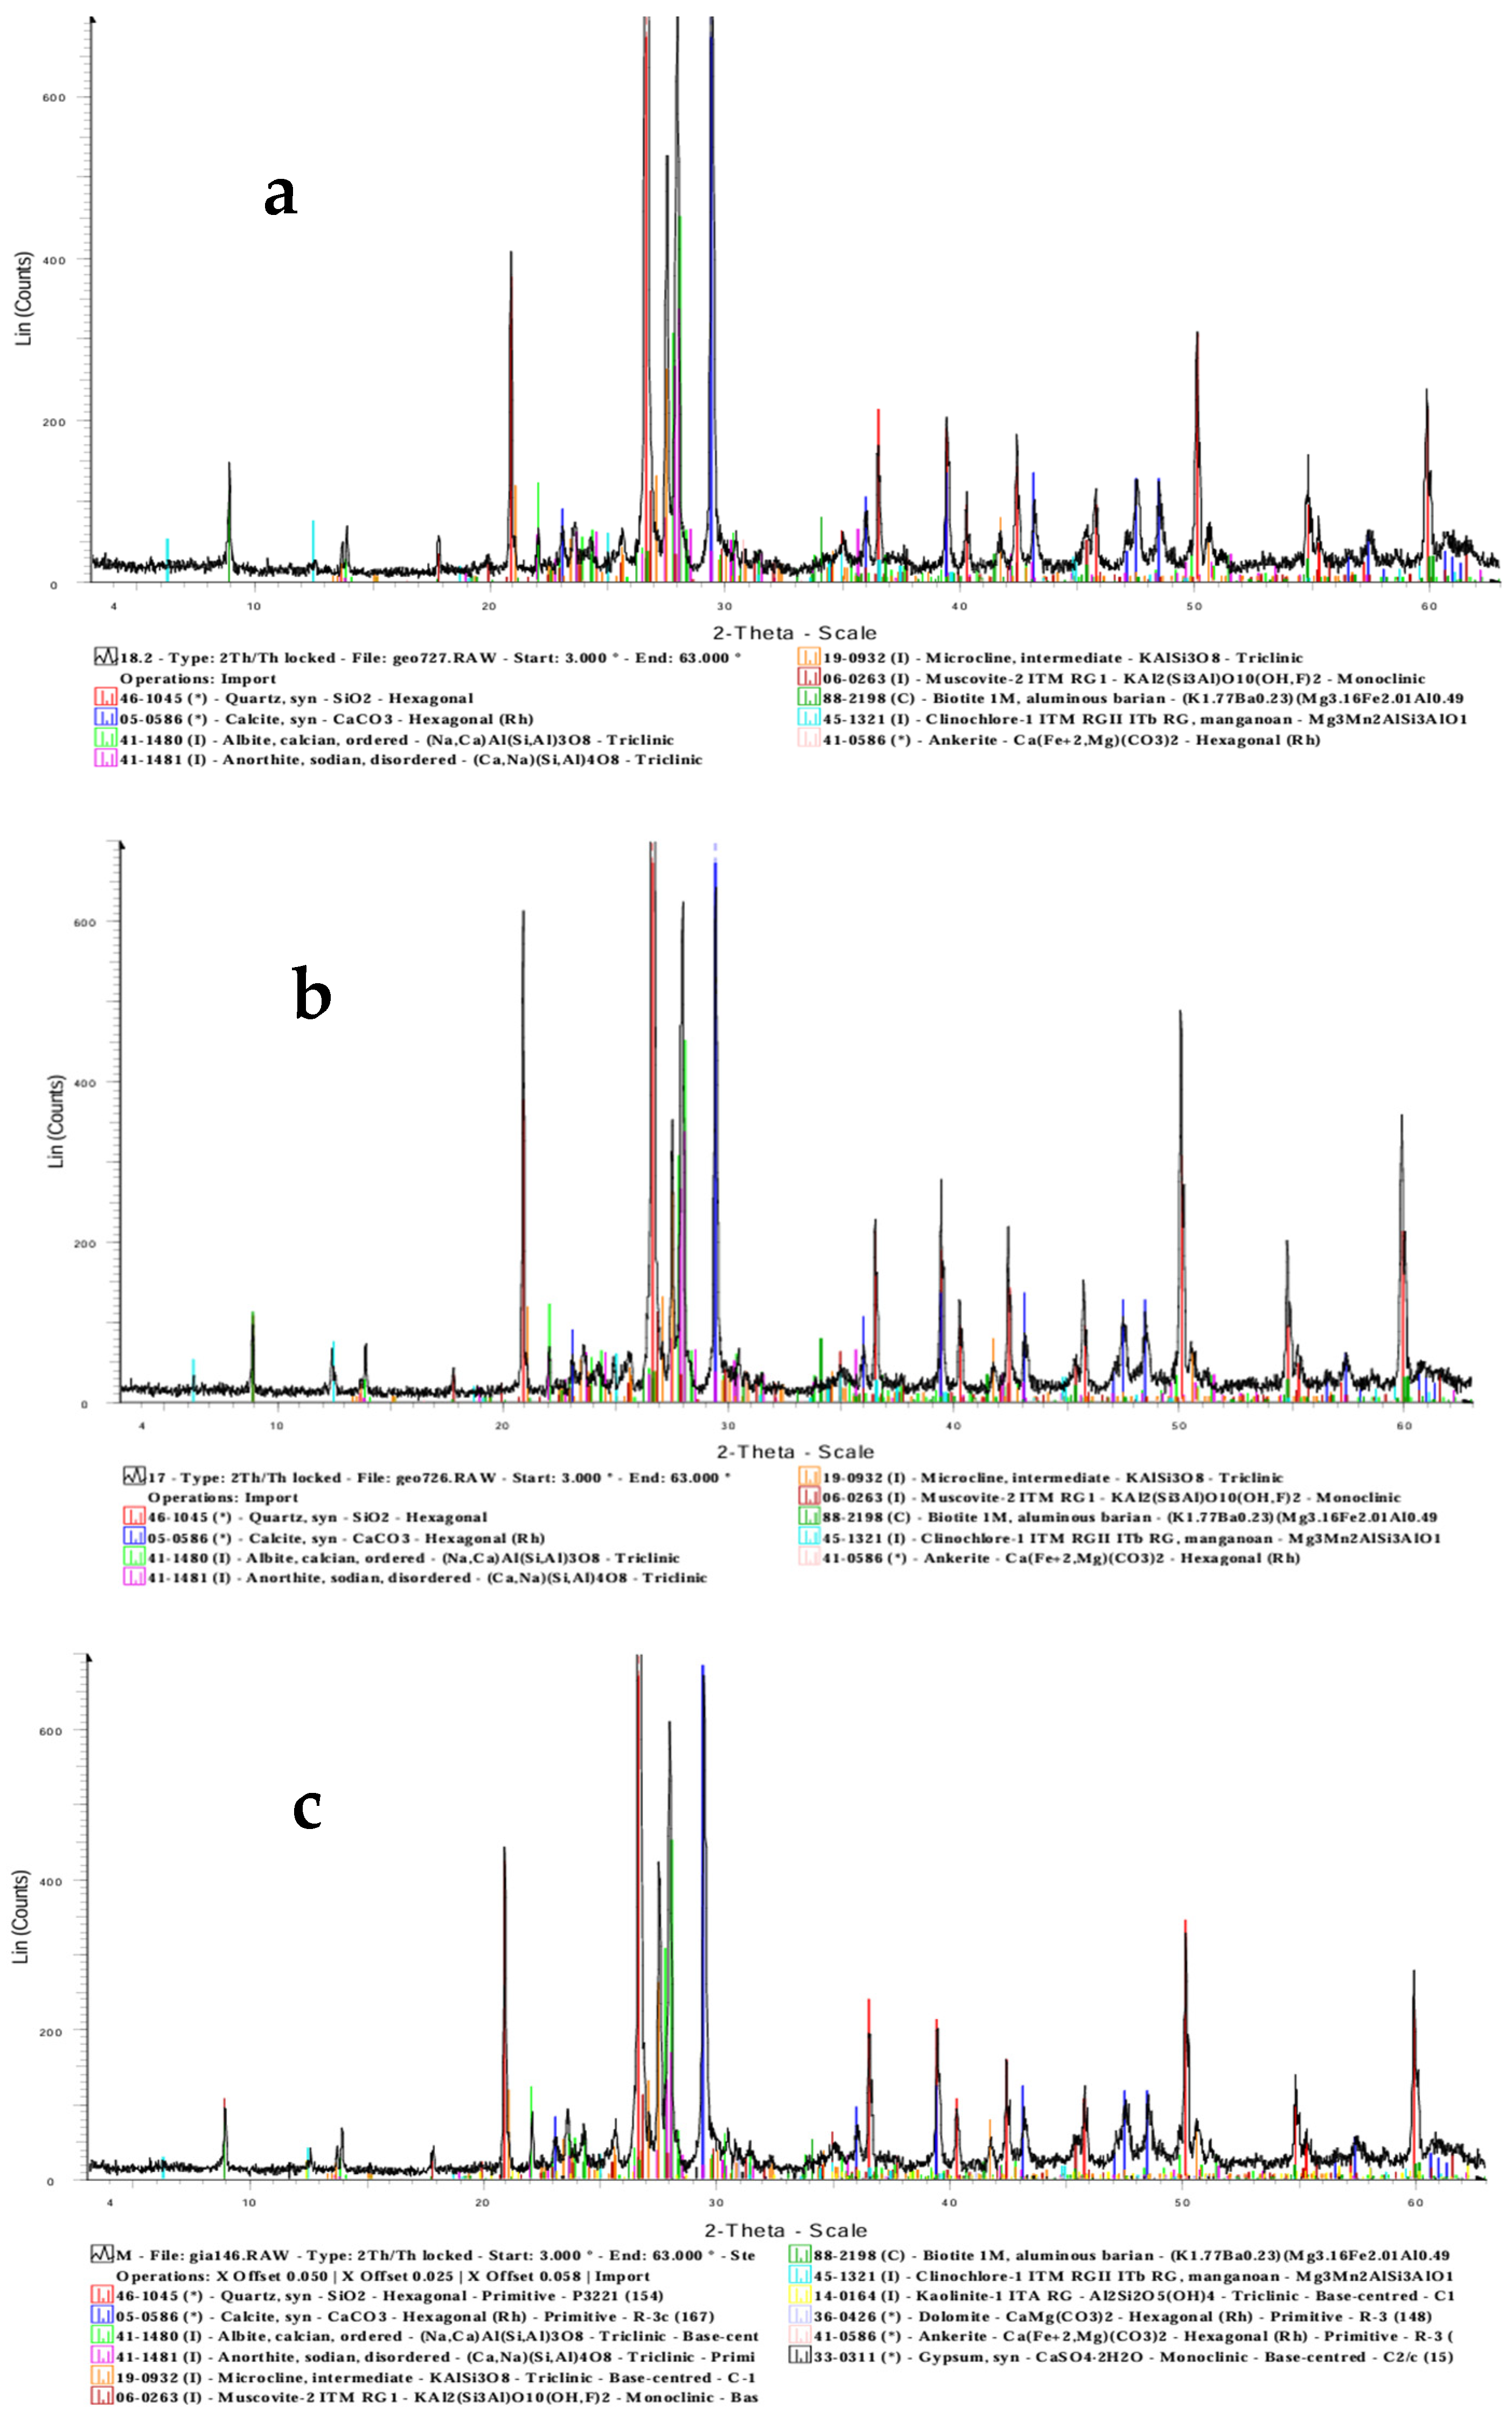
3.1. Petrographic Study
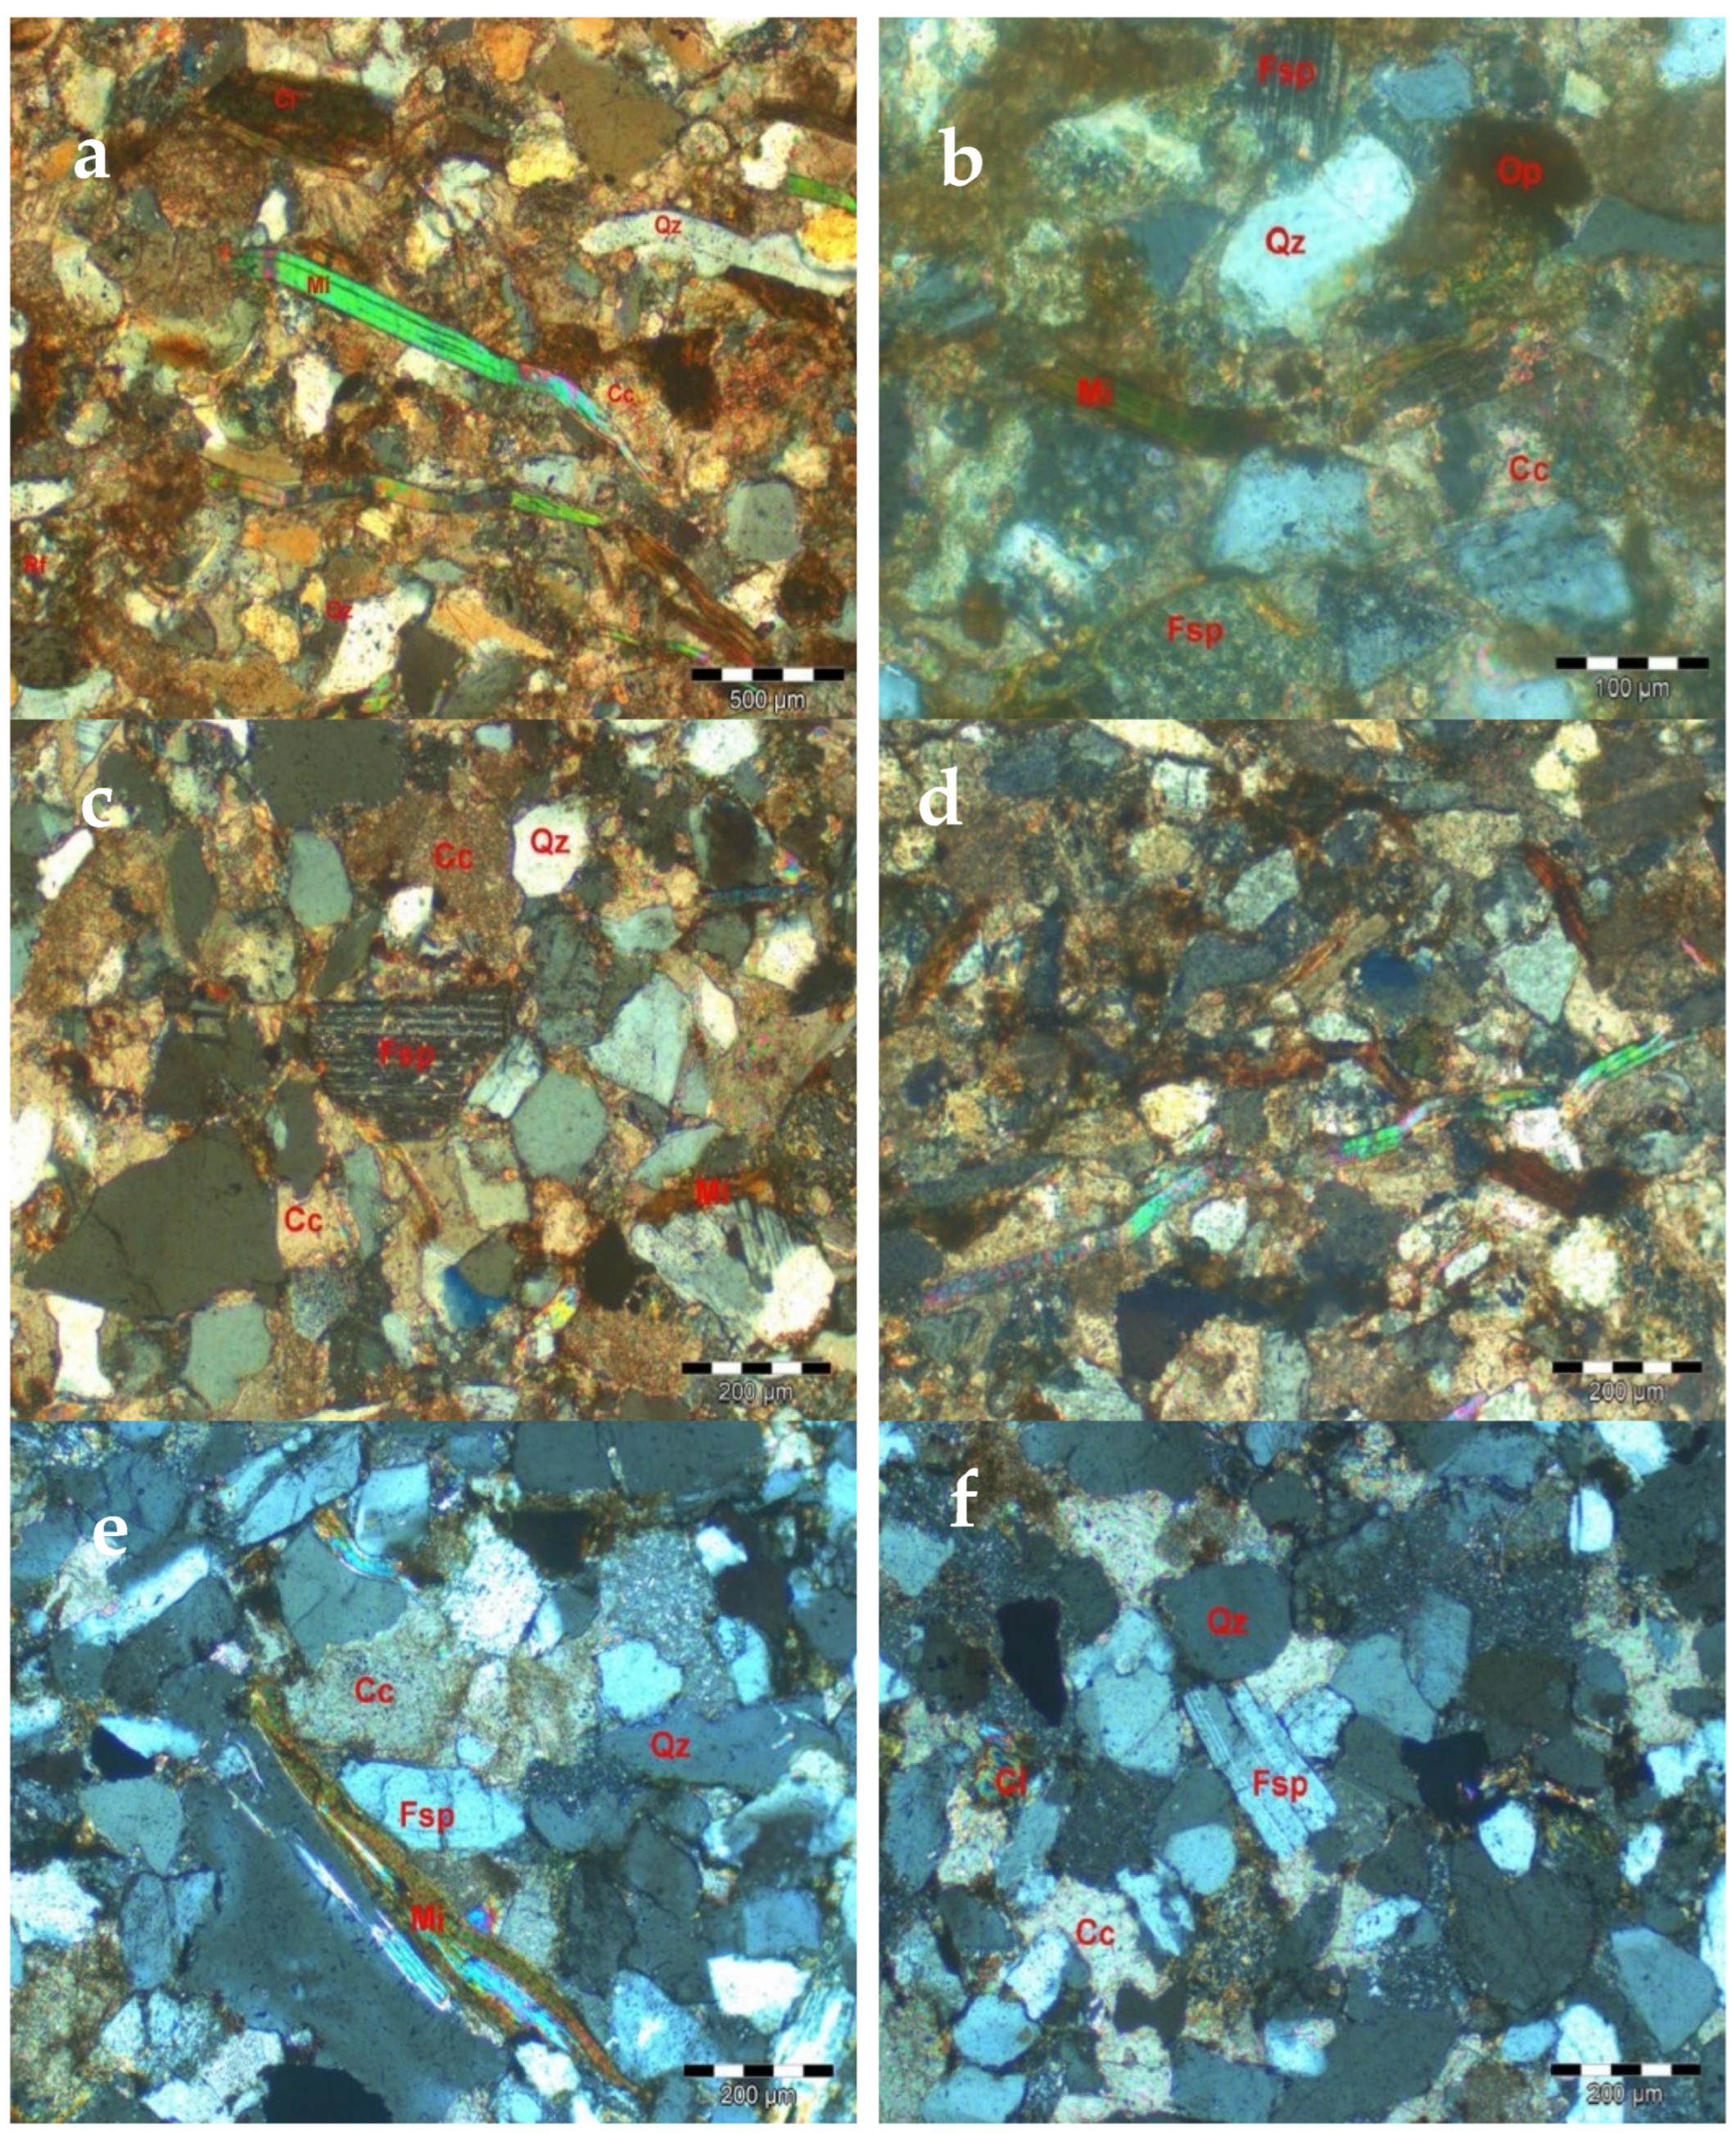
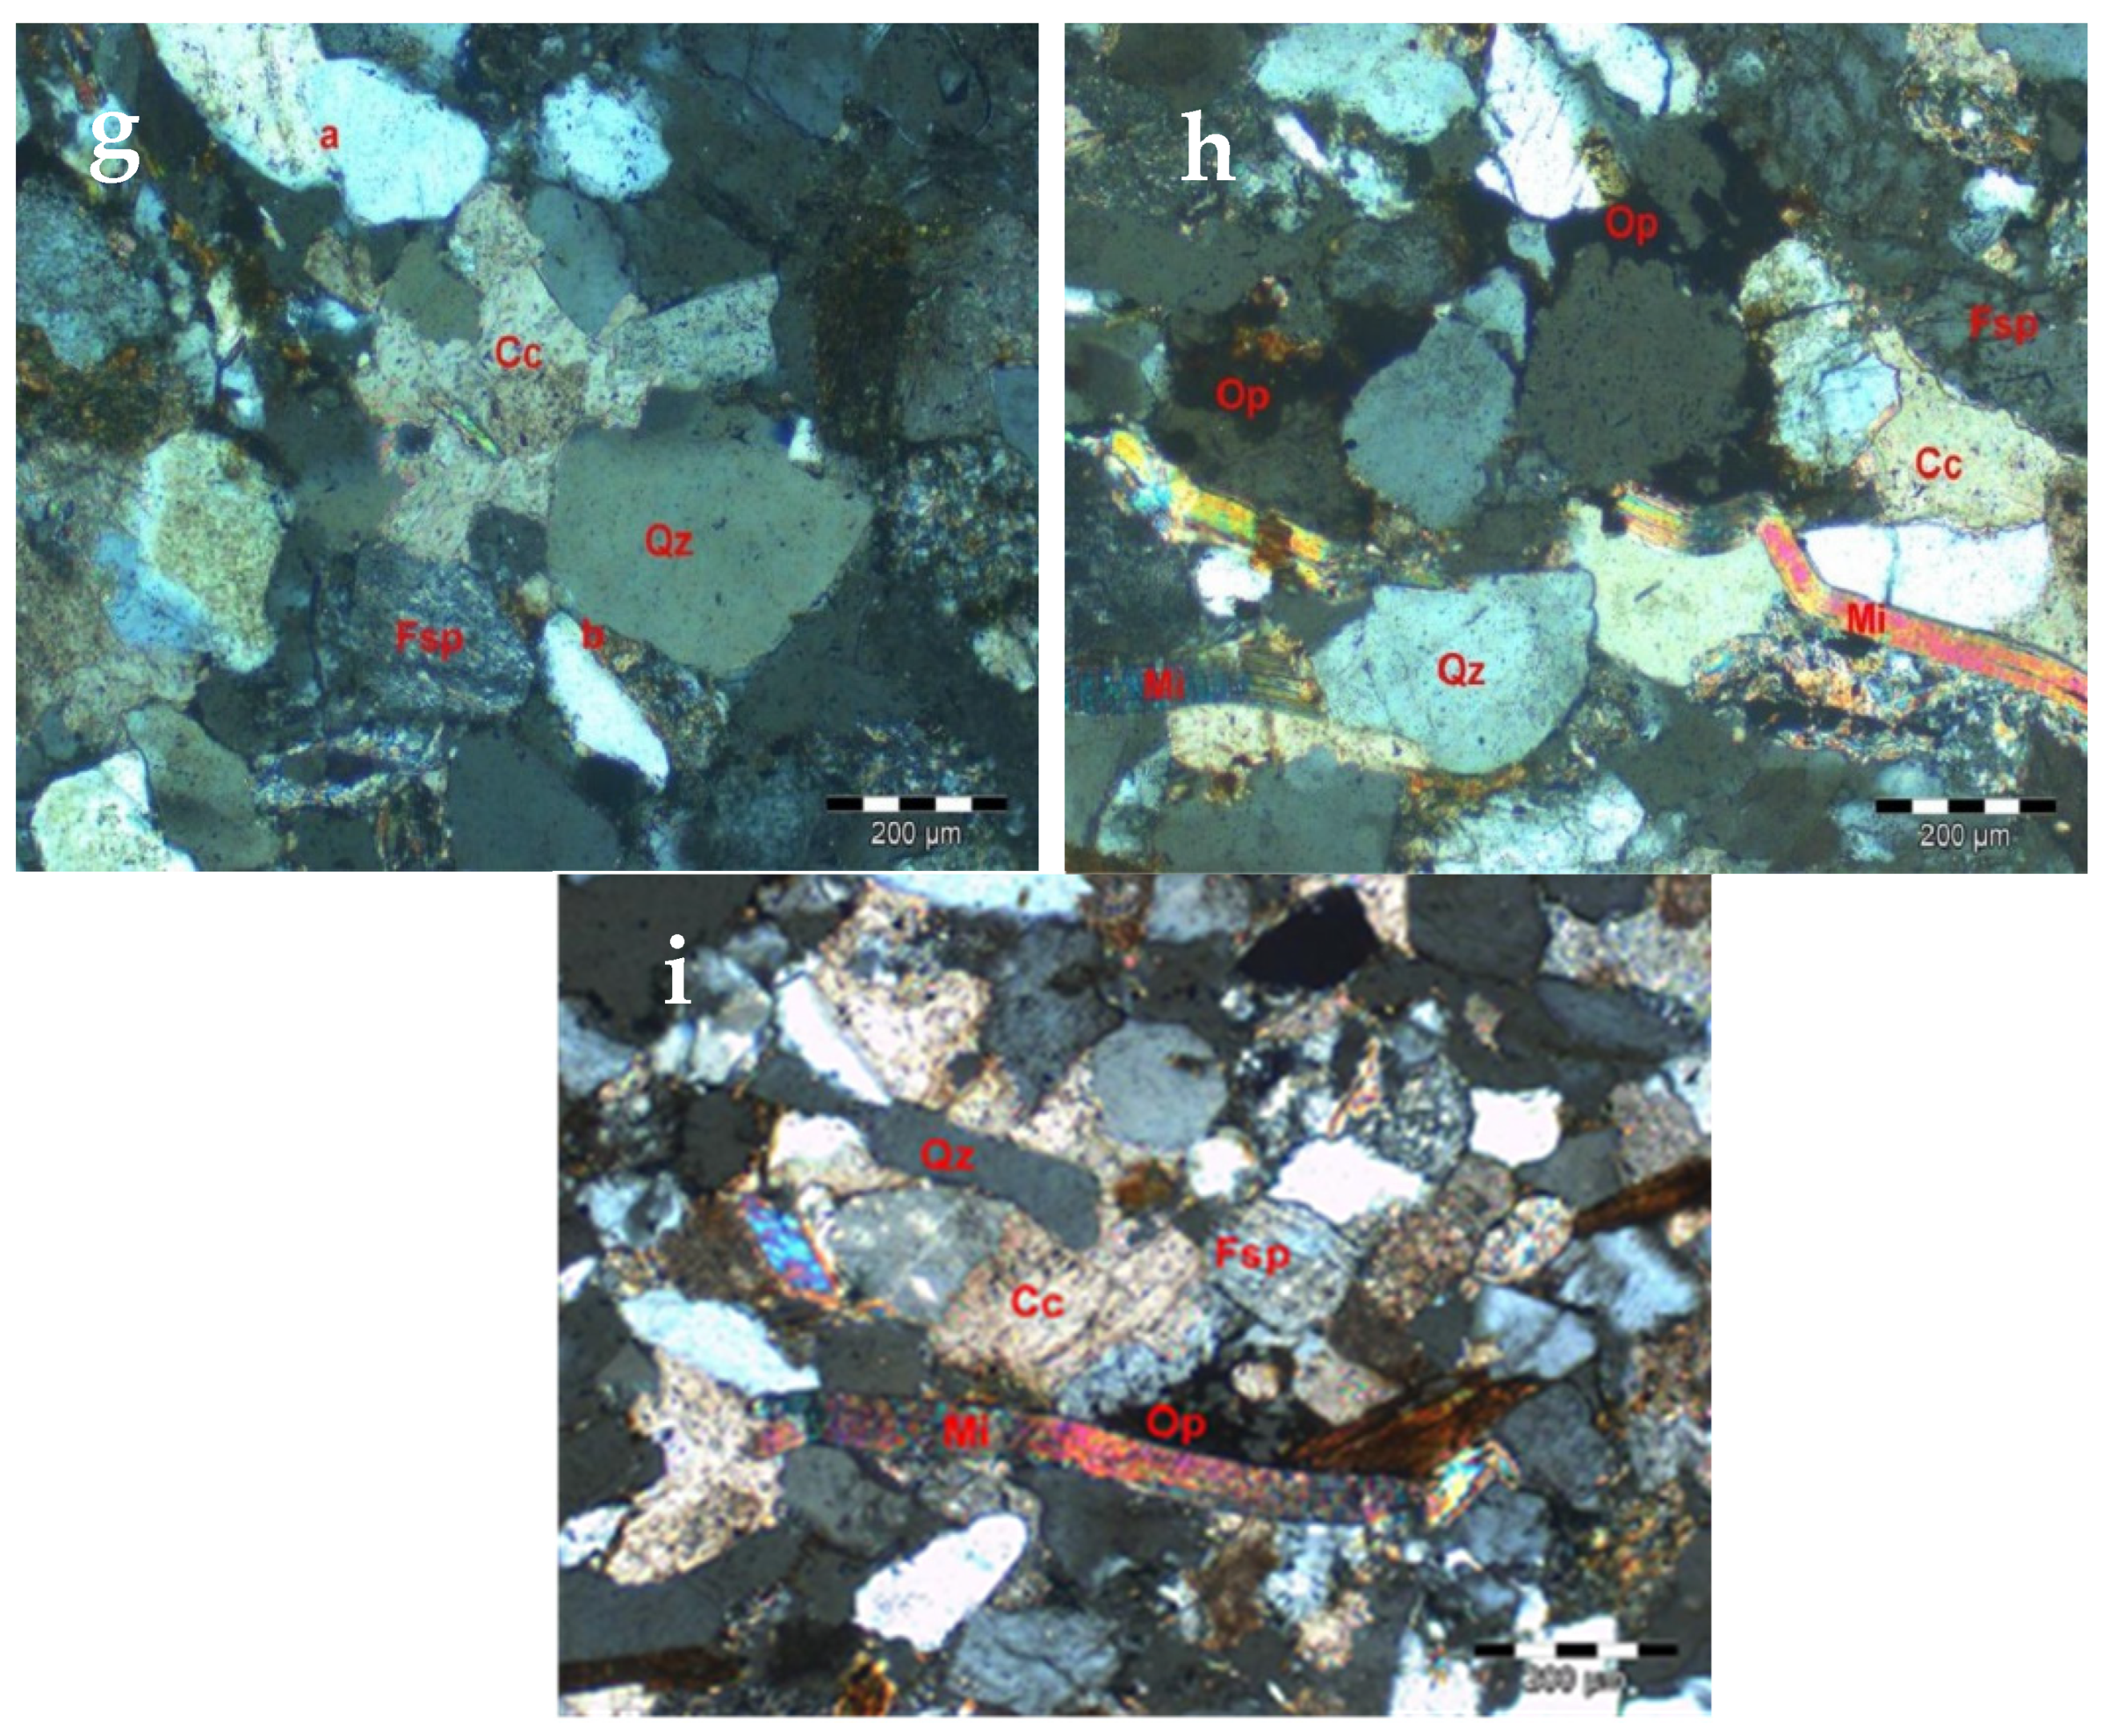
- The constitutive minerals are essentially the same in the grains, matrix and grain-bonding cement, although there are differences in their respective contents, as per the previous reference in Table 1.
- Micas present preferential orientations, except for the B variety, where there is a random distribution, and the M variety, which exhibits orientations in both directions. The macroscopic arrangement of the orientation of lineations in typology B is apparent, as microscopic observation revealed they were randomly distributed. In typology M, bedding was not observed macroscopically due to mica orientations in the two directions, according to microscopic observation.
- The cement of carbonate and silicious materials, which predominate, is of secondary origin.
- The rock fragments have the same origin, i.e., debris due to weathering, carried from Berlengas Islands in this specific subsector of the Lusitanian Basin, close to its western margin.
- Chemical weathering is frequently shown in feldspars, e.g., sericitization and the partial chloritization of biotite, which also occurs in association with iron oxides and hydroxides, with their dissemination in the matrix, and of clinochlore, which constitutes oxidized chlorite.
- Grain size: In the A + B lithotype, the average grain sizes of quartz and feldspars range between 0.1 and 0.13 mm, with maximum values between 0.3 and about 0.5 mm, while in the lithotype C + M, they vary between 0.15 and 0.24 mm, with maximum values between around 0.5 and 0.95 mm. The designation of very fine sands of the classification [38] is not adequate for the C + M lithotype, only fine sands. Variety M has grains with average dimensions slightly larger than those of variety C and maximum dimensions similar to those of coarse sands.
- Bonds and contacts between grains: In both lithotypes, the grains are supported by a predominantly calcite matrix, with direct contacts between them being rare in lithotype A + B, while in the C + M lithotype, there is a higher frequency of contacts.
3.2. The Physical Study of Both Lithotypes of Sandstones of the Lourinhã Formation
3.3. The Mechanical Study of Both Lithotypes of Sandstones of the Lourinhã Formation
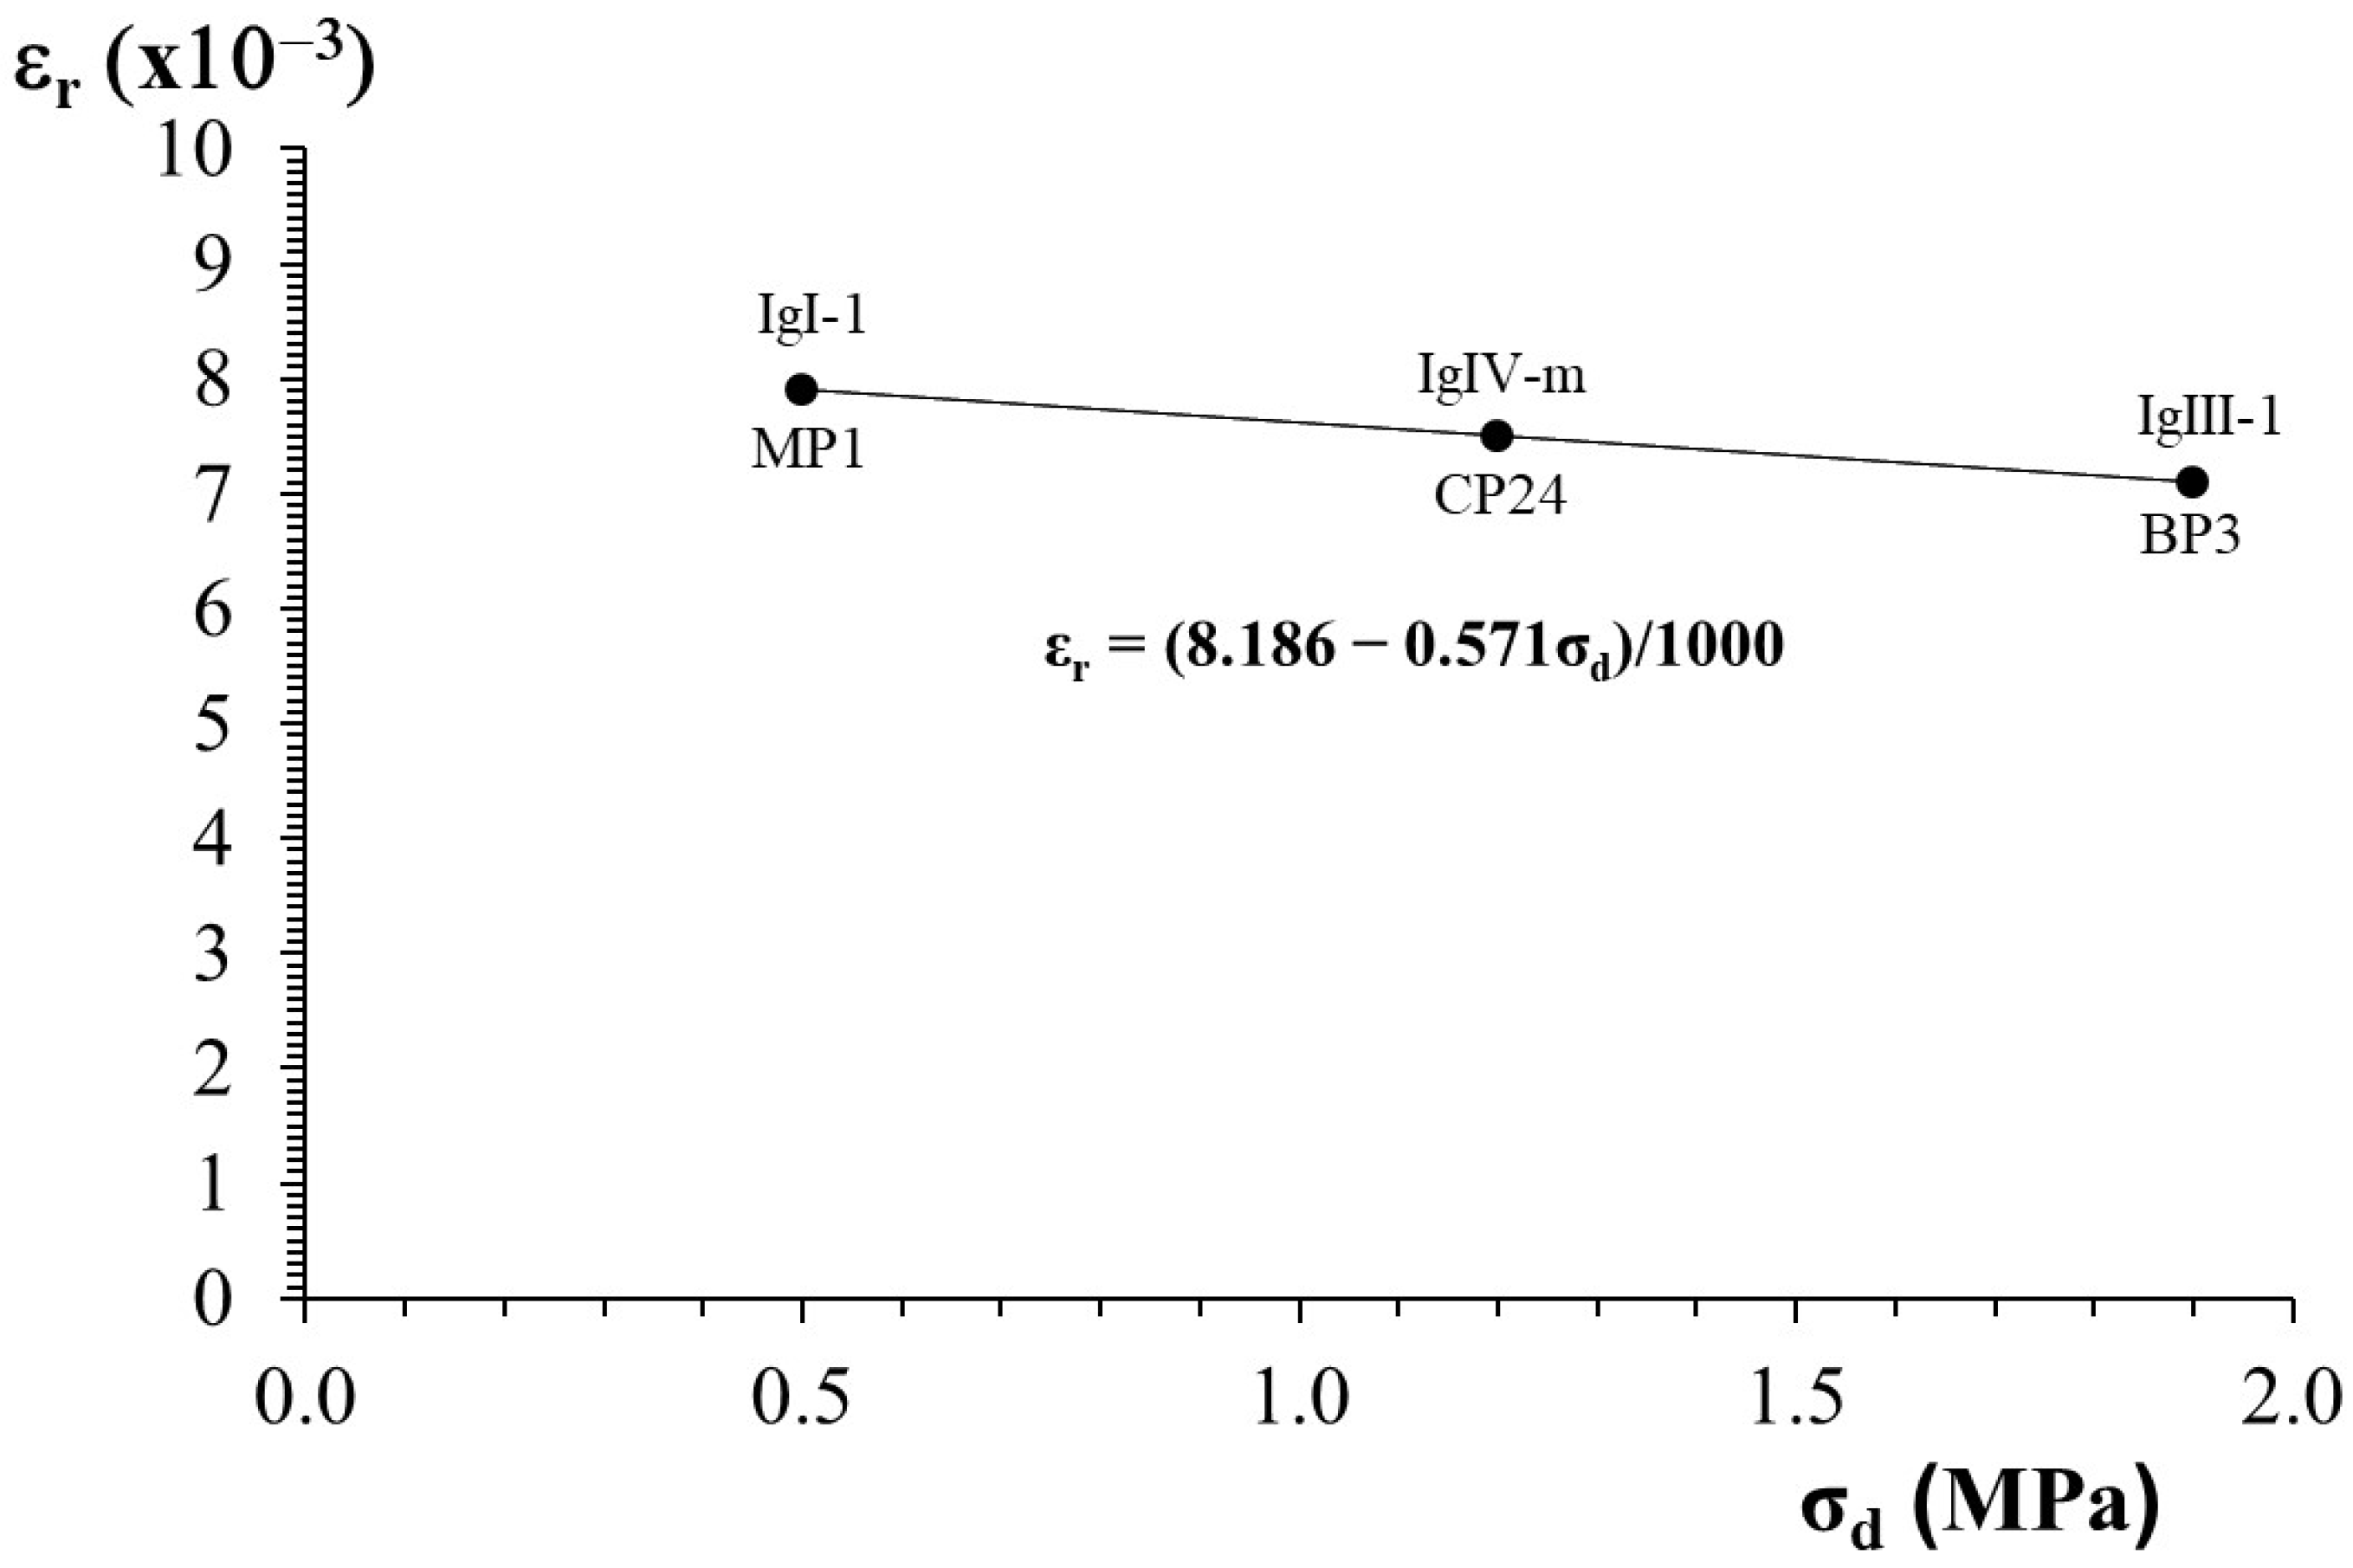
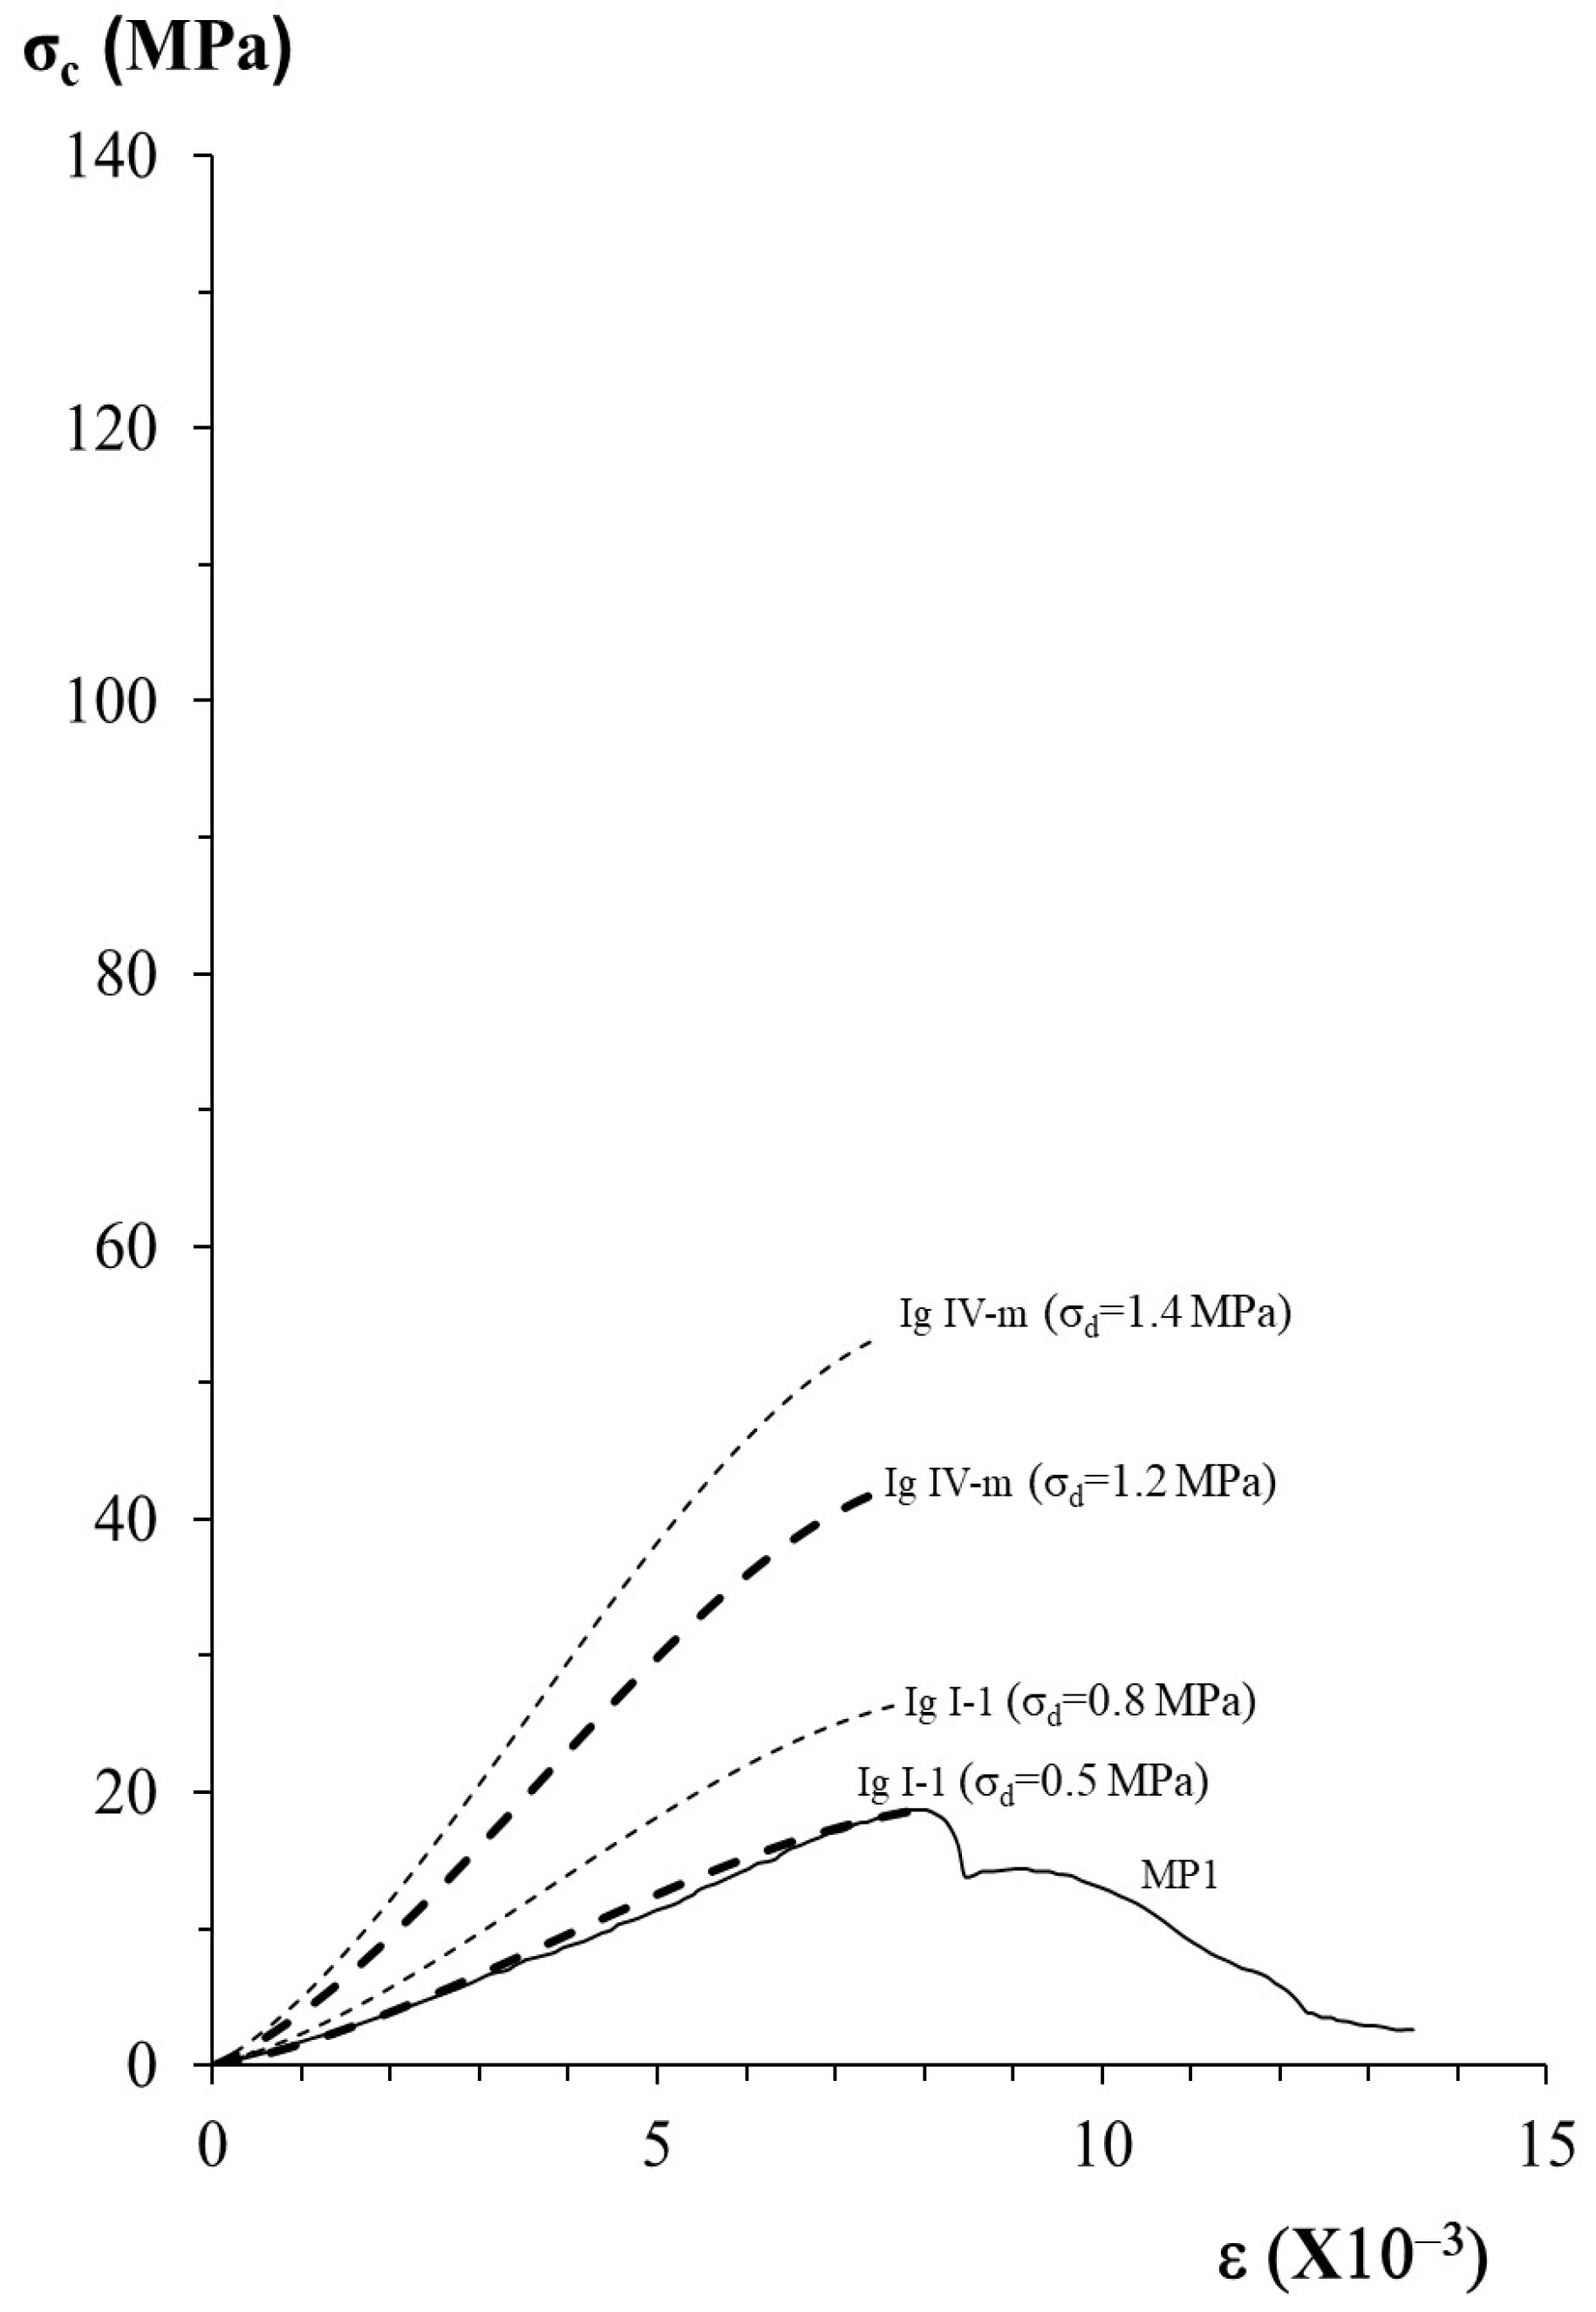
4. Analytical Modelling of Stress–Strain Curves from DRMT Data
5. Conclusions
Author Contributions
Funding
Institutional Review Board Statement
Informed Consent Statement
Data Availability Statement
Conflicts of Interest
References
- UNI 11182; Beni Culturali—Materiali Lapidei Naturali ed Artificiali—Descrizione Della Forma di Alterazione—Termini e Definizioni. UNI: Reggio di Calabria, Italy, 2006.
- Ordaz, J.; Esbert, R. Glosario de términos relacionados con el deterioro de las piedras de construcción. Mater. Constr. 1988, 38, 39–45. [Google Scholar] [CrossRef]
- Fitzner, B.; Heinrichs, K. Photo Atlas of Weathering Forms on Stone Monuments; Geological Institute, RWTH Aachen University—Working Group Natural Stones and Weathering: Aachen, Germany, 2004; 24p. [Google Scholar]
- Vergès-Belmin, V. Illustrated Glossary on Stone Deterioration Patterns. Glossaire Illustré sur les Formes d’altération de la Pierre; ICOMOS: Warsaw, Poland, 2008. [Google Scholar]
- Fitzner, B.; Heinrichs, K.; La Bouchardiere, D. Weathering damage on Pharaonic sandstone monuments in Luxor. Egypt. Build. Environ. 2003, 38, 1089–1103. [Google Scholar] [CrossRef]
- Heinrichs, K. Diagnosis of weathering damage on rock-cut monuments in Petra, Jordan. Environ. Geol. 2008, 56, 643–675. [Google Scholar] [CrossRef]
- Wadeson, L. Nabataean façade tombs: A new chronology. Studies in the History and Archaeology of Jordan. Jordan Press Found. 2013, 11, 507–528. [Google Scholar]
- Heinrichs, K.; Fitzner, B. Stone monuments of the Nemrud Dag sanctuary/Turkey—Petrographical investigation and diagnosis of weathering damage. [Steinmonumente des Nemrud Dag heiligtums/Türkei petrographische untersuchung und diagnose der verwitterungsschäden]. Z. Dtsch. Ges. Geowiss. 2007, 158, 519–548. [Google Scholar]
- Ma, J. Leshan Grand Buddah: Investigations of traditional and alternative materials for repairs. Methods of Evaluating Products for the Conservation of Porous Building Materials in Monuments. In Proceedings of the International Colloquium, ICCROM 1995, Rome, Italy, 19–21 June 1995; pp. 29–39. [Google Scholar]
- Qiao, Z.; Ding, Z.; Wang, J.; Sun, B.; Wang, F.; Xie, Z. Enhanced mechanical properties and environmental erosion resistance with metakaolin in a kind of Chinese traditional Lime-based mortar. Constr. Build. Mater. 2022, 317, 126110. [Google Scholar] [CrossRef]
- Stein, E. Constructing Kanchi: City of Infinite Temples; Amsterdam Univ. Press: Amsterdam, The Netherlands, 2021. [Google Scholar]
- Singh, M. Studies on weathering of Kailasanatha Temple, Kancheepuram. Curr. Sci. Assoc. 1993, 64, 559–565. [Google Scholar]
- Deshpande, S.; Savant, S.; Cardoz, D.; Mehrotra, R.; Piplani, N. Stabilisation & Conservation of Walls, Bastions & Slopes of Jaisalmer Fort; Report Prepared by Bombay Collaborative Urban Design & Conservation Pvt. Ltd. for the Archaeological Survey of India and World Monuments Fund; World Monuments Fund: New York, NY, USA, 2008; 253p. [Google Scholar]
- Uchida, E.; Ogawa, Y.; Maeda, N.; Nakagawa, T. Deterioration of stone materials in the Angkor monuments. Cambodia Eng. Geol. 1999, 55, 101–112. [Google Scholar] [CrossRef]
- Hosono, T.; Uchida, E.; Suda, C.; Ueno, A.; Nakagawa, T. Salt weathering of sandstone at the Angkor monuments, Cambodia: Identification of the origins of salts using sulfur and strontium isotopes. J. Arch. Sci. 2006, 33, 1541–1551. [Google Scholar] [CrossRef]
- Siedel, H.; Pfefferkorn, S.; Plehwe-Leisen, E.; Leisen, H. Sandstone weathering in tropical climate: Results of low-destructive investigations at the temple of Angkor Wat, Cambodia. Eng. Geol. 2010, 115, 182–192. [Google Scholar] [CrossRef]
- Ashmore, W. Quiriguá Reports, Settlement Archaeology at Quiriguá, Guatemala; Univ. Pennsylvania Press: Philadelphia, PA, USA, 2007; Volume IV, 362p. [Google Scholar]
- Migoń, P. Sandstone geomorphology—Recent advances. Geomorph 2021, 373, 107484. [Google Scholar] [CrossRef]
- Graham, J. Rainbow Bridge National Monument Geologic Resources Inventory Report; Natural resource report NPS/NRPC/GRD/NRR—2009/131; National Park Service: Denver, CO, USA, 2009.
- Ostanin, I.; Safonov, A.; Oseledets, I. Natural erosion of sandstone as shape optimization. Sci. Rep. 2017, 7, 17301. [Google Scholar] [CrossRef] [PubMed]
- Bruthans, J.; Soukup, J.; Vaculikova, J.; Filippi, M.; Schweigstillova, J.; Mayo, A.; Masin, D.; Kletetschka, G.; Rihosek, J. Sandstone landforms shaped by negative feedback between stress and erosion. Nat. Geosci. 2014, 7, 597–601. [Google Scholar] [CrossRef]
- Queensland’s Sandstone Wilderness Parks; State of Queensland, Queensland Parks and Wildlife Service, Department of Environment and Science: Brisbane, Australia, 2022; 28p.
- Soleilhavoup, F. Sahara. Visions d’un Explorateur de la Mémoire Rupestre; Transboréal: Paris, France, 1999; 128p, ISBN 2-913955-04-5. [Google Scholar]
- Tiano, P.; Rodrigues, J.D.; De Witte, E.; Vergès-Belmin, V.; Massey, S.; Snethlage, R.; Costa, D.; Cadot-Leroux, L.; Garrod, E.; Singer, B. The conservation of monuments: A new method to evaluate consolidating treatments. Int. J. Restor. Build. Monum. 2000, 6, 133–150. [Google Scholar]
- Ludovico-Marques, M.; Delgado-Rodrigues, J. Consolidation of volcanic tuffs. Some physical and mechanical properties. In Proceedings of the EUROCK 2002, International Workshop on Volcanic Rocks, Funchal, Portugal, 25–28 November 2002; pp. 37–44. [Google Scholar]
- Dassow, J.; Lia, X.; Leea, M.; Youngb, M.; Harkness, P. Ultrasonic drilling for the characterisation of building stones and salt induced decay. Ultrasonics 2020, 101, 106018. [Google Scholar] [CrossRef] [PubMed]
- Ludovico-Marques, M. Contribution to the Knowledge of the Effect of Crystallization of Salts in the Weathering of Sandstones. Application to the Built Heritage of Atouguia da Baleia. Ph.D. Thesis, Universidade Nova de Lisboa, Lisbon, Portugal, 2008; p. 314. (In Portuguese). [Google Scholar]
- Ludovico-Marques, M.; Chastre, C. Effect of salt crystallization ageing on the compressive behavior of sandstone blocks in historical buildings. Eng. Fail. Anal. 2012, 26, 247–257. [Google Scholar] [CrossRef]
- Chastre, C.; Ludovico-Marques, M. Nondestructive testing methodology to assess the conservation of historic stone buildings and monuments. In Handbook of Materials Failure Analysis with Case Studies from the Construction Industries; Makhlouf, H., Aliofkhazraei, M., Eds.; Butterworth Heinemann (Elsevier): Oxford, UK, 2018; pp. 255–294. [Google Scholar]
- RILEM. Recommended tests to measure the deterioration of stone and to assess the effectiveness of treatment methods. Mater. Const. Bourdais-Dunoud 1980, 13, 175–253. [Google Scholar]
- EN1936; Natural Stone Test Method-Determination of Real Density and Apparent Density, and of Total and Open Porosity. European Committee for Standardization: Brussels, Belgium, 1999.
- Katz, A.; Thompson, A. Quantitative prediction of permeability in porous rock. Phys. Rev. Online Arch. B 1986, 34, 8179–8181. [Google Scholar] [CrossRef] [PubMed]
- NORMAL–29/88; Misuradell’Indice di Asciugamento (Drying Index). Alterazioni dei Material Lapidei e Trattamenti Conservativi Proposte per L’unificazione dei Metodi Sperimentali di Studio e di Controllo. CNR–ICR: Rome, Italy, 1991.
- Ludovico-Marques, M.; Chastre, C. Prediction of stress–strain curves based on hydric non-destructive tests on sandstones. Materials 2019, 12, 3366. [Google Scholar] [CrossRef] [PubMed]
- Singer, B.; Hornschild, J.; Snethlage, R. Strength profiles and correction functions for abrasive stones. In Proceedings of the Workshop DRILLMORE—Drilling Methodologies for Monuments Restoration, Munich, Firenze, 16–17 March 2000. [Google Scholar]
- Taylor, A.; Gowland, S.; Leary, S.; Keogh, K.; Martinius, A. Stratigraphical correlation of the Late Jurassic Lourinhã Formation in the Consolação Sub-basin (Lusitanian Basin), Portugal. Geol. J. 2013, 49, 143–162. [Google Scholar] [CrossRef]
- Folk, R. Petrology of Sedimentary Rocks; Hemphill Publishing: Austin, TX, USA, 1974; 184p. [Google Scholar]
- Folk, R. Petrology of Sedimentary Rocks; Hemphill Publishing: Austin, TX, USA, 1968; 170p. [Google Scholar]
- Powers, M.A. New roundness scale for sedimentary particles. J. Sediment. Res. 1953, 23, 117–119. [Google Scholar] [CrossRef]
- Pellerin, F. La porosimetrie au mercure apliquee a l’ estude geotechnique des sols et des roches. Bull Liaison Lab Ponts Chauss 1980, 106, 105–116. [Google Scholar]
- Lee, J.; Derome, D.; Carmeliet, J. Drop impact on natural porous stones. J. Colloid Interface Sci. 2016, 469, 147–156. [Google Scholar] [CrossRef] [PubMed]


| Minerals (%) | A | A ┴ | B | B ┴ | C | C ┴ | M | M ┴ | Ig1 # |
|---|---|---|---|---|---|---|---|---|---|
| Quartz | 29.6 | 30.2 | 30.8 | 31.6 | 37.8 | 38.6 | 51.4 | 44.8 | 41.3 |
| Feldspars * | 14.6 | 13.2 | 15.6 | 15.1 | 17.9 | 17.0 | 15.2 | 17.0 | 18.0 |
| Carbonates ** | 37.4 | 39.6 | 33.6 | 34.8 | 24.6 | 26.8 | 20.2 | 21.4 | 18.3 |
| Micas/clinochlore *** | 4.9 | 3.8 | 5.8 | 4.6 | 4.4 | 3.8 | 3.6 | 3.6 | 5.4 |
| Matrix **** | 6.7 | 6.8 | 7.8 | 7.5 | 7.3 | 5.8 | 3.2 | 4.8 | 8.8 |
| Rock fragments ***** | 5.8 | 5.4 | 5.4 | 5.2 | 7.0 | 7.2 | 5.2 | 6.6 | 7.2 |
| Opaque minerals | 1.0 | 1.0 | 1.0 | 1.2 | 1.0 | 0.8 | 1.2 | 1.8 | 1.0 |
| Total | 100 | 100 | 100 | 100 | 100 | 100 | 100 | 100 | 100 |
| Sandstones Variety | A | B | C | M | C + M (Monument) | |
|---|---|---|---|---|---|---|
| Classification | Lithic arkose with carbonate cement (after [37]). | |||||
| Major minerals | Quartz, calcite, feldspars, rock fragments. | |||||
| Minor minerals | Micas, clinochlore, clays, opaque minerals, hematite, goethite, heavy minerals. | |||||
| Fabric | Grain size (quartz and feldspars) | 0.1 mm (average) 0.4 mm (maximum) | 0.12 mm (average) 0.51 mm (maximum) | 0.15 mm (average) 0.50 mm (maximum) | 0.22 mm (average) 0.95 mm (maximum) | 0.16 mm (average) 0.43 mm (maximum) |
| Very fine sand (according to [38]) | Very fine sand (according to [38]) | Fine sand (according to [38]) | Fine sand (according to [38]) | Fine sand (according to [38]) | ||
| Grains with several sizes | ||||||
| Sorting | Moderate. | |||||
| Roundness (quartz and feldspars) | Sub-angular to sub-rounded (after [39]). | |||||
| Grain contacts (quartz and feldspars) | Matrix-supported grains and rare direct grain contacts. | Matrix-supported grains and direct grain contacts (point contacts and waved sutures). | ||||
| Orientation | Micas and clinochlore present a dominant orientation | Not identified. | Micas and clinochlore present a dominant orientation | Micas and clinochlore present a dominant orientation | Micas and clinochlore present a dominant orientation | |
| Grain bonding | Matrix-supported fabric (carbonate as matrix mineral is predominant). | Matrix-supported fabric (carbonate as matrix mineral is predominant) and direct grain contacts (point contacts and waved sutures). | ||||
| Mineral components | Quartz | Sometimes with overgrowths and inclusions. | ||||
| Carbonates | Carbonate, mainly calcite; ankerite is rare. | |||||
| Feldspars | Albite, anorthite, microcline; often weathered and sericitized or looking similar to quartz. | |||||
| Rock fragments | Sedimentary rock fragments, chert, carbonate rock fragments, metamorphic rock fragments, polycrystalline quartz. | |||||
| Mineral components | Micas/ Clinochlore | Partly in large flakes; micas are biotite and muscovite; biotite is partly chloritized or occurs in combination with Fe-oxide (hematite); clinochlore occurs as single mineral or as fine-grained matrix mineral. | ||||
| Clay minerals | Kaolinite, sericite; partly in combination with Fe-oxide (hematite) and Fe-hydroxide (goethite). | |||||
| Opaque min. | Mainly ferrous. | |||||
| Oxides and hydrox of iron | Mainly hematite and goethite as opaque minerals and fine-grained as matrix minerals. | |||||
| Heavy minerals | Rare; mainly tourmaline, zircon, rutile; as single grains or inclusions. | |||||
| Cement | Carbonates as cementing material, secondarily generated. Siliceous cementing material as contact cement. Secondarily generated and often mixed with fine-grained calcite are clay minerals, fine-grained clinochlore or hematite as contact cement on fine borders or as pore-filling materials. | |||||
| Samples | Number of Samples | Porosity n (%) (Average ± SD (CV %)) | Bulk Density (kg/m3) (Average ± SD (CV %)) | Real Density (kg/m3) (Average ± SD (CV %)) |
|---|---|---|---|---|
| A variety | 34 | 4.1 ± 0.4 (9.8%) | 2594 ± 13 (0.5%) | 2705 ± 6 (0.3%) |
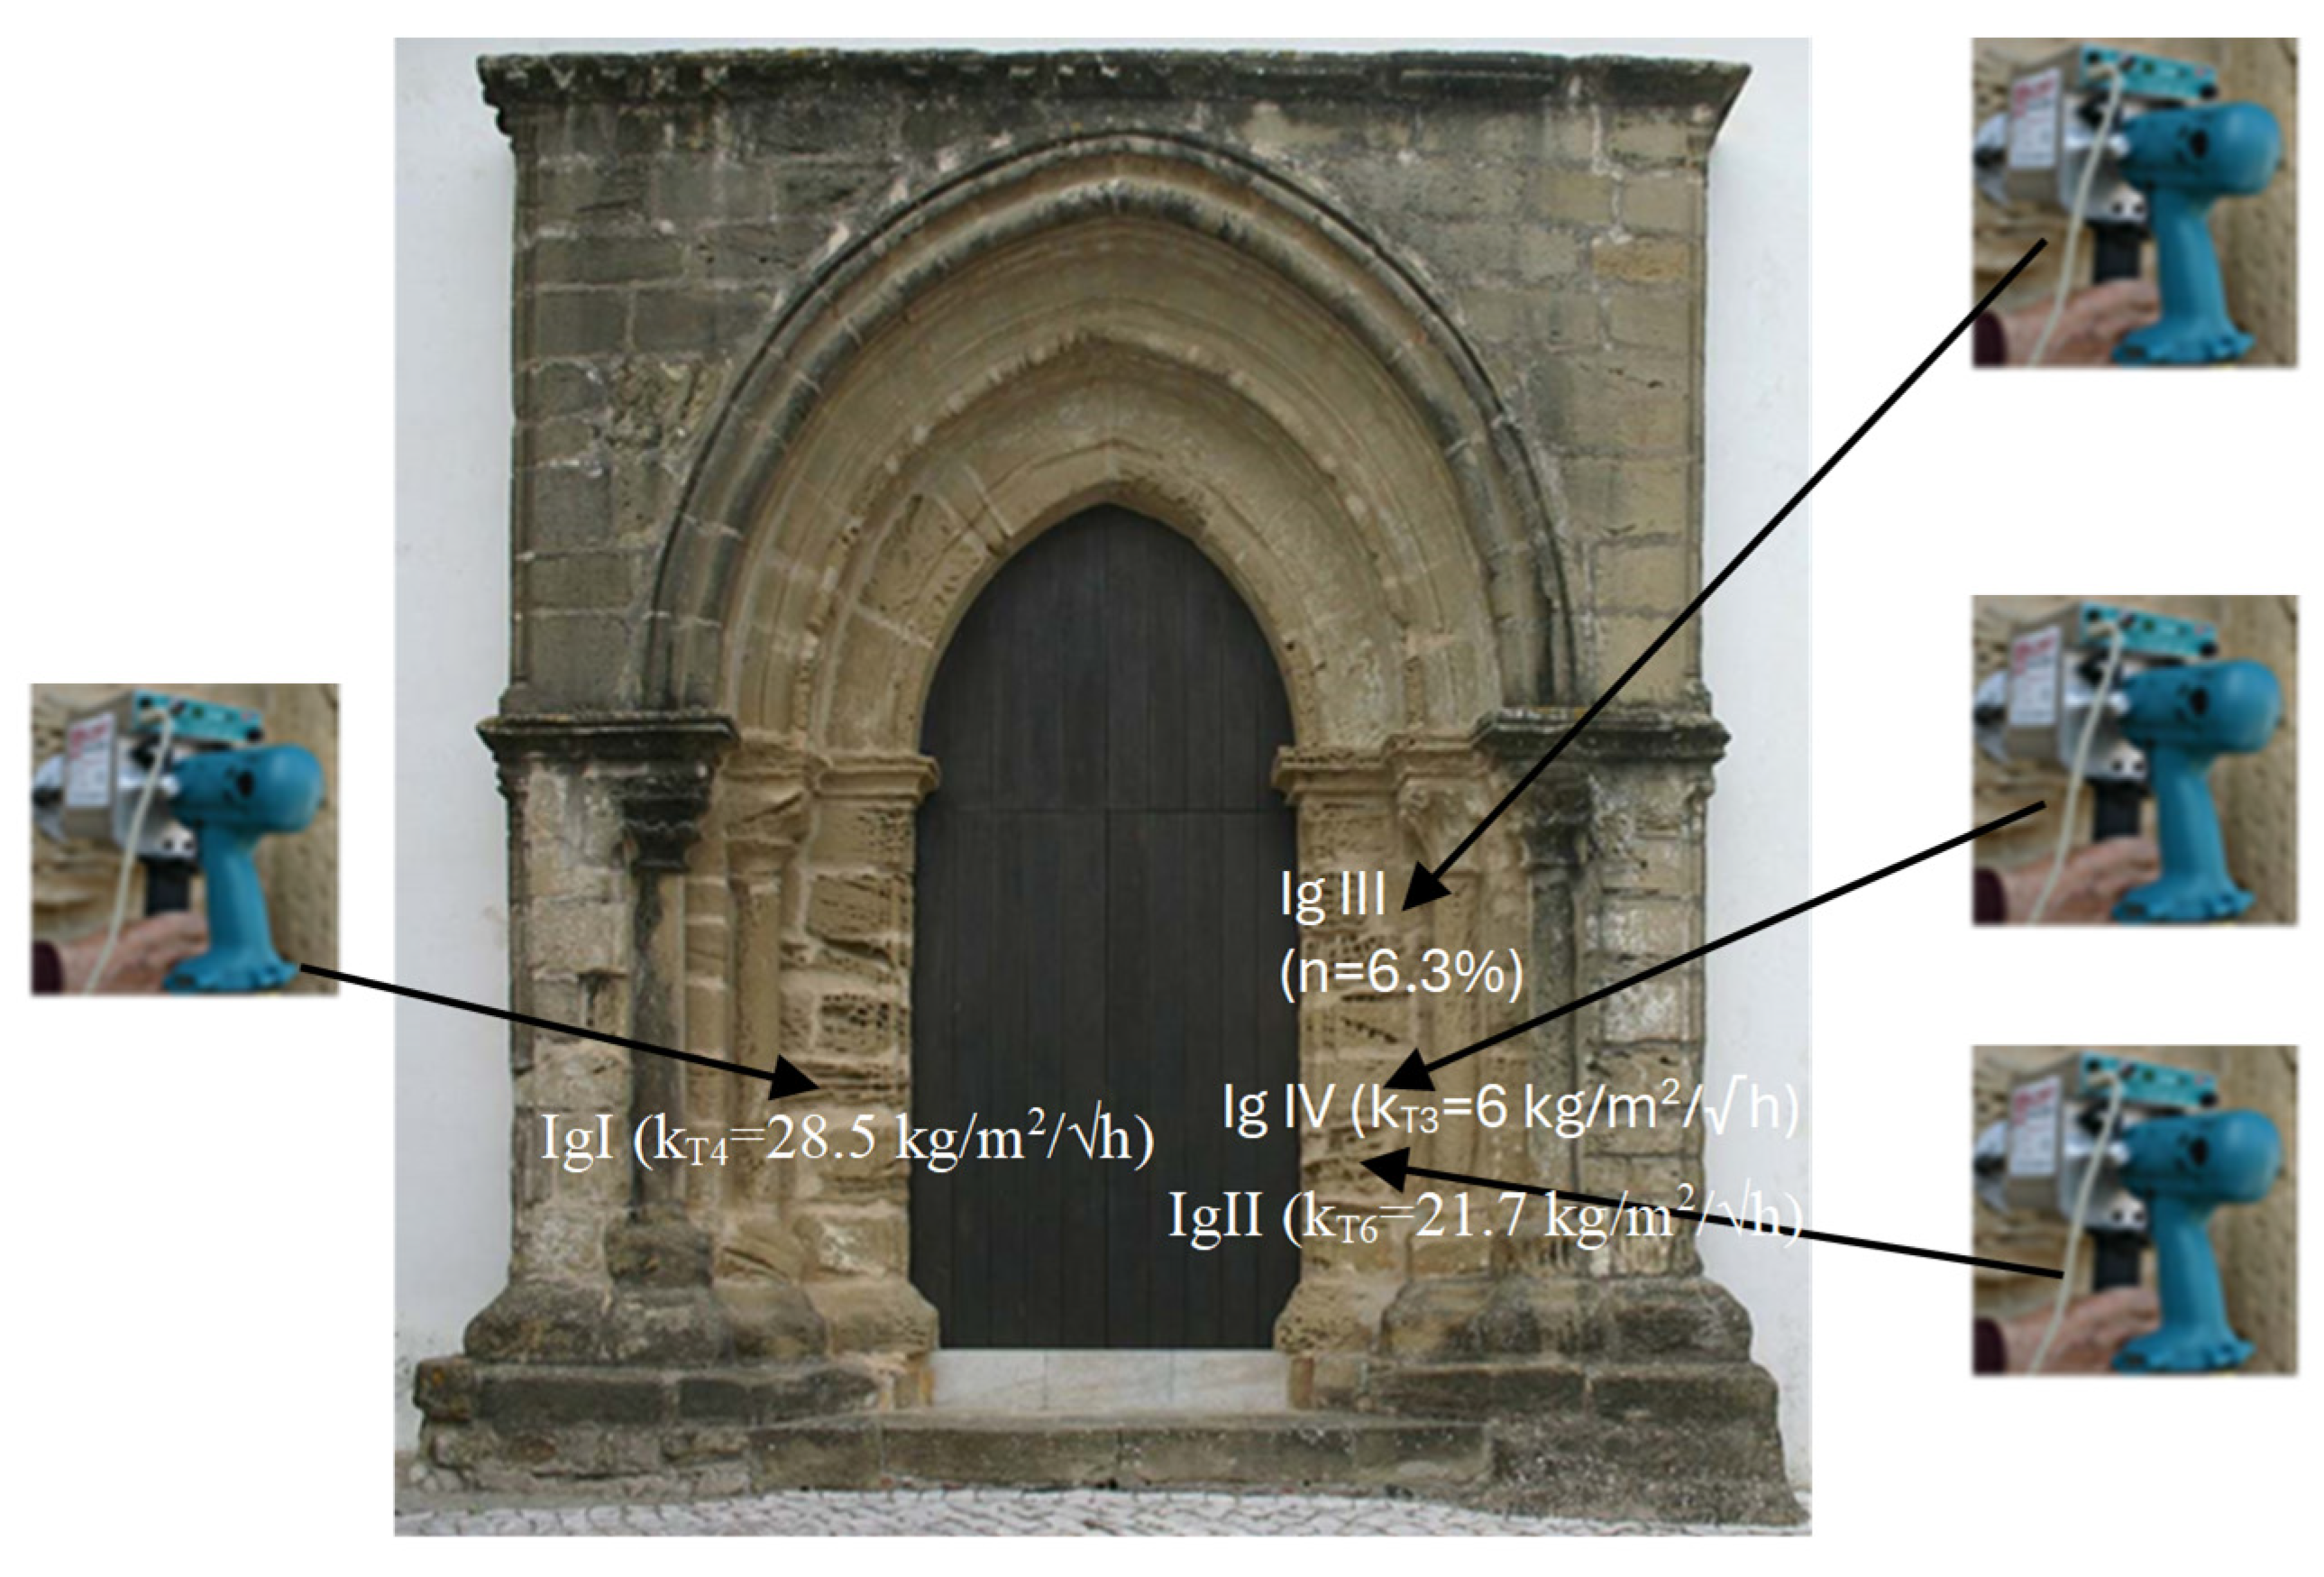
| B variety | 35 | 6.9 ± 0.5 (7.2%) 6.3 (monument) | 2510 ± 19 (0.8%) 2375 (monument) | 2697 ± 8 (0.3%) 2533 (monument) |
| C variety | 34 | 12.7 ± 0.4 (3.1%) 11.5 * (12.5 and 10.5) | 2343 ± 25 (1.1%) 2350 * (2375 and 2324) | 2684 ± 10 (0.4%) 2655 * (2714 and 2596) |
| M variety | 140 | 18.5 ± 0.4 (2.2%) 17.1 * (18.3 and 15.9) | 2179 ± 13 (0.6%) 2222 * (2202 and 2241) | 2671 ± 6 (0.2%) 2682 * (2697 and 2666) |
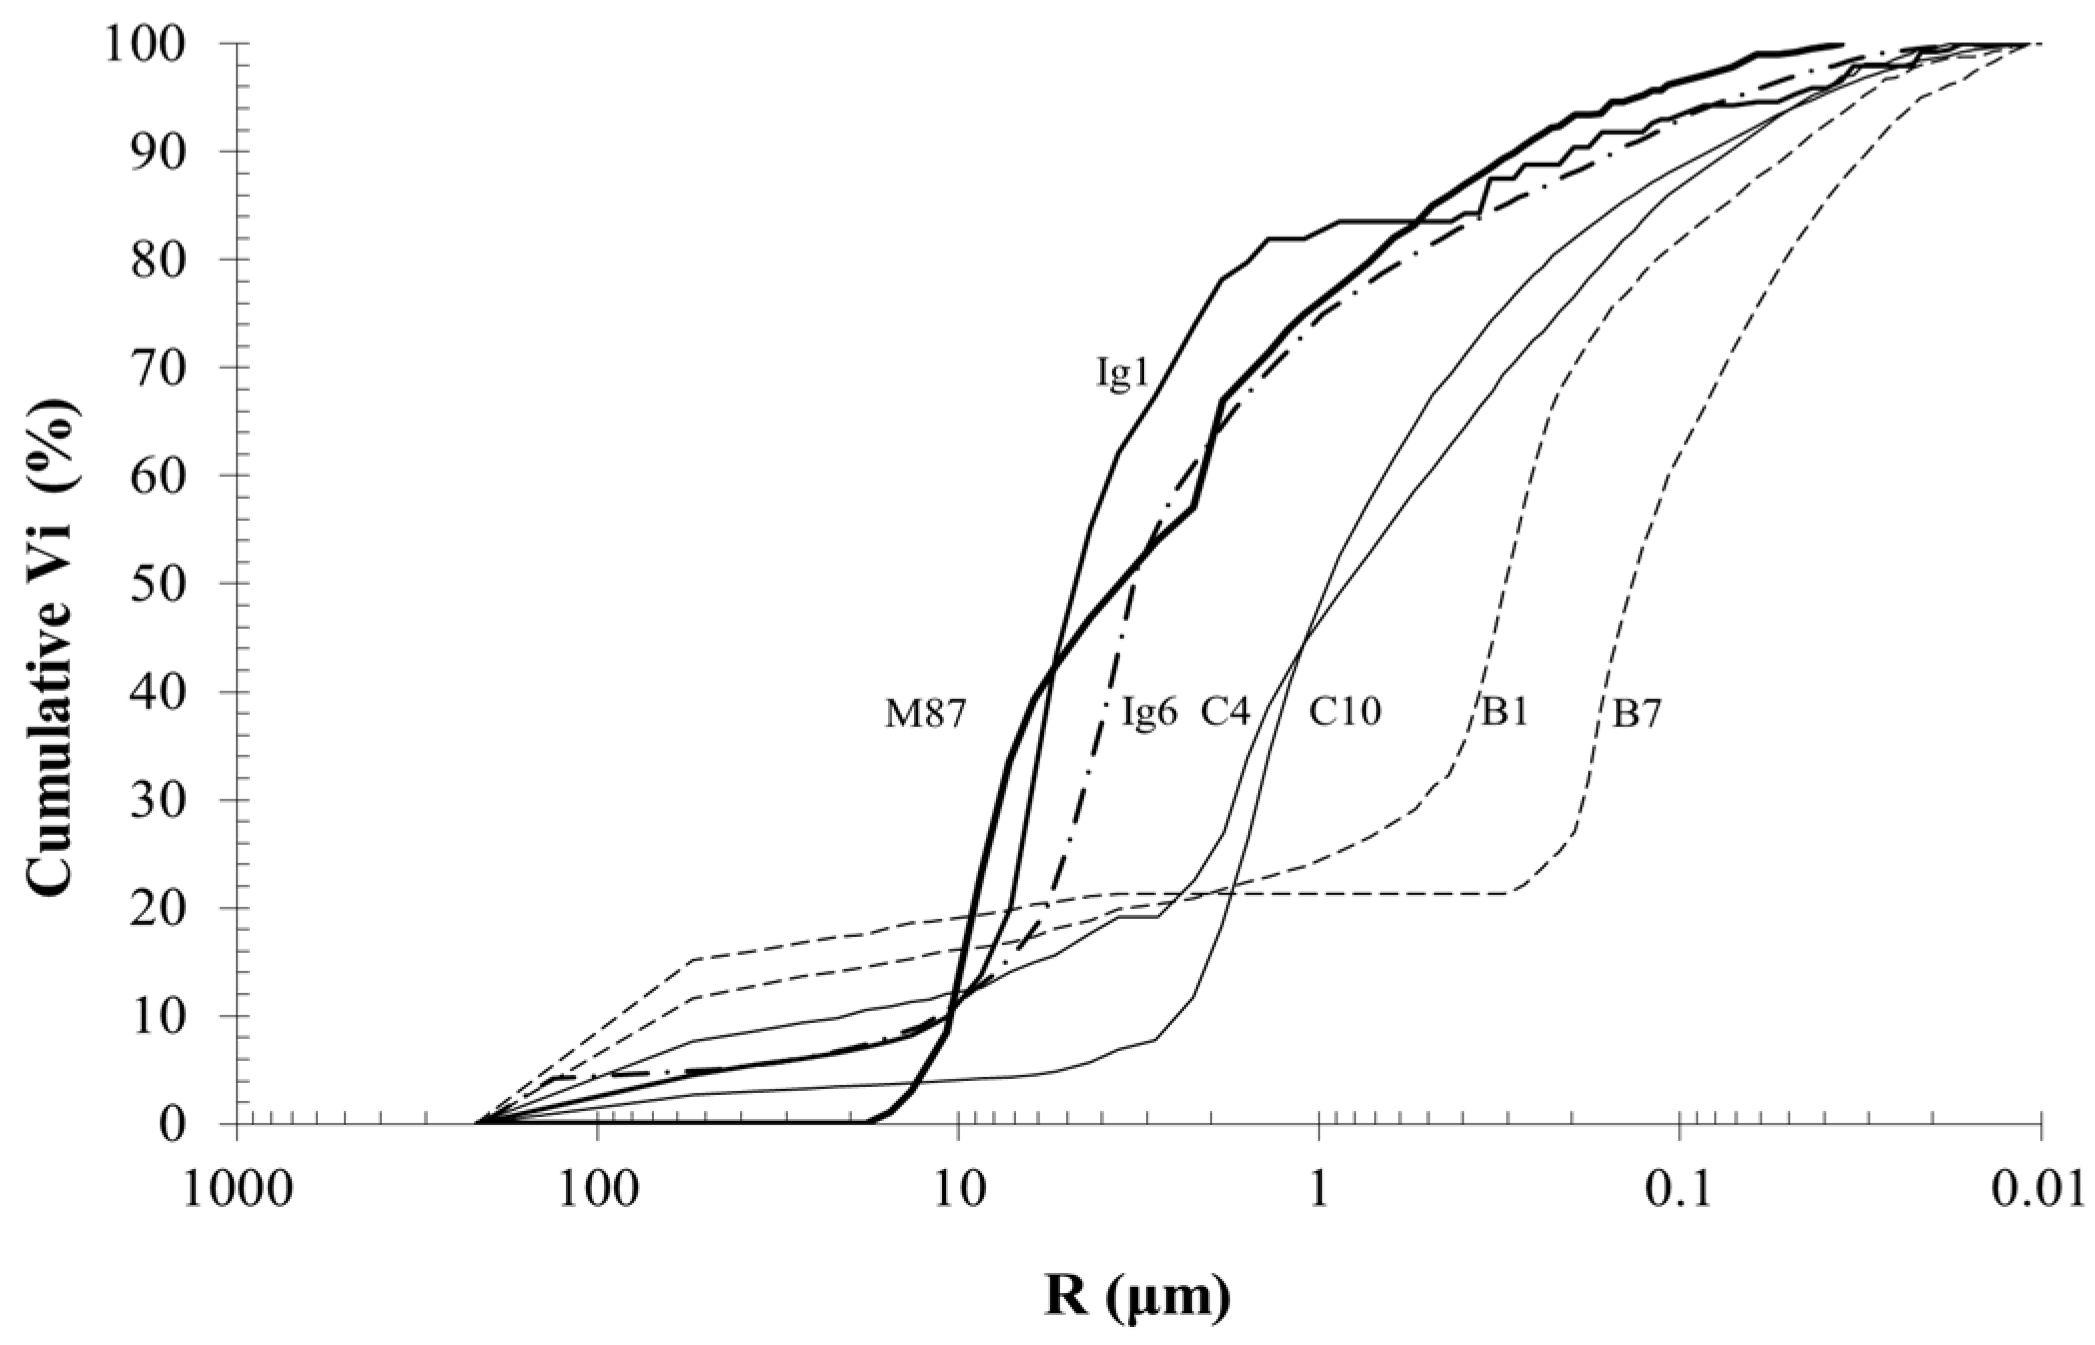
| Samples | Porosity n (%) | Bulk Density (kg/m3) | Real Density (kg/m3) | Median of Pore Radius (µm) | Permeability (mD) |
|---|---|---|---|---|---|
| B1 | 5.8 | 2509 | 2665 | 0.31 | 56.8 |
| B7 | 7.4 | 2472 | 2670 | 0.14 | 96.7 |
| C4 | 12.4 | 2340 | 2671 | 0.84 | 2.8 |
| C10 | 13.1 | 2333 | 2684 | 0.95 | 2.3 |
| M87 | 17 | 2158 | 2591 | 3.57 | 30.1 |
| Ig1 * | 16.1 | 2139 | 2550 | 4.78 | 19.7 |
| Ig6 * | 16.2 | 2194 | 2616 | 3.20 | 24.6 |
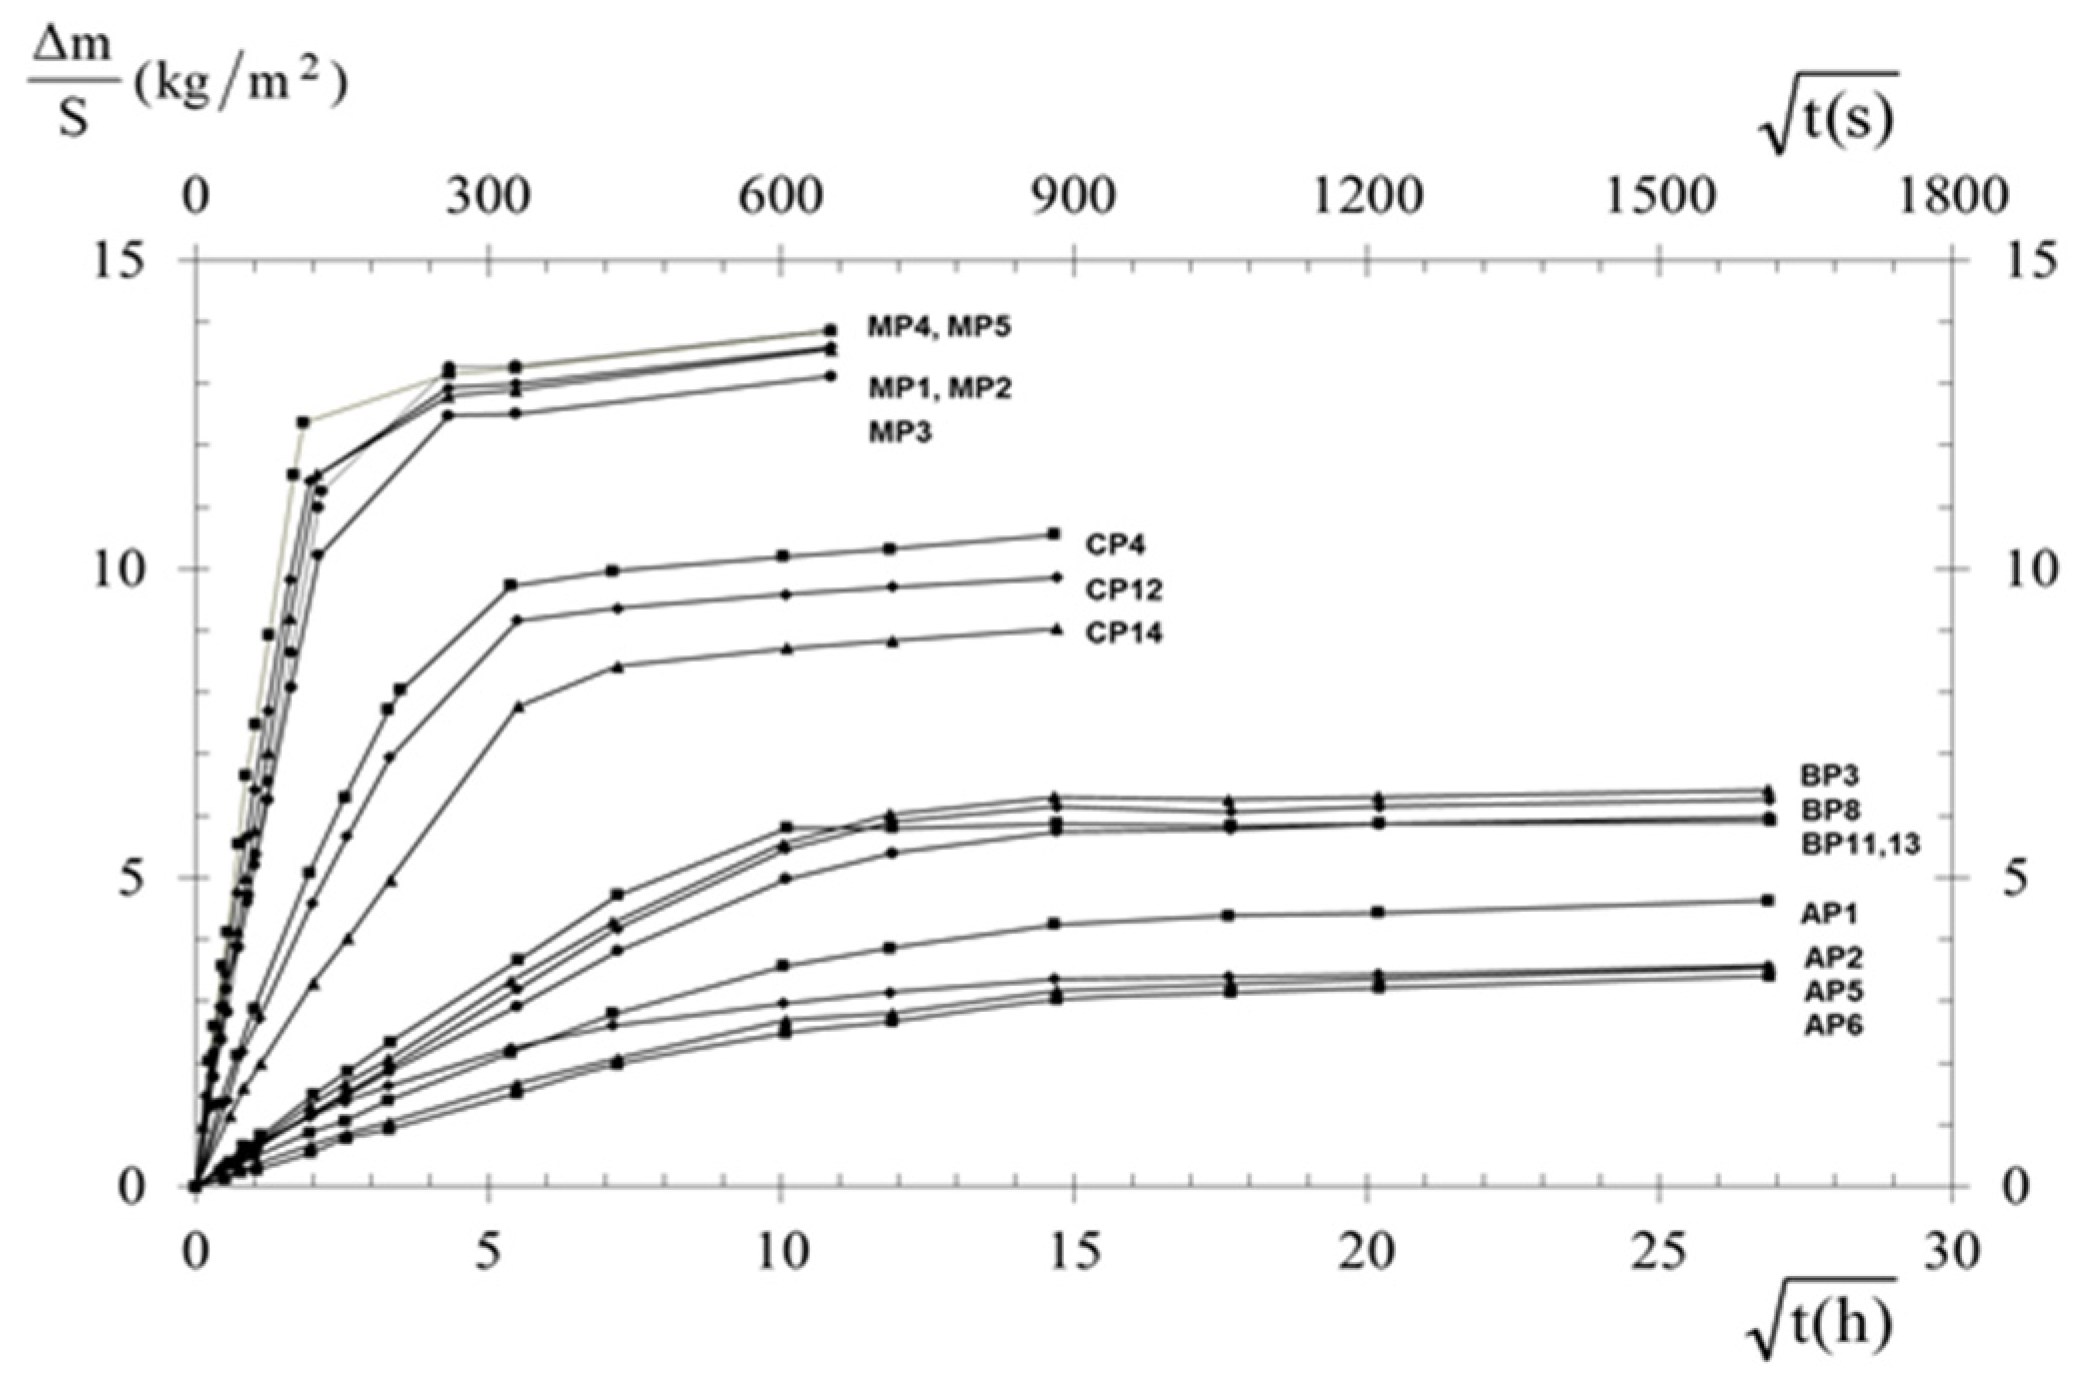
| Variety | Samples (Prisms) | Water Absorption, k (kg/m2/√h) | Water Absorption, k (kg/m2/√h) Average ± SD (CV %) |
|---|---|---|---|
| A | AP38 | 0.7 | 0.9 ± 0.2 (21) |
| AP39 | 0.7 | ||
| AP53 | 0.8 | ||
| AP96 | 0.7 | ||
| AP1 | 1.3 | ||
| AP5 | 1.1 | ||
| AP6 | 1 | ||
| AP9 | 0.9 | ||
| AP11 | 0.8 | ||
| B | BP6 | 2.4 | 2.4 ± 0.3 (14.4) |
| BP27 | 2.4 | ||
| BP32 | 3.2 | ||
| BP45 | 2.5 | ||
| BP72 | 2 | ||
| BP3 | 2.4 | ||
| BP13 | 2.4 | ||
| BP | 2 | ||
| C | CP18 | 7.6 | 6.2 ± 1.1 (17.5) |
| CP24 | 7.4 | ||
| CP50 | 5.3 | ||
| CP40 | 5.3 | ||
| CP87 | 5.3 | ||
| M | MP1 | 26.4 | 25.6 ± 3.4 (13.3) |
| MP2 | 23.7 | ||
| MP3 | 22.8 | ||
| MP5 | 23.2 | ||
| MP6 | 31.8 | ||
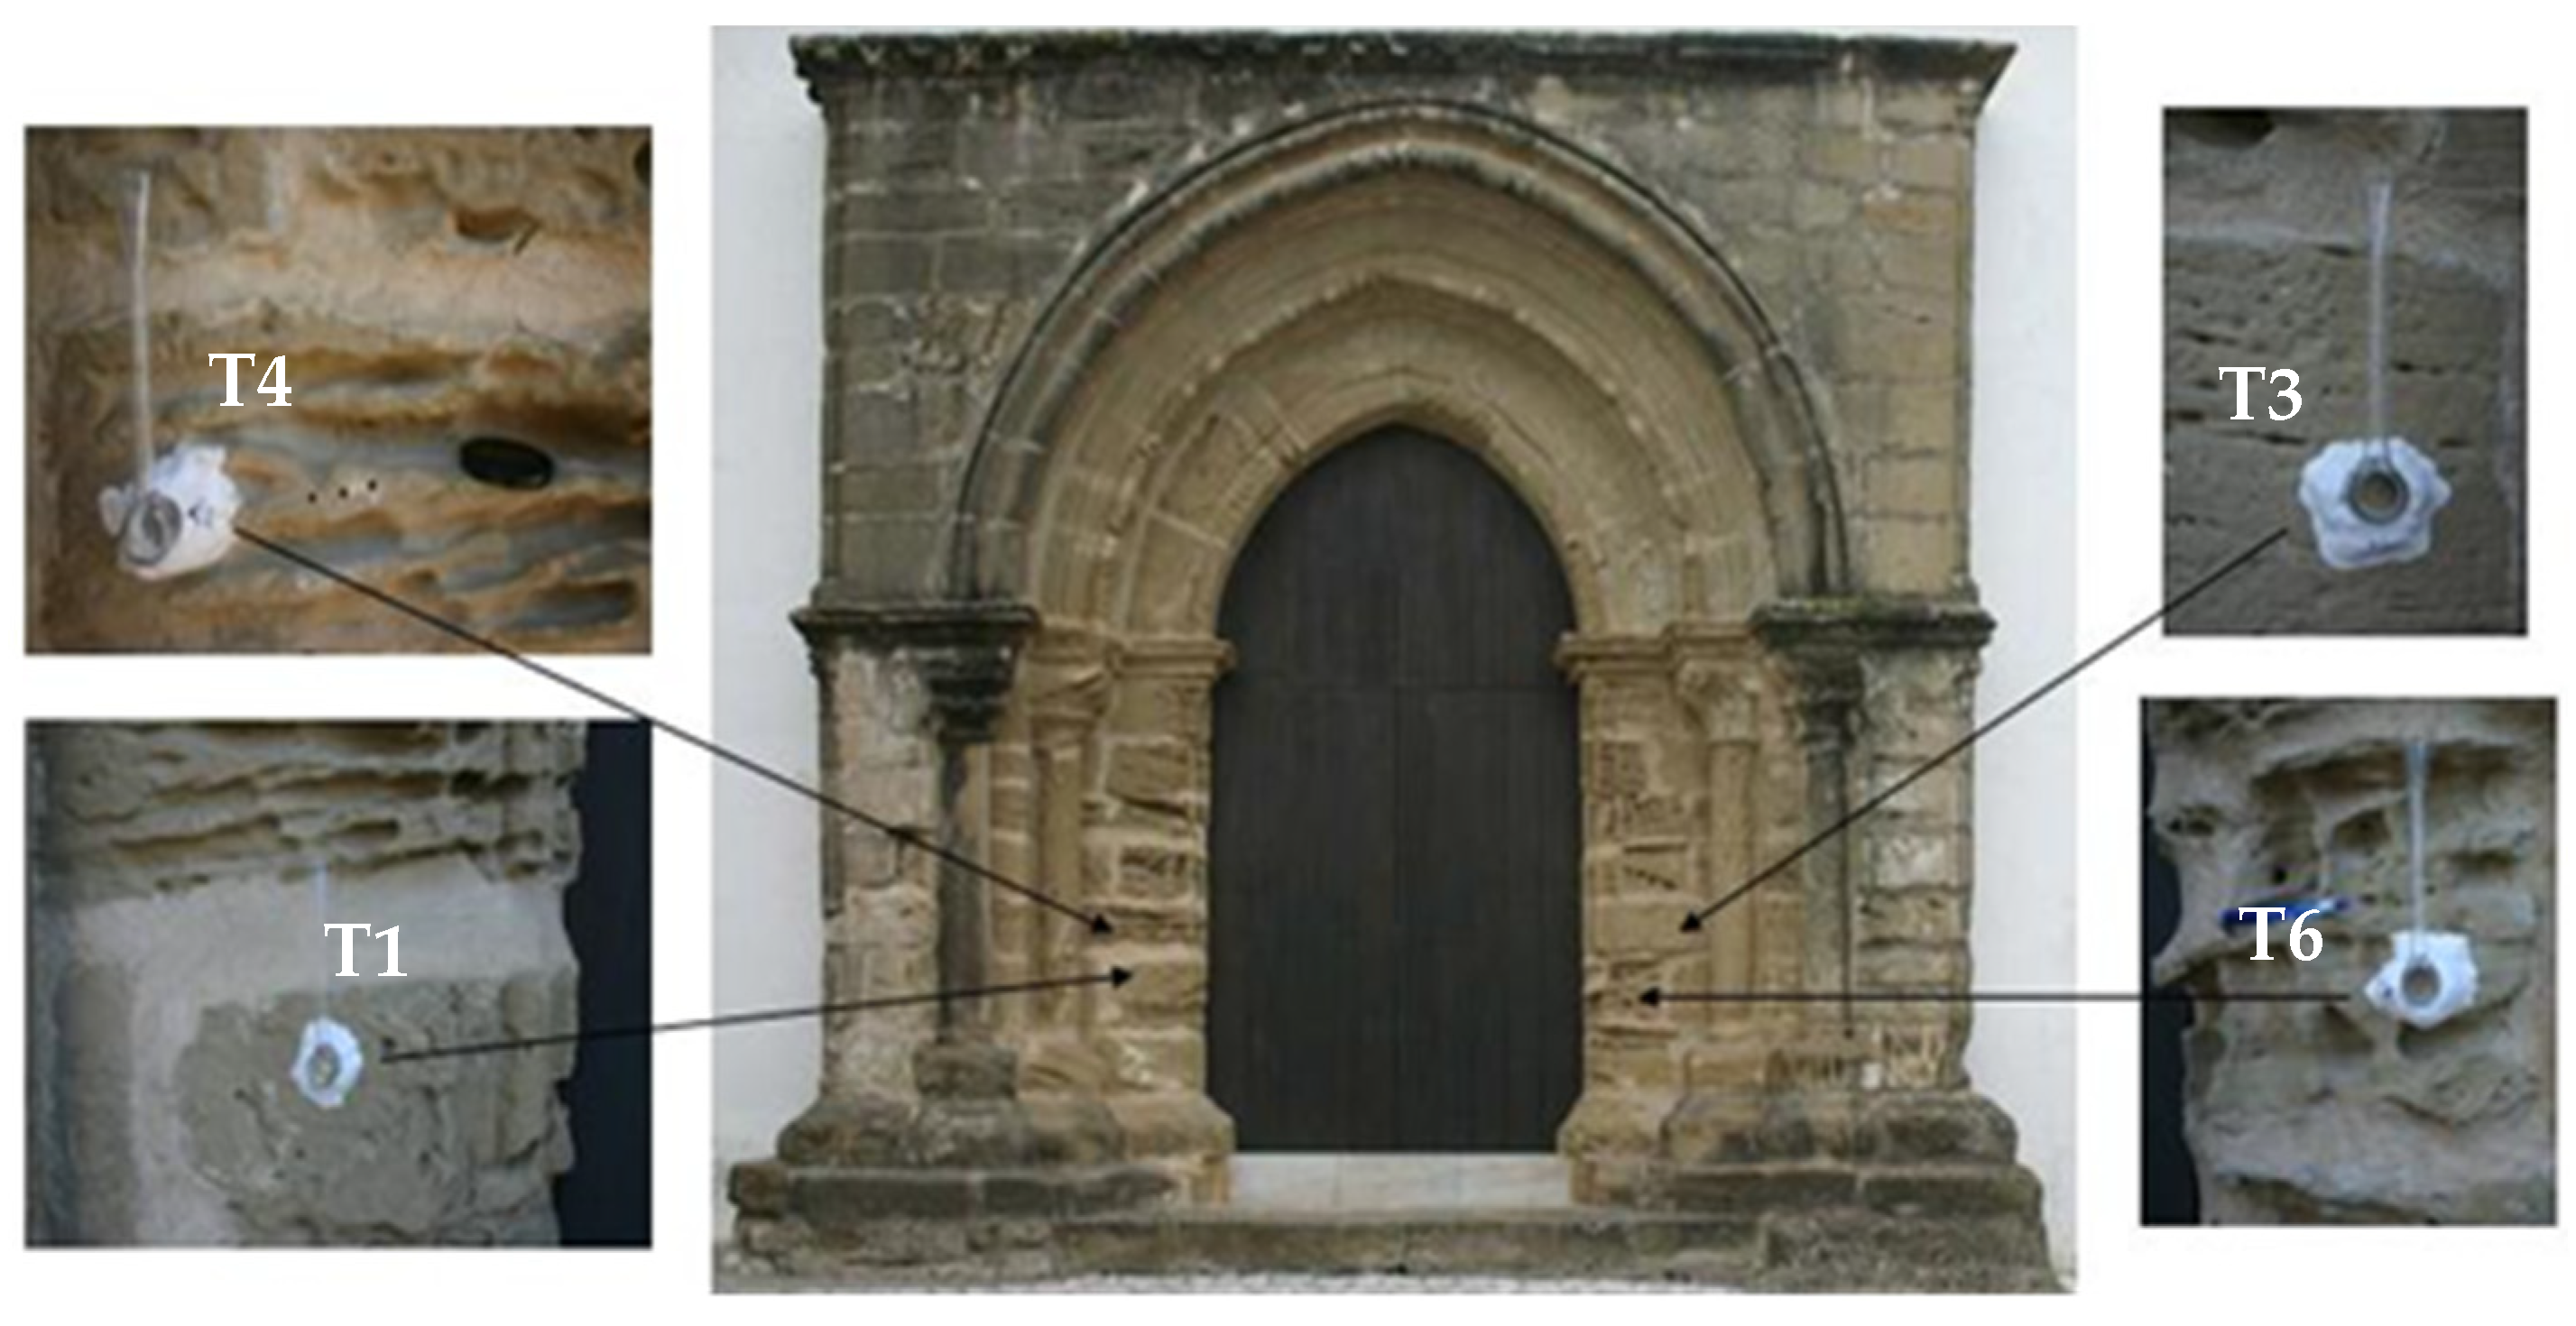
| C + M | T1 | 5.6 | - |
| T3 | 6.0 | - | |
| T4 | 28.5 | - | |
| T6 | 21.7 | - |
| Variety | Samples | Cc (kg/m2/√h) | Average ± SD |
|---|---|---|---|
| (CV %) | |||
| A | P1 | 0.4 | 0.4 ± 0.1 (24.5) |
| P2 | 0.5 | ||
| P5 | 0.3 | ||
| P6 | 0.3 | ||
| B | P3 | 0.6 | 0.6 ± 0.1 (9.2) |
| P8 | 0.6 | ||
| P11 | 0.5 | ||
| P13 | 0.7 | ||
| C | P4 | 2.5 | 2.1 ± 0.5 (25.0) |
| P12 | 2.2 | ||
| P14 | 1.5 | ||
| M | P1 | 5.7 | 5.9 ± 0.8 (13.6) |
| P2 | 6.2 | ||
| P3 | 5.1 | ||
| P4 | 5.3 | ||
| P5 | 7.1 |
| Variety | Samples (Prisms) | Drying Index | Drying Index Average ± SD (CV %) | ||||
|---|---|---|---|---|---|---|---|
| DI1 | DI2 | DIt | DI1 | DI2 | DIt | ||
| A | AP1 | 0.01 | 0.37 | 0.38 | 0.01 ± 0.00 (0.00) | 0.36 ± 0.02 (5.56) | 0.37 ± 0.02 (5.41) |
| AP2 | 0.01 | 0.33 | 0.34 | ||||
| AP5 | 0.01 | 0.37 | 0.38 | ||||
| AP6 | 0.01 | 0.38 | 0.39 | ||||
| B | BP3 | 0.02 | 0.18 | 0.20 | 0.02 ± 0.00 (0.00) | 0.18 ± 0.01 (5.56) | 0.20 ± 0.01 (5.00) |
| BP8 | 0.02 | 0.16 | 0.18 | ||||
| BP11 | 0.02 | 0.18 | 0.20 | ||||
| BP13 | 0.02 | 0.18 | 0.20 | ||||
| Variety | Samples (Cubes) | Drying Index | Drying Index Average ± SD (CV %) | ||||
|---|---|---|---|---|---|---|---|
| DI1 | DI2 | DIt | DI1 | DI2 | DIt | ||
| C | C60.1 | 0.02 | 0.16 | 0.18 | 0.02 ± 0.00 (0.00) | 0.18 * ± 0.07 * (38.89) * 0.15 ± 0.01 (6.67) | 0.20 * ± 0.07 * (35.00) * 0.17 ± 0.01 (5.88) |
| C85.2 | 0.02 | 0.13 | 0.15 | ||||
| C79.1 | 0.02 | 0.14 | 0.16 | ||||
| C78.1 | 0.02 | 0.16 | 0.18 | ||||
| C47.2 | 0.02 | 0.16 | 0.18 | ||||
| C87.2 | 0.02 | 0.33 * | 0.35 * | ||||
| M | M103 | 0.06 | 0.06 | 0.12 | 0.05 ± 0.01 (20.00) | 0.05 ± 0.01 (20.00) | 0.10 ± 0.01 (10.00) |
| M104 | 0.05 | 0.05 | 0.10 | ||||
| M105 | 0.05 | 0.05 | 0.10 | ||||
| M106 | 0.06 | 0.05 | 0.11 | ||||
| M107 | 0.05 | 0.04 | 0.09 | ||||
| M108 | 0.05 | 0.04 | 0.09 | ||||
| Specimen/Test | AP11 | BP3 | Bpt(n = 6.3%) | CP24 | T3 | MP1 | T4 |
|---|---|---|---|---|---|---|---|
| k (kg/m2/√h) | 0.8 | 2 | 2 | 7 | 6 | 26 | 28.5 |
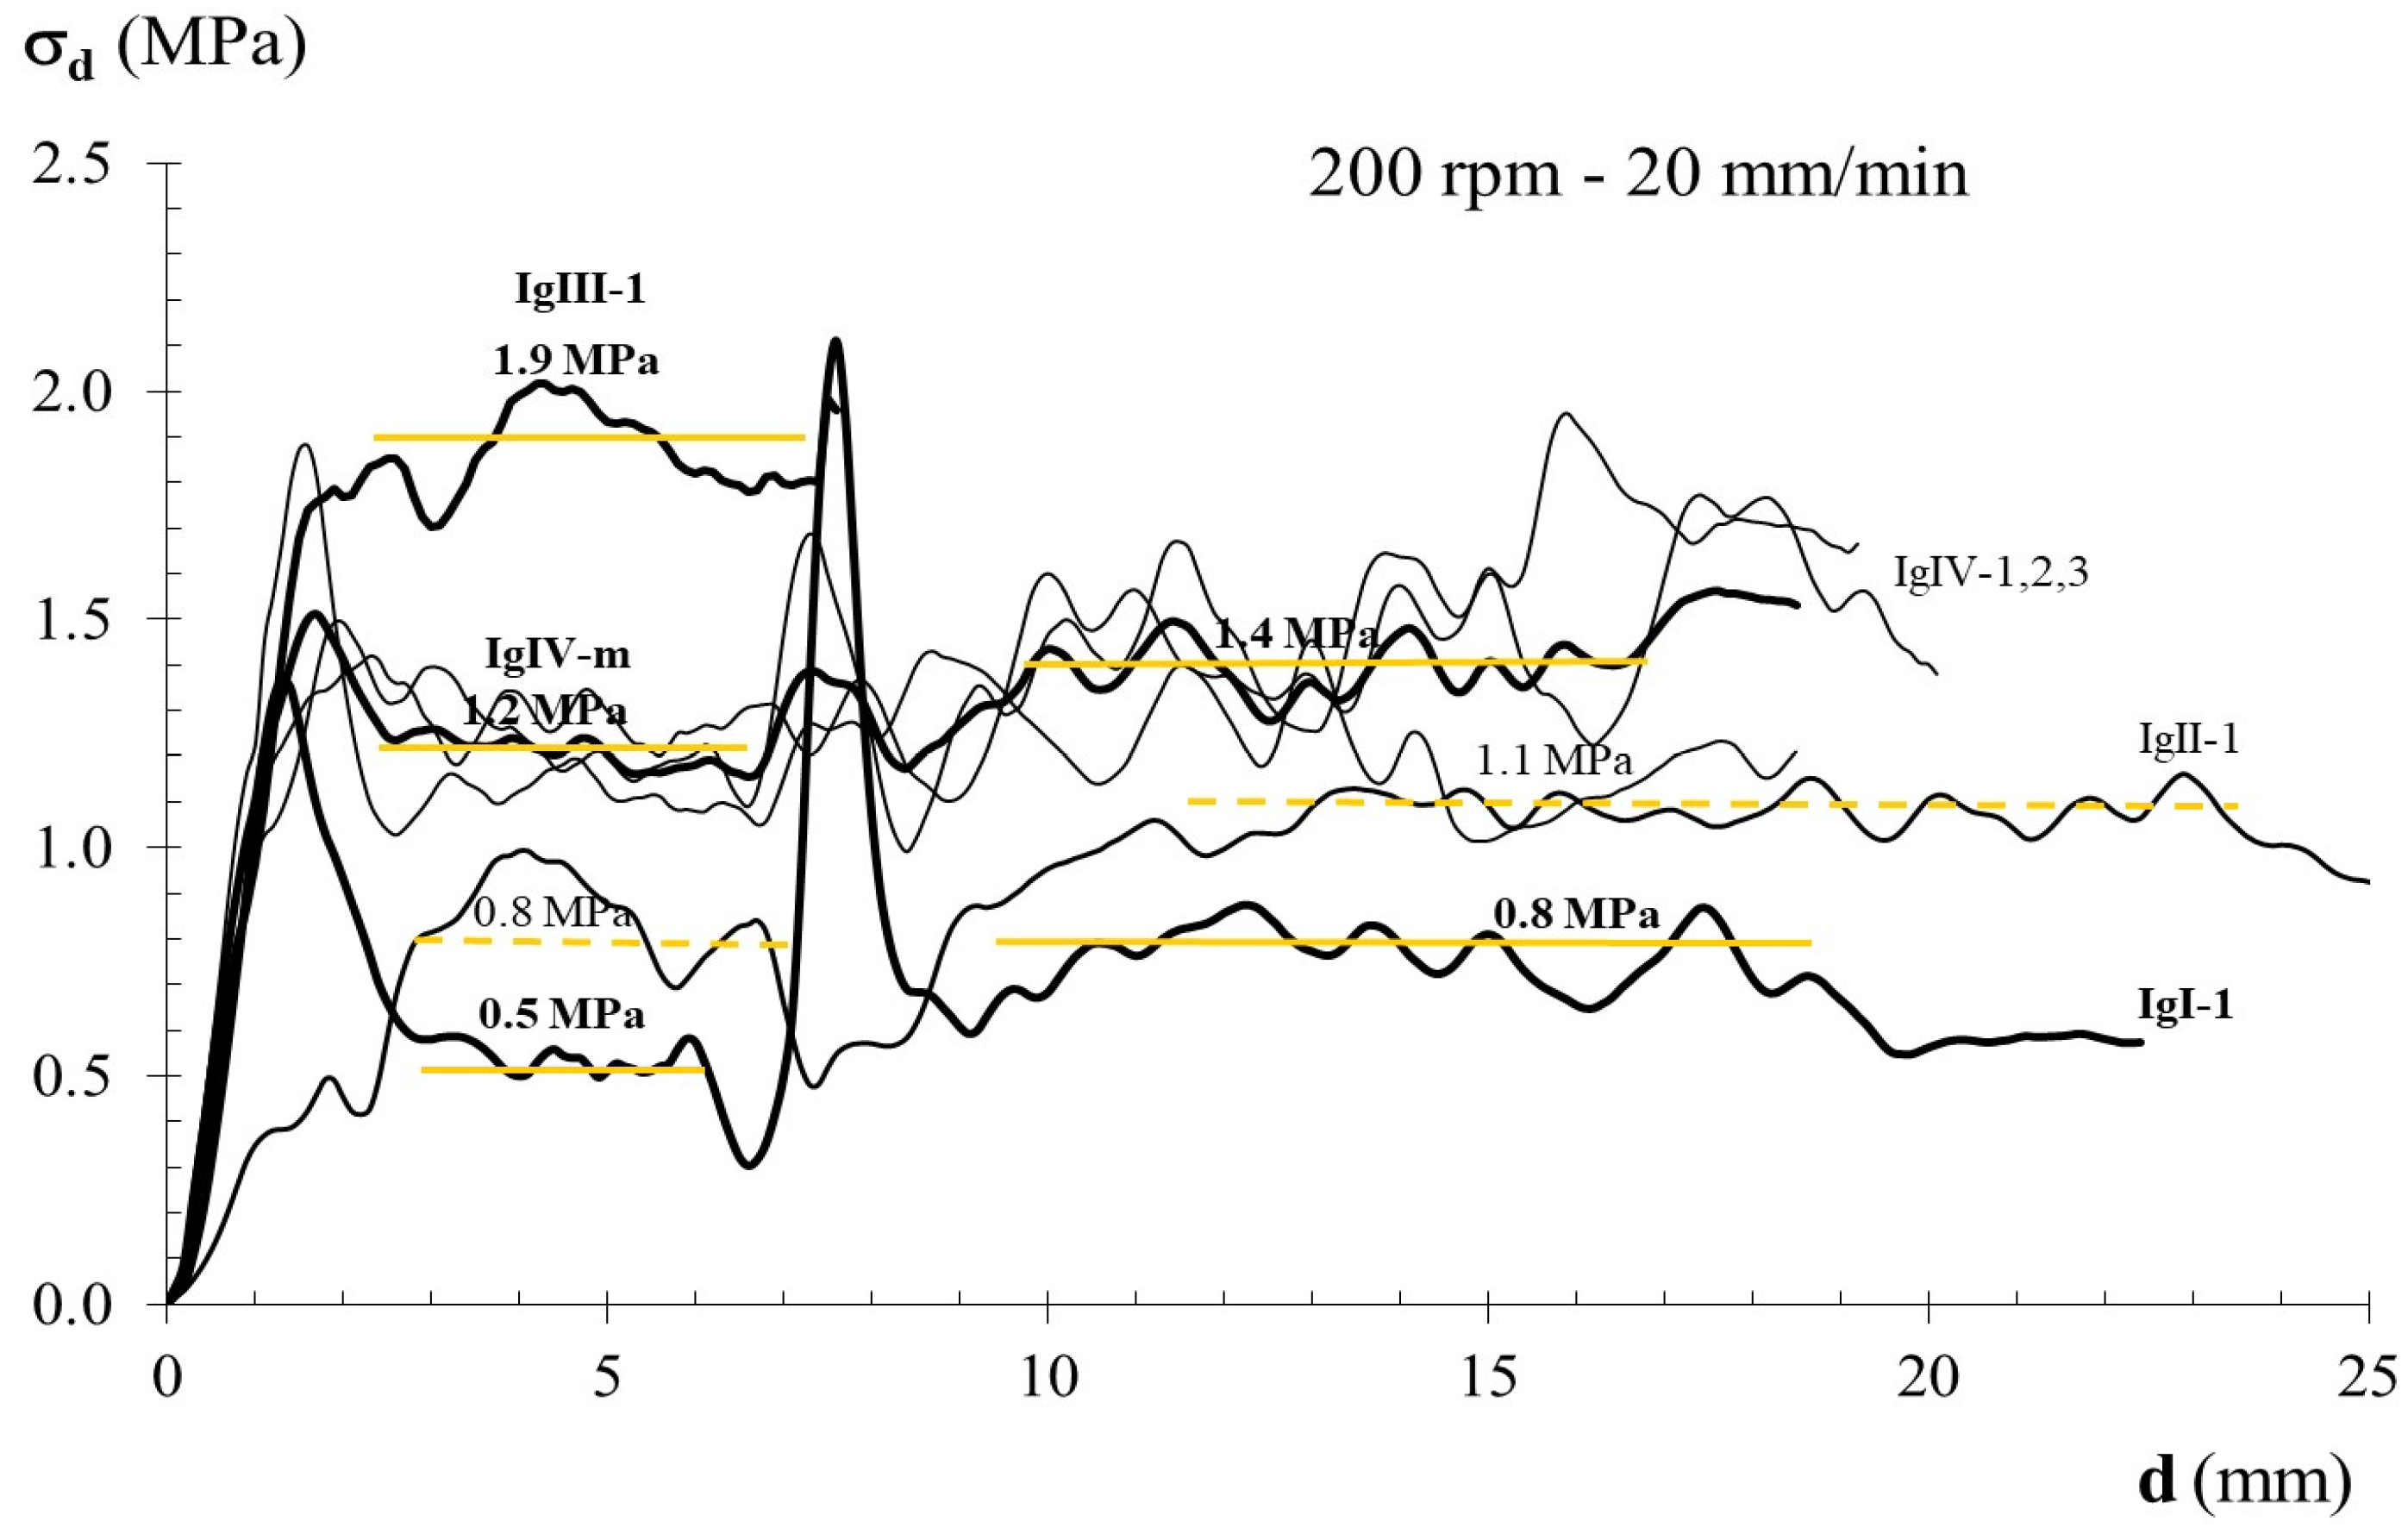
| σd (MPa) | 2.25 * | - | 1.9 | - | 1.2 | - | 0.5 |
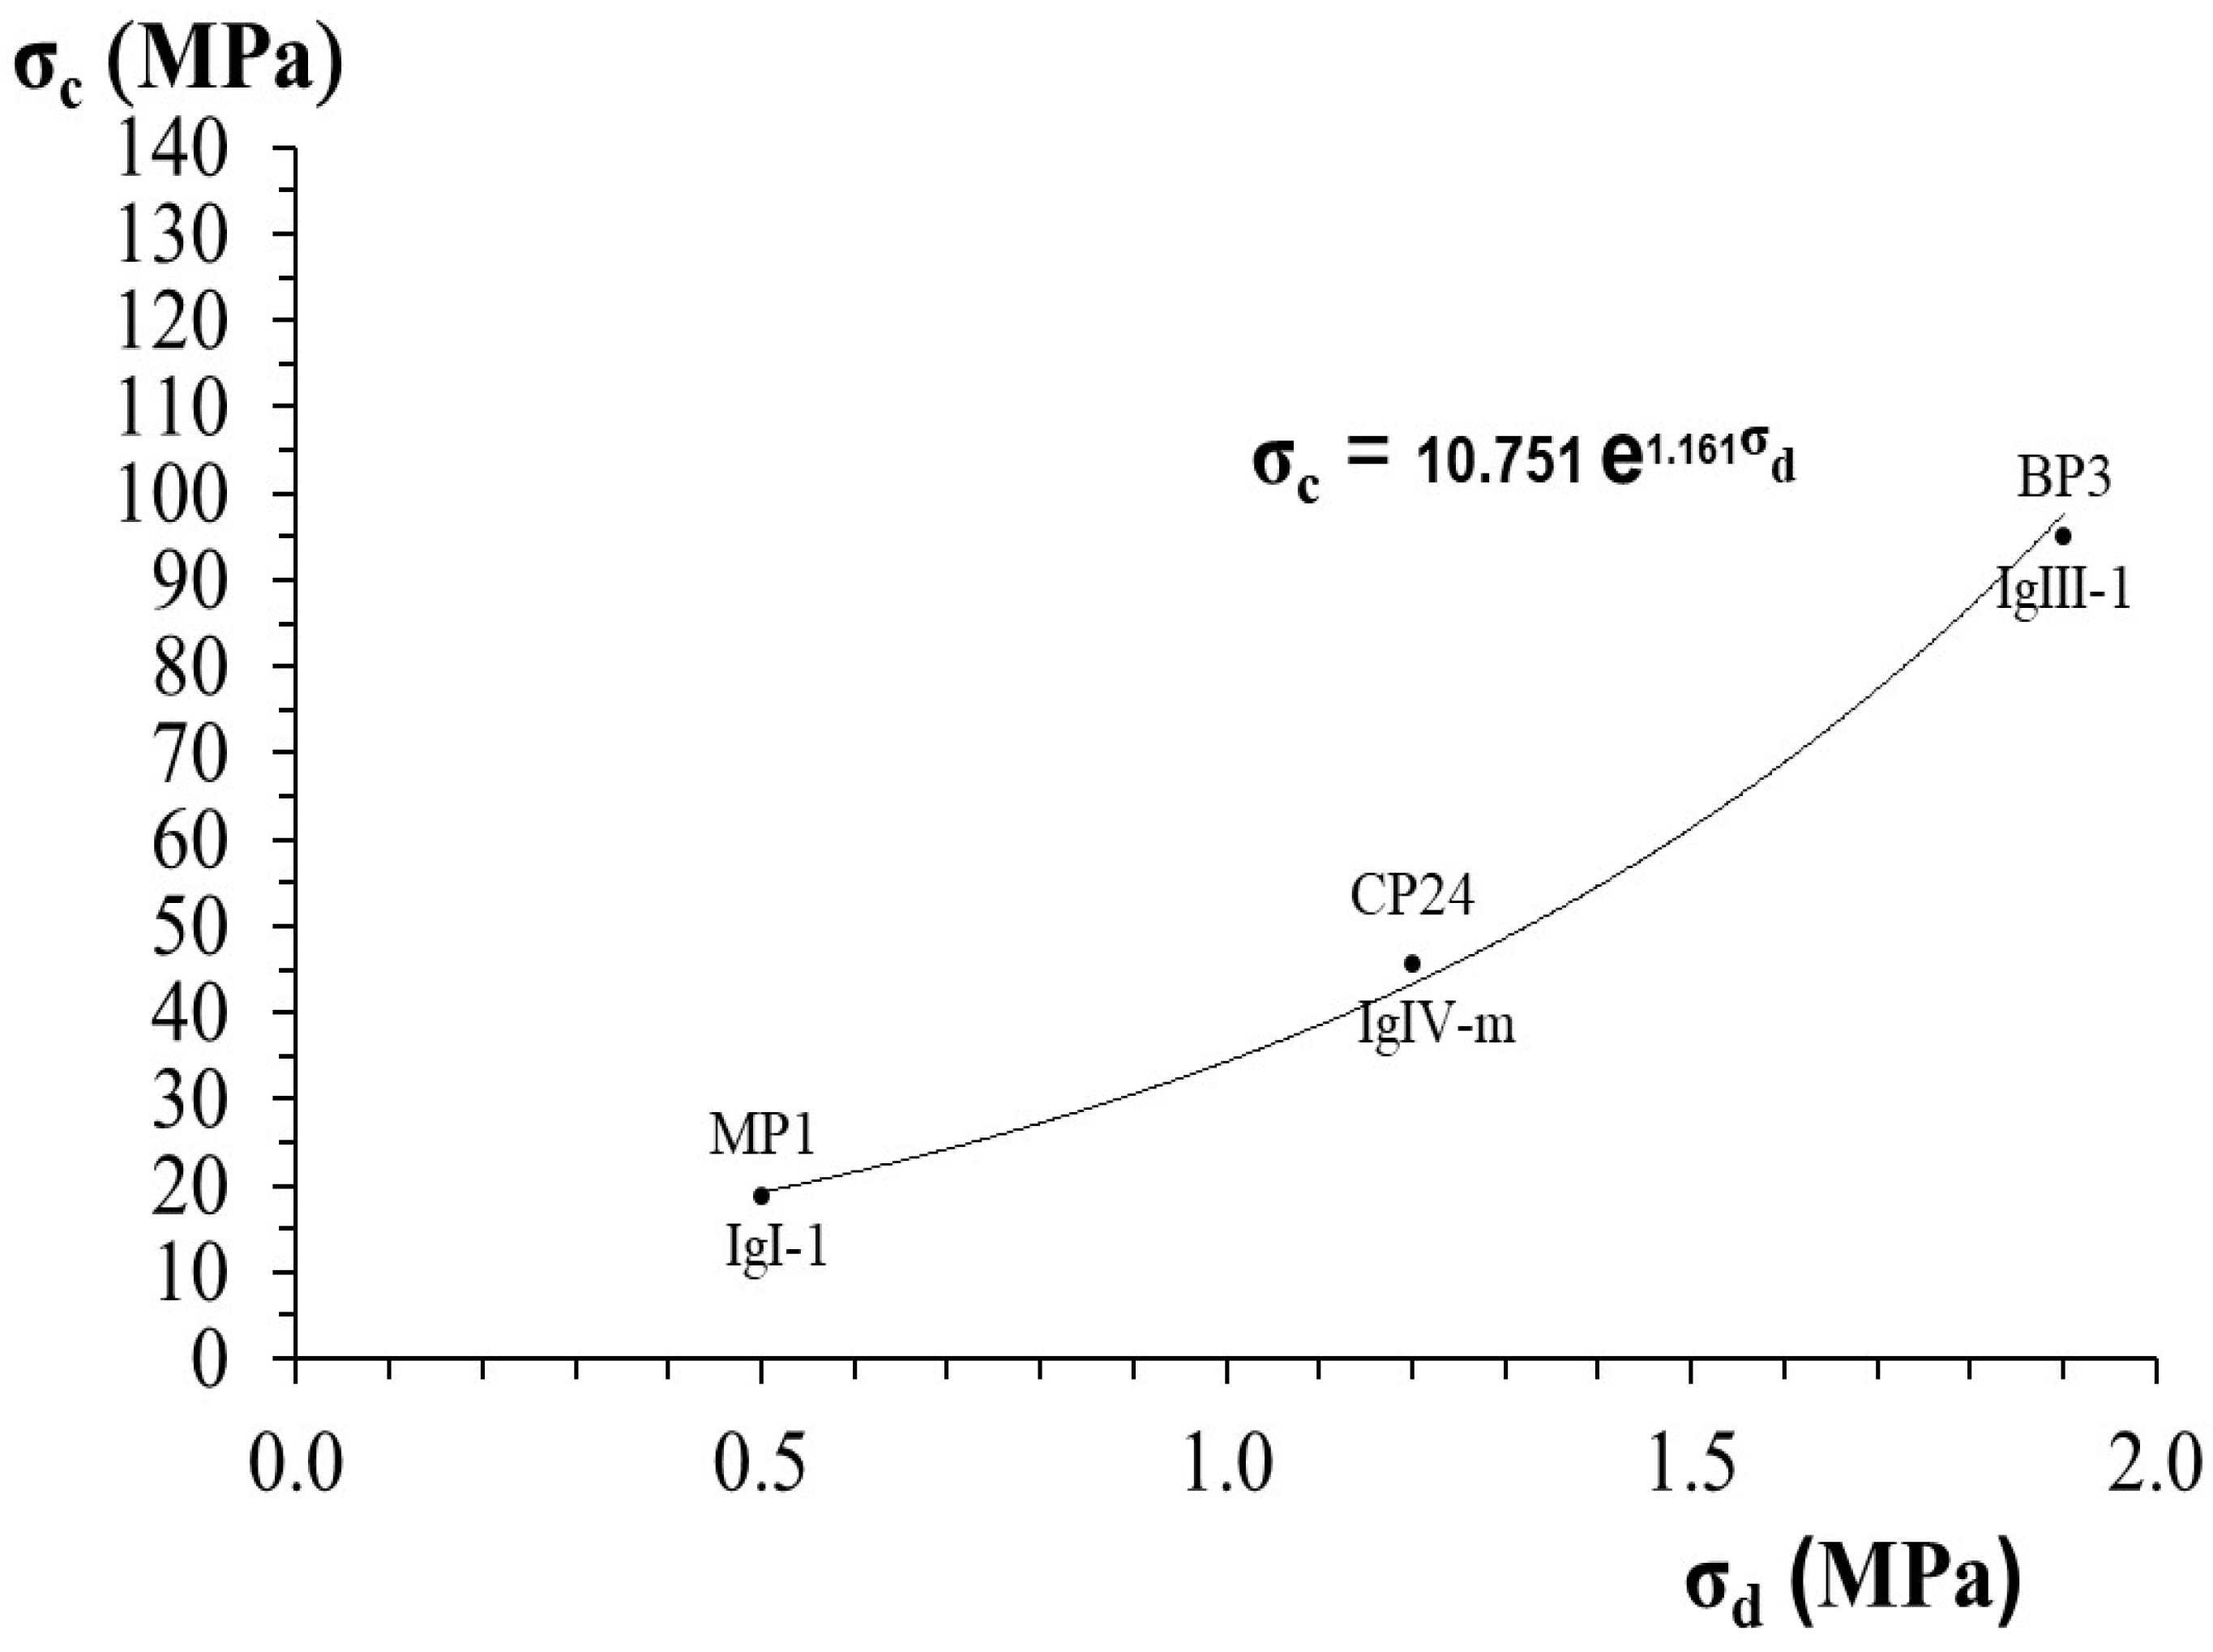
| σc (MPa) | 136.2 | 95.0 | - | 45.7 | - | 18.7 | - |
| σc pred DRMT (MPa) | 146.5 | - | 97.6 | - | 43.3 | - | 19.2 |
| εR | 6.3 × 10⁻³ | 7.2 × 10⁻³ | - | 7.4 × 10⁻³ | - | 7.9 × 10⁻³ | - |
| εR pred DRMT | 6.9 × 10⁻³ | - | 7.1 × 10⁻³ | - | 7.5 × 10⁻³ | - | 7.9 × 10⁻³ |
| ∆σc pred − σc specimen (%) | 7.6 | 2.7 | 5.3 | 2.7 | |||
| ∆εR pred − εR specimen (%) | 9.5 | 1.4 | 1.4 | 0 | |||
Disclaimer/Publisher’s Note: The statements, opinions and data contained in all publications are solely those of the individual author(s) and contributor(s) and not of MDPI and/or the editor(s). MDPI and/or the editor(s) disclaim responsibility for any injury to people or property resulting from any ideas, methods, instructions or products referred to in the content. |
© 2024 by the authors. Licensee MDPI, Basel, Switzerland. This article is an open access article distributed under the terms and conditions of the Creative Commons Attribution (CC BY) license (https://creativecommons.org/licenses/by/4.0/).
Share and Cite
Ludovico-Marques, M.; Chastre, C. Modelling the Mechanical Effect of Salt Weathering on Historical Sandstone Blocks through Microdrilling. Sustainability 2024, 16, 6277. https://doi.org/10.3390/su16156277
Ludovico-Marques M, Chastre C. Modelling the Mechanical Effect of Salt Weathering on Historical Sandstone Blocks through Microdrilling. Sustainability. 2024; 16(15):6277. https://doi.org/10.3390/su16156277
Chicago/Turabian StyleLudovico-Marques, Marco, and Carlos Chastre. 2024. "Modelling the Mechanical Effect of Salt Weathering on Historical Sandstone Blocks through Microdrilling" Sustainability 16, no. 15: 6277. https://doi.org/10.3390/su16156277