Review

Data-Driven Net-Zero Carbon Monitoring: Applications of Geographic Information Systems, Building Information Modelling, Remote Sensing, and Artificial Intelligence for Sustainable and Resilient Cities

by
Jilong Li
,
Sara Shirowzhan
*,
Gloria Pignatta
and
Samad M. E. Sepasgozar
School of Built Environment, Kensington Campus, The University of New South Wales, Sydney, NSW 2052, Australia
*
Author to whom correspondence should be addressed.
Sustainability 2024, 16(15), 6285; https://doi.org/10.3390/su16156285
Submission received: 10 April 2024 / Revised: 7 July 2024 / Accepted: 12 July 2024 / Published: 23 July 2024

Abstract

:
NZCCs aim to minimise urban carbon emissions for healthier cities in line with national and international low-carbon targets and Sustainable Development Goals (SDGs). Many countries have recently adopted Net-Zero Carbon City (NZCC) policies and strategies. While there are many studies available on NZCC cities’ definitions and policymaking, currently, research is rare on understanding the role of urban data-driven technologies such as Building Information Modelling (BIM) and Geographic Information Systems (GIS), as well as AI, for achieving the goals of NZCCs in relation to sustainable development goals (SDGs), e.g., SDGs 3, 7,11, 13, and 17. This paper aims to fill this gap by establishing a systematic review and ascertaining the opportunities and barriers of data-driven approaches, analytics, digital technologies, and AI for supporting decision-making and monitoring progress toward achieving NZCC development and policy/strategy development. Two scholarly databases, i.e., Web of Science and Scopus databases, were used to find papers based on our selected relevant keywords. We also conducted a desktop review to explore policies, strategies, and visualisation technologies that are already being used. Our inclusion/exclusion criteria refined our selection to 55 papers, focusing on conceptual and theoretical research. While digital technologies and data analytics are improving and can help in the move from net-zero carbon concepts and theories to practical analysis and the evaluation of cities’ emission levels and in monitoring progress toward reducing carbon, our research shows that these capabilities of digital technologies are not used thoroughly yet to bridge theory and practice. These studies ignore advanced tools like city digital twins and GIS-based spatial analyses. No data, technologies, or platforms are available to track progress towards a NZCC. Artificial Intelligence, big data collection, and analytics are required to predict and monitor the time it takes for each city to achieve net-zero carbon emissions. GIS and BIM can be used to estimate embodied carbon and predict urban development emissions. We found that smart city initiatives and data-driven decision-making approaches are crucial for achieving NZCCs.

1. Introduction

Fostering economic growth and urbanisation, rapid industrialisation has caused a simultaneous increase in carbon emissions. Balancing economic development with carbon reduction efforts is imperative for achieving sustainability goals in urban areas [1]. Industrialisation has led to the development of many sectors worldwide, alongside population growth and increased income levels [2]. In the past two centuries, the world economy relied on altering biogeochemical cycles and exploiting natural resources [3]. With rising living standards, the global population is anticipated to climb from 7.8 billion in 2020 to 9.9 billion in 2050, and the results mean that individuals will require 70% more food and 80% more energy [4]. Moreover, in exploring the path to the city’s future development, indispensable projects include constructing green facilities and addressing crucial aspects of human development, such as accessibility to education facilities, green infrastructures, and the quantity of bicycle paths [5]. These green redevelopments prompt urban planners to consider how to assess the public’s satisfaction level regarding the transformation to a Net-Zero Carbon City (NZCC) [6].
In addition, NZCC initiatives are also crucial for achieving the Sustainable Development Goals (SDGs) explained by the United Nations (UN), especially SDG 11, which focuses on helping cities to become more resilient, safe, and sustainable for the daily life convenience of surrounding communities [7]. Reducing carbon emissions to close to zero is vital for the future of cities because carbon emissions negatively impact climate change and global warming [8]. However, the reverse impact of early industrialisation has already warned the world, providing evidence of the increase in carbon dioxide emissions, which has led to increasing climate warming and frequent climate extremes [9]. Immediate efforts are needed to reduce greenhouse gas (GHG) emissions, including CO2.
Frequently monitoring carbon emissions by utilising reliable datasets is necessary to research the spatiotemporal trends in CO2 and evaluate the effectiveness of emission reduction policies [10]. Biber and Krogstie (2021) have emphasised the importance of the basic development of frameworks for data-driven technologies in the background of Net-Zero Carbon Cities (NZCCs) [11]. Data-driven methods facilitate digital visualisation technologies to monitor cities’ current conditions and make predictions [12]. This advancement contributes to creating cities that are more liveable and smarter than before. To effectively monitor and modify the corresponding situation of the city, policy/decision-makers need to possess the necessary capabilities to utilise the correct digitalisation technologies and understand the city’s strengths and weaknesses to make comprehensive data analyses, and then make the most suitable decision to modify the state of the city [13].
Recently, multiple industrial companies have been willing to use the city digital twin method to monitor and solve carbon issues to avoid paying the extra carbon tax [14]. Indeed, the implementation techniques of digital governance in smart cities have already shown the potential to reduce regional carbon emissions, and this process has proven that long-term sustainability is necessary for developing NZCCs as the primary target [15]. When establishing a city digital platform, additional analyses and calculations, such as flood simulation and the potential of using solar energy, can be utilised to modify and monitor city development [16]. Furthermore, digital transformation technologies such as Building Information Modelling (BIM) and Geographic Information Systems (GIS), city digital twins (CDTs), and Artificial Intelligence (AI) can facilitate accurate decision-making for the planning of future NZCCs.
While the value and potential of digital technologies and data-driven approaches and methods, including spatial data science and Building Information Modelling or digital twins and AI, are reported in some studies, a thorough review is lacking in the literature to derive further opportunities these technologies provide for monitoring and measuring progress towards NZCCs.
This study aims to fill this gap by constructing a systematic literature review on using these digital technologies to accelerate achieving NZCCs with a more practical focus. This paper focuses on filling the research gap by employing content analysis to assess the existing literature based on data, sources, and case studies. In addition, this study begins by providing a comprehensive overview of data, sources, and accessibility to identify any deficiencies in current datasets and outline potential avenues for future research directions in NZCCs. Also, this study explores how these technologies can be utilised to contribute to measuring success towards NZCCs.
Furthermore, we thoroughly examine existing case studies as typical examples to demonstrate the data digitalisation technologies that have been implemented. Additionally, an assessment is carried out to determine which technologies are more practical and to employ effective methodologies for analysing, visualising, and modelling CO2 emission data. Finally, the studies are classified and subcategorised based on their applications.
Indeed, this study formulates three research questions, intending to guide future research directions:
  • What is the potential of data-driven methods to be utilised to assist in achieving NZCCs?
  • What are the opportunities and barriers to effectively using and developing city digitalisation technologies to achieve NZCCs’ goals?
  • What are the opportunities brought by AI as a next-generation tool for monitoring and facilitating decision-making in developing NZCCs scenario planning tools and measurements?
The following are the paper’s contributions:
  • A systematic review of NZCCs: This paper provides a detailed investigation of existing data analytical methods and tools for the path to NZCCs, identifying different concepts that are associated with concept differentiation about NZCCs.
  • A detailed investigation into the progress of achieving NZCCs worldwide through policymaking and method approaching.
  • Data-driven methods and associated technologies that can be implemented in the research of NZCCs and applications of NZCCs. This work identifies the importance of utilising the data-driven method in the path to NZCCs and of providing possibilities for utilising GIS, BIM, RS, and AI for monitoring the carbon emission change and further supporting the path to achieve NZCCs.
  • Providing future research directions about how to optimise the performance of the technical combination of carbon emission prediction and artificial intelligence in the establishment of NZCCs.

2. SDGs and NZCCs

The SDGs suggest working together worldwide to mitigate the impact of poverty, protect the environment, improve quality of life, and give everyone more opportunities for future development. In September 2015, United Nations members stated and agreed unanimously to add the SDGs to the 2030 Agenda for Sustainable Development [17].
A close relationship exists between the research criteria of NZCCs and SDGs, as shown in Figure 1. This figure provides relevant research fields in SDGs and NZCCs, showing the most relevant SDGs to the NZCC concept.
A brief presentation of the SDGs listed in Figure 1 and their relationship with NZCCs is provided as follows:
  • GOAL 3
The third SDG explains the necessity of ensuring healthy and thriving lives while advancing overall well-being across all age groups, and shares the same direction with NZCCs. For example, the burning of fossil fuels for transportation use and daily energy consumption is a major source of air pollution in cities; as a result, the SDGs encourage active transport mitigation tools to improve physical fitness, mental health, and environmental sustainability, further decreasing the carbon emissions produced by human activities [7].
  • GOAL 7
The seventh SDG ensures equitable access to all affordable, reliable, environmentally friendly, and up-to-date energy resources. In addition, if this goal can be achieved successfully, then the utilisation of solar, wind, and geothermal energy as renewable energies can further decrease the usage of fossil fuels, which can also help achieve a net zero carbon future [7].
  • GOAL 11
SDG 11 tries to transform cities and human settlements into places with characteristics such as safety, resilience, and sustainability [7]. At the same time, NZCCs also prioritise sustainable development, which balances economic growth with environmental and social concerns.
  • GOAL 13
SDG 13 aims to explain the problem of climate change and its associated consequences. Upon comparing the objectives of SDGs with those of a NZCC, a notable similarity emerges in their shared emphasis on addressing carbon emissions as a critical priority. Both initiatives focus on implementing mitigation and adaptation measures to address climate change [7].
  • GOAL 17
The seventeenth SDG (SDG) aims to enhance the execution mechanisms and reinvigorate the worldwide alliance for sustainable development. Cooperation and engagement are essential to achieving the SDGs and establishing comprehensive NZCCs. These cities frequently collaborate with others and engage stakeholders to exchange best practices, share resources, and disseminate knowledge, fostering positive feedback and addressing research shortages [7].
Figure 1. The relationship between NZCCs and SDGs.
Sustainability 16 06285 g001
In conclusion, the relevance of these SDGs is closely related to researching progress and methodologies to achieve NZCCs. This high-frequency overlap underscores the importance of comprehending sustainability goals as the initial step in determining the direction of further research for NZCCs. The subsequent step involves using this research direction as a guide to analyse specific case studies, extracting the evidence necessary to achieve NZCCs.

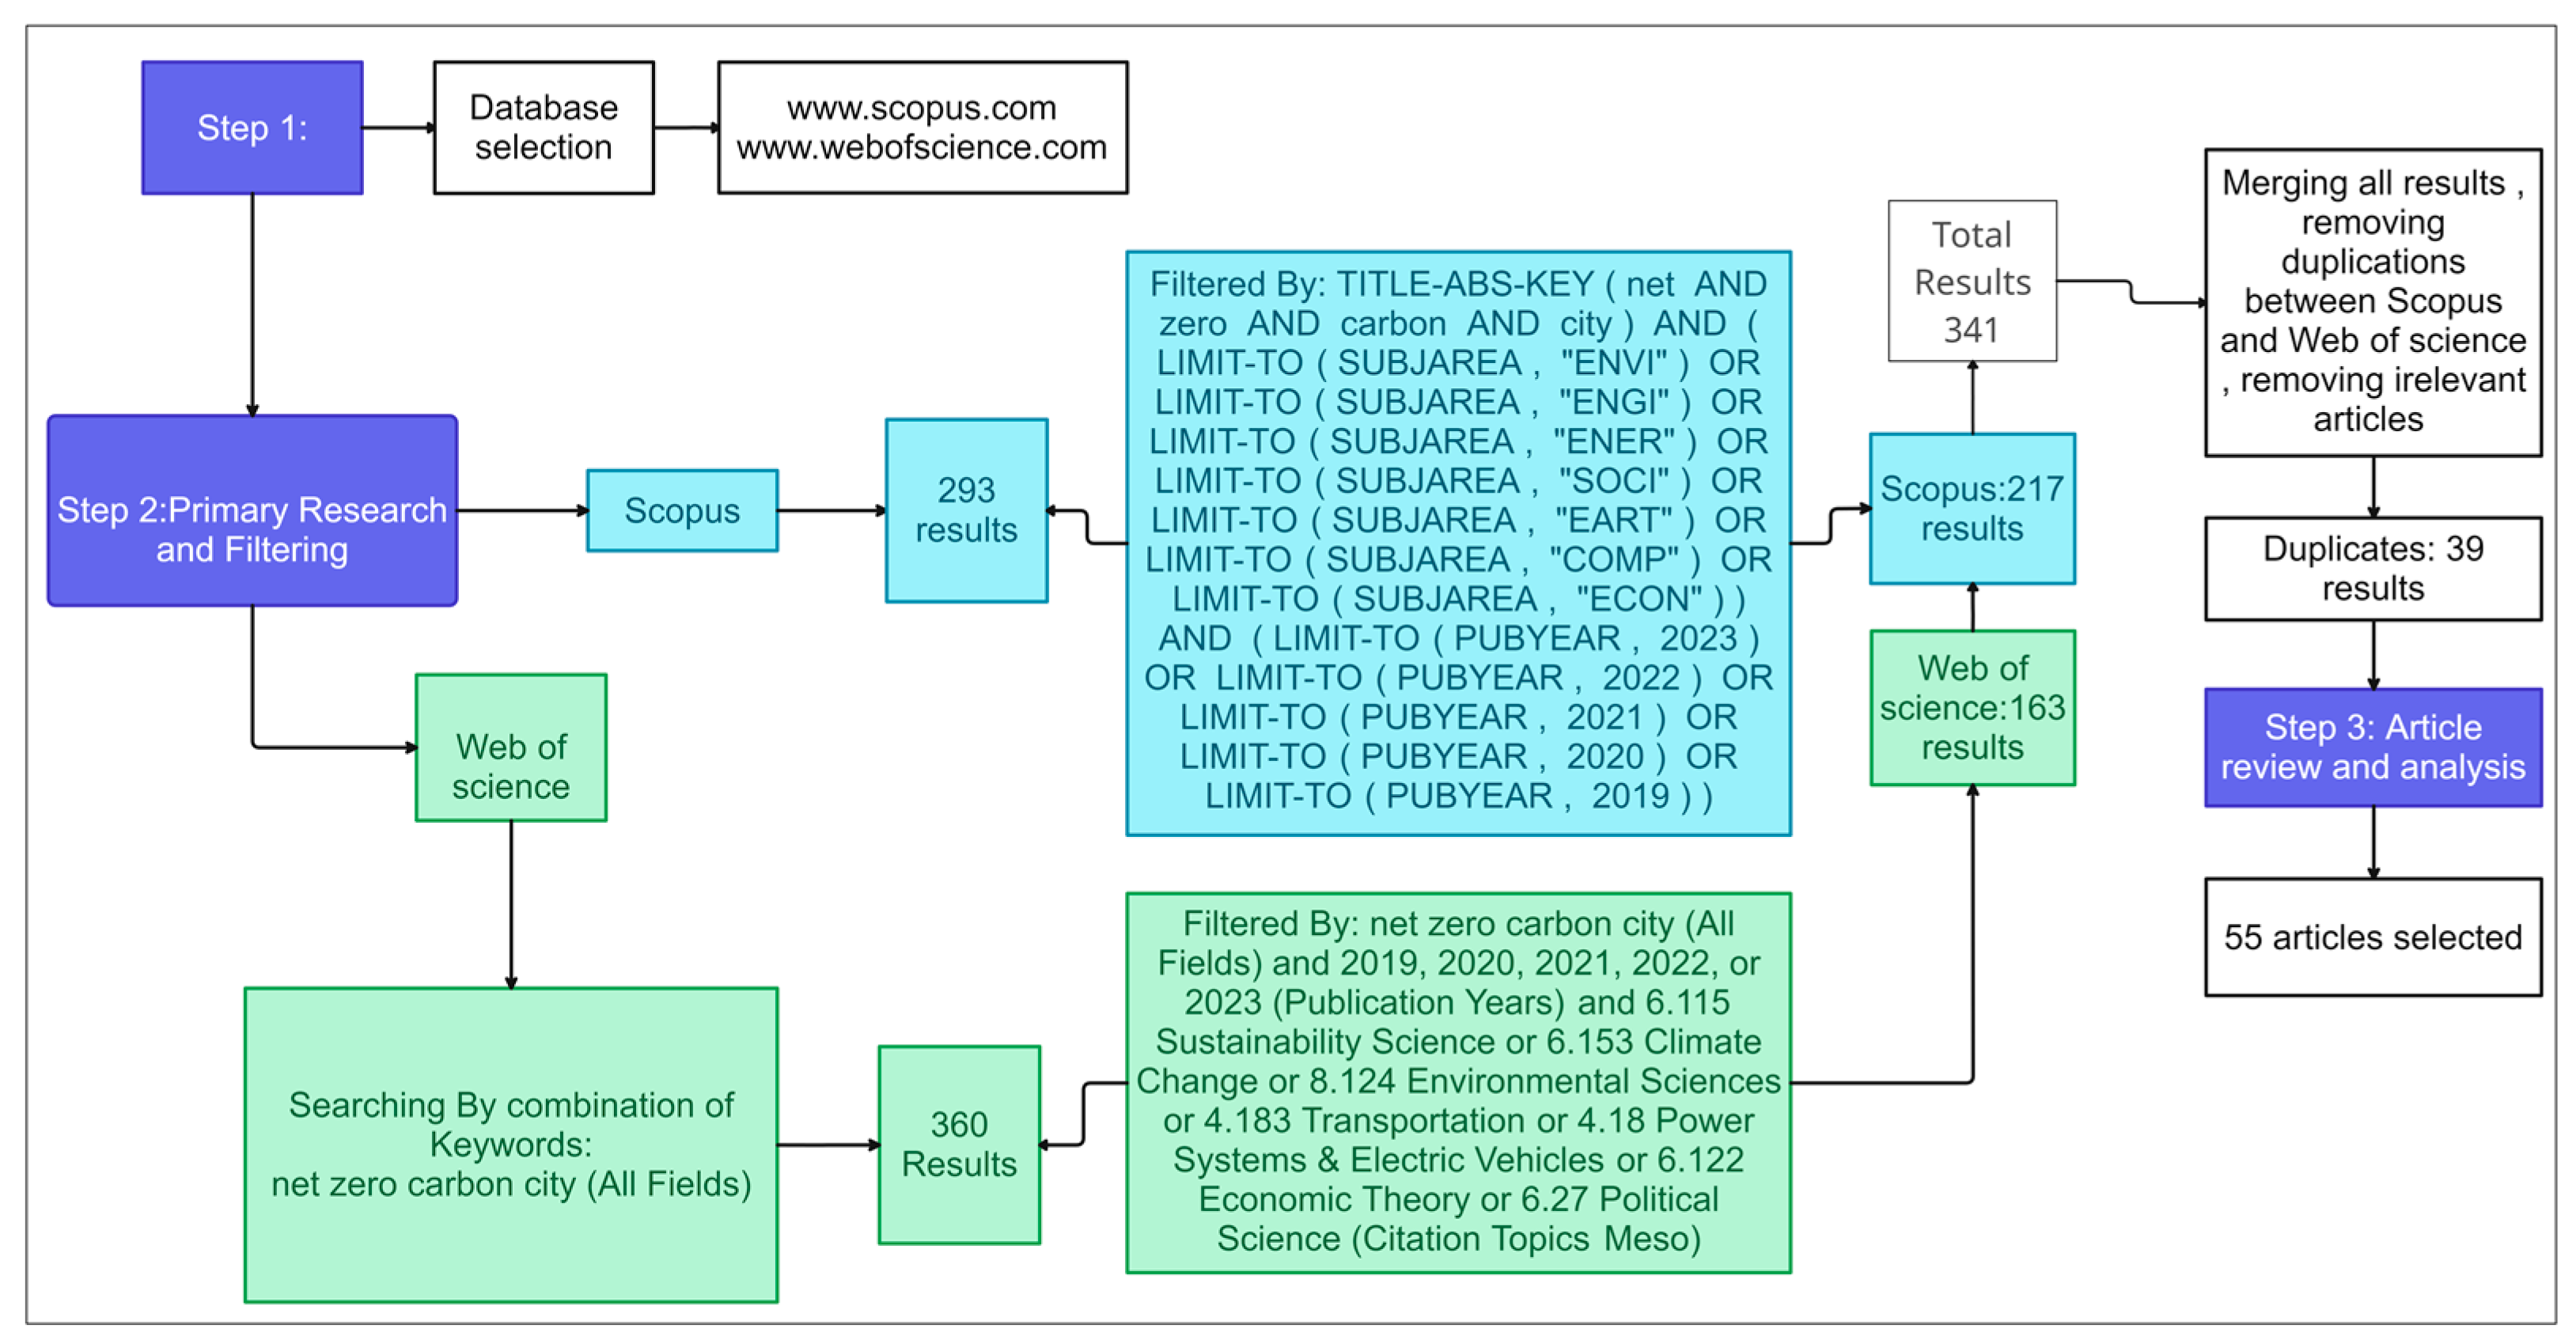
3. Methods and Data Collection

This paper discusses the issues that data-driven net-zero cities encounter and future research objectives with a practical focus on solving real-world issues. The approach to investigation can be divided into initial data gathering and content analysis. The Web of Science and Scopus databases were selected as the search engines for the quantitative analyses of the content and the literature.
In this phase, the task entailed meticulously curating pertinent publications about ongoing research. Specifically, the focus was on the themes of “Net-Zero Carbon City”, “data-driven approaches”, and “city digital technology”. These publications were carefully selected from Scopus and Web of Science. The rationale behind selecting these databases is their ability to offer a comprehensive range of articles related to the research topic. Considering the results from both databases minimises the likelihood of overlooking any pertinent papers. The methodology proposed for article selection is depicted in Figure 2. In February 2024, a systematic search was conducted on selected databases utilising titles, abstracts, and keywords to obtain relevant papers on data-driven NZCCs.
Furthermore, “AND” and “OR” Boolean operators are utilised to enhance the precision of our search outcomes, reducing screening duration and excluding extraneous studies. A total of 653 relevant articles were identified, and specific criteria were employed for the inclusion and exclusion of papers, considering factors such as paper type, language, and study area. As a result, a total of 341 distinct articles was chosen for subsequent examination.

3.1. Research Inclusion and Exclusion Criteria

The major criterion for selecting studies for inclusion was their relevance to the NZCC concept. The temporal dimension was significant, and based on this parameter, the years February 2019 to February 2024 were selected as a time constraint based on the start of COVID-19 up to the most recent studies, to explain more about research during a period in which cities faced the pandemic impact up to the development of NZCCs. The most recent five-year study identified the most current utilisation of the research database.
As per the inquiry’s findings, it ascertained that the investigation encompassed crucial research about NZCCs. The study encompassed various subjects, including sustainability, global warming, zero carbon emissions, GHG emissions, carbon footprint, and black carbon. Understanding these keywords helps illustrate the concepts and importance of providing critical and confidential definitions and applications for NZCCs.
The issue of carbon emissions is related to multiple social elements, including social, economic, and environmental aspects. Understanding the utilisation of data and digital technologies for a NZCC is crucial to creating a city with carbon neutrality, and it is the key to unlocking the new era of future research on sustainable city development. The visual aid illustrates the paper selection procedure, whereas Table 1 comprehensively summarises the subject.
Table 1 summarises the initial research into key terms and words, which helped us to better understand the areas needed for further research. The number of papers found for each selection string or group of keywords shows the research areas where higher or lower studies have focused so far. There is less research or study on digital platforms for NZCCs in these databases, but we also need to conduct a desktop review to understand whether there has been any GIS-based platforms developed so far. Some inclusion and exclusion criteria used in the paper selection through the database indicate the need to study the data-driven net-zero carbon city.
This study analysed the keywords used in the 341 studies chosen for a systematic review. The keywords used for generating the visualisation maps are articles that are frequently cited and were selected for co-occurrence analysis. The findings are depicted in Figure 3 and Figure 4, where the nodes’ magnitude refers to the frequency of the keyword’s occurrence, whereas the width of the line denotes the degree of their interrelatedness. The general key terms identified were “Carbon emission”, “smart city”, “emission control”, and “Carbon footprint”. After that, we used the search engine Scopus to find related studies to compare with the results from the Web of Science to see the coverage results. Finally, we wanted to find out what research has already been carried out in previous studies and fill the research gap.
The following transcript from the database “Scopus” is the searching query string used for identifying the related papers for research:
TITLE-ABS-KEY (net AND zero AND carbon AND City) AND (LIMIT-TO (SUBJAREA, “ENVI”) OR LIMIT-TO (SUBJAREA, “ENGI”) OR LIMIT-TO (SUBJAREA, “ENER”) OR LIMIT-TO (SUBJAREA, “SOCI”) OR LIMIT-TO (SUBJAREA, “EART”) OR LIMIT-TO (SUBJAREA, “COMP”) OR LIMIT-TO (SUBJAREA, “ECON”)) AND (LIMIT-TO (PUBYEAR, 2023) OR LIMIT-TO (PUBYEAR, 2022) OR LIMIT-TO (PUBYEAR, 2021) OR LIMIT-TO (PUBYEAR, 2020) OR LIMIT-TO (PUBYEAR, 2019))
What stands out after searching in the Scopus search engine is that 217 documents were found; Figure 3 provides the results of visualising the most relevant paper keywords deriving from the search outcomes. After that, we wanted to know the most frequently occurring key terms in the search papers.
Figure 3 demonstrates that after finalising the search results into the VOS viewer to generate the visualisation maps for the keywords in those searching papers, keywords with a minimum of three co-occurrences had a larger size of the circle, representing the key terms which occurred more frequently in the literature. The different colours indicate key terms that will be placed into one cluster with closer relevance. As we can see from Figure 3, “Greenhouse gases”, “Carbon emissions”, “energy utilisation”, and “emission control” are the frequently occurring results.
The following transcript from the database “Web of Science” is the search query string used for identifying the related papers for research:
NZCC (All Fields) and 2019, 2020, 2021, 2022, or 2023 (Publication Years) and 6.115 Sustainability Science or 6.153 Climate Change or 8.124 Environmental Sciences or 4.183 Transportation or 4.18 Power Systems & Electric Vehicles or 6.122 Economic Theory or 6.27 Political Science (Citation Topics Meso)
After plugging in the search keywords, 163 documents were found in the Web of Science database, packing the results into the VOS viewer. Figure 4 indicates the visualisation of the most relevant paper keywords deriving from the search outcomes, and the size of the dots indicates the frequency of keyword co-occurrence. The keywords “Carbon neutrality”, “sustainability”, and “optimization” are the most frequently occurring keywords in the generated results.
In conclusion, Table 2 provides precise results when searching for the keywords “net-zero carbon city” using two different databases, and there are 293 papers from the Scopus database and 360 from the Web of Science database. Finally, after reviewing the keywords and abstracts, 55 papers were found in the data-driven urban planning category search. After applying duplication checks on the papers from the Scopus and Web of Science search results to, thirty-nine duplications were found.

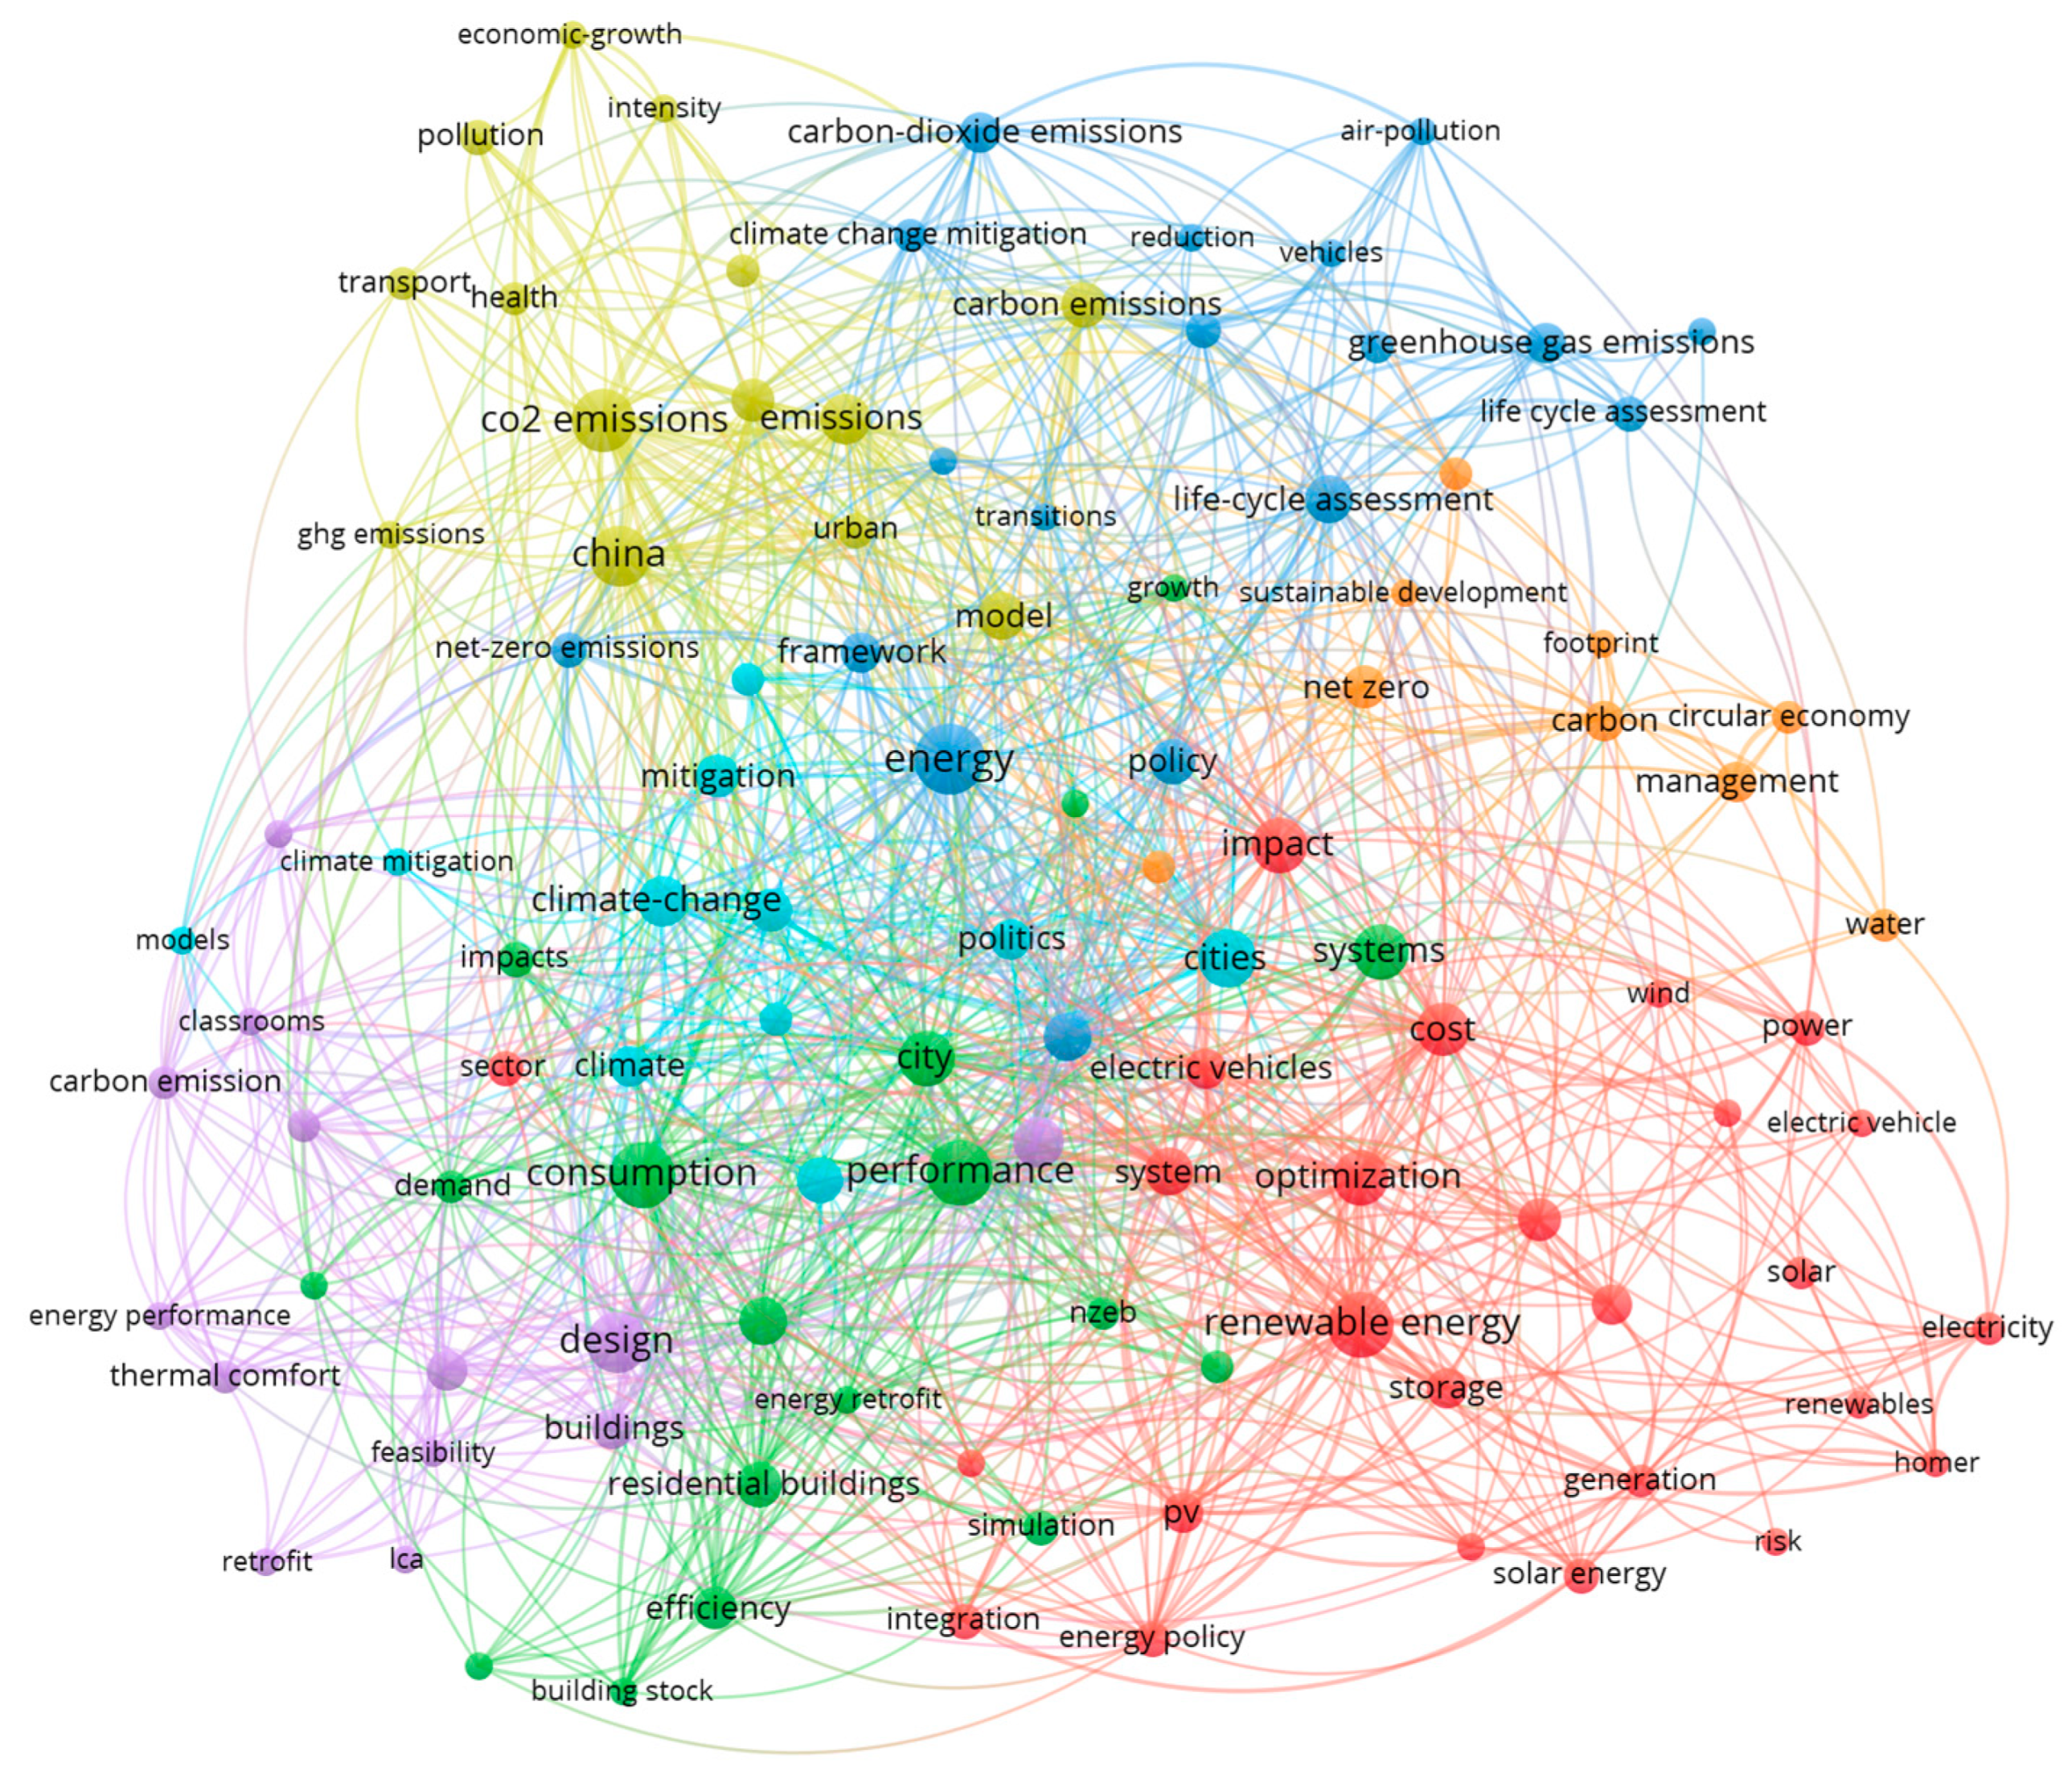
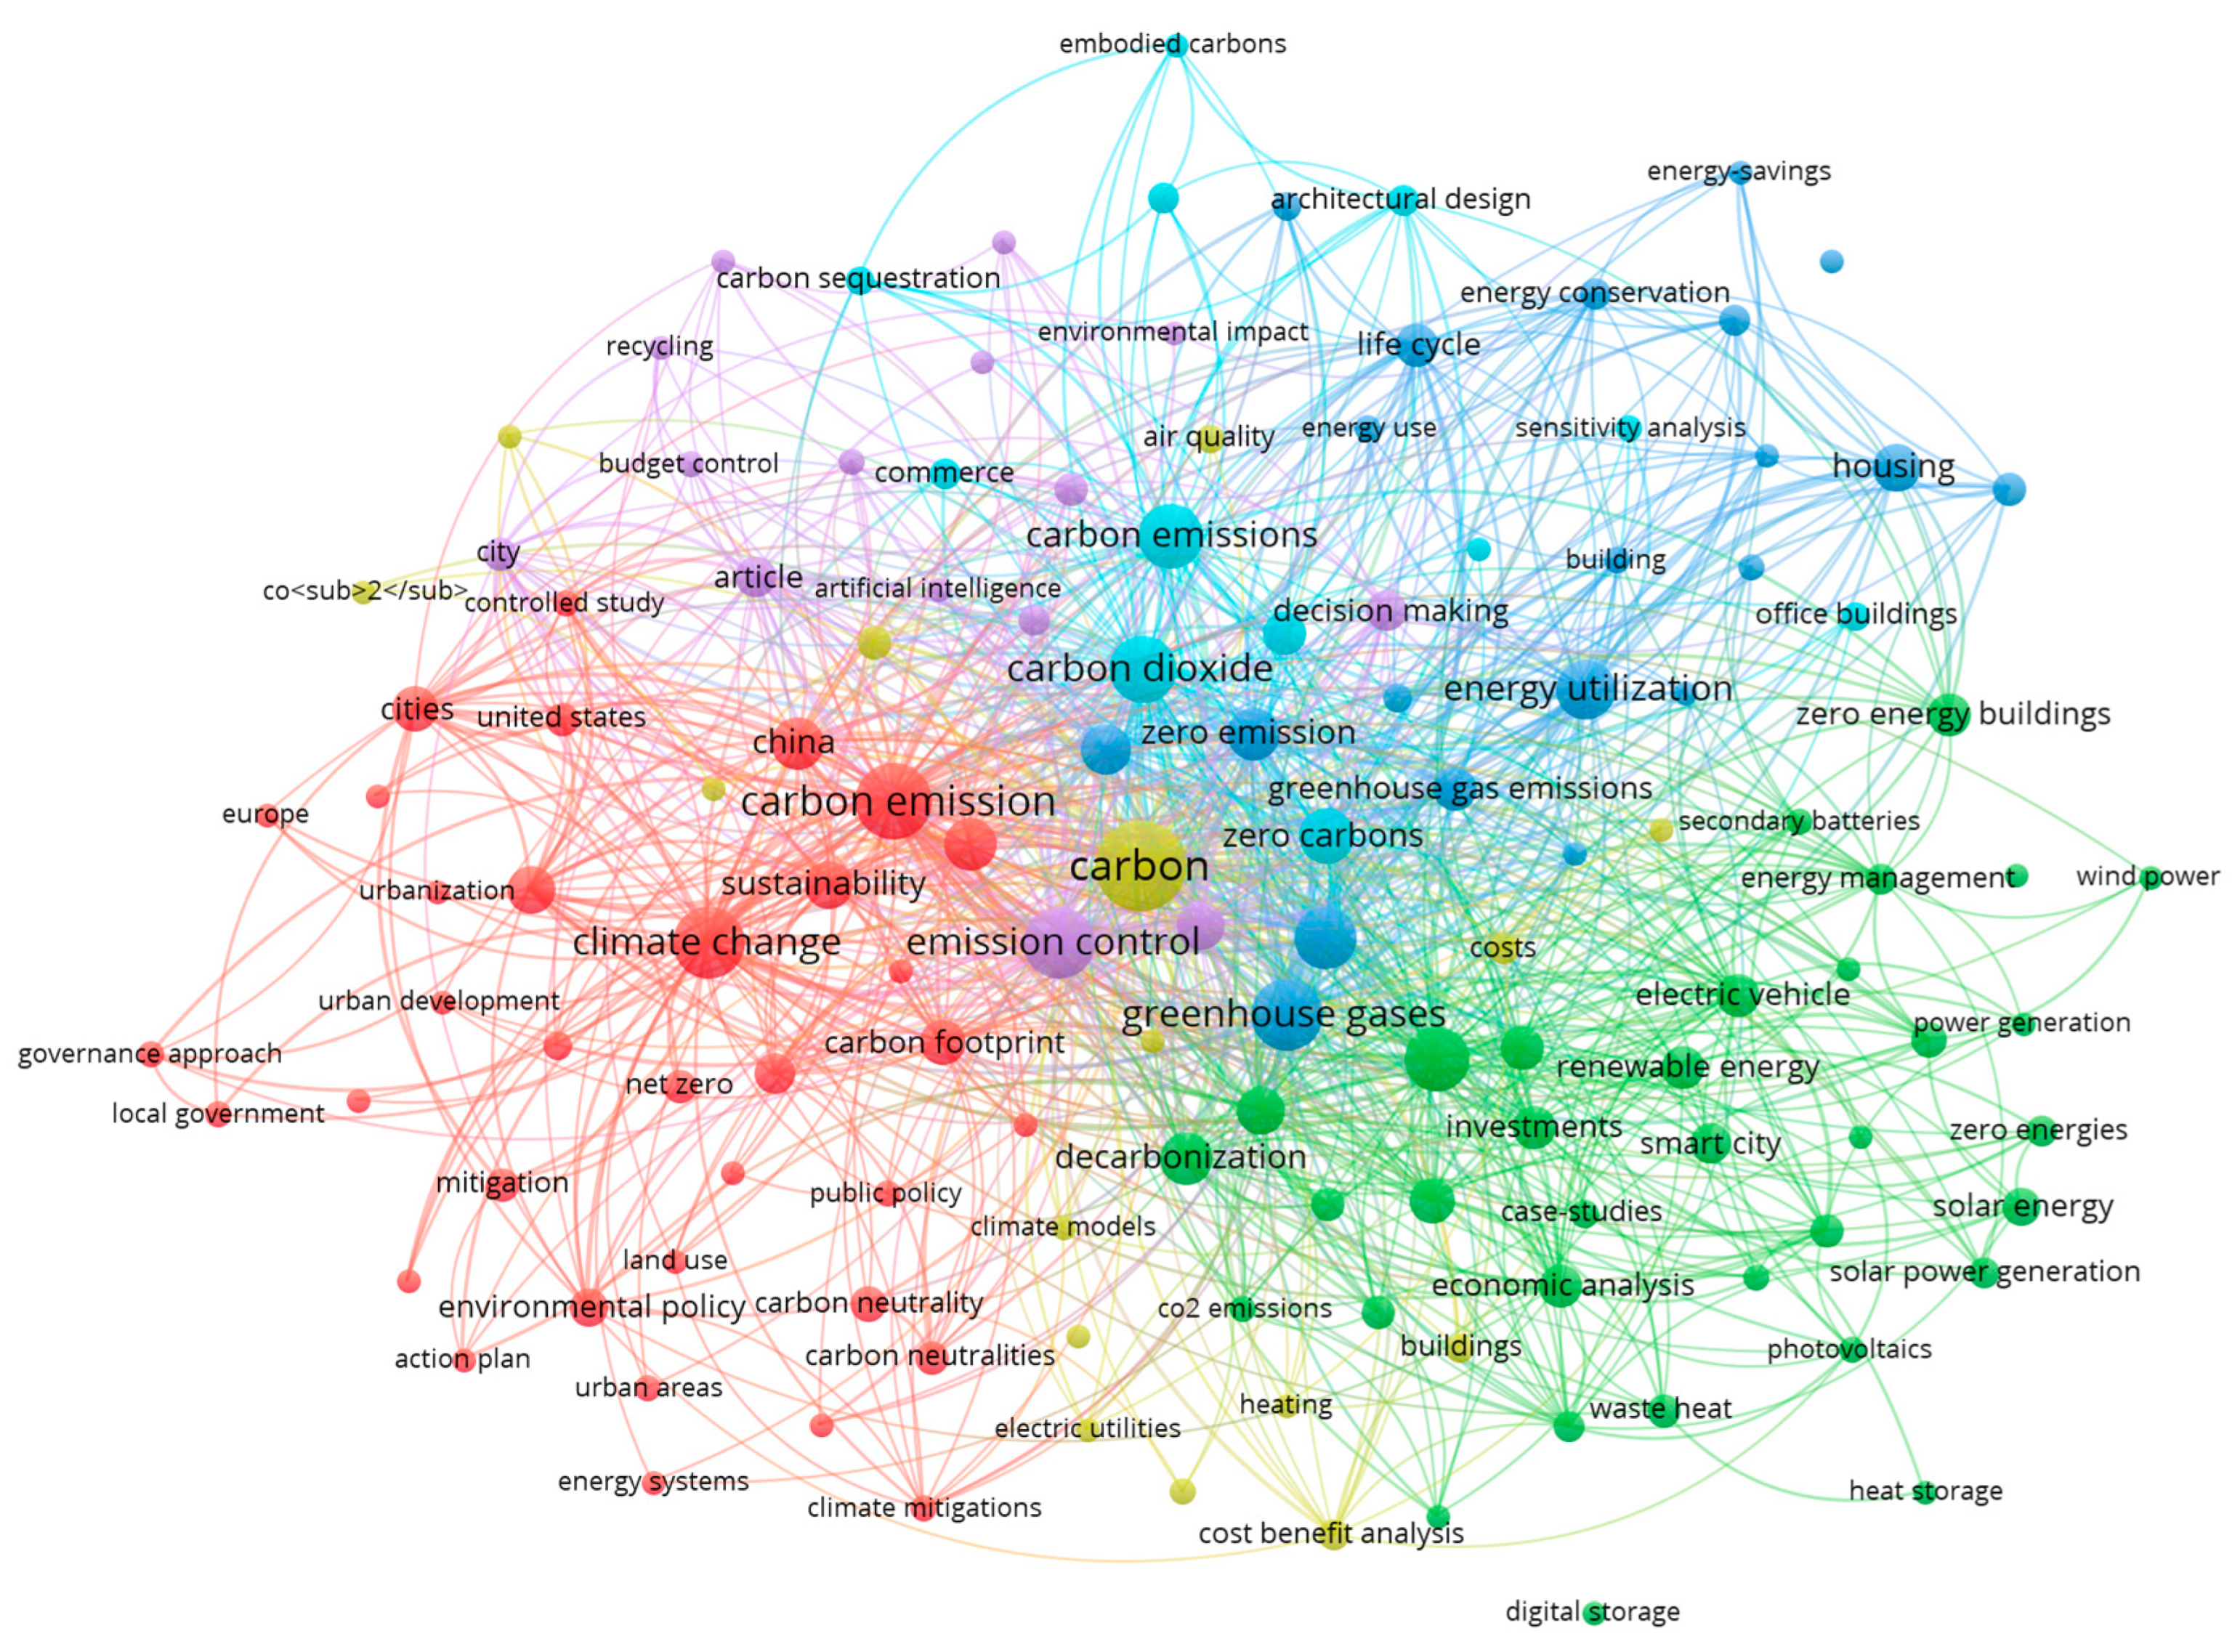
3.2. Frequently Used Terms and Key Terms Used in NZCC-Related Research

Figure 2 and Figure 3 show key terms that are frequently used in net-zero carbon initiatives, and which are essential to understanding how NZCCs support environmental, social, and economic fields in urban development. In addition, there are multiple perspectives for understanding the relationship between NZCCs and urban development; Below is a summary of the definitions and contributions of each frequently used term in NZCCs.
Global warming—This is regarded as the prolonged elevation in the Earth’s mean temperature caused by human activities, particularly the release of greenhouse gases like carbon dioxide (CO2), nitrous oxide (N2O), and methane (CH4) [18]. This occurrence is primarily linked to the industrial practices on which our modern civilization relies, including the combustion of fossil fuels and deforestation [19]. Increasing carbon emissions contribute to global warming concerns and adversely affect climate change within urban regions.
Zero emissions—Zero-emission buildings and industrial processes also form part of this paradigm shift towards more sustainable practices [20]. The attainment of a zero-emission future is a universally recognised international objective that seeks to mitigate the adverse consequences of human actions on Earth while establishing an equilibrium between the quantity of GHG emissions generated and the quantity of GHG emissions withdrawn [21].
GHG emissions—Green House Gases (GHGs) refer to gases containing water vapor, ozone, nitrous oxide, chlorofluorocarbons, methane, and carbon dioxide [22]. These emissions contribute to warming the Earth. Carbon dioxide is the most significant GHG produced through the process of burning fossil fuels, as well as deforestation and land use changes [23]. Methane, another type of GHG, is emitted during the production of coal and natural gas, as well as by livestock and other agricultural practices [24]. In addition, nitrous oxide is often found to come from the emissions of agricultural and industrial activities. While less common, fluorinated gases are often used in industrial applications and are particularly potent as they can stay in the atmosphere for a long time [25]. The attainment of a zero-emission future is a universally recognised international objective that seeks to mitigate the adverse consequences of human actions on Earth while establishing an equilibrium for greenhouse gas emissions [21].
Carbon footprint—This is explained as the total amount of greenhouse gases a person, family, or company puts into the air each year. Greenhouse gas emissions from fuel that a person burns directly, like when heating a home or driving a car, are part of their carbon footprint [26].
Black carbon (B.C.)—B.C. refers to one of the most important aerosol species due to the enormous impact of regional influence on radiative and urban environmental health [27]. In addition, black carbon also has the characteristics of particulate matter (PM), which absorbs light and reduces atmospheric visibility [28].
In addition, during the process of literature review of NZCCs, we also found several similar concepts related to the development of NZCCs, such as Net Zero Energy Districts, Net Zero Emissions Energy System, and Net Zero Energy Buildings, which can be used to further understand the components of NZCCs and how NZCCs can be facilitated into the path to achieve the goal of zero carbon emissions.

4. Preliminary Concepts of Net-Zero Carbon Cities

Net Zero Energy Districts, Net Zero Energy Emission Systems, and Net Zero Energy Buildings share similar strategies in addressing energy usage and carbon emissions. In addition, those terms are also frequently used for a city aiming to achieve zero carbon emissions. These terms exhibit similar characteristics that align with environmentally sustainable development, and which aid in creating cities with a primary goal of achieving net-zero carbon emissions. Table 3 includes the definitions available in the literature for each equivalent terminology relevant to NZCCs.
Among the definitions in Table 3, the definition of NZED and the idea proposed by Kominos [29] stand out due to its innovative comprehensiveness, which involves integrating specific measures (discussed below) to facilitate the transition towards NZED.
These measures include implementing smart city strategies and applications to optimise and conserve energy, and adopting renewable energy systems compatible with local districts. In addition, in this concept and approach, there is a significant emphasis on renewable energy and attaining a balance resulting in zero carbon emissions [29]. Indeed, the transition model helps to investigate the effects of measures that can be feasible to facilitate the transformation toward NZED. The measures of the transition encompass three distinct entities:
(1)
Individuals, regarding their choices concerning energy investment and conservation, finally contributing to achieving NZED.
(2)
Communities establishing district planning and operation regulations to encourage community engagement in developing regulations and policies for NZED.
(3)
Advanced technologies (AI, 3D GIS, BIM) and machines necessary for data analytics, robotisation, and real-time adjustment.
The utilisation of the NZED model has demonstrated the interdependence of behaviours and capabilities across all levels of analysis. Furthermore, it has also been established that a high level of connected intelligence is required to transition to NZED successfully [29]; the Net-Zero Emission System also requires a high level of connected intelligence to increase energy utilisation efficiently. Net-Zero Emission Systems are anticipated to differ significantly from the current energy systems, leading to difficulties in adopting advanced technologies. These differences encompass alterations in demand, behaviour, and operations, as well as the adoption of new technological alternatives [30].

5. Global Cities’ Strategies and Policies Towards Achieving Net-Zero Goals

Carbon emission reduction has become an urgent global issue in every country; associate cities have started to manage the reduction policies and strategies to support carbon emission reduction. As Table 4 demonstrates, countries worldwide have set a goal for the year to achieve the NZCC objective [32]. Each country has started using specific cities as experimental trials in this global mission to establish a standard for achieving the goal of NZCCs.
Table 4 shows years in which different countries aim to achieve the NZCC goal and further reflects that 84% of these countries have aimed for 2050 as the year of achieving NZCC targets. The only country that aims for 2030 to achieve the NZCC target is Mauritania. Moreover, Sweden is aiming for 2045. On the other hand, there are two countries, i.e., China and Russia, which are aiming for a later year, i.e., 2060, compared to other countries [32]. These differences in the target year for achieving NZCC could come from the priorities of these countries regarding their own issues.
As Table 5 shows, different countries set timelines to achieve NZCCs and the associate-specific policy that associate cities use in different countries [32], which indicates that the Net-Zero Carbon mission has already become one of the urgent environmental accomplishments for governments to discuss and achieve on an urban scale.

6. Using Advanced Technologies for NZCCs

Monitoring and observation technologies, such as remote sensing data collected by satellites, can detect differences in carbon storage on Earth. For example, Jiang et al. (2023) analysed the disparities in (impervious surface area) ISA growth and its associated effect on carbon storage between urban and rural regions by using remote sensing data for soil sampling [33].
Implementing net zero emissions requires significant transformative measures at both the societal and industrial levels, redirecting development towards technological innovation to achieve net zero emissions [34]. The local and regional development of NZCCs relies on digital technologies and data-driven methods to process the transition from the smart city movement to a more urbanised decarbonisation technology revolution period [35]. Indeed, digitalisation technologies show clear evidence of digital governance’s effectiveness in reducing carbon emissions in the local area [36]. Moreover, digital technologies and data-driven net-zero carbon emissions in terms of development should employ a standardised approach rather than relying solely on inadequately harmonised statistical data to process future sustainable development [37]. In addition, it is necessary to understand the possibility of using digital technologies as essential in reducing carbon emissions, and there is evidence that data-driven methods and digital technologies for NZCC development can potentially help mitigate the negative impact of carbon emissions.
Table 6 shows multiple studies that used data-driven methods and digital technologies for estimating and predicting carbon emissions. Some of these methods estimate residents’ direct carbon emissions, crucial for preventing strategies towards lowering carbon emissions. For instance, a neural network analysis model in China was used to predict each province’s 1999–2019 carbon emissions using temporal data [38]. The neural network models show greater accuracy and minor errors in predicting carbon emissions (Jin, 2021). The results show to China’s objective to set a carbon peak between 2027 and 2032 and accelerate actions towards the final zero carbon emission goal [38].
As Table 7 reports, three-dimensional modelling technology has been employed in the prevalent literature, and predominantly Building Information Modelling (BIM) and Geographic Information System (GIS) technologies have been utilised for big data analysis and modelling. These approaches utilise the well-established method of city digital technologies for the real-time monitoring and technical adjustment of urban carbon emissions, thereby playing a crucial role in expediting the development of NZCCs. The demand for carbon neutrality in urban areas is increasing, leading to the processes and outcomes of building a NZCC on a global scale. On the other hand, there is also a need to understand the functions and relationships between those general 3D technologies and Net-Zero Carbon Cities, which can be utilised to clarify more suitable monitoring methods for adjusting NZCCs’ development.
BIM can be utilised to monitor the buildings’ embodied carbon and carbon emissions in real-time. The system algorithm acts as an energy transition system (electricity meter reader) by simultaneously collecting and analysing data after setting the building information and specific scenarios [45]. Furthermore, the essence of BIM lies in a database built according to architecturally intuitive physical forms that record all data information for each stage, aiding in understanding the data movement and adjusting to retrieve more accurate carbon data [46]. To fully comprehend how BIM can be utilised in the study of NZCC, the BIM characteristics below demonstrate the evidence to support the necessity of exploring multiple possibilities to achieve the digitalisation of carbon emissions.
In the application of 3D GIS, its utilisation has primarily been in urban planning to explain land use development and city master plans. Indeed, 3D GIS can also serve as an analysis tool in NZCC analysis research. With the advancement of information technology, the development of digital cities is rapidly moving towards smart cities. The use of three-dimensional GIS technology in smart cities enables the integration of geographic information, and the advantages of applying 3D GIS technology in smart cities are enormous.
The traditional forms of information primarily consist of two-dimensional geographic data. Three-dimensional GIS technologies can significantly improve the amount of information and its expressive capabilities. As Tao [47] indicated, 3D GIS enhances data accuracy, making the construction and operation of smart cities more stable [47]. Additionally, the application of 3D GIS technology substantially strengthens its visualisation capabilities, enabling city managers to better understand landscape characteristics, spatial layouts, and the overall state of the city through 3D models [48]. The main reasons for increasing the accuracy of 3D GIS are listed below:
  • The 3D data used in 3D GIS are closer to real-world features of natural and manmade objects.
  • 3D GIS algorithms better consider real scenarios happening in the real world, considering additional dimensions of information.
Therefore, this enhanced capability helps to better monitor carbon emissions faster and more efficiently.
Lastly, the visualisation capability of 3D GIS is a crucial characteristic that can provide evidence of a city’s carbon emission status. For instance, a high-performance three-dimensional GIS visualisation system can fully utilise the latest computer graphics research achievements based on efficient 3D spatial data organisation management and dynamic scheduling mechanisms, allowing for local dynamic loading and the optimisation of 3D spatial data across the city [49]. Furthermore, the concept of city digital twins, as explained further below, offers more detailed insights into the research of Net-Zero Carbon Cities.
City digital twin technology is an innovative approach that integrates models, data, and physical entities [42]. A city digital twin (CDT) utilises digital twin technologies to gather digital replicas of the various entities within an urban area. Indeed, developing smart cities drives various industries toward increased intelligence [50]. However, the diverse origins of the data gathered by the intelligent system pose a challenge to its direct integration into the smart city’s IoT infrastructure.
In addition, the advantages of using city digital twins are that professionals in various fields can create a virtual replica of physical objects in a mirror world [51]. As a result, they can remotely monitor, identify, and correct errors by making physical changes to the objects. The addition of 3D GIS real-time monitoring algorithms into the digital replicas of cities provides an opportunity to model the cities’ information in real-time. Lastly, as seen in Table 8, 3D technologies such as BIM and 3D GIS, as well as digital twins of cities and buildings, can be used for monitoring carbon emissions, simulating carbon reduction, and achieving NZCCs. This approach is more explicit and progressive. The most striking difference was the substantial difference in that all 3D technologies aim to comprehensively visualise the dataset and perform multiple data analyses for data transformation.
Artificial intelligence models can predict future patterns and possibilities. Indeed, these models use temporal and simulated data to forecast future patterns of occurrences. In this study context, artificial intelligence can also be used to aid in predicting and drawing the path towards NZCCs using temporal carbon emission data, considering carbon reduction factors.

Carbon Emission Prediction Models

Over the last decade, environmental concerns have raised huge attention regarding human daily life, and particularly the increase in carbon emission variation, which has multiple perspective impacts on human health; the research shows that the concentration of carbon dioxide increased over 30–31% between the years 1700 and 2000 [52], and the importance of the constant increase in carbon emissions and of accurately predicting future carbon emission amounts are considered [53]. As Table 9 shows, plenty of existing carbon emission prediction models contribute to this field of research. The Stochastic Impacts of Regression on Population, Affluence, and Technology (STIRPAT) model [54], the grey system theory [55], and the regression model [56] focus more on accounting for carbon emissions. In addition, Table 10 illustrates the datasets and limitations of these prediction models.
The STIRPAT is an influencing factor prediction method that analyses the influencing factors of carbon emissions and then makes predictions by modelling the correlation between emission data and their influencing factors [68]. The influencing factors in this model are categorised into five fields: energy, urbanisation, economics, industry, and technology. The relationship between influencing factors and algorithms is analysed by combining influencing factors and carbon emissions [68]. Accordingly, the further exploration of artificial intelligence with prediction models is necessary to provide technological support to data analysis and processing through multiple fields of study [69]. In addition, plenty of modified carbon emission models combine the original algorithm with the machine learning and artificial intelligence algorithms as hybrid algorithms for more accurate prediction through more complex data and algorithm processing [70]. Indeed, currently, most of the existing prediction models aim to explore the multiple relationships between socio-economic indicators, carbon emissions, land use, energy consumption, and other important factors [71]. Accordingly, in machine learning methods, Ma and Wang [72] used the Game Model to retrieve the relationship between energy economy maximisation and carbon emission minimisation based on a Deep Neural Network. Then, Ma and Wang [72] also made the comparison between three prediction models, the deep neural network, wavelet neural network, and radial basis function (RBF) neural network, based on the prediction index of mean absolute error (MAE) and mean square deviation values. In this model, the depth neural network shows better performance in the prediction of carbon emissions and keeps the error within 5% (low).

7. Challenges and Opportunities

Data-driven NZCCs’ priority target is to reduce city-scale carbon emissions in the long term, with net zero emission as its primary goal. Previous studies have indicated numerous optimisation technologies or algorithms that can fulfill different categories of optimisation processes on carbon emission prediction models. Table 10 summarises the opportunities and challenges we found for various technical, social, and environmental categories.

7.1. Opportunities Associated with Net-Zero Carbon Cities

The authors have identified three categories of opportunities for NZCC studies, as explained below. These categories comprise environmental opportunities, social opportunities, and technical opportunities.

7.1.1. Opportunities Associated with the Environmental Aspect

The depletion of non-renewable resources due to worldwide industrialisation and other environmental hazards, including vast amounts of fossil fuels, deforestation, and waste incineration, has led to a considerable increase in GHG emissions in the atmosphere [73]. In addition, the rise in carbon emissions has ultimately resulted in environmental deterioration, such as escalating global temperatures and melting polar ice caps [74].
Society needs to enhance its capacity to evaluate environmental aspects, such as emissions, air quality, and greenspace, to obtain a detailed understanding of the urban environment [75]. This also leads to the statement that the achievement of NZCCs provides multiple benefits, including carbon emission reduction and decreased energy consumption, which provide opportunities for climate change mitigation and environmental protection. Furthermore, attaining NZCCs will contribute to the reduction in adverse environmental effects and the deceleration of the escalating global temperature, which further proves that attaining carbon neutrality with NZCCs as guidance has become a huge opportunity for many nations. This has emerged as a crucial goal in contemporary times and is considered as one of the plausible remedies to tackle the problem of climate change.

7.1.2. Opportunities Associated with the Social Aspect

The transition towards NZCCs significantly raises many social opportunities to enhance community well-being and social cohesion. One of the most compelling benefits is the potential for creating a more equitable and inclusive urban environment. For example, NZCCs enable the prior target of reaching zero carbon emissions in urban areas to be achieved, and also provides a unique place for people to have social networks. The air quality shows a significant impact on residents’ life satisfaction [76]. By prioritising green infrastructure and affordable, sustainable housing, cities can solve longstanding environmental justice issues, ensuring that all residents, regardless of socio-economic status, have access to clean air, green spaces, and energy-efficient homes.
Additionally, the shift towards a green economy is poised to generate a surge in job opportunities in renewable energy, green construction, and sustainable transportation sectors, offering pathways to employment and skill development for diverse community members. This transition also presents a unique opportunity to foster stronger community ties and engagement, such as collaborative projects like community gardens, energy co-operatives, and sustainability workshops can bring residents together, promoting a sense of belonging and collective investment in the city’s future. The move towards NZCCs could catalyse social innovation, leading to more vibrant, connected, and resilient communities.

7.1.3. Technical Opportunities: Necessity of Developing NZCC Digital Scenario Planning Tools

The progress development of the Net-Zero mission has shown that the best prediction and mitigation strategies are based on the data and technologies we can collect and then on making the best decisions.
For effective monitoring and evaluating of the process of achievement of NZCC goals, there is a need for the future development of NZCC digital technologies and tools [77], such as scenario planning tools, to facilitate the process of zero carbon emissions by using the capabilities of GIS, AI, and BIM digital technologies for large-extent urban areas. In the meantime, urban planners benefit by utilising these tools in correlation with the strategies for cities, which provide more accurate and precise data analysis to modify the negative impact of urbanisation and climate change consequences.
In addition, NZCCs should not be the sole goal of urban planning and city development. This city development needs to be combined and evolve, shifting cities towards being more suitable places for human lives with an environmentally friendly focus. For such an aim, technical upgrades will assist in making human lives more sustainable in the future. Below, we have explained our findings on technological opportunities for further studies in the field of research on NZCCs.

7.1.4. Advancing AI and GIS-Based Technology Opportunities

AI and GIS technologies provide opportunities for the simulation, visualisation, and prediction of carbon emissions and carbon reduction in cities. Also, the optimisation of models and algorithms in combination with AI can be further developed in GIS environments for studies of NZCCs. For example, the carbon emission prediction model Back Propagation Neural Network (BPNN) consists of AI technologies that can be utilised for the prediction of building carbon emission trends; this AI-related carbon emission prediction algorithm can also be optimised for integration with GIS technologies for urban planning monitoring and predicting the carbon emission status on an urban scale. Spatio-temporal analysis for monitoring and predictions of carbon emission and reduction is also another avenue we recommend for the focus of future studies when fuelled by the power of AI-optimised models.

7.2. Challenges

In addition to the opportunities detailed above, the authors found three categories, environmental, social, and technical, for aspects of challenges for NZCCs, as explained below. These challenges can be the subjects of future studies based on this research.

7.2.1. Challenges Associated with Environmental Aspects

The exploration of research on NZCCs includes environmental challenges that necessitate thoughtful solutions. One of the primary concerns is the ecological footprint of constructing green infrastructure. The achievement of NZCCs requires several components to finalise; the most important factor is constructing and transporting new green energy infrastructure with monitoring sensors to monitor the carbon emission change [78]. In addition, producing and transporting materials for renewable energy infrastructure, like solar panels and wind turbines, has significant environmental impacts, including habitat disruption and resource depletion. Furthermore, the transition to a net zero urban landscape usually requires substantial land use changes, such as increasing green space, renewable energy infrastructure installation, and energy-efficient buildings, which also leads to the loss of biodiversity and natural habitats if not managed carefully.
Urban densification is one of the solutions considered a crucial approach to decrease carbon emissions, and requires the careful management of land use changes to ensure the preservation of green space, which is also essential for biodiversity, stormwater management, and urban cooling. In addition, the dependence on specific renewable energy system techniques, such as battery storage, to achieve net zero status gives attention to worries over the sustainability of resource exploitation and the possibility of contamination.

7.2.2. Challenges Associated with Social Aspects

There are multiple challenges associated with the social impact of carbon emissions in cities, including extreme weather conditions due to the increase in carbon emissions. Such extreme weather conditions can lead to the collapse of residential buildings and the loss of human life. Finally, this can result in habitat destruction and food scarcity, which can significantly disrupt the prevailing social structure.
Furthermore, the disruption of the biological food web due to extreme weather events can cause irreparable harm to the ecosystem, leading to the eventual inability of human beings to sustain their daily life and the consequent destabilisation of societal structures [79]. For instance, rising sea levels cause some island nations and coastal cities to become completely submerged, resulting in substantial human displacement and possible conflict and threatening the stability of global society as a whole [80]. Moreover, new cities’ environmental development causes shifts in some of the previous economic activities or enterprises, such as an existing coal industry. The environmental protection strategies require less air pollution produced from industrial activities that cause damage to the current living environment, resulting in industries expecting to experience further job losses quickly.

7.2.3. Technical Challenges Associated with NZCCs

The urban planner’s perspective promotes the achievement of the goals of zero carbon and sustainable development for the city, which necessitates a prolonged cycle [81]. Therefore, enhancing and encouraging the precision and comprehensiveness involved in assessing the city’s inherent ability to absorb carbon through natural resources is the primary target to improve the city’s development, achieving Net-Zero Carbon Emissions.
On the other hand, the construction of carbon-neutral cities can be facilitated by providing comprehensive data and technological support for carbon policies [82]. In the meantime, the increasing urban development and modernisation of digital technologies have supported cities in their governance and planning. Studies on the utilisation of digital technologies imply that the rapid development of low-carbon cities is inextricable from their dependence on science and technology, and that the same level of development entails the development of low-carbon cities [81], which also implies the further development of NZCCs. For instance, GIS, BIM, and the digital twin of a city can be used to analyse past and existing carbon emission data using robust computer data calculation algorithms and analysis. These technologies can construct more accurate prediction models for accurate forecasts and deliver more effective and optimised technical support and solutions for achieving NZCCs.

8. Discussion

This article contributed to identifying the impact of utilising the data-driven method in achieving NZCCs worldwide. We discussed how the data-driven method approach provides more comprehensive support for informed decision-making, policy, and strategy development and modification at an urban scale.
The preliminary concept of a NZCC was analysed based on the systematic literature review regarding the search for relevant studies. The strong relationship between SDGs (i.e., SDG 3, SDG 7, SDG 8, SDG 11, SDG 13, and SDG 17) and the future development of NZCCs is identified in Figure 1. After going through a systematic literature review, the terminology and definition of NZCCs can be identified as essential to achieving the international sustainable development goals. In detail, reducing carbon emissions is the prior target to achieve by optimising the previous carbon emission prediction models. We also studied the impact of achieving NZCCs in different cities around the world through significant case studies and reviewed their corresponding supportive approaches to identify the importance and urgency of the NZCC goals for each of these cities.
We found that prior studies, which have noted the importance of identifying the preliminary concept of NZCC with multiple perspectives, emphasised the NZCC contribution to sustainable urban development goals for environmental protection and cooling cities. This finding is in line with Wimbadi and Djalante et al.’s (2020) findings on the strong relationship between NZCCs and SDGs [83].
In addition, we propose utilising the carbon emission prediction models within GIS or digital twin platforms. Furthermore, this study emphasises the importance of a data-driven method and digital technologies for carbon emission monitoring through the monitoring process of achieving NZCCs on an urban scale.
The carbon emission factors are also identified to be further monitored and predicted with a data-driven approach, especially utilising advanced technologies such as optimised AI algorithms with emission prediction models to make high-accuracy and stable predictions. Furthermore, we thoroughly reviewed the sampling prediction results and visualisation modelling with GIS or digital twin platforms.
This study has proved the importance of data-driven methods and digital technologies in the study of Net-Zero Carbon Cities. However, the corresponding NZCC policy and strategies associated with the code of ethics and government regulations are not identified, and the standard that can be used to testify to the level of achievement was not discussed in this study, which is also important for future research directions to understand the progress.
As mentioned in the literature review, the continuous advancement of artificial intelligence, especially the evolution of AI algorithm optimisation and the application of machine learning methods in predicting carbon emissions, is becoming more feasible and comprehensive.
By combining AI algorithms with these previous carbon emission prediction models, we can dramatically improve the accuracy and stability of our predictions. The addition of AI algorithms optimises the data analysis process. It increases the processing of sampling results and enables models to process real-time data and provide support when decisions need to be made simultaneously. This advancement is essential for environmental scientists when making emission predictions for future research purposes. Furthermore, it also has implications for policymakers’ decisions, as they need accurate data to formulate emission reduction strategies and implement environmental strategies. In addition, such data-driven technological advances also demonstrate that global warming and climate change trends can be better understood and predicted, providing a scientific foundation for climate change consequences. By accurately predicting CO2 emissions, we can monitor environmental carbon emission changes more effectively and provide substantial data support for reducing global greenhouse gas emissions and achieving the SDGs. Applying AI algorithms and machine learning models to carbon emission prediction models will enable us to anticipate and respond to environmental challenges with greater precision and efficiency.
Furthermore, the digital platform combines AI carbon emission prediction models with current geographic information systems and digital twin technology. The platform provides policymakers with accurate, real-time data visualisation to help adjust Net-Zero Carbon Emission strategies and future development for cities. Accordingly, the digital platform can also provide the public with visualisations of emission information, which is not only a way to provide information but also an innovative model similar to weather forecasting to help the public avoid physical harm during extreme weather conditions. By integrating these advanced technologies and methods, we can enhance the science and effectiveness of policymaking, increasing public understanding and awareness of climate change and its potential impacts. Such a digital platform, with the precise predictive power of AI and the highly location-based simulation nature of GIS and digital twin technology, provides a powerful tool for sustainable urban development. In this way, we can better assess and respond to the challenges of climate change and achieve green transformation. Moreover, we also identified the potential research directions, as follows:
  • NZCCs corresponding policy and strategy development with data analysis support;
  • The further optimisation of digital platforms with the improvement of data collection reliability;
  • The cyber-security of utilisation of a platform with public access;
  • Extending insights into carbon emission prediction’s influencing factors with correlational analysis to demonstrate emission impacts on an urban scale;
  • The development of AI algorithms with future new multiple emission prediction models;
  • Connections to the digital platform with a data-driven method approach to connect to the government planning system for implementing emission emergency response systems, considering the damage based on the carbon emissions on an urban scale.
The development of NZCCs drives the feasibility of development from multiple perspectives. The hybrid emission prediction model combined with the AI algorithm will significantly help to accelerate the future realisation of NZCCs. In addition, creating the digital platform ensures that urban planners have the most accurate and multivalve data analysis to adapt NZCC strategies. Lastly, the data-driven method plays a crucial role in developing net-zero carbon emission cities, which will change the direction of urban development and guide cities towards developing zero-emission goals.

9. Conclusions

A systematic review of the importance of achieving NZCCs through a data-driven method approach and digital technologies is rare, especially when these are developed to monitor and predict progress towards NZCCs. This paper aimed to fill this gap by conducting a thorough systematic literature review, examining the potential applications of digital technologies, e.g., digital twins, data-driven methods and analytics, and AI, in establishing a NZCC and focusing on developing a research framework and establishing a link between NZCCs and monitoring 3D technologies.
To comprehensively explore this intricate and multi-faceted subject, we employed bibliometric and content analysis techniques to effectively navigate and overcome obstacles encountered during a systematic literature review within this domain.
While the outcome of the bibliometric analysis shows consistent growth in the number of publications in NZCCs, there is still a lack of practice in using digital technologies and optimised AI algorithms for the carbon emission prediction model for NZCC. Using data-driven methods to achieve NZCC will improve the measuring, monitoring, and prediction of the achievement of the Sustainable Development and NZCC goals. Indeed, these data-driven approaches and technologies will contribute to improving the accuracy and correctness of decision-making by:
  • Detecting the areas of concentrated problems to be prioritised and focused on;
  • Identification of the spatial and temporal patterns of success or failure;
  • Predicting the success or failure of the strategies/policies based on success/failure factors.
Indeed, the review of fifty-five selected papers showed that the potential of urban digital twins and AI in environmental planning remained underutilised, particularly regarding the systematic monitoring of carbon emissions and the prediction of the success or failure of the intervening policies/strategies. On the other hand, the variable factors of AI could be another critical element for emission prediction modelling that can accelerate the progress of decision-making by sufficiently analysing relevant data sources. The cooperation of AI technology with data analysis and emission prediction tools is the smart way to make evolutionary progress in achieving NZCC goals.
Using NZCC in urban planning and establishing innovative city models leads to more opportunities for comprehensively improving building energy conversion efficiency, the accuracy of carbon emission prediction on an urban scale, real-time monitoring of the impact of building carbon emissions on cities, and the advantages of city planning. Indeed, the goal of NZCCs is to find quick solutions to the issue of carbon emissions for urban planning and the formulation of carbon emission policies, anticipating and comprehensively solving invisible urban difficulties.
The findings of this paper are crucial for the next generation of research in NZCCs with data-driven methodologies and technological approaches to make better and more accurate decisions for future cities and people’s lives. The study contributes to our understanding of the future development of NZCCs with a data-driven approach and digital technologies in the monitoring process towards achieving a Net-Zero Carbon City. In addition, the further use of AI technology with the digital platform assists in our understanding of the role of the further optimisation of the carbon emission prediction model and decision-making support.
We found that most studies only discuss the use of 3D technology in definition and field utilisations. However, none of the articles or studies outline how to use GIS or digital twin platforms to solve NZCCs’ problems. This shortage, from a practical perspective, is also a problem in realising the true meaning of smart city construction. In general, this new urban concept is still evolving and necessitates efforts from cities worldwide. Thus, it is crucial to establish an open data platform based on specific data disclosure, effective and efficient communication activities, and data sharing to help accelerate the global goal of reaching net-zero emissions. Establishing a reasonable NZCC database for future research and identifying the correct database for accurate research into NZCCs is recommended to generate a detailed analysis based on the Net-Zero Carbon City’s carbon status.

Author Contributions

Conceptualisation, J.L., S.S. and S.M.E.S.; methodology, J.L. and S.S.; software, J.L.; investigation, J.L. and S.S.; resources, J.L. and S.S.; data curation, J.L.; writing—original draft preparation, J.L., S.S. and S.M.E.S.; interpretations and writing—review and editing, J.L., S.S., S.M.E.S. and G.P.; visualisation, J.L. and S.S.; supervision, S.S., S.M.E.S. and G.P. All authors have read and agreed to the published version of the manuscript.

Funding

This research received no external funding.

Institutional Review Board Statement

Not applicable.

Informed Consent Statement

Not applicable.

Data Availability Statement

No new data were created or analyzed in this study. Data sharing is not applicable to this article.

Conflicts of Interest

The authors declare no conflicts of interest.

References

  1. Xu, D.; Abbasi, K.R.; Hussain, K.; Albaker, A.; Almulhim, A.I.; Alvarado, R. Analyzing the factors contribute to achieving sustainable development goals in Pakistan: A novel policy framework. Energy Strateg. Rev. 2023, 45, 101050. [Google Scholar] [CrossRef]
  2. Saba, C.S.; Ngepah, N. Empirics of convergence in industrialisation and their determinants: Global evidence. Discov. Sustain. 2023, 4, 25. [Google Scholar] [CrossRef]
  3. Rees, J. Natural resources, economy and society. In Horizons in Human Geography; Palgrave: London, UK, 1989; pp. 364–394. [Google Scholar]
  4. Wang, F.; Harindintwali, J.D.; Yuan, Z.; Wang, M.; Wang, F.; Li, S.; Yin, Z.; Huang, L.; Fu, Y.; Li, L.; et al. Technologies and perspectives for achieving carbon neutrality. Innovation 2021, 2, 100180. [Google Scholar] [CrossRef] [PubMed]
  5. Naumann, S.; Davis, M.; Kaphengst, T.; Pieterse, M.; Rayment, M. Design, implementation and cost elements of Green Infrastructure projects; Final report to the European Commission, DG Environment, Contract no. 070307/2010/577182/ETU/F.1, Ecologic institute and GHK Consulting; European Commission: Brussels, Belgium, 2011. [Google Scholar]
  6. Szczepańska, A.; Kaźmierczak, R.; Myszkowska, M. Smart City Solutions from a Societal Perspective—A Case Study. Int. J. Environ. Res. Public Health. 2023, 20, 5136. [Google Scholar] [CrossRef] [PubMed]
  7. Lützkendorf, T.; Balouktsi, M. On net zero GHG emission targets for climate protection in cities: More questions than answers? In Proceedings of IOP Conference Series: Earth and Environmental Science; IOP Publishing: Bristol, UK, 2019; p. 012073. [Google Scholar]
  8. Hansen, J.; Kharecha, P.; Sato, M.; Masson-Delmotte, V.; Ackerman, F.; Beerling, D.J.; Hearty, P.J.; Hoegh-Guldberg, O.; Hsu, S.-L.; Parmesan, C. Assessing “dangerous climate change”: Required reduction of carbon emissions to protect young people, future generations and nature. PLoS ONE 2013, 8, e81648. [Google Scholar] [CrossRef]
  9. Sarkodie, S.A.; Owusu, P.A.; Leirvik, T. Global effect of urban sprawl, industrialization, trade and economic development on carbon dioxide emissions. Environ. Res. Lett. 2020, 15, 034049. [Google Scholar] [CrossRef]
  10. An, N.; Mustafa, F.; Bu, L.; Xu, M.; Wang, Q.; Shahzaman, M.; Bilal, M.; Ullah, S.; Feng, Z. Monitoring of Atmospheric Carbon Dioxide over Pakistan Using Satellite Dataset. Remote Sens. 2022, 14, 5882. [Google Scholar] [CrossRef]
  11. Bibri, S.E.; Krogstie, J. A novel model for data-driven smart sustainable cities of the future: A strategic roadmap to transformational change in the era of big data. Future Cities Environ. 2021, 7, 1–25. [Google Scholar] [CrossRef]
  12. Seto, K.C.; Churkina, G.; Hsu, A.; Keller, M.; Newman, P.W.; Qin, B.; Ramaswami, A. From low-to net-zero carbon cities: The next global agenda. Annu. Rev. Environ. Resour. 2021, 46, 377–415. [Google Scholar] [CrossRef]
  13. Stevens, D.; Dragicevic, S.; Rothley, K. iCity: A GIS–CA modelling tool for urban planning and decision making. Environ. Model. Softw. 2007, 22, 761–773. [Google Scholar] [CrossRef]
  14. Zhu, N.; Bu, Y.; Jin, M.; Mbroh, N. Green financial behavior and green development strategy of Chinese power companies in the context of carbon tax. J. Clean. Prod. 2020, 245, 118908. [Google Scholar] [CrossRef]
  15. Thornbush, M.J.; Golubchikov, O. Sustainable Urbanism in Digital Transitions: From Low Carbon to Smart Sustainable Cities; Springer: Berlin/Heidelberg, Germany, 2019. [Google Scholar]
  16. Schrotter, G.; Hürzeler, C. The digital twin of the city of Zurich for urban planning. PFG–J. Photogramm. Remote Sens. Geoinf. Sci. 2020, 88, 99–112. [Google Scholar] [CrossRef]
  17. Ramaswami, A.; Tong, K.; Canadell, J.G.; Jackson, R.B.; Stokes, E.; Dhakal, S.; Finch, M.; Jittrapirom, P.; Singh, N.; Yamagata, Y.; et al. Carbon analytics for net-zero emissions sustainable cities. Nat. Sustain. 2021, 4, 460–463. [Google Scholar] [CrossRef]
  18. Hui, D.; Deng, Q.; Tian, H.; Luo, Y. Global climate change and greenhouse gases emissions in terrestrial ecosystems. In Handbook of Climate Change Mitigation and Adaptation; Springer: Berlin/Heidelberg, Germany, 2022; pp. 23–76. [Google Scholar]
  19. Wood, B.D.; Vedlitz, A. Issue definition, information processing, and the politics of global warming. Am. J. Political Sci. 2007, 51, 552–568. [Google Scholar] [CrossRef]
  20. Nilsson, L.J.; Bauer, F.; Åhman, M.; Andersson, F.N.; Bataille, C.; de la Rue du Can, S.; Ericsson, K.; Hansen, T.; Johansson, B.; Lechtenböhmer, S. An industrial policy framework for transforming energy and emissions intensive industries towards zero emissions. Clim. Policy 2021, 21, 1053–1065. [Google Scholar] [CrossRef]
  21. Rogelj, J.; Schaeffer, M.; Meinshausen, M.; Knutti, R.; Alcamo, J.; Riahi, K.; Hare, W. Zero emission targets as long-term global goals for climate protection. Environ. Res. Lett. 2015, 10, 105007. [Google Scholar] [CrossRef]
  22. Kumar, A. Global warming, climate change and greenhouse gas mitigation. In Biofuels: Greenhouse Gas Mitigation and Global Warming: Next Generation Biofuels and Role of Biotechnology; Springer: New Delhi, India, 2018; pp. 1–16. [Google Scholar]
  23. Yoro, K.O.; Daramola, M.O. CO2 emission sources, greenhouse gases, and the global warming effect. In Advances in Carbon Capture; Elsevier: Amsterdam, The Netherlands, 2020; pp. 3–28. [Google Scholar]
  24. Shirinbakhsh, M.; Harvey, L.D.D. Net-zero energy buildings: The influence of definition on greenhouse gas emissions. Energy Build. 2021, 247, 111118. [Google Scholar] [CrossRef]
  25. Fuge, R. Fluorine in the environment, a review of its sources and geochemistry. Appl. Geochem. 2019, 100, 393–406. [Google Scholar] [CrossRef]
  26. Wiedmann, T.; Minx, J. A definition of ‘carbon footprint’. Ecol. Econ. Res. Trends 2008, 1, 1–11. [Google Scholar]
  27. Streets, D.G.; Gupta, S.; Waldhoff, S.T.; Wang, M.Q.; Bond, T.C.; Yiyun, B. Black carbon emissions in China. Atmos. Environ. 2001, 35, 4281–4296. [Google Scholar] [CrossRef]
  28. Petzold, A.; Ogren, J.A.; Fiebig, M.; Laj, P.; Li, S.-M.; Baltensperger, U.; Holzer-Popp, T.; Kinne, S.; Pappalardo, G.; Sugimoto, N.; et al. Recommendations for reporting” black carbon” measurements. Atmos. Chem. Phys. 2013, 13, 8365–8379. [Google Scholar] [CrossRef]
  29. Komninos, N. Net Zero Energy districts: Connected intelligence for carbon-neutral cities. Land 2022, 11, 210. [Google Scholar] [CrossRef]
  30. Azevedo, I.; Bataille, C.; Bistline, J.; Clarke, L.; Davis, S. Net-zero emissions energy systems: What we know and do not know. Energy Clim. Chang. 2021, 2, 100049. [Google Scholar] [CrossRef]
  31. Wells, L.; Rismanchi, B.; Aye, L. A review of Net Zero Energy Buildings with reflections on the Australian context. Energy Build. 2018, 158, 616–628. [Google Scholar] [CrossRef]
  32. Tracker. Net Zero Tracker. 2024. Available online: https://zerotracker.net/ (accessed on 15 February 2024).
  33. Jiang, H.; Guo, H.; Sun, Z.; Yan, X.; Zha, J.; Zhang, H.; Li, S. Urban-rural disparities of carbon storage dynamics in China’s human settlements driven by population and economic growth. Sci. Total Environ. 2023, 871, 162092. [Google Scholar] [CrossRef]
  34. Dwivedi, Y.K.; Hughes, L.; Kar, A.K.; Baabdullah, A.M.; Grover, P.; Abbas, R.; Andreini, D.; Abumoghli, I.; Barlette, Y.; Bunker, D.; et al. Climate change and COP26: Are digital technologies and information management part of the problem or the solution? An editorial reflection and call to action. Int. J. Inf. Manag. 2022, 63, 102456. [Google Scholar] [CrossRef]
  35. Zeng, J.; Yang, M. Digital technology and carbon emissions: Evidence from China. J. Clean. Prod. 2023, 430, 139765. [Google Scholar] [CrossRef]
  36. Ma, Z.; Wu, F. Smart City, Digitalization and CO2 Emissions: Evidence from 353 Cities in China. Sustainability 2023, 15, 225. [Google Scholar] [CrossRef]
  37. Li, F.G.; Bataille, C.; Pye, S.; O’Sullivan, A. Prospects for energy economy modelling with big data: Hype, eliminating blind spots, or revolutionising the state of the art? Appl. Energy 2019, 239, 991–1002. [Google Scholar] [CrossRef]
  38. Jin, H. Prediction of direct carbon emissions of Chinese provinces using artificial neural networks. PLoS ONE 2021, 16, e0236685. [Google Scholar] [CrossRef]
  39. Hoesly, R.; Matthews, H.S.; Hendrickson, C. Energy and Emissions from U.S. Population Shifts and Implications for Regional GHG Mitigation Planning. Environ. Sci. Technol. 2015, 49, 12670–12678. [Google Scholar] [CrossRef]
  40. Tan, Y.; Liang, Y.; Zhu, J. CityGML in the Integration of BIM and the GIS: Challenges and Opportunities. Buildings 2023, 13, 1758. [Google Scholar] [CrossRef]
  41. Shirowzhan, S.; Sepasgozar, S.M.; Edwards, D.J.; Li, H.; Wang, C. BIM compatibility and its differentiation with interoperability challenges as an innovation factor. Autom. Constr. 2020, 112, 103086. [Google Scholar] [CrossRef]
  42. Shahat, E.; Hyun, C.T.; Yeom, C. City digital twin potentials: A review and research agenda. Sustainability 2021, 13, 3386. [Google Scholar] [CrossRef]
  43. Autodesk. Green Building Studio. Available online: https://gbs.autodesk.com/gbs (accessed on 17 January 2024).
  44. Autodesk. Using Revit and Dynamo to Assess Embodied Carbon \textbar Autodesk University. Available online: https://www.autodesk.com/autodesk-university/article/Using-Revit-and-Dynamo-Assess-Embodied-Carbon-2021 (accessed on 10 January 2024).
  45. Spiegelhalter, T. Achieving the net-zero-energy-buildings “2020 and 2030 targets” with the support of parametric 3-D/4-D BIM design tools. J. Green Build. 2012, 7, 74–86. [Google Scholar] [CrossRef]
  46. Bremer, M.; Mayr, A.; Wichmann, V.; Schmidtner, K.; Rutzinger, M. A new multi-scale 3D-GIS-approach for the assessment and dissemination of solar income of digital city models. Comput. Environ. Urban Syst. 2016, 57, 144–154. [Google Scholar] [CrossRef]
  47. Tao, W. Interdisciplinary urban GIS for smart cities: Advancements and opportunities. Geo-Spat. Inf. Sci. 2013, 16, 25–34. [Google Scholar] [CrossRef]
  48. Lafioune, N.; St-Jacques, M. Towards the creation of a searchable 3D smart city model. Innov. Manag. Rev. 2020, 17, 285–305. [Google Scholar] [CrossRef]
  49. Shi, W.; Yang, B.; Li, Q. An object-oriented data model for complex objects in three-dimensional geographical information systems. Int. J. Geogr. Inf. Sci. 2003, 17, 411–430. [Google Scholar] [CrossRef]
  50. Lehtola, V.V.; Koeva, M.; Elberink, S.O.; Raposo, P.; Virtanen, J.-P.; Vahdatikhaki, F.; Borsci, S. Digital twin of a city: Review of technology serving city needs. Int. J. Appl. Earth Obs. Geoinf. 2022, 114, 102915. [Google Scholar] [CrossRef]
  51. Haq, S. Urban green spaces and an integrative approach to sustainable environment. Urban Ecol. Strateg. Green Infrastruct. Land Use 2015. [Google Scholar] [CrossRef]
  52. Kabir, M.; Habiba, U.E.; Khan, W.; Shah, A.; Rahim, S.; Rios-Escalante, P.R.D.l.; Farooqi, Z.-U.-R.; Ali, L.; Shafiq, M. Climate change due to increasing concentration of carbon dioxide and its impacts on environment in 21st century; a mini review. J. King Saud Univ. Sci. 2023, 35, 102693. [Google Scholar] [CrossRef]
  53. Webster, M.D. Uncertainty in Future Carbon Emissions: A Preliminary Exploration; MIT Joint Program: Cambridge, MA, USA, 1997. [Google Scholar]
  54. Yu, S.; Zhang, Q.; Hao, J.L.; Ma, W.; Sun, Y.; Wang, X.; Song, Y. Development of an extended STIRPAT model to assess the driving factors of household carbon dioxide emissions in China. J. Environ. Manag. 2023, 325, 116502. [Google Scholar] [CrossRef]
  55. Nie, W.; Duan, H. A novel multivariable grey differential dynamic prediction model with new structures and its application to carbon emissions. Eng. Appl. Artif. Intell. 2023, 122, 106174. [Google Scholar] [CrossRef]
  56. Xikai, M.; Lixiong, W.; Jiwei, L.; Xiaoli, Q.; Tongyao, W. Comparison of regression models for estimation of carbon emissions during building’s lifecycle using designing factors: A case study of residential buildings in Tianjin, China. Energy Build. 2019, 204, 109519. [Google Scholar] [CrossRef]
  57. Wang, H.; Zhang, Z. Forecasting CO2 Emissions Using A Novel Grey Bernoulli Model: A Case of Shaanxi Province in China. Int. J. Env. Res. Public Health 2022, 19, 4953. [Google Scholar] [CrossRef]
  58. Kong, F.; Song, J.; Yang, Z. A novel short-term carbon emission prediction model based on secondary decomposition method and long short-term memory network. Environ. Sci. Pollut. Res. 2022, 29, 64983–64998. [Google Scholar] [CrossRef]
  59. Pu, X.; Yao, J.; Zheng, R. Forecast of Energy Consumption and Carbon Emissions in China’s Building Sector to 2060. Energies 2022, 15, 4950. [Google Scholar] [CrossRef]
  60. Liu, Z.; Jiang, P.; Wang, J.; Zhang, L. Ensemble system for short term carbon dioxide emissions forecasting based on multi-objective tangent search algorithm. J. Environ. Manag. 2022, 302, 113951. [Google Scholar] [CrossRef]
  61. Hosseini, S.M.; Saifoddin, A.; Shirmohammadi, R.; Aslani, A. Forecasting of CO2 emissions in Iran based on time series and regression analysis. Energy Rep. 2019, 5, 619–631. [Google Scholar] [CrossRef]
  62. Pao, H.-T.; Tsai, C.-M. Modeling and forecasting the CO2 emissions, energy consumption, and economic growth in Brazil. Energy 2011, 36, 2450–2458. [Google Scholar] [CrossRef]
  63. Qiao, W.; Lu, H.; Zhou, G.; Azimi, M.; Yang, Q.; Tian, W. A hybrid algorithm for carbon dioxide emissions forecasting based on improved lion swarm optimizer. J. Clean. Prod. 2020, 244, 118612. [Google Scholar] [CrossRef]
  64. Wang, J.; Yang, F.; Zhang, X. Analysis of the Influence Mechanism of Energy-Related Carbon Emissions with a Novel Hybrid Support Vector Machine Algorithm in Hebei, China. Pol. J. Environ. Stud. 2019, 28, 3475–3487. [Google Scholar] [CrossRef] [PubMed]
  65. Yousefi-Sahzabi, A.; Sasaki, K.; Yousefi, H.; Sugai, Y. CO2 emission and economic growth of Iran. Mitig. Adapt. Strateg. Glob. Chang. 2011, 16, 63–82. [Google Scholar] [CrossRef]
  66. Luo, H.; Li, Y.; Gao, X.; Meng, X.; Yang, X.; Yan, J. Carbon emission prediction model of prefecture-level administrative region: A land-use-based case study of Xi’an city, China. Appl. Energy 2023, 348, 121488. [Google Scholar] [CrossRef]
  67. Azeez, O.S.; Pradhan, B.; Shafri, H.Z.M. Vehicular CO Emission Prediction Using Support Vector Regression Model and GIS. Sustainability 2018, 10, 3434. [Google Scholar] [CrossRef]
  68. Zhang, S.; Zhao, T. Identifying major influencing factors of CO2 emissions in China: Regional disparities analysis based on STIRPAT model from 1996 to 2015. Atmos. Environ. 2019, 207, 136–147. [Google Scholar] [CrossRef]
  69. Cockburn, I.M.; Henderson, R.; Stern, S. The impact of artificial intelligence on innovation: An exploratory analysis. In The Economics of Artificial Intelligence: An Agenda; University of Chicago Press: Chicago, IL, USA, 2018; pp. 115–146. [Google Scholar]
  70. Javanmard, M.E.; Ghaderi, S.; Hoseinzadeh, M. Data mining with 12 machine learning algorithms for predict costs and carbon dioxide emission in integrated energy-water optimization model in buildings. Energy Convers. Manag. 2021, 238, 114153. [Google Scholar] [CrossRef]
  71. Wang, P.; Hu, J.; Chen, W. A hybrid machine learning model to optimize thermal comfort and carbon emissions of large-space public buildings. J. Clean. Prod. 2023, 400, 136538. [Google Scholar] [CrossRef]
  72. Ma, L.; Wang, D. Construction of Game Model between Carbon Emission Minimization and Energy and Resource Economy Maximization Based on Deep Neural Network. Comput. Intell. Neurosci. 2022, 2022, 4578536. [Google Scholar] [CrossRef]
  73. Chen, L.; Msigwa, G.; Yang, M.; Osman, A.I.; Fawzy, S.; Rooney, D.W.; Yap, P.-S. Strategies to achieve a carbon neutral society: A review. Environ. Chem. Lett. 2022, 20, 2277–2310. [Google Scholar] [CrossRef] [PubMed]
  74. Ionescu, L. Urban greenhouse gas accounting for net-zero carbon cities: Sustainable development, renewable energy, and climate change. Geopolit. Hist. Int. Relat. 2022, 14, 155–171. [Google Scholar]
  75. O’Regan, A.C.; Nyhan, M.M. Towards sustainable and net-zero cities: A review of environmental modelling and monitoring tools for optimizing emissions reduction strategies for improved air quality in urban areas. Environ. Res. 2023, 231, 116242. [Google Scholar] [CrossRef]
  76. Liu, H.; Hu, T.J. How does air quality affect residents’ life satisfaction? Evidence based on multiperiod follow-up survey data of 122 cities in China. Environ. Sci. Pollut. Res. 2021, 28, 61047–61060. [Google Scholar] [CrossRef]
  77. Duan, Z.; Kim, S. Progress in Research on Net-Zero-Carbon Cities: A Literature Review and Knowledge Framework. Energies 2023, 16, 6279. [Google Scholar] [CrossRef]
  78. Novotny, V. Water and energy link in the cities of the future–achieving net zero carbon and pollution emissions footprint. Water Sci. Technol. 2011, 63, 184–190. [Google Scholar] [CrossRef] [PubMed]
  79. Muruganandam, M.; Rajamanickam, S.; Sivarethinamohan, S.; Reddy, M.K.; Velusamy, P.; Gomathi, R.; Ravindiran, G.; Gurugubelli, T.R.; Munisamy, S.K. Impact of climate change and anthropogenic activities on aquatic ecosystem—A review. Environ. Res. 2023, 238, 117233. [Google Scholar]
  80. McMichael, A. Climate Change and the Health of Nations: Famines, Fevers, and the Fate of Populations; Oxford University Press: Oxford, UK, 2017. [Google Scholar]
  81. Fan, Y.; Wei, F. Contributions of natural carbon sink capacity and carbon neutrality in the context of net-zero carbon cities: A case study of Hangzhou. Sustainability 2022, 14, 2680. [Google Scholar] [CrossRef]
  82. Huovila, A.; Siikavirta, H.; Rozado, C.A.; Rökman, J.; Tuominen, P.; Paiho, S.; Hedman, Å.; Ylén, P. Carbon-neutral cities: Critical review of theory and practice. J. Clean. Prod. 2022, 341, 130912. [Google Scholar] [CrossRef]
  83. Wimbadi, R.W.; Djalante, R. From decarbonization to low carbon development and transition: A systematic literature review of the conceptualization of moving toward net-zero carbon dioxide emission (1995–2019). J. Clean. Prod. 2020, 256, 120307. [Google Scholar] [CrossRef]
Figure 2. The flowchart of the research framework is generated using the two databases, Web of Science and Scopus.
Sustainability 16 06285 g002
Figure 3. Visualisation of keywords from the Scopus database.
Sustainability 16 06285 g003
Figure 4. Key terms are visualised from the relevant search in the Web of Science database.
Sustainability 16 06285 g004
Table 1. Major keyword search results through the Scopus database.
DatabaseSearching QueryNumber of Papers Keywords
Scopus TITLE-ABS-KEY (net AND zero AND cities) AND (LIMIT-TO (PUBYEAR, 2023) OR LIMIT-TO (PUBYEAR, 2022) OR LIMIT-TO (PUBYEAR, 2021) OR LIMIT-TO (PUBYEAR, 2020) OR LIMIT-TO (PUBYEAR, 2019)) AND (LIMIT-TO (SUBJAREA, “ENER”) OR LIMIT-TO (SUBJAREA, “ENVI”))320Net-Zero City
TITLE-ABS-KEY (data AND driven AND carbon AND cities) AND PUBYEAR > 2012 AND PUBYEAR < 2024 AND (EXCLUDE (SUBJAREA, “MEDI”) OR EXCLUDE (SUBJAREA, “AGRI”) OR EXCLUDE (SUBJAREA, “BUSI”) OR EXCLUDE (SUBJAREA, “CHEM”) OR EXCLUDE (SUBJAREA, “BIOC”) OR EXCLUDE (SUBJAREA, “PHYS”) OR EXCLUDE (SUBJAREA, “CENG”) OR EXCLUDE (SUBJAREA, “PHAR”) OR EXCLUDE (SUBJAREA, “MATE”) OR EXCLUDE (SUBJAREA, “ARTS”) OR EXCLUDE (SUBJAREA, “NEUR”) OR EXCLUDE (SUBJAREA, “PSYC”)) AND (LIMIT-TO (LANGUAGE, “English”))192Data-Driven Net-Zero City
TITLE-ABS-KEY (methods AND for AND net AND zero AND cities)169The method implemented by Net-Zero Carbon
Cities
TITLE-ABS-KEY (spatial AND analysis AND net AND zero AND cities)35Spatial analysis and NZCCs
TITLE-ABS-KEY (machine AND learning AND net AND zero AND cities) AND (LIMIT-TO (PUBYEAR, 2023) OR LIMIT-TO (PUBYEAR, 2022) OR LIMIT-TO (PUBYEAR, 2021) OR LIMIT-TO (PUBYEAR, 2020) OR LIMIT-TO (PUBYEAR, 2019)) 21Machine Learning and Net Zero Carbon
Cities
TITLE-ABS-KEY (gis AND net AND zero AND cities)20GIS and Net-Zero City
TITLE-ABS-KEY (net-zero AND city AND digital AND
technology)
20Net-Zero City and digital technology
TITLE-ABS-KEY (artificial AND intelligence AND net AND zero AND cities) AND (LIMIT-TO (PUBYEAR, 2023) OR LIMIT-TO (PUBYEAR, 2022) OR LIMIT-TO (PUBYEAR, 2021) OR LIMIT-TO (PUBYEAR, 2020)) 18AI and Net Zero Carbon Cities
TITLE-ABS-KEY (deep AND learning AND net AND zero AND cities) AND (LIMIT-TO (PUBYEAR, 2023) OR LIMIT-TO (PUBYEAR, 2022) OR LIMIT-TO (PUBYEAR, 2021) OR LIMIT-TO (PUBYEAR, 2020)) 11Deep Learning and Net Zero Carbon Cities
TITLE-ABS-KEY (analytics AND for AND net AND zero AND cities)10Remote Sensing and Net Zero Carbon Cities
TITLE-ABS-KEY (remote AND sensing AND for AND net AND zero AND cities) 9Analytics and Net Zero Carbon Cities
TITLE-ABS-KEY (dashboardAND digital AND platforms/AND digital AND portals AND for AND mapping AND net AND zero AND cities)0Digital Platforms and Net Zero Carbon Cities
TITLE-ABS-KEY (deriving AND factors AND preventing AND net AND zero AND cities)0Preventing factors for achieving Net Zero
Cities
Table 2. Database results from searching and filtering.
TitleSearch StringTotal Papers
ScopusTITLE-ABS-KEY (net AND zero AND carbon AND city)293
Web of ScienceNet-zero carbon city (All Fields)360
Total articlesAfter applying the filters and removing the duplications341
Total review articlesAfter the selection of data-driven urban planning articles55
Table 3. Definitions of net-zero carbon, net-zero emission, net-zero energy cities.
Terms UsedDefinition
Net-Zero Energy DistrictsNet-Zero Energy Districts (NZEDs) refer to urban or human settlement districts in which the annual emissions of CO2 are equal to the emissions removed from the atmosphere through the positive energy efficiency and energy flexibility that support reducing the daily release of carbon emissions in infrastructure [29].
Net-Zero Emissions Energy SystemsNet-Zero Emission Systems are energy systems without net carbon dioxide and net GHG [30].
Net-Zero Energy BuildingsA Net-Zero Energy Building (NZEB) has specific characteristics, such as producing the same amount of energy as it consumes, having a significantly lower energy demand, having energy costs equal to zero, or having zero greenhouse gas emissions. This term has multiple meanings, and it could be used to describe a structure with these characteristics [31].
Table 4. Different countries have met the NZCC goal in various years.
CountryStrategies/PoliciesYear NZCC Will Be Achieved
United KingdomClean Growth Strategy2050
United StatesClimate Mobilization Act2050
SingaporeThe Green Plan 20302050
ChinaThree-Year Action Plan for Winning the Blue-Sky Defence War/Carbon Neutralization Action Plan for the Construction Industry2060
JapanGreen Growth Strategy through Achieving
Carbon Neutrality
2050
CanadaThe Canadian Net-Zero Emissions
Accountability Act
2050
MexicoMexico Climate Change Fact Sheet2050
NicaraguaNDC CHECKLIST Nicaragua Analysis2050
BrazilGreen Policy of Brazil2050
RussianHighly insufficient2060
MauritaniaGreen Hydrogen Strategy of Mauritania2030
GabonNet Carbon Sink2050
FranceThe Paris Agreement2050
DenmarkDenmark’s net-zero policy2050
New ZealandZero Carbon Amendment to the Climate Change Response Act2050
HungaryHungarian National Energy Strategy 20302050
SwedenThe Net-Zero Strategy Sweden2045
SpainNet-Zero Spain2050
ChileChile’s Carbon Policy2050
AustraliaAPS Net-Zero 20302050
Table 5. NZCCs policy.
Year NZCC Will Be AchievedCityCity Policy
2050LondonLondon Carbon Policy
2050San Francisco/laThe Zero Net Energy Ordinance/The City of Los Angeles’ Sustainable City plan
2050AllSingapore Green City Policy
2060ChengduLow-Carbon City Pilot (LCCP) policy
2050KyotoEnvironmental Policy Kyoto Treaty
2050VancouverThe City of Vancouver’s Renewable City Strategy
2050RECIFERecife the City Climate Action Plan
2050ParisParis Agreement
2050CopenhagenThe “Smart City” approach
2045StockholmThe City of Stockholm’s Climate Positive Plan
2050Sydney/NSWThe Net-Zero Plan Stage 1: 2020–2030
Table 6. Articles which used data-driven methods and digital technology for NZCCs.
Objective of the StudyMethodTypes of Used DataMain FindingsReference
Use big Earth data to address the knowledge deficit about the alterations in carbon storage and human settlement expansion across the urban–rural gradient in China.Employed GAIA (global artificial impervious area) data and the GUB (global urban boundaries) product to investigate the disparities in human settlement expansion between urban and rural areas across China from 1990 to 2018.Big Earth data
  • VBC (vegetation biomass carbon) and SOC (soil organic carbon) densities on the rural–urban continuum increased moderately.
  • The socio-economic factors’ impact on urban human settlement expansion is larger than rural human settlement expansion [33].
[33]
The correlation between digitalisation and carbon dioxide emissions, utilising China’s policy framework of “smart city” construction pilots.
  • Parallel Trend Test and Dynamic Effect Estimation.
  • Baseline Regression: Multi-Period DID (Difference-in Difference) Estimation.
  • Robustness test.
  • Heterogeneity Analysis.
CEADs (carbon emission accounts and datasets), DMSP/OLS (Defence Meteorological Satellite Program/Operational Linescan System) and NPP/VIIRS (National Polar-Orbiting Partnership/Visible Infrared Imaging Radiometer Suite) data.
  • The deployment of smart city construction pilot projects has significantly reduced carbon emissions in urban areas. The degree of digitisation in urban areas has a substantial adverse effect on carbon emissions.
  • Digitisation facilitates the reduction in carbon emissions significantly.
  • Digitisation stimulates the development of environmentally friendly innovations in companies with high pollution levels [36].
[36]
The impact of interstate migration on net changes in GHG emissions in the United States.Percentile of residential energy use, and then by household income. Estimates of migrating households in terms of both their origin and destination states, followed by calculations of the annual change in household emissions resulting from relocation to a different state.Residential energy data, electricity grid emission data, household transportation data, migration and demographic data.In low-carbon regions or urban areas experiencing rapid population migration, it is necessary to develop sustainable low-carbon development strategies to offset the emissions growth resulting from households moving to high-carbon areas [39].[39]
Evidence that the carbon emissions per capita in the northern region of China show a noteworthy disparity compared to those in the southern region, with a persistent upward trend in the rate of carbon emissions.The direct carbon emission calculation method employs the carbon emission coefficient approach, whereby the carbon emissions from individuals’ daily lives are quantified using statistical data about diverse fossil energy sources.The selection of the BPNN, RBF, and Elman neural network models is based on the nonlinear characteristics of the carbon emission data.
  • In China, the carbon emissions of individuals residing in the northern region exhibit a marked disparity compared to those in the southern region.
  • The Elman neural network shows superior accuracy and reduced errors in predicting carbon emissions compared to alternative models.
  • Compared to the B.P. neural network, there is a notable increase in accuracy by 55.93% and an improvement in prediction performance by 19.48%.
  • According to the forecast outcomes, China is expected to reach the carbon emissions peak between 2027 and 2032 [38].
Table 7. Visualisation and 3D technologies used for NZCCs.
Visualisation ApproachInformationVisualisation ToolReference
3D City TechnologyNet-zero layer/data
(carbon emission,
urban heat island,
energy consumption layer)
3D
(BIM/GIS integration, City GML) [40]
[41]
City digital twinsSmart city directionGIS integration[42]
Autodesk Green Building StudioEnergy consumption and carbon emissionsCarbon footprint visualisation, embodied carbon visualisation [43][44]
Table 8. Major 3D technology use for Net-Zero Carbon Cities.
City TechnologyCharacteristicsApplication/Applicability in Net-Zero Carbon Cities
Building Information Modelling (BIM)Visualisation, coordinated coordination, simulative simulation,BIM further implements the monitoring and system optimisation of engineering projects to assist engineers in balancing the negative impact of carbon emissions of materials in the early stages of construction and achieve balanced building energy management.
Three-dimension GISThree-dimensional GIS, IoT technology, visualisation system3D GIS helps NZCCs visualise data, enables implementation management and real-time monitoring of existing data, and converts the collected point-to-point data into image data that the public can comprehend. The entire design, construction, and operation process is continuously optimised.
City digital twinMonitoring, visualisation, decision-makingThe interdependence between NZCC and digital twins is significant. Smart cities’ sustainable growth depends on advancing digital twin methodologies to establish a robust framework network. This network facilitates the monitoring of the city’s status and allows for formulating decisions and policies in real-time.
Table 9. Previous carbon emission prediction models.
Prediction ModelDatasetsAIGISSpatio-Temporal ApproachRemaining Gap
Reported in the Study for Future Studies
Source
Novel grey Bernoulli model (1,1, α,β)
(NFOGBM)
  • Energy consumption data
  • Carbon emission coefficients
  • Converted standard coal coefficients
YesNoYes
  • Application in the combination of new opposite-directional cumulative and background value optimisation approach with other models
[57]
Variational Mode Decomposition–Ensemble Empirical Mode Decomposition–Long Short-Term Memory hybrid model
(VMD—EEMD—LSTM)
  • Daily carbon emission data
YesNoNo
  • Unknown for long-term prediction
  • Parameters of LSTM are not optimised
  • Combination of LSTM and optimisation algorithm
[58]
Stochastic Impacts by Regression on Population, Affluence, And Technology
(STIRPAT)
  • Influencing factor data
NoNoNo
  • Household carbon emissions as a potential influencing factor
  • Emerging economies
  • Comparative study
[54]
Back Propagation Neural Network (BPNN)
  • Energy data
  • National building material consumption
  • National total primary energy consumption
  • Different types of energy in terminal energy consumption
  • Time range: 1995 to 2019
YesNoYes
  • Prediction of building carbon emission trends in different regions
  • Architectural styles and energy use habits that cause differences in carbon emission prediction at the urban level
[59]
Carbon Emission Ensemble Forecasting System
(CEEFS)
  • The day-resolution carbon emissions time series in China and the US
  • Carbon monitor database
YesNoYes
  • Influencing factors, including economy, population, energy consumption
  • Optimisation technologies
[60]
Multiple Regression
(MR)
  • Historical data from World Bank Open Data
NoNoYes
  • Diversification of net income
  • Carbon tax systems
  • Optimal privatisation path
  • Renewable energy
  • CO2 capture technology
[61]
Grey Prediction model
  • Energy consumption
  • Real GDP between 1980 and 2007
  • Energy Information Administration (EIA)
  • World Development Indicators (WDI)
  • Carbon emissions
  • Energy consumption
NoNoNo
  • Combination and optimisation of models
[62]
Least-Squares Support Vector Machine
(LSSVM)
  • Total carbon dioxide emissions worldwide (“67th Statistical Review of World Energy”)
YesNoNo
  • Model optimisation through the adaptive lion swarm optimisation algorithm
  • More countries
  • sampling analysis
[63]
Improved Particle Swarm Optimisation–Support Vector Machine
(IPSO-SVM)
  • China Energy Statistical Yearbook and Hebei Statistical Yearbook
  • Carbon emission datasets
YesNoYes
  • Potential optimisation of models and datasets
[64]
Dispersion model
  • Environmental data 2000–2003
  • NSW Environment Protection Authority, 2005
NoYesYes
  • Emission dispersion of pollutants in different regions with GIS and a GIS-aided dispersion modelling approach
[65]
Carbon Emission Spatial Simulation and Prediction Model
  • Socio-economic indicators
  • Climatic and meteorological data
  • Geographic data
YesYesYes
  • Latest predicting models for socio-economic factors
  • The accuracy of long-term prediction
  • Algorithm optimisation
[66]
Correlation-Based Feature Selection and Support Vector Regression
(CFS-SVR)
  • Traffic flow data
  • Relative humidity
  • Temperature
  • Wind speed
  • Wind direction
NoYesYes
  • Complexity of data collection
  • Deep learning algorithm optimisation
[67]
Table 10. Opportunities and challenges associated with NZCCs.
OpportunitiesChallenges
EnvironmentalEnvironmental protection policy and strategies
Urban environmental planning
Sustainability of materials
Carbon offset and storage
Resource intensity of green technologies
SocialPublic health improvement
Enhanced Community Resilience
Increased Social Equity
Job loss due to environmental protection restrictions
Public engagements and acceptance
TechnicalOptimisation of Carbon emission prediction model
Optimisation of AI with GIS-based technologies
Data storage and analytics
Prediction model accuracy and stability
Carbon emission data collection
City digital platform accessibility
Disclaimer/Publisher’s Note: The statements, opinions and data contained in all publications are solely those of the individual author(s) and contributor(s) and not of MDPI and/or the editor(s). MDPI and/or the editor(s) disclaim responsibility for any injury to people or property resulting from any ideas, methods, instructions or products referred to in the content.

