Article

Metro Stations as Catalysts for Land Use Patterns: Evidence from Wuhan Line 11

1
School of Architecture and Planning, Yunnan University, Kunming 650500, China
2
Key Laboratory of New Technology for Construction of Cities in Mountain Area, Chongqing University, Chongqing 400045, China
3
School of Architecture and Urban Planning, Huazhong University of Science and Technology, Wuhan 430074, China
4
College of Engineering Sciences, Hanyang University ERICA, Ansan 15588, Republic of Korea
5
School of Ecology and Environmental Science, Yunnan University, Kunming 650500, China
6
Faculty of Architecture, Technical University of Berlin, 10623 Berlin, Germany
*
Author to whom correspondence should be addressed.
Sustainability 2024, 16(15), 6320; https://doi.org/10.3390/su16156320
Submission received: 12 June 2024 / Revised: 11 July 2024 / Accepted: 22 July 2024 / Published: 24 July 2024

Abstract

:
Urban rail transit systems significantly influence land use patterns in newly developed areas, yet their impact on spatial organization and functional characteristics remains understudied. This research examines Wuhan Metro Line 11, analyzing land use within an 800 m radius of stations using Point of Interest data, ArcGIS spatial analysis, and locational entropy methods. The study reveals three station types, i.e., single-function, mixed-function, and underdeveloped, each exhibiting distinct spatial differentiation patterns. On this basis, a novel “core-diffusion” model emerges, with the highest density of functional elements observed at approximately 600 m from station centers, challenging conventional proximity assumptions. Three spatial organization modes are identified: single-core independent in two-level axis, single-core continuous in single-level axis, and double-core continuous in two-level axis. These findings contribute to the Transit-Oriented Development literature, offering sustainable insights into optimizing land use around metro stations in rapidly urbanizing contexts. This study also provides a methodological framework applicable to similar urban environments, enhancing the understanding of the complex relationships between metro development and surrounding land use patterns. These results have significant implications for urban planning and policy-making, particularly in emerging economies seeking to balance transit efficiency with sustainable urban growth.

1. Introduction

The expansion of mega-cities and the establishment of new urban areas outside city centers have become necessary to alleviate the pressure on land and accommodate the growing urban population, service industries [1], high-tech sectors, and research institutes. This rapid urbanization has led to increased traffic demands in these new areas. To address this issue, the construction of rail transportation systems, such as metros and intercity railways, has become a popular solution to relieve local traffic pressure and improve overall urban infrastructure [2].
However, operating metros and intercity railways can be a challenging task, and many countries, including China, face difficulties in ensuring their financial sustainability. Most metro systems in China operate at a loss [3]. In contrast, the Wuhan Metro has shown remarkable financial performance in recent years, even in the face of significant challenges posed by the COVID-19 pandemic. This exceptional performance has been referred to as the “Wuhan Metro Profit”.
According to available statistics, the Wuhan Metro achieved a net profit of CNY 1.678 billion (USD 233 million) in 2020, ranking it as the third most profitable metro system in China. In 2021, its net profit further increased to CNY 1.731 billion, maintaining its position as China’s third largest metro by profitability. Finally, in 2022, despite the net profit decreasing to CNY 1.570 billion, the Wuhan Metro emerged as China’s top-ranking metro in terms of profitability, given that profits for other city metro systems also declined (Wuhan Metro Group Co., Ltd. (Wuhan, China) 2022 Annual Report, Beijing Financial Asset Exchange. https://www.cfae.cn/connector/selectOnePortalView?infoId=416664 (accessed on 2 February 2024)).
The consistent growth in the Wuhan Metro’s financial performance highlights its profitability, which stands out amidst the challenges faced by the metro industry in China. The ability of the Wuhan Metro to generate significant profits showcases its successful management of operations and optimization of revenue streams.
Analyzing the specific factors contributing to the Wuhan Metro’s profitability requires a detailed examination of its operational strategies [4], cost management [5], fare structures [6], ridership patterns [7], and other relevant factors. Nonetheless, the “Wuhan Metro Profit” phenomenon serves as an intriguing case study within the realm of urban rail transit enterprises, demonstrating the potential for financial success even in a challenging industry.
The existing body of research predominantly focuses on various aspects such as engineering cost [8], vehicle scheduling mode [9], business cooperation mode [10], and group financial management [11] in relation to this phenomenon. However, there is a noticeable gap in studies that examine the spatial and functional characteristics of land surrounding metro line stations.
Within this realm, scholars have delved into the phased development trajectory of transportation in emerging urban areas [12], the intricate interplay between land use and transport systems [13], the interdependence between transport infrastructure development and land utilization [14], as well as the ramifications of introducing rail transport in emerging urban areas on overall urban development [15]. Collectively, these studies concur that rail transport in emerging urban areas exerts a profound influence on the land use patterns and developmental dynamics within these new regions [16,17,18].
Significant progress has been made, especially in understanding the mechanisms of land use patterns and the development mode of Transit-Oriented Development (TOD) in urban areas. Notably, Shuwei Wang (2013) [19] focused on rail stations and their sphere of influence, proposing the theory of the potential attraction range of stations. Jae-Hong Kim (2017) [20] analyzed the impact of light rail systems beyond a half-mile radius using the example of the Los Angeles light rail, investigating the complex mechanisms by which transportation systems shape land use patterns in cities. Examining high-density urban areas in East Asia, Jiawen Yang (2020) [21] explored TOD development practices in Shanghai, Shenzhen, and Dongguan, emphasizing development patterns and composite utilization under different types of development. Khin Thiri Kyaw Nyunt (2020) [22] assessed the relationship between ridership demand and TOD patterns by examining land-use density, diversity, and accessibility using the Bangkok Metro as a case study. Yujuan Chen (2021) [23] used location entropy to measure equity and intra-district differences in the distribution of urban public sports facilities among spatial units. In this study, the fairness of sports space in Hangzhou was calculated and analyzed using kernel density method and entropy analysis, which provides a paradigmatic interpretation of the symbiosis between cities and residents. However, many existing studies primarily focus on areas with relatively high levels of urbanization, and there is a need for further exploration in developing new areas during expansion periods. There is a noticeable gap in studies that examine the spatial and functional characteristics of land surrounding metro line stations.
Specifically, it has been observed that metro lines in central or urban areas of major cities maintain relative consistency in terms of passenger flows and operational characteristics, while lines in far-flung suburban areas demonstrate significant differences [24]. Is the planning of suburban metro lines in the Wuhan Metropolitan Area a crucial factor contributing to the “Wuhan Metro Profit”? However, current research still lacks discussion on the relationship between these suburban railway line planning and subway profits.
To address this question, the research group conducted a comparative analysis of far-urban metro lines in Wuhan with those in similarly sized cities in mainland China, considering passenger density and operating hours. The study revealed that Wuhan Metro Line 11 exhibits outstanding performance in these aspects.
Firstly, Wuhan Metro Line 11 demonstrates excellent Passenger Flow Intensity (PFI). PFI is calculated using the formula Q = P/L, where Q represents the intensity of metro passenger flow, P denotes the number of passengers during a specific time period, and L signifies the number of miles of rail transport during the same time period. PFI is a crucial indicator for assessing metro operational efficiency and planning new lines or adjusting existing ones. A high PFI suggests that the metro system is highly utilized in the given area or time period, potentially requiring additional capacity or service optimization to meet demand. Conversely, a low PFI may indicate a lack of demand or over-service. When compared to other suburban lines in Wuhan (Line 16, Line 21) and suburban lines in reference cities (Line S1, S6, S8 in Nanjing, Line 8 in Hangzhou, and Chongqing International Expo Line), the average passenger intensity on Wuhan Metro Line 11 reaches 0.4725, significantly surpassing other lines., as depicted in Figure 1. This finding indicates that Wuhan Line 11 attracts a substantial number of passengers during operations, laying a solid foundation for its profitability.
Furthermore, the operating hours of Wuhan Metro Line 11 present relative advantages. With a daily opening time of 6:00 and a closing time of 23:00, Line 11 operates for a longer duration compared to other lines, as depicted in Figure 2. This extended operating schedule enables Line 11 to better cater to the travel needs of passengers at all times, thereby further enhancing its operational efficiency.
The remarkable performance of Line 11, both in terms of passenger intensity and operating hours, surpasses that of other comparable lines. These factors contribute to the line’s exceptional operational viability and financial strength.
Therefore, in order to discover the relationship between line planning and the phenomenon of metro profitability, the study focuses on Wuhan Metro Line 11, which is operated by Wuhan Rail Transit Company (WRTC) and serves the Wuhan East Lake New Technology Development Zone (ELDZ), to determine the uniqueness of Line 11 and to explore the inherent logic and organizational factors that underlie its profitability through a combination of interviews and data analysis. By employing the ArcGIS spatial analysis method and the location entropy method, the study classifies the stations along the line and analyzes the spatial organization patterns of land use in their vicinity. Through an examination of spatial characteristics and functional aggregation, the research provides valuable insights for the planning of suburban routes. Moreover, it offers recommendations for land development and utilization along rail transit lines in new urban areas, addressing the challenges posed by economic recovery and the infrastructure industry in the post-epidemic era.

2. Research Data and Methodology

2.1. Overview of the Study Area

The ELDZ is the area with the largest and fastest-growing GDP in Wuhan, the capital of Hubei Province, China. It also boasts the highest concentration of high-tech enterprises and research institutes. Wuhan Metro Line 11 runs east–west through this entire area and has become a vital mode of public transportation in this new urban zone. Over time, the management of Line 11 has improved the functionality of the land surrounding its stations, effectively guiding passenger flow demand and contributing to the gradual maturity of land use in the area.
Currently, Line 11 has a total length of 20 km and comprises 13 stations. It starts from Wuhandong Railway Station (S1 in Table 1) in the west and ends at Gedian South Station in the east, which is located in the city of Ezhou. The entire line runs through the new urban area, encompassing the entirety of ELDZ, and serves as the main traffic artery for the Wuhan Optics Valley Industrial Park. Since the completion of Line 11, there has been rapid development in the Optics Valley area, with increased land value and a noticeable increase in vitality.
Due to the line spanning both Wuhan and Ezhou cities, there are challenges and potential inaccuracies in collating and collecting Point of Interest (POI) data across administrative regions. Additionally, only one station, Gedian South Station, is located in Ezhou. Therefore, this study focuses solely on Phase I of Line 11, which includes the section from Wuhandong Railway Station to Zuoling, excluding the Gedian section, as depicted in Figure 3a,b.

2.2. Data Sources and Pre-Processing

In this research, the authors collected the POI data using Java and the open platform Amap. The data was acquired on 14 March 2023. Each data entry includes details such as the name, category, door number, latitude, and longitude of the POI.
To determine the influence area of the rail transit stations, the authors followed the convention in China, where walking distance is the primary consideration. Typically, a 5–15-min walking distance, which translates to 400–1000 m, is used as the standard [25,26]. Taking into account the station distances of Line 11 and the accessibility of the stations, this study adopts an 800 m radius as the influence area around the rail transit stations. The investigation focuses on the data within this influence area (Figure 4).
To analyze the POI data within 800 m of the rail transit stations, the researchers utilized ArcGIS to intersect the original POI data points with the area within an 800 m radius of each station. This process resulted in extracting the POI data points that fall within the specified radius around the rail transit stations.
Subsequently, the extracted POI data was exported from ArcGIS and classified into various categories. The classification of the data was carried out by referencing “the Urban Land Use Classification and Planning and Construction Land Use Standards” as well as relevant research [27]. The POI data points were classified into the following categories: Residential Area (A), Office (O), Shopping (S), Catering & Food (F), Living Services (L), Financial Services & Economy (E), Culture, Science & Education (C), Leisure & Recreation (R).
This classification allows for a comprehensive understanding of the land use patterns and functional distribution within the 800 m radius around the rail transit stations (Table 2).
Considering the differences in land area and influence range of each type of data, the weights were assigned to POIs with reference to the study on the influence degree of different POI types by Genrong Cao [28] et al. The raw mean values were normalized to obtain the standard occupancy mean values to improve the scientific validity of the study.
ζ = δ × ε
η = ζ/∑ζ
where δ is the proportion of the number of POIs in each category, ε is the weight, ζ is the raw mean, and η is the standard percentage mean. The processed results are shown below in Table 3.

2.3. Research Methodology

To delve into the characteristics of land function and organization, this study employs kernel density analysis and the locational entropy (LE) method as the primary research tools (see roadmap in Figure 5).
The kernel density analysis method is utilized to identify agglomeration trends in different areas by estimating the density of point distribution in geographic space [29]. In this study, the method is applied to examine the spatial differentiation and organization patterns of land use around the rail transit stations in the new district. Through this method, the quantitative spatial distribution of different functional areas can be captured, revealing areas of concentrated and dispersed distribution.
On the other hand, the LE analysis method provides insights into the organizational structure of land use. By calculating the information entropy of each location in space, it assesses the diversity of land use functions and the degree of distribution balance in the area [30]. It quantifies the spatial balance of various land use types.
The combination of kernel density and LE analysis offers a comprehensive approach to understand land use functions around the metro stations. Kernel density analysis provides a visual representation of the distribution of discrete measurements, such as POI data points, across a continuous area, helping in identifying areas with varying levels of density and concentration. LE analysis, on the other hand, measures the relative concentration and specialization of specific elements, indicating the degree of specialization around the stations. For instance, kernel density analysis might show a high density of commercial POIs around a station, suggesting a commercial hub, whereas LE analysis might reveal a low specialization entropy for the same area, indicating a balanced mix of functions. Such discrepancies highlight the importance of using both methods together to gain a holistic understanding of land use dynamics. This dual-method approach allows for a comprehensive spatial data analysis, enabling a deeper understanding of the characteristics of land use functions and organization on-site.
The combined use of kernel density and LE analysis allows for a comprehensive spatial data analysis, enabling a deeper understanding of the characteristics of land use functions and organization on-site. It further provides scientific and reasonable suggestions for urban planning and development along the rail transit routes. By integrating these methods, the study aims to provide scientific and reasonable suggestions for urban planning and development along the rail transit routes.

2.3.1. Kernel Density Analysis Method

The kernel density analysis method, implemented in ArcGIS, provides a visual representation of the distribution of discrete measurements across a continuous area. In this study, the method is applied as follows:
  • Establishing Buffer Zones: A buffer zone is created around each station of Line 11, with a radius of 800 m. These buffer zones serve as the centers (kernels) for analysis. The data within each buffer zone is statistically analyzed to determine the types of stations through intersection analysis.
  • Studying Spatial Differentiation: To investigate the spatial differentiation of land in the study area, additional buffer zones are created at intervals of 200 m around each station of Line 11. The selection of a buffer distance of 200 m takes into account reasonable spatial division and urban research practices [31,32]. These studies show that 200 m is a more appropriate radius for very large cities, especially in densely populated areas. These multi-ring buffer zones provide a detailed understanding of the land characteristics at varying distances from the stations.
  • Conducting Kernel Density Calculation: The kernel density calculation is performed separately for each type of element in the study area. This involves analyzing the density of each element within its respective buffer zones.
  • Parameter Selection: Parameters for the kernel density analysis, such as bandwidth ( h ), are calculated by default according to the ArcGIS based on the data. The bandwidth parameter is chosen to strike a balance between over-smoothing and under-smoothing. ArcGIS uses Silverman’s rule of thumb to automatically calculate the default bandwidth with the following formula:
    h = 1.06 σ n 1 5
  • Where h is the bandwidth, also known as the smoothing parameter. σ is the standard deviation of the sample data. n is the number of sample data points.
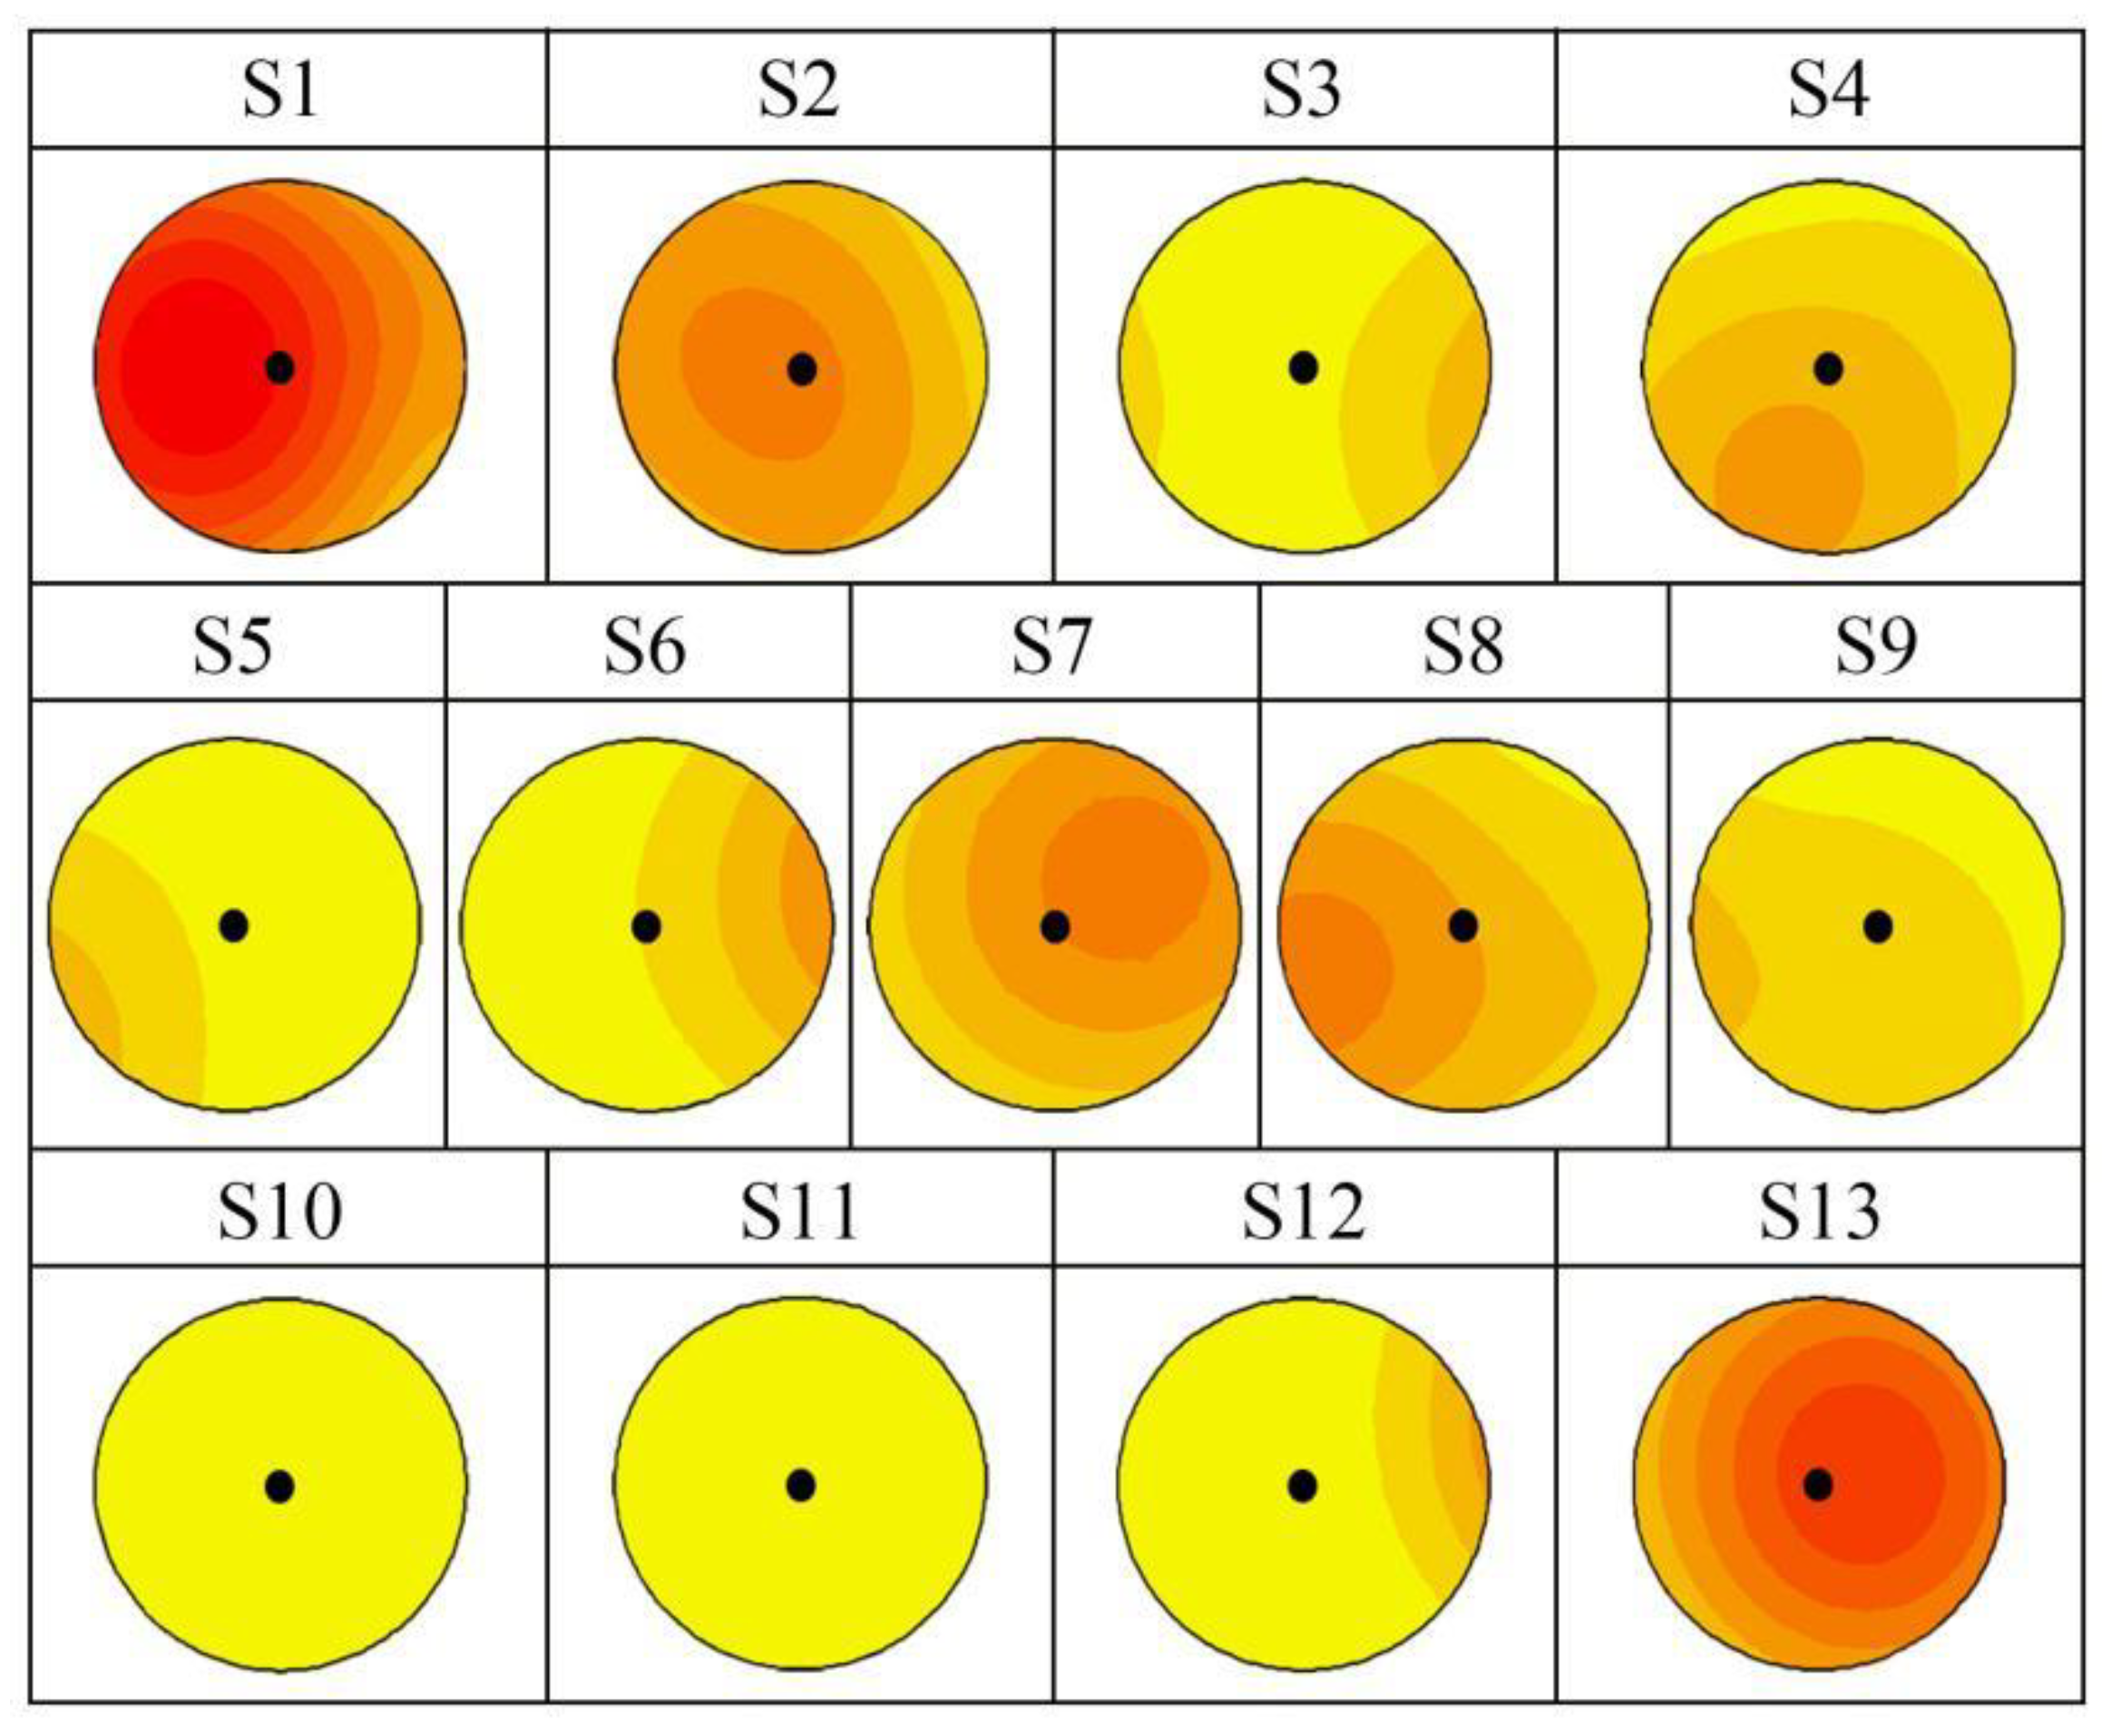
  • Weighted Sum and Final Results: After completing the kernel density calculations for each element type, the results are extracted in ArcGIS. A weighted sum is then applied to combine the individual results. This step helps to consolidate and integrate the information obtained from the kernel density analysis.
By carrying out these steps, the study obtains final results that provide insights into the distribution and density of various elements within the study area, contributing to a comprehensive understanding of the land use patterns and organization around Line 11.
f n x = i = 1 n k ( x x i h ) n h
where f n x is the kernel density function; n is the number of points in the region; k is the kernel function; h is the bandwidth; x x i is the distance from the raster centre point to the known points.
The kernel density calculation in ArcGIS produces results that illustrate the spatial distribution of POI data points. In Figure 6, the colors represent the values of kernel density, with the following interpretation:
  • Redder Color: Indicates a higher value of kernel density, representing a denser spatial distribution of POI data points. Areas with this color are characterized by a higher concentration of POI data points.
  • Yellower Color: Represents a lower value of kernel density, indicating a sparser spatial distribution of POI data points. Areas with this color have a lower concentration of POI data points.
Figure 6. Perimeter range kernel density for each station.
Sustainability 16 06320 g006
By visualizing the kernel density results in this manner, it becomes easier to identify areas with varying levels of density and concentration of POI data points within the study area.

2.3.2. Location Entropy Analysis Method
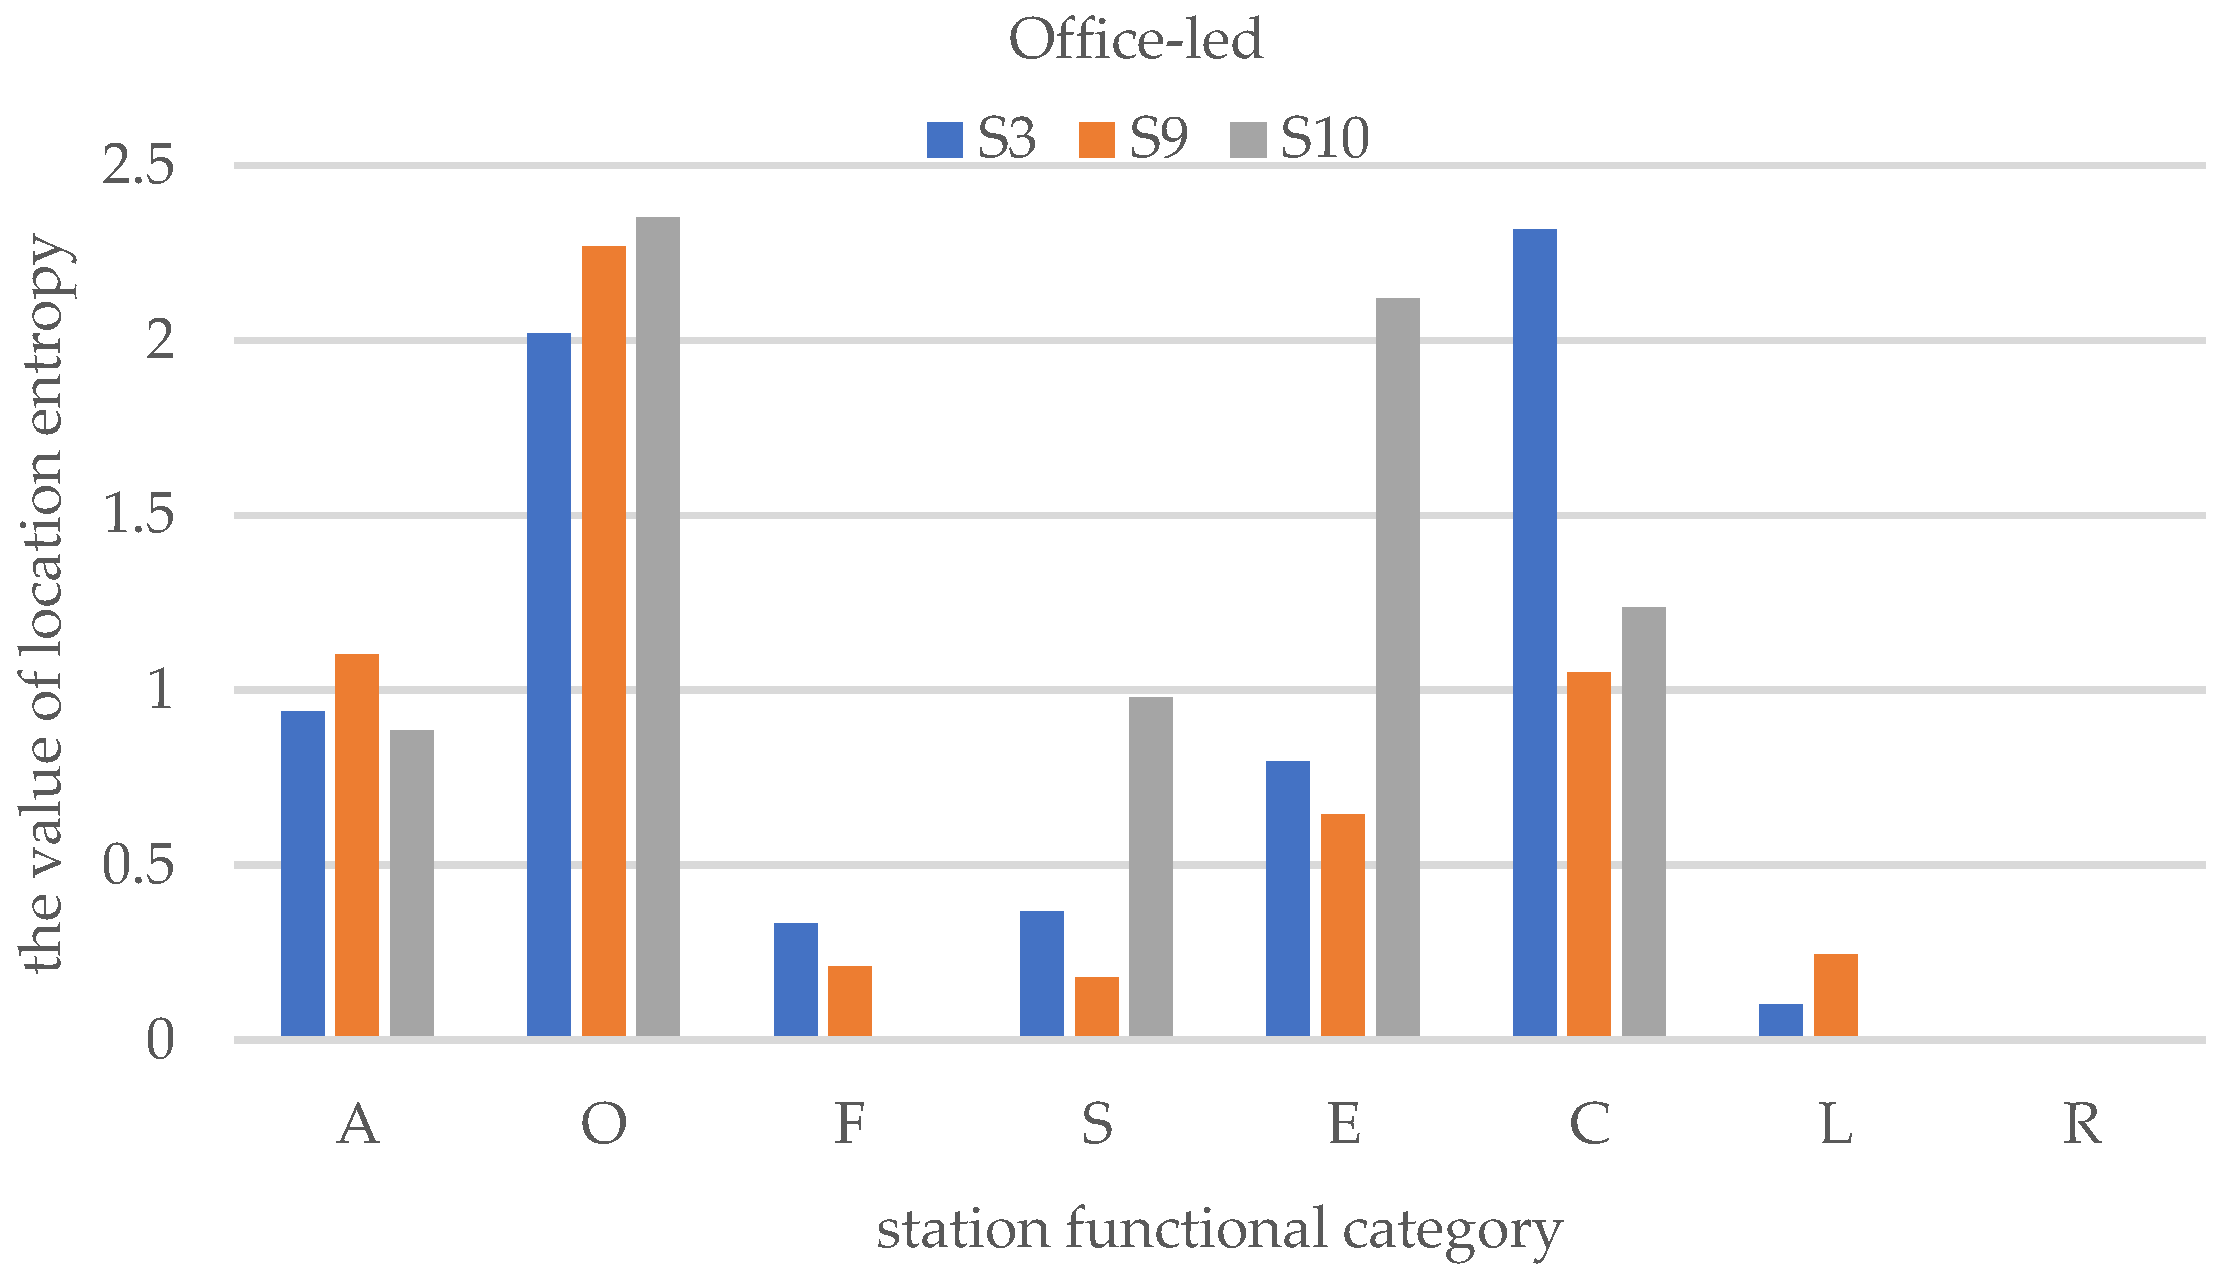
LE is commonly employed to assess the relative concentration of specific elements within a particular region, indicating the degree of specialization of those elements [33]. In the context of urban rail transit research, location entropy helps to examine the spatial distribution differences of specific functions and the land development characteristics associated with the degree of specialization around rail transit stations.
In this study, LE is utilized to analyze the specialization characteristics of different stations. By calculating the LE for each station, the researchers can assess the level of concentration and specialization of various land use functions in the vicinity of each station. This analysis provides insights into the unique characteristics and functional composition of different stations along the rail transit line.
By employing LE, the study aims to gain a deeper understanding of the spatial patterns and specialization of land use around the rail transit stations, thereby contributing to a comprehensive analysis of the functional organization and development of the area.
L Q i j = q i j / q i Q j / Q
where L Q i j is the functional elements of land use i in the station j entropy of location in the station, and q i j is the location entropy of the elements i in the station j number of POI in the station; q i is the functional element of the station i the total number of points of interest within the station’s sphere of influence; Q j indicates the total number of points of interest for the station j total number of POI; Q means the total number of land use functional elements within the station’s sphere of influence.
The LE can be divided into two categories based on the calculation of L Q i j :
  • High Entropy ( L Q i j > 1 ): Indicates a higher concentration of a specific functional element at a station compared to the overall study area. This suggests that the station has a specialization in that particular function. For example, a high L Q i j for commercial POIs at a station indicates a strong commercial presence, making it a commercial hub.
  • Low Entropy ( L Q i j < 1 ): Indicates a lower concentration of a specific functional element at a station compared to the overall study area. This suggests that the station has less specialization in that function. For example, a low L Q i j for residential POIs at a station indicates that residential activities are not a dominant feature of that station.
By calculating and classifying the LE, it is beneficial to better help us analyze the specialization characteristics of different stations.

3. Empirical Analysis and Results

3.1. Types of Station Functional Elements

In the study, the researchers utilized POI data, which are more comprehensive and reflective of the current land use status compared to traditional maps of urban land use. They extracted the dominant POI data types around each station based on eight categories: Residential Area (A), Office (O), Shopping (S), Catering & Food (F), Living Services (L), Financial Services & Economy (E), Culture, Science & Education (C), and Leisure & Recreation (R).
To classify the stations, buffer analysis was conducted for each station, and the data was normalized using weights assigned in Table 3. The mean proportions of each functional element around the stations were calculated, resulting in the following average values: Residential Area (35.44%), Office (31.97%), Shopping (4.80%), Catering & Food (11.72%), Living Services (3.89%), Financial Services & Economy (4.43%), Culture, Science & Education (7.61%), and Leisure & Recreation (0.15%). Generally, Residential (A) and Office types (O) accounted for a larger proportion, while Living Services (L) and Leisure & Recreation (R) accounted for a smaller proportion.
Based on the functional elements theory, stations were classified into different types. If a single functional element or the sum of two types of elements after normalization was greater than 50%, the station was categorized as a single-functional type. According to this theory, an important supplement is proposed: for the single-functional type, the contribution of a single element exceeds 50%, while for the mixed-functional type, the combined contribution of multiple elements surpasses 50%). If there were fewer functional elements in each category, the station was classified as underdeveloped based on the actual situation. Further classification was performed based on the major categories, determining the dominant functional land use of each station [34].
The results revealed two main categories: single-function and mixed-function stations. The single-function type was further divided into office-led, residence-led, and traffic-led subcategories. The mixed-function type was divided into four subcategories: residence-office mixed, catering-residence mixed, residence-science-education mixed, and science-education-catering mixed. Additionally, the development-deprived type was classified separately based on the available data, as shown in Table 4.
By completing the buffer analysis, data normalization, and subsequent classification process, the study successfully categorized the stations based on the dominant functional land use. This classification not only reflects the current land use status of each station but also provides a foundation for understanding the functional differences between stations, enabling further analysis and planning.
In this area, the main types observed are the AO mixed type and O dominant type, which represent the mixed-functional and single-functional categories, respectively. These types are also the most typical ones in their respective categories. Notably, the area’s significant characteristic is the emphasis on office-led development, which aligns with the commuting needs of the metro system and corresponds to the presence of numerous high-tech enterprises in the ELDZ. Taking Tongji Hospital Station (S3) as an example, the office category comprises a prominent 52.46% of the normalized POI data, despite its proximity to the hospital, which is a defining feature of this station.
Residential land also occupies a substantial proportion in the new urban area. Weilai 3rd Rd Station (S12) exemplifies a typical residential-led station, with the residential category accounting for 54.42%. The vicinity of this station exhibits a combination of various functional elements, including office, science and education, shopping, and living facilities.
Among all the station types, there are four stations classified as mixed residential and office (AO), accounting for the largest proportion, totaling 30.77% of all stations. Guanggu 5th Rd Station (S6) represents this type, where the sum of residential and office functional elements reaches a significant 61.90%. Consequently, the integration of residential and office land use has become the predominant form around this station.
Furthermore, Culture, Science & Education (C) play a significant role as functional elements in the new urban area. At Zuoling Station (S13), the combined percentage of science, education, culture, and catering functional elements reaches 50.77%. The surrounding area exhibits a relatively balanced distribution of schools, catering establishments, and other functional elements.
There are also underdeveloped areas within the new urban zone, where land is predominantly reserved as vacant space. This characteristic is inherent along the rail transit lines in the new cities. Weilai 1st Rd Station (S11) serves as an example of such an underdeveloped area, with limited available POI data. Consequently, the percentage of functional elements derived from the analysis may not effectively reflect the actual situation. Hence, this study identifies Weilai 1st Rd Station (S11) as a development-poor type. These are shown in Figure 7.

3.2. Circular Spatial Differentiation around the Station

To analyze the distribution of functional elements around each station, a multi-ring buffer zone is created with a radius of 800 m, at intervals of 200 m, with each station as the center. The number of functional elements within each buffer zone is normalized and analyzed. The results demonstrate a spatial stratification of functional elements, forming concentric circles from the innermost to the outermost zones (Figure 8).
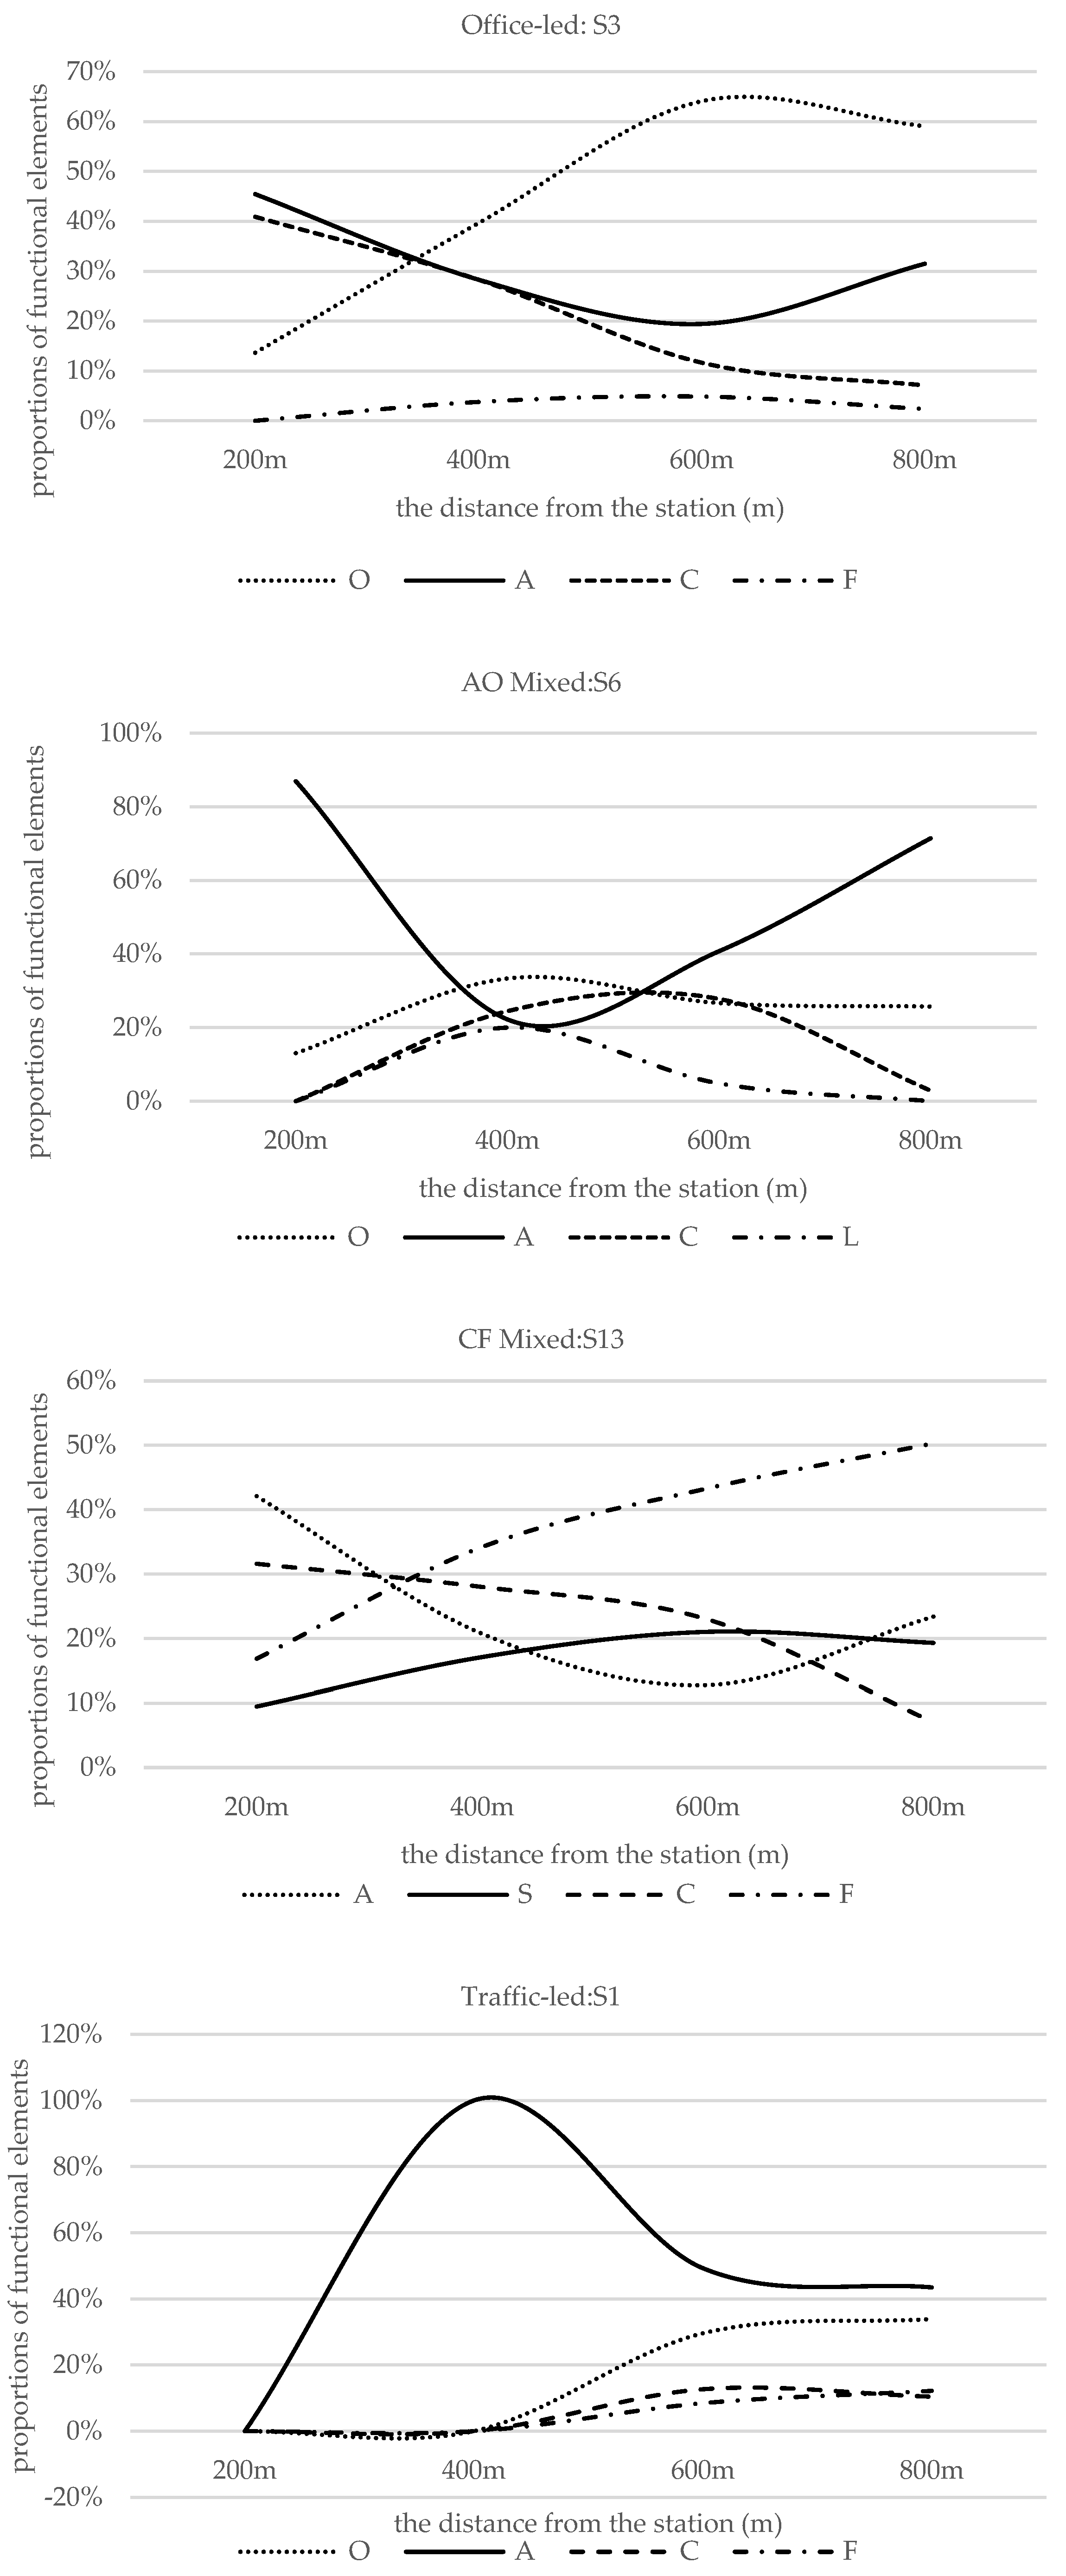
  • Within the first 200 m ring, there is a moderate concentration of functional elements, particularly residential areas and science and education facilities. This indicates a tendency for these types of functions to be located in close proximity to the central station.
  • Between the 200 and 400 m rings, there is another moderate aggregation of functional elements, including office spaces and various living services. This suggests that these functions tend to be distributed slightly further away from the center but still maintain a significant presence within the surrounding area.
  • Between the 400 and 800 m rings, a prominent dominance of the leading functional elements of each station is observed. This indicates that the primary function associated with each station becomes more prevalent as the distance from the center increases. In other words, the functional characteristics of the land surrounding each station display a spatial pattern where the leading functional elements become increasingly dominant as one moves farther from the center.
Figure 8. POI points within 0–800 m of influence.
Sustainability 16 06320 g008
From an analysis of the functional element types within each land circle around the stations, it can be observed that dominant types tend to cluster, while other types of functional elements are more evenly distributed. This finding aligns with the predictions made in Shuxin Jin et al.’s study, which suggests that a single element typically dominates around a particular station due to considerations of larger land potential [35]. However, this finding deviates somewhat from Bosin Tang’s research on the characteristics of residential and commercial land use around metro stations. The divergence may be attributed to variations in the level of urban land use tension [36].
In our study, specifically, office-led stations are surrounded by office buildings and industrial parks, which occupy a significant area primarily within a range of 400 to 800 m from the station. Related supporting services, on the other hand, are predominantly located within 400 m from the station.
Traffic interchange stations, due to their location as comprehensive transport hubs, have a larger coverage area of up to 400 m, primarily occupied by transport facilities. Other types of land use are relatively limited. Between 400 and 800 m, there is an increase in office, residential, science and education, catering, and other functional elements, indicating a certain level of centripetal concentration of land use beyond the immediate vicinity of the station.
Office–residence hybrid stations exhibit a dominance of residential land within 200 m of the station. Between 200 and 400 m, a balanced distribution of various land types is observed. Within 400 to 600 m, there is a certain proportion of office, residential, catering, and other functional elements, while the proportion of living service functional elements starts to decrease. By 600 to 800 m, residential land becomes the dominant land use type.
For science, education, and catering hybrid stations, the proportion of residential and science and education functional elements decreases as the distance from the station increases, while the proportion of catering and shopping functional elements increases.
These findings are illustrated in Figure 9, showcasing the changing proportions of functional elements as the distance from the station increases.
The study reveals that the area around 600 m from the station exhibits the highest density of functional elements. This finding diverges from the mainstream view that suggests a higher density of various functional elements closer to metro stations. However, this conventional perspective is primarily based on observations from older metro lines in already developed urban areas, where urban density is generally high and functional intensity is well-established [37,38,39].
In the case of new urban areas, similar to our findings, other studies support the notion that the intensity of functional elements is negatively affected by the distance from metro stations. For instance, Yuan Hua’s research (2018) [40] in Shanghai examined the geographical distribution of retail shops and their relationship with the underground network. The findings indicated that the density of commercial service elements, such as retail shops, decreases with increasing distance from metro stations. Particularly in less developed areas of the city, most commercial service elements are located outside the metro service area or at a certain distance from the stations.
In our study specifically, we create multi-ring buffer zones at 200 m intervals within an 800 m radius, centered around each station. We analyze the density share of functional elements based on the ratio of the area of each buffer zone, as illustrated in Figure 10. The results demonstrate a gradual increase in the density of functional elements from 0 to 600 m, followed by a decreasing trend from 600 to 800 m. The lowest density is observed within 200 m from the station, while the highest density is observed within the range of 400 to 600 m. Overall, the area around 600 m from a metro station appears to be the most densely populated with functional elements, providing the most adequate coverage.
These findings provide insights into the distribution and density of functional elements in relation to metro stations, specifically in new urban areas.

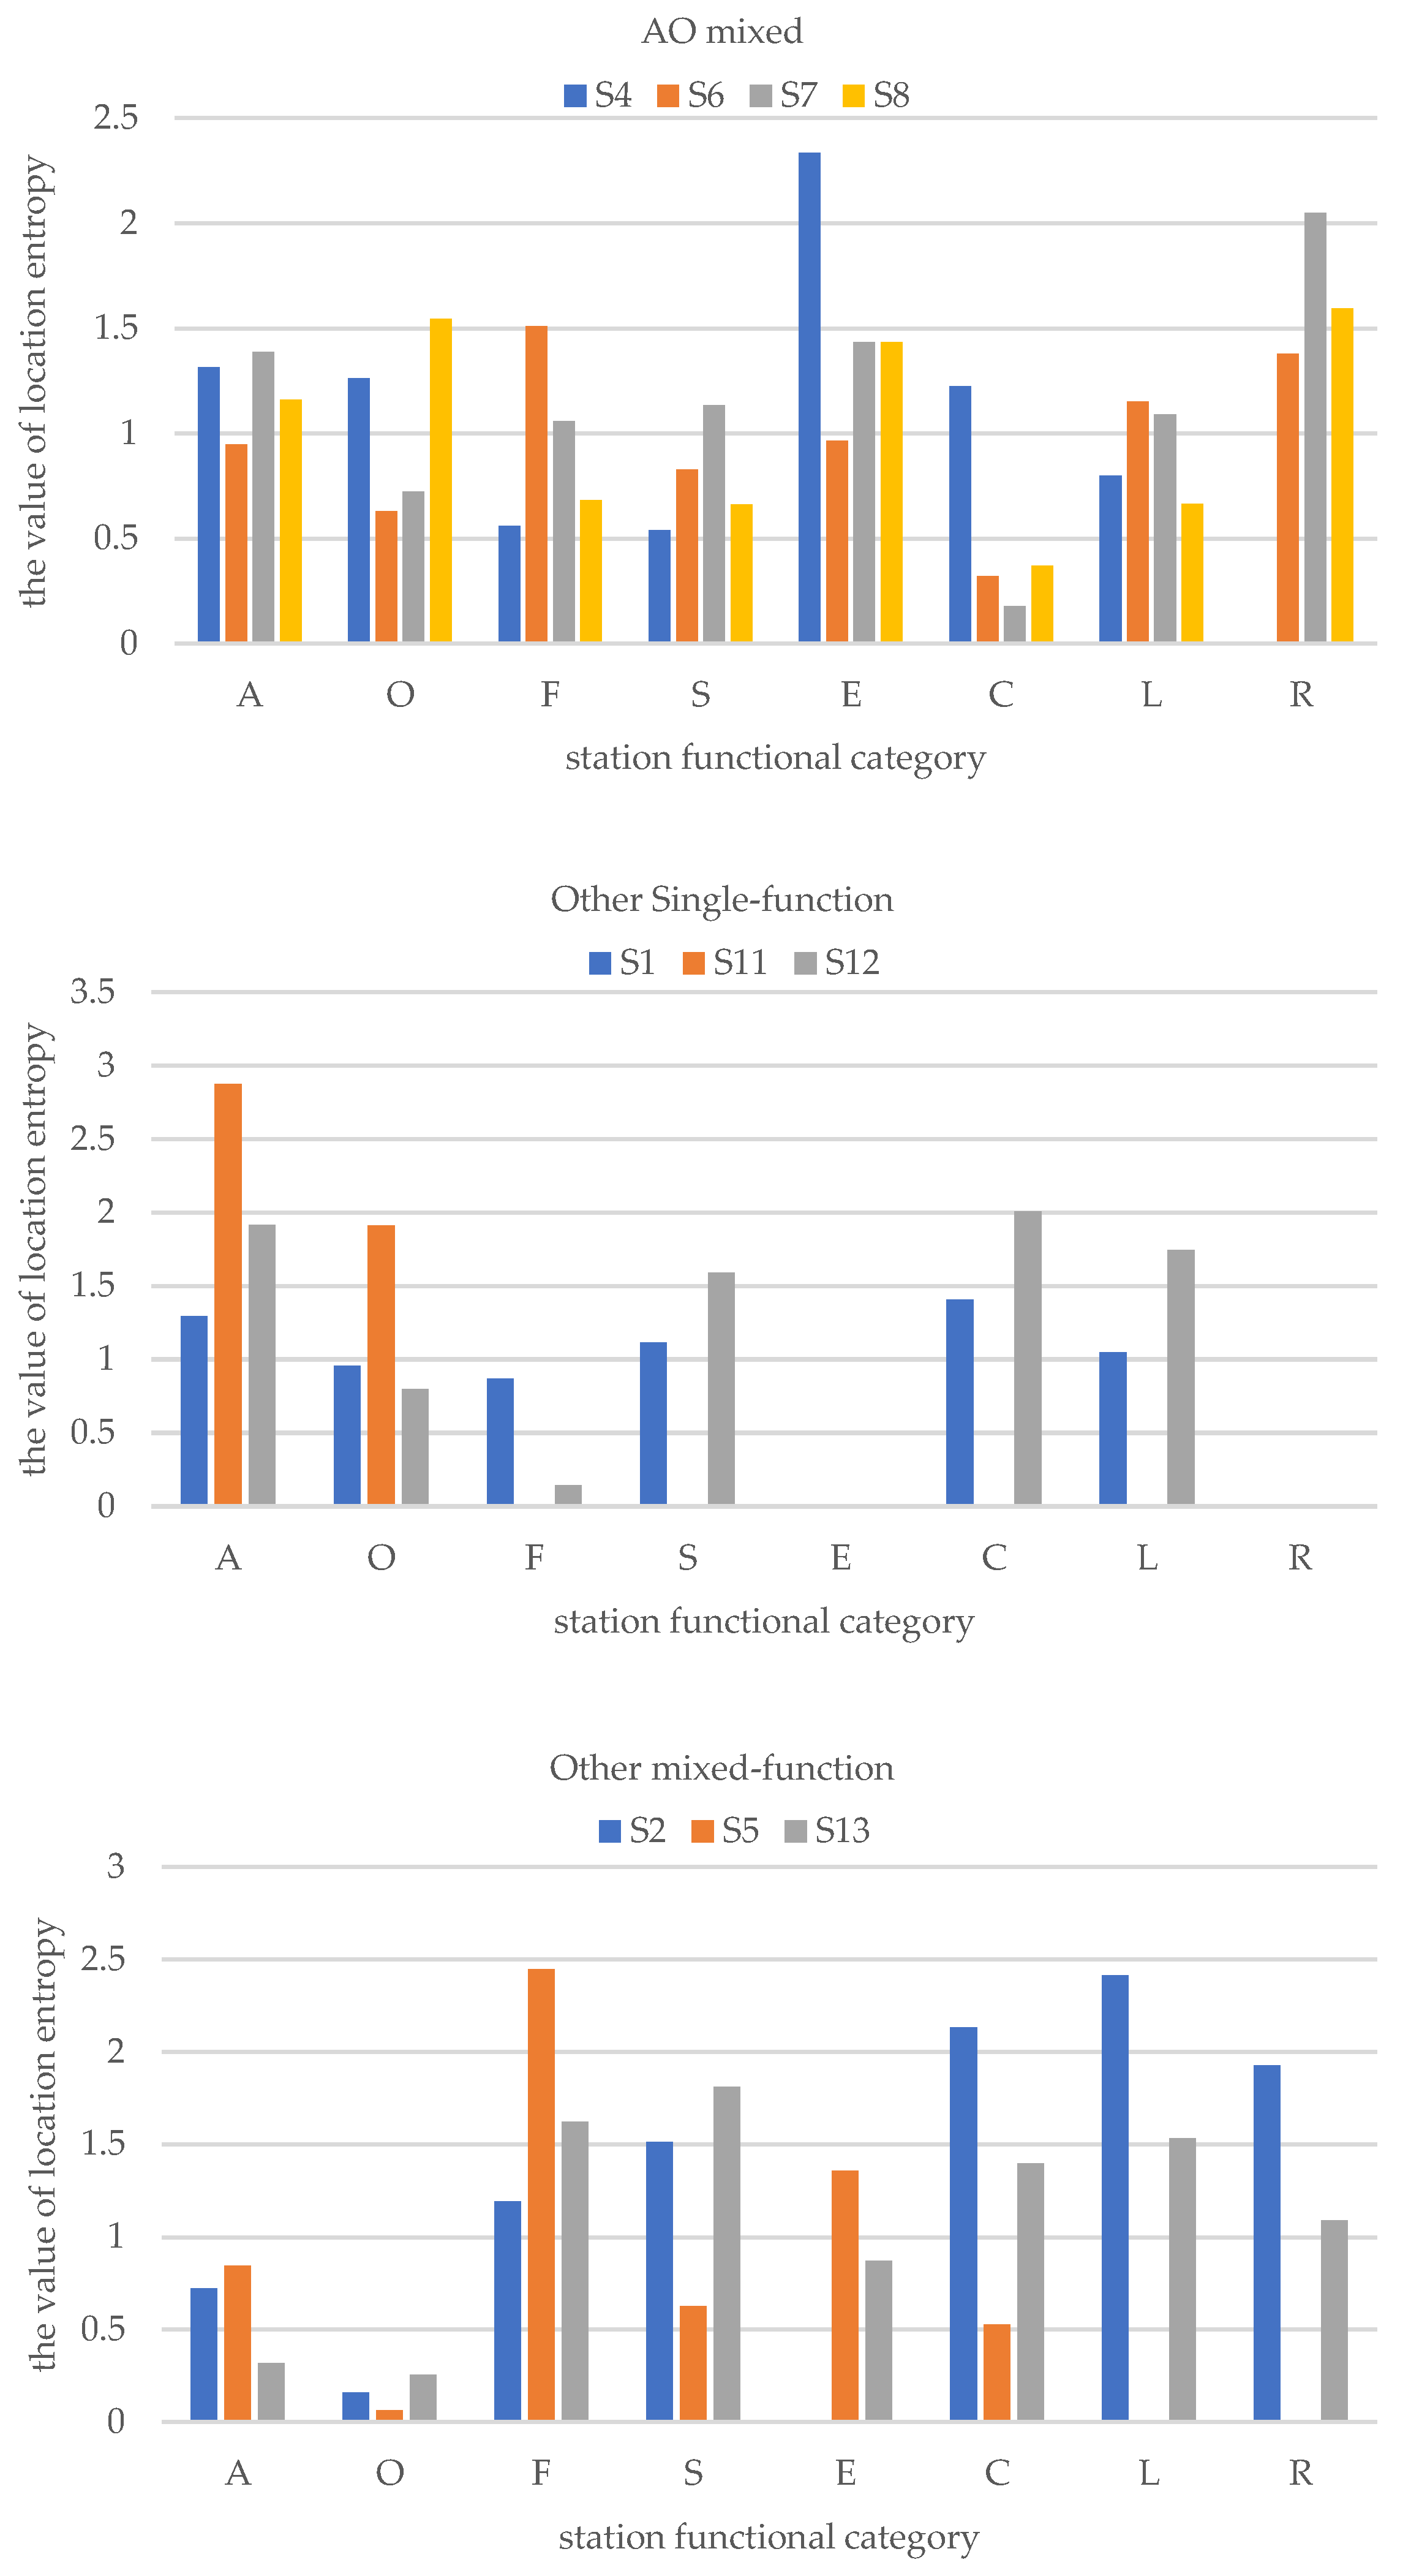
3.3. Characteristics of Elemental Intensity of Station Functions

The study conducted separate analyses of the elemental intensity characteristics for single-function and mixed-function stations, as depicted in Figure 11.
For single-function stations, the location entropy of each functional element type was calculated and analyzed. The results indicate that single-function stations have the advantage of a dominant function, with residence and office functions being the most prevalent. Office-dominant stations are primarily located on both sides of Guanggu Central City, exhibiting a high degree of specialization in office functions, along with moderate concentrations of science, education, culture, residential, and financial services. Tongji Hospital Station (S3) is in proximity to Huazhong University of Science and Technology (HUST) International Medical Centre and Guanggu Bio-city, showcasing prominent office and science education and culture functions, as well as residential, financial, and shopping functions. Changlingshan Station (S10) is surrounded by office functions such as Future Smart City and Beidou Building. However, due to the overall lower level of development around the station, there are fewer functional elements such as catering and living services. Guanggu 7th Road (S9) Station is situated in the eastern side of Guanggu Central City, featuring high land development intensity, clusters of technology enterprises, and moderate aggregation of various other functional elements. The degree of specialization in other single-function-led areas is relatively weak. Weilai 3rd Road Station (S12) is located in Wuhan Future Science and Technology City, and as a residence-led station, it is surrounded by more offices, shopping areas, cultural establishments, science and education facilities, and living services. Wuhandong Railway Station (S1), classified as a separate transport interchange, is surrounded by a variety of land types, with financial and recreational functional elements being less frequent compared to other functional elements, which are more evenly distributed. Weilai 1st Road Station (S11) is not discussed separately due to the lower intensity of development in the surrounding land.
Mixed-function stations are predominantly characterized by two dominant land use functions, along with other supporting land use functions. The most prominent mix of functions includes residential, office, catering, science and education, and financial services, with residential and office functions being the most significant. Mixed residential and office stations are concentrated in the central city area of Optics Valley (Guanggu), exhibiting relatively similar land use characteristics. Building upon the residential and office land use function dominance, Guanggu 5th Rd Station (S6) near Wuhan Joy City emphasizes catering, leisure, and entertainment. Guanggu Sixth Road Station (S7) and Baoxie Station (S8) near the China Construction Third Bureau Building, where financial institutions are concentrated, highlight the financial service function. Guanggu Bio-Park Station (S4) near the Optics Valley Financial Centre is notable for its financial service function.
Other mixed-function stations have their own geographical specialization characteristics. Guanggu 4th Road Station (S5) is located in the central city of Guanggu. Unlike the aforementioned mixed-function residential and office stations, the relatively late development of the land around this station resulted in the numerous restaurants in the nearby Wuhan Joy City commercial complex having a greater impact on the geographical specialization. Hukou Station (S2) is positioned in the vicinity of Hubei No. 2 Teachers College and Hubei Sports Vocational College, and it is close to the Hukou community, which is characterized by cultural, scientific, educational, residential, and living service functions. Zuoling Station (S13) is situated on the periphery of the Wuhan administrative district, and the station is near the relatively independent Zuoling community, which exhibits more uniform distribution of various functional elements, except for offices.

3.4. Spatial Organization Patterns of Land

According to the analysis of the land surrounding the station, the differentiation pattern of the station can be described as a “core-diffusion” pattern, with the station as the center radiating outwards. The pattern is summarized as follows:
  • Within a radius of 200 m from the station: This area exhibits a high intensity of function mixing and development. It is the core area where different functions come together and interact. The mixing of various functions is prominent, and the development intensity is high.
  • Within a radius of 200–400 m from the station: In this area, there is a concentration of similar functions. The functions tend to cluster together and exhibit a higher degree of specialization. The area shows a certain level of functional homogeneity.
  • Within a radius of 400–800 m from the station: In this area, the functions become relatively dispersed and show a tendency to diffuse outwards. The mixing of different functions decreases compared to the core area. The functions in this area are more spread out.
The study concludes that for single-function stations, the dominant function remains distinct and obvious as it spreads outward from the station (Figure 12). While there may be some mixing with other functions, the intensity of mixed development is low. On the other hand, for mixed-function stations, the core area consists of two or more functional units with a high degree of aggregation. In this core area, the intensity of mixed development is higher, and there is a corresponding formation of service relationships between the different functions. As the distance from the station increases, the spatial arrangement of functions in the outer ring areas exhibits the “core-diffusion” pattern once again.
This analysis highlights the spatial dynamics and patterns of functional development around the stations, providing insights into the distribution and mixing of different functions within different radii from the station.
In the station-centered “core-diffusion” mode, the spatial pattern of service can be divided into two modes: “independent” development mode and “continuous” development mode, depending on the distance and radius from the station. These modes are further categorized into three spatial organizational modes for the stations along Wuhan Rail Transit Line 11, as shown in Figure 13. These modes are described as follows:
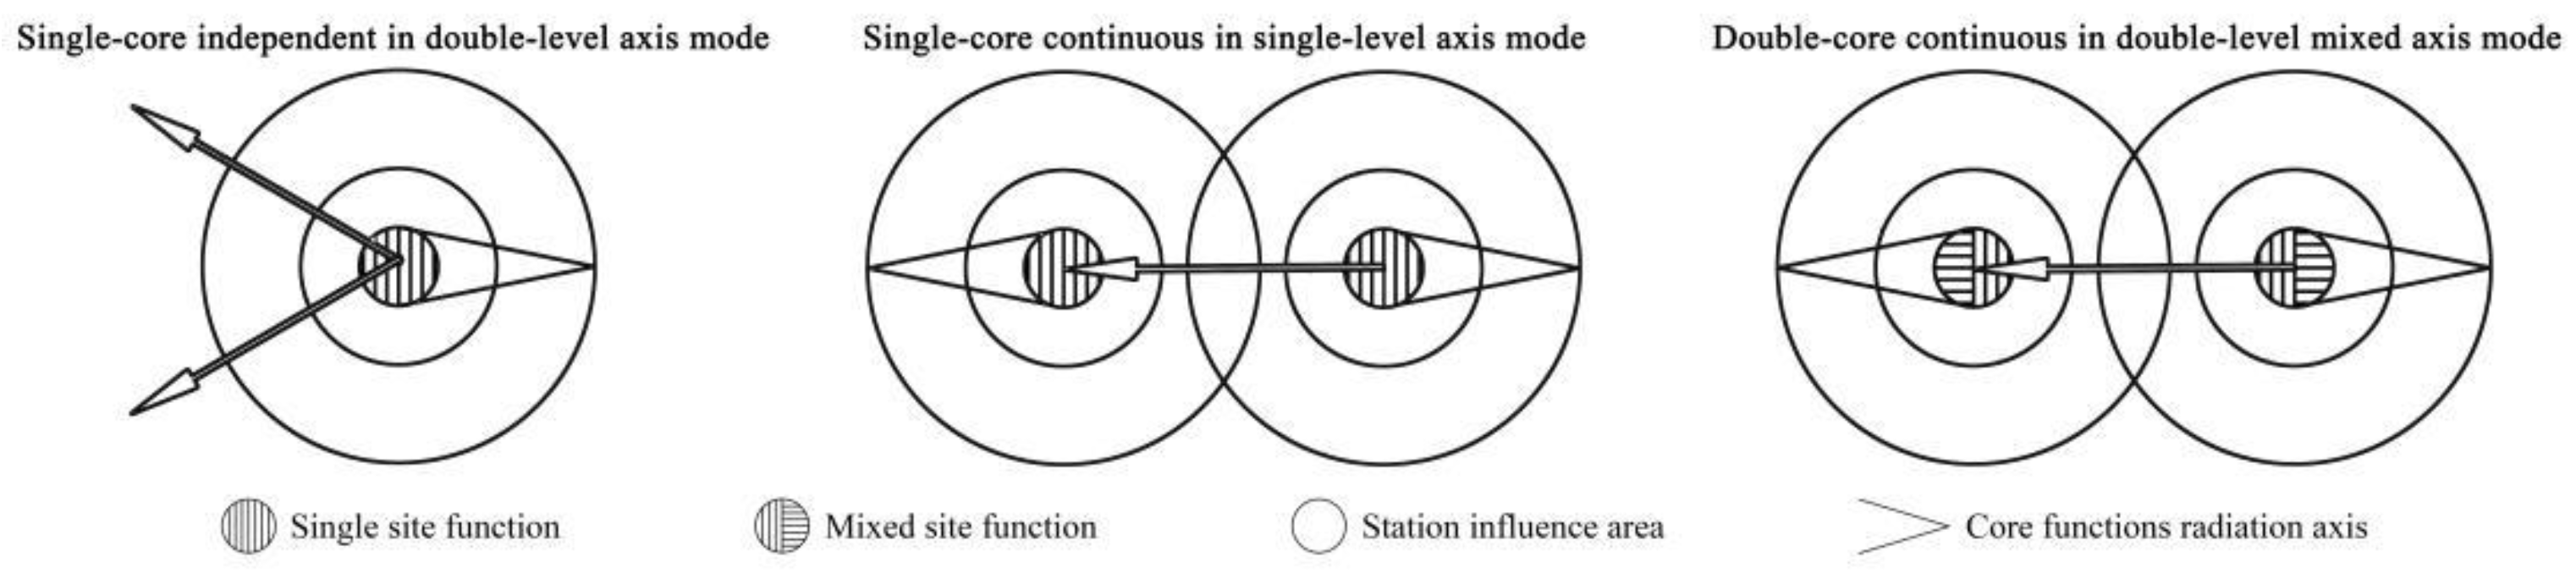
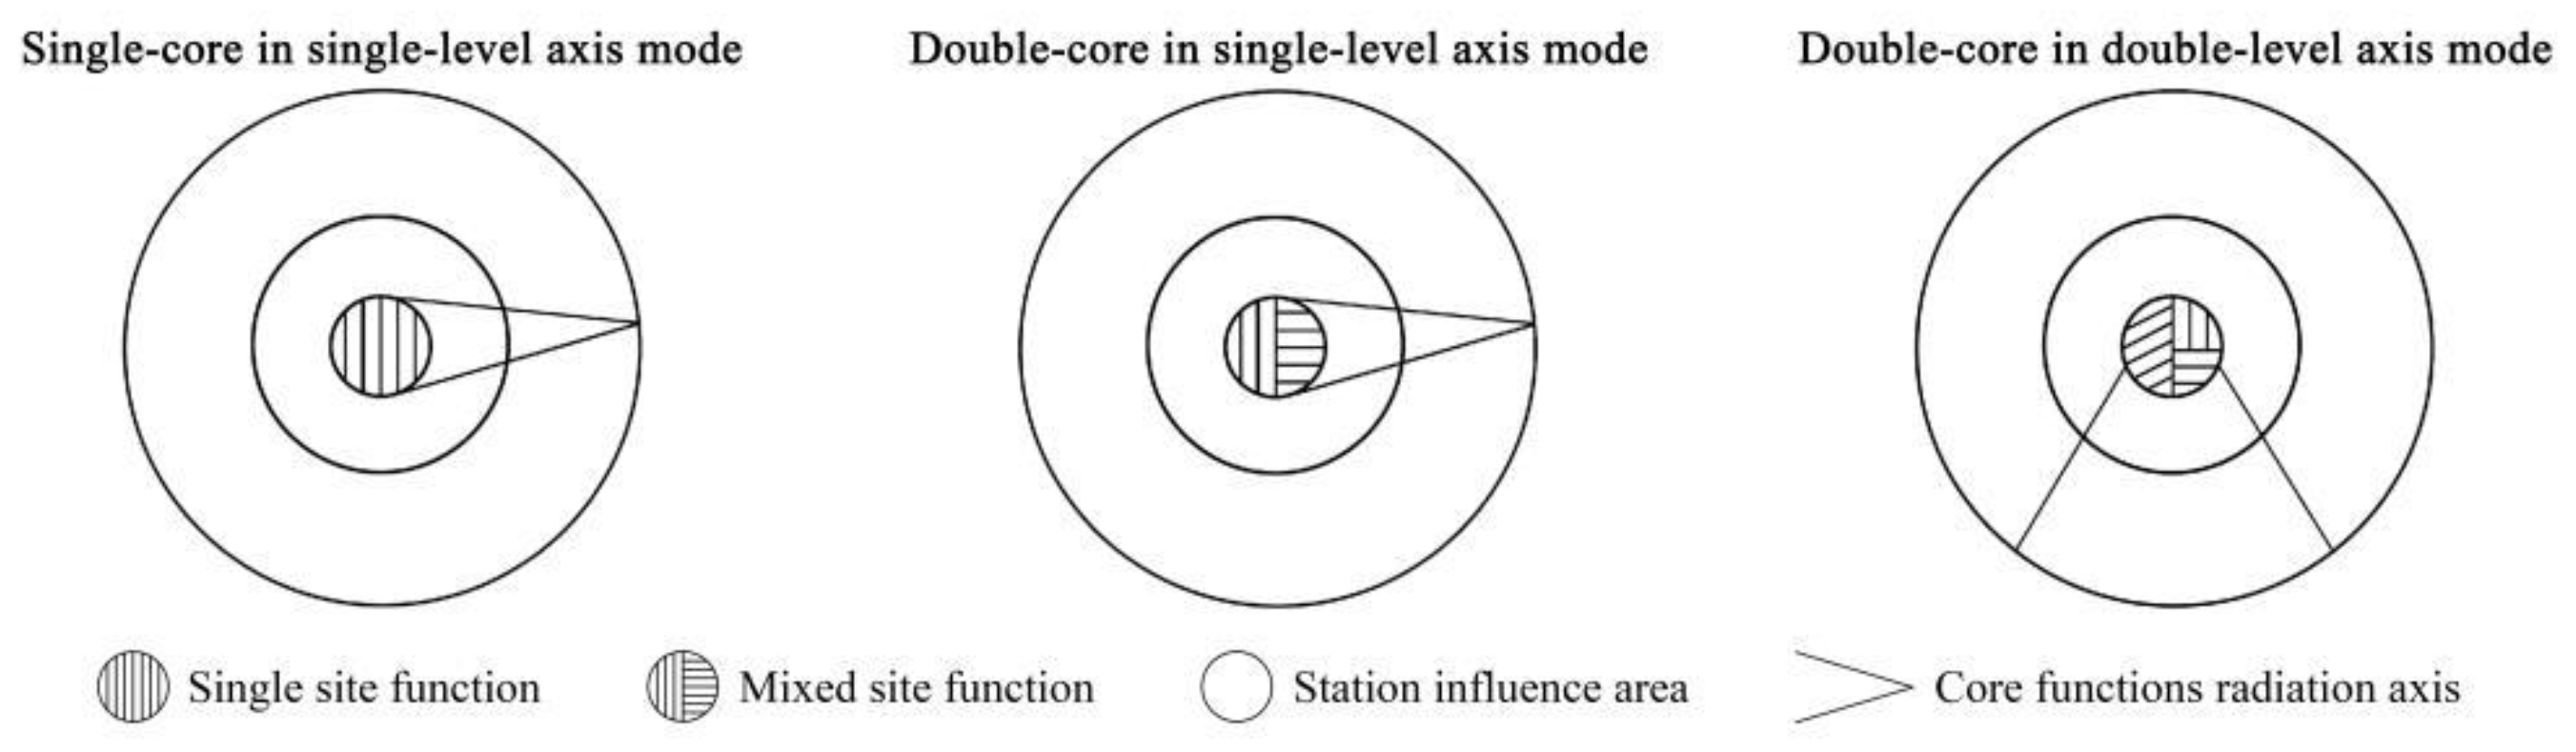
  • Single-core independent in double-level axis mode: This mode refers to stations where the station has a single core within a small radius, and the functions are independently developed in two different levels or axes. In this mode, there is a clear separation between the functions within each level or axis, and they do not mix or interact significantly. Each axis has its own concentration of specific functions. This mode is typically observed when the station has a small radius and is surrounded by distinct functional areas.
  • Single-core continuous in single-level axis mode: This mode pertains to stations where the station has a single core within a certain radius, and the functions continuously develop along a single level or axis. In this mode, the functions maintain a relatively continuous and homogeneous distribution along the axis, with a gradual transition between different functional areas. The mixing of functions is moderate, and there is a clear spatial continuity along the axis. This mode is commonly seen when the station has a larger radius and is characterized by a more uniform distribution of functions.
  • Double-core continuous in double-level mixed axis mode: This mode refers to stations where the station has two cores within a larger radius, and the functions continuously develop along two different levels or axes. In this mode, there are two distinct functional cores that are connected by a mixed development area. The functions in each core are relatively concentrated and specialized, while the mixed development area between the cores exhibits a higher intensity of mixing and interaction between different functions. This mode is typically observed when the station has a larger radius and represents a more complex spatial arrangement of functions.
These three spatial organizational modes capture the different patterns of development and function mixing observed along Wuhan Rail Transit Line 11. They provide a framework for understanding the spatial dynamics and organization of services in relation to the stations and their surrounding areas.
The comparison with Jie Zhang’s study on the functional organization pattern of the land around Changchun LRT Line 3 station highlights the spatial organization patterns in Changchun, which include single-core in a single axis, double-core in a single axis, and double-core in a multi-pole axis (see Figure 14) [41]. These patterns indicate the role of the axial direction and its influence on spatial connections, which can attract passenger flow and generate revenue.
In contrast, the spatial organization pattern of the stations around the stations of Wuhan Metro Line 11, as summarized in this study, suggests a relatively favorable condition for generating revenue. This is supported by the financial performance of Wuhan Metro, which reported a net profit of CNY 1.570 billion in 2022. On the other hand, Changchun’s LRT Line 3 recorded a loss of up to CNY 3.722 billion in the same year (Changchun Railway Traffic Group Co., Ltd. (Changchun, China) 2022 Annual Report, Shanghai Clearing House. https://www.shclearing.com.cn/xxpl/cwbg/nb/202304/t20230428_1229518.html (accessed on 2 February 2024)).
Despite Changchun LRT Line 3 being primarily located in the city center, its passenger flow intensity is only 0.4557 (Changchun Railway Traffic Group Co., Ltd. http://www.ccqg.com/ (accessed on 2 February 2024)), which is lower than the passenger flow intensity of Wuhan Metro Line 11, which serves new developing or suburban areas and has a passenger flow intensity of 0.4725. This contrast further reinforces the notion that the spatial organization pattern of the sites around the stations of Wuhan Metro Line 11 is relatively favorable for generating revenue.
It is important to note that revenue generation in transportation systems is influenced by various factors, including passenger demand, fare structures, operating costs, and overall economic conditions. While the spatial organization pattern can play a role in attracting passenger flow and generating revenue, it should be considered alongside other factors when analyzing the financial performance of a transit system.

4. Conclusions

This paper focuses on the case of Wuhan Rail Transit Line 11 and utilizes POI data, buffer zone analysis, intersection analysis, and location entropy methods to study the functional elements, spatial differentiation, territorial specialization, and spatial organization mode of the land around the rail transit stations in the new urban areas. The main conclusions drawn from the study are as follows:
  • Classification of stations based on functional elements: The stations are categorized into single-function, mixed-function, and development-poor based on the number and types of functional elements in their periphery. Single-function stations are surrounded by one type of functional element, mixed-function stations have a large number of one or two types of functional elements, and development-poor stations have a small number of functional elements. This categorization reveals that the functional mix and attractiveness of stations to the surrounding area are crucial for increasing passenger flow and operational efficiency, thus impacting the profitability of the metro system.
  • Spatial differentiation of functional types: The functional types of the stations show spatial differentiation in the form of concentric circles. Each circle exhibits changes in the dominant functional element types. The different station types also influence the dominant functional elements within each circle. The spatial differentiation of functionality and the changing patterns of element density are important for improving passenger flow and operational efficiency. Enhancing station attractiveness, particularly through the concentration and optimization of functional elements within specific circles, plays a key role in improving the overall profitability of the metro system.
  • Geographic specialization of functions: Single-function stations exhibit prominent dominance of the dominant function, with other functional elements showing a lower degree of aggregation. Mixed-function stations have multiple functional elements aggregated, reflecting mixed development characteristics.
  • Spatial organization modes: The spatial organization modes of the land use functions around the stations are summarized based on the dominant functions and geographical layout characteristics. Three modes are identified: “single-core independent in two-level axis mode,” “single-core continuous in single-level axis mode,” and “double-core continuous in two-level axis mode.” Each mode has unique characteristics that influence passenger flow attraction and operational efficiency, thereby impacting the overall profitability of the metro system.
The knowledge gained from the construction of Wuhan Rail Transit Line 11 can serve as a reference for other cities, including those in South America, South Asia, Africa, and other rapidly developing regions. The construction of new urban areas requires comprehensive consideration of sustainable development, with rail transport playing a key role in driving high-quality urban growth [42]. The functional organization pattern observed in Wuhan Metro Line 11, characterized by a circle structure and TOD (Transit-Oriented Development) principles, promotes land use efficiency, reduces reliance on private transport, and provides a valuable model for future urban planning and rail development. The successful case study of Wuhan Rail Transit Line 11 can serve as a reference for other cities in coordinating land use development and rail transit planning, supporting the high-quality development of new urban districts.

5. Discussion and Outlook

This study conducted a detailed analysis of the new development areas around urban rail transit stations, focusing on Line 11 of Wuhan, to explore the spatial organization and functional elements of urban rail transit systems. Although the findings are substantial, the study still has limitations, pointing to new directions for future research.
  • In the process of data selection, because the actual flow of people at the site and other data sets are one-off, it is difficult to verify their accuracy at a larger level through mathematical methods, which makes it very challenging to form a more general mathematical model. For example, for the kernel density method and entropy value calculation, cross-validation and plug-in methods require a longer period of time to establish and compare more databases.
  • The impact of land scarcity on the distribution of functional elements: The study reveals the impact of land scarcity on the distribution of functional elements. Under the perspective of studying Wuhan as a case, rapid urbanization, the concentration of high-tech enterprises, and the development of new districts may lead to deviations from the results of Bosin Tang’s study [36]. Detailed analysis of how land scarcity and urban policies affect the distribution of functional elements can provide a clearer understanding of the observed differences. However, this study has not fully explored the specific impact mechanisms of land scarcity on the distribution of functional elements, for example how land scarcity affects the competition and synergy between different functional elements.
  • Impact on land use strategy: Classifying stations into single-function, mixed-function, and underdeveloped types provides some insights into land use strategy. However, this study has not yet delved deeply into how these types specifically influence the formulation of regional land use strategies. Future research needs to analyze in more detail the impact of different station types on the surrounding land market, traffic flow, and resident behavior, as well as how these analyses can be translated into specific planning guidelines.
  • Comparison with other urban models: The focus of this study on Wuhan’s “core-diffusion” model may differ from other urban models due to differences in urban density, development history, and transportation system design. More cross-city comparisons are needed to identify key factors that influence the differences in models, such as city size, transportation network design, and cultural background, and to explore how these factors influence urban planning practices.
This study provides empirical foundations for urban planning and the transportation industry by exploring the close link between land use and urban rail transit. For example, the study reveals how high-quality urban growth can be achieved through fine-tuned land use planning and urban rail transit system design in the process of rapid urbanization, using the Wuhan Line 11 as a case study. The study findings emphasize the necessity of implementing the TOD principle, providing strategic guidance for creating efficient, livable, and economically prosperous urban environments. At the same time, this study also points the way forward for future research, encouraging further exploration of the interaction between urban rail transit systems and urban development to leverage the rail transit system as an important force for promoting sustainable urban development.

Author Contributions

Conceptualization, Y.Y. and J.Z. (Juncheng Zeng); methodology, Y.Y. and G.X.; software, J.Z. (Juncheng Zeng); validation, J.Z. (Juncheng Zeng), J.Y., X.W. and P.W.; formal analysis, T.C.; investigation, J.Z. (Jie Zhou); resources, Y.Y.; data curation, J.Z. (Juncheng Zeng); writing—original draft preparation, Y.Y. and J.Z. (Juncheng Zeng); writing—review and editing, J.R., W.A. and S.O.M.; visualization, J.Z. (Juncheng Zeng) and J.Y.; supervision, C.J.; project administration, Y.Y. All authors have read and agreed to the published version of the manuscript.

Funding

This research was funded by Fund on Key Laboratory of New Technology for Construction of Cities in Mountain Area (LNTCCMA-20230103), Fund on Yunnan Province Philosophy and Social Science Planning Project: A Study on the Mechanism and Optimization Path of the Impact of Urban Compactness in the Central Yunnan Urban Agglomeration on Green Total Factor Productivity (YB2023090), Fund on Yunnan University (2023Y43, 202301138, 202307058).

Institutional Review Board Statement

Ethical review and approval were waived for this study due to the geographic information data used are obtained from publicly released reports by the government and companies, and do not involve the interests of the individuals and groups of the respondents.

Informed Consent Statement

Informed consent was obtained from all subjects involved in the study.

Data Availability Statement

Restrictions apply to the availability of these data. Data were obtained from Amap and are available at https://lbs.amap.com/ (accessed on 14 March 2023) with the permission of Amap.

Acknowledgments

We would like to express our deepest gratitude to Jun Zhang of Yunnan University for his invaluable guidance and insights throughout this study. His expertise and support have been fundamental to the success of our research. Special appreciation is also extended to Zhao of Huazhong University of Science and Technology for her thoughtful advice and contributions, which have significantly enriched our work. We are grateful for the financial support provided by project on research and education reform in Yunnan University, which was instrumental in facilitating our research activities. Our sincere thanks go to the School of Architecture and Planning at Yunnan University, the Technical University of Berlin, Huazhong University of Science and Technology, and Hanyang University ERICA for their support and resources that were crucial for our research. This study benefited immensely from the collaborative environment and the supportive academic community. We acknowledge everyone involved for their dedication and commitment to advancing knowledge in urban planning and transportation.

Conflicts of Interest

The authors declare no conflicts of interests.

References

  1. Song, Y.; Wang, Y.; Zhou, M. Public Space Satisfaction Evaluation of New Centralized Communities in Urban Fringe Areas—A Study of Suzhou, China. Int. J. Environ. Res. Public Health 2022, 20, 753. [Google Scholar] [CrossRef] [PubMed]
  2. Hu, Y.; Huo, M.; Qin, G. The rail transportation and bus intelligent connection under the comprehensive transportation system. In Proceedings of the Second International Conference on Intelligent Transportation, Chengdu, China, 25–27 November 2015; Springer: Singapore, 2017; pp. 57–62. [Google Scholar]
  3. Yan, C.; Tong, Q. Analysis of the evolutionary game between the government and urban rail transit enterprises under the loss-subsidy mode: A case study of Beijing. Sustainability 2021, 13, 8041. [Google Scholar] [CrossRef]
  4. Li, L.; Muraki Asano, C.; Asano, A. Dual primitive estimation for morphological texture analysis. In Proceedings of the 10th International Symposium on Communications and Information Technologies, Tokyo, Japan, 26–29 October 2010; pp. 149–152. [Google Scholar]
  5. Cowie, J.; Loynes, S. An assessment of cost management regimes in British rail infrastructure provision. Transportation 2012, 39, 1281–1299. [Google Scholar] [CrossRef]
  6. Wang, Q.; Schonfeld, P.; Deng, L. Profit Maximization Model with Fare Structures and Subsidy Constraints for Urban Rail Transit. J. Adv. Transp. 2021, 2021, 6659384. [Google Scholar] [CrossRef]
  7. Wang, J.; Wan, F.; Dong, C.; Yin, C.; Chen, X. Spatiotemporal effects of built environment factors on varying rail transit station ridership patterns. J. Transp. Geogr. 2023, 109, 103597. [Google Scholar] [CrossRef]
  8. Chen, F.; Wang, Z.J. Study on Civil Cost Control of Urban Rail Transit Underground Station. In Proceedings of the Key Technologies of Railway Engineering—High Speed Railway, Heavy Haul Railway and Urban Rail Transit, Beijing, China, 20–22 August 2010; pp. 109–114. [Google Scholar]
  9. Yan, D.; Xing, S.; Yang, E.; Wang, M.; Sun, W. Dynamic scheduling of intelligent Rail Guided Vehicle based on queuing theory. In Proceedings of the 2020 Chinese Control and Decision Conference (CCDC), Hefei, China, 22–24 August 2020; pp. 3808–3813. [Google Scholar]
  10. Albalate, D.; Bel, G.; Fageda, X. Competition and cooperation between high-speed rail and air transportation services in Europe. J. Transp. Geogr. 2015, 42, 166–174. [Google Scholar] [CrossRef]
  11. Yang, Q. Evaluation of Wuhan Urban Rail Traffic Network Financial Solution Design. In Proceedings of the 2008 International Conference on Construction & Real Estate Management, Toronto, ON, Canada, 4–5 October 2008; Volumes 1 and 2, pp. 1500–1504. [Google Scholar]
  12. Katsumi, M.; Fox, M. Ontologies for transportation research: A survey. Transp. Res. Part C Emerg. Technol. 2018, 89, 53–82. [Google Scholar] [CrossRef]
  13. Ziemke, D.; Nagel, K.; Moeckel, R. Towards an agent-based, integrated land-use transport modeling system. Procedia Comput. Sci. 2016, 83, 958–963. [Google Scholar] [CrossRef]
  14. Perrott, F.C.; Renfrew, A.C. Utility–utilization of transport infrastructure and land through information technology. Proc. IMechE Railtech 1998, 98, 87–94. [Google Scholar]
  15. Cao, H.Y.; Liu, Z.J.; Jia, H.M.; Duan, M.Z. Rail Transit—An inevitable choice for China Urban Transport. In Proceedings of the 2011 International Conference on Engineering and Risk Management, Toronto, ON, Canada, 28–30 October 2011; pp. 297–300. [Google Scholar]
  16. Lv, C. Characteristics of pre-study of rail transit backbone lines running through new urban areas. Railw. Stand. Des. 2022, 66, 25–29. [Google Scholar]
  17. Zhao, L.; Shen, L. The impacts of rail transit on future urban land use development: A case study in Wuhan, China. Transp. Policy 2019, 81, 396–405. [Google Scholar] [CrossRef]
  18. Wang, Y.; Yun, Y.; Gao, C. Research on the development mode of fringe towns of large cities under the influence of rail transport—A comparative analysis of Paris and Tianjin. Urban Plan. 2017, 41, 40–44+88. [Google Scholar]
  19. Wang, S.; Sun, L.; Rong, J. Study on the attraction range of Beijing railway stations. Transp. Syst. Eng. Inf. 2013, 13, 183–188. [Google Scholar]
  20. Kim, J.; Houston, D.; Cho, J.; Lo, A.; Shareem, N. Transit Investment Impactson Land Use Beyond the Half-Mile Mark. UC Office of the President: University of California Institute of Transportation Studies. 2017. Available online: https://escholarship.org/uc/item/6cv0d1rs (accessed on 2 February 2024).
  21. Yang, J.; Duan, Y.; Le, X. Land Preparation Practice for Comprehensive Development under TOD Strategy—Taking Shanghai, Shenzhen and Dongguan as Examples. Int. Urban Plan. 2020, 35, 124–130. [Google Scholar]
  22. Nyunt, K.T.K.; Wongchavalidkul, N. Evaluation of Relationships Between Ridership Demand and Transit-Oriented Development (TOD) Indicators Focused on Land Use Density, Diversity, and Accessibility: A Case Study of Existing Metro Stations in Bangkok. Urban Rail Transit 2020, 6, 56–70. [Google Scholar] [CrossRef]
  23. Chen, Y.; Lin, N.; Wu, Y.; Ding, L.; Pang, J.; Lv, T. Spatial equity in the layout of urban public sports facilities in Hangzhou. PLoS ONE 2021, 16, e0256174. [Google Scholar] [CrossRef] [PubMed]
  24. Chen, Y.; Lin, N.; Wu, Y.; Ding, L.; Pang, J.; Lv, T. Spatiotemporal heterogeneity analysis of influence factor on urban rail transit station ridership. J. Transp. Eng. Part A Syst. 2022, 148, 04021115. [Google Scholar]
  25. Li, J.; Yao, M.; Ji, F.; Xiang, L. Impact of land use mixing degree on passenger flow in rail transit stations. J. Tongji Univ. (Nat. Sci. Ed.) 2016, 44, 1415–1423. [Google Scholar]
  26. Gu, J.; Shi, X. Relationship between passenger flow characteristics and peripheral land use in Shenzhen rail stations. Traffic Transp. 2019, 35, 47–50. [Google Scholar]
  27. Zheng, M.; Wang, H.; Shang, Y.; Zheng, X. Identification and prediction of mixed-use functional areas supported by POI data in Jinan City of China. Sci. Rep. 2023, 13, 2913. [Google Scholar] [CrossRef]
  28. Cao, G.; Gu, C.; Zhang, Q. Identification and pattern analysis of “three life spaces” in central urban areas based on POI data—Taking the central urban area of Shanghai as an example. J. Urban Plan. 2019, 2, 44–53. [Google Scholar]
  29. Zhang, Z.; Yang, J. The density fraction estimation of coarse coal by use of the kernel method and machine vision. Energy Sources Part A Recovery Util. Environ. Eff. 2015, 37, 181–191. [Google Scholar] [CrossRef]
  30. Zheng, Z.; Qiu, F.; Zhang, X. Heterogeneity of correlation between the locational condition and industrial transformation of regenerative resource-based cities in China. Growth Chang. 2020, 51, 771–791. [Google Scholar] [CrossRef]
  31. Pinar-Pérez, J.M.; Ruiz-Hernández, D.; Menezes, M.B.C. Market proliferation and the impact of locational complexity on network restructuring. Appl. Math. Model. 2022, 104, 315–338. [Google Scholar] [CrossRef]
  32. Weliange, S.D.S.; Fernando, D.; Withanage, S.; Gunatilake, J. A GIS based approach to neighbourhood physical environment and walking among adults in Colombo municipal council area, Sri Lanka. BMC Public Health 2021, 21, 989. [Google Scholar] [CrossRef]
  33. Coppola, E.; Rouphael, Y.; De Pascale, S.; Moccia, F.D.; Cirillo, C. Ameliorating a complex urban ecosystem through instrumental use of softscape buffers: Proposal for a green infrastructure network in the metropolitan area of Naples. Front. Plant Sci. 2019, 10, 410. [Google Scholar] [CrossRef]
  34. Li, W.; Zhou, M.; Dong, H. Classifications of stations in urban rail transit based on the two-step cluster. Intell. Autom. Soft Comput. 2020, 26, 531–538. [Google Scholar] [CrossRef]
  35. Jin, S.; Wang, D.; Su, B. Functional orientation and spatial siting of subway stations based on land potential and mixed land use. Ain Shams Eng. J. 2022, 13, 101733. [Google Scholar] [CrossRef]
  36. Tang, B.S.; Wong, S.W.; Ho, W.K.; Wong, K.T. Urban land uses within walking catchment of metro stations in a transit-oriented city. J. Hous. Built Environ. 2020, 35, 1303–1319. [Google Scholar] [CrossRef]
  37. Deng, Y. Trajectories and organisational patterns of urban physical space renewal in rail transit station domains—A case study of Beijing. Geoscience 2017, 37, 817–824. [Google Scholar]
  38. Tan, Z.; Li, S.; Li, X.; Liu, X.; Chen, Y.; Li, W. Spatial and temporal effects of urban rail transport on land use change. J. Geogr. 2017, 72, 850–862. [Google Scholar]
  39. Lv, X. Exploration of transport facilities articulation and peripheral land use planning of rail transit stations—Taking Xi’an as an example. Urban Transp. 2015, 13, 51–58. [Google Scholar]
  40. Hua, Y. Geographic Distribution of Urban Retail and its Spatial Relationship with Subway Network: A Case Study of Retail POI Data in Shanghai; Columbia University: New York, NY, USA, 2018. [Google Scholar]
  41. Zhang, J.; Hao, F.; Wang, S. Functional differences and organisational patterns of land around urban rail transit stations—Taking Changchun Light Rail Line 3 as an example. Urban Express Rail Transit 2022, 35, 28–35. [Google Scholar]
  42. Zhang, H.; Chai, Y.; Yang, X.; Zhao, W. High-Speed Rail and Urban Growth Disparity: Evidence from China. Sustainability 2022, 14, 8170. [Google Scholar] [CrossRef]
Figure 1. Average passenger flow intensity on selected suburban metro lines.
Sustainability 16 06320 g001
Figure 2. The average operating hours of selected suburban metro lines in working days.
Sustainability 16 06320 g002
Figure 3. (a) Schematic representation of the location of Wuhan in China. (b) Schematic location of Wuhan Rail Transit Line 11 Phase I (Wuhandong Railway Station to Zuoling).
Sustainability 16 06320 g003
Figure 4. POIs within 800 m of influence.
Sustainability 16 06320 g004
Figure 5. Technology roadmap.
Sustainability 16 06320 g005
Figure 7. Proportion of functional elements around typical stations.
Sustainability 16 06320 g007
Figure 9. Changes in the proportion of functional elements around typical stations in each category.
Sustainability 16 06320 g009
Figure 10. Density of functional features around stations in meters.
Sustainability 16 06320 g010
Figure 11. Geographical specialization characteristics of land use functions around stations by locational entropy.
Sustainability 16 06320 g011aSustainability 16 06320 g011b
Figure 12. Extraction of spatial organization patterns by functional distribution analysis.
Sustainability 16 06320 g012
Figure 13. Spatial organization pattern with “core-axis” mode of the land use function around stations.
Sustainability 16 06320 g013
Figure 14. Spatial organization patterns around the Changchun Line 3 as a comparison.
Sustainability 16 06320 g014
Table 1. Wuhan Rail Transit Line 11 Phase I station setting.
Station CodeStation Name
S1Wuhandong Railway Station
S2Hukou
S3Tongji Hospital
S4Guanggushengwuyuan
S5Guanggu 4th Rd.
S6Guanggu 5th Rd.
S7Guanggu 6th Rd.
S8Baoxie
S9Guanggu 7th Rd.
S10Changlingshan
S11Weilai 1st Rd.
S12Weilai 3rd Rd.
S13Zuoling
Table 2. Classification and percentage of POI data within the impact area.
Category (α)POI Data Type (β)Number (γ)Ratio (δ)
Residential Area (A)Residential complexes, business houses, dormitories, flats, etc.28817.41%
Office (O)Companies, enterprises, factories, etc.43326.18%
Shopping (S)Convenience stores, general markets, shopping centres, etc.1307.86%
Catering & Food (F)Restaurants, pubs, etc.47628.78%
Living Services (L)Postal service, logistics, housekeeping, hotels, etc.1589.55%
Financial Services & Economy (E)Banks, financial institutions, etc.603.63%
Culture, Science & Education (C)Schools, research institutes, libraries, training organisations, etc.1036.23%
Leisure & Recreation (R)Teahouses, cinemas, theatres, farmhouses, etc.60.36%
Table 3. Mean value of standardized percentage of each type of POI by normalization.
Category (α)Ratio (δ)Weight (ε)Raw Mean (ζ)Percentage Mean (η)
A17.41%5.00.87061735.44%
O26.18%3.00.78536931.97%
S7.86%1.50.1178964.80%
F28.78%1.00.28778711.72%
L9.55%1.00.0955263.89%
E3.63%3.00.1088274.43%
C6.23%3.00.186827.61%
R0.36%1.00.0036280.15%
Table 4. Functional type classification of Wuhan Line 11 stations.
Station FunctionStation TypeStationNumber of Stations
Single-functionOffice-ledS3, S9, S103
Residence-ledS121
Traffic-ledS11
Mixed-functionAO mixedS4, S6, S7, S84
FA mixedS51
AC mixedS21
CF mixedS131
UnderdevelopedDevelopment-PoorS111
Disclaimer/Publisher’s Note: The statements, opinions and data contained in all publications are solely those of the individual author(s) and contributor(s) and not of MDPI and/or the editor(s). MDPI and/or the editor(s) disclaim responsibility for any injury to people or property resulting from any ideas, methods, instructions or products referred to in the content.

