Article

Rural Ecosystem Health Assessment and Spatial Divergence—A Case Study of Rural Areas around Qinling Mountain, Shaanxi Province, China

1
Key Laboratory of Disaster Monitoring and Mechanism Simulating of Shaanxi Province, Baoji University of Arts and Science, Baoji 721013, China
2
School of Geography & Environment, Baoji University of Arts and Sciences, Baoji 721013, China
*
Author to whom correspondence should be addressed.
Sustainability 2024, 16(15), 6323; https://doi.org/10.3390/su16156323
Submission received: 16 April 2024 / Revised: 29 June 2024 / Accepted: 4 July 2024 / Published: 24 July 2024

Abstract

:
The rapid progress of urbanization and rural revitalization in developing countries has led to dramatic changes to the rural ecological environment. Assessing the rural ecosystem health (REH) is a crucial foundation for promoting sustainable development in rural areas. This study, focusing on rural areas around the Qinling Mountains in Shaanxi Province, establishes an evaluation system based on appropriate evaluation indicators for assessing the composite ecosystem. This evaluation system comprises four rural ecosystem subsystems: resource, environment, society, and economy. By employing a comprehensive indicator evaluation model and remote sensing image data, this study examines the health status of rural ecosystems in the 40 counties and districts across the study area, as well as their spatial differentiation characteristics, using ArcGIS (10.8) spatial analysis. The REH scores of these areas range from 0.6856 to 0.8818, with a fluctuating downward trend from north to south. This suggests that the rural ecosystems around the Qinling Mountains in Shaanxi Province are relatively healthy, with the northern area being notably healthier than the southern area. Spatial Gini coefficient analysis reveals a much smaller coefficient for the overall ecosystem compared to the subsystems in the study area, indicating that the distribution of health levels is dispersed and not concentrated. After establishing REH grades and quantity metrics, the 40 counties and districts are categorized into 13 types, followed by an analysis of the influencing factors for each type. Recommendations and management strategies are then proposed to enhance the health of rural ecosystems.

1. Introduction

The primary objective of environmental management is to ensure the health of ecosystems [1,2]. Initially, most research on ecosystem health focused on the conceptual definition [3,4,5,6]. Ecosystem health is defined as the ecosystem’s capability to meet the reasonable needs of human society and its ability for self-repair and renewal [7,8], which is an essential component of ecosystem security. In the 1990s, Costanza et al. introduced three indicators, i.e., vitality, organizational strength, and resilience, to assess the performance and health of ecosystems [9]. Ecosystem health is linked to the ecological and economic domains and should be assessed by combining human values with biophysical processes [8,10], highlighting adaptation to the external environment and its connection with population health levels. In recent years, there has been a growing emphasis on the significance of ecosystem health among scholars. This has led to an increase in research dedicated to developing evaluation models and methods, as well as optimizing ecological indicators [11,12]. At present, international research primarily revolves around assessment, with rural ecosystem studies integrating economic aspects into the evaluation and forecasting of material and resource utilization efficiency. The main focus is on the ecological environment in rural areas [12,13,14,15]. Ecosystem health research has focused on evaluating various types of ecosystems, such as watersheds, wetlands, forests, cities, and agriculture [16,17,18,19,20]. The principal methods employed for studying the ecosystem health evaluation methods can be categorized into three types: (1) utilizing the vigor–organization–resilience (VOR) assessment framework and functional indicators to assess the health of natural ecosystems, emphasizing a single-dimensional evaluation while overlooking the holistic consideration of the social and economic system [16,17,18]; (2) examining the causal relationship between ecosystems and human activities to uncover the internal evolution mechanism, mainly using the pressure–state–response (PSR) model, driving–state–response (DSR) model, and driving–pressure–state–impact–response (DPSIR) model [19,20,21,22], which are methods that also concentrate on the single-dimensional evaluation of natural ecosystems, neglecting effective measures of ecosystem integrity; (3) shifting focus towards ecosystem integrity, there is a growing interest in assessing the social–economic–natural complex ecosystem, such as the REHI index method [23,24]. On the whole, there is a scarcity of studies on rural ecosystem health (REH). The evaluation system of REH has not been clearly defined, and the selection and quantification of evaluation indicators pose unresolved pressing issues.
A rural ecosystem refers to the ecological, economic, and technological composite system composed of the rural population, rural environment (light, heat, water, air, soil, etc.), rural organisms (plants, animals, microorganisms), rural buildings (houses), agricultural production tools, rural science and technology, and rural culture within the scope of rural areas. This system is an ecological unit with the basic functions of matter circulation and energy flow [25]. Compared to the general ecosystem, the rural ecosystem is a distinctive artificial and semi-artificial ecosystem, in which many environmental and biological compositions are created and altered by the residents themselves through “labor”. Therefore, the rural ecosystem exhibits structural complexity and functional diversity. It encompasses both a typical natural ecosystem and the pronounced synthetic characteristics of a social–economic system. This comprehensive expression is shaped by the flow of material, energy, and information between humans and external resources, the environment, society, and the economy. The resource and environment subsystems directly influence the input of natural capital, while the social and economic subsystems impact the external drivers of production relations and the accumulation of material wealth in rural populations (Figure 1). With the rapid advancement of urbanization and rural revitalization, the consumption income of rural residents has been increasing [26,27,28]. However, rural ecosystems have been affected to a certain degree. For example, resource wastage, depopulation, and environmental pollution are increasing the pressure on rural ecosystems and decreasing the functionality of ecosystems [29,30,31]. Currently, for many developing countries such as China, South Africa, and India, the most important settlements are still rural areas. Rural environmental health has always been a focal issue for the government, with significant efforts made to enhance and address it [32]. The health of rural ecosystems is vital for promoting sustainable rural development. Research on rural ecosystem health can aid in understanding the underlying causes of rural ecological challenges, guiding rural revitalization, reconstruction, and sustainable development.
In China, scholars have predominantly focused their research on urban areas, while rural research has mainly centered around topics like rural environmental assessment, spatial differentiation of rural settlements, rural reconstruction, and integrated rural development [33,34,35,36,37,38]. Studies have shown that out of 4398 ecosystem health research references, only 18 (0.4%) were dedicated to rural areas and the countryside, with various evaluation systems established from different perspectives [30,31,32]. However, the selected indicators are relatively limited in scope, the research content is somewhat homogeneous, and there is a lack of comprehensive studies that integrate ecosystems with human factors such as rural socioeconomics. The holistic examination of rural nature, society, and economy is often overlooked. Currently, there is still a lack of research on developing a mountain ecosystem index system that aligns with international standards. The rural areas around the Qinling Mountains in Shaanxi Province, China, are positioned in south-central Shaanxi Province and feature a complex topography and diverse climate types, making it the region with the most intricate natural geography in the entire province [39]. There are noticeable variations in rural ecology and landscape patterns among counties and districts. As the area is a typical mountainous rural ecosystem, its rural ecology and landscape patterns are greatly influenced by factors such as mountain resources, economy, and policies in the Qinling Mountain area. In the context of rural revitalization, the counties around the Qinling Mountains are undergoing further enhancements in terms of mountain ecological resource protection, comprehensive rural environment improvement, rural social development, and the enhancement of rural living conditions. The level of rural development shows a pattern of gradual decline from north to south [40]. Taking 40 representative counties and districts around the Qinling Mountains in Shaanxi Province as a case study, we established a rural ecosystem health evaluation system from the perspective of the natural–social–economic composite system to assess the rural ecosystems in the region. By classifying the REH into different types according to the health level of rural ecosystem subsystems, we examined the spatial differentiation patterns and identified issues and characteristics within rural ecosystems. The goal is to establish a standardized index system for assessing the health of mountainous rural ecosystems, so as to provide a benchmark for evaluating the mountain rural ecosystem health in Shaanxi Province and other areas in developing countries.

2. Materials and Methods

2.1. Overview of the Study Area

The Qinling Mountains, spanning across Shaanxi, Gansu, Qinghai, and Henan and extending eastwards to the Nanyang and Xiangyang basins, are a mid- to high-altitude mountain range across the center of China. This mountain range is connected to the Qilian Mountains and Kunlun Mountains in the west and Tongbai Mountains and Dabie Mountains in the east. It serves as a natural demarcation line for geography, geology, climate, wildlife, and flora areas in mainland China. In Shaanxi, the Qinling Mountains lean against the Guanzhong Plain to the north and the Hanzhong and Ankang basins to the south. They also act as the watershed dividing the Yellow River and Yangtze River systems, with the mountains rising steeply in the north and gradually sloping in the south. Based on the “Regulations on the Protection of Qinling Ecological Environment”, the scope of Qinling ecological environmental protection encompasses the Qinling Mountain region in Shaanxi Province, bordered by the provincial boundaries in the east and west and by the base of the Qinling Mountains in the north and south [41]. The Qinling Mountains include Shangluo City and parts of Xi’an, Baoji, Weinan, Hanzhong, and Ankang, and can be divided into the Guanzhong region and southern Shaanxi region. The southern Shaanxi mountainous area is vast, characterized by a mild climate, rich species, complex topography, relatively underdeveloped economic and social conditions, and a high poverty rate [42]. The Guanzhong Plain features a vast area, deep loess deposits, and a long history of development. In this study, the 2020 administrative division of Shaanxi Province, including counties, county-level cities, and municipal districts, was used as research units, with a total of 40 geographic units identified. The comprehensive development level is higher in Hanyin County among these 40 counties, due to its abundant natural resources, minimal ecological environmental pollution, good environmental quality, and relatively high level of rural economic development. On the other hand, Liuba County and Zhashui County have a poor comprehensive development level with limited resource conditions, a degraded ecological environment, an underdeveloped rural economy, an unreasonable industrial structure, inadequate infrastructure construction, and low living standards for rural residents (Figure 2).

2.2. Data Sources

The evaluation scale of ecosystem health typically considers a specific geographical scope or a unified administrative boundary as the spatial unit. The county-level administrative unit is the smallest administrative entity that offers comprehensive statistics and data summaries of various social and economic activities in China. Taking the county-level administrative scale as the spatial unit facilitates the collection of detailed data [23]. To ensure data availability and accuracy, 40 district and county administration and data statistics units were selected to gather spatial data from 40 districts and counties in 2020. These data primarily included the 1:50,000 topographic map, land use data, NDVI data, water system data, natural environment data, and social and economic data of Shaanxi Province in 2020. The specific data sources are shown in Table 1.

2.3. Selection of Indicators for Rural Ecosystem Health Assessment

The health of the rural ecosystem depends on the stability of the rural social, economic, and natural subsystems. The rural natural ecosystem comprises the rural resource subsystem and the environmental subsystem [23,43]. In this study, following the principles of integrity, regionalism, operability, accessibility, and quantification, an evaluation index system for rural ecosystem health in the Qinling Mountains was developed. Member experts from the Shaanxi Rural Ecology Association conducted two rounds of index screening and feedback, resulting in the establishment of a comprehensive evaluation index system. This system incorporates dimensions of rural resources, environment, economy, and society, emphasizing the significance of the sustainable development concept in assessing rural ecosystem health. A Sustainable Development Goal (SDG17) was integrated into the construction of the index system. A three-level evaluation index system was established, comprising 28 indicators such as per capita arable land area, per capita ecosystem service value, per capita water resources, forest coverage rate, and air quality compliance rate (Table 2). These indicators offer a holistic view of rural ecosystem health in the Qinling Mountain region.
(1)
Subsystem of rural resource ecosystem
Natural resources form the foundation for rural production and livelihoods. The rural resource subsystem, a crucial carrier of rural production and livelihood, serves as a key indicator for evaluating the ecological health of a specific region. It aligns with the Sustainable Development Goals’ aim of “zero hunger” and seeks to highlight the stable capacity of the rural ecosystem to sustainably meet the reasonable needs of human activities, as well as self-maintenance and renewal. This reliance is determined by the endowment capacity and potential conditions of rural natural resources, arable land resources, agricultural production capacity, water resources, and forest resources. This study has identified six key natural resource indicators for evaluation, including per capita arable land area, per capita water resources, forest coverage, wetland area ratio, biological abundance index, and ecosystem service value to characterize the health status of the rural resource subsystem. The per capita arable land area emphasizes the arable potential of land resources and the production capacity of agricultural products, directly influencing the production and supply capacity of agricultural materials in mountainous rural ecosystems. Per capita water resources, forest coverage, wetland area ratio, bio-abundance index, and ecosystem service value are sustainable indicators used to assess the self-maintenance and renewal function of rural ecosystems, reflecting the natural endowment of forest resources, water resources, and biological resources in rural areas. Per capita arable land area and water resources represent the scale of arable land and water resources in the region. Forest coverage rate, wetland area ratio, and biological abundance index reflect the quantity of forest, water resources, and biological resources within rural areas. These indicators serve as proxies of rural ecological resilience and regeneration capacity. The biological abundance index (BI) is then calculated based on the proportion of different land use types (Formula (1)). The ecosystem service value (ESV) assessment methodology is derived from the research by Costanza et al. [44], incorporating ecological value coefficients and per-hectare land values for different land use types, which have been derived through the modification and calculation of ecosystem biomass factors proposed by Xie Gao Di et al. [45,46] (Formula (2)).
B I = A b i o × 0.35 × A 1 + 0.21 × A 2 + 0.28 × A 3 + 0.11 × A 4 + 0.04 × A 5 + 0.01 × A 6 / A t o t a l
where B I is the biological abundance index and A b i o is the normalization factor. A 1 ~ A 6 denote the woodland, grassland, wetland, arable land, construction land, and barren land, respectively (Technical Standard for Ecosystem Condition Evaluation (HJ 192-2015)). A t o t a l indicates the total area of the study area in km2, and A m a x indicates the maximum BI value before normalization. A b i o = 100 / A m a x .
E S V k = k = 1 n A k × V C k
V C k = g = 1 l E C k × E a
E a = 1 5 f = 1 m G f × H f × B f J m
where E S V is the integrated ecosystem service value at the county scale, E S V k is the ecosystem service value of the land use type k (CNY), k indicates the land use type, g indicates the ecosystem service type, A k is the area of land use type k , V C k is the ecosystem service value per unit area of land use type k , E C k is the value equivalent of ecosystem service of category g , E a is the value of ecosystem services, m is the type of food crops grown in Shaanxi Province, G f , H f , and B f are the price, output, and planting area of food crop f , respectively, and J m is the total planting area of crops.
(2)
Subsystem of rural environment ecosystem
The rural environmental subsystem is a crucial integrated representation for maintaining a stable ecological environment, safeguarding agricultural production systems from symptoms of dysregulation, and addressing external stressors, in alignment with the Sustainable Development Goals of “clean water and sanitation, responsible consumption and production, climate action”. The rural ecological environment plays a pivotal role in rural development and economic growth. It is emphasized that the sustainable capacity of rural ecosystems to self-sustain and renew depends on factors such as pollution infestation and interference with agricultural production, especially in regions around the Qinling Mountains. Given its close ties to the ecological preservation of the Qinling Mountains, the quality of the rural ecological environment becomes paramount. This study selected six indicators to characterize the health status of the rural environmental subsystem, including the rate of rural surface water quality meeting standards, the proportion of days when air quality met standards, the comprehensive utilization rate of solid waste, and the rate of village environment comprehensive improvement meeting standards. These indicators reflect the status of rural environmental quality. The amount of pesticide and fertilizer applied per unit area of arable land represent human agricultural production activities and cleaner production technology, which are negative indicators.
(3)
Subsystem of rural social ecosystem
The rural social subsystem aims to enhance the well-being of rural residents by utilizing rural natural capital input, which is indicative of the production and living conditions of rural residents. This is closely linked to the level of rural economic wealth and the accumulation of artificial capital. In alignment with the Sustainable Development Goals of “no poverty, decent work and economic growth, industrial innovation and infrastructure, reducing inequality, sustainable cities and communities”, the emphasis lies on the quality of rural material infrastructure and the production and living conditions of residents. The health status of the rural social subsystem was characterized by eight key indicators that evaluate population dynamics, living conditions, healthcare, consumption, and education. The key metrics include the natural population growth rate, population density, housing space per capita, number of doctors and beds per 1000 people, electricity consumption per capita, rural per capita consumption expenditure, per capita education expenditure, and Engel’s coefficient. The natural population growth rate and population density indicate the growth rate and spatial distribution of the population in the region. Rural per capita consumption expenditure, per capita education expenditure, per capita housing area, number of doctors and beds per 1000 people, and electricity consumption per capita serve as comprehensive reflections of rural employment, elderly care, education, and medical social services, with higher values of these indicators signifying better rural social development. Conversely, the Engel coefficient of rural residents acts as a negative indicator, where lower values correspond to higher levels of rural social development.
(4)
Subsystem of rural economic ecosystem
The rural economic subsystem, which represents the accumulation of artificial material wealth resulting from rural natural capital investment, aligns with the Sustainable Development Goals of “no poverty, zero hunger, affordable clean energy, decent work and economic growth, industrial innovation and infrastructure”. It aims to highlight the capacity of rural ecosystems to fulfill reasonable human needs, contingent on the rural economic development level, agricultural production level, production activity intensity, industrial structure, and per capita economic level conditions. In combination with the current situation of rural economic development around the Qinling Mountains in Shaanxi Province, six indicators were selected to depict the health status of the rural economic subsystem. These indicators include the per capita grain output of farmers, per capita disposable income of farmers, per capita gross output value of agriculture, forestry, animal husbandry, and fisheries, per capita gross power of agricultural machinery, ratio of rural non-agricultural labor force population, and ratio of secondary and tertiary industries. Notably, rural agricultural productivity indicators such as the per capita grain output of farmers, the per capita gross output value of agriculture, forestry, animal husbandry, and fisheries, and per capita total power of agricultural machinery are all positive indicators. On the other hand, the per capita disposable income of farmers, the proportion of rural non-agricultural labor force population, and the proportion of secondary and tertiary industries reflect the typical per capita income level and agricultural economic structure. The former is a positive indicator, with a higher indicator representing a higher rural economic level, while the latter two are negative indicators, with a larger indicator indicating a weaker dominant position of the agricultural industry and greater disturbance of economic production activities to the rural ecosystem. Based on the above analyses, the index system for evaluating the rural ecosystem health around the Qinling Mountains in Shaanxi Province was established using the hierarchical analysis method, as shown in Table 2.

2.4. Determination of Indicator Weights

Due to the variations in the significance of indicators in the comprehensive assessment, this study employed the hierarchical analysis method [47] and the Delphi method [48] to assign weights to the indicators. The Delphi method, also known as the expert survey method, involves gathering opinions from experts in the relevant fields to determine the specific contributions of indicators to the REH evaluation. The appropriateness of indicator weights greatly influences the assessment results. Weight determination methods typically fall into two categories: subjective weighting methods and objective weighting methods. Objective weighting methods involve systematic calculations to determine the weight of each index, requiring substantial data and precision. However, this approach may lead to a lack of differentiation in the evaluation model, limiting its ability to comprehensively assess regional characteristics. Subjective weighting methods, on the one hand, align more closely with the actual context but may introduce biases due to differences in perceptions among subjects. Overall, it is difficult to achieve the desired effect by using either the objective or subjective weighting method alone due to their shortcomings. Based on the analytic hierarchy process (AHP), with 28 relevant experts and scholars in rural ecosystem health assessment, the weights of the indicators were iteratively adjusted through three rounds of consultation to ensure that the assessment results accurately reflect the actual conditions in the study area. This approach seeks to mitigate the limitations of both objective and subjective weighting methods to achieve a more robust assessment outcome.
On the basis of the AHP, 28 experts and scholars specializing in rural ecosystem health assessment were consulted. Through three rounds of consultation, the weights of each indicator were repeatedly adjusted to ensure that the evaluation results accurately reflected the actual situation in the study area. This approach aimed to minimize the limitations of objective and subjective weighting methods, acquiring more reliable evaluation results.
(1)
Indicator normalization
Since the natural disaster risk assessment system contains too many assessment indicators related to various types of disaster risk impact factors, there are significant differences in the order of magnitude, unit, and scale of each indicator, making direct comparisons challenging. To achieve equal calculation and comparison results of the impact indicators, it is necessary to normalize the detailed parameters of each indicator, mapping the final value of each impact indicator to a range of [0, 1] [49]. The formula is as follows:
Positive   indicators :   Y m n = X m n X m   m i n / X m   m a x X m   m i n
Negative   indicators :   Y m n = X m   m a x X m n / X m   m a x X m   m i n
where   Y m n is the standardized value;   X m n is the original value of the nth item and mth column indicators; X m   m a x and X m   m i n are the maximum and minimum values of the indicators for the 39 counties in the studied area, respectively.
(2)
AHP hierarchical analysis method
The AHP hierarchical analysis method is a highly holistic, simple, and practical decision-making method that simplifies complex decision processes by breaking them down into hierarchical structures. In this method, decision elements are decomposed into guidelines, programs, objectives, and other levels through hierarchical analysis, followed by systematic decision-making calculations. The strength of hierarchical analysis lies in its simplicity and systematic nature to decision analysis. However, it may lack strong subjectivity due to certain differences in knowledge and conceptual understanding among researchers. In this study, the AHP method was utilized within Decision-making based on Preference and Similarity (DPS, 19.05, China) to construct a preference matrix and analyze the selected indicators, thus obtaining the weights of each indicator after preliminary calculation.
(3)
Rural ecosystem health index
Calculating the REH index of county units in the study area required benchmark values of indicators in each county for reference. Due to the areas around the Qinling Mountains in Shaanxi Province being relatively more economically developed, in order to ensure the feasibility and validity of the evaluation, the benchmark values of the indicators were determined based on recognized values, regional averages, domain and local standards [50], national standards, and Shaanxi Province standards. The computational formula [51] is as follows:
Positive   Indicators :   When   x m y m ,   S m = 1 ;   When   x m < y m ,   S m = x m / y m
Negative   indicators :   When   x m y m ,   S m = 1 ;   When   x m > y m ,   S m = y m / x m
where S m is the ecosystem health index for each county,   x m is the actual value for each county, and y m is the calculated reference value of the index.
(4)
Rural ecosystem health evaluation model
Based on the index values of the REH assessment framework and their corresponding calculated index weights in each county unit around the Qinling Mountains in Shaanxi Province, the REH subsystem indices and the comprehensive REH index were obtained. Then, the REH assessment model for the counties around the studied area was constructed.
R R S = i = p q w i × S i
R E n v S = i = p q w i × S i
R S S = i = p q w i × S i
R E c o S = i = p q w i × S i
R E H = R R S + R E n v S + R S S + R E c o S
where R R S , R E n v S , R S S , and R E c o S are the scores of each rural ecosystem subsystem;   R E H is the score of the comprehensive rural ecosystem; w i is the indicator weight of each subsystem; S i   is the ecosystem health index of each indicator; p and q are the serial numbers of each indicator in the nth subsystem.
(5)
Classification of rural ecosystem health
Based on the calculated scores of ecosystem health indices, the health levels of four subsystems for each county unit were categorized into four classes: healthy, sub-healthy, unhealthy, and diseased. The formula for calculating the scores of subsystem health is as follows:
B i j = k = 1 n ( X i k X j k ) 2 n
where B i j is the coefficient of similarity between the subsystem scores of counties i and j;   X i k is the standardized value of the kth subsystem score of county i;   X j k is the standardized value of the kth subsystem score of county j; n is the number of counties around the Qinling Mountains in Shaanxi Province, and n = 39.
(6)
Identification of types of rural ecosystem health
In regional rural development, the classification of various rural ecosystem health types serves as a critical initial step and plays a pivotal role in fostering the sustainable and healthy development of rural ecosystems. By identifying diverse types and levels of rural ecosystem health strengths and aligning them with the local socioeconomic context, stakeholders can better understand and address rural development challenges in a timely manner. In this study, the classification and identification of REH types were determined based on the ranking of ecosystem health within each subsystem [52]. The division criteria designed for this study, as shown in Table 3, were developed by referring to the criteria used by other scholars to determine ecosystem health grades, while the classification methodology is illustrated in Figure 3.
(7)
Analysis of spatial distribution of rural ecosystem health in counties
To explore the spatial distribution of integrated rural ecosystems and the health status of each subsystem in 39 counties around the study area, the spatial distribution of each subsystem was evaluated using the spatial Gini coefficient, with the following formula:
N p = q = 1 m G p q G p / m / q = 1 m G p q + m 2 G p / m
where N p denotes the spatial Gini coefficient, G p q denotes the health score of the rural ecosystem in county q, and G p denotes the sum of the health scores of the system p. m = 39, which is the total number of units in the counties around the studied area, and p represents the type of rural ecosystem. A larger N p value indicates a denser spatial distribution of rural ecosystem health in the study area, while smaller values indicate a more dispersed distribution of rural ecosystem health.
(8)
Analysis of factors affecting rural ecosystem health assessment
Grey correlation analysis is commonly used to explore intricate relationships among various factors and variables [53], helping to mitigate empirical bias and subjective arbitrariness in system analysis. In this study, grey correlation analysis was used to examine the correlation types between indicators and subsystems of rural ecosystems concerning the REH status in each county. Additionally, variable conversion and selective deletion were implemented to manage interrelated variables. The calculation steps are as follows:
(1)
Select X p k as the reference series, and X q k as the comparison series, where q = 1, 2, 3 …k, i.e., the kth number in the series;
(2)
Dimensionless: X q k = X q k / X q 1 , where q = 0, 1, 2 …k;
(3)
Find the correlation coefficient:
ε K = min q min p X p k X q k + ρ max q max p X p k X q k / X p k X q k + ρ max q max p X p k X q k
where ρ is the resolution factor, taking a value in the interval [0, 1], generally 0.5.
(4)
Calculation of correlation:
ε = 1 / n k = 1 n ε k
where ɛ takes a value in the interval [0, 1], and the higher the value, the stronger the correlation.

3. Results

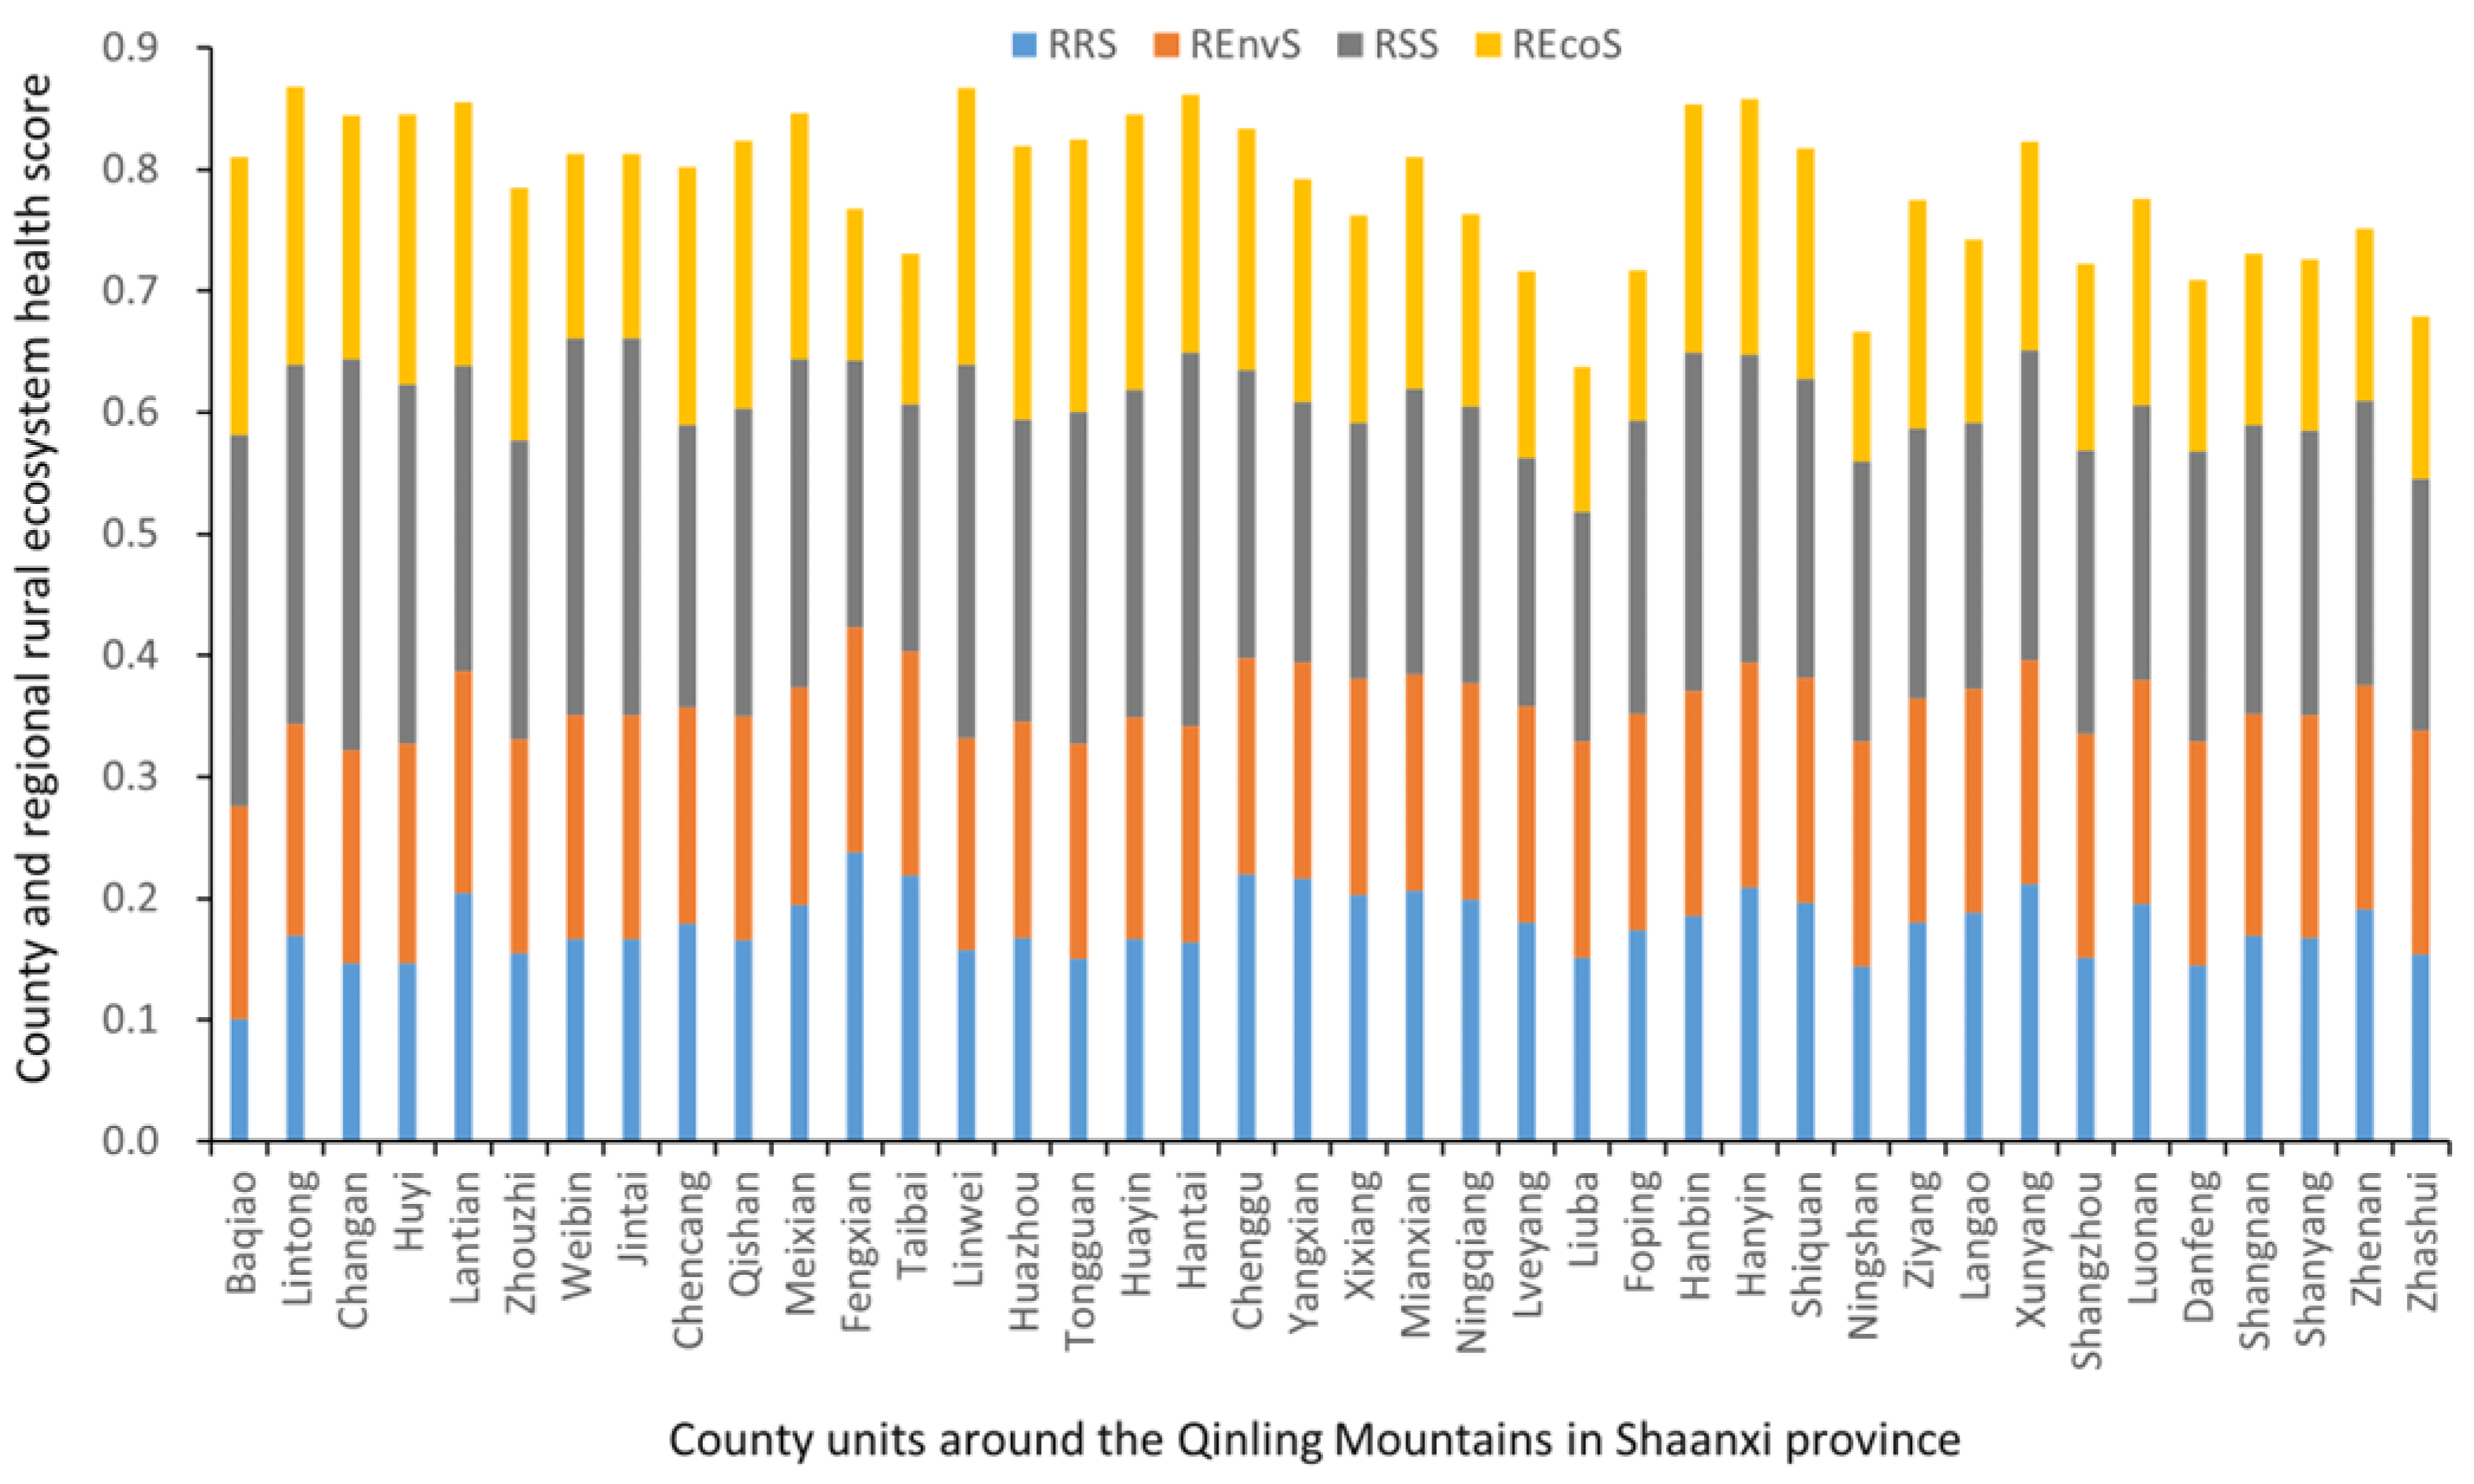
3.1. Analysis of Rural Ecosystem Health Score

Complying with the REH assessment framework, the health scores of each ecosystem subsystem and the comprehensive REH scores in the counties and districts around the Qinling Mountains in Shaanxi Province were calculated based on health indices and weights of the indicators. The results are shown in Table 4. The overall distribution of REH scores around the studied area ranges from 0.6377 to 0.8679, with an average health score of 0.7865 and a standard deviation of 0.0594. Thirty-seven of the forty counties score between 0.7 and 0.9, indicating that the region’s ecosystems are relatively healthy. In accordance with the REH score, we plotted the health score curves for four subsystems and the comprehensive ecosystem (Figure 4) and analyzed the spatial distribution change characteristics. As shown in Figure 4, the REH scores around the Qinling Mountains in Shaanxi Province vary greatly, showcasing a fluctuating downward trend from Guanzhong to southern Shaanxi. The average REH score of Guanzhong is 0.8562, and the standard deviation is 0.0351. The average REH score of southern Shaanxi is 0.7562, and the standard deviation Is 0.0612, indicating an overall better rural ecosystem health in Guanzhong than that in southern Shaanxi.
The health scores of the rural resource ecosystem subsystem range from 0.1006 to 0.2381, with an average of 0.1775 and a standard deviation of 0.0272, indicating that this region generally exhibits good ecosystem health. The minimum value is observed in the Baqiao District of Xi’an City, while the maximum value is in the Feng County of Baoji City. An analysis of Figure 3 reveals significant fluctuations in the health scores of the resource ecosystem subsystems across counties, showing a fluctuating upward trend from north to south.
The health scores of the rural environmental ecosystem subsystem range from 0.1737 to 0.1849, with an average of 0.1811 and a standard deviation of 0.0037. The maximum value is observed in Taibai County, Baoji City, and the minimum value is seen in the Linwei District of Weinan City.
The average health score of the social ecosystem subsystem is 0.2498, with scores for each county unit ranging from 0.1895 and 0.3215, and the highest value is observed in Chang’an District of Xi’an City. The standard deviation is 0.0342. The health scores of the rural social ecosystem subsystem for each county unit exhibit a fluctuating downward trend from north to south.
The health scores of the rural economic ecosystem subsystem range from 0.1065 to 0.2286, with an average of 0.1788 and a standard deviation of 0.0372. The maximum value is in Baqiao District of Xi’an City, while the minimum value is in Ningxia County, Ankang City. The bar demonstrates noticeable fluctuations, showing a downward trend from north to south, as illustrated in Figure 4.

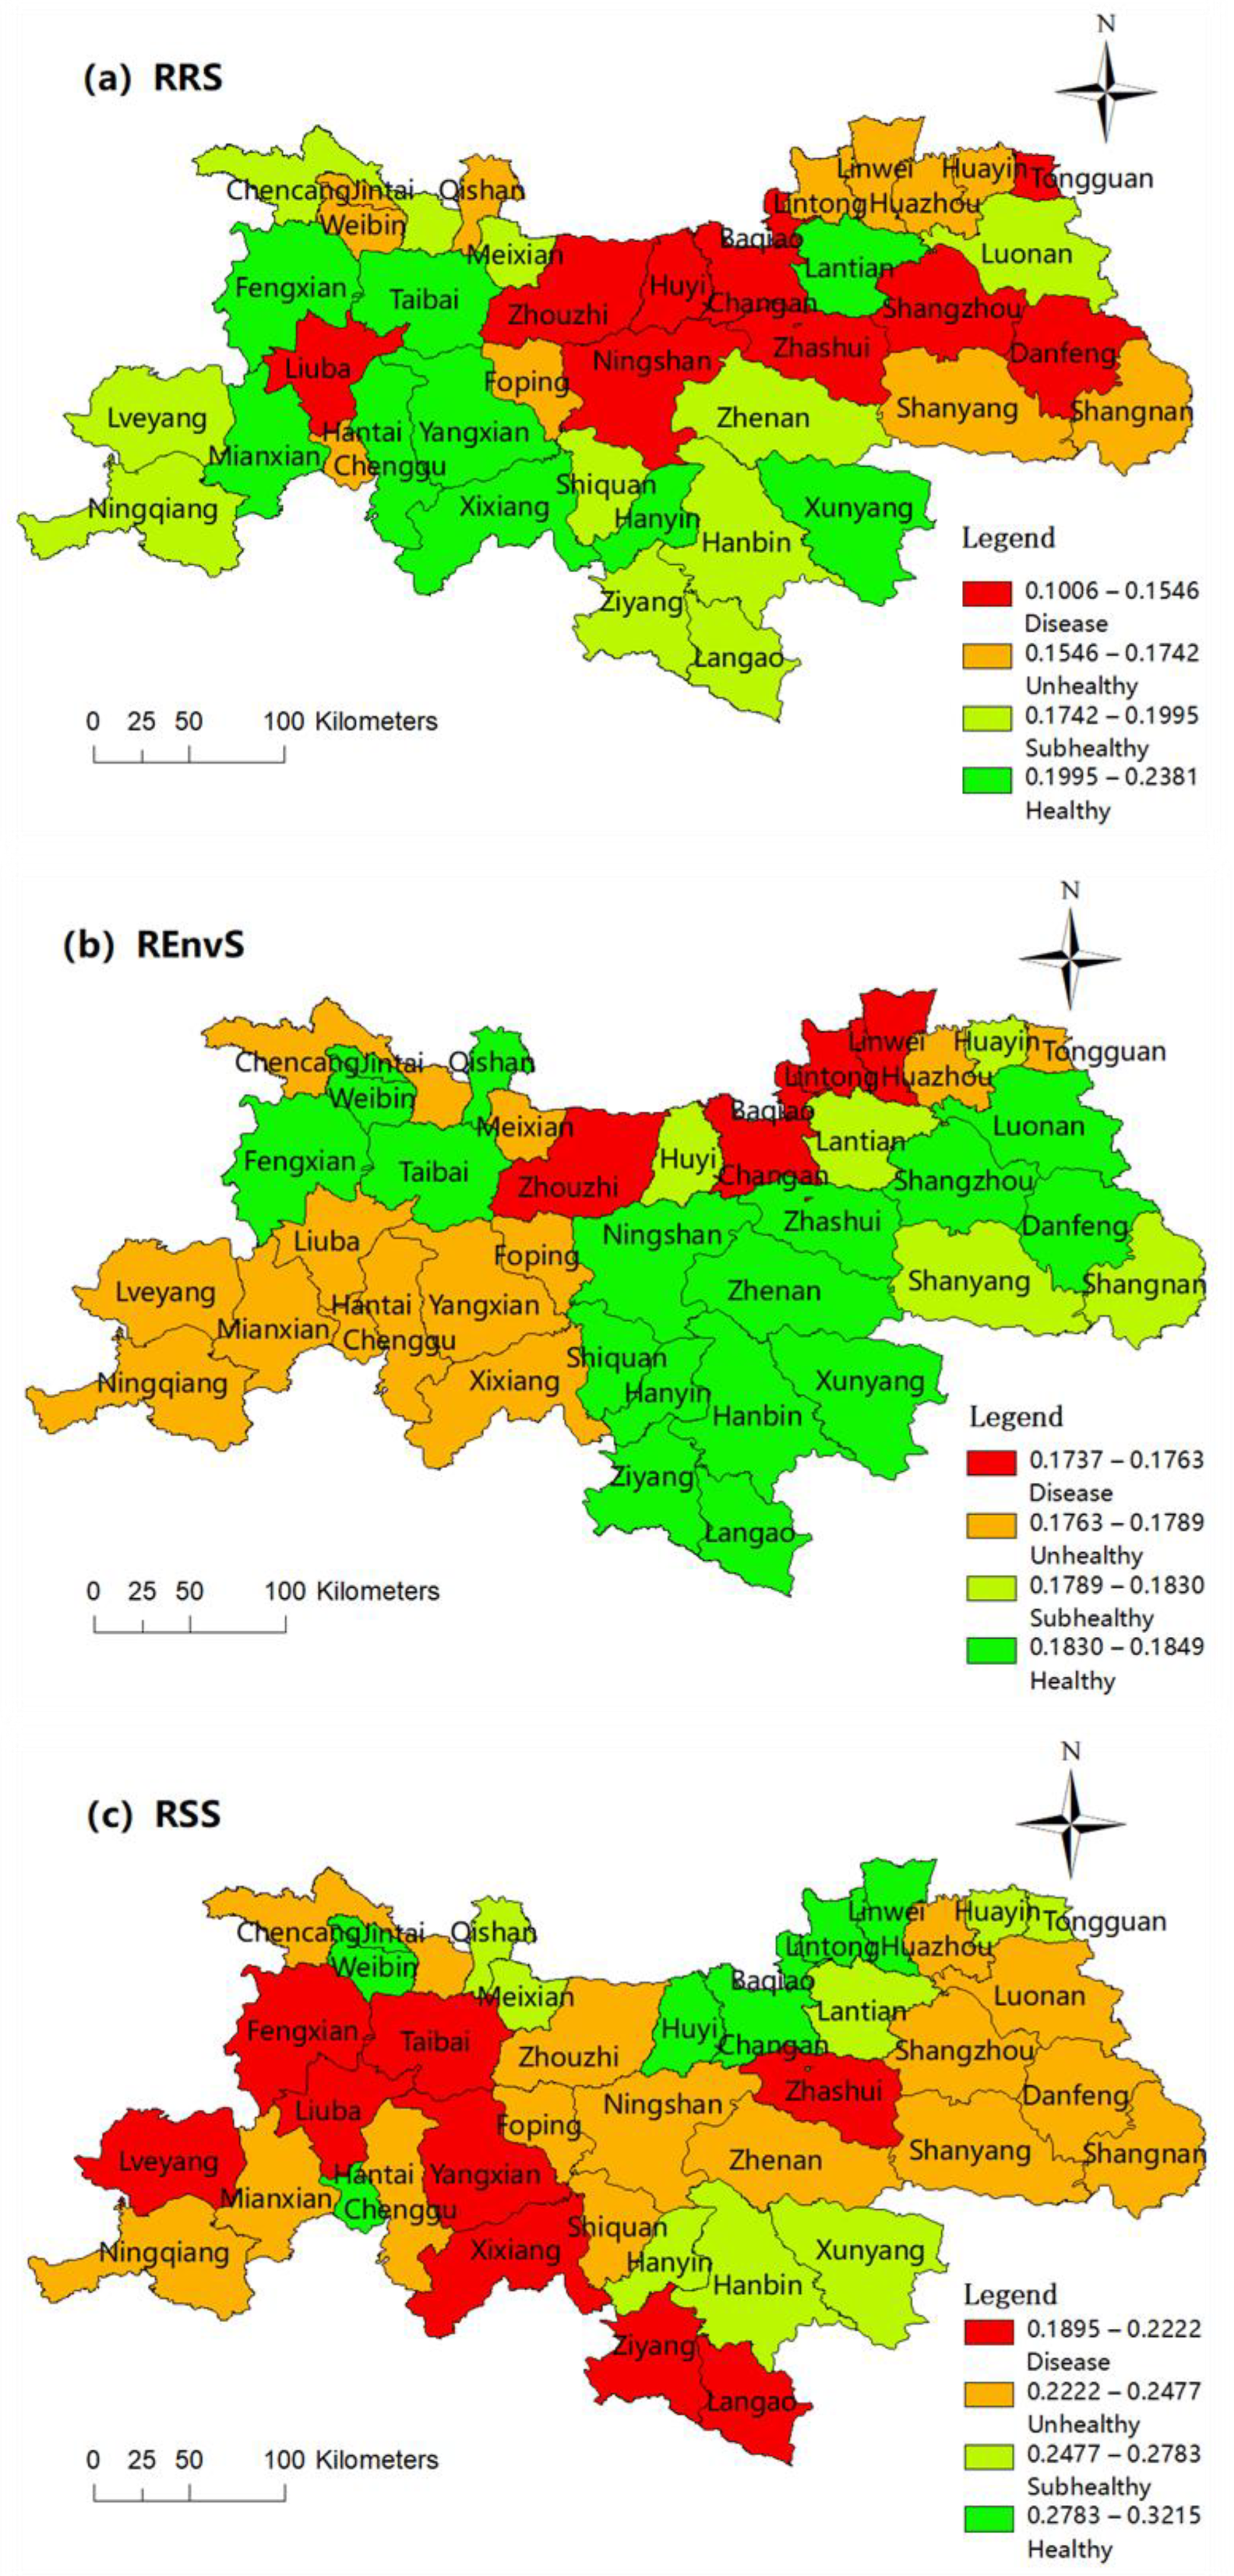
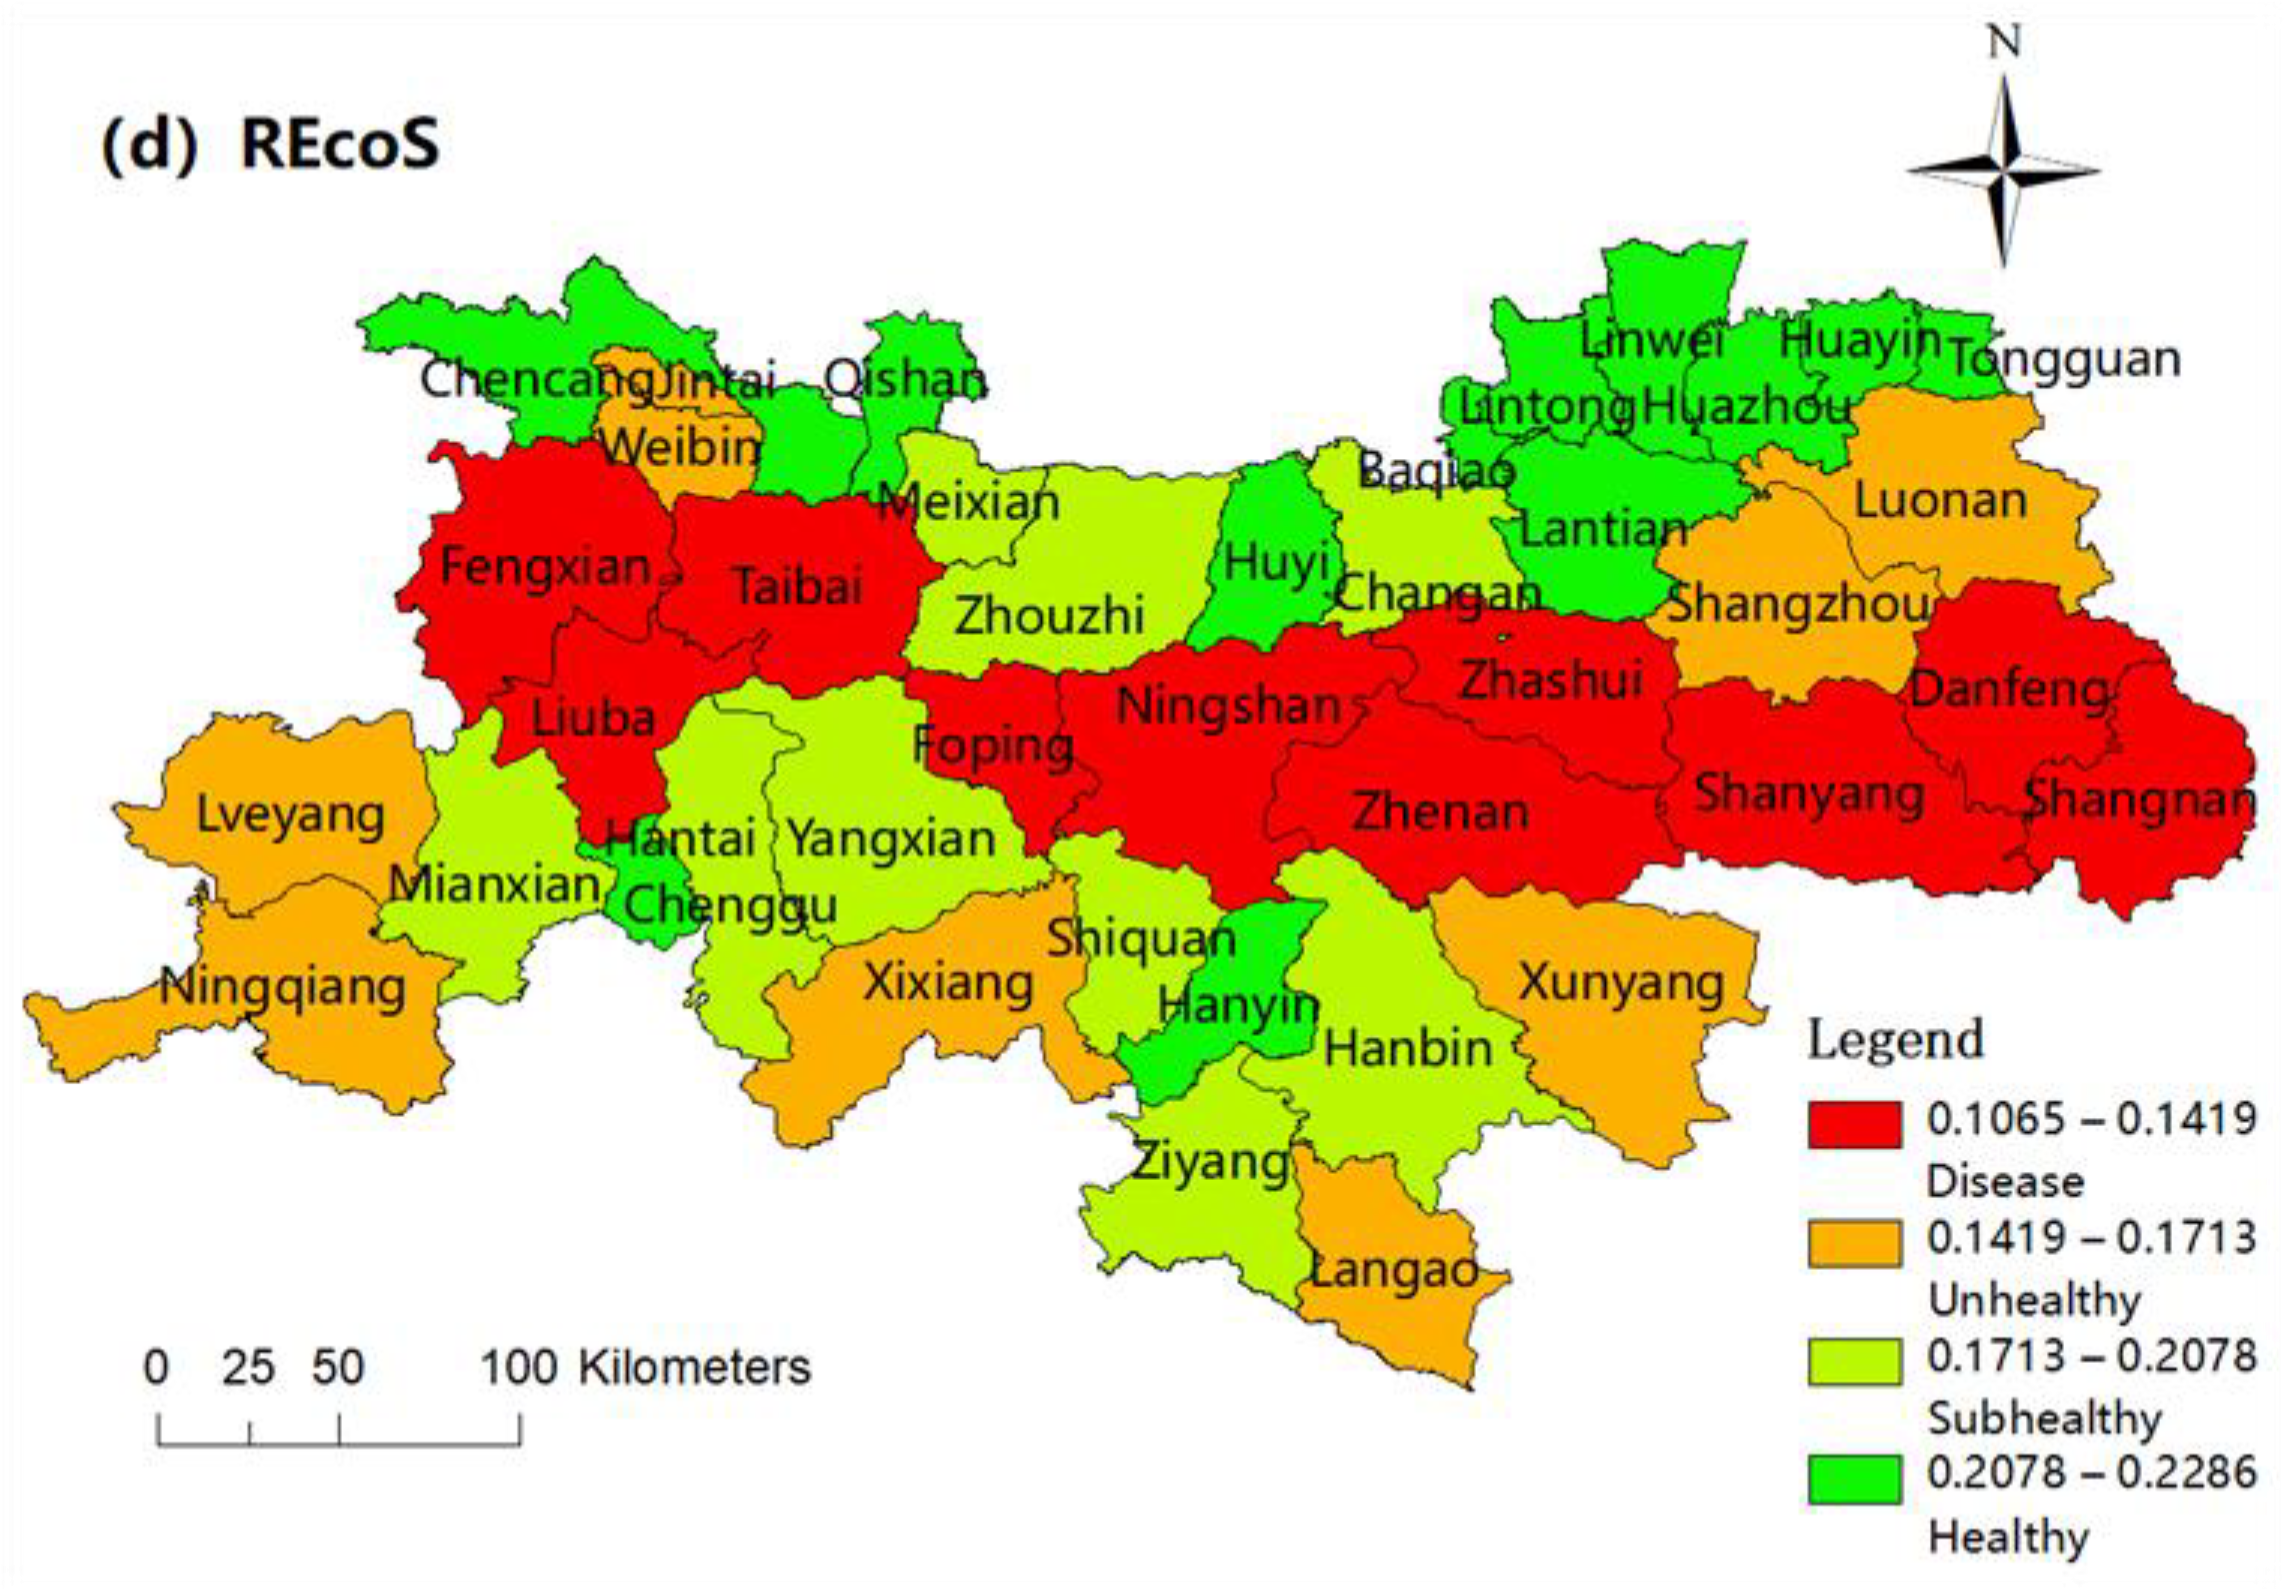
3.2. Spatial Distribution of Rural Ecosystem Health Subsystems around the Qinling Mountains in Shaanxi

As shown in Table 5 and Figure 5, the spatial Gini coefficients of rural resources, environment, society, and economy subsystems are 0.1310, 0.0197, 0.1105, and 0.1924, respectively. The spatial Gini coefficient for the integrated rural ecosystems is 0.0670. These findings indicate a lack of strong spatial clustering of the health levels of rural ecosystems and their subsystems, highlighting significant spatial variations. The spatial distribution of the health levels within the rural environmental ecosystem appears to be the least concentrated among the subsystems, whereas the rural resource and economic ecosystem subsystems exhibit more concentrated distributions, suggesting better spatial agglomeration.
As shown in Figure 6a, the spatial distribution of health grades within the rural resource ecosystem subsystem is relatively concentrated. In southern Shaanxi, the health scores of the rural resource subsystem are significantly higher than those in Guanzhong, except for Ningshan County and Zhashui County in northern Ankang, Shangzhou District and Danfeng County in central Shangluo, and Liuba County in central Hanzhong, which exhibit lower natural resource scores. Generally, the remaining counties have higher health scores and better natural resource abundance. Counties with healthy grades are mainly found in Feng and Taibai counties in Baoji City, Lantian County in Xi’an City, Chenggu, Yang, Mian, and Xixiang counties in Hanzhong City, and Hanyin and Xunyang counties in Ankang City, all boasting health scores of 0.1994 or higher. On the other hand, counties with diseased grades are mainly located in Zhouzhi County, Huyi District, Chang’an District, and Baqiao District in Xi’an City, Tongguan County in Weinan City, Liuba County in Hanzhong City, Ningshan County in Ankang City, and Shangzhou District, Danfeng County, and Zhashui County in Shangluo City, all having health scores below 0.1546. Unhealthy and sub-healthy-grade counties are distributed across all regions, mainly in the northeastern part of the study area and its surroundings. Diseased-grade county units are mostly distributed in the central region close to Guan–zhong, and healthy-grade county units are primarily distributed in southern Shaanxi. This result aligns with the changes in health scores within the rural resource ecosystem subsystem, indicating a higher degree of variability in natural resources around the Qinling Mountains.
The health grade of the rural environmental ecosystem subsystem in southern Shaanxi significantly surpasses that in Guanzhong (Figure 6b). Counties with healthy grades are mainly distributed in Feng County, Taibai County, Weibin District, and Qishan County in the south of Baoji City, all county units in Ankang City, and Shangzhou District, Luonan County, and Danfeng County in the north of Shangluo. These counties account for 41% of the total number of counties in the region, with health scores ranging from 0.1830 to 0.1849. Counties with diseased grades are mainly located in the northern part of the Qinling Mountains, including Zhouzhi County, Chang’an County, Baqiao District, Lintong District in Xi’an City, and Linwei District in Weinan City, constituting 12.8% of the total counties in the region. All counties in Hanzhong within the study area fall into the unhealthy grade. Apart from Hanzhong, all counties in Shan Nan are categorized into the healthy and sub-healthy grades, with six out of seven falling into the healthy grade.
The health grades of the rural social ecosystem subsystems vary greatly, with Guazn–hong exhibiting higher health grades than southern Shaanxi (Figure 6c). Counties with healthy grades are mainly situated in the relatively more economically developed areas, including Weibin District of Baoji City, Hantai District of Hanzhong City, Huyi, Chang’an, Baqiao, and Lintong Districts of Xi’an City, and Linwei District of Weinan City. These areas are centrally located in the northern part of the region, proximate to Guanzhong, and constitute 18% of the total counties around the Qinling Mountains. The health scores in these areas range from 0.2783 to 0.3215. The counties in this region cover a large range of unhealthy and diseased grades, with generally lower health scores for the social subsystem in the southern part of Baoji City, most of Hanzhong City, all of Shangluo City, and the northern part of Ankang City. These areas are in proximity to the west-central and southern parts of the Qinling Mountains.
The spatial distribution of the health grade of the rural economic ecosystem subsystem demonstrates a significant pattern of “poor in the middle and good in the north and south” (Figure 6d). Counties with healthy grades include Huyi District, Baqiao District, Lantian County, Lintong District in Xi’an City, Linwei District, Huazhou District, Huayin City, Tongguan County in Weinan City, Chencang District in Baoji City, Qishan County in Baoji City, Hantai District in Hanzhong City, and Hanyin County in Ankang City, predominantly distributed in Guanzhong District. These counties account for 83% of the total number of healthy-grade counties, with health scores ranging from 0.2078 to 0.2286. This trend aligns with the spatial distribution of rural per capita disposable income. Counties with diseased grades mainly include Feng County and Taibai County in Baoji City, Liuba County and Foping County in Hanzhong City, Ningshan County in Ankang City, Zhen’an County and Zhashui County in Shangluo City, Shanyang County, Danfeng County, and Shannan County, accounting for 25.6% of the total counties. These areas are mainly situated in the northern part of southern Shaanxi and the southern part of Guan–zhong.

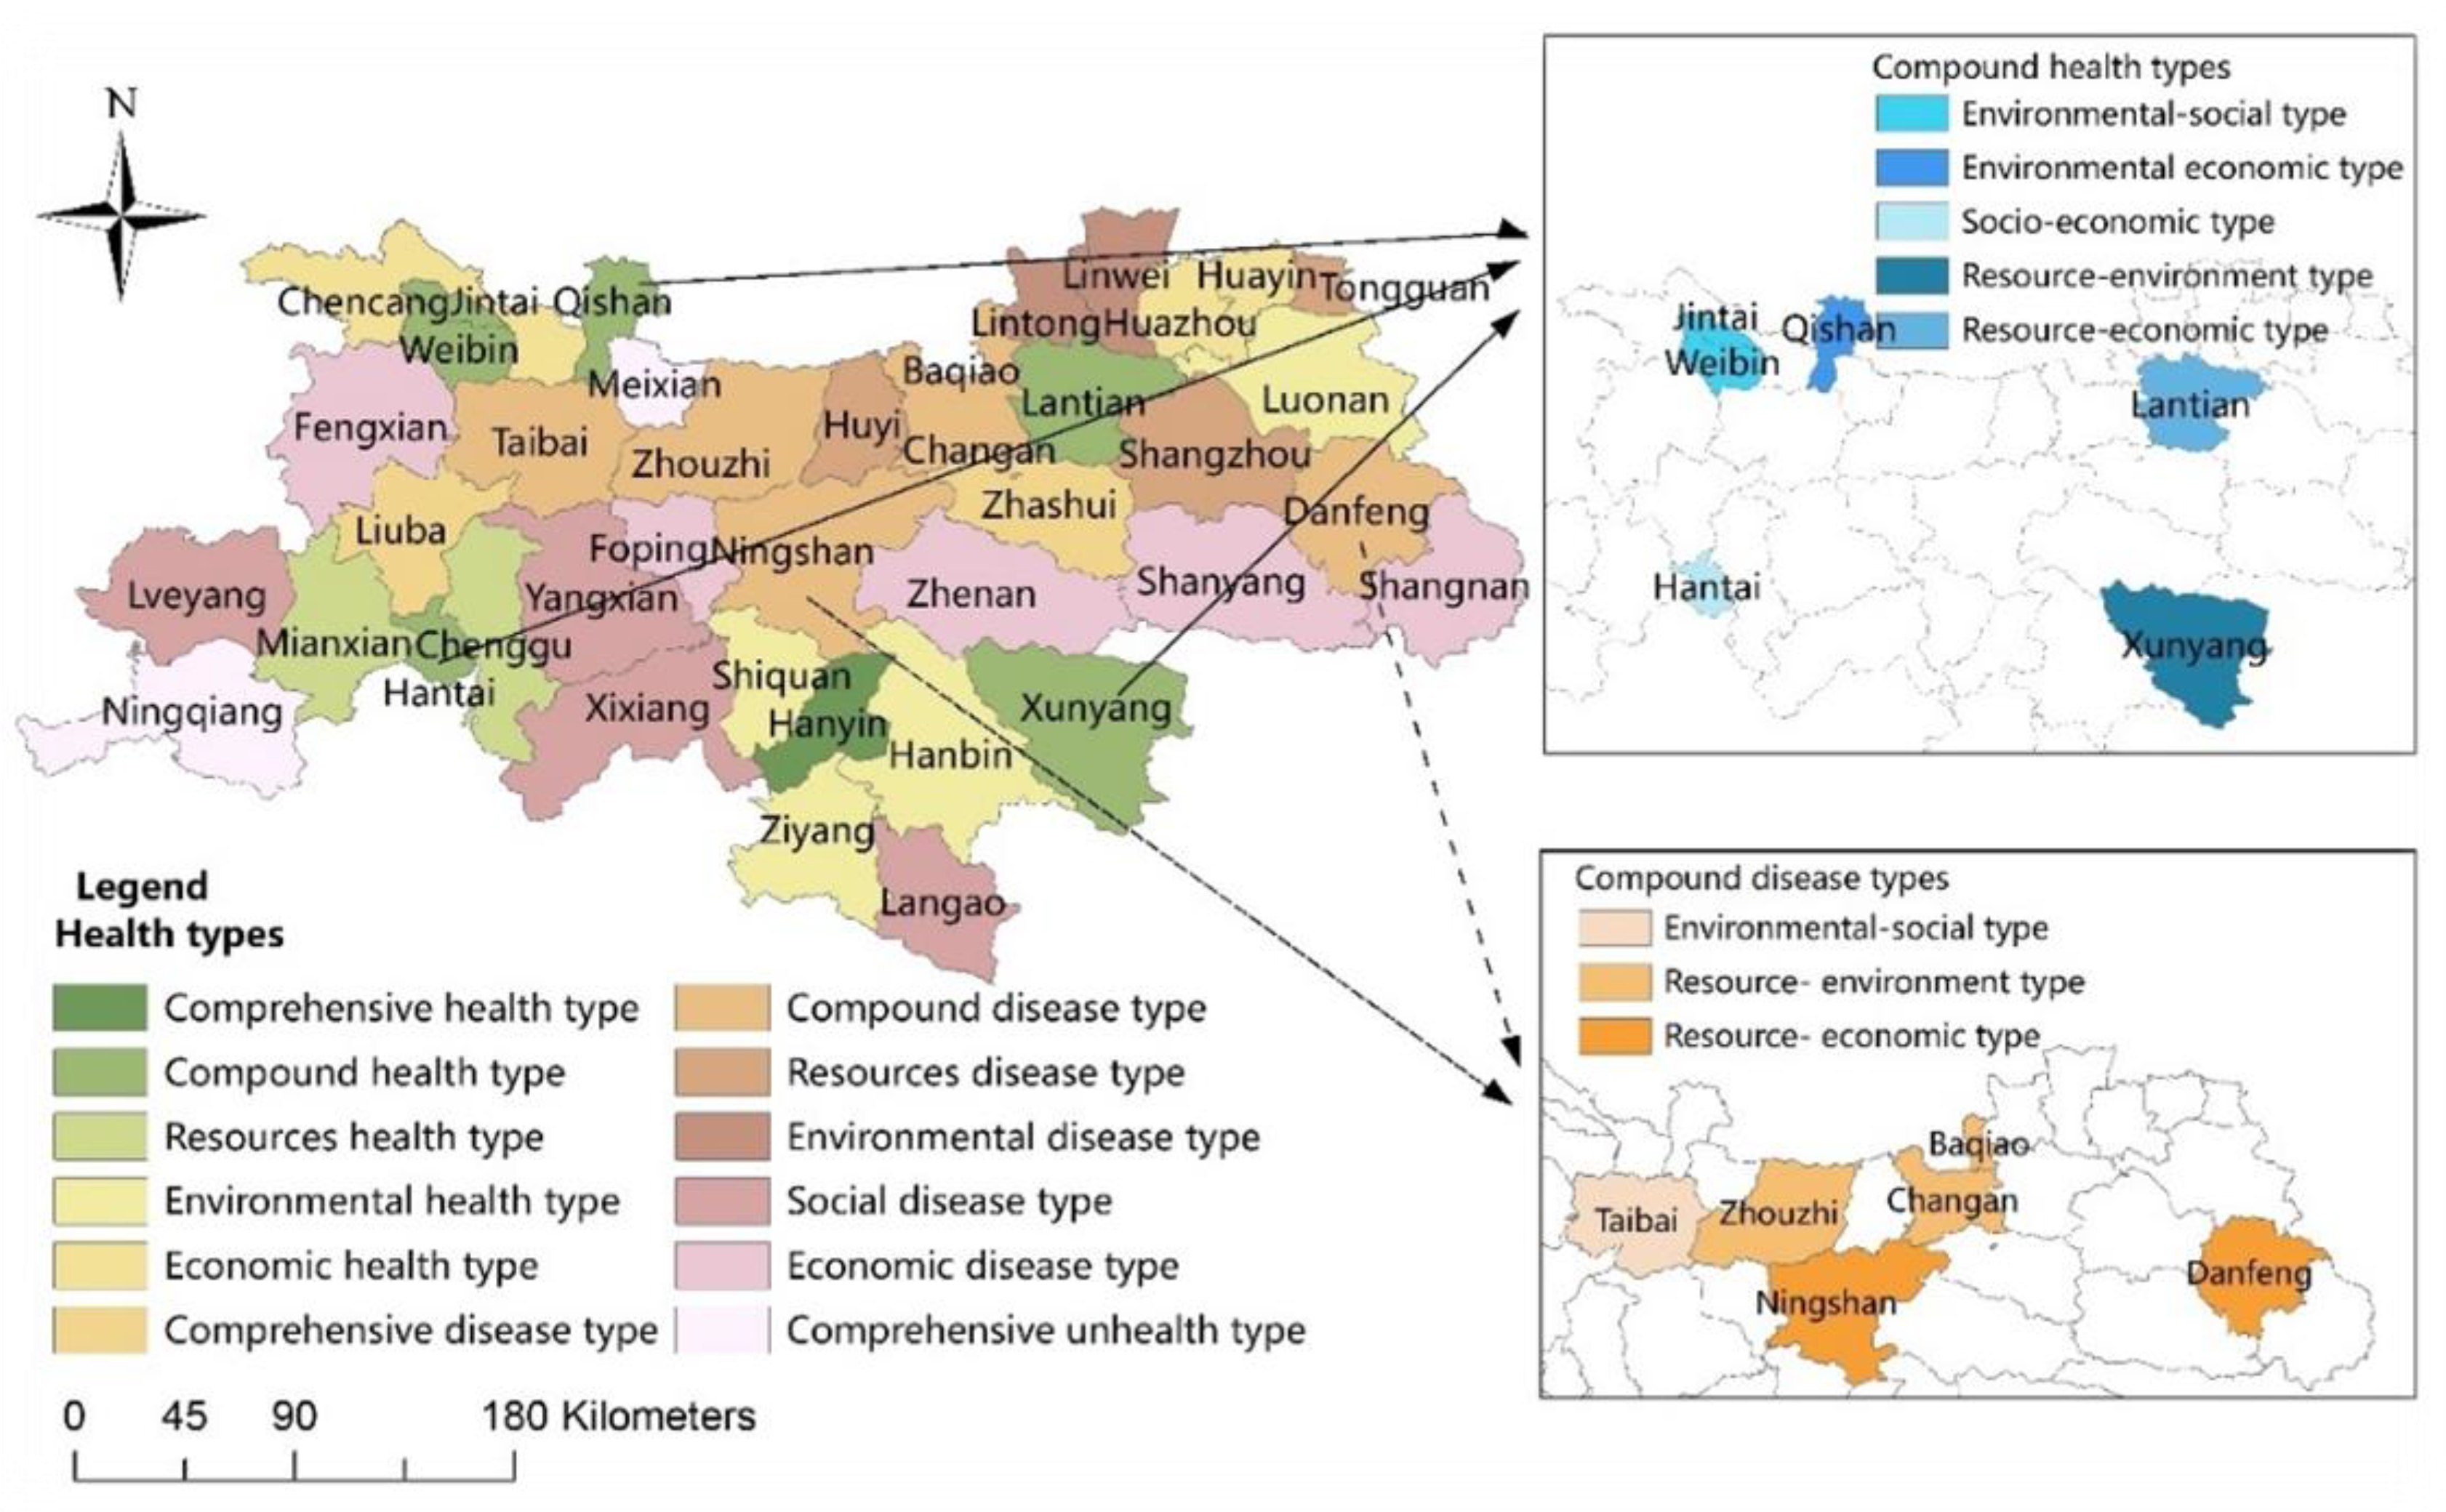
3.3. Classification of Rural Ecosystem Health Types around the Qinling Mountains in Shaanxi Province

(1)
Analysis of the development of rural ecosystems in healthy counties
According to the classification criteria presented in Table 3 and Figure 3, healthy rural ecosystems include 16 counties of five types, constituting 40% of the total number of counties (Table 6). The comprehensive health type is exemplified by Hanyin County, characterized by abundant natural resources, minimal ecological pollution, favorable environmental quality, and a relatively high level of rural economic development. Given these attributes, it should be considered a priority for strategic development to sustain healthy and sustainable growth. The compound health type includes 10 counties of five types, mainly concentrated in Guanzhong and southern Shaanxi. These counties typically exhibit favorable environmental or economic conditions but face challenges concerning natural resources and social conditions. The single health type includes 19 counties of four types, primarily concentrated in most of southern Shaanxi and some areas of northern Shaanxi. These counties possess a moderate level of ecosystem health and boast distinctive strengths in terms of resources, environment, society, and economy, although their weaknesses and shortcomings are also significant.
(2)
Analysis of the development of rural ecosystems in diseased health counties
Diseased rural ecosystems are categorized into three groups, including 21 counties, which make up 53.8% of the total number of counties. The comprehensive disease type includes two counties, Liuba County and Zhashui County, where protection measures must be implemented across rural resources, environment, society, and economy. The compound disease type includes six counties, with Chang’an District, Zhouzhi County, and Baqiao District as the resource–environment disease type, Ningshan and Danfeng Counties as the resource–economy disease type, and Taibai County as the economy–social disease type (Figure 7). The compound disease type counties primarily exhibit resource–environment characteristics and are distributed in the Guanzhong region. Resources and the environment are the main factors constraining the ecological health of these areas. The single disease type is categorized into four groups, including 13 counties, accounting for 33% of the total number of counties. Huyi District, Tongguan County, and Shangzhou District are the resource–disease type, Lintong District and Linwei District are the environment disease type, Yang County, Xixiang County, and Langao County are the social disease type, and Foping County, Feng County, Shangnan County, Shanyang County, and Zhen’an County are the economy disease type. Through practical investigation, it is evident that these areas suffer from poor resource conditions, a degraded ecological environment, underdeveloped rural economies, unbalanced industrial structures, inadequate infrastructure, and low living standards of rural residents.
According to the principle of categorization, the sub-healthy type of rural ecosystems, positioned between the healthy type and the diseased type, is categorized as other types. The comprehensively unhealthy type includes two counties, Mei County and Ningqiang County, accounting for 5.1% of the total number of counties. The ecosystem health of this type is at a low to medium level in Shaanxi Province, necessitating comprehensive management. This area is pivotal for facilitating the transition from disease types to healthy and sub-healthy types.

4. Discussion

4.1. Perspective Selection for Rural Ecosystem Health Assessment

The evaluation of rural ecosystem health should be approached holistically. OSTROM et al. emphasized that an ecosystem comprises a complex interplay of human society, economic activities, and natural conditions, embodying the essence of sustainable development through the interconnectedness of the human system and ecosystem. This holistic view encompasses five essential components: humans, resources, environment, society, and economy [12,54,55,56]. The health of a rural ecosystem can be gauged by the stability of rural production, livelihoods, and ecological spaces, which are influenced by the interactions within the intricate rural social–economic–nature system. The level of stability dictates the trajectory of development, change, and sustainable growth of the rural ecosystem [57]. Therefore, assessing the health of a rural ecosystem necessitates a comprehensive understanding of its essence, considering it as the culmination of interactions among various subsystems and human activities. The evaluation framework should integrate dimensions of social and economic subsystems alongside natural ecological subsystems. This study elucidates the concept of rural ecosystem health by emphasizing ecosystem integrity, devises a scientific and quantitative evaluation system tailored for the health of mountain rural ecosystems, and expounds the spatiotemporal patterns and classifications. This approach is crucial for addressing challenges related to ecological conservation and fostering balanced economic development in rural mountainous areas.

4.2. Effectiveness and Scientificity of the Rural Ecosystem Health Evaluation Index System

The rural ecosystem health assessment index system established in this study has proven to be effective for the research area. Compared with the existing ecosystem health evaluation system, the established rural ecosystem health evaluation index system encompasses “resource–environment–social–economy” components. The selection of indicators involved a thorough process, with 28 evaluation indicators identified through a literature review and two rounds of expert screening conducted by members of the Shaanxi Provincial Rural Ecological Protection Association. These indicators have been widely used in previous ecosystem health assessment studies, encompassing factors such as water quality [58,59], forest coverage rate [60], resident Engel coefficient [61], and per capita food production [62], making them reliable measures for characterizing rural ecosystem health. Furthermore, the health status of the rural ecosystem around the Qinling Mountains in Baoji City was assessed and compared using the Ecological Environment Status Index (EI) and the pressure–state–response (PSR) model employed by our team for health assessment (Table 7). The health score of the “nature–economy–society” assessment model was calculated as 0.7865, aligning closely with scores obtained by the other two methods, indicating a consistent assessment of health status. This verification underscores the practicality, effectiveness, and scientificity of the evaluation system.

4.3. Applicability of Rural Ecosystem Health Evaluation Index System

This study introduces the innovative integration of the sustainable SDG 17 reference standard into the rural ecosystem health evaluation index, aligning well with international reference standards and evaluations. Significant spatial differentiation variations in the health levels of rural ecosystems in the rural areas around the Qinling Mountains in Shaanxi Province were identified, with rural society and resource subsystems exerting the most significant impacts (Table 8). The findings exhibit both similarities and differences in comparison to previous research on rural ecosystems in Jiangsu and Chongqing, China [23,63]: (1) The similarity lies in the core influences of rural social and economic development on rural ecosystem health, which is basically consistent with the actual situation of rural development around the Qinling Mountains in Shaanxi Province. In recent years, Shaanxi Province has seen substantial improvements in rural social and economic development through initiatives promoting rural revitalization and urban–rural integration. (2) Compared with rural areas in Jiangsu, China, mountainous villages around the Qinling Mountains in Shaanxi face more prominent constraints due to transportation challenges, the flow of external production factors, and geographical locations. Consequently, economic growth and material wealth accumulation can be achieved through sustained investment in natural resources, leading to the enhancement of rural social subsystem development. The analysis indicates that the index system established in this study holds broad applicability for evaluating the health of mountainous rural ecosystems in China and other developing countries.
Rural ecosystem health is an important research topic within the field. Preliminary results have been obtained in the areas of REH evaluation, spatial distribution, and type classification in this exploratory study. Subsequent research will further enhance the examination of the dynamic evolution of REH in the vicinity of the Qinling Mountains. This will aid in gaining a more thorough comprehension of the development process of REH and uncovering its underlying principles, thereby providing a more comprehensive reference for the construction of rural areas in developing countries.

5. Conclusions

The health scores of rural ecosystems around the Qinling Mountains in Shaanxi Province were generally healthy, showing a fluctuating downward trend from Guanzhong to southern Shaanxi.
The spatial distribution of REH grades in counties around the Qinling Mountains in Shaanxi was dispersed and not concentrated. Moreover, the spatial distribution of individual subsystems appeared more concentrated, exhibiting better clustering and noticeable cluster distribution patterns.
Identification of the REH type was conducted in the 40 counties around the Qinling Mountains in Shaanxi. Healthy-type counties were mainly distributed in Guanzhong and southern Shaanxi, while diseased-type counties were predominantly distributed in the east-central areas of Guanzhong and southern Shaanxi.
The level of rural socioeconomic development is the key factor influencing the ecosystem health of counties around the Qinling Mountains in Shaanxi, China.

Author Contributions

Y.X. conceived and designed the study and drafted the manuscript. Q.C. performed the data processing and analyzed and interpreted the results. H.Z. drew the graphs and completed the translation. Y.X., Q.C. and H.Z. participated in revising and improving the manuscript. All authors have read and agreed to the published version of the manuscript.

Funding

This research was funded by the Shaanxi Provincial Key Think Tank Research Project on “Social Sciences Helping County Economies Develop in High Quality”: Countermeasures Research on All-Region Tourism Boosting the High-Quality Development of Mei County’s Economy (2023ZD0624).

Data Availability Statement

No new data were created or analyzed in this study. Data sharing is not applicable to this article.

Conflicts of Interest

The authors declare no conflicts of interest.

References

  1. Yuan, X.; Liu, H.; Lu, J. Ecosystem health assessment--conceptual framework and indicator selection. J. Appl. Ecol. 2001, 12, 627–629. [Google Scholar]
  2. Yuan, M.; Yan, H. Application of hierarchical analysis to urban ecosystem health assessment. S. Sci. Manag. S. T. 2003, 8, 84–86. [Google Scholar]
  3. Ning, L.; Ma, L.; Zhou, Y.; Bai, X. Study on spatial and temporal changes of ecosystem health in Jiangsu coastal zone based on PSR model. China Environ. Sci. (Chin. Ed.) 2016, 36, 534–543. [Google Scholar]
  4. Jiang, H.; Liu, P.; Liu, L.; Zhu, J.; Qiu, M.; Li, H.; Xu, Y. Evaluation of ecosystem health in Magnetic Lake Basin based on PSR model. J. Hubei Univ. Nat. Sci. 2021, 43, 661–666. [Google Scholar]
  5. Zhang, W.; Ma, Z.; Chen, B.; Zhang, D.; Hu, W.; Chen, G.; Yu, W. Ecosystem health assessment of mangrove forests at the mouth of Chiu-lung River in Fujian Province: Based on the VOR framework. J. Ecol. Rural Environ. 2022, 38, 61–68. [Google Scholar]
  6. Li, J.; Fu, B.; Sun, J.; Hong, Z.; Zhang, B.; Wang, X.; Bai, H.; Wang, F.; Zhao, Z.; Cao, X. Ecological civilization construction of Qinling Mountain in the new period: Problems and development path. J. Nat. Resour. 2021, 36, 2449–2463. [Google Scholar]
  7. Zhou, Q.; Su, W.; Zhang, J.; Guan, B. A preliminary study on ecosystem health assessment of rural settlements. R. Soil Water Conserv. 2009, 16, 121–126. [Google Scholar]
  8. Li, P.; Fang, X. Evaluation index system of rural ecosystem health in the Loess Plateau and experimental research on ecological and economic functional zones. In Proceedings of the Annual Conference of the Chinese Society of Environmental Sciences; China Environmental Science Publishing House: Beijing, China, 2011; pp. 216–223. [Google Scholar]
  9. Costanza, R.; Mageau, M. What is a healthy ecosystem? Aquat. Ecol. 1999, 33, 105–115. [Google Scholar] [CrossRef]
  10. Wang, L. Research on spatial planning of rural tourism in Yuexi County; Anhui University of Architecture: Hefei, China, 2017. [Google Scholar]
  11. Editorial Committee of the General Editorial Committee of the Chinese Encyclopedia of Agriculture. Chinese Agricultural Encyclopedia: Insect Volume; Agricultural Press: Beijing, China, 1990. [Google Scholar]
  12. Rapport, D.J.; Costanza, R.; McMichael, A.J. assessing ecosystem health. Trends Ecol. Evol. 1998, 13, 397–402. [Google Scholar] [CrossRef] [PubMed]
  13. Fellows, C.S.; Clapcott, J.E.; Udy, J.W.; Bunn, S.E.; Harch, B.D.; Smith, M.J.; Davies, P.M. Benthic Metabolism as an Indicator of Stream Ecosystem Health. Hydrobiologia 2006, 572, 71–87. [Google Scholar] [CrossRef]
  14. Bharti, M. Ants as bioindicators of ecosystem health in Shivalik Mountains of Himalayas: Assessment of species diversity and invasive species. Asian Myrmecol. 2017, 8, 1–8. [Google Scholar]
  15. Lackey, R.T. Values, policy, and ecosystem health. Bioscience 2001, 51, 437–443. [Google Scholar] [CrossRef]
  16. Pan, Z.; He, J.; Liu, D.; Wang, J.; Guo, X. Ecosystem health assessment based on ecological integrity and ecosystem services demand in the middle reaches of the Yangtze River Economic Belt, China. Sci. Total Environ. 2021, 774, 144837. [Google Scholar] [CrossRef]
  17. Costanza, R. Ecosystem health and ecological engineering. Ecol. Eng. 2012, 45, 24–29. [Google Scholar] [CrossRef]
  18. Li, W.; Wang, Y.; Xie, S.; Cheng, X. Coupling coordination analysis and spatiotemporal heterogeneity between urbanization and ecosystem health in Chongqing municipality, China. Sci. Total Environ. 2021, 791, 148311. [Google Scholar] [CrossRef] [PubMed]
  19. Neri, A.C.; Dupin, P.; Sanchez, L.E. A pressure⁃state⁃response approach to cumulative impact assessment. J. Clean. Prod. 2016, 126, 288–298. [Google Scholar] [CrossRef]
  20. Styers, D.M.; Chappelka, A.H.; Marzen, L.J.; Somers, G.L. Developing a land⁃cover classification to select indicators of forest ecosystem health in a rapidly urbanizing landscape. Lands. Urban Plan. 2010, 94, 158–165. [Google Scholar] [CrossRef]
  21. Van Niekerk, L.; Adams, J.B.; Bate, G.C.; Forbes, A.T.; Forbes, N.T.; Huizinga, P.; Lamberth, S.J.; MacKay, C.F.; Petersen, C.; Taljaard, S.; et al. Country wide assessment of estuary health: An approach for integrating pressures and ecosystem response in a data limited environment. Estuar. Coast. Shelf Sci. 2013, 130, 239–251. [Google Scholar] [CrossRef]
  22. Ye, C.; Li, C.; Wang, Q.; Chen, X. Drivingm forces analysis for ecosystem health status of littoral zone with dikes: A case study of Lake Taihu. Acta Ecol. Sin. 2012, 32, 3681–3690. [Google Scholar]
  23. Meng, L.; Huang, J.; Dong, J. Assessment of rural areas ecosystem health and type classification in Jiangsu province, China. Sci. Total Environ. 2018, 615, 1218–1228. [Google Scholar] [CrossRef]
  24. Zhao, R.; Shao, C.; He, R. Spatiotemporal evolution of ecosystem health of China’s provinces based on SDGs. Int. J. Environ. Res. Public Health 2021, 18, 10569. [Google Scholar] [CrossRef] [PubMed]
  25. Huang, G. The Theory of Building Socialism New Countryside; China Agricultural Press: Beijing, China, 2007. [Google Scholar]
  26. Hong, H.; Liao, H.; Wei, C.; Li, T.; Xie, D. Health assessment of a land use system used in the ecologically sensitive area of the Three Gorges reservoir area, based on the improved TOPSIS Method. Acta Ecol. Sin. 2015, 35, 8016–8027. [Google Scholar]
  27. Peng, J.; Liu, Y.; Li, T.; Wu, J. Regional ecosystem health response to rural land use change: A case study in Lijiang City, China. Ecol. Indic. 2016, 72, 399–410. [Google Scholar] [CrossRef]
  28. Pinto, U.; Maheshwari, B.L.; Ollerton, R.L. Analysis of long-term water quality for effective river health monitoring in peri-urban landscapes-a case study of the Hawkesbury—Nepean river system in NSW, Australia. Environ. Monit. Assess. 2013, 185, 4551–4569. [Google Scholar] [CrossRef] [PubMed]
  29. Shen, C.; Shi, H.; Zheng, W.; Ding, D. Spatial heterogeneity of ecosystem health and its sensitivity to pressure in the waters of nearshore archipelago. Ecol. Indic. 2016, 61, 822–832. [Google Scholar] [CrossRef]
  30. Wang, Q.; Yuan, X.; Zhang, J.; Gao, Y.; Hong, J.; Zuo, J.; Liu, W. Assessment of the sustainable development capacity with the entropy weight coefficient method. Sustainability 2015, 7, 13542–13563. [Google Scholar] [CrossRef]
  31. Lepold, J.C. Getting a handle on ecosystem health. Science 1997, 276, 887. [Google Scholar]
  32. Rapport, D.J.; Riegier, H.A.; Hutchinson, T.C. Ecosystem behavior under stress. Am. Nat. 1985, 125, 617–640. [Google Scholar] [CrossRef]
  33. Shear, H. the development and use of indicators to assess the state of ecosystem health in the Great Lakes. Ecosyst. Health 1996, 2, 241–258. [Google Scholar]
  34. Kristin, S.F. Ecosystem health: A new paradigm for ecological assessment? Trends Ecol. Evol. 1994, 9, 245–456. [Google Scholar]
  35. Opinions of the State Council of the Central Committee of the Communist Party of China on the Implementation of the Strategy of Rural Revitalization; Central Committee of the CCP: Beijing, China, 2018.
  36. Opinions of the State Council of the Central Committee of the Communist Party of China on Comprehensively Promoting Rural Revitalization and Accelerating Modernization of Agriculture and Rural Areas; Central Committee of the CCP: Beijing, China, 2021.
  37. Odum, E.P.; Barrett, G.W. Foundations of Ecology; Beijing Higher Education Press: Beijing, China, 2009. [Google Scholar]
  38. Fosberg, F.R.; Overbeek, J.V. Balance in Cultivated Ecosystems. Science 1959, 129, 1499. [Google Scholar] [CrossRef] [PubMed]
  39. Huang, G. Functions, problems and countermeasures of rural ecosystems in China. Chin. J. Eco-Agric. 2019, 27, 177–186. [Google Scholar]
  40. Shen, W.; Shen, Z.; Wang, X. An analysis of ecosystem health theory and evaluation methods. Chin. J. Eco-Agric. 2004, 12, 164–166. [Google Scholar]
  41. Kong, H.; Zhao, J.; Ma, K.; Zhang, P.; Ji, L.; Deng, H.; Lu, Z. A preliminary study of ecosystem health assessment methods. J. Appl. Ecol. 2002, 13, 486–490. [Google Scholar]
  42. Ma, K.; Kong, H.; Guan, W.; Fu, B. Ecosystem health assessment: Methods and directions. J. Ecol. 2001, 21, 2106–2116. [Google Scholar]
  43. Zhang, J.; Luo, S. Basic connotation and evaluation index of agroecosystem health. Chin. J. Appl. Ecol. 2004, 15, 1473–1476. [Google Scholar]
  44. Li, H.; Zhang, X.; Wu, J. Spatial pattern and its driving mechanism of rural settlements in southern Jiangsu. Sci. Geogr. Sin. 2014, 34, 439–446. [Google Scholar]
  45. Long, H.; Jian, Z.; Liu, Y. Differentiation of rural development driven by industrialization and urbanization in eastern coastal China. Habitat Int. 2009, 33, 454–462. [Google Scholar] [CrossRef]
  46. Long, H.L. Land consolidation and rural spatial restructuring. Acta Geograph. Sin. 2013, 68, 1019–1028. [Google Scholar]
  47. Ren, P.; Hong, B.; Liu, Y.; Zhou, J. A study of spatial evolution characteristics of rural settlements and influences of landscape patterns on their distribution using GIS and RS. Acta Ecol. Sin. 2014, 34, 3331–3340. [Google Scholar]
  48. Liu, L. Research on Rural Landscape along Qinling Mountain in Xi’an Based on the Vision of Ecological Culture; Xi’an University of Architecture and Technology: Xi’an, China, 2013. [Google Scholar]
  49. Chen, X. Research on optimisation and enhancement of rural landscape in the context of rural revitalisation--Taking South Doujiao Village in the North Foothill of Qinling as an Example. Pop. Lit. Art. 2020, 2, 132–133. [Google Scholar]
  50. Regulations on the Protection of Qinling Ecological Environment; Shaanxi Daily: Xi’an, China, 2017.
  51. Zhang, Y.u.; Wang, J.; Liu, Y. Transformation of regional functions and path of high-quality development in Qinba Mountain area of Shaanxi. J. Nat. Resour. 2021, 36, 2464–2477. [Google Scholar]
  52. Su, Y. Ecosystem Health Assessment of Lanling Creek Small Watershed; Huazhong Agricultural University: Wuhan, China, 2010. [Google Scholar]
  53. Zhao, Z.; Yu, D.; Han, C.; Wang, K. Study on spatial and temporal changes of ecosystem service value in Poyang Lake Ecological and Economic Zone from 2008 to 2016. Resour. Environ. Yangtze Basin 2017, 26, 198–208. [Google Scholar]
  54. Elinor, O.A. general framework for analyzing sustainability of social-ecological systems. Science 2009, 325, 419–422. [Google Scholar]
  55. Wang, R.; Ouyang, Z. Socioeconomic-natural complex ecosystem and sustainable development. Bull. Chin. Acad. Sci. 2012, 27, 337–345. [Google Scholar]
  56. Partelow, S. Coevolving Ostrom’s social–ecological systems (SES) framework and sustainability science: Four key co-benefits. Sustain. Sci. 2016, 11, 399–410. [Google Scholar] [CrossRef]
  57. Liu, Y.; Yang, C.; Tan, S.; Zhou, H.; Zeng, W. An approach to assess spatio-temporal heterogeneity of rural ecosystem health: A case study in Chongqing mountainous area, China. Ecol. Indic. 2022, 136, 108644. [Google Scholar] [CrossRef]
  58. Zhou, Q.; Peng, C.; Liu, X.; Xiang, Y.; Zhou, L. VOR model based on ecosystem health assessment in the Three Gorges Reservoir area from 2010 to 2020. Res. Soil Water Conserv. 2022, 29, 310–318. [Google Scholar]
  59. Cui, B.; Yang, Z. Index system of wetland ecosystem Health Evaluation Ⅰ. The theory. Acta Ecol. Sin. 2002, 22, 1005–1011. [Google Scholar]
  60. Qi, F.; Li, Q.; Zhu, L. Research progress of Marine ecosystem health assessment. Mar. Bull. 2007, 26, 97–104. [Google Scholar]
  61. Xie, H.; Li, B.; Wang, C.; Yang, B.; Zhang, X. Health evaluation of agricultural ecosystem in western China. Acta Ecol. Sin. 2005, 25, 3028–3036. [Google Scholar]
  62. Wang, F.; Mao, A.; Li, H.; Jia, M. Analysis of urbanization quality, quantitative measure and spatial difference in Shandong province based on entropy method. Geoscience 2013, 33, 1323–1329. [Google Scholar]
  63. Cao, Y.; Yang, C.; Wang, X. Spatial and temporal pattern evolution and planning regulation of rural ecosystem health in Chongqing. J. Mt. Sci. 2022, 40, 902–918. [Google Scholar]
Figure 1. Conceptual interpretation of rural ecosystem health.
Sustainability 16 06323 g001
Figure 2. Overview of the study area.
Sustainability 16 06323 g002
Figure 3. Conceptual diagram of health typology. Notes: REH refers to rural ecosystem health, RRS refers to rural resource subsystem, REnvS refers to rural environmental subsystem, RSS refers to rural social subsystem, and REcoS refers to rural economic subsystem.
Sustainability 16 06323 g003
Figure 4. Line graph of changes in REH scores of counties around the Qinling Mountains in Shaanxi Province.
Sustainability 16 06323 g004
Figure 5. Distribution of the number of health grades of rural ecosystem subsystems in counties around the Qinling Mountains in Shaanxi Province, China. Note: Shan Nan refers to the southern region of Shaanxi. The Shan Nan region, from west to east, encompasses the prefecture-level cities of Hanzhong, Ankang, and Shangluo; the Guanzhong region is located in central Shaanxi Province, including five prefecture-level cities of Xi’an, Xianyang, Baoji, Weinan, and Tongchuan.
Sustainability 16 06323 g005
Figure 6. Spatial distribution of four subsystems with different health levels across 40 counties in Shaanxi province.
Sustainability 16 06323 g006aSustainability 16 06323 g006b
Figure 7. Spatial distribution of the REH types of 40 counties in Shaanxi province.
Sustainability 16 06323 g007
Table 1. Selected data sources.
Data TypeData Source Clarification
Administrative divisions of Shaanxi Province (1:50,000)Geospatial Data Cloud (https://www.gscloud.cn/, accessed on 5 April 2021)Vector data
LUCC data (50 m × 50 m)Cold and Arid Regions Science Data Center (https://www.westdc.westgis.ac.cn, accessed on 6 May 2021)Used to calculate
BI and ESV
NDVI data (30 m × 30 m)Geospatial data cloud network (http://www.gscloud.cn, accessed on).Calculated vegetation
coverage
Water system data (1:40,000)Chinese River System dataset [M],1988, BeijingUsed to calculate
wetland area ratio
Natural environment dataEcol Environ Status Bull (2020) (https://sthjt.shaanxi.gov.cn/, accessed on); Water Soil Conserv. Bull. (2020) (http://slt.shaanxi.gov.cn/, accessed on 6 July 2021)Characterize the health
status of rural resources
and environment
subsystem
Social and economic dataStatistical Yearbook for Cities and Counties (2020) (http://www.shaanxi.gov.cn/, accessed on 6 July 2021)Characterize the health
status of rural social and
environmental subsystems
Table 2. County-based rural ecosystem health assessment framework, indicator weights, and reference values.
SubsystemsIndicatorsUnitsReference ValueWeightIndicator Character
Rural resources subsystem (RRS)Arable land area per capitahm20.090.0391+
Water resources per capitam32077.750.0531+
Proportion of wetland area%1.6760.0412+
Forest cover rate%180.0228+
Biological richness index%750.0291+
Ecosystem services value per hectareCNY/hm2380,427.80.0538+
Rural environment subsystem (REnvS)Up-to-standard rate of rural surface water quality%700.0819+
Up-to-standard rate of air quality per year%76.710.0204+
Rate of comprehensive utilization of solid waste%900.0279+
Up-to-standard rate of comprehensive improvement of rural environment%77.660.0270+
Farmland use of pesticides per hectaret/hm20.010.0100
Farmland chemical fertilizer application per hectaret/hm22500.0176
Rural social subsystem (RSS)Natural population growth rate%3.810.0279
Density of rural populationPerson/km27180.0584
Per capita self-owned housing area in rural aream341.80.0297+
Rural annual per capita household electricity consumptionkw·h/person7200.0372+
Per capita living consuming expenditures of rural residentsCNY10,9350.0253+
Per capita education funds expendituresCNY13870.0343+
Engel coefficient of rural residents%25.90.0261
Number of doctors per 1000 personsPerson11.230.0537+
Number of health care institutions beds per 1000 persons6.860.0525+
Rural economic subsystem (REcoS)Per capita grain output of rural residentskg783.20.0383+
Per capita disposable income of rural residentsCNY12,3260.0365+
Proportion of non-farm payrolls among rural residents%51.670.0254
Proportion of rural secondary and tertiary industry product%101.350.0304
Output value of agriculture, forestry, animal husbandry, and fishing per hectare10,000 CNY/hm21.72020.0503+
General power capacity of agriculture machinery per hectarekw/hm21.13400.0500+
Note: “+” and “−” indicate positive and negative correlations with ecosystem health.
Table 3. Criteria for the classification type of rural ecosystem health.
Health Levels of Subsystems (H)Health Type Diseased Levels of Subsystems (D)Disease Type
H ≥ 3Comprehensive healthD ≥ 3Comprehensive disease
H = 2Compound healthD = 2Compound disease
H = 1Single healthD = 1Single disease
Table 4. Ecosystem health scores of 39 county units around the Qinling Mountains in Shaanxi Province, China.
CountyScore
RRSREnvSRSSREcoSREH
Chang’an 0.14690.17540.32150.20120.8449
Huyi0.14650.18090.29580.22240.8456
Lantian0.20460.18230.25180.21630.8550
Zhouzhi0.15460.17630.24650.20780.7852
Lintong0.16930.17470.29520.22860.8679
Baqiao0.10060.17540.30570.22860.8103
Weibin0.16660.18490.30970.15200.8133
Chencang0.17980.17780.23200.21230.8019
Qishan0.16560.18490.25320.22020.8238
Mei0.19500.17850.27010.20240.8460
Feng0.23810.18490.22040.12400.7674
Taibai0.21880.18490.20290.012380.7304
Tongguan0.15040.17690.27340.22410.8249
Huayin0.16660.18300.26880.22750.8459
Huazhou0.16720.17890.24770.22580.8196
Linwei0.15800.17370.30760.22810.8675
Chenggu0.22020.17910.23680.19860.8347
Yang0.21640.17850.21400.18380.7928
Xixiang0.20300.17820.21000.17120.7624
Mian0.20680.17810.23440.19090.8101
Ningqiang0.19950.17830.22770.15770.7633
Lueyang0.18020.17820.20390.15420.7166
Liuba0.15110.17920.18950.11870.6377
Foping0.17420.17790.24060.12380.7165
Hantai0.16420.17950.30670.21310.8635
Hanyin0.20940.18460.25290.21130.8586
Shiquan0.18490.19650.24650.18920.8171
Ningshan0.14400.18480.23070.10650.6661
Ziyang0.18010.18490.22220.18810.7753
Xunyang0.21150.18460.25490.17130.8223
Hanbin0.18570.18670.27830.20450.8552
Langao0.18820.18450.21840.15070.7418
Shangzhou 0.15110.18430.23380.15310.7224
Luonan0.19530.18400.22590.17000.7756
Danfeng0.14540.18420.23860.14120.7094
Shangnan0.16920.18260.23750.14090.7303
Shanyang0.16780.18300.23470.14050.7261
Zhen’an 0.19100.18510.23390.14190.7520
Zhashui0.15380.18450.20750.13290.6788
Jintai0.1666 0.1849 0.3097 0.1520 0.8133
Table 5. Spatial Gini coefficients of rural ecosystems and subsystems around the Qinling Mountains in Shaanxi Province, China.
TypeRRSREnvSRSSREcoSREH
Di6.93337.05929.68196.999830.6743
Gi0.13100.01970.11050.19240.0670
Note: Di denotes the Dagum Gini coefficient value for each subsystem; Gi denotes the Gini coefficient value for each subsystem.
Table 6. Statistics on rural ecosystem health types.
TypesNumberCounties
First ClassSecond ClassThird ClassFirst ClassSecond ClassThird Class
Health typeComprehensive health--1-Hanyin
Compound healthResource–environment type-61Xunyang
Resource–economic type1Lantian
Environmental–social type2Weibin, Jintai
Environmental–economic type1Qishan
Social–economic type1Hantai
Resource health2-Chenggu, Mian
Environmental health4-Shiquan, Ziyang, Hanbin, Luonan
Social health0-
Economic health3-Chencang, Huayin, Huazhou
Disease typeComprehensive disease-2-Liuba, Zhashui
Compound diseaseResource–environment disease type-63Chang’an, Zhouzhi, Baqiao
Resource–economic disease type2Ningshan, Danfeng
Economic–social disease type1Taibai
Resource disease-3-Huyi, Tongguan, Shangzhou
Environmental disease-2-Lintong, Linwei
Social disease-4-Yang, Xixiang, Langao, Lueyang
Economic disease-5-Foping, Shangnan, Shanyang, Feng, Zhen’an
Comprehensively unhealthy type -2--Mei, Ningqiang
Table 7. Comparison of ecosystem health assessment results of the rural areas around the Qinling Mountains using different evaluation systems.
Time 202120222023
Evaluation model PSR modelEI index methodNature–economy–society evaluation model
Health score 0.652880.57000.7865
Health status HealthHealthHealth
Evaluation levelComprehensively healthy(0.8, 1.0](≥75)(0.9, 1.0]
Healthy(0.6, 0.8](55, 75](07, 0.9]
Sub-healthy(0.4, 0.6](35, 55](0.5, 0.7]
Diseased(0.2, 0.4](20, 35](0.3, 0.5]
Comprehensively unhealthy(0, 0.2](0.4, 0.6](<20)
Table 8. Correlation coefficients of the primary factors affecting ecosystem health in counties around the Qinling Mountains in Shaanxi Province.
Impact FactorValue of Ecosystem Services per CapitaAnnual per Capita Rural Electricity ConsumptionRural per Capita Expenditure on EducationRural per Capita Disposable Income
Pearson’s correlation0.3850.3230.4100.402
Significance0.0160.0450.0100.011
Disclaimer/Publisher’s Note: The statements, opinions and data contained in all publications are solely those of the individual author(s) and contributor(s) and not of MDPI and/or the editor(s). MDPI and/or the editor(s) disclaim responsibility for any injury to people or property resulting from any ideas, methods, instructions or products referred to in the content.

