Article

A Sustainable Rental Price Prediction Model Based on Multimodal Input and Deep Learning—Evidence from Airbnb

Department of E-Commerce, Jinan University (Shenzhen Campus), Shenzhen 518053, China
*
Authors to whom correspondence should be addressed.
Sustainability 2024, 16(15), 6384; https://doi.org/10.3390/su16156384
Submission received: 13 June 2024 / Revised: 23 July 2024 / Accepted: 23 July 2024 / Published: 25 July 2024

Abstract

:
In the accommodation field, reasonable pricing is crucial for hosts to maximize their profits and is also an essential factor influencing tourists’ tendency to choose. The link between price prediction and findings about the causal relationships between key indicators and prices is not well discussed in the literature. This research aims to identify comprehensive pricing determinants for sharing economy-based lodging services and utilize them for lodging price prediction. Utilizing data retrieved from InsideAirbnb, we recognized 50 variables classified into five categories: property functions, host attributes, reputation, location, and indispensable miscellaneous factors. Property descriptions and a featured image posted by hosts were also added as input to indicate price-influencing antecedents. We proposed a price prediction model by incorporating a fully connected neural network, the bidirectional encoder representations from transformers (BERT), and MobileNet with these data sources. The model was validated using 8380 Airbnb listings from Amsterdam, North Holland, Netherlands. Results reveal that our model outperforms other models with simple or fewer inputs, reaching a minimum MAPE (mean absolute percentage error) of 5.5682%. The novelty of this study is the application of multimodal input and multiple neural networks in forecasting sharing economy accommodation prices to boost predictive performance. The findings provide useful guidance on price setting for hosts in the sharing economy that is compliant with rental market regulations, which is particularly important for sustainable hospitality growth.

1. Introduction

Over the last decades, the world of accommodation has been experiencing an unparalleled shift towards a sharing economy [1,2], as exemplified by the accommodation website Airbnb [1,2], which has been at the forefront in connecting owners of idle accommodation assets with travelers [3]. The sharing economy has played a disruptive role in the hospitality sector as it changed the accommodation paradigm from one that was provided by businesses to one offered by individuals [4,5]. Such a more private management pattern enables hosts to offer an extensive array of costs, property attributes, and flexibility [3], as well as a more diversified experience for consumers than traditional hotel lodging [6,7]. Peer-to-peer networks also posed a challenge to the hotel ecosystem’s capacity to support itself financially [7]. For example, Texas’s plentiful supply of Airbnb forced hoteliers to decrease their rates in response [3], which reduced their profits. Sharing economy lodging is therefore intimately associated with sustainability.
It is well known that price is one of the key factors affecting the long-term success of the lodging industry [8,9], as fair pricing influences consumers’ propensity to choose shared products and is crucial to hosts making a profit. Several studies have predicted rental prices using data-mining algorithms on Airbnb listings [8,10,11,12], while other scholars have excavated the variables influencing Airbnb room pricing [2,7,9,13,14,15]. Although a plethora of influential variables related to the listing price on peer-to-peer platforms have been investigated, price prediction has been understudied. First, most research on predictive models for rental prices is based on data from a single source [5,16]. Seldom have other sources, such as textual or graphic materials, been included. Second, the true potential of the deep learning models in resolving peer-to-peer residential rental problems has not been fully exerted. Efforts from [17,18] are notable exceptions; nevertheless, both of them focused mainly on time-series forecasting. Integration of state-of-the-art deep learning (DL) paradigms for granular predictive analytics of listing prices is scarce [19]. Third, important elements that have been highlighted in previous empirical research have not been employed to support the performance evaluation’s causal theory. Airbnb offers a wide range of attributes, from trivial features to beautiful photos, which are linked to rental performance in the shared marketplace [20]. Rarely is such crucial data put into a forecast model.
Our investigation was driven by the above knowledge gaps. We used multimodal input (i.e., influential metadata, texts, and images) and multiple DL approaches to predict a static-time-point listing price on Airbnb. Results show that the proposed model outperforms other models with simple or fewer inputs, reaching a minimum MAPE (mean absolute percentage error) of 5.5682% and an approximate 4.6% decrease against any subset. This study offers a few novel insights. First, as far as we know, this is the initial empirical attempt to apply multimodal input to price prediction. Second, we concentrate on constructing a conjoint DL framework based on bidirectional encoder representations from transformers (BERT) and MobileNet in the sharing economy accommodation field. Our goal is to predict accommodation listing prices by expanding the branches of predictors and applying a separate neural network to illustrate each branch’s distinctiveness. Third, we used the text description and images provided by hosts as supplementary input, truly acknowledging the hosts’ marketing initiatives. Findings offer insightful information on how hosts in the sharing economy should set their prices and how consumers can identify listings with arbitrary pricing. Platform administrators are thus able to keep the Airbnb platform’s listings valued sustainably.
The remaining portions of this research are arranged as follows: Section 2 reviews the literature, Section 3 briefs the architectural framework, Section 4 depicts the empirical results, and Section 5 and Section 6 present the discussion and conclusion.

2. Literature Review

2.1. Peer-to-Peer Residential Rentals

The sharing economy places immense value on the idea that everyone has the willingness to lend their products, resources, or services to those in need [21,22]. The sharing economy provides a fresh approach to resource exchange. Additionally, the swift growth of information and communication technologies, whether in the form of software or hardware, has made it possible for users to create and share their content, work together, and transact through online platforms at anytime, anywhere. The industry of peer-to-peer residential rentals has grown astronomically due to the increased demand from travelers. These accommodations are listed by people who have the legal authority to use the space on online marketplaces like Airbnb, 9flats, and HomeAway. Such peer-to-peer residential rentals can compete with hotels in the lodging sector since they provide a range of accommodations, including private rooms, complete homes, or even castles, which are offered by hosts [23]. In terms of operating and leasing contracts, some hosts kept living in their properties alongside tenants, whereas in most cases tenants lived alone. From the timely dimension, some hosts practice short-term rentals while others run permanent rental businesses.
Airbnb is one of the most well-known home-sharing sites, specializing in residential rentals. It differs from conventional lodging establishments in basic amenities, customer support, website layout, and reservation methods. While it may be perceived as direct competition in areas with more developed tourism industries, Airbnb may also be seen as an addition to the present hotel room supply [24]. Prior studies have focused on Airbnb’s advantages, threats [3,25], and impacts on the tourism-related industries [25,26,27]. For instance, scholars emphasized that the advantages of Airbnb stemmed from its more affordable rates in comparison to traditional lodging, such as hotels, resorts, and clubs [3], and the advantages of living locally emanated from a sociocultural perspective [6,28]. Both suppliers and customers profit financially from this sharing consumption business model [3]. Fang et al. revealed that employment can increase thanks to the sharing economy, particularly in small- and medium-sized marketplaces [29]. What is the most threatening is that the concept of the sharing economy is gradually ignored as managers transition to seek commercial-style development. An increasing number of investors purchase homes and apartments to rent out permanently on websites like Airbnb. As a result, entire apartment buildings or even neighborhoods are converted into hotel-like vacation rentals [30]. For peer-to-peer platforms to continue operating lawfully and maintaining the initial convenience they brought about, a regulatory framework must be put in place. The boosting of Airbnb has some impact on traditional accommodations. According to Zervas et al., Texas hotel revenues fell by 0.05% for every 1% rise in Airbnb listings [3]. However, this impact may differ in regions. For instance, Nakamura et al. suggested that the total hotel occupancy rates in Japan were not significantly affected by the quantity of Airbnb listings [31].

2.2. Price Determinants in the Sharing Economy

Determining factors that affect rental prices are the key to tourism accommodation management [32], as they may assist hosts in recognizing the service gaps and adjusting the price to a reasonable level for their products to some extent [33,34]. There are various studies aimed at identifying classification methods for influential factors of listing price. Chen and Xie categorized attributes into intrinsic and extrinsic factors; intrinsic factors include functionality and hosting effort, and extrinsic factors include consumer reviews and competition [35]. Zhao et al. classified the influential factors into three attributes: functional attributes, location attributes, and host status attributes [8]. Wang and Rasouli discussed the determinants from structural variables, reputational attributes, and positional variables [36]. Five groups of variables have been recognized as influential factors: host attributes, location attributes, property attributes, review attributes, and miscellaneous attributes [37]. Following the above studies [8,37], we classified the influential factors into the following five categories: function factors, host factors, reputation factors, location factors, and miscellaneous factors.
Functionality has been considered in almost all accommodation price studies. Several studies have shown that functional characteristics associated with accommodation demand, particularly the quantity and capacity of bedrooms, positively affected listing prices [32,35,38,39]. Other function-related features such as the property type and room type were also greatly related to Airbnb room prices [8]. In particular, compared to a shared room, the cost was relatively high for private rooms or independent homes [40].
Another category is host attributes. “Superhost” and “professional host” status (i.e., managing more than two listings) are examples of the most utilized variables [9,35,38,39]. Numerous studies have shown that “Professional hosts” or “Superhost” command a higher room rate than their nonprofessional counterparts [32,39,40,41]. For instance, experienced landlords charged a premium of about 9% over inexperienced landlords, according to Voltes-Dorta and Inchausti-Sintes [40]. Wang and Nicolau revealed that hosts who have more Airbnb listings command a higher lodging fee [7]. However, some scholars claimed that regional heterogeneity existed. For example, it has been discovered that professional landlords in either Hong Kong or New York charge lower fees than amateur ones [41].
Reputation is also a significant indicator of influential factors. The most representative attributes within this category are reviews and ratings [5,16,39]. Price boosting has been verified to be associated with high ratings. For instance, Wang and Nicolau found that each additional star can boost premiums by around 0.87% [7]. Gyódi et al. also noted that hosts should pay attention to cleanliness rating [32].
Another notable price determinant of Airbnb is location. The most direct way to represent location was latitude and longitude, which have been included as predictive indicators in previous studies [16,37]. The majority of the literature has shown that other factors, such as the distance from the city center, positively affect price. For instance, Önder, Weismayer, and Gunter discovered that in Tallinn, Estonia, the quantity of points of interest (POIs) in the neighborhood was positively correlated with the cost of Airbnb listings [5,16,39]. Gyódi et al. also suggested that hosts should revise the property textual content to better underline the positional features [32].

2.3. Price Prediction in Accommodations

Pricing is significant for hotel managers and private hosts as it affects the profit of the supply side and subliminally influences regional development. Price forecasting has been a significant academic issue in the accommodation industry over decades, with diversified predicting models and methods tested by scholars [10,11,12]. Earlier studies focused on conventional lodgings, like price prediction for hotels [42,43]. With the concept of the sharing economy proposed, a novel accommodation appeals to worldwide attention and thus inspires price-related studies [11,37]. These approaches can be generally divided into two categories: statistical analysis and machine learning techniques.
Using a standard binomial Probit model, Mohammed et al. evaluated the impact of various factors representing the tangible, reputational, and contextual attributes of hotels along with market conditions on the probability of price increase or decrease in order to identify the indicators that are related to dynamic price adjustments [44]. Tong et al. developed a hedonic pricing model with data gathered from three cities. The study showed that overall ratings and an emphasis on the scale of the accommodation promoted higher prices, while prices were inversely connected with the number of reviews and the distance from the city center [22]. To investigate the significance of Airbnb hosts’ level of professionalism and how it relates to listing performance and pricing tactics, Abrate et al. adopted regression analysis with longitudinal data in Italy [45]. Using ordinary least squares (OLS) and clustered standard errors, Gunter and Önder found that Vienna’s Airbnb listings showed price inelasticity, indicating that raising prices would allow hosts to make more money [46]. Utilizing a two-stage least squares regression model, Benítez-Aurioles discovered that the demand for Airbnb was price elastic in Barcelona and Madrid, with values that were very close at 2.2 and 2.4, respectively [47].
Several studies have witnessed a notable increase in the accuracy of their predictions with the utilization of machine learning models [48,49,50]. By utilizing graph neural networks and document embeddings, Kanakaris achieved a groundbreaking discovery in the prediction of Airbnb listing costs for popular tourist sites like the island of Santorini [16]. Kalehbasti et al. employed DL and natural language processing (NLP) techniques to help hosts and tenants assess the prices on Airbnb listings by using consumer evaluations, host characteristics, and the numerical features of each listing as input [12]. Sánchez-Franco et al. described an innovative way to analyze prices in the sharing economy using fuzzy clustering and topic modeling [10]. There was evidence that the adaptive network fuzzy interference system (ANFIS) model benefited the study carried out in the gulf cooperation council [43]. From textual descriptions of properties, Islam et al. adopted latent Dirichlet allocation (LDA) to excavate synthetic variables to bolster the precision of price prediction [51].
Machine learning technologies have advanced in the last 20 years, and special attention has been paid to DL-based predictive models in the hospitality and tourism sectors. Though the existing literature has applied machine learning techniques to price prediction in Airbnb accommodation [11,12,51,52,53], these studies concentrate only on textual input. A broader perspective of predictor input should be considered in the model to enhance the accuracy of the prediction.

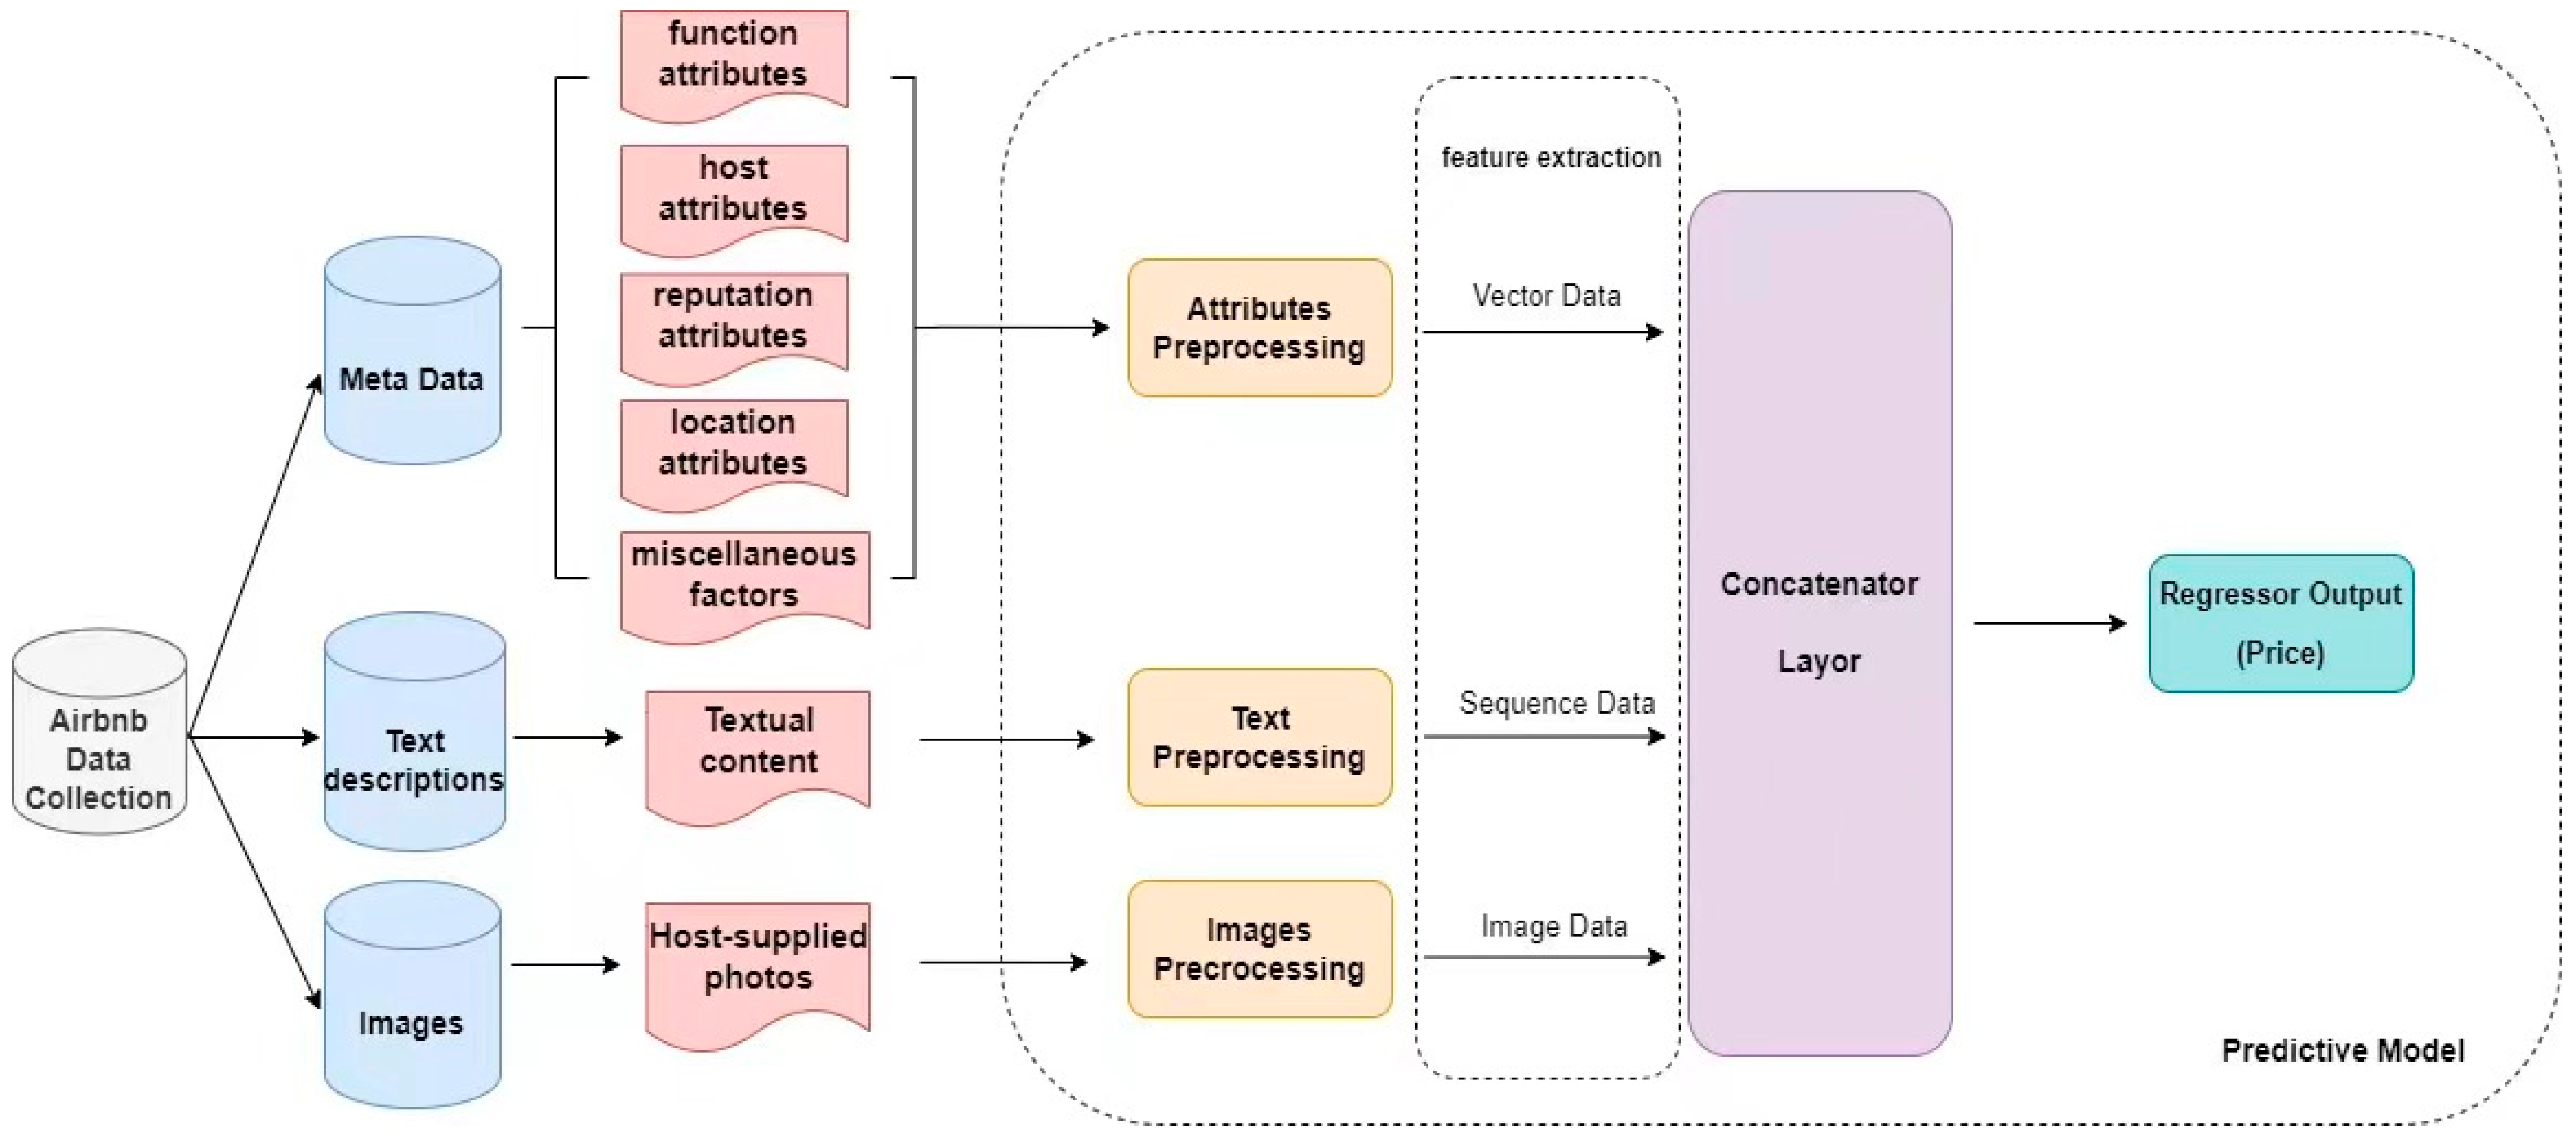
3. Research Design, Data Set, and Methodology

3.1. Research Design

We built a framework based on advanced deep learning techniques to support multimodal prediction. Our three modal sources are influential factors, property textual descriptions, and host-provided images. With the consideration of the non-linear connections between isolated property attributes and price, we employed multilayer neural networks for incorporating multimodal sources into the price predictive model. Motivated by the findings from the prior work [20,51], we proposed a text–image combined method based on BERT and MobileNet. For overall listing price prediction based on a regression problem, a conjoint DL model was created to avoid information redundancy and simultaneously learn the holistic representation. The proposed model was compared with other models and the generated results were verified under different evaluation metrics.
The research framework consisted of the following five steps, as shown in Figure 1:
(1)
Necessary data, including influential factors, textual descriptions, and host-provided images, were retrieved from Airbnb. The influential factors were further categorized into five groups;
(2)
Three data sources were preprocessed to satisfy the various DL model requirements;
(3)
To demonstrate the uniqueness of each branch, a different neural network was used for each data source;
(4)
To represent a full characteristic, the three branches were concatenated. To produce an output, a dense (i.e., fully connected neural network) regressor was applied on top of the concatenated representations to predict the price;
(5)
The proposed model was compared with several baseline approaches. Models’ performance was verified through different evaluation metrics and multiple combinations of data sources.

3.2. Data Collection

Airbnb is a prevalent sharing economy accommodation booking platform, which is seen as a universal information pool in related research. Our experimental data were retrieved from a third-party website, InsideAirbnb.com (https://insideairbnb.com/ [accessed on 5 April 2024]), which is consistent with previous studies [11,19,37]. Following a study by Ghosh et al. [53], accommodations in Amsterdam were selected. The selection was based on multiple facets, including a low computational load, a low percentage of missing values, a high number of available data, and a strong and broad correlation between the price and the potential influential factors.
Data were accessed in April 2024. Numerous data kinds, including numerical data (e.g., host_listing_counts, beds, and review_scores_value), boolean data (e.g., host_identity_verified and has_availability), categorical data (e.g., room_type and source), and date data (e.g., host_since and first_review) were all included in the dataset we have gathered. Additionally, the dataset included image and text data. The property photos uploaded by the hosts for the listings were included in the image data [2,20,54], and written descriptions were included in the text data [51]. Every observation was obtained from InsideAirbnb for listings that were active between March 2023 and April 2024. There were 8380 pieces of data in total.

3.3. Methodology

3.3.1. Multimodal Source

The first type of information source is influential metadata, which consists of five categories: function attributes, host attributes, reputation attributes, location attributes, and miscellaneous attributes. After consulting several relevant studies on the factors affecting Airbnb properties’ listing prices [5,14,15,16,32], we selected 50 representative indicators based on the availability of data. These variables are reported in Table 1. Moreover, we also used two other information sources for listing price forecasting: property textual description and host-provided images. The data format we scraped is presented in Figure 2. Table 1 and Figure 2 exhibit the three types of data sources that are being examined.

3.3.2. Data Preprocessing

The three stages of data preprocessing were metadata, text, and picture processing. First, vectorization of non-numeric properties was accomplished using their representations. The processing of metadata was subdivided into category-type and date-type data. Data fields with string values were instances of category-type data. We filled in the null value with its prior value after labeling this field with nominal category labels and converting the initial string-type data into integer-type data that the model can accept. For date-type data, this involved filling the null value with a prevalence first and then converting the date value to the elapsed days since the data collection date. For all other numeric data, this process was repeated, filling the null value with the mean value first, and then converting it to integer data. After the above procedure, we min–max normalized all of the numerical data to avoid ranges with excessive variance.
Second, texts with a maximum length of 512 tokens, or about comparable words, can be processed via the BERT model. Consequently, we set the length of the text description to 512, cropped the part that was longer than 512, filled the part that was shorter than 512 with 0, and then converted it into word vectors through word segmentation and other operations because the length of the body text in the property description that went with a listing varied. Third, the number of host-provided images differed. Following prior work [55,56], we used only one photo (i.e., the featured image on the first page) in our study (experiments revealed that adding more photos to the model caused a modest decline in performance when textual content was excluded from model input). The image was downsized to 224 × 224 × 3, and each piece of data matches an image that can be used to represent the required morphology for the “MobileNet” Python program.

3.3.3. Model Development

Influential factors comprise the first data source and represent basic metadata. Dense networks are typically used to process such data. Textual descriptions are usually represented as sequential data, constituting the second data source. These data are usually processed with recurrent networks, which allow textual descriptions to be analyzed due to the linguistic representation techniques they provide. The third category, which consists of property photos provided by hosts, includes image data that are frequently handled using image-processing frameworks such as 2D convolutional neural networks (CNNs) and enhanced CNN-based structures.
(1) Dense is a fully connected neural network and has often been used in semantic segmentation, NLP, small sample learning, and so on [57]. Instead of only connecting to the output of the previous layer like a traditional convolutional network, Dense allows each layer in the network to connect to all the previous layers. In this way, the output of each layer is used as input for all subsequent layers, enabling the reuse of features. However, it may overfit due to many parameters. To reduce overfitting, regularization can be added after the fully connected layer, or more complex techniques can be used;
(2) BERT is a model constructed based on embeddings from language models’ bi-directional information extraction and transformer-based feature extraction of the attention mechanism [58] and has been found to have better performance in text processing [56,59]. Only the encoder structure of the transformer was retained, and the parameters of BERT consisted of two parts: the embedding and the transformer blocks. BERT had two primary model sizes with different parameters:
BERTBase: 12 layers, 768 hidden dimensions, 12 self-attention heads, and 110 million total parameters;
BERTLarge: 24 layers, 1024 hidden dimensions, 16 self-attention heads, and 340 million total parameters;
(3) MobileNet network focused on mobile or embedded devices in the lightweight CNN network [60]. Given the extensive dataset and numerous features derived from multimodal data, we referred to the previous study [61] and replaced existing models frequently found in tourism research with MobileNet, as its number of parameters and transport volume were greatly reduced. In Table 2, the overall network architecture of MobileNetV2.0 was presented. The variables n, c, avgpool, and conv2d denoted the number of repeats, output channels, and conventional convolution, respectively. This network consists of a total of 19 layers, with feature extraction occurring in the middle layer and classification occurring in the last layer.

3.3.4. Model Comparison

We investigated the implications of multimodal input compositions by using seven different combinations of data sources to constitute different subsets. From single to mixed inputs, seven combinations were included: (1) metadata only, (2) textual description only, (3) image only, (4) metadata and textual description, (5) metadata and image, (6) textual description and image, and (7) metadata, text, and image. First, we employed the Dense layers for the initial metadata branch. The second branch of textual data was then created using long short-term memory (LSTM) and BERT. We compared the third branch of picture data using MobileNet and CNN.
(1) LSTM is a special type of recurrent neural network (RNN) that performs better than traditional recurrent neural networks in processing and predicting sequence data. LSTM is able to learn long-term dependent information through its unique network structure. With its unique network structure design (e.g., Cell State, Forget Gate, Input Gate, and Output Gate), LSTM addresses the issues of gradient disappearance and gradient explosion of conventional RNNs. With just minor linear interactions running through the whole chain structure, the Cell State is the key to the LSTM. The Forget Gate determines which information should be discarded from Cell State and outputs 0 or 1 for “completely discarded” and “fully retained”, respectively. Its formula is the following:
f t = S W f h t 1 , x t + b f  
where f t is the output of Forget Gate, W f and b f are the weights and bias, S ( ) is the sigmoid function, h t 1 indicates the hidden state of the network at the time step t 1 , and x t refers to the current input. The Input Gate is responsible for updating the Cell State, and it can be expressed as follows:
i t = σ W i h t 1 , x t + b i  
C ~ t = t a n h W C h t 1 , x t + b C
where i t is the output of Input Gate, C ~ t is a newly potential value vector, and W i , W C and b i , b C are the corresponding weights and biases. Finally, which portions of the cell state will be the output is determined via the Output Gate using a sigmoid function. Then, it passes the Cell State through t a n h to a value between −1 and 1 and multiplies it by the output of the sigmoid gate to obtain the final output, like what follows:
o t = σ W o h t 1 , x t + b o
h t = o t × t a n h C t  
where o t is the output of Output Gate, h t is a new hidden state, and W o and b o are the corresponding weight and bias, respectively. LSTM is commonly used in NLP, time-series prediction, audio processing, video analysis, and so on;
(2) CNNs are a type of DL model that are particularly suitable for processing data with grid-like topologies, such as images [62]. Neurons in CNNs are connected to only one local region of input data and the same convolution kernels are applied to all positions of the input data. Then, the network slides on the input data through convolution kernels to carry out a dot product operation, generating a feature map. The convolution operation between an image X R ( u × u ) and a filter F R ( v × v ) can be defined as follows:
X F = C u v + 2 × P a d + 1 s × u v + 2 × P a d + 1 s
C a b = k = 0 u l = 0 u X k l × F a k b l  
here the is a convolution operation, the stride s refers to the number of pixels by which F is sliding over X , and a , b , k , and l are the row and column indices of C and X . Moreover, the Rectified Linear Unit (ReLU) is usually used as the activation function to increase the nonlinearity of the network. Finally, it converts the feature map of the convolution layer into an output.

3.3.5. Model Evaluation

To evaluate the performance from single model to multimodal input, we took the mean absolute percentage error (MAPE), mean square error (MSE), mean absolute error (MAE), root mean square error (RMSE), and the mean arctangent absolute percentage error (MAAPE), which have been frequently used in prior work [11,37,43], as measurements of forecasting errors. Their formulas are as follows:
M S E = 1 n i = 1 n y ^ i y i 2  
R M S E = 1 n i = 1 n ( y ^ i y i ) 2
M A P E = 100 n i = 1 n y ^ i y i y i
M A A P E = tan 1 1 n i = 1 n y ^ i y i y i  
M A E = 1 n i = 1 n y ^ i y i

4. Findings

4.1. Descriptive Analysis

The Appendix A’s Table A1 presents the variables’ descriptive statistics, encompassing the mean, standard deviation, median, and minimum and maximum values. Fifty variables make up the five influencing factors. The host factor has eight variables, the function factor has eleven, the reputation factor has fourteen, the location factor has two, and the miscellaneous factor has fifteen. Typically, accommodates ranged from 1 to 16 with an average of 2.9, bedrooms ranged from 1 to 17 with an average of 1.55, and beds ranged from 1 to 33 with an average of 1.82. These results indicate that the majority of the samples for these variables are located in the low-value region.

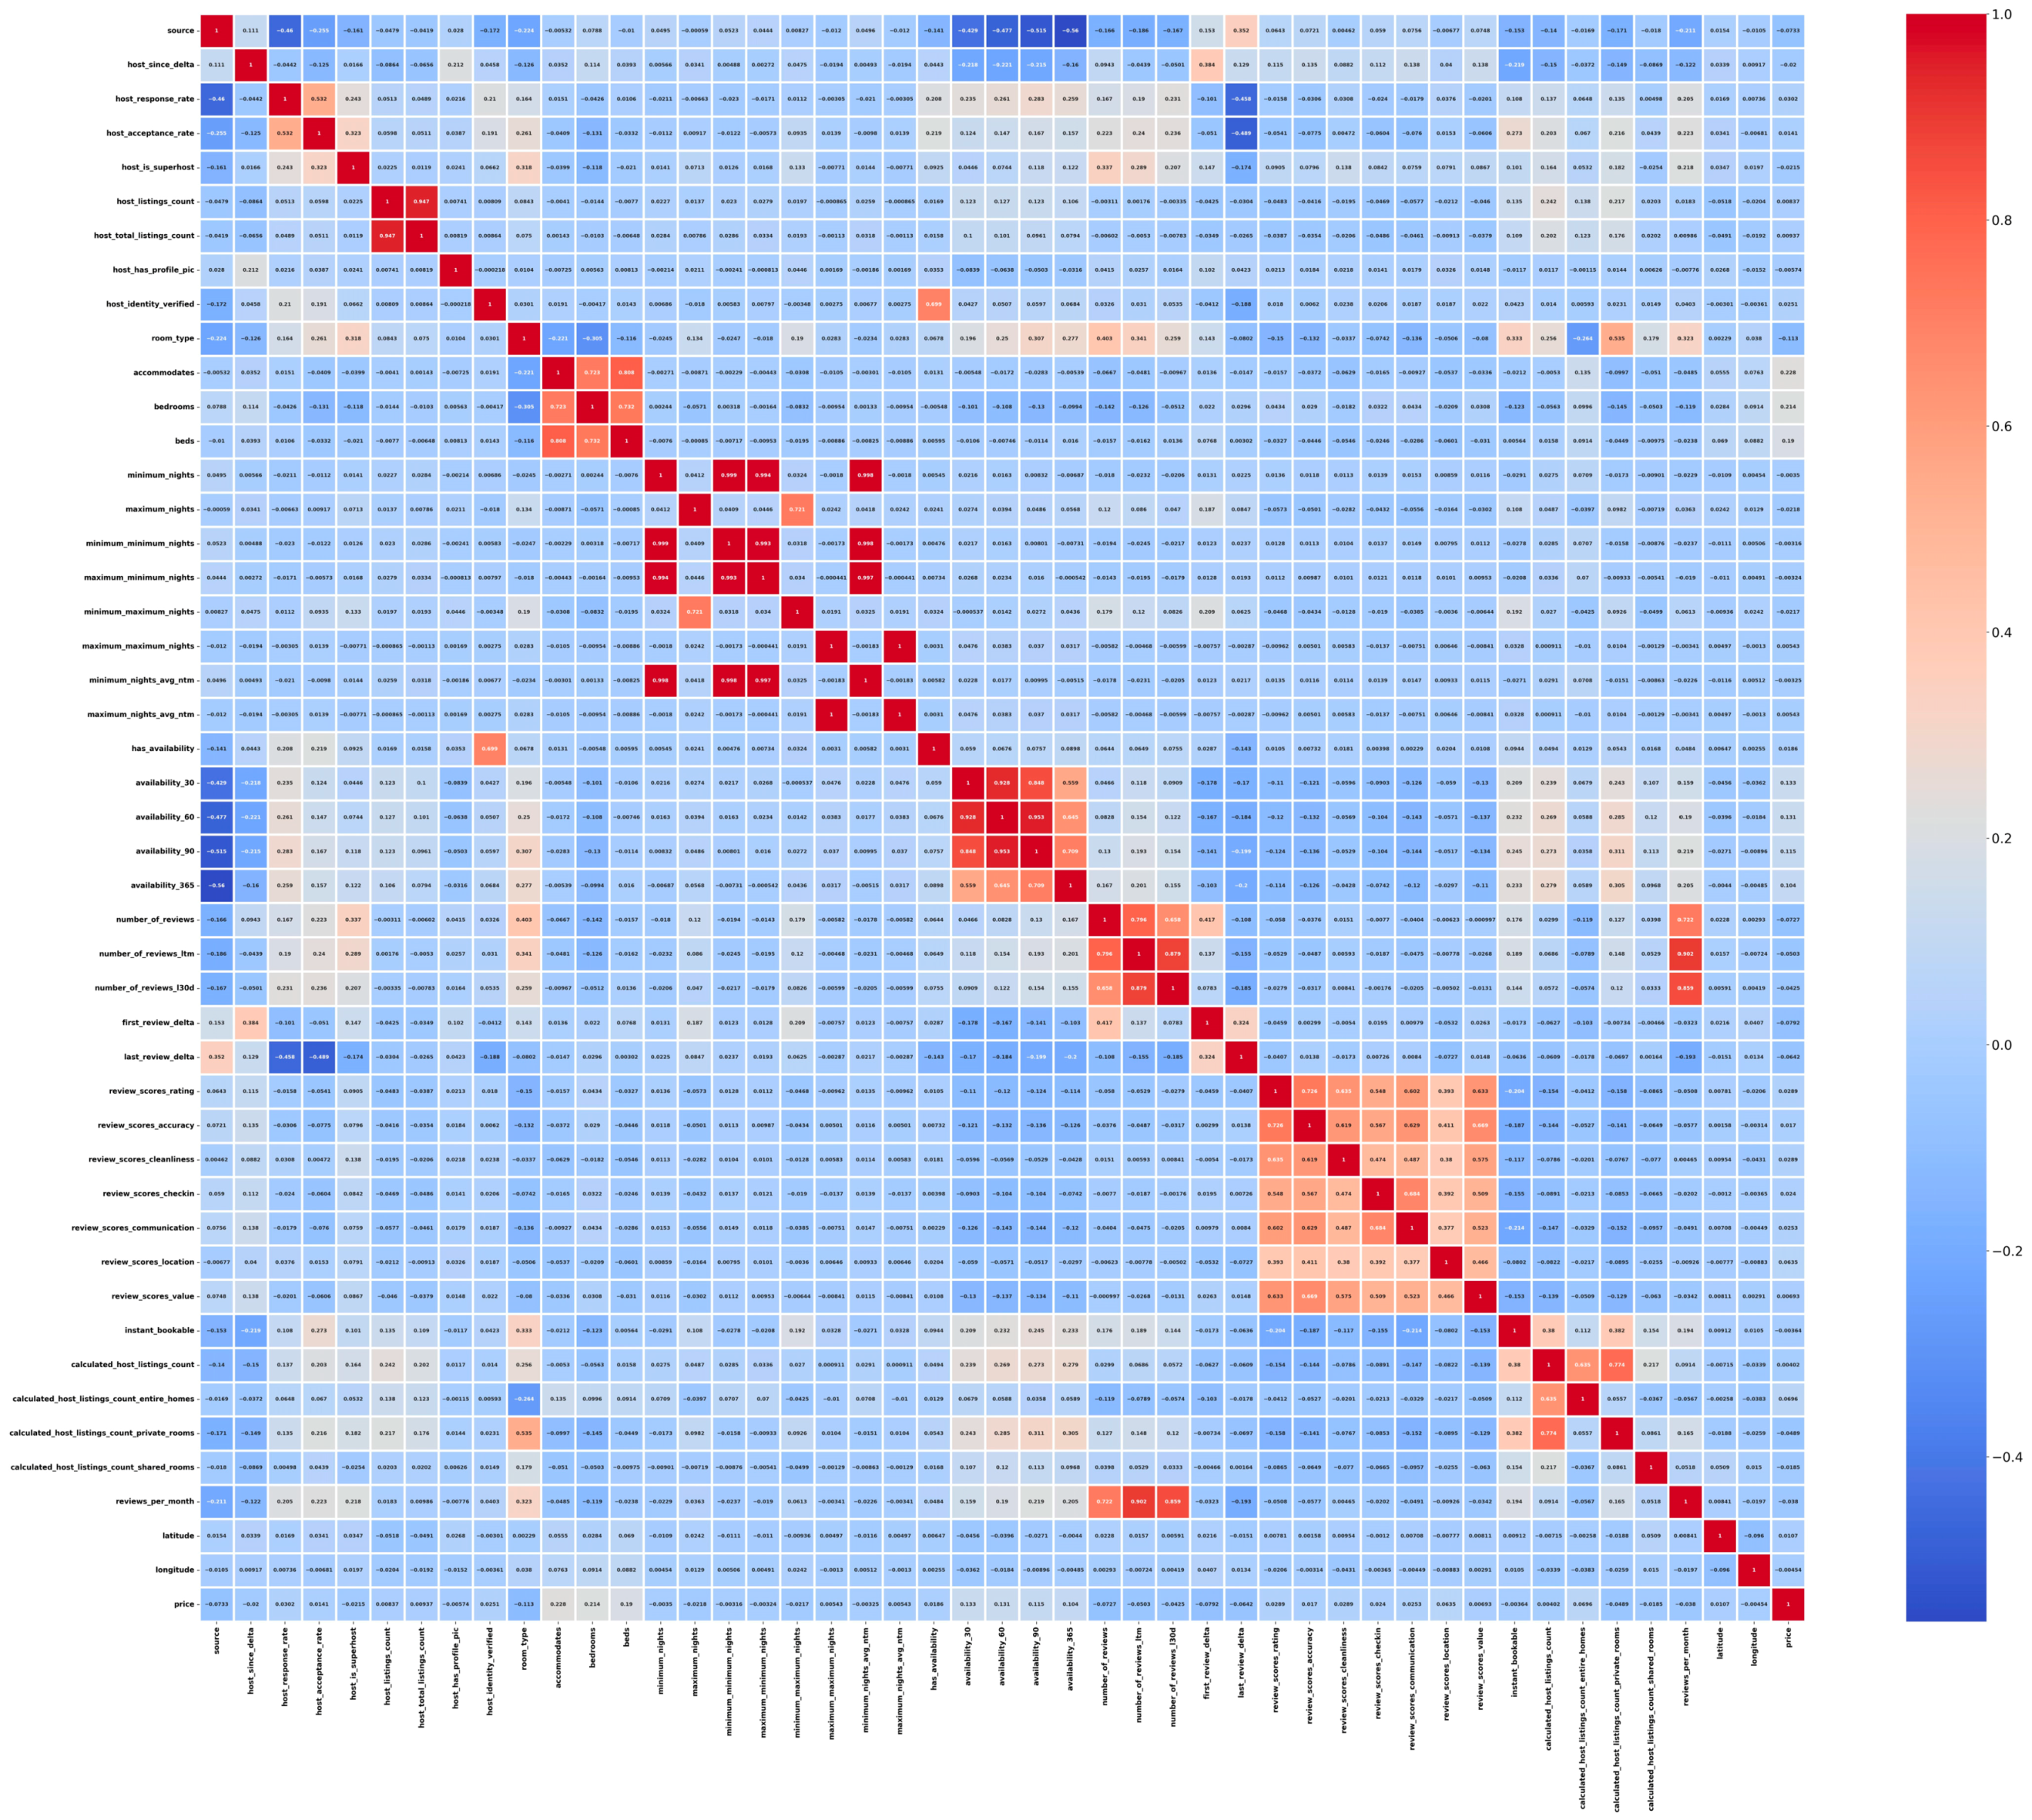
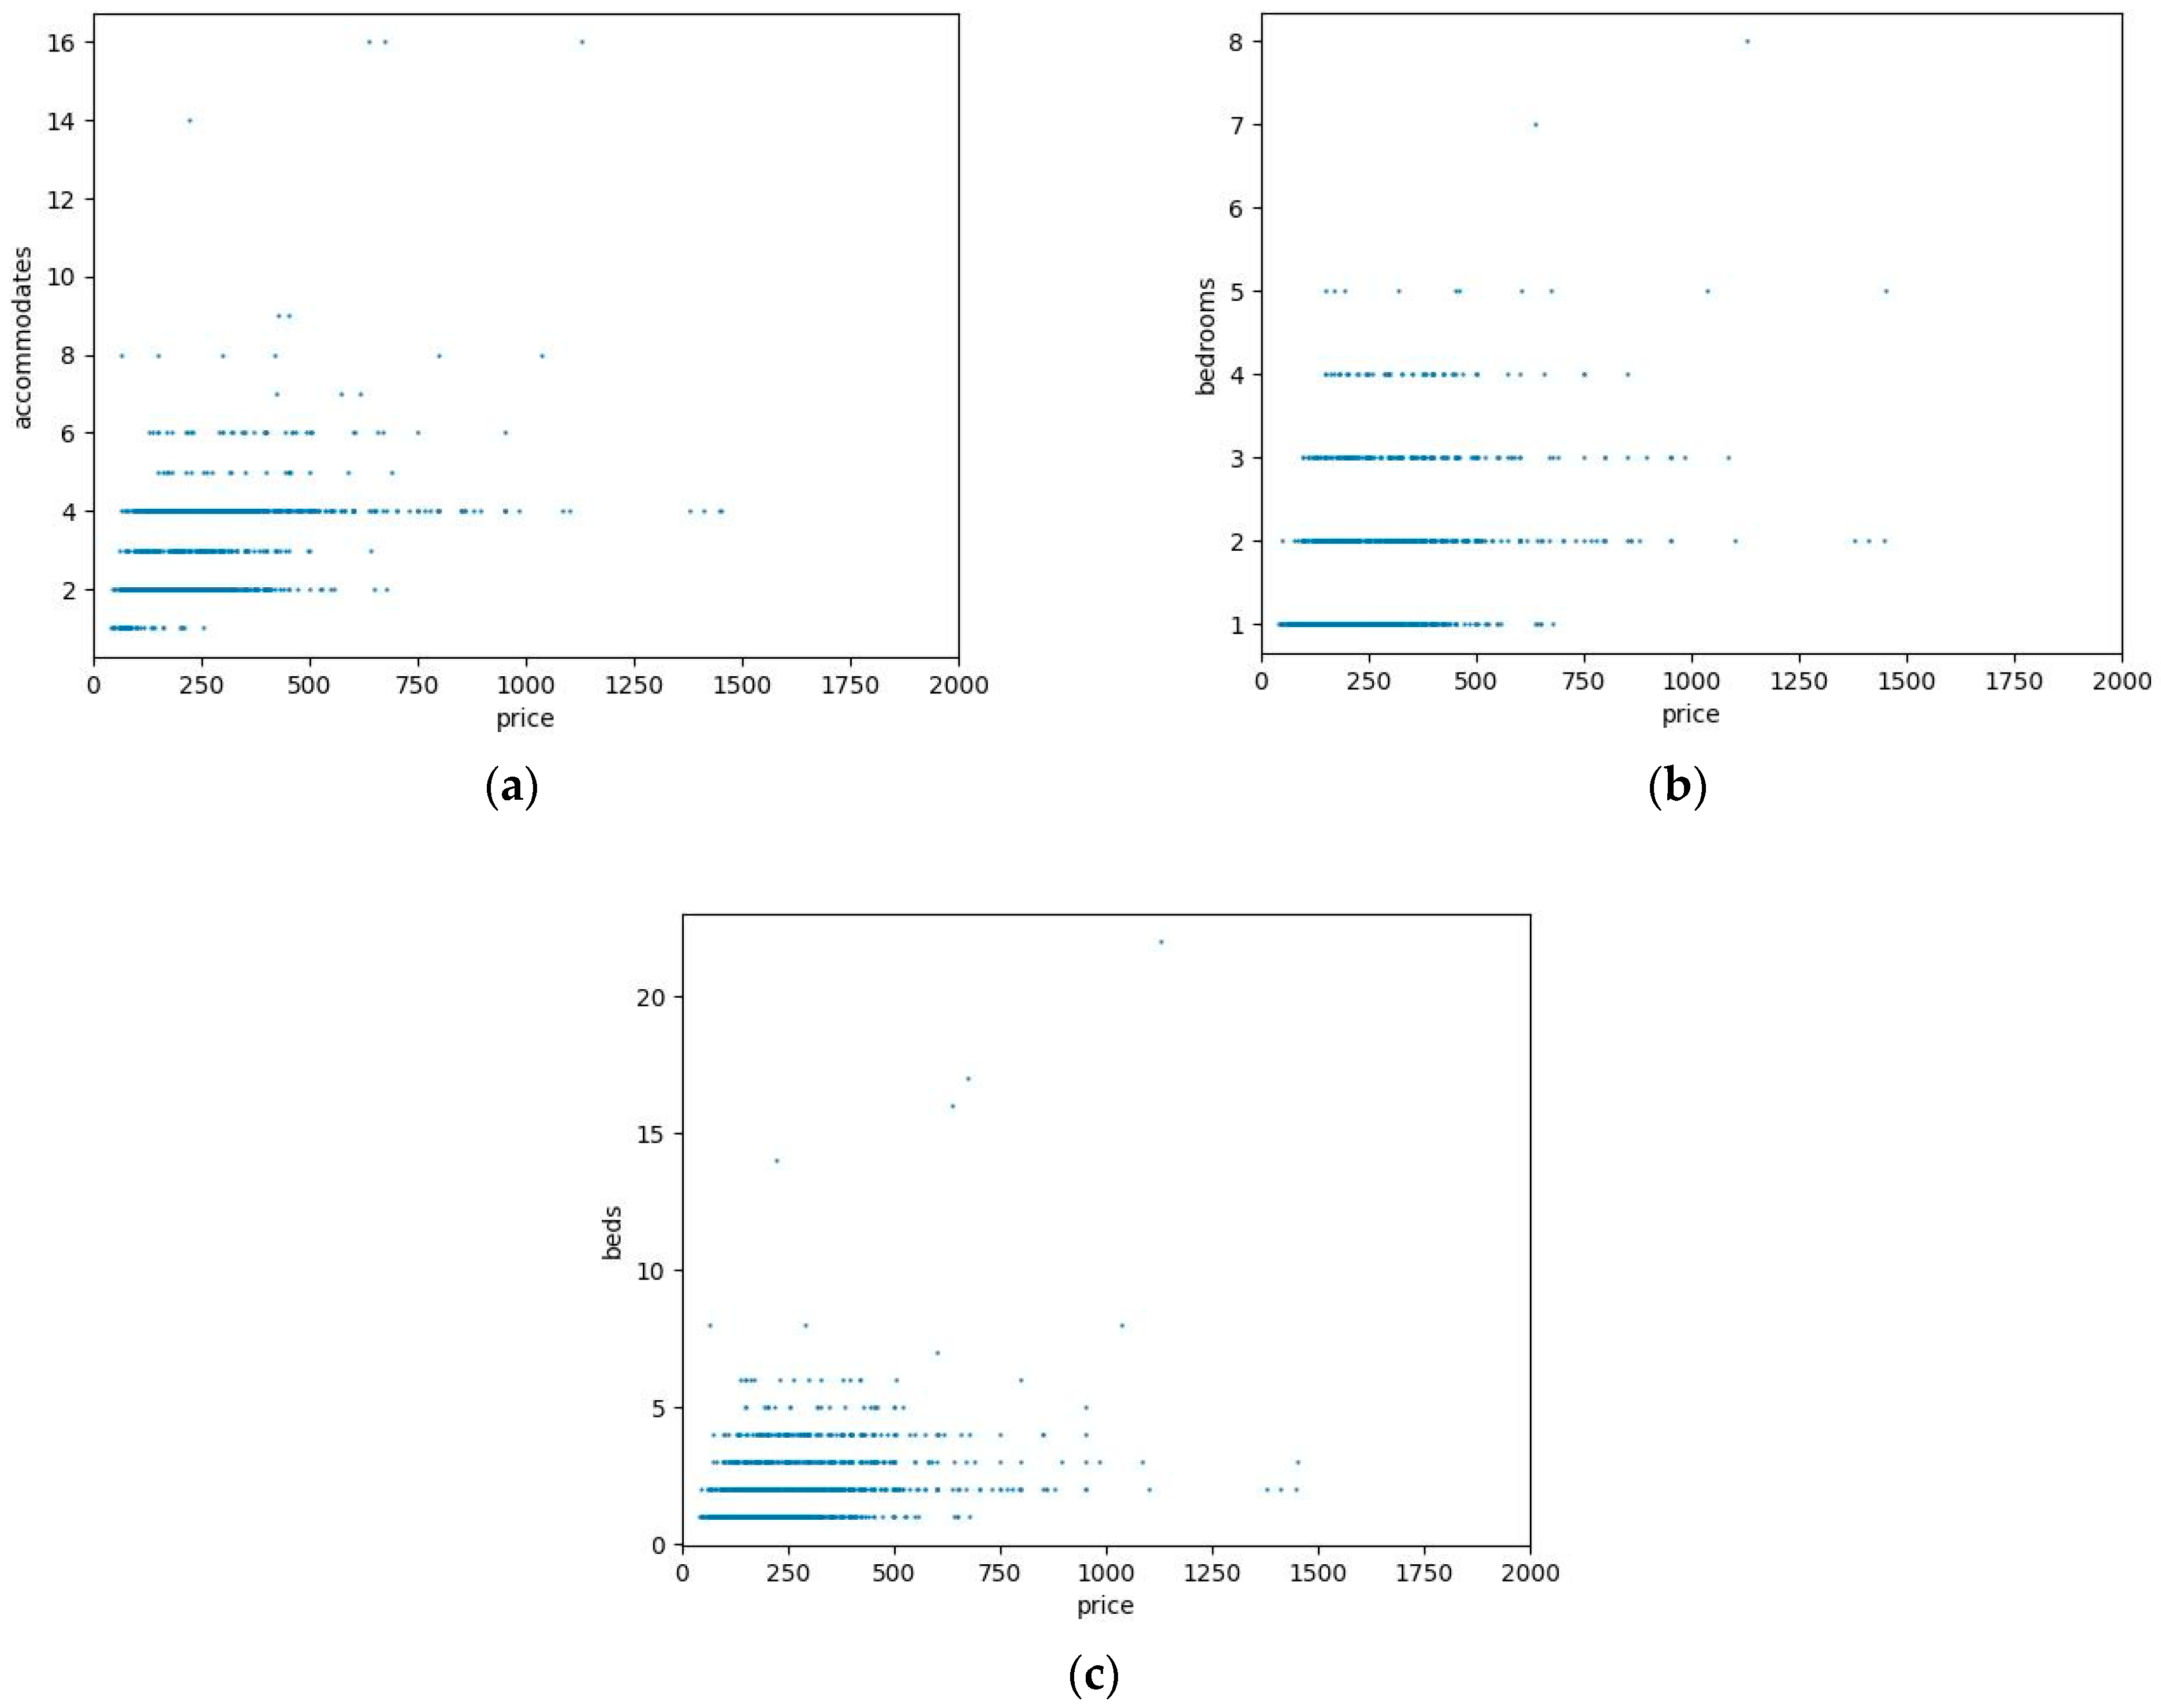
4.2. Feature Correlation Analysis

In our investigation, we employed the Pearson correlation coefficient (PCC) [63] to determine the correlation between the variables in our price prediction model. The degree and direction of the association between two variables can be determined using the PCC. Strong positive correlations are indicated by values close to 1, strong negative correlations by values close to −1, and weak or no associations by values close to 0. As depicted in Figure 3, only accommodates (r = 0.228), bedrooms (r = 0.214), and beds (r = 0.19) show a certain level of correlation with price. Findings echo prior work by Ghosh et al. [53], where the main lines of correlation strength were between 0 and 0.4. In other words, the number of bedrooms, beds, and people it can accommodate determines the rental price. This supports the claims made by earlier researchers that a listing’s beds, bedrooms, and accommodate capacity positively impacted its pricing [11] and that bedrooms and accommodates were far more important features [51]. Conversely, the remaining variables have little to no correlation with price, suggesting that their influence on the forecast is minimal. The weak linear connection indicates how difficult it will be to create an appropriate prediction model using traditional statistical techniques, which is in line with the findings of previous scholars [53]. This limitation highlights the necessity of employing DL technology to identify potential characteristics through neural network or transformer analysis and to determine their relationships.
To analyze further, we used the visual scatter images to investigate the correlation link between the three salient attributes and price, as seen in Figure 4. There was a correlation between price and accommodation, as Figure 4a shows. It is made clear that the observations grouped densely, indicating a strong likelihood of higher pricing—the highest to the peak price of USD 1500+—when the accommodated number ranged from 0 to 6. In contrast, when the accommodation value increased above 6, there were fewer pricing samples and a smaller matching price range, with only a few reaching USD 1000. To sum up, the price spread tended to widen as the number of rooms climbed from 0 to 6, although the corresponding price range was frequently less for accommodations valued between 6 and 16.
Figure 4b illustrates a correlation between price and the type of bedroom. The bedroom types were allocated number values ranging from 0 to 8, which reflected different pricing ranges. When there are fewer than four bedrooms, the spaces are separated broadly. In particular, the price range shows a wide range from USD 100 to 1500, especially when the kind of bedroom is type 2. The highest prices, with a few notable exceptions, are essentially less than USD 1250, even with the growing range of bedroom arrangements. This could mean that different features and amenities were available for the two-bedroom apartment types at different price points.
The pricing and bed type association is shown in Figure 4c; there was a correlation between these two variables. The various bed types were represented by numbers from 0 to 20 and were linked to corresponding pricing points. Prices for the bed ranged from 0 to 10, with most of them falling between USD 100 and 1250. While remaining within reasonable parameters, some prices may be somewhat above this range. This implies that lodgings that offer these kinds of beds charge differently. The pricing values exhibit a notable leftward movement, suggesting that certain lodgings within this range may have had predicted prices ranging from USD 0 to 500.

4.3. Model Performance Analysis

Table 3 showcases the efficacy of applying a mixed combination of neural network models to the training and test data. We used RMSE and MAPE as key evaluation metrics to analyze the error of various formats of sources. It is evident that the Dense module improves the prediction model the most. With Dense included, almost every combination works well, and the RMSEs and the MAPEs are approximately below 0.40 and 5.8%, respectively. The performance remains the same or improves when either text or host-supplied photos are taken into account. This indicates that the metadata used in the Dense module played a key role in the prediction outcome, while textual content and images had weaker effects. Such a result is in line with previous studies [56,61]. Additionally, it can be found that BERT outperformed LSTM, with an approximate 38% decrease in the RMSE when using BERT across the three combinations containing text. One possible explanation could be that BERT was able to extract more successfully than LSTM the linguistic, psychological, and other components that conveyed the property description, thus highlighting significant words in each property description and determining the embedded viewpoints of the hosts. This also alludes to a prior researcher’s prediction study, which suggested that BERT is more adept at identifying the linguistic and psychological components of texts [58].
When combining textual content and host-provided photographs, the RMSE is 0.5447* and the MAPE is 7.8438%*. The asterisk in this case denotes that multiple methods were compared, and the value was chosen based on which performed better or lowest (i.e., the lowest score included in the subset). The findings were not significantly affected by removing any of the components. For example, only the host-supplied images (RMSE: 0.5443*; MAPE: 7.8549%*) and only the written material (RMSE: 0.5436*; MAPE: 7.8991%*) were reached. Consideration of simply written descriptions and photographs as inputs does not capture the benefits of multimodal inputs, as no single composition—texts alone, images alone, or both—produced a result that was statistically significant. According to Ma et al. and Zheng et al. [56,61], the use of scalar regression rather than binary classification likely contributed to this failure. Error value drastically decreased to the lowest level with an RMSE of 0.3991* and an MAPE of 5.5682%* when considering the three sources’ input, metadata, property textual description, and host-supplied photos. We also observed at least an approximate 4.6% decrease in MAPE against any subset. Although the value of RMSE is close between the BERT-CNN set and the BERT-Mobile set, the latter combination showcases a more excellent performance with the lowest MAPE of 5.5682%. Compared to other subsets using CNN or LSTM, the performance improved by 1.2%. By considering the listing information provided by the landlord in multiple dimensions, it is possible to identify the marketing priorities. This supports the idea put forth by earlier researchers that, in order to comprehend business better, provider and consumer models had to be created independently [64]. In summary, the predictive model outperformed in terms of accuracy by determining the relationships between landlords’ sharing and properties’ presentation from three different sources.

5. Discussion

5.1. Theoretical Insights

First, this study is a preliminary attempt to apply multimodal prediction to the field of sharing economy accommodation. Our study supports the previous hypothesis that hybrid techniques using multiple data sources can enhance predictive performance [61,65]. We also echo earlier calls for attention to consider textual descriptions of listings to improve model accuracy [51]. Second, the findings add new knowledge to the existing literature by highlighting the importance of textual content and visual assets in price prediction. Media types can influence people’s understanding of a given subject [56]. We introduced several facets of indicators (i.e., textual description, image data, and metadata provided by hosts) as predictors to attain a broad perspective of the price setting. Third, to respond to the prior scholars who highlighted the methodological defects [11], we adopted multiple DL techniques to improve predictive performance. Fourth, we reviewed the results from earlier research regarding the causal links between influential variables and rental prices. We integrated the previous classification for influential attributes and took more segmented variables in the metadata category. We believe that such integration, bringing more input into the model, contributes to the credibility of the predictive model. Fifth, as far as we know, this study is the first to stand by hosts’ perspectives to consider pricing. Different from previous studies, which applied customers’ textual review to explore price setting [11,66], we integrated various sources (metadata, textual description, and images) which are all provided by hosts, truly reflecting the hosts’ marketing intention.

5.2. Managerial Implications

Practically speaking, the findings of our study have significant ramifications for customers, hosts, and platform management. First, this study suggests that, in order to make a new listing more helpful, a host should submit a unique room photo and use descriptive language. This valuable information should not be neglected in practice given its predictive power as compared to other subsets. Second, using our methodology, customers can estimate if a rental price is charged near to the predicted value. If a listing meeting one’s expectation about the upcoming lodging and services turns out to be affordable, then the tenant is very likely to be satisfied, thus mitigating purchase risks as well as boosting the host’s reputation. On the contrary, accurate price prediction may also assist customers in identifying listings with arbitrary pricing. Third, platform managers can assist hosts in guiding their price settings in a timely and accurate manner by deploying the predictive model on the website and granting access to the hosts. Until now, Airbnb has made certain efforts in an attempt to assist hosts in determining the “right” price in the market. For example, Airbnb provides hosts with more than just recommendations for determining the starting pricing [41], but also uses the business’s new pricing algorithm capabilities to offer price recommendations for hosts [26,39,67]. We thus urge room-sharing sites to further investigate our results pertaining to the coupling of various neural network models and multi-modal input sources to make the suggested price more reasonable. By so doing, they can sustainably manage the sharing market.

6. Conclusions and Future Directions

Because of the popularity of online accommodation booking systems, the prediction of listing prices on peer-to-peer accommodations has become crucial. The effects and interactions between texts and images of Airbnb have been discussed in prior research [68,69], which indicates that it is feasible to import these factors into indicators of Airbnb’s price estimation. This study used three categories of data that make up the multimodal input, i.e., influential metadata, texts, and images, to predict a static time point listing price on Airbnb on the basis of multiple DL approaches. Results indicate that our model outperforms other models with simple or fewer inputs, reaching a minimum MAPE of 5.5682% and an approximate 4.6% decrease against any subset. The findings reveal that using multimodal input and DL technologies is a promising approach to forecasting accommodation listing prices. Our study offers a thorough comprehension of the factors that influence prices in this novel price prediction model.
The current work presents several innovative insights. First, in the realm of sharing economy accommodations, our study takes the initiative to use multimodal input from online reservation information. Second, we present a DL method based on BERT and MobileNet in the sharing economy accommodation field. Our goal is to predict accommodation listing prices by applying a separate neural network to illustrate each branch’s distinctiveness and concatenate them into the final prediction. Third, apart from influential metadata, we also take property text descriptions and host-provided photos into consideration. Our predictive model responds to the host-decisive price mechanism [11], reflecting the hosts’ intention to conduct marketing appropriately.
Nevertheless, we acknowledge certain limitations of this study which illuminate avenues for future work. First, our data were excavated from Airbnb only, but samples from other online accommodation sources should be used to confirm the generalizability of the findings. Forecasting algorithms can produce more insightful data for accommodation management and decision-making when they have access to more specific data. Second, the listing price used in this study was gathered from a snapshot of time that does not consider the dynamic price changes. Predicting prices over time to present dynamic changes could be another avenue for future research to assess how well the proposed architecture for lodging price forecasting performs. Third, this study focuses on using DL techniques and multimodal input models to predict rental prices on Airbnb; however, more advanced models and methods such as fine-tuning and model integration are not currently considered in the prediction framework. For instance, utilizing more current transformer models (such as Longformer [70]) with a 4096 token maximum as opposed to 512 should be investigated further to achieve higher accuracy. Fourth, because factors influencing prices vary across regions [41], the predictive method should be examined in different cities to ensure the efficacy of the model. Exogenous variables such as weather, seasonality, and scheduled events can also be incorporated when considering time series to enhance forecasting. Lastly, this study aims to predict listing prices from the perspective of marketers, focusing on the effect of attributes of listings and hosts on prices. It does not adequately consider the effect of user needs and preferences. Users’ comments and user-generated photos for listings may reflect a subliminal effect, which could impact the rental price. Future studies can be strengthened in this direction.

Author Contributions

Conceptualization, H.T.; methodology, T.S.; software, H.T.; validation, T.S.; formal analysis, X.W. and P.C.; investigation, X.W.; resources, T.S.; data curation, T.S. and H.T.; writing—original draft preparation, H.T.; visualization, H.T. and T.S.; writing—review and editing: P.C. and X.W.; supervision, T.Z.; project administration, T.Z.; funding acquisition, H.T., T.S. and T.Z. All authors have read and agreed to the published version of the manuscript.

Funding

This research was funded by the National Innovation and Entrepreneurship Training Program for Undergraduate (Grant Nos. 202410559009 and 202410559138X) and the Jinan University Shenzhen Campus Funding Program (Grant No. JNSZQH2302).

Institutional Review Board Statement

Not applicable.

Informed Consent Statement

Not applicable.

Data Availability Statement

In this study, the website http://insideairbnb.com (accessed on 5 April 2024) offers the data that can be found to support this research.

Conflicts of Interest

The authors declare no conflicts of interest.

Appendix A

Table A1. Statistical analysis of the influential metadata.
FactorVariableMeanS.D.25%50%75%MinMax
Host factorshost_is_superhost0.200.4000001
host_has_profile0.990.1111101
host_identity_verified0.970.1711101
host_since_delta2770.421082.1122172988.50356315456
host_response_rate0.690.4401101
host_acceptance_rate0.660.380.390.83101
host_total_listings_count6.2257.6311311555
host_listings_count3.4926.561111672
Function factorsaccommodates2.901.33224116
room_type0.450.8400003
entire home/apartment1.101.70111016
private room0.661.99000021
shared room0.030.3800008
bedrooms1.550.89112117
beds1.821.44112133
calculated_host_listings_count1.832.86111127
calculated_host_listings_count_entire_homes1.101.70111016
calculated_host_listings_count_private_rooms0.661.99000021
calculated_host_listings_count_shared_rooms0.030.3800008
Reputation factorsnumber_of_reviews45.44107.353103603199
reviews_per_month1.182.140.30.681.180.01120.11
review_scores_rating4.830.264.794.88505
review_scores_accuracy4.850.234.814.9515
review_scores_cleanliness4.770.314.74.83515
review_scores_check-in4.880.224.874.94515
review_scores_communication4.900.214.904.97515
review_scores_location4.790.254.714.83515
review_scores_value4.640.314.534.674.8115
number_of_reviews_ltm10.8530.8203801689
number_of_reviews_l30d1.002.590010150
first_review_delta1224.501157.43160767.502170.75−15269
last_review_delta218.04440.71631156−13666
reviews_per_month1.182.140.300.681.180.01120.11
Location factorslatitude52.370.0252.3652.3752.3852.2952.43
longitude4.890.044.874.894.914.765.03
miscellaneous factorsminimum_nights5.0534.7123411001
maximum_nights392.11468.422060112511125
minimum_minimum_nights4.8834.7122311001
maximum_minimum_nights5.5034.9023411001
minimum_maximum_nights500.62504.7221365112511125
maximum_maximum_nights516.42505.8827365112511125
minimum_nights_avg_ntm5.1334.7823411001
maximum_nights_avg_ntm511.90503.9427365112511125
instant_bookable0.180.3900001
has_availability0.960.1911101
availability_304.327.35005030
availability_609.8515.380213060
availability_9017.3025.340328090
availability_36582.83113.570181420365
source0.380.4800101

References

  1. Baute-Díaz, N.; Gutiérrez-Taño, D.; Díaz-Armas, R.J. What Drives Guests to Misreport Their Experiences on Airbnb? A Structural Equation Modelling Approach. Curr. Issues Tour. 2022, 25, 3443–3460. [Google Scholar] [CrossRef]
  2. Ert, E.; Fleischer, A.; Magen, N. Trust and Reputation in the Sharing Economy: The Role of Personal Photos in Airbnb. Tour. Manag. 2016, 55, 62–73. [Google Scholar] [CrossRef]
  3. Zervas, G. The Rise of the Sharing Economy: Estimating the Impact of Airbnb on the Hotel Industry. J. Mark. Res. 2017, 54, 687–705. [Google Scholar] [CrossRef]
  4. So, K.K.F.; Oh, H.; Min, S. Motivations and Constraints of Airbnb Consumers: Findings from a Mixed-Methods Approach. Tour. Manag. 2018, 67, 224–236. [Google Scholar] [CrossRef]
  5. Toader, V.; Negrușa, A.L.; Bode, O.R.; Rus, R.V. Analysis of Price Determinants in the Case of Airbnb Listings. Econ. Res.-Ekon. Istraživanja 2022, 35, 2493–2509. [Google Scholar] [CrossRef]
  6. Guttentag, D.A.; Litvin, S.W.; Smith, W.W. To Airbnb or Not to Airbnb: Does Airbnb Feel Safer than Hotels during a Pandemic? Int. J. Hosp. Manag. 2023, 114, 103550. [Google Scholar] [CrossRef]
  7. Wang, D.; Nicolau, J.L. Price Determinants of Sharing Economy Based Accommodation Rental: A Study of Listings from 33 Cities on Airbnb.Com. Int. J. Hosp. Manag. 2017, 62, 120–131. [Google Scholar] [CrossRef]
  8. Zhao, C.; Wu, Y.; Chen, Y.; Chen, G. Multiscale Effects of Hedonic Attributes on Airbnb Listing Prices Based on MGWR: A Case Study of Beijing, China. Sustainability 2023, 15, 1703. [Google Scholar] [CrossRef]
  9. Hung, W.-T.; Shang, J.-K.; Wang, F.-C. Pricing Determinants in the Hotel Industry: Quantile Regression Analysis. Int. J. Hosp. Manag. 2010, 29, 378–384. [Google Scholar] [CrossRef]
  10. Sánchez-Franco, M.J.; Troyano, J.A.; Alonso-Dos-Santos, M. Fuzzy Metatopics Predicting Prices of Airbnb Accommodations. J. Intell. Fuzzy Syst. 2021, 40, 1879–1891. [Google Scholar] [CrossRef]
  11. Alharbi, Z.H. A Sustainable Price Prediction Model for Airbnb Listings Using Machine Learning and Sentiment Analysis. Sustainability 2023, 15, 13159. [Google Scholar] [CrossRef]
  12. Kalehbasti, P.R.; Nikolenko, L.; Rezaei, H. Airbnb Price Prediction Using Machine Learning and Sentiment Analysis. In International Cross-Domain Conference for Machine Learning and Knowledge Extraction; Springer International Publishing: Cham, Switzerland, 2021; Volume 12844, pp. 173–184. [Google Scholar]
  13. Cai, Y.; Zhou, Y.; Ma, J.; Scott, N. Price Determinants of Airbnb Listings: Evidence from Hong Kong. Tour. Anal. 2019, 24, 227–242. [Google Scholar] [CrossRef]
  14. Chang, C.; Li, S. Study of Price Determinants of Sharing Economy-Based Accommodation Services: Evidence from Airbnb.Com. J. Theor. Appl. Electron. Commer. Res. 2020, 16, 584–601. [Google Scholar] [CrossRef]
  15. Teubner, T.; Hawlitschek, F.; Dann, D. Price Determinants on Airbnb: How Reputation Pays Off in the Sharing Economy. J. Self-Gov. Manag. Econ. 2017, 5, 53–80. [Google Scholar] [CrossRef]
  16. Kanakaris, N.; Karacapilidis, N. Predicting Prices of Airbnb Listings via Graph Neural Networks and Document Embeddings: The Case of the Island of Santorini. Procedia Comput. Sci. 2023, 219, 705–712. [Google Scholar] [CrossRef]
  17. Bi, J.-W.; Han, T.-Y.; Yao, Y.; Yang, T. Tourism Demand Forecasting under Conceptual Drift during COVID-19: An Ensemble Deep Learning Model. Curr. Issues Tour. 2023, 1–20. [Google Scholar] [CrossRef]
  18. Chen, J.; Li, C.; Huang, L.; Zheng, W. Tourism Demand Forecasting: A Deep Learning Model Based on Spatial-Temporal Transformer. Tour. Rev. 2023; in press. [Google Scholar]
  19. Priambodo, F.; Sihabuddin, A. An Extreme Learning Machine Model Approach on Airbnb Base Price Prediction. Int. J. Adv. Comput. Sci. Appl. 2020, 11, 179–185. [Google Scholar] [CrossRef]
  20. Zhang, H.; Zach, F.J.; Xiang, Z. Multi-Level Differentiation of Short-Term Rental Properties: A Deep Learning-Based Analysis of Aesthetic Design. Tour. Manag. 2024, 100, 104832. [Google Scholar] [CrossRef]
  21. Yang, S.-B. In Airbnb We Trust_ Understanding Consumers’ Trust-Attachment Building Mechanisms in the Sharing Economy. Int. J. Hosp. Manag. 2019, 83, 198–209. [Google Scholar] [CrossRef]
  22. Tong, B.; Gunter, U. Hedonic Pricing and the Sharing Economy: How Profile Characteristics Affect Airbnb Accommodation Prices in Barcelona, Madrid, and Seville. Curr. Issues Tour. 2022, 25, 3309–3328. [Google Scholar] [CrossRef]
  23. Birinci, H.; Berezina, K.; Cobanoglu, C. Comparing Customer Perceptions of Hotel and Peer-to-Peer Accommodation Advantages and Disadvantages. Int. J. Contemp. Hosp. Manag. 2018, 30, 1190–1210. [Google Scholar] [CrossRef]
  24. Nieuwland, S.; Van Melik, R. Regulating Airbnb: How Cities Deal with Perceived Negative Externalities of Short-Term Rentals. Curr. Issues Tour. 2020, 23, 811–825. [Google Scholar] [CrossRef]
  25. Perez-Sanchez, V.; Serrano-Estrada, L.; Marti, P.; Mora-Garcia, R.-T. The What, Where, and Why of Airbnb Price Determinants. Sustainability 2018, 10, 4596. [Google Scholar] [CrossRef]
  26. Gibbs, C.; Guttentag, D.; Gretzel, U.; Yao, L.; Morton, J. Use of Dynamic Pricing Strategies by Airbnb Hosts. Int. J. Contemp. Hosp. Manag. 2018, 30, 2–20. [Google Scholar] [CrossRef]
  27. Zhang, T.C.; Jahromi, M.F.; Kizildag, M. Value Co-Creation in a Sharing Economy: The End of Price Wars? Int. J. Hosp. Manag. 2018, 71, 51–58. [Google Scholar] [CrossRef]
  28. Cheng, M. Sharing Economy: A Review and Agenda for Future Research. Int. J. Hosp. Manag. 2016, 57, 60–70. [Google Scholar] [CrossRef]
  29. Fang, Z.; Huang, L.; Wierman, A. Prices and Subsidies in the Sharing Economy. In Proceedings of the 26th International Conference on World Wide Web, Perth, Australia, 3 April 2017; International World Wide Web Conferences Steering Committee: Perth, Australia, 2017; pp. 53–62. [Google Scholar]
  30. Suciu, A.M. The Impact of Airbnb on Local Labour Markets in the Hotel Industry in Germany. SSRN J. 2016, 2874861. [Google Scholar] [CrossRef]
  31. Nakamura, S.; Baskaran, A.; Selvarajan, S.K. Impact of Airbnb on the Hotel Industry in Japan. J. Destin. Mark. Manag. 2024, 31, 100841. [Google Scholar] [CrossRef]
  32. Gyódi, K.; Nawaro, Ł. Determinants of Airbnb Prices in European Cities: A Spatial Econometrics Approach. Tour. Manag. 2021, 86, 104319. [Google Scholar] [CrossRef]
  33. Lampinen, A.; Cheshire, C. Hosting via Airbnb: Motivations and Financial Assurances in Monetized Network Hospitality. In Proceedings of the 2016 CHI Conference on Human Factors in Computing Systems, San Jose, CA, USA, 7 May 2016; ACM: San Jose, CA, USA, 2016; pp. 1669–1680. [Google Scholar]
  34. Zhang, Z.; Chen, R.; Han, L.; Yang, L. Key Factors Affecting the Price of Airbnb Listings: A Geographically Weighted Approach. Sustainability 2017, 9, 1635. [Google Scholar] [CrossRef]
  35. Chen, Y.; Xie, K. Consumer Valuation of Airbnb Listings: A Hedonic Pricing Approach. Int. J. Contemp. Hosp. Manag. 2017, 29, 2405–2424. [Google Scholar] [CrossRef]
  36. Wang, R.; Rasouli, S. Contribution of Streetscape Features to the Hedonic Pricing Model Using Geographically Weighted Regression: Evidence from Amsterdam. Tour. Manag. 2022, 91, 104523. [Google Scholar] [CrossRef]
  37. Tang, J.; Cheng, J.; Zhang, M. Forecasting Airbnb Prices through Machine Learning. Manag. Decis. Econ. 2024, 45, 148–160. [Google Scholar] [CrossRef]
  38. Hong, I.; Yoo, C. Analyzing Spatial Variance of Airbnb Pricing Determinants Using Multiscale GWR Approach. Sustainability 2020, 12, 4710. [Google Scholar] [CrossRef]
  39. Gibbs, C.; Guttentag, D.; Gretzel, U.; Morton, J.; Goodwill, A. Pricing in the Sharing Economy: A Hedonic Pricing Model Applied to Airbnb Listings. J. Travel Tour. Mark. 2018, 35, 46–56. [Google Scholar] [CrossRef]
  40. Voltes-Dorta, A.; Sánchez-Medina, A. Drivers of Airbnb Prices According to Property/Room Type, Season and Location: A Regression Approach. J. Hosp. Tour. Manag. 2020, 45, 266–275. [Google Scholar] [CrossRef]
  41. Kwok, L.; Xie, K.L. Pricing Strategies on Airbnb: Are Multi-Unit Hosts Revenue Pros? Int. J. Hosp. Manag. 2019, 82, 252–259. [Google Scholar] [CrossRef]
  42. Hunold, M.; Kesler, R.; Laitenberger, U.; Schlütter, F. Evaluation of Best Price Clauses in Online Hotel Bookings. Int. J. Ind. Organ. 2018, 61, 542–571. [Google Scholar] [CrossRef]
  43. Al Shehhi, M.; Karathanasopoulos, A. Forecasting Hotel Room Prices in Selected GCC Cities Using Deep Learning. J. Hosp. Tour. Manag. 2020, 42, 40–50. [Google Scholar] [CrossRef]
  44. Mohammed, I.; Guillet, B.D.; Law, R.; Rahaman, W.A. Predicting the Direction of Dynamic Price Adjustment in the Hong Kong Hotel Industry. Tour. Econ. 2021, 27, 346–364. [Google Scholar] [CrossRef]
  45. Abrate, G.; Sainaghi, R.; Mauri, A.G. Dynamic Pricing in Airbnb: Individual versus Professional Hosts. J. Bus. Res. 2022, 141, 191–199. [Google Scholar] [CrossRef]
  46. Gunter, U.; Önder, I. Determinants of Airbnb Demand in Vienna and Their Implications for the Traditional Accommodation Industry. Tour. Econ. 2018, 24, 270–293. [Google Scholar] [CrossRef]
  47. Benítez-Aurioles, B. Why Are Flexible Booking Policies Priced Negatively? Tour. Manag. 2018, 67, 312–325. [Google Scholar] [CrossRef]
  48. Shapoval, V.; Wang, M.C.; Hara, T.; Shioya, H. Data Mining in Tourism Data Analysis: Inbound Visitors to Japan. J. Travel Res. 2018, 57, 310–323. [Google Scholar] [CrossRef]
  49. Lee, C. Predicting land prices and measuring uncertainty by combining supervised and unsupervised learning. Int. J. Strateg. Prop. Manag. 2021, 25, 169–178. [Google Scholar] [CrossRef]
  50. Binesh, F.; Belarmino, A.M.; van der Rest, J.P.; Singh, A.K.; Raab, C. Forecasting Hotel Room Prices When Entering Turbulent Times: A Game-Theoretic Artificial Neural Network Model. Int. J. Contemp. Hosp. Manag. 2023; in press. [Google Scholar]
  51. Islam, M.D.; Li, B.; Islam, K.S.; Ahasan, R.; Mia, M.R.; Haque, M.E. Airbnb Rental Price Modeling Based on Latent Dirichlet Allocation and MESF-XGBoost Composite Model. Mach. Learn. Appl. 2022, 7, 100208. [Google Scholar] [CrossRef]
  52. Zhu, A.; Li, R.; Xie, Z. Machine Learning Prediction of New York Airbnb Prices. In Proceedings of the 2020 Third International Conference on Artificial Intelligence for Industries (AI4I), Irvine, CA, USA, 21–23 September 2020; IEEE: Irvine, CA, USA, 2020; pp. 1–5. [Google Scholar]
  53. Ghosh, I.; Sanyal, M.K.; Pamucar, D. Modelling Predictability of Airbnb Rental Prices in Post COVID-19 Regime: An Integrated Framework of Transfer Learning, PSO-Based Ensemble Machine Learning and Explainable AI. Int. J. Info. Technol. Dec. Mak. 2023, 22, 917–955. [Google Scholar] [CrossRef]
  54. Sengupta, P.; Biswas, B.; Kumar, A.; Shankar, R.; Gupta, S. Examining the Predictors of Successful Airbnb Bookings with Hurdle Models: Evidence from Europe, Australia, USA and Asia-Pacific Cities. J. Bus. Res. 2021, 137, 538–554. [Google Scholar] [CrossRef]
  55. Hong, W.; Thong, J.Y.L.; Tam, K.Y. Designing Product Listing Pages on E-Commerce Websites: An Examination of Presentation Mode and Information Format. Int. J. Hum.-Comput. Stud. 2004, 61, 481–503. [Google Scholar] [CrossRef]
  56. Ma, Y.; Xiang, Z.; Du, Q.; Fan, W. Effects of User-Provided Photos on Hotel Review Helpfulness: An Analytical Approach with Deep Leaning. Int. J. Hosp. Manag. 2018, 71, 120–131. [Google Scholar] [CrossRef]
  57. Huang, G.; Liu, Z.; Van Der Maaten, L.; Weinberger, K.Q. Densely Connected Convolutional Networks. In Proceedings of the 2017 IEEE Conference on Computer Vision and Pattern Recognition (CVPR), Honolulu, HI, USA, 21–26 July 2017; IEEE: Honolulu, HI, USA, 2017; pp. 2261–2269. [Google Scholar]
  58. Xu, H.; Liu, B.; Shu, L.; Yu, P.S. BERT Post-Training for Review Reading Comprehension and Aspect-Based Sentiment Analysis. arXiv 2019, arXiv:1904.02232. [Google Scholar]
  59. Xu, S.; Barbosa, S.E.; Hong, D. BERT Feature Based Model for Predicting the Helpfulness Scores of Online Customers Reviews. In Advances in Information and Communication; Arai, K., Kapoor, S., Bhatia, R., Eds.; Advances in Intelligent Systems and Computing; Springer International Publishing: Cham, Switzerland, 2020; Volume 1130, pp. 270–281. ISBN 978-3-030-39441-7. [Google Scholar]
  60. Qin, Z.; Zhang, Z.; Chen, X.; Peng, Y. FD-MobileNet: Improved MobileNet with a Fast Downsampling Strategy. In Proceedings of the 2018 25th IEEE International Conference on Image Processing (ICIP), Athens, Greece, 11 February 2018; pp. 1363–1367. [Google Scholar]
  61. Zheng, T.; Lin, Z.; Zhang, Y.; Jiao, Q.; Su, T.; Tan, H.; Fan, Z.; Xu, D.; Law, R. Revisiting Review Helpfulness Prediction: An Advanced Deep Learning Model with Multimodal Input from Yelp. Int. J. Hosp. Manag. 2023, 114, 103579. [Google Scholar] [CrossRef]
  62. Lee, S.; Kim, H.; Lieu, Q.X.; Lee, J. CNN-Based Image Recognition for Topology Optimization. Knowl.-Based Syst. 2020, 198, 105887. [Google Scholar] [CrossRef]
  63. Adler, J.; Parmryd, I. Quantifying Colocalization by Correlation: The Pearson Correlation Coefficient Is Superior to the Mander’s Overlap Coefficient. Cytom. Part A 2010, 77A, 733–742. [Google Scholar] [CrossRef] [PubMed]
  64. Sung, E.; Kim, H.; Lee, D. Why Do People Consume and Provide Sharing Economy Accommodation?—A Sustainability Perspective. Sustainability 2018, 10, 2072. [Google Scholar] [CrossRef]
  65. Kwon, W.; Lee, M.; Back, K.-J.; Lee, K.Y. Assessing Restaurant Review Helpfulness through Big Data: Dual-Process and Social Influence Theory. J. Hosp. Tour. Technol. 2021, 12, 177–195. [Google Scholar] [CrossRef]
  66. Lawani, A.; Reed, M.R.; Mark, T.; Zheng, Y. Reviews and Price on Online Platforms: Evidence from Sentiment Analysis of Airbnb Reviews in Boston. Reg. Sci. Urban Econ. 2019, 75, 22–34. [Google Scholar] [CrossRef]
  67. Jiang, Y.; Zhang, H.; Cao, X.; Wei, G.; Yang, Y. How to Better Incorporate Geographic Variation in Airbnb Price Modeling? Tour. Econ. 2023, 29, 1181–1203. [Google Scholar] [CrossRef]
  68. Chi, M.; Pan, M.; Huang, R. Examining the Direct and Interaction Effects of Picture Color Cues and Textual Cues Related to Color on Accommodation-Sharing Platform Rental Purchase. Int. J. Hosp. Manag. 2021, 99, 103066. [Google Scholar] [CrossRef]
  69. Chi Maomao, P.M. Impacts of Cue Consistency on Shared Accommodation Bookings: Interaction Between Texts and Images. Data Anal. Knowl. Discov. 2020, 4, 74–83. [Google Scholar] [CrossRef]
  70. Beltagy, I.; Peters, M.E.; Cohan, A. Longformer: The Long-Document Transformer. arXiv 2020, arXiv:2004.05150. [Google Scholar] [CrossRef]
Figure 1. Architecture of the predictive model.
Sustainability 16 06384 g001
Figure 2. An example of room picture and text description.
Sustainability 16 06384 g002
Figure 3. The heat map of correlation coefficients.
Sustainability 16 06384 g003
Figure 4. The scatter image of price and some attributes.
Sustainability 16 06384 g004
Table 1. Descriptive analysis.
FactorsSegmentation VariablesTypeDefinitionReferences
Host factorshost_is_superhostBooleanThe host attains superhost status or not[5,8,45,51]
host_has_profileBooleanThe host provides profile pictures or not
host_identity_verifiedBooleanThe host’s identity was verified on Airbnb or not
host_since_deltaIntegerThe time elapsed from the date of the host was created to the collection date
host_response_rateFloatThe speed at which a host replies to reservations
host_acceptance_rateFloatThe frequency at which a host accepts reservations
host_total_listings_countIntegerThe total number of listings’ shared rooms
host_listings_countIntegerThe host’s listing count (as per unidentified calculations on Airbnb)
Function factorsaccommodatesIntegerThe quantity of individuals who can fit in[5,7,8,13,14,16,32,46,51]
room typeCategoryThe three sorts of accommodations that are offered are the following: independent place, private room, and shared room
entire home/apartmentIntegerThe quantity of complete house/apartment listings that the host currently has
private roomIntegerThe quantity of private room listings that the host currently has in the scraping
shared roomIntegerThe quantity of shared room listings that the host currently has in the scraping
bedroomsIntegerHow many bedrooms there are
bedsIntegerThe quantity of beds
calculated_host_listings_countIntegerThe total number of listings that the host has
calculated_host_listings_count_entire_homesIntegerThe quantity of entire house listings that the host owns
calculated_host_listings_count_private_roomsIntegerThe quantity of private rooms listings that the host has
calculated_host_listings_count_shared_roomsIntegerThe quantity of shared rooms listings that the host has
Reputation factorsnumber of reviewsIntegerThe total amount of reviews the listing got[8,13,16,51]
reviews_per_monthNumericThe amount of reviews the listing receives each month
review_scores_ratingFloatThe listing’s rating based on review scores
review_scores_accuracyFloatThe listing’s reviews’ accuracy scores
review_scores_cleanlinessFloatThe listing’s cleanliness ratings
review_scores_check-inFloatThe scores for check-in in the listing
review_scores_communicationFloatThe scores for communication in the listing
review_scores_locationFloatThe scores for location in the listing
review_scores_valueFloatThe scores for value in the listing
number_of_reviews_ltmIntegerThe quantity of reviews that the listing has gotten during the previous 12 months
number_of_reviews_l30dIntegerThe quantity of evaluations the listing has gotten in the previous 30 days
first_review_deltaIntegerThe time interval between the first review date and the collection date
last_review_deltaIntegerThe time elapsed between the last review date and the collection date
reviews_per_monthNumericThe average monthly number of reviews throughout its existence
Location factorslatitudeNumericLatitude location[16]
longitudeNumericLongitude location
Miscellaneous Factorsminimum_nightsIntegerThe listing indicated the least number of nights stayed[5,12]
maximum_nightsIntegerThe listing displayed the most nights stayed
minimum_minimum_nightsIntegerThe calendar’s smallest minimum_night value
maximum_minimum_nightsIntegerThe calendar’s largest minimum_night value
minimum_maximum_nightsIntegerThe calendar’s smallest maximum_night value
maximum_maximum_nightsIntegerThe calendar’s biggest maximum_night value
minimum_nights_avg_ntmNumericThe calendar’s average minimum_night value
maximum_nights_avg_ntmNumericThe calendar’s average maximum_night value
has_availabilityBooleanThe listing indicates if it is available or not
availability_30IntegerThe calendar indicates the listing’s availability thirty days in advance
availability_60IntegerThe calendar indicates the listing’s availability sixty days in advance
availability_90IntegerThe calendar indicates the listing’s availability ninety days in advance
availability_365IntegerThe calendar indicates that the offering will be available for purchase 365 days in advance
instant_bookableBooleanThe host offers instant booking or not
sourcecategoryThe search sources are divided into categories:
“neighbourhood search”;
“previous scrape”.
Table 2. The network architecture of MobileNetV2.0.
Input PatternOperatortcns
2242 × 3Conv2d-3212
1122 × 32bottleneck11611
1122 × 16bottleneck62422
562 × 24bottleneck63232
282 × 32bottleneck66442
142 × 64bottleneck69631
142 × 96bottleneck616032
72 × 160bottleneck632011
72 × 320Conv2d 1 × 1-128011
72 × 1280Avgpool 7 × 7--1-
12 × 1280Conv2d 1 × 1-k--
Table 3. Testing results of prediction on different models and multiple subsets.
SetSourceModelsRMSEMSEMAPE (%)MAAPEMAE
TrainTestTrainTestTrainTestTrainTestTrainTest
1MDDense0.39470.40570.15580.16455.64285.83900.05610.05810.29880.3069
2TCBERT0.57190.54360.32710.29558.38257.89910.08300.07840.44120.4188
LSTM1.53210.84310.83480.71098.50679.40720.18640.09031.05310.4991
3HPICNN0.57920.54730.33550.29958.54107.94750.08460.07880.44980.4217
Mobile0.56010.54430.31370.29628.20967.85490.08130.07790.43190.4187
4MD + TCDense + BERT0.40330.42060.16270.17695.80956.12080.05780.06090.30790.3239
Dense + LSTM0.34690.47360.12030.22434.93016.84090.04910.06800.26130.3634
5MD + HPIDense + CNN0.40780.40810.16630.16655.80575.70800.05770.05680.30760.3065
Dense + Mobile0.44130.40890.19480.16726.38755.77240.06350.05740.33800.3090
6TC + HPIBERT + CNN0.58140.54470.33800.29678.55227.84380.08470.07780.44990.4187
BERT + Mobile0.58760.54710.34530.29938.61767.82470.08530.07770.45320.4198
LSTM + CNN0.66670.77410.44450.59929.778311.1520.09670.11010.51980.6070
7MD + TC + HPIDense + BERT + CNN0.44310.39910.19630.15936.44525.68520.06410.05660.34080.3024
Dense + BERT + Mobile0.22450.40450.05040.16373.11485.56820.03110.05540.16570.3030
Dense + LSTM + CNN0.22410.64550.05020.41673.17739.39230.03170.09320.16870.5171
Dense + LSTM + Mobile0.56230.55560.31610.30878.18367.88570.08110.07830.43300.4243
Notes: Set = Subset; MD = Meta Data; TC = Textual Content; HPI = Host-provided images.
Disclaimer/Publisher’s Note: The statements, opinions and data contained in all publications are solely those of the individual author(s) and contributor(s) and not of MDPI and/or the editor(s). MDPI and/or the editor(s) disclaim responsibility for any injury to people or property resulting from any ideas, methods, instructions or products referred to in the content.

