
Geological Study Based on Multispectral and Hyperspectral Remote Sensing: A Case Study of the Mahuaping Beryllium–Tungsten Deposit Area in Shangri-La

Abstract
:1. Introduction
2. Geological Overview
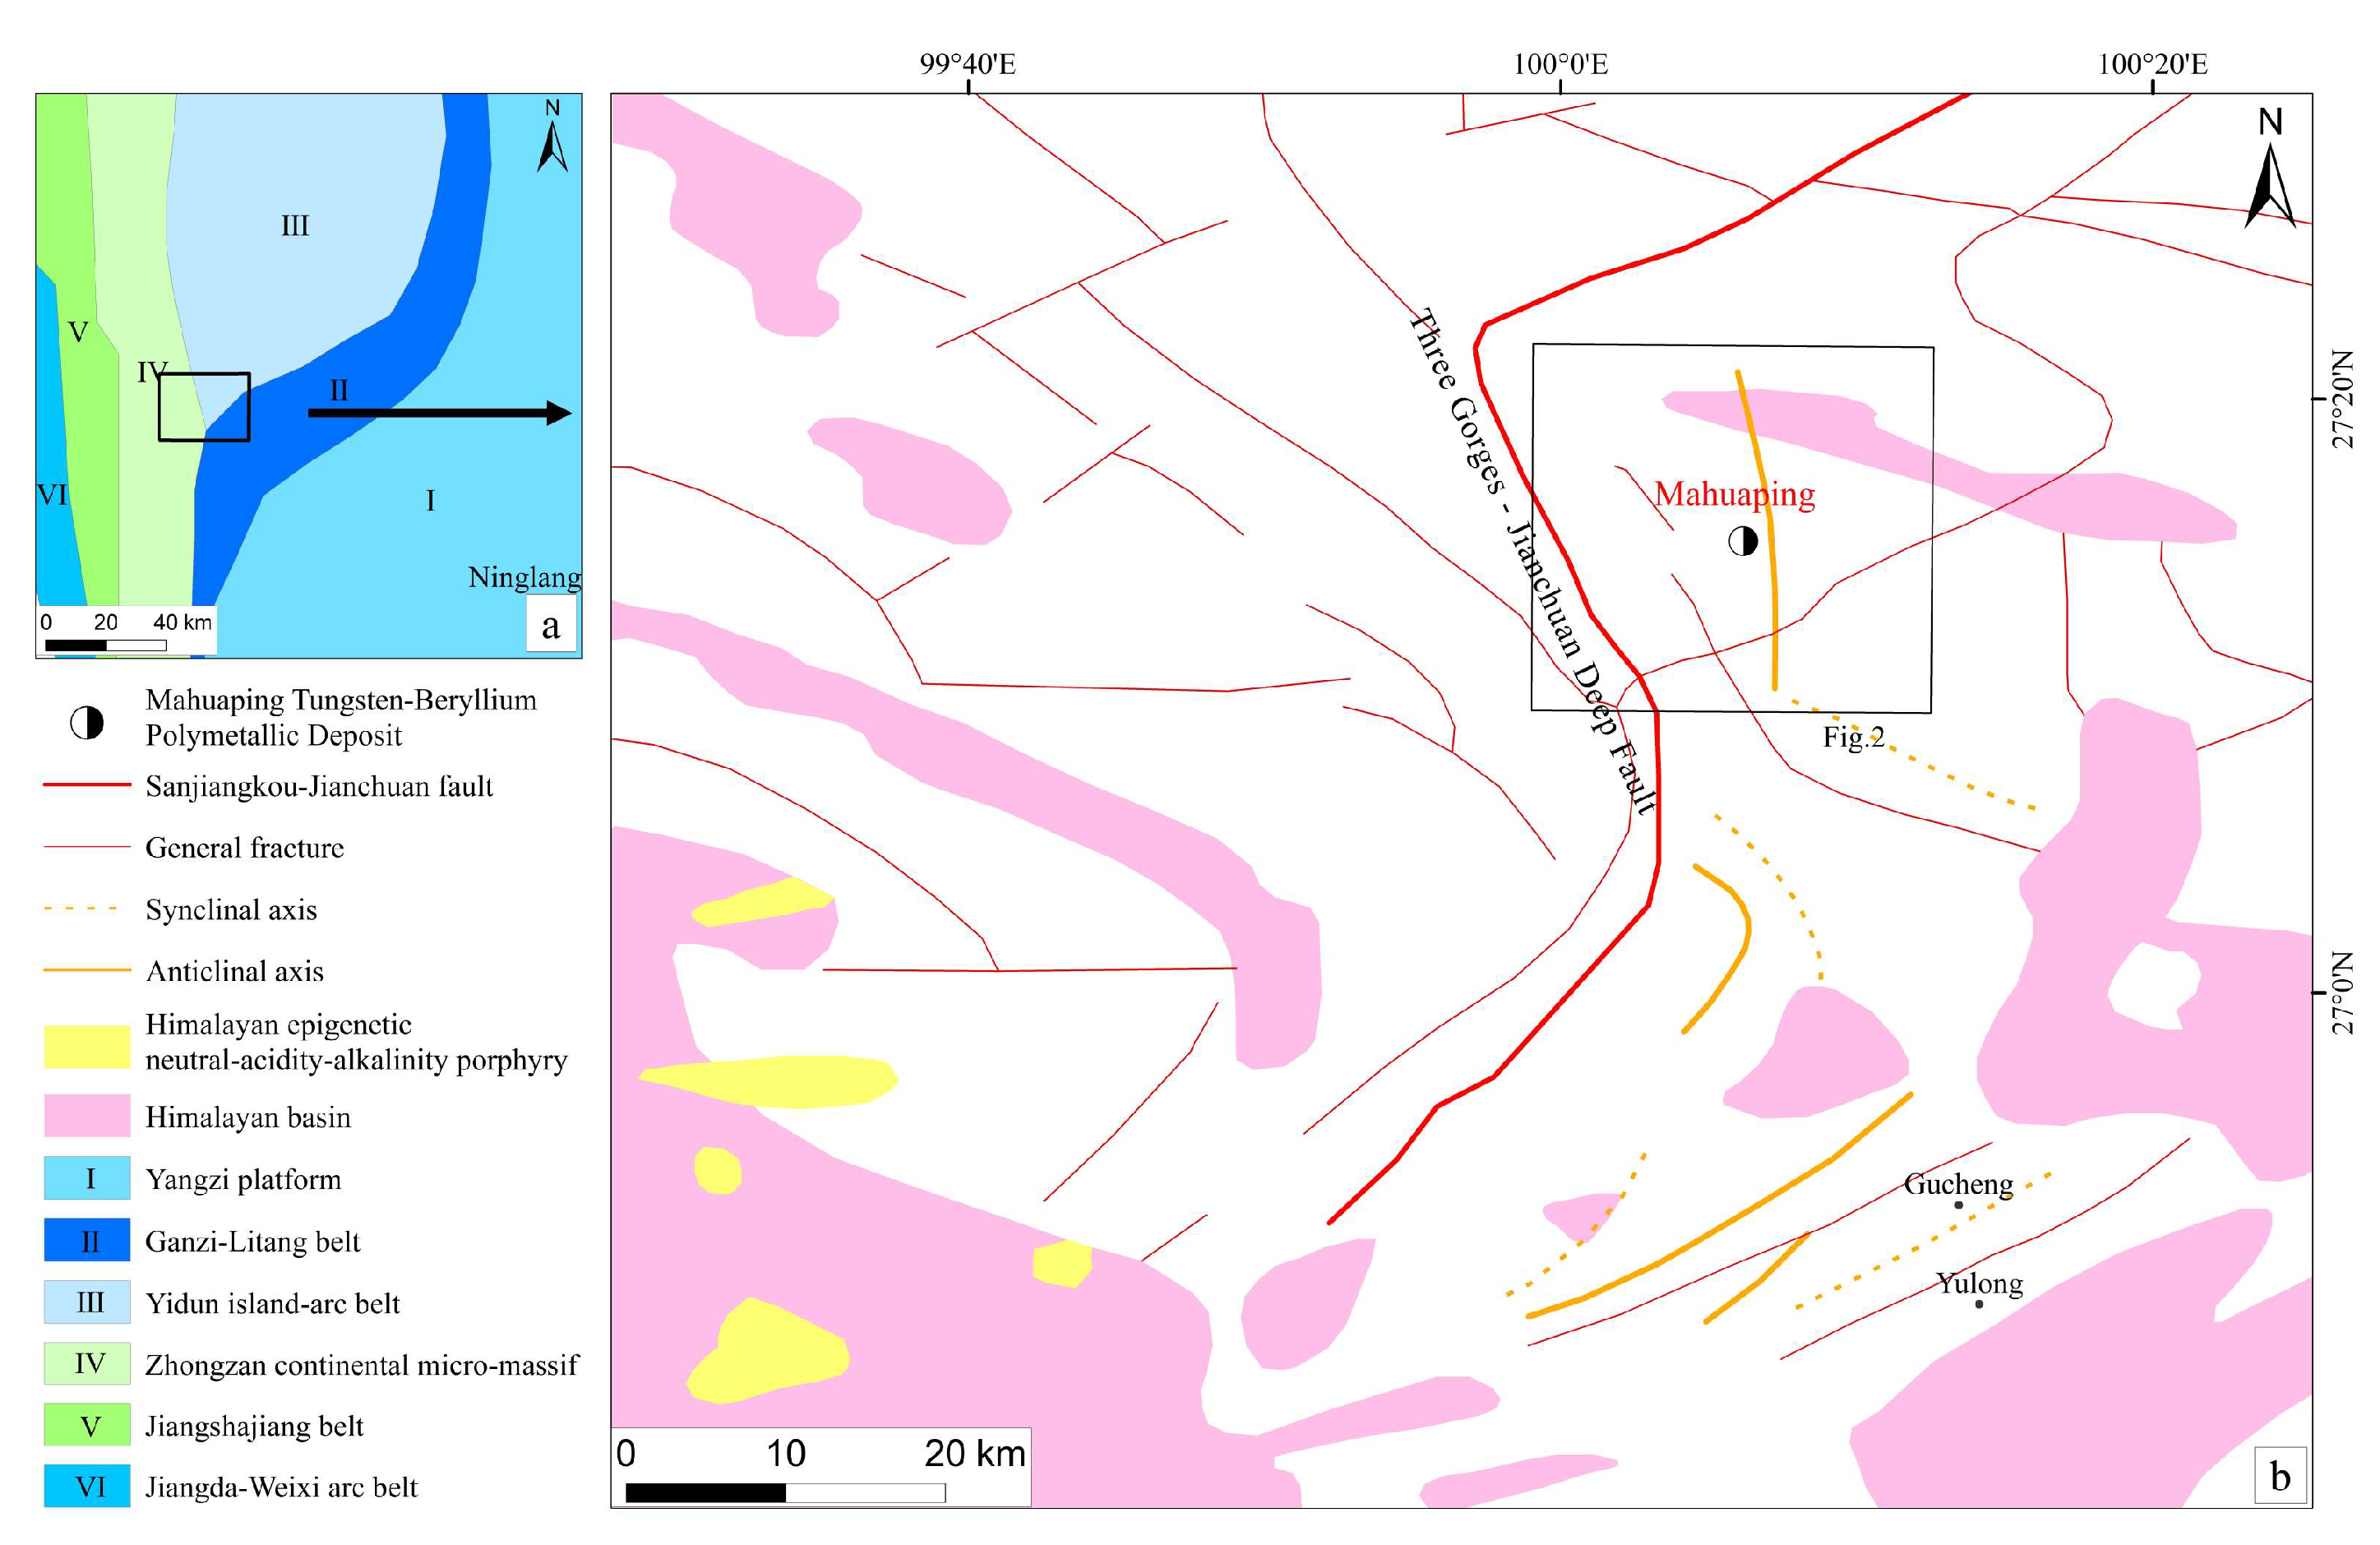
2.1. Regional Geological Overview
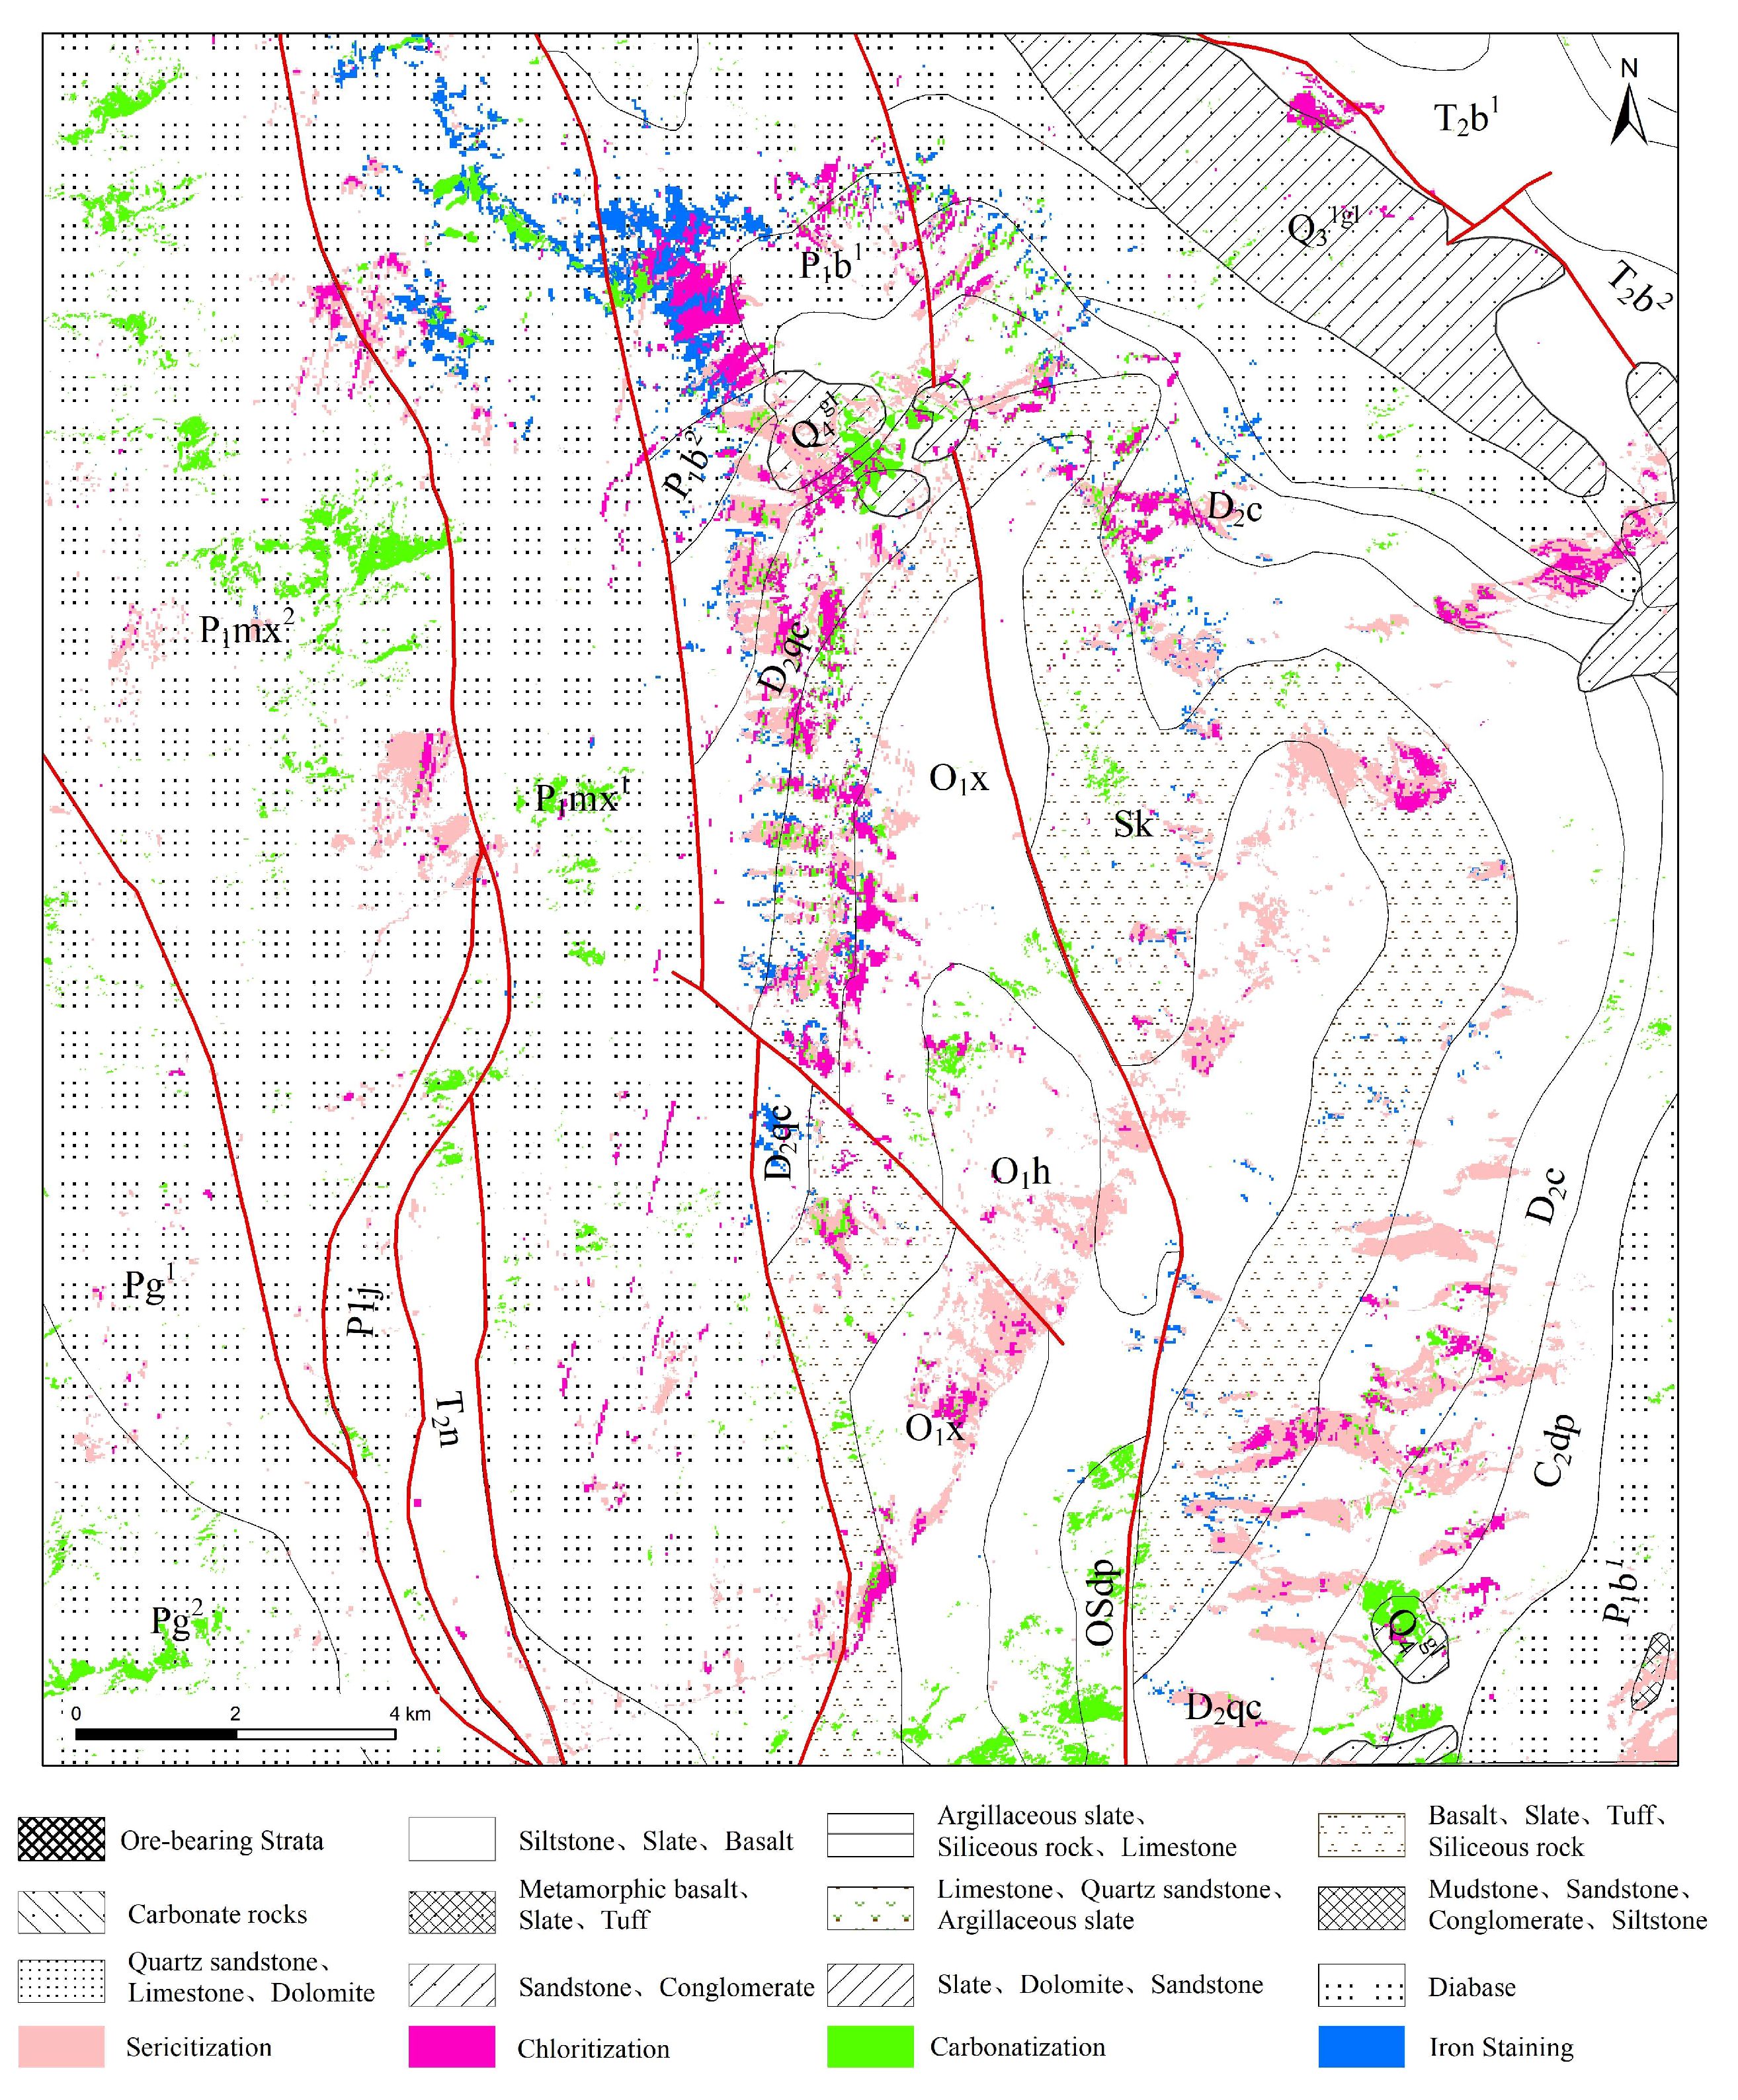
2.2. Geological Overview of the Mahuaping Mining Area
- (1)
- Lower Devonian low-grade metamorphic clastic rocks (D1): The lower section consists of a suite of metamorphic fine sandstone–metamorphic siltstone, predominantly interbedded with ribboned phyllites, and laminated fine metamorphic siltstones, with metamorphic siderite quartz siltstones. The top section includes interbedded metamorphic calcareous phyllite siltstone, lensoidal marbleized gray sandstone, and metamorphic siderite quartz siltstone. The upper section comprises gray to gray-black siltstone phyllites interbedded with carbonaceous phyllites, calcareous phyllites, and lensoidal marbleized schists. The rocks exhibit banded marbleized schists.
- (2)
- Middle to Upper Devonian marble (D2+3): Mainly light gray to gray-white thin to medium-thick layers, composed of partially blocky marbles interspersed with dark gray marbleized limestone. The lower part contains banded or lensoidal marbleized dolomitic limestone, with localized interbeds of metamorphic carbonaceous siltstone in the middle part. The top part consists of bioclastic rocks, metamorphic carbonaceous muscovite siltstone, and carbonaceous phyllites.
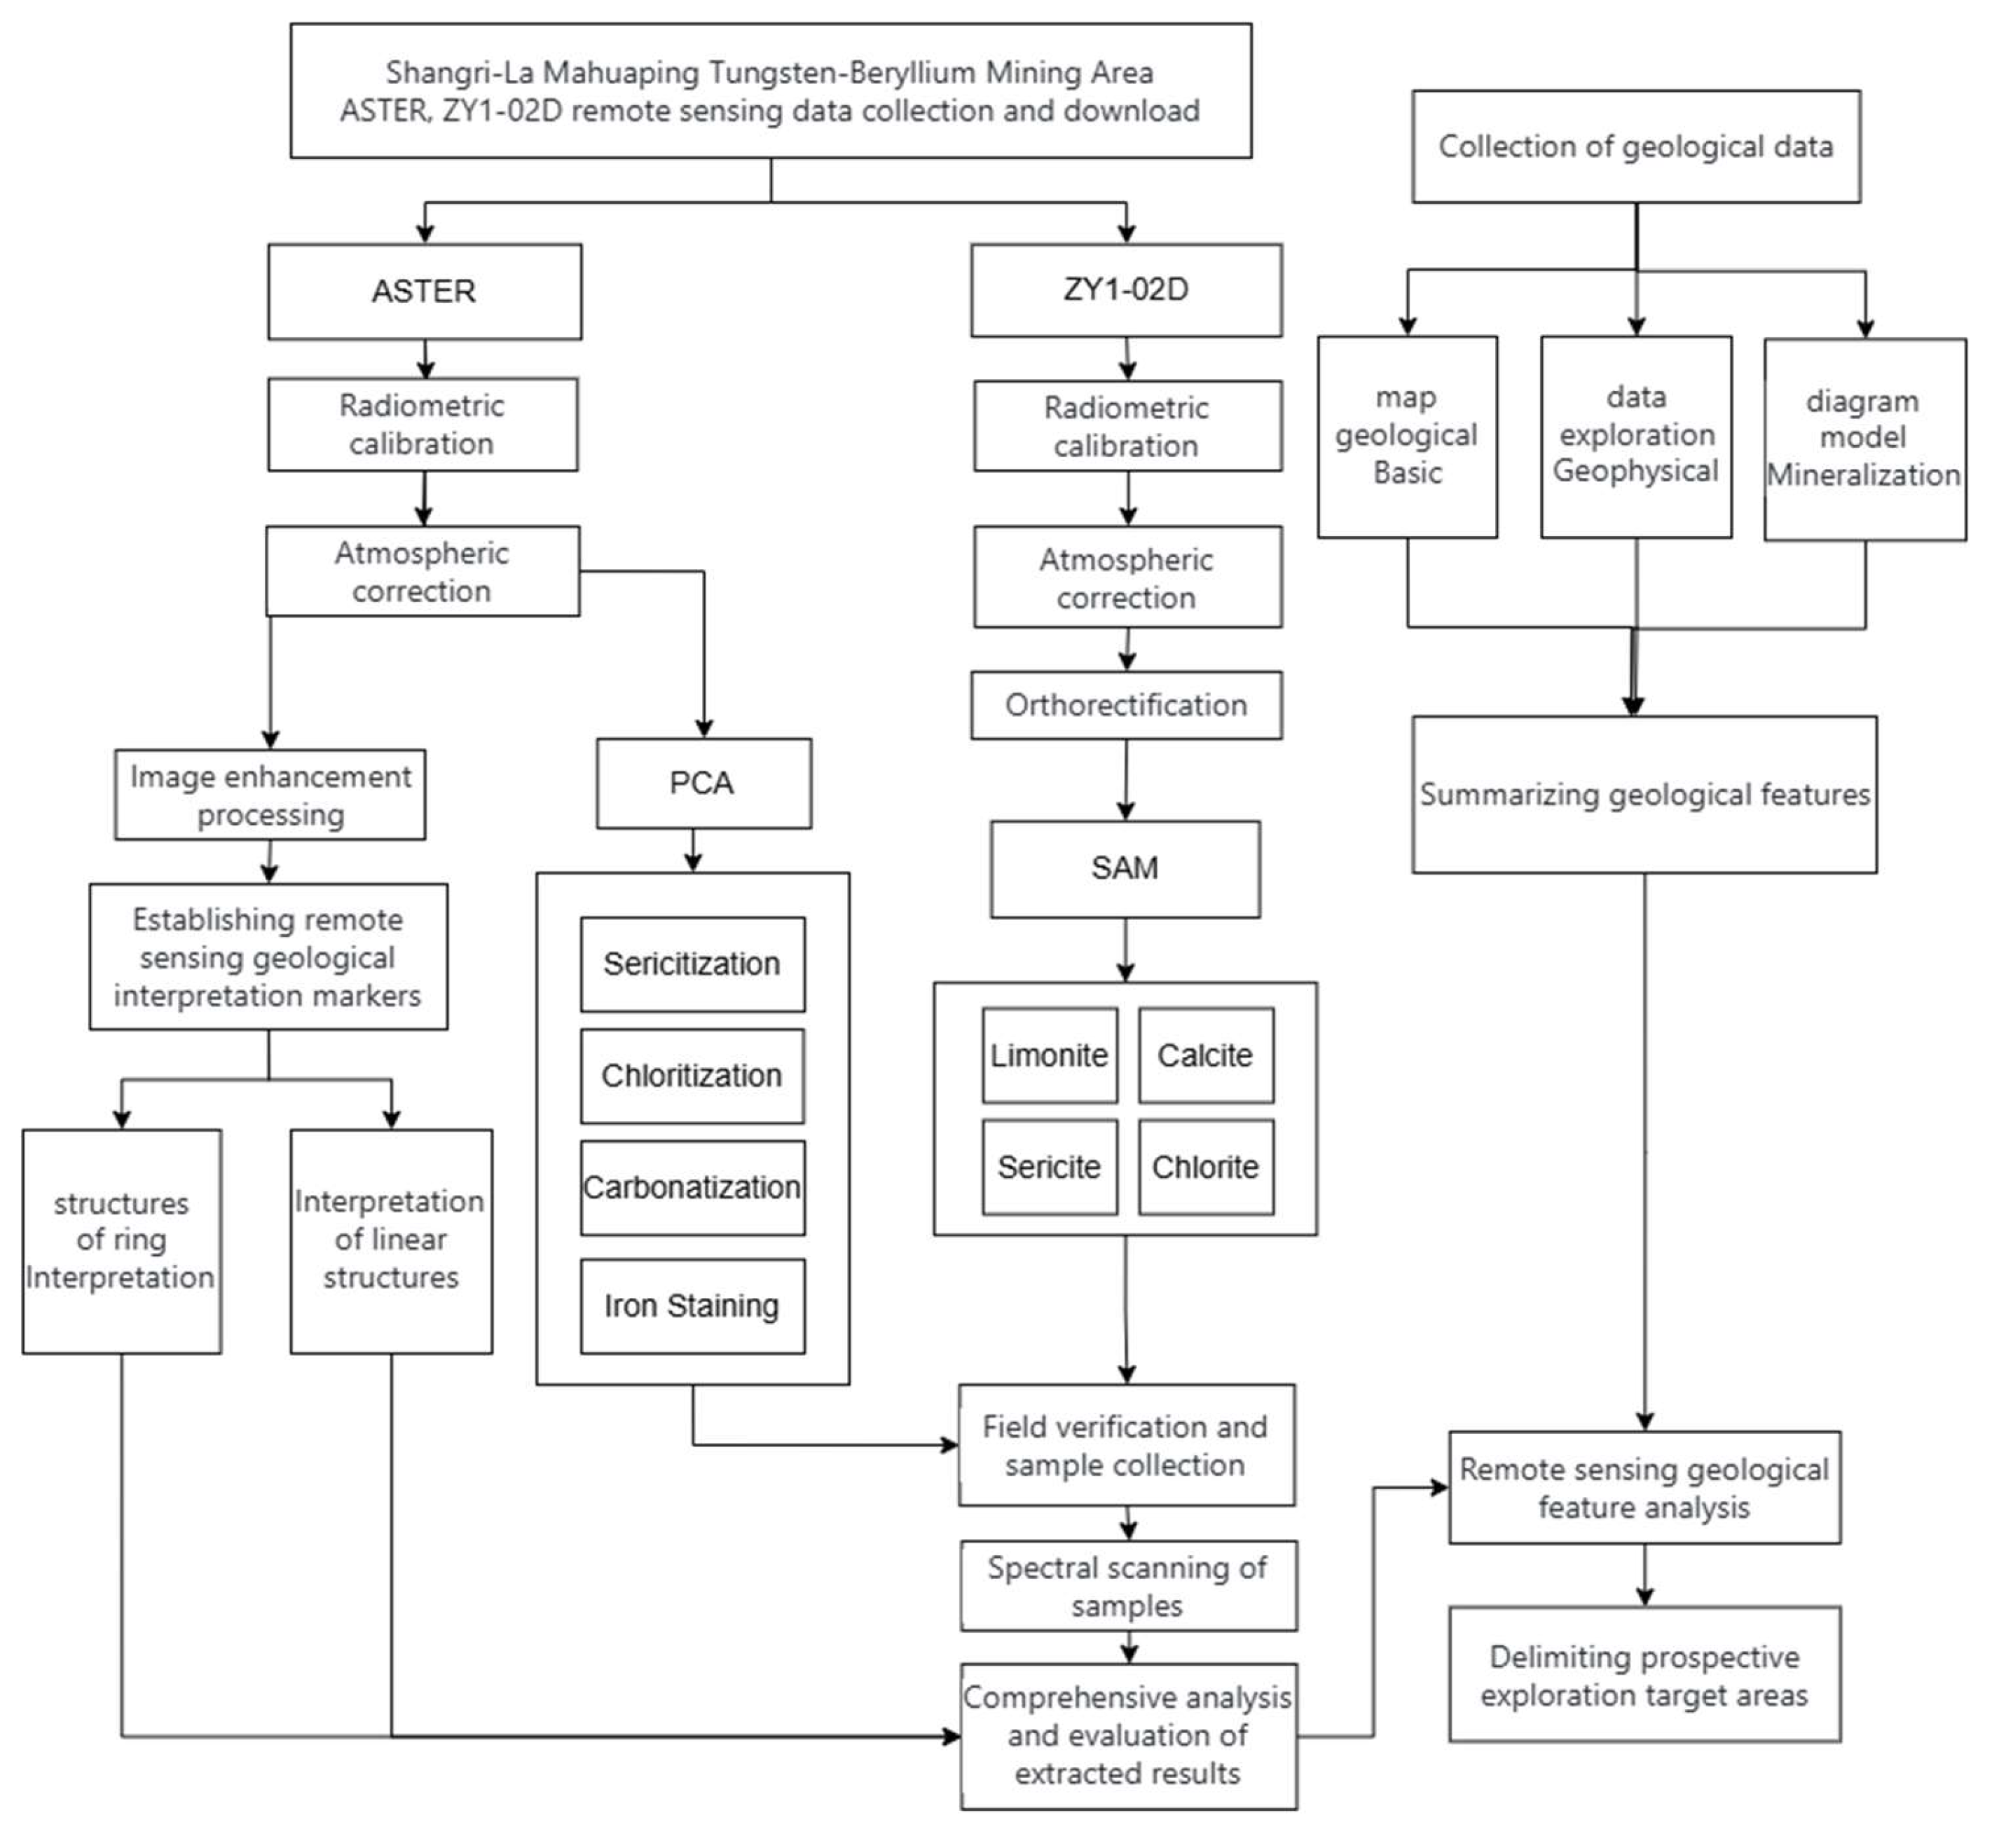
3. Data and Methods
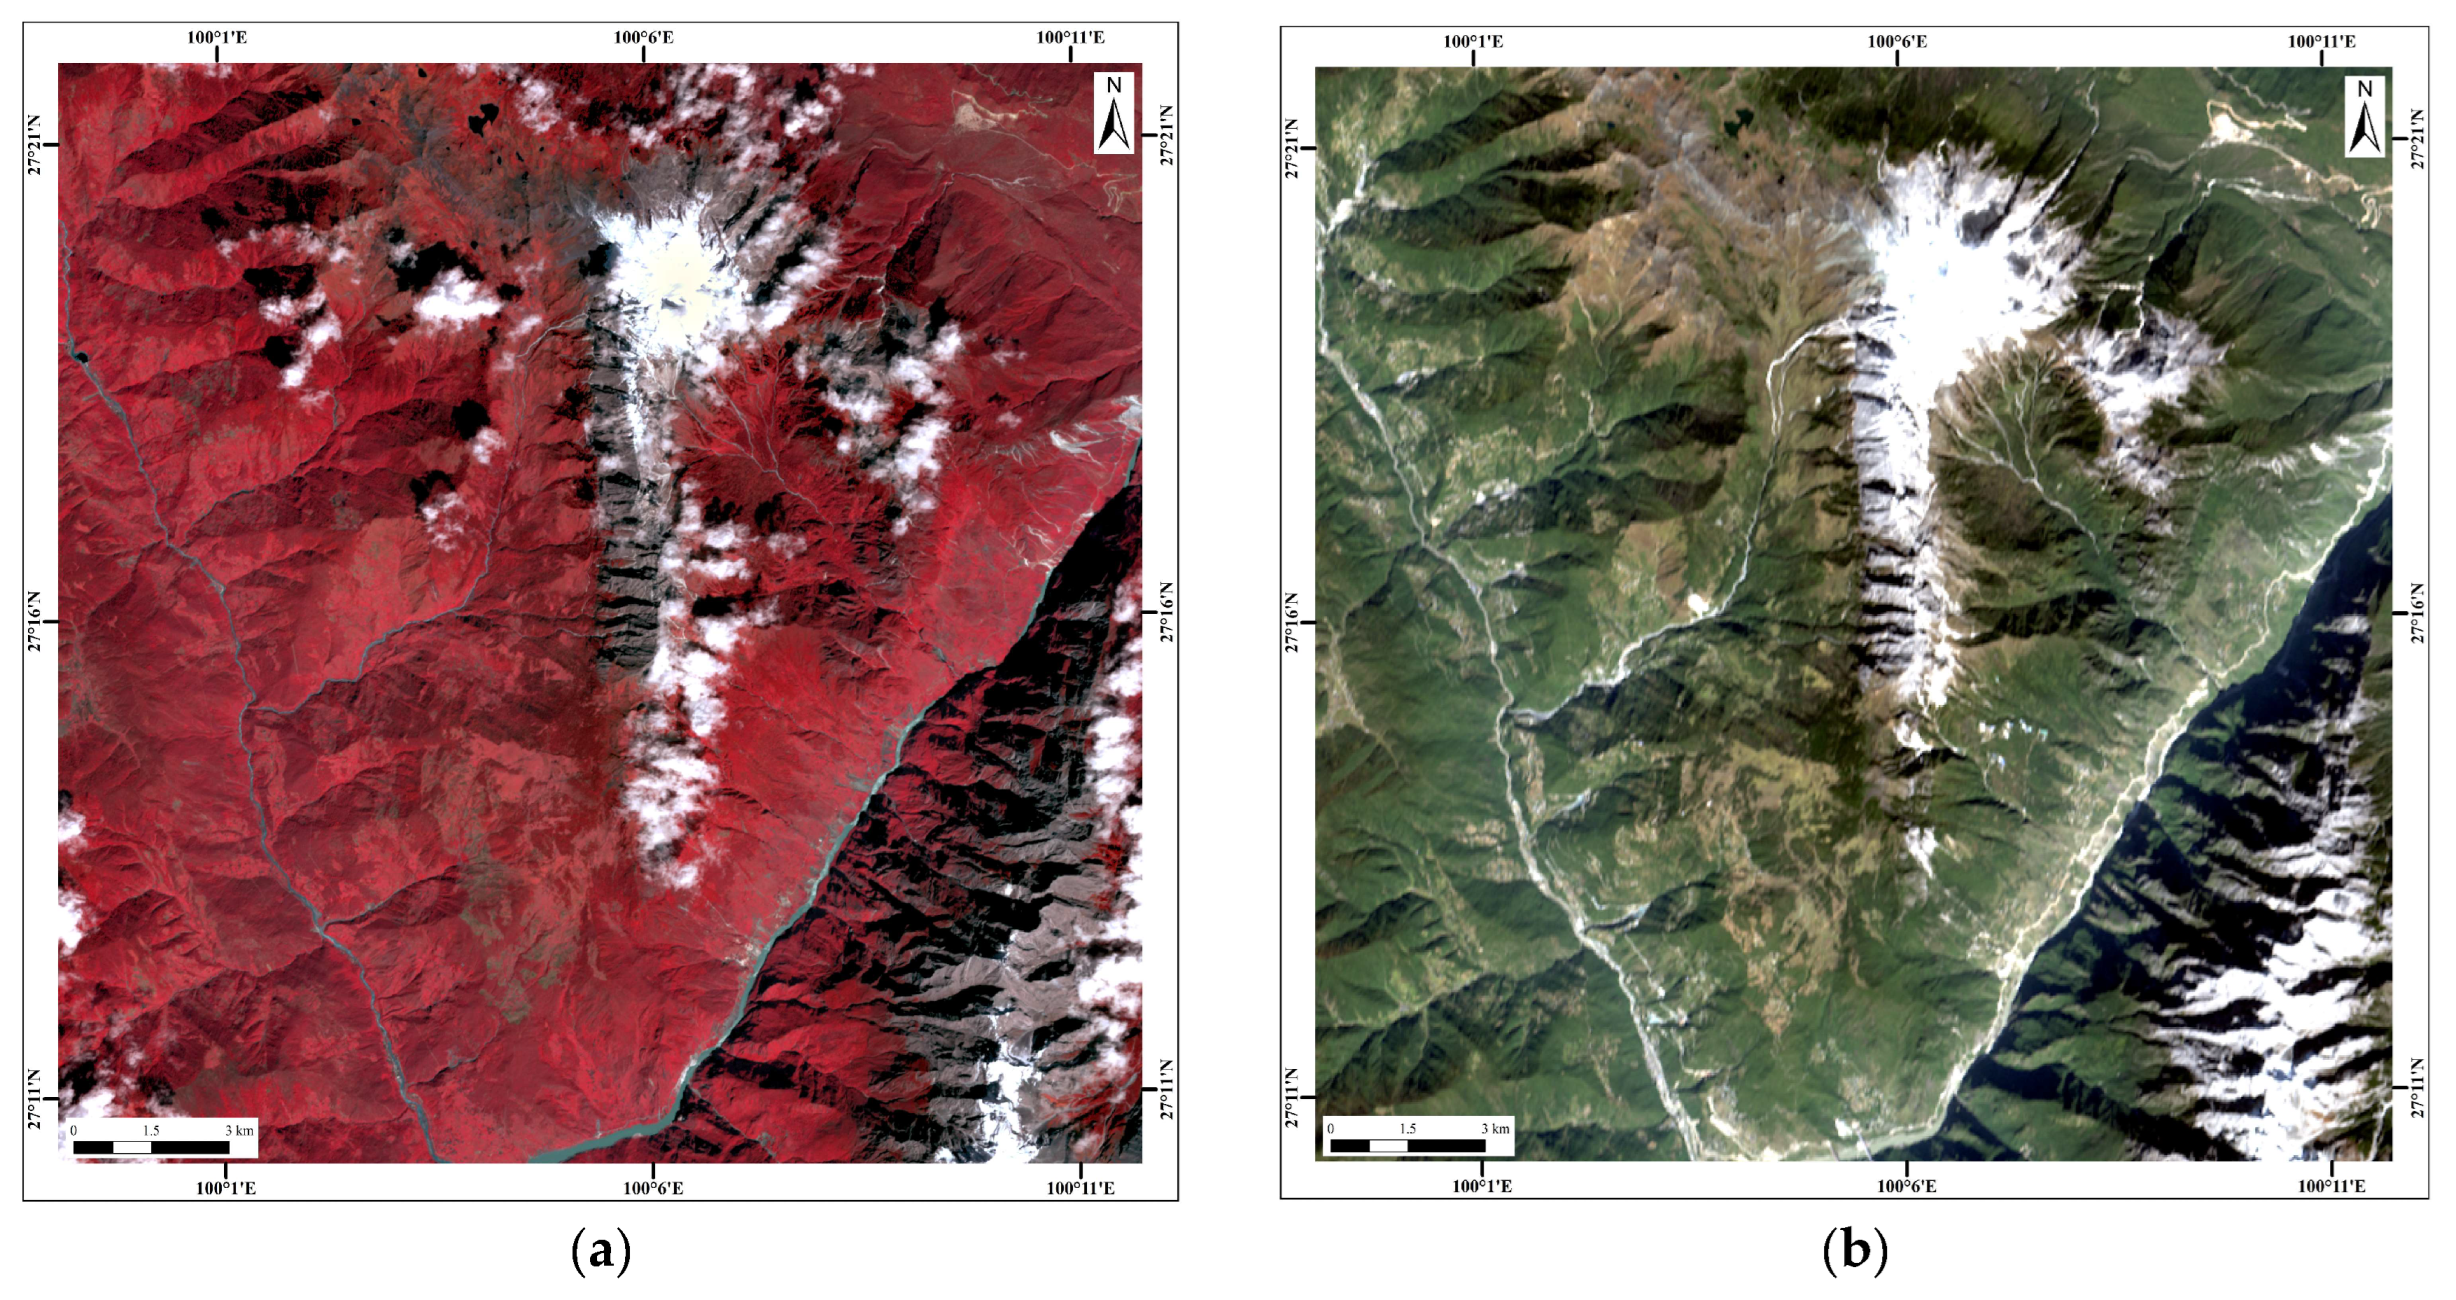
3.1. Utilizing the Data
3.2. Method
3.2.1. Structural Interpretation
3.2.2. Alteration Information Extraction
4. Results
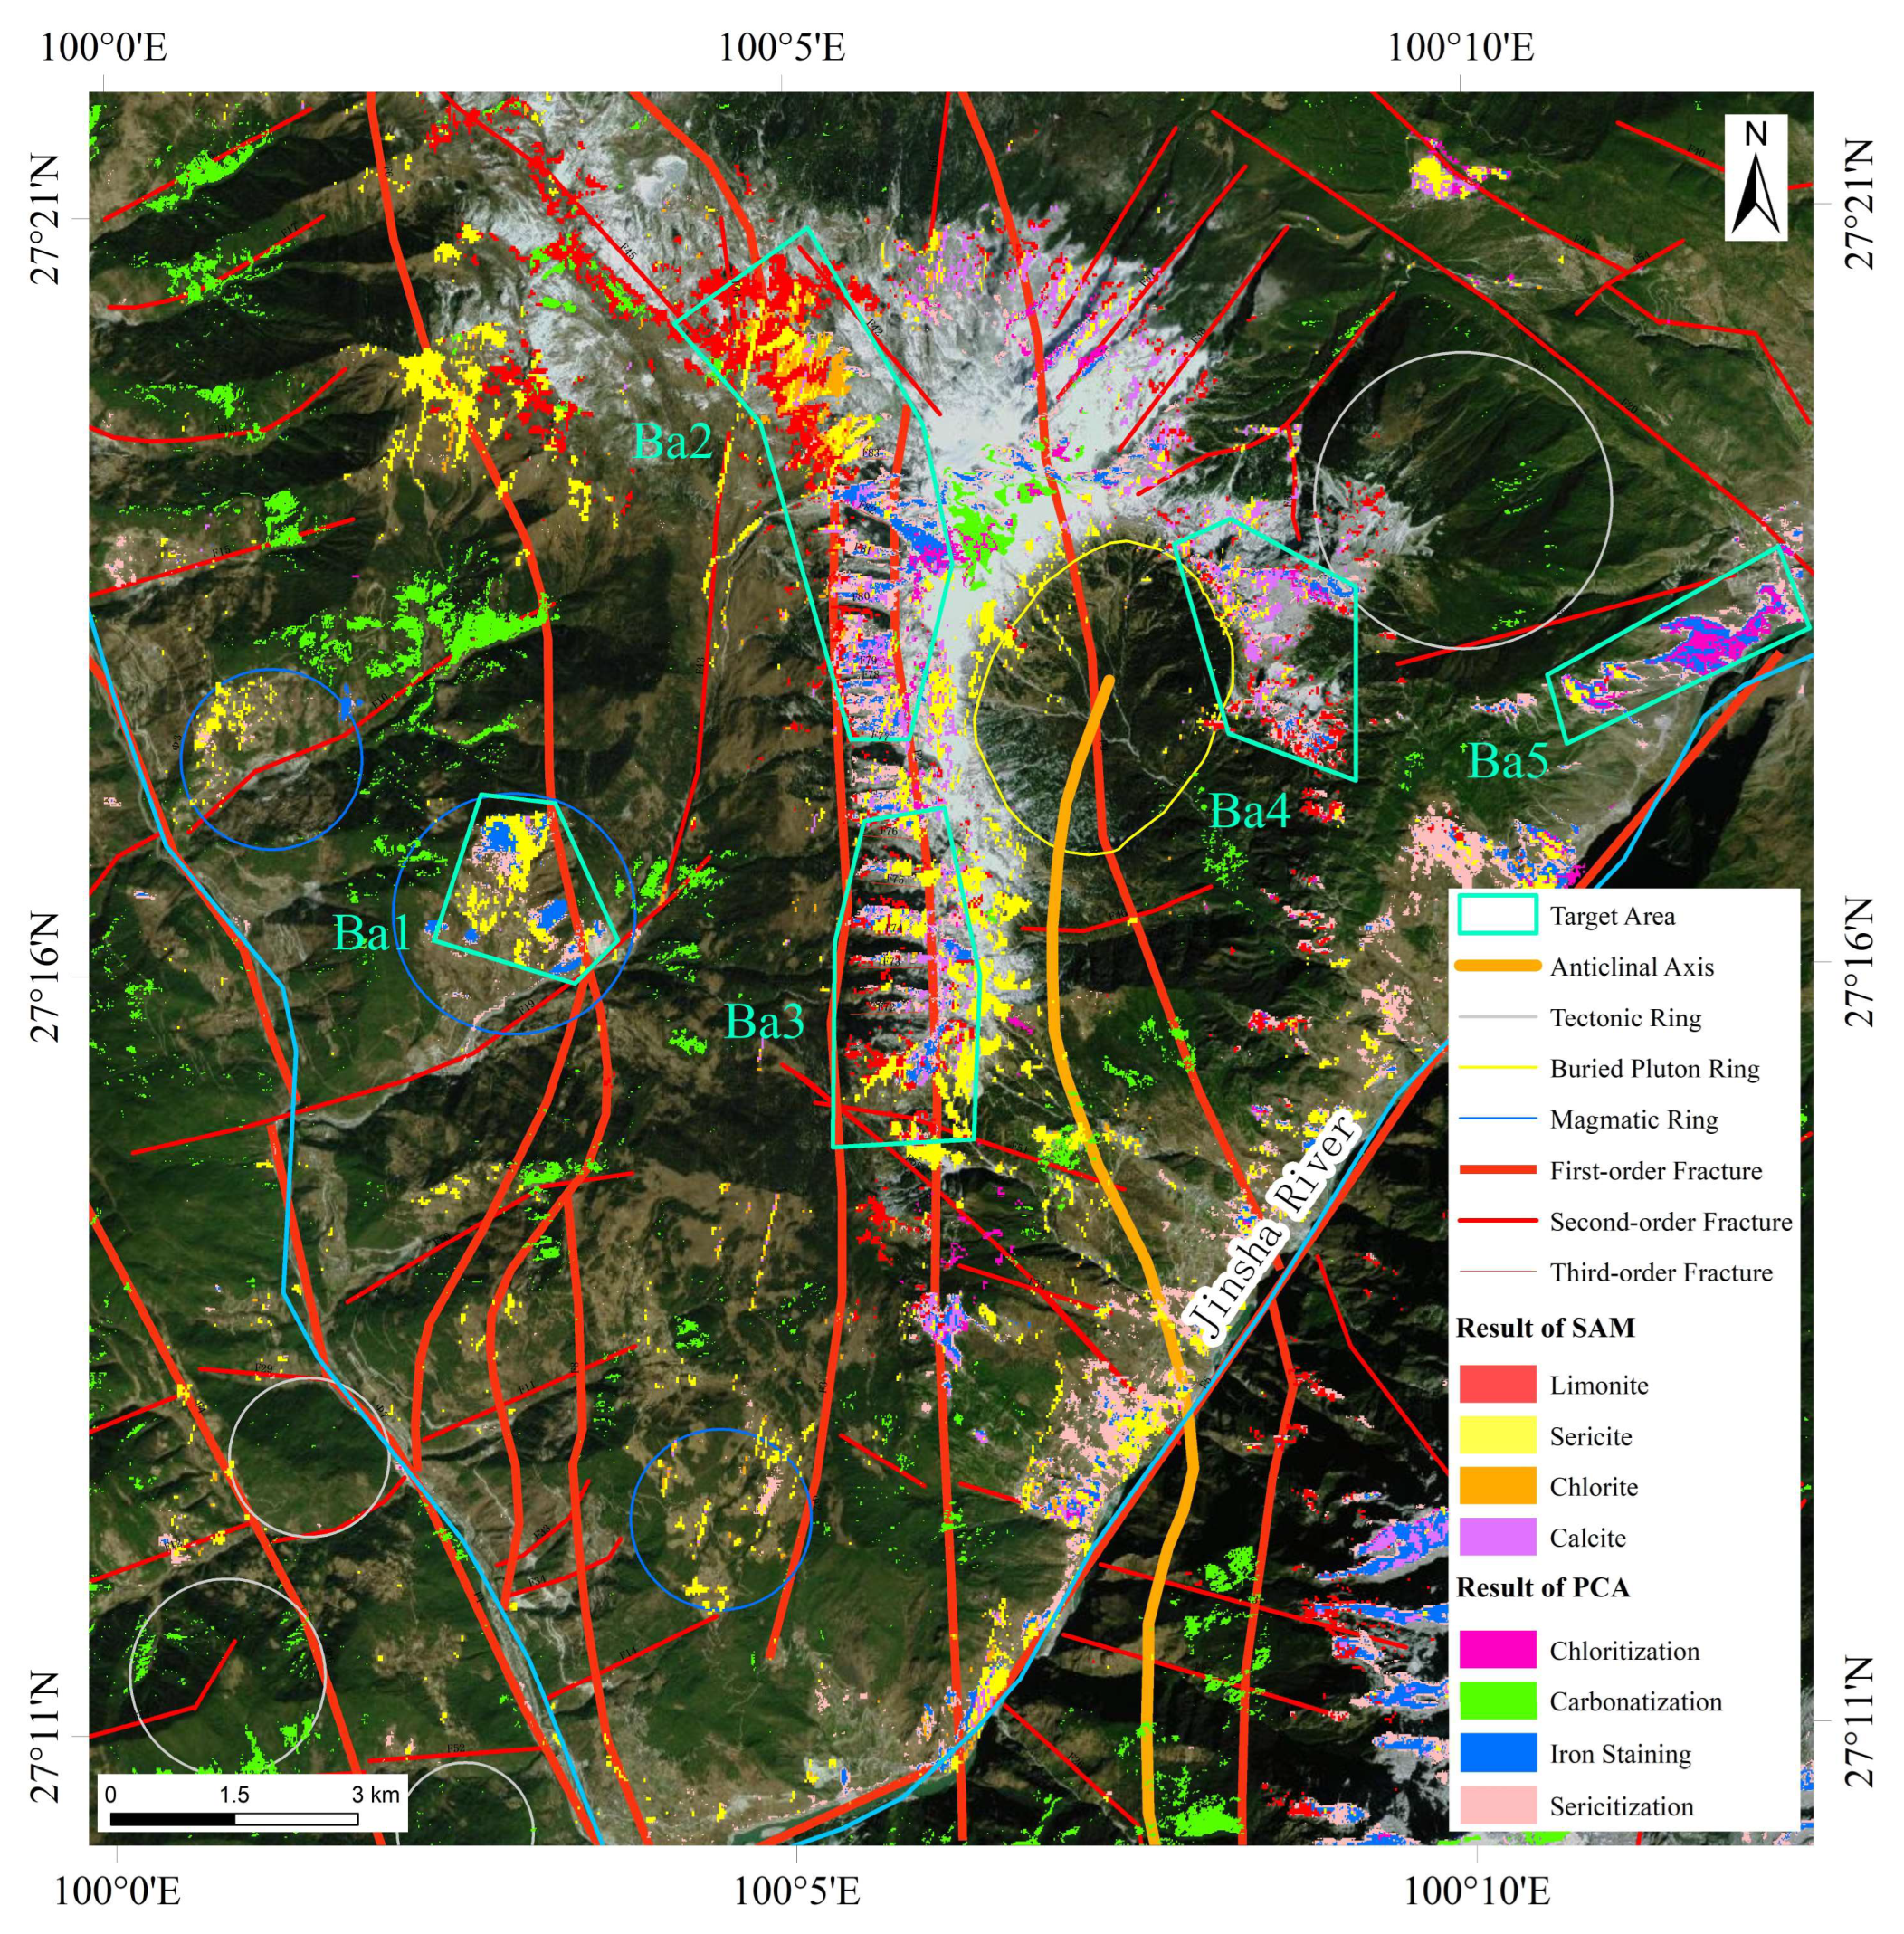
4.1. Structural Interpretation Results
4.2. Principal Component Analysis (PCA)
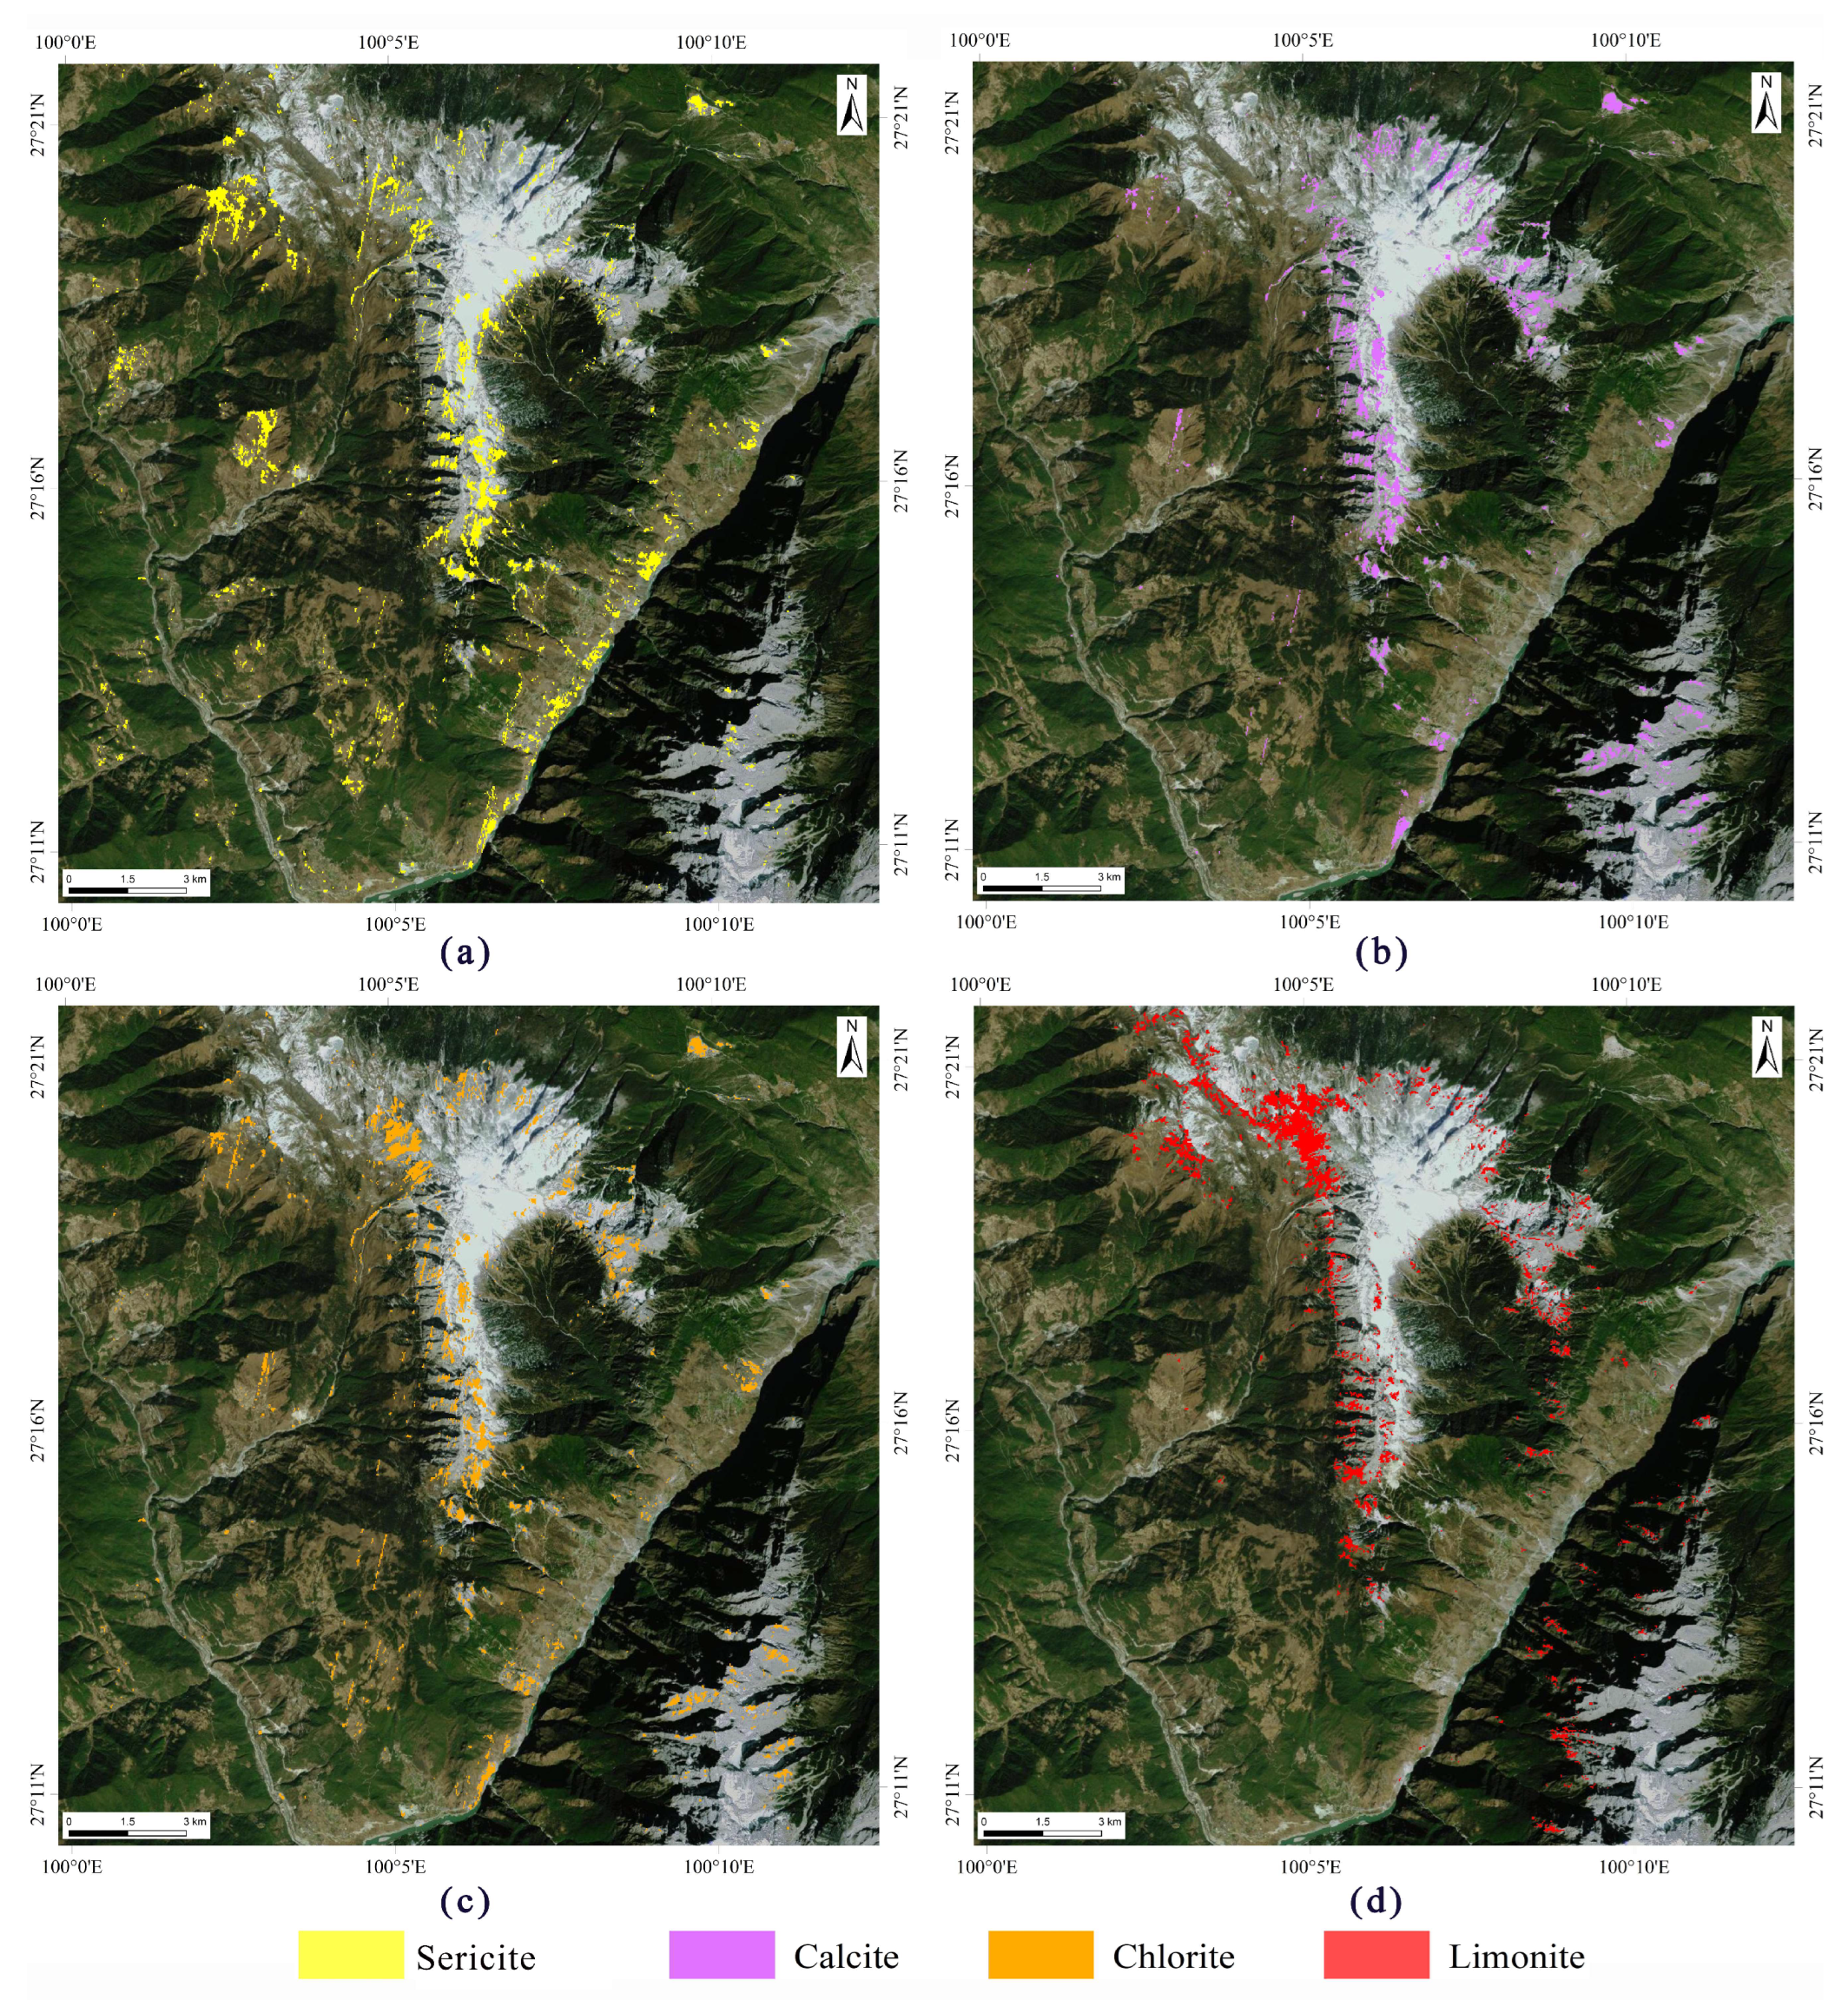
4.3. Spectral Angle Method (SAM)
4.4. Comprehensive Analysis
5. Discussion
5.1. Accuracy of Spectral Scanning Results
5.2. Accuracy of Extraction Results
5.3. Comparison Analysis of Alteration Extraction Results and Lithology
5.4. Comparison of Alteration Extraction Results from ASTER and ZY1-02D
6. Conclusions
Author Contributions
Funding
Institutional Review Board Statement
Informed Consent Statement
Data Availability Statement
Conflicts of Interest
References
- Ye, T.Z. Theoretical Framework of Methodology of Deposit Modeling and Integrated Geological Information for Mineral Resource Potential Assessment. J. Jilin Univ. 2013, 43, 1053–1072, (In Chinese with English abstract). [Google Scholar]
- Adams, J.B. Visible and near-infrared diffuse reflectance spectra of pyroxenes as applied to remote sensing of solid objects in the solar system. J. Geophys. Res. 1974, 79, 4829–4836. [Google Scholar] [CrossRef]
- Adams, J.B.; Filice, A.L. Spectral reflectance 0.4 to 2.0 microns of silicate rock powders. J. Geophys. Res. 1967, 72, 5705–5715. [Google Scholar] [CrossRef]
- Rowan, L.C.; Mars, J.C.; Simpson, C.J. Lithologic Mapping of the Mordor, NT, Australia Ultramafic Complex by Using the Advanced Spaceborne Thermal Emission and Reflection Radiometer (ASTER). Remote Sens. Environ. 2005, 99, 105–126. [Google Scholar] [CrossRef]
- Fraser, S.J.; Green, A.A. A Software Defoliant for Geological Analysis of Band Ratios. Int. J. Remote Sens. 1987, 8, 525–532. [Google Scholar] [CrossRef]
- Loughlin, W.P. Principal Component Analysis for Alteration Mapping. Photogramm. Eng. Remote Sens. 1991, 57, 1163–1169. [Google Scholar]
- Johnson, P.E.; Smith, M.O.; Adams, J.B. Simple Algorithms for Remote Determination of Mineral Abundances and Particle Sizes from Reflectance Spectra. J. Geophys. Res. Planets 1992, 97, 2649–2657. [Google Scholar] [CrossRef]
- Kumar, C.; Chatterjee, S.; Oommen, T.; Guha, A. Automated lithological mapping by integrating spectral enhancement techniques and machine learning algorithms using AVIRIS-NG hyperspectral data in Gold-bearing granite-greenstone rocks in Hutti, India. Int. J. Appl. Earth Obs. Geoinf. 2020, 86, 102006. [Google Scholar] [CrossRef]
- Van Der Meer, F.D.; Van Der Werff, H.M.A.; Van Ruitenbeek, F.J.A.; Hecker, C.A.; Bakker, W.H.; Noomen, M.F.; Van Der Meijde, M.; Carranza, E.J.M.; De Smeth, J.B.; Woldai, T. Multi-and hyperspectral geologic remote sensing: A review. Int. J. Appl. Earth Obs. Geoinf. 2021, 14, 112–128. [Google Scholar] [CrossRef]
- Sun, Y.; Liu, J.J.; Zhai, D.G.; Liu, Z.J.; Zhang, F.F.; Zhao, Y.J.; Liu, P.F.; Wang, Z.T. Alteration minerals mapping and identification of gold mineralization belt based on ZY1-02D hyperspectral data in the Toudiaoquan-Nandatan area, Ganse Province. Geol. Prospect. 2022, 58, 399–409. (In Chinese) [Google Scholar]
- Amer, R.; Kusky, T.; Ghulam, A. Lithological Mapping in the Central Eastern Desert of Egypt Using ASTER Data. J. Afr. Earth Sci. 2010, 56, 75–82. [Google Scholar] [CrossRef]
- Xiong, Y.; Khan, S.D.; Mahmood, K.; Sisson, V.B. Lithological Mapping of Bela Ophiolite with Remote-Sensing Data. Int. J. Remote Sens. 2011, 32, 4641–4658. [Google Scholar] [CrossRef]
- Lobo, A.; Garcia, E.; Barroso, G.; Martí, D.; Fernandez-Turiel, J.L.; Ibáñez-Insa, J. Machine Learning for Mineral Identification and Ore Estimation from Hyperspectral Imagery in Tin–Tungsten Deposits: Simulation under Indoor Conditions. Remote Sens. 2021, 13, 3258. [Google Scholar] [CrossRef]
- Pei, C.-K.; Fu, J. Status and prospect of hyperspectral remote sensing technique in rock and mineral identification. World Nuclear Geosci. 2007, 24, 32–38, (In Chinese with English abstract). [Google Scholar]
- Wei, J.; Ming, Y.-F.; Han, L.-S.; Ren, Z.-L.; Guo, Y.-M. Remote sensing identification method of mineral information based on matching of multispectral characteristic parameters. Spectrosc. Spectr. Anal. 2015, 35, 2862–2866. (In Chinese) [Google Scholar]
- Mohammadi, N.M.; Hezarkhani, A. Application of Support Vector Machine for the Separation of Mineralised Zones in the Takht-e-Gonbad Porphyry Deposit, SE Iran. J. Afr. Earth Sci. 2018, 143, 301–308. [Google Scholar] [CrossRef]
- Ordóñez-Calderón, J.C.; Gelcich, S. Machine Learning Strategies for Classification and Prediction of Alteration Facies: Examples from the Rosemont Cu-Mo-Ag Skarn Deposit, SE Tucson Arizona. J. Geochem. Explor. 2018, 194, 167–188. [Google Scholar] [CrossRef]
- Carrino, T.A.; Crósta, A.P.; Toledo, C.L.B.; Silva, A.M. Hyperspectral Remote Sensing Applied to Mineral Exploration in Southern Peru: A Multiple Data Integration Approach in the Chapi Chiara Gold Prospect. Int. J. Appl. Earth Obs. Geoinf. 2018, 64, 287–300. [Google Scholar] [CrossRef]
- Cheng, J.L.; Yang, L.Y.; Cui, Z.L.; Zhang, X.H. Mineral Geology of China · Yunnan Volume · Tin and Tungsten Minerals; Yunnan Institute of Geology and Mineral Exploration: Kunming, China, 2019; pp. 245–257. (In Chinese) [Google Scholar]
- Ran, M.J.; Zhong, K.H.; Yang, J.G.; Luo, M.F. Geochemistry and Its Genesis Implications of Beryllium and Tungsten Deposit in Mahuaping of Shangri-La, Yunnan; Sichuan Nonferrous Metals: Chengdu, China, 2015; pp. 42–45, (In Chinese with English abstract). [Google Scholar]
- Zhou, Z.; Wen, H.; Qin, C.; Liu, L. Geochemical and isotopic evidence for a magmatic-hydrothermal origin of the polymetallic vein-type Zn-Pb deposits in the northwest margin of Jiangnan Orogen, South China. Ore Geol. Rev. 2017, 86, 673–691. [Google Scholar] [CrossRef]
- Jiang, S.; Woodhead, J.; Yu, J.; Pan, J.; Liao, Q.; Wu, N. A reconnaissance of Cu isotopic compositions of hydrothermal vein-type copper deposit Jinman, Yunnan, China. Chin. Sci. Bull. 2002, 47, 249–251. [Google Scholar] [CrossRef]
- Han, C.C.; Zhang, X.B.; Wu, S.S.; Liu, Y.T. The Magmatic-Hydrothermal Ore-Forming Processes of the Tonggou Cu-Zn Deposit, NW China: Constraints from Magnetite Chemistry and Fluid Inclusions. Minerals 2022, 12, 485. [Google Scholar] [CrossRef]
- Ma, J.; Tao, Y.; He, D.F.; Xiong, F. The Ore-Forming Age and Fluid Inclusion Characteristics of the Mahuaping Tungsten-Beryllium Deposit in Yunnan Province. Bull. Mineral. Geochem. 2020, 39, 223–232. [Google Scholar] [CrossRef]
- Xiong, F.; Tao, Y.; Deng, X.Z. Characteristics of fluid inclusions and genetic analysis of the Mahuaping tungsten-beryllium deposit in Yunnan. Acta Mineral. Sin. 2015, 35, 353–354. [Google Scholar] [CrossRef]
- Elaaraj, A.; Lhachmi, A.; Tabyaoui, H.; Alitane, A.; Varasano, A.; Hitouri, S.; El Yousfi, Y.; Mohajane, M.; Essahlaoui, N.; Gueddari, H.; et al. Remote Sensing Data for Geological Mapping in the Saka Region in Northeast Morocco: An Integrated Approach. Sustainability 2022, 14, 15349. [Google Scholar] [CrossRef]
- Pan, Z.; Liu, J.; Ma, L.; Chen, F.; Zhu, G.; Qin, F.; Zhang, H.; Huang, J.; Li, Y.; Wang, J. Research on Hyperspectral Identification of Altered Minerals in Yemaquan West Gold Field, Xinjiang. Sustainability 2019, 11, 428. [Google Scholar] [CrossRef]
- Nafigin, I.O.; Ishmukhametova, V.T.; Ustinov, S.A.; Minaev, V.A.; Petrov, V.A. Geological and Mineralogical Mapping Based on Statistical Methods of Remote Sensing Data Processing of Landsat-8: A Case Study in the Southeastern Transbaikalia, Russia. Sustainability 2022, 14, 9242. [Google Scholar] [CrossRef]
- Dong, T.; Du, B.; Duan, Z.Y.; Cao, X.M.; Song, X.F.; Dong, H.G.; Zhang, Y.M.; Li, B. Metallogenic regularity and prospecting direction of tungsten deposits in Shangri-La area, NW Yunnan Province, China. Sediment. Geol. Tethyan Geol. 2022, 42, 62–74, (In Chinese with English abstract). [Google Scholar]
- Ran, M.J.; Zhong, K.H.; Li, F.Y.; Luo, M.F.; Liu, Z.C.; Tang, J.X. Analysis of the Tectonic of Deposit and the Age of Mineralization in Mahuaping of Shangri-La in Yunnan; Sichuan Nonferrous Metals: Chengdu China, 2011; pp. 21–27, (In Chinese with English abstract). [Google Scholar]
- Rowan, L.C.; Mars, J.C. Lithologic mapping in the Mountain Pass, California area using Advanced Spaceborne Thermal Emission and Reflection Radiometer (ASTER) data. Remote Sens. Environ. 2003, 84, 350–366. [Google Scholar] [CrossRef]
- Mahdi, A.M.; Eldosouky, A.M.; Elkhateeb, S.O.; Youssef, A.M.; Saad, A.A. Integration of remote sensing and geophysical data for the extraction of hydrothermal alteration zones and lineaments; Gabal Shilman basement area, Southeastern Desert, Egypt. J. Afr. Earth Sci. 2022, 194, 104640. [Google Scholar] [CrossRef]
- Abubakar, A.J.; Hashim, M.; Pour, A.B. Identification of hydrothermal alteration minerals associated with geothermal system using ASTER and Hyperion satellite data: A case study from Yankari Park, NE Nigeria. Geocarto Int. 2019, 34, 597–625. [Google Scholar] [CrossRef]
- Ghosh, U.K.; Naik, K.K.; Kesari, M.P. Digital image processing of multispectral ASTER imagery for delineation of alteration and related clay minerals in Sakoli belt: Maharashtra—A case study. J. Geol. Soc. India 2016, 88, 464–470. [Google Scholar] [CrossRef]
- Zhao, Z.F. Study on Remote Sensing Anomaly Information of Mineralization; China University of Geosciences: Beijing, China, 2008; (In Chinese with English abstract). [Google Scholar]
- Xu, T.; Liu, X.F.; Zhang, J.F.; Yang, F.F. Research progress of quartz vein type tungsten ore mineralization. Contrib. Geol. Miner. Resour. Res. Contr. Geol Min. Resour. Res. 2019, 34, 196–200. (In Chinese) [Google Scholar]
- Pour, A.B.; Hashim, M. Identifying areas of high economic-potential copper mineralization using ASTER data in the Urumieh–Dokhtar Volcanic Belt, Iran. Adv. Space Res. 2012, 49, 753–769. [Google Scholar] [CrossRef]
- Hegab, M.A.E.R.; Mousa, S.E.; Salem, S.M.; Farag, K.; GabAllah, H. Gold-related Alteration Zones Detection at the Um Balad Area, Egyptian Eastern Desert, using Remote Sensing, Geophysical, and GIS Data Analysis. J. Afr. Earth Sci. 2022, 196, 104715. [Google Scholar] [CrossRef]
- Zhang, M.L. Principal component analysis in gold mine alteration information extraction. Remote Sens. Technol. Appl. 1996, 11, 2–7. (In Chinese) [Google Scholar] [CrossRef]
- Li, C.G.; Zhang, Y.J. The Principal Component Analysis Method was Used to Extract Remote Sensing Information of Copper Mineralization Alteration in Lanping Area of Lancang River; Remote Sensing for Land & Resources: Beijing, China, 1997; pp. 22–32. (In Chinese) [Google Scholar]
- Wang, R.D.; Xing, L.X. Remote sensing extraction method of alteration information of ore deposit. World Geol. 2000, 19, 397–401. (In Chinese) [Google Scholar]
- Abdelkareem, M.; El-Baz, F. Characterizing hydrothermal alteration zones in Hamama area in the central Eastern Desert of Egypt by remotely sensed data. Geocarto Int. 2018, 33, 1307–1325. [Google Scholar] [CrossRef]
- Gabr, S.S.; Hassan, S.M.; Sadek, M.F. Prospecting for new gold-bearing alteration zones at El-Hoteib area, South Eastern Desert, Egypt, using remote sensing data analysis. Ore Geol. Rev. 2015, 71, 1–13. [Google Scholar] [CrossRef]
- Honarpazhouh, J.; Hassanipak, A.A.; Seifpanahi, S.K. Integration of Stream Sediment Geochemical and Aster Data for Porphyry Copper Deposit Exploration in Khatun Abad, North West of Iran/Integracja geochemicznych danych o osadach dennych oraz danych pozyskanych z systemu aster do poszukiwań geologicznych w rejonie złóż miedzi porfirytowej w khatun abad, w północno-zachodniej części iranu. Arch. Min. Sci. 2013, 58, 37–54. [Google Scholar]
- Kruse, F.A.; Lefkoff, A.B.; Boardman, Y.J.; Heidebrecht, K.B.; Shapiro, A.T.; Barloon, P.J.; Goetz, A.F.H. The Spectral Image Processing System (SIPS) Interactive Visualization and Analysis of Imaging Spectrometer Data. Remote Sens. Environ. 1993, 44, 145–165. [Google Scholar] [CrossRef]
- Zhang, Y.J.; Zeng, C.M.; Chen, W. Research and application of remote sensing anomaly extraction method for ETM~+(TM) alteration: Method selection and technical process. Remote Sens. Land Resour. 2003, 2, 44–49, (In Chinese with English abstract). [Google Scholar]
- Yonezawa, C. Maximum likelihood classification combined with spectral angle mapper algorithm for high resolution satellite imagery. Int. J. Remote Sens. 2007, 28, 3729–3737. [Google Scholar] [CrossRef]
- Qiu, F.; Abdelsalam, M.; Thakkar, P. Spectral analysis of ASTER data covering part of the Neoproterozoic Allaqi-Heiani suture, Southern Egypt. J. Afr. Earth Sci. 2006, 44, 169–180. [Google Scholar] [CrossRef]
- Honarmand, M.; Ranjbar, H.; Shahabpour, J. Application of Principal Component Analysis and Spectral Angle Mapper in the Mapping of Hydrothermal Alteration in the Jebal-Barez Area, Southeastern Iran: Hydrothermal alteration mapping. Resour. Geol. 2012, 62, 119–139. [Google Scholar] [CrossRef]
- Shahriari, H.; Ranjbar, H.; Honarmand, M.; Carranza, E.J.M. Selection of Less Biased Threshold Angles for SAM Classification Using the Real Value–Area Fractal Technique. Resour. Geol. 2014, 64, 301–315. [Google Scholar] [CrossRef]
- Krupnik, D.; Khan, S.D. High-Resolution Hyperspectral Mineral Mapping: Case Studies in the Edwards Limestone, Texas, USA and Sulfide-Rich Quartz Veins from the Ladakh Batholith, Northern Pakistan. Minerals 2020, 10, 967. [Google Scholar] [CrossRef]
- Hubbard, B.E.; Gallegos, T.J.; Stengel, V. Mapping Abandoned Uranium Mine Features Using Worldview-3 Imagery in Portions of Karnes, Atascosa and Live Oak Counties, Texas. Minerals 2023, 13, 839. [Google Scholar] [CrossRef]
- Kayet, N.; Pathak, K.; Singh, C.P.; Chowdary, V.M.; Bhattacharya, B.K.; Kumar, D.; Kumar, S.; Shaik, I. Vegetation health conditions assessment and mapping using AVIRIS-NG hyperspectral and field spectroscopy data for-environmental impact assessment in coal mining sites. Ecotoxicol. Environ. Saf. 2022, 239, 113650. [Google Scholar] [CrossRef]
- Lotfi, M.; Arefi, H.; Bahroudi, A. Investigating alteration zone mapping using EO-1 Hyperion imagery and airborne geophysics data. J. Min. Environ. 2020, 11, 405–417. [Google Scholar] [CrossRef]
- Mehdikhani, B.; Imamalipour, A. ASTER-Based Remote Sensing Image Analysis for Prospection Criteria of Podiform Chromite at the Khoy Ophiolite (NW Iran). Minerals 2021, 11, 960. [Google Scholar] [CrossRef]
- Pournamdari, M.; Hashim, M.; Pour, A.B. Application of ASTER and Landsat TM Data for Geological Mapping of Esfandagheh Ophiolite Complex, Southern I ran. Resour. Geol. 2014, 64, 233–246. [Google Scholar] [CrossRef]
- Wang, Y.L.; Wang, R.; Yan, Z.Q.; Zhang, X.M.; Li, X.L.; Xu, C.L. Extraction of structural alteration information and prospecting prediction in Delong area of Qinghai Province using GF-2 and ASTER data. Remote Sens. Nat. Resour. 2023, 36, 1–10. (In Chinese) [Google Scholar]
- Wu, Z.C.; Guo, F.S.; Liu, L.Q.; Xie, C.F.; Jiang, Y.B. Application of remote sensing alteration anomaly extraction with the method of composite algorithm based on TM/ETM images. Geol. Explor. 2013, 49, 511–522. (In Chinese) [Google Scholar]
- Zhang, C.; Ye, F.W.; Xu, Q.J.; Liu, H.C.; Meng, S. Mineral mapping and analysis of alteration characteristics using airborne hyperspectral remote sensing data in the Baiyanghe uranium and beryllium ore district, Xinjiang. Remote Sens. Land Resour. 2017, 29, 161–166. (In Chinese) [Google Scholar]
- Liang, S.N.; Gan, P.P.; Yan, B.K.; Wei, H.Y.; Xiao, C.C. Study on the relationship between mineral composition and spectral characteristics of chlorite. Spectrosc. Spectr. Anal. 2014, 34, 1764–1768. (In Chinese) [Google Scholar]
- Zhai, W.Y.; Chen, L.; Xu, Y.X.; Kong, X.Y. Quantitative inversion of influencing factors of carbonate minerals by spectral absorption depth and application analysis. Spectr. Spectr. Anal. 2021, 41, 2227–2232. (In Chinese) [Google Scholar]


| Item | Terra (ASTER) | ZY1-02D (AHSI) | |
|---|---|---|---|
| Spectral range | |||
| VL/NIR | 0.52~0.60 μm | 0.396–1.04 μm (b1–b76) | |
| 0.63~0.69 μm | |||
| 0.76~0.86 μm | |||
| SWIR | 1.60~1.70 μm | 1.005–2.501 μm (b77–b166) | |
| 2.145~2.185 μm | |||
| 2.185~2.225 μm | |||
| 2.235~2.285 μm | |||
| 2.295~2.365 μm | |||
| 2.360~2.430 μm | |||
| TIR | 8.125~8.475 μm | Null | |
| 8.475~8.825 μm | |||
| 8.925~9.275 μm | |||
| 10.25~10.95 μm | |||
| 10.95~11.65 μm | |||
| PAN | |||
| Spatial resolution | VL/NIR | 15 m | 30 m |
| SWIR | 30 m | ||
| TIR | 90 m | ||
| PAN | Null | ||
| Spectral resolution | VL/NIR | Null | 10 nm |
| SWIR | 20 nm | ||
| TIR | Null | ||
| PAN |
| Interpretation Marker | Type | Data/Method Used | Description Characteristics |
|---|---|---|---|
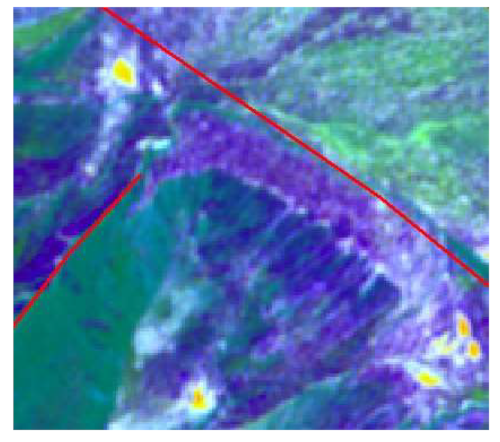 | Fault | Principal component analysis of bands 1, 2, 3, and 4 (RGB: pc1, pc3, pc4) | A sizable colored line or colored boundary |
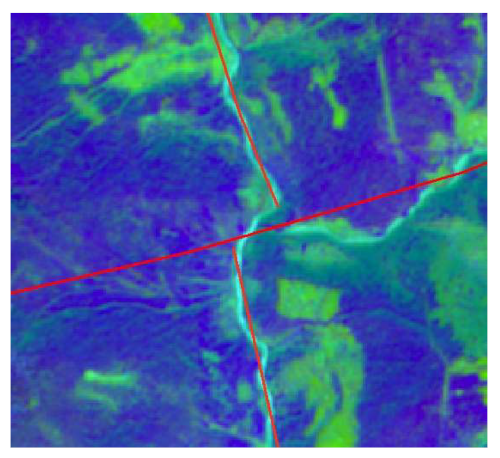 | Fault | Principal component analysis of bands 1, 2, 3, and 4 (RGB: pc1, pc3, pc4) | Anomalous watercourse abruptly bends at right angles, then resumes its original direction and continues extending |
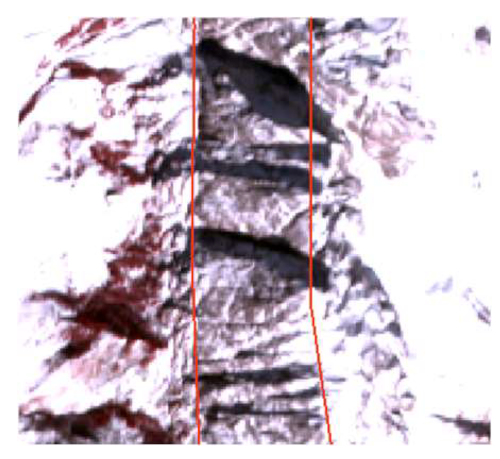 | Fault | ASTER (RGB: 321) | Translated linear extension imagery with patchy or mottled patterns, characterized by fine textures within the area, featuring fragmented blocks often appearing as small patches |
 | Fault | ASTER (RGB: 321) | Translated mountain ridge faults and mountain displacement, where in parts of the mountain range originally oriented northeast, there are local dislocations. The continuous ridge is offset |
 | Magmatic ring | ASTER (RGB: 321) | Translated circular structure caused by volcanic activity. The large ring is composed of multiple cycles of rings, while the small rings often appear obscure. These volcanic rings indicate past underground magma activity in the area |
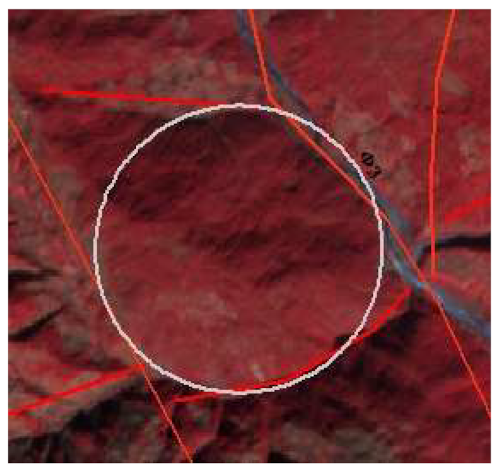 | Structural ring | ASTER (RGB: 321) | Structural rings often remain intact in the middle despite being cut by fault structures around them, forming features with nearly circular patterns |
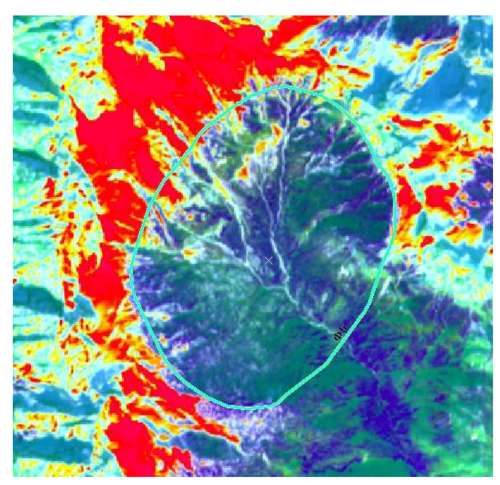 | Intrusive rock formation ring | Principal component analysis of bands 1, 2, 3, and 4 (RGB: pc1, pc3, pc4) | Translated intrusive rocks, which are magma products that have not surfaced in the region, closely related to underground rock bodies. They exhibit a distinct center, with radial fractures and joints around them, resembling a radial bursting pattern |
| (a) Eigenvectors | PC1 | PC2 | PC3 | PC4 |
|---|---|---|---|---|
| Band 1 | −0.478906 | −0.539819 | −0.692171 | −0.011992 |
| Band 3 | −0.814557 | −0.020538 | 0.579694 | −0.005393 |
| Band 6 | −0.230614 | 0.615599 | −0.308632 | −0.68746 |
| Band 7 | −0.2323 | 0.573769 | −0.299333 | 0.726104 |
| (b) Eigenvectors | PC1 | PC2 | PC3 | PC4 |
| Band 1 | −0.448528 | −0.514381 | −0.719857 | −0.126653 |
| Band 3 | −0.790672 | −0.152735 | 0.58637 | 0.087638 |
| Band 5 | −0.351592 | 0.725998 | −0.201973 | −0.555443 |
| Band 8 | −0.223705 | 0.43013 | −0.311742 | 0.817167 |
| (c) Eigenvectors | PC1 | PC2 | PC3 | PC4 |
| Band 1 | 0.63034 | 0.204404 | 0.744642 | 0.079998 |
| Band 2 | 0.730161 | 0.17149 | −0.656654 | −0.079134 |
| Band 5 | 0.194764 | −0.727934 | 0.104675 | −0.649016 |
| Band 8 | 0.177776 | −0.631603 | −0.057944 | 0.752407 |
| (d) Eigenvectors | PC1 | PC2 | PC3 | PC4 |
| Band 1 | −0.510673 | −0.373236 | 0.312665 | 0.708624 |
| Band 2 | −0.596764 | −0.30381 | 0.248685 | −0.699806 |
| Band 3 | −0.617865 | 0.562234 | −0.542232 | 0.090113 |
| Band 4 | −0.03646 | 0.672523 | 0.739176 | 0.001801 |
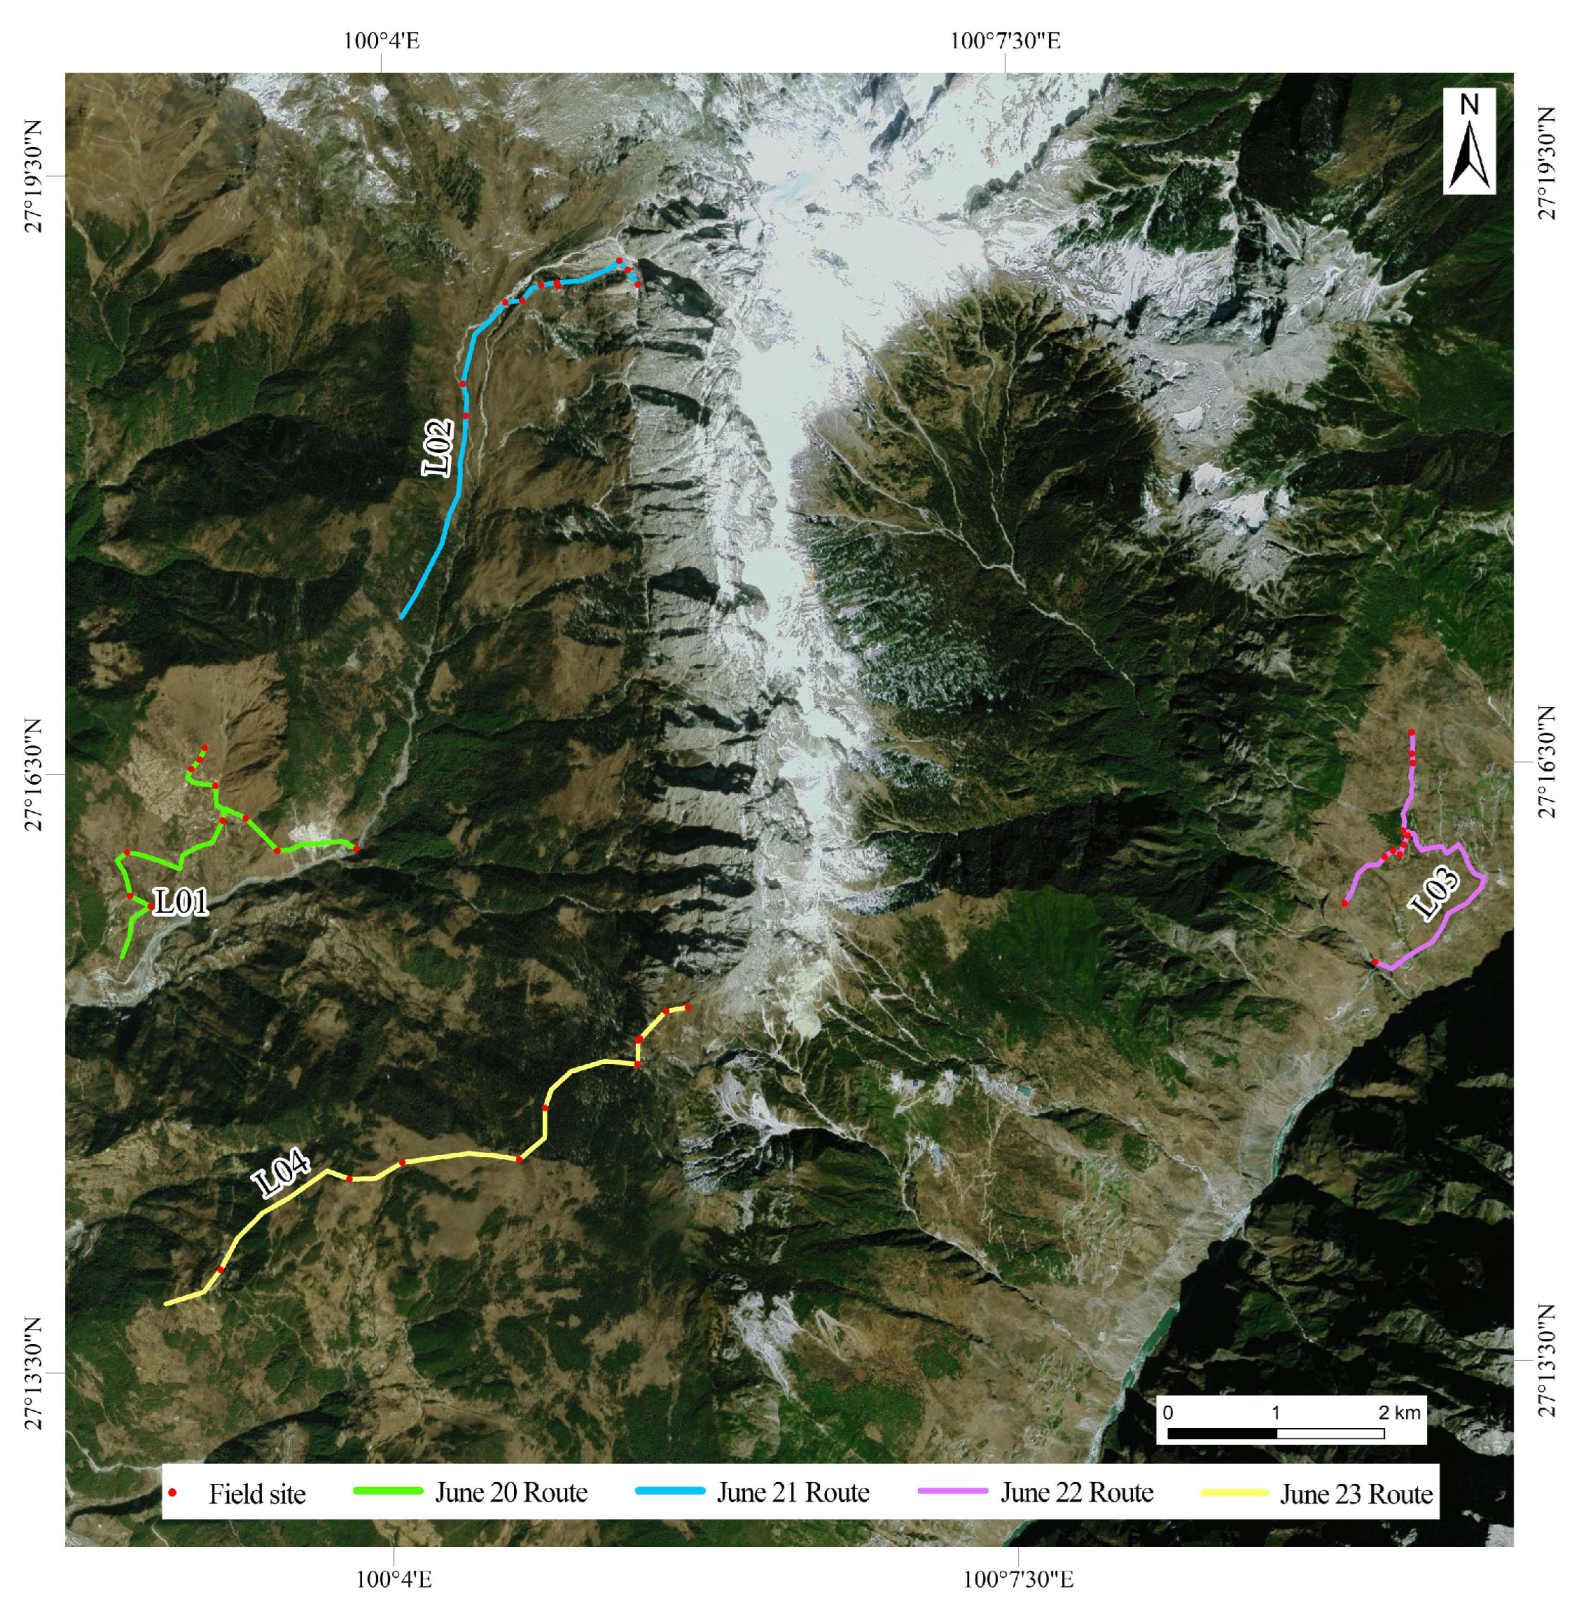
| Line Number | Field Verification Points | Field Sampling Points |
|---|---|---|
| L01 | 1–11 | 1–10 |
| L02 | 12–22 | 16–18, 21 |
| L03 | 22–32 | 23, 28–31 |
| L04 | 33–42 | 33–38 |
Disclaimer/Publisher’s Note: The statements, opinions and data contained in all publications are solely those of the individual author(s) and contributor(s) and not of MDPI and/or the editor(s). MDPI and/or the editor(s) disclaim responsibility for any injury to people or property resulting from any ideas, methods, instructions or products referred to in the content. |
© 2024 by the authors. Licensee MDPI, Basel, Switzerland. This article is an open access article distributed under the terms and conditions of the Creative Commons Attribution (CC BY) license (https://creativecommons.org/licenses/by/4.0/).
Share and Cite
Hu, Y.; Zhao, Z.; Zhang, X.; Feng, L.; Qin, Y.; Ouyang, L.; Huang, Z. Geological Study Based on Multispectral and Hyperspectral Remote Sensing: A Case Study of the Mahuaping Beryllium–Tungsten Deposit Area in Shangri-La. Sustainability 2024, 16, 6387. https://doi.org/10.3390/su16156387
Hu Y, Zhao Z, Zhang X, Feng L, Qin Y, Ouyang L, Huang Z. Geological Study Based on Multispectral and Hyperspectral Remote Sensing: A Case Study of the Mahuaping Beryllium–Tungsten Deposit Area in Shangri-La. Sustainability. 2024; 16(15):6387. https://doi.org/10.3390/su16156387
Chicago/Turabian StyleHu, Yunfei, Zhifang Zhao, Xinle Zhang, Lunxin Feng, Yang Qin, Liu Ouyang, and Ziqi Huang. 2024. "Geological Study Based on Multispectral and Hyperspectral Remote Sensing: A Case Study of the Mahuaping Beryllium–Tungsten Deposit Area in Shangri-La" Sustainability 16, no. 15: 6387. https://doi.org/10.3390/su16156387
APA StyleHu, Y., Zhao, Z., Zhang, X., Feng, L., Qin, Y., Ouyang, L., & Huang, Z. (2024). Geological Study Based on Multispectral and Hyperspectral Remote Sensing: A Case Study of the Mahuaping Beryllium–Tungsten Deposit Area in Shangri-La. Sustainability, 16(15), 6387. https://doi.org/10.3390/su16156387