Abstract
To contribute to the realization of the goal of carbon peak and carbon neutrality, the non-polluting and sustainable nature of new energy sources such as wind, photovoltaic power, and energy storage has gained widespread attention, and new-energy distributed power generation technology is being applied on a large scale. Due to the high penetration, decentralization, and source–load uncertainty in new-energy distributed power generation, the traditional centralized regulation and control method struggles to meet the demand for scheduling flexibility in a distribution network. Hence, a cluster-optimization scheduling method for distribution networks considering source–load–storage synergy is proposed in this paper. Firstly, by using the comprehensive index of cluster-active power balance and electrical-distance modularity as the objective function, a simulated annealing algorithm is proposed to improve the genetic algorithm for solving a distribution network cluster division model. Then, based on the results of the distributed cluster segmentation, an optimal scheduling model is established, with the objective of minimizing the comprehensive operating costs by considering clusters as units. Inter-cluster power interactions are then used to reduce cluster operating costs and to meet intra-cluster power balance requirements by automatically setting time-sharing tariffs between the clusters. Finally, an IEEE33 node system is taken as an example for verification. The results show that the proposed distribution network cluster division method has better electrical coupling and active power balance and that the optimal scheduling method of clusters can effectively reduce the system operation costs. Hence, the method studied in this paper can increase the flexibility of regional distribution grid scheduling and the reliability of the power supply, reduce regional energy mobility to reduce energy consumption, improve the utilization efficiency of energy, and promote the sustainable development of new energy access to the distribution network.
1. Introduction
The development of renewable energy is an important step towards achieving peak carbon and carbon neutrality. Meanwhile, in order to cope with the problems of energy depletion and environmental pollution, new energy power-generation technology has attracted widespread attention in the world, with sustainable new energy represented by wind and light developing rapidly in recent years [1,2]. However, a large number of distributed generators (DGs) using wind and photovoltaic (PV) power have been connected to distribution grids in a decentralized manner, which has resulted in many challenges in the operational control and economical dispatch of power systems [3,4,5]. At the same time, the intermittent and fluctuating nature of new energy outputs and the mismatch of grid-load timing have become more and more prominent, leading to a gradual decline in the ability to consume DG [6]. Hence, zonal optimal operation control of distribution networks is essential to promote the sustainable development of new energy [7,8]; it not only improves energy utilization efficiency but also effectively reduces energy losses, ensuring economic efficiency and reducing environmental impacts. The current operation and control methods of distribution networks can be mainly categorized as centralized optimization control and distributed optimization control [9]. Since traditional centralized regulation and control methods struggle to adapt to the operational requirements of distribution grids with high renewable energy sources access, the theory and methods of optimal distributed dispatch control need to be studied for distribution networks with distributed resource clusters [10].
Cluster-based optimal operational control can make full use of the autonomy of clusters [11,12] to divide loads, distributed generators (DGs), and energy storage (ES) into different clusters. Furthermore, it can effectively deal with the dispersed nature of DG access and any uncertain outputs, as well as achieve efficient operation for each distributed cluster. There are a large number of application cases in real engineering. For example, in the distribution grid of a county in Jiangxi Province, China, research was carried out to study the optimal planning methodology for the photovoltaic energy storage systems of a clustered distribution grid [13]. In addition, clustering technology was used for low-pressure feeders in rural northern Slovakia [14]. Furthermore, some wind farms in Western Europe have used the cluster approach for operational control [15].
The planning of distribution networks by considering clusters as units mainly involves the division of clusters [16,17] and scheduling control [18,19]. The research on cluster partitioning focuses primarily on cluster partitioning algorithms and cluster partitioning metrics. In [20], an improved genetic algorithm was used to solve the partitioning of distribution network clusters, and a new chromosome coding method was designed based on a network adjacency matrix. In [21], a hierarchical aggregation clustering algorithm was employed to simplify for determining the location of distributed power sources during distribution network planning. In [22], an electrical distance modularity index was used to divide up clusters, and a particle swarm algorithm (PSO), genetic algorithm (GA), and K-means combined with an intelligent algorithm were used to solve this cluster division. This combined method improved the effect of cluster division in distribution networks, but its computational complexity was high. In [23], an electrical distance metric with the ability to regulate voltage was used as a distribution network cluster segmentation model based on voltage-active and -reactive sensitivity matrices, which were solved via a taboo search algorithm. In [24], hierarchical clustering was employed to cluster distribution networks by combining electrical distance and cohesion metrics. In [25], the degree of modularity, active power balance, and net load fluctuation were applied to construct a comprehensive index system for cluster delineation. In [26], an improved modularity index combining greedy algorithms for cluster segmentation was proposed to optimize cluster voltage control, integrating inter-node reactive voltage sensitivity and regional reactive power balance.
Based on those studies, we can see that the existing cluster division index mainly focuses on the electrical coupling between nodes based on the operating state of the distribution network. At the same time, the algorithm to be solved is relatively single or computationally complex, and the optimization result has a local optimal solution.
In terms of the scheduling and optimization of the clusters, scheduling and managing the clusters as a whole unit under a single control command is easy. In [27], a two-phase distributed optimal scheduling approach was proposed. It considered the robust balance between the supply and demand of distribution network flexibility. A distributed cluster optimal scheduling model was established based on cluster segmentation, with the objective of minimizing daily operating costs. The focus of the study in [28] was a distributed-generation scheduling strategy with a virtual power source. The virtual power source consisted of wind and photovoltaic power and a pumped storage; the flexibility of the virtual power and time-sharing tariff mechanism was used to establish a coordinated scheduling model, with the objective of optimizing being maximizing profits. In [29], a two-tier optimal scheduling method considering energy sharing for a micro-grid cluster clustered distribution system was proposed. The minimum daily operating cost of micro-grid clusters was modeled in the upper tier. The lower-tier optimization objectives were used to minimize the operating costs of the distribution network and the peak-to-valley difference in net loads. In [30], through cluster division, a planning model was established with the objective of maximizing the consumption of distributed power sources within a cluster. In [31], the results of cluster segmentation were applied to optimize wind power outputs, thus reducing fluctuations in wind power output. Based on the above studies, we can see that research on optimal scheduling models for clusters has given less consideration to the economic impact of inter-cluster power transfer and that existing optimization operation strategies struggle to take into account the optimization of energy storage timing outputs.
In summary, the aim of this paper is to study and analyze distribution network cluster division and optimal scheduling. The problem of the complementary power characteristics of the nodes within a cluster in distribution network cluster division indexes not being considered much, the problem of a long calculation time and the insufficient accuracy of cluster division algorithms, and the problem of inter-cluster power interaction in the optimal scheduling model of distribution network clusters are studied and analyzed here. At the same time, in order to give full play to the regional autonomy of the distribution network, improve the economic efficiency, and alleviate the pressure power supply of the grid, the degree of coupling between the distribution network cluster delineation metrics and the cluster optimization scheduling model is further considered. Finally, an optimal scheduling method for distribution network clusters considering source–load–storage synergy is proposed. Operational controls are narrowed down as much as possible to distribution network clusters to improve energy use efficiency and the speed and flexibility of distribution network operations, promoting the sustainable development of new energy properties in distribution networks.
Firstly, in order to achieve and take full advantage of the objective of distributed cluster scheduling, an electrical distance modularity index and an improved active power balance index were used to construct a comprehensive index for cluster division. The idea of annealing, taken from a simulated annealing algorithm, was then introduced to improve the speed of the GA algorithm to solve cluster partitioning. Then, from the results of the cluster division, an optimal scheduling model with the objective of minimizing the integrated operating costs of clusters was established by treating clusters as units. Inter-cluster power interactions through self-setting time-sharing tariffs between clusters reduce cluster operating costs and satisfy intra-cluster power balance. Finally, an example analysis is carried out with an IEEE33 node distribution system to verify the validity and rationality of the proposed schedule.
2. Distribution Network Clustering Division Methodology
2.1. Modularity Metrics Based on Electrical Distance
An electrical distance is defined here using a voltage sensitivity matrix. The active and reactive power–voltage sensitivity matrices can be calculated using the current correction equations from Newton’s Raphson method in polar form [32], the specific formulas of which are as follows:
where is the change in active power injected by the node, measured in kW; is the change in reactive power injected at the node, measured in kvar; is the change in phase angle of the node voltage, measured in degrees; is the change in node voltage amplitude, measured in degrees; is the active power–voltage phase angle sensitivity matrix; is the active power–voltage magnitude sensitivity matrix; is the reactive power–voltage phase angle sensitivity matrix; and is the reactive power–voltage magnitude sensitivity matrix.
The active voltage sensitivity matrix can be obtained by making , and the reactive voltage sensitivity matrix can be obtained by making . Their formulas are as follows:
where is the active voltage sensitivity matrix. is the reactive voltage sensitivity matrix. The relationship between node and node is defined as follows:
where is the sum of the ratio of the change in voltage of node to that of node when the reactive power and active power change; and are the active and reactive node voltage sensitivities of node itself, respectively; and and are the active and reactive nodal voltage sensitivities between nodes, respectively.
Considering the correlation between the electrical distance between two nodes and other nodes in the network, the electrical distance between each node is calculated based on the Euclidean distance with the following formula.
Modularity metrics is often used to solve partitioning problems in complex networks [33]. The modularity value ranges from 0 to 1; if the modularity index is larger, the similarity of nodes inside the cluster is higher, and vice versa. The module degree metric is defined as follows [34,35,36]:
where is the sum of all edge weights in the whole network; is the weight of the edge connecting node and node ; and are the sum of the weights of all connected edges of nodes and , respectively; and indicates that the two node regions belong to the same state, taking a value of 1 when node and node belong to the same cluster and 0 otherwise.
2.2. Improved Active Power Balance Metrics
In terms of functionality, in order to improve the local consumption capacity of a DG within the cluster and to reduce backward transmission of power from the cluster, the complementary power characteristics of the source and load storage within the cluster should be made as strong as possible. Adopting the degree of active power balance combined with the cluster’s consumption capacity as the classification index, the degree of active power balance is expressed as follows [37,38]:
where is the active balance of cluster ; is the length of time, chosen as 24 in this paper; and is the net power of cluster at time .
Cluster consumption refers to the ability to represent its consumption level, which can further reflect the balance degree of source–charge–storage. The active sensitivity parameter is utilized to describe the active power consumption capability. The active power consumption index is expressed as follows:
where is the active sensitivity of cluster , is the total active dissipation capacity that can be provided by the DGs and ES in cluster , is the minimum active power required, is the voltage increment of node , and is the active voltage sensitivity of node in cluster .
When the power that the DGs and ES provide is insufficient, let . Otherwise, let . Then, the improved active power balance index can be expressed as follows.
where is the active balance of the whole network, is the number of cluster divisions, and is the weighting factor.
2.3. Comprehensive Metrics for Clustering Division
According to the principles of the classification of clusters, the main characteristics to consider are structure and function [39]. In terms of structure, to facilitate the operation and management of a cluster, the evaluation index is expressed as a modularity index based on electrical distance. In terms of function, traditional nodes are replaced by clusters, mainly for power matching. Giving full play to the complementary characteristics of the source, load, and storage within a cluster that helps improve its active power matching, the evaluation index is expressed by the improved cluster active power balance degree. Hence, the comprehensive indicator for cluster division is expressed as follows:
where is a comprehensive indicator of cluster classification, and are weighting factors, is a modularity indicator, and is the active power balance indicator.
2.4. Cluster Segmentation Algorithm
In this paper, the simulated annealing genetic algorithm (SAGA) is used to divide the clusters. In the process of solving, the comprehensive index of cluster division is taken as the applicability function. A flowchart of the SAGA algorithm is shown in Figure 1.
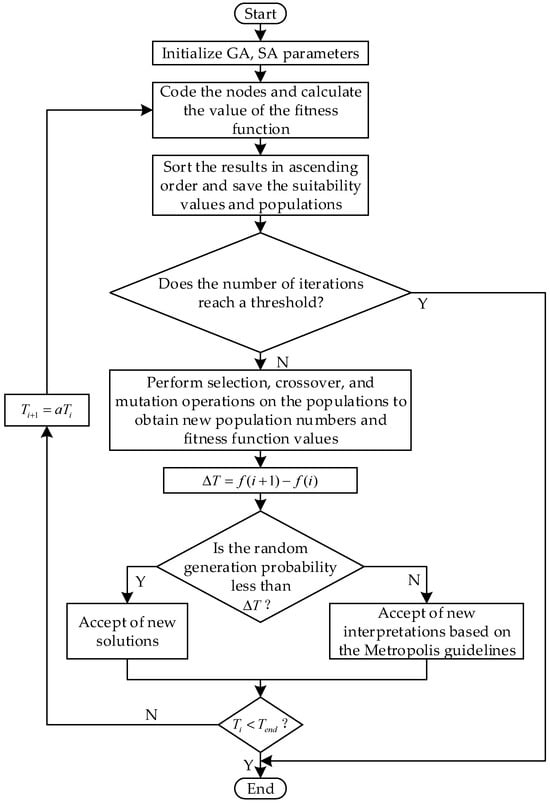
Figure 1.
Flowchart of the SAGA algorithm.
The global search capability of the genetic algorithm ensures that the optimal solution is gradually approached as the number of iterations increases [40]. When the number of iterations increases, the evolutionary capacity declines. As a result, the algorithm is highly likely to converge locally, which results in precociousness [41]. The core idea behind simulated annealing (SA) is to find an approximate global solution to the optimization problem by simulating a high-temperature annealing process, and then to continue the search after jumping out of the local optimum until the globally optimal solution is obtained [42,43].
The Metropolis criterion for annealing is introduced on top of the genetic algorithm to generate new solutions, and a cooling function is introduced to control the temperature decay to perform an annealing operation on the population. The cooling function and Metropolis criterion are shown in the following:
where is the value of the fitness function for generation , is the current temperature, and is the annealing temperature coefficient.
3. An Economic Optimal Dispatch Model for Distribution Network Clusters
3.1. Distribution Network Cluster Structure
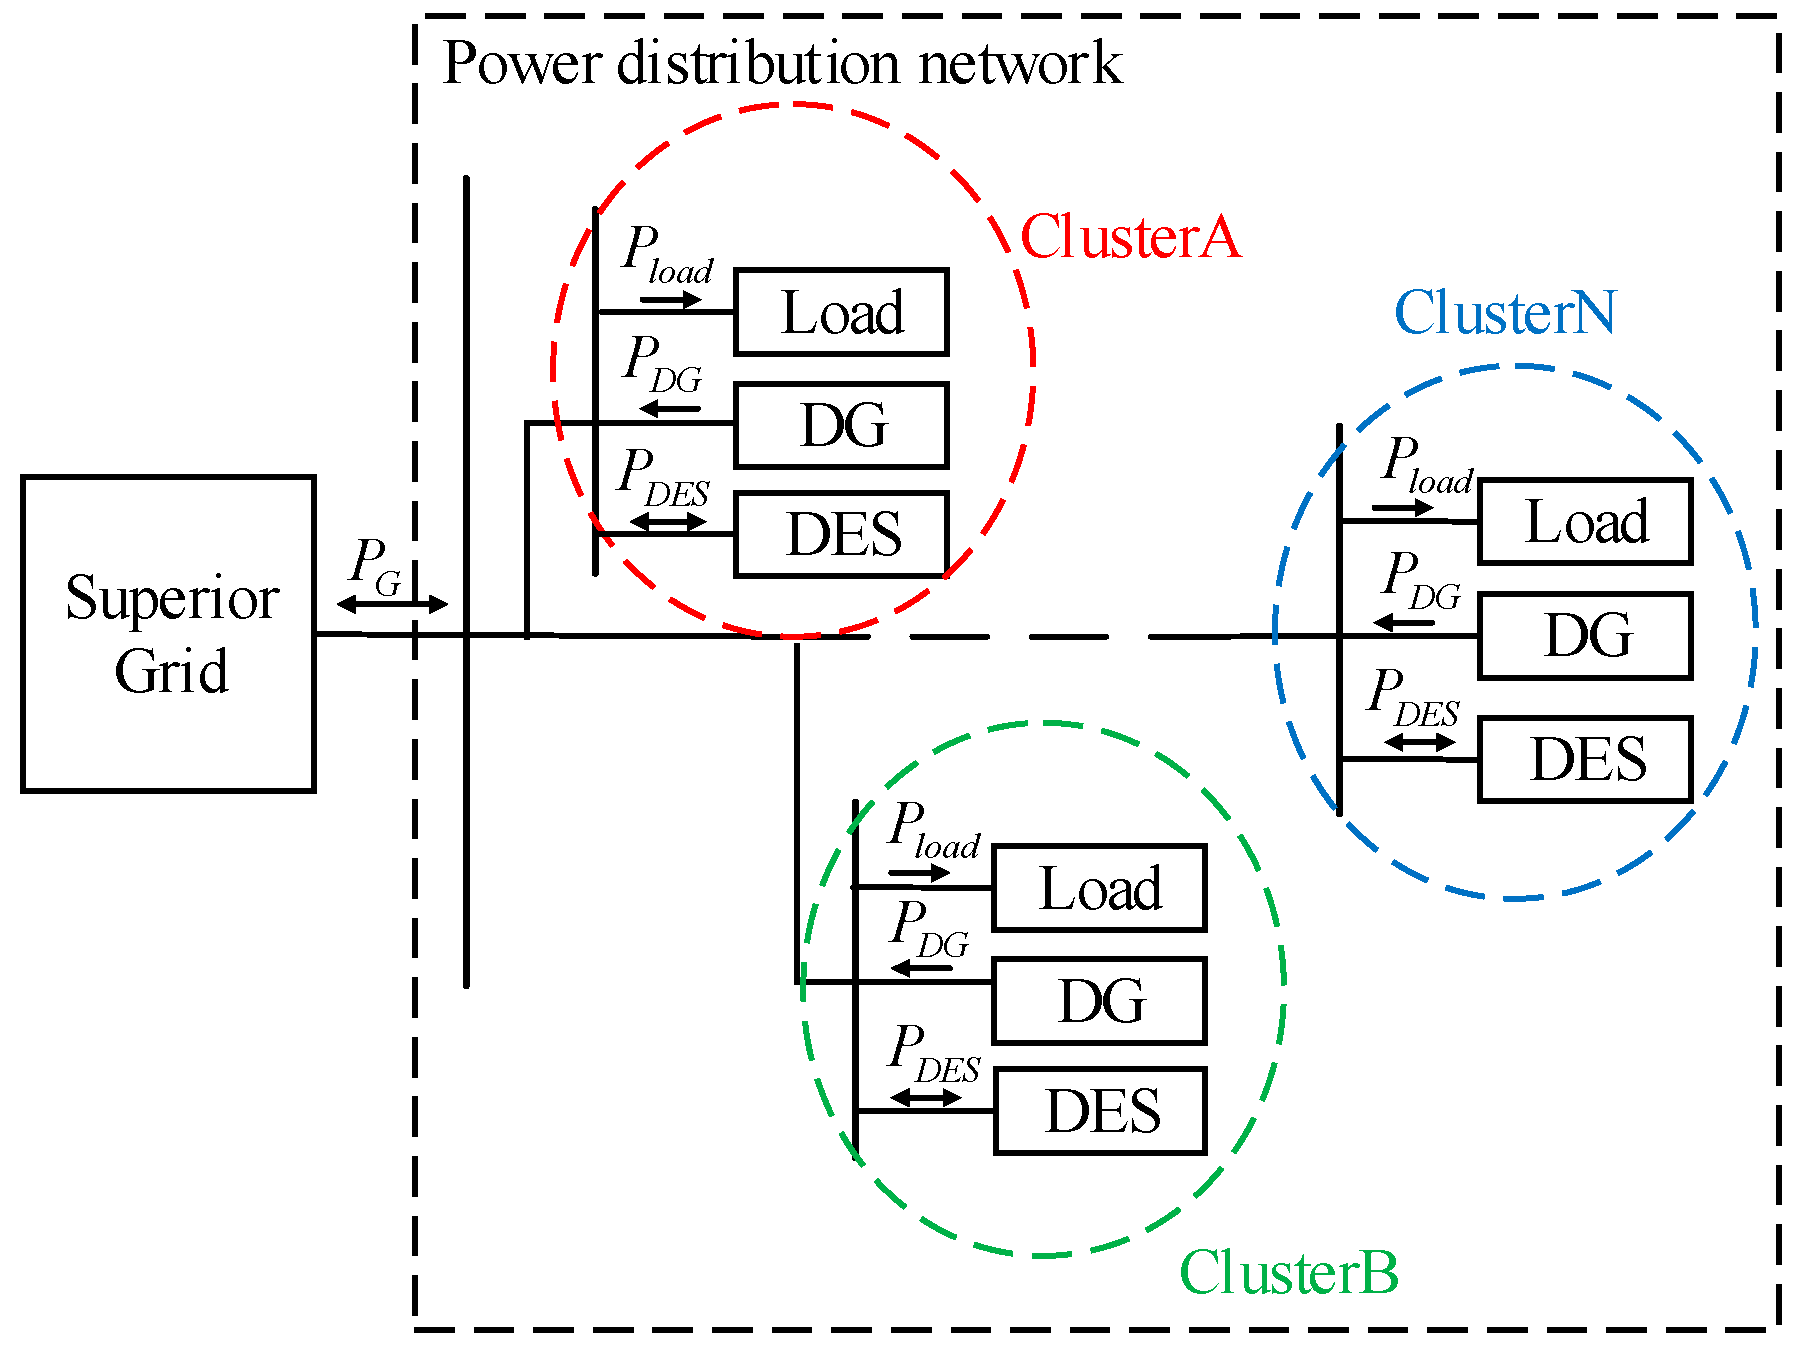
In this paper, a structure diagram is constructed for the distribution network cluster containing the distributed energy storage, as shown in Figure 2.
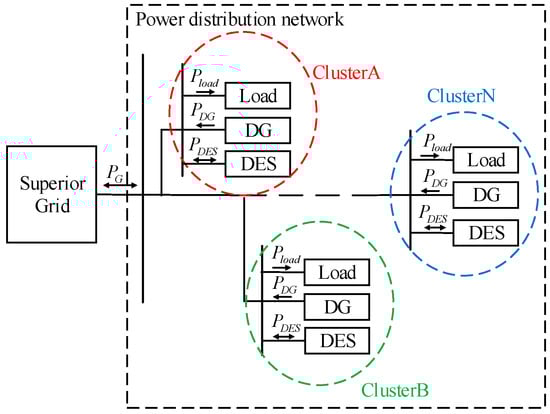
Figure 2.
Distribution network cluster structure.
It mainly includes distributed wind power, photovoltaic and energy storage, and conventional loads. In the loads, DGs and distributed energy storage (DES) are distributed into different clusters according to the characteristics of the nodes within the distribution network. Different-colored regions represent different clusters, and an optimal cluster scheduling strategy is designed according to the loads that can be handled by the different clusters. It prioritizes the full consumption of new energy within the cluster and cluster power balance and reduces the operating costs of the entire distribution system.
3.2. Objective Function
The objective function of optimal scheduling is usually constructed by economic cost [44,45]. The economic optimal dispatch model is based on the cluster being a unit and establishes the minimum daily integrated operating cost of the distribution network as an objective function:
where represents the cost of investment, represents the operation and maintenance (O&M) costs, represents the cost of purchasing and selling electricity for the cluster, represents the inter-cluster power interaction cost, represents the cost of network losses in the distribution network, and represents the cluster’s power penalty for interacting with a higher-level grid.
- 1.
- Investment costs
- 2.
- Operation and maintenance costs
- 3.
- Cluster’s purchase and sale of electricity costs
- 4.
- Inter-cluster power interaction costs
- 5.
- Network loss costs in distribution networks
- 6.
- Cluster interaction power penalties with a higher-level grid
3.3. Restrictive Condition
- Power balance constraint
- 2.
- Cluster and upper-grid power transfer constraints
- 3.
- Inter-cluster power transfer constraints
- 4.
- Energy storage charge/discharge constraints
- 5.
- Energy storage power and capacity constraints
- 6.
- Charge state of energy storage
4. Data and Methods of Simulation
4.1. Data and Method of Distribution Network Cluster Division
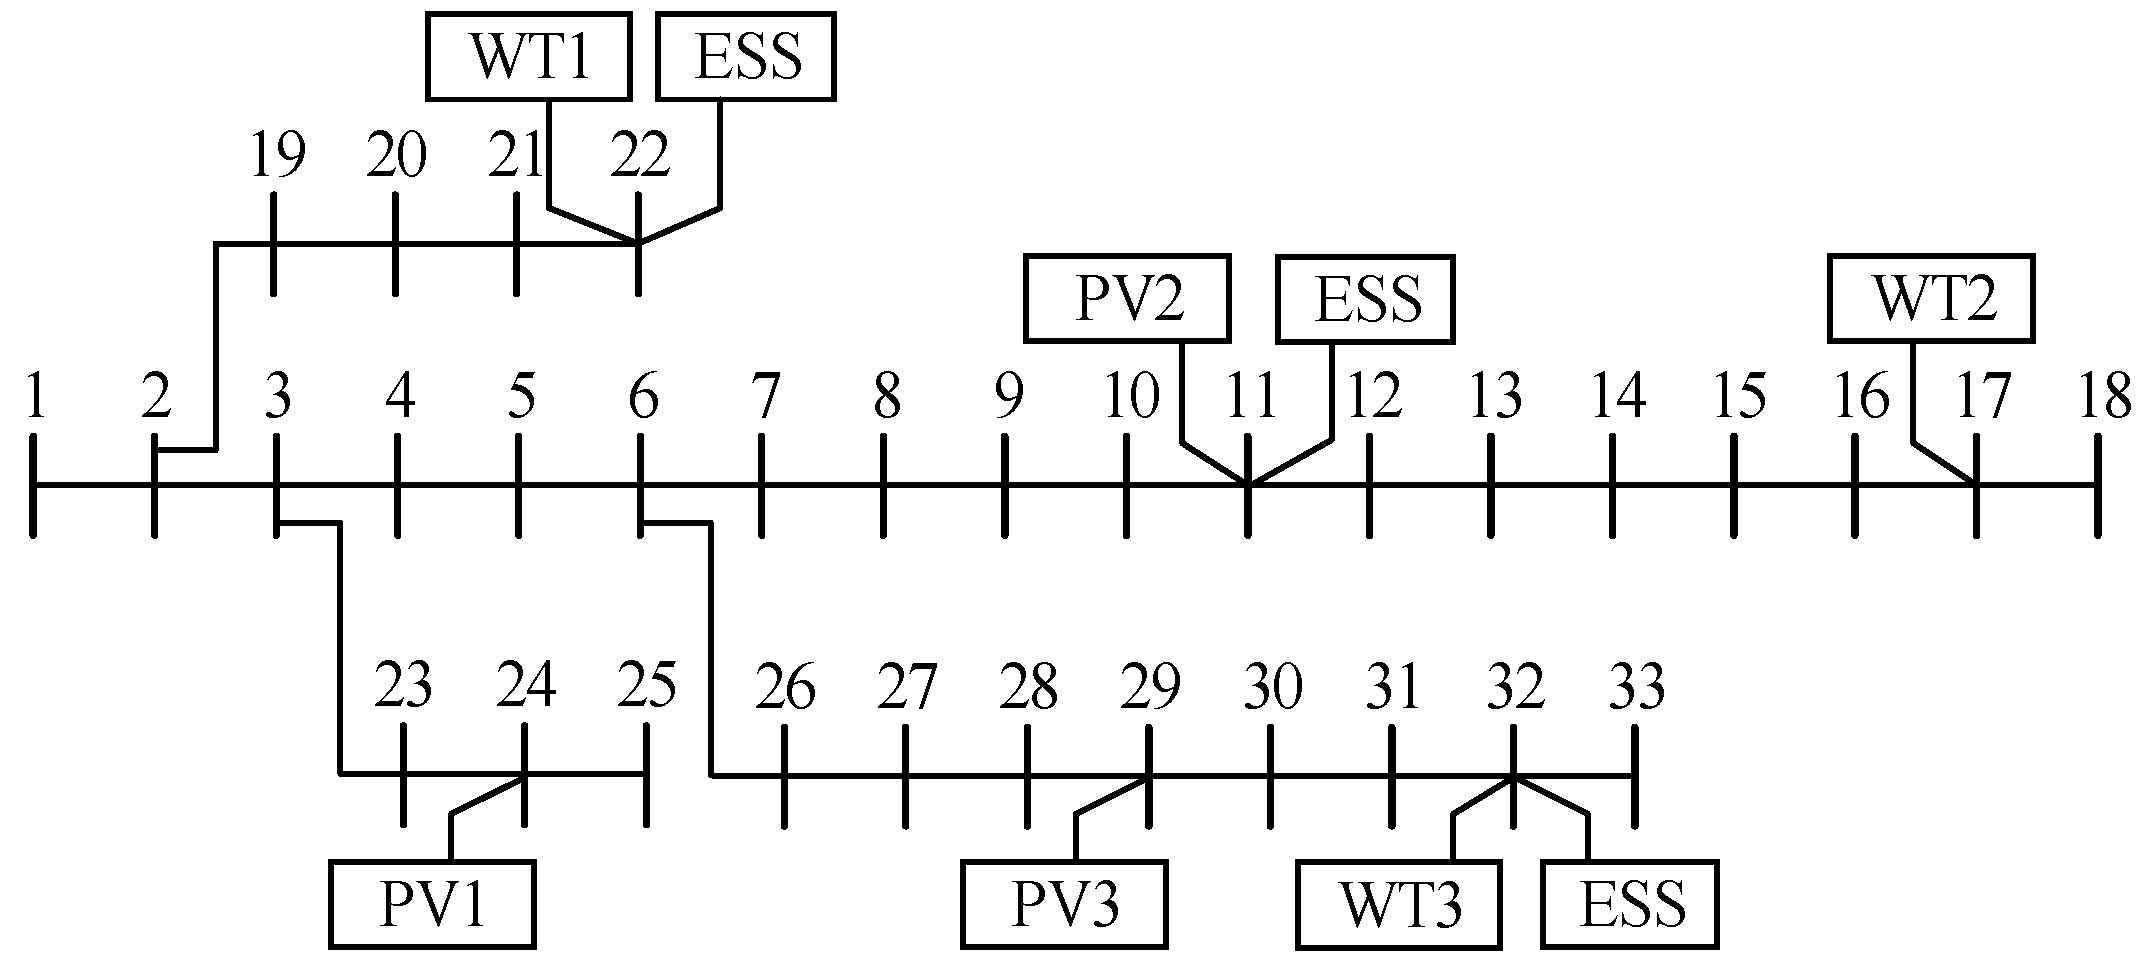
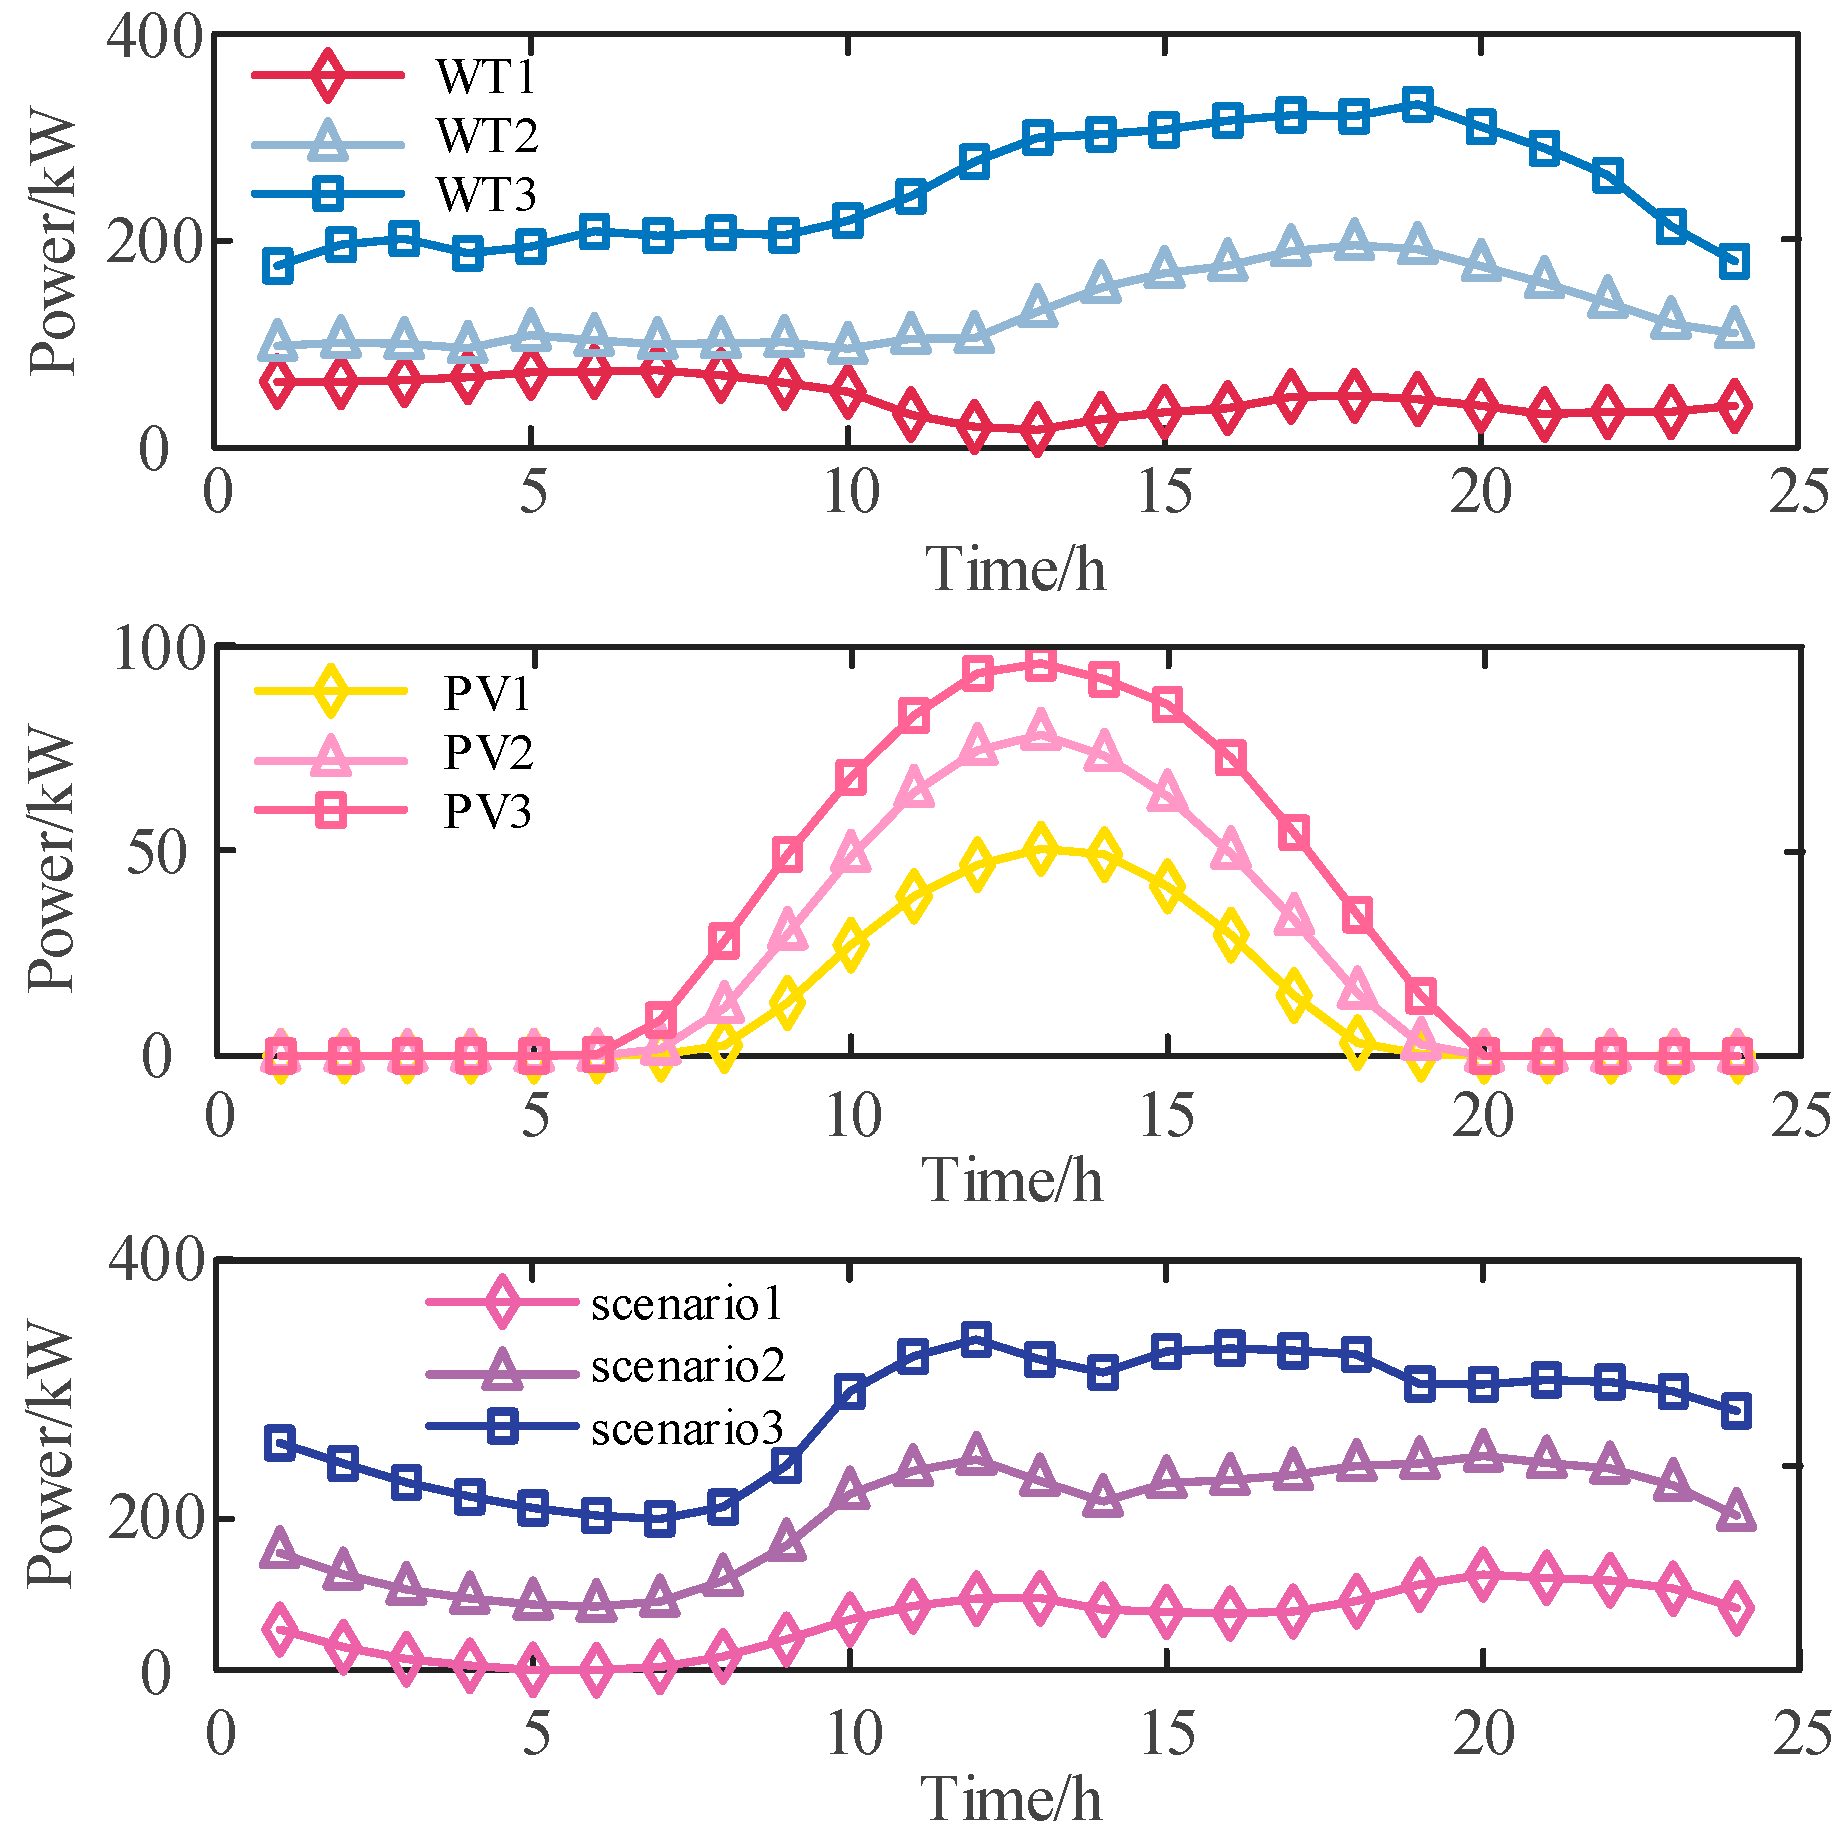
An IEEE33 node power distribution system is used here as an example for simulation and analysis [46]. Nodes 17, 22, and 32 were connected to wind turbines, and nodes 11, 24, and 29 were connected to photovoltaic generators; Nodes 22, 11, and 32 were configured for energy storage with a rated capacity of 300 kW/h. The maximum charging and discharging power was 40 kW, and the upper and lower bounds for the charge state were 0.95 and 0.3. The IEEE33 node power distribution network structure is shown in Figure 3, and typical curves for wind and photovoltaic power outputs and load are shown in Figure 4. The corresponding data of wind and photovoltaic power in the node are shown in Figure 4.
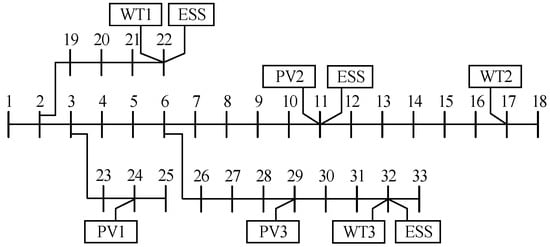
Figure 3.
IEEE33 node power distribution system.

Figure 4.
Typical curves for wind and PV outputs and load.
Typical-day data for the IEEE33 node distribution system were employed to divide up the clusters. SAGA algorithm was set, with the maximum number of iterations being 100, crossover probability being 0.8, mutation probability being 0.3, annealing coefficient being 0.9, and control variables being 32. The number of cluster divisions was limited to three, and the time of the highest permeability of DG in the distribution network, 12:00, was selected to divide the cluster. Both functional and structural indicators were considered. Different weights cause different results during the classification of clusters, so their weights were set the same to ensure performance. Two different scenarios were set up for comparison testing:
Scenario 1: Segmentation of clusters based on modularity metrics and source–load power balance metrics.
Scenario 2: Segmentation of clusters based on modularity metrics and source–load–storage power balance metrics.
4.2. Data and Methods for Optimal Scheduling of Distribution Network Clusters
The proposed cluster optimal scheduling model in this paper uses the YALMIP toolbox in a MATLAB2018bplatform to invoke the CPLEX solver to solve the proposed model.
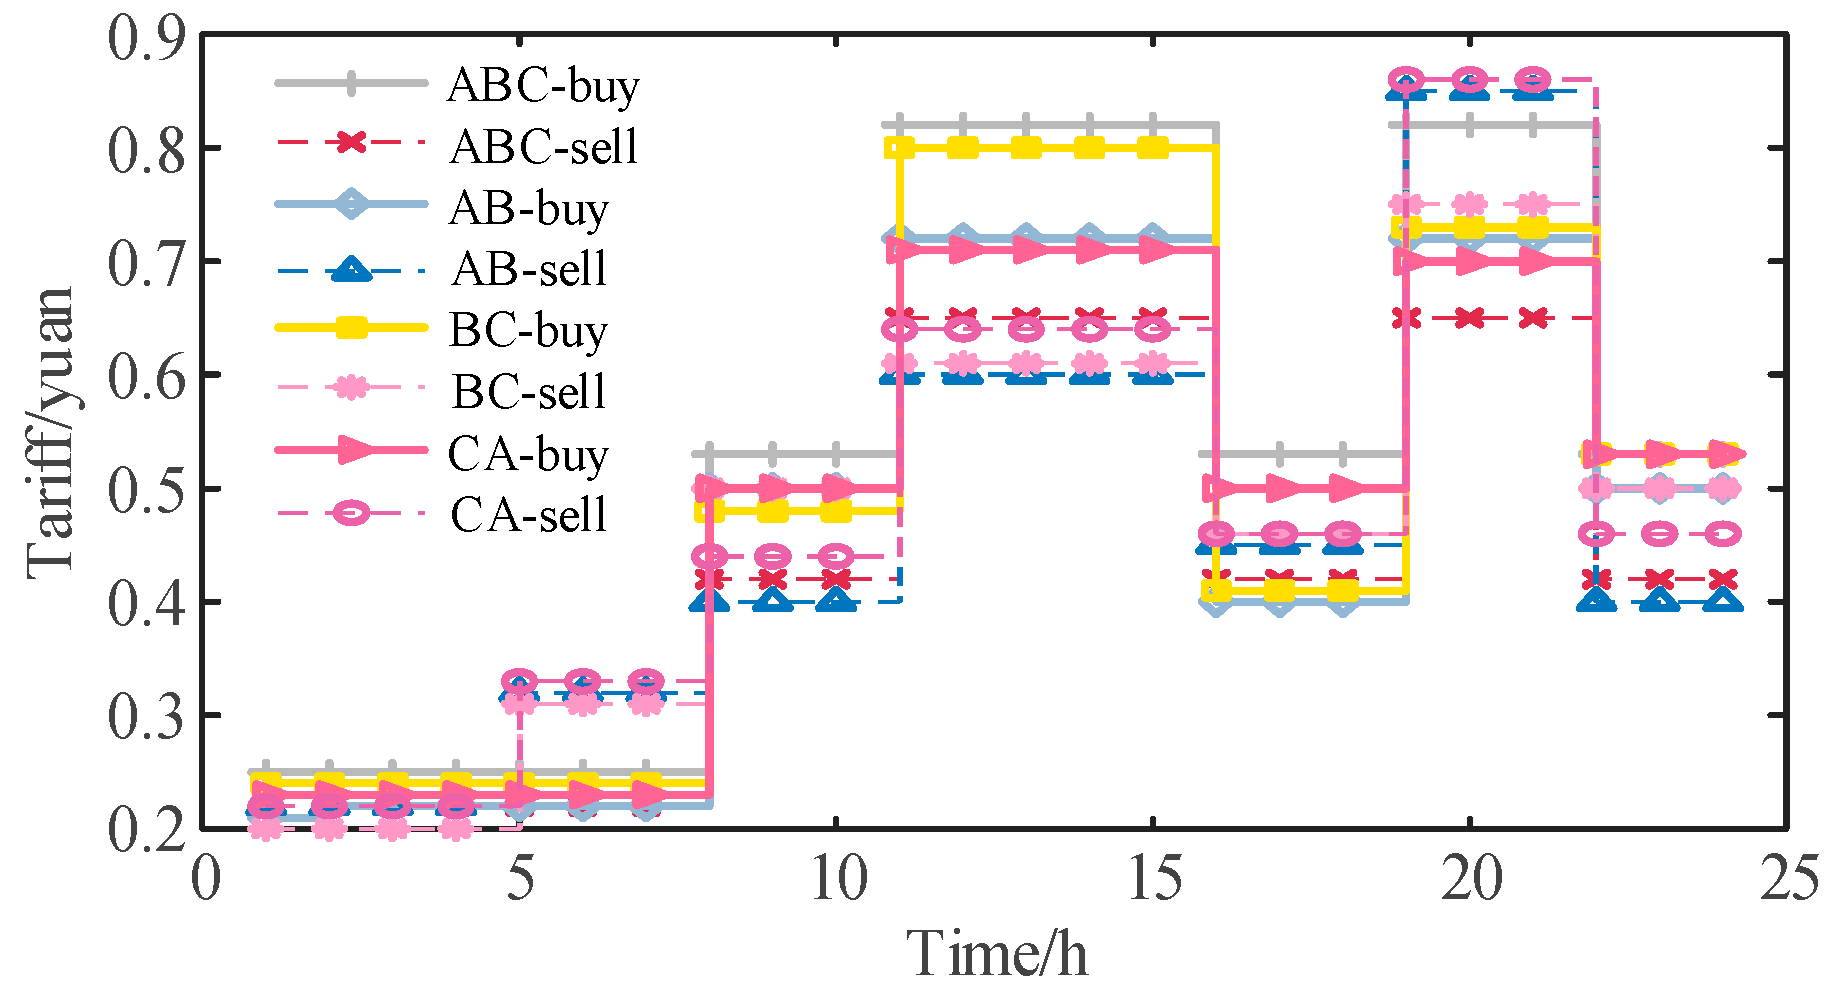
The data involved in the objective function of the cluster optimization scheduling model are shown in Figure 5 and Table 1. The cost parameters for the distributed power and energy storage are shown in Table 1. The purchase/sale price of electricity between clusters and the external grid and other clusters are shown in Figure 5.

Figure 5.
Cluster purchase and sale tariff.

Table 1.
DG and energy storage cost parameters.
The selection of cluster division in scheme 2 was to study the optimal scheduling of distribution network clusters. In order to reflect the effectiveness and superiority of a cluster division intuitively, two different schemes were used for comparison.
Scheme 1: Optimal scheduling without considering cluster partitioning.
Scheme 2: Considering cluster division for optimal scheduling with clusters as units, combined with inter-cluster time-sharing tariffs for power interaction. The purchase of electricity is provided from Cluster A to Cluster B, from Cluster B to Cluster C, and from Cluster C to Cluster A.
5. Results and Discussion of the Experiment
5.1. Results of Distribution Network Clustering Division
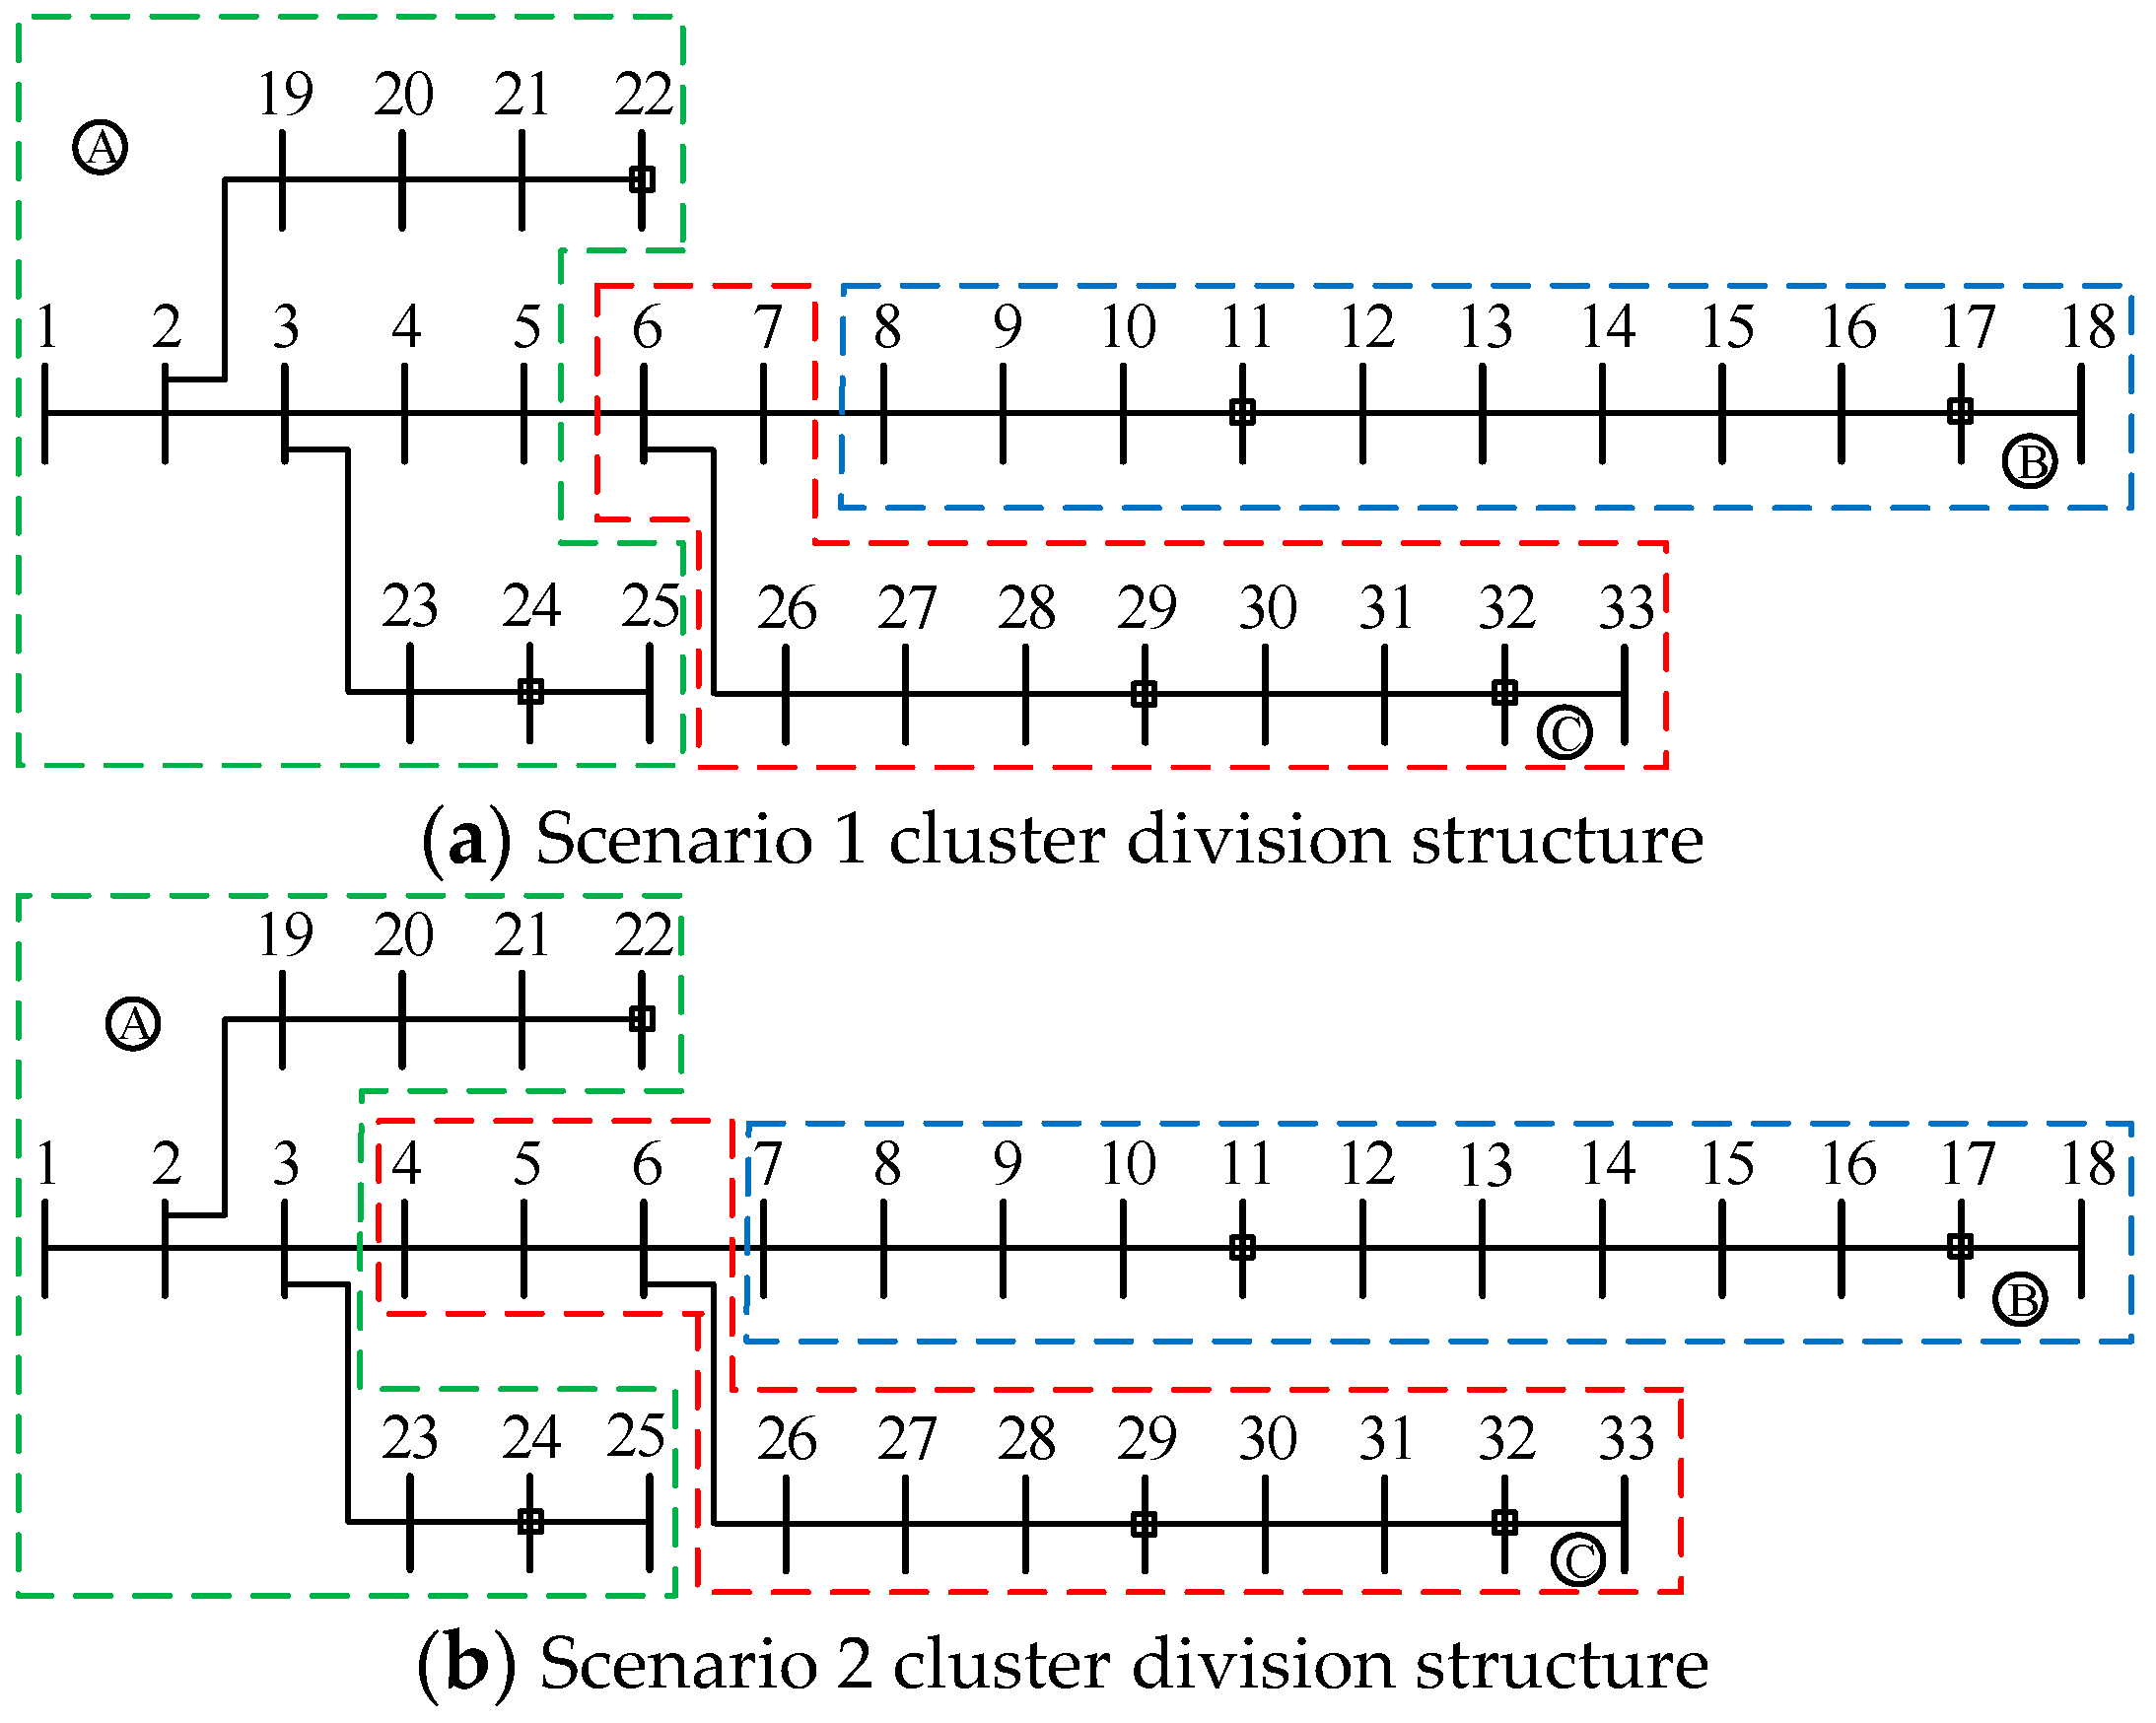
The results of the cluster division for the different schemes are shown in Table 2, and a structure corresponding to the cluster division is shown in Figure 6.
Table 2.
Results of two different clustering programs.
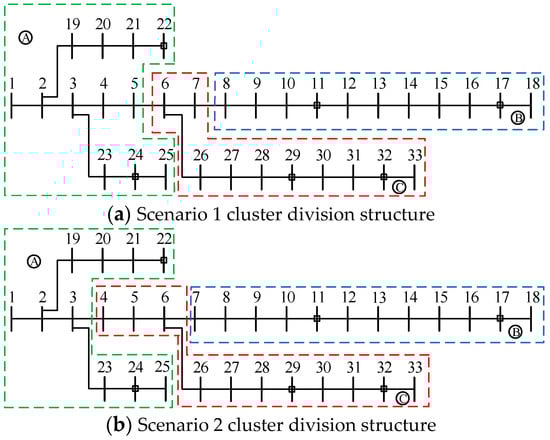
Figure 6.
Structure of clusters division.
We can see from Table 2 that the distribution network for both schemes is divided into three regions and that each region contains a relatively balanced number of nodes with no isolated nodes. As scenario 2 takes the source–load–storage power balance into account, its modularity index decreased by 0.07% compared with that in scenario 1. Although the structural strength of the cluster nodes is slightly weaker, the power balance index increased by 3.03%, and the functionality index significantly improved. The scenario 1 composite indicator is 0.68345, and the scenario 2 composite indicator is 0.6937, an improvement of 1.4% over the former.
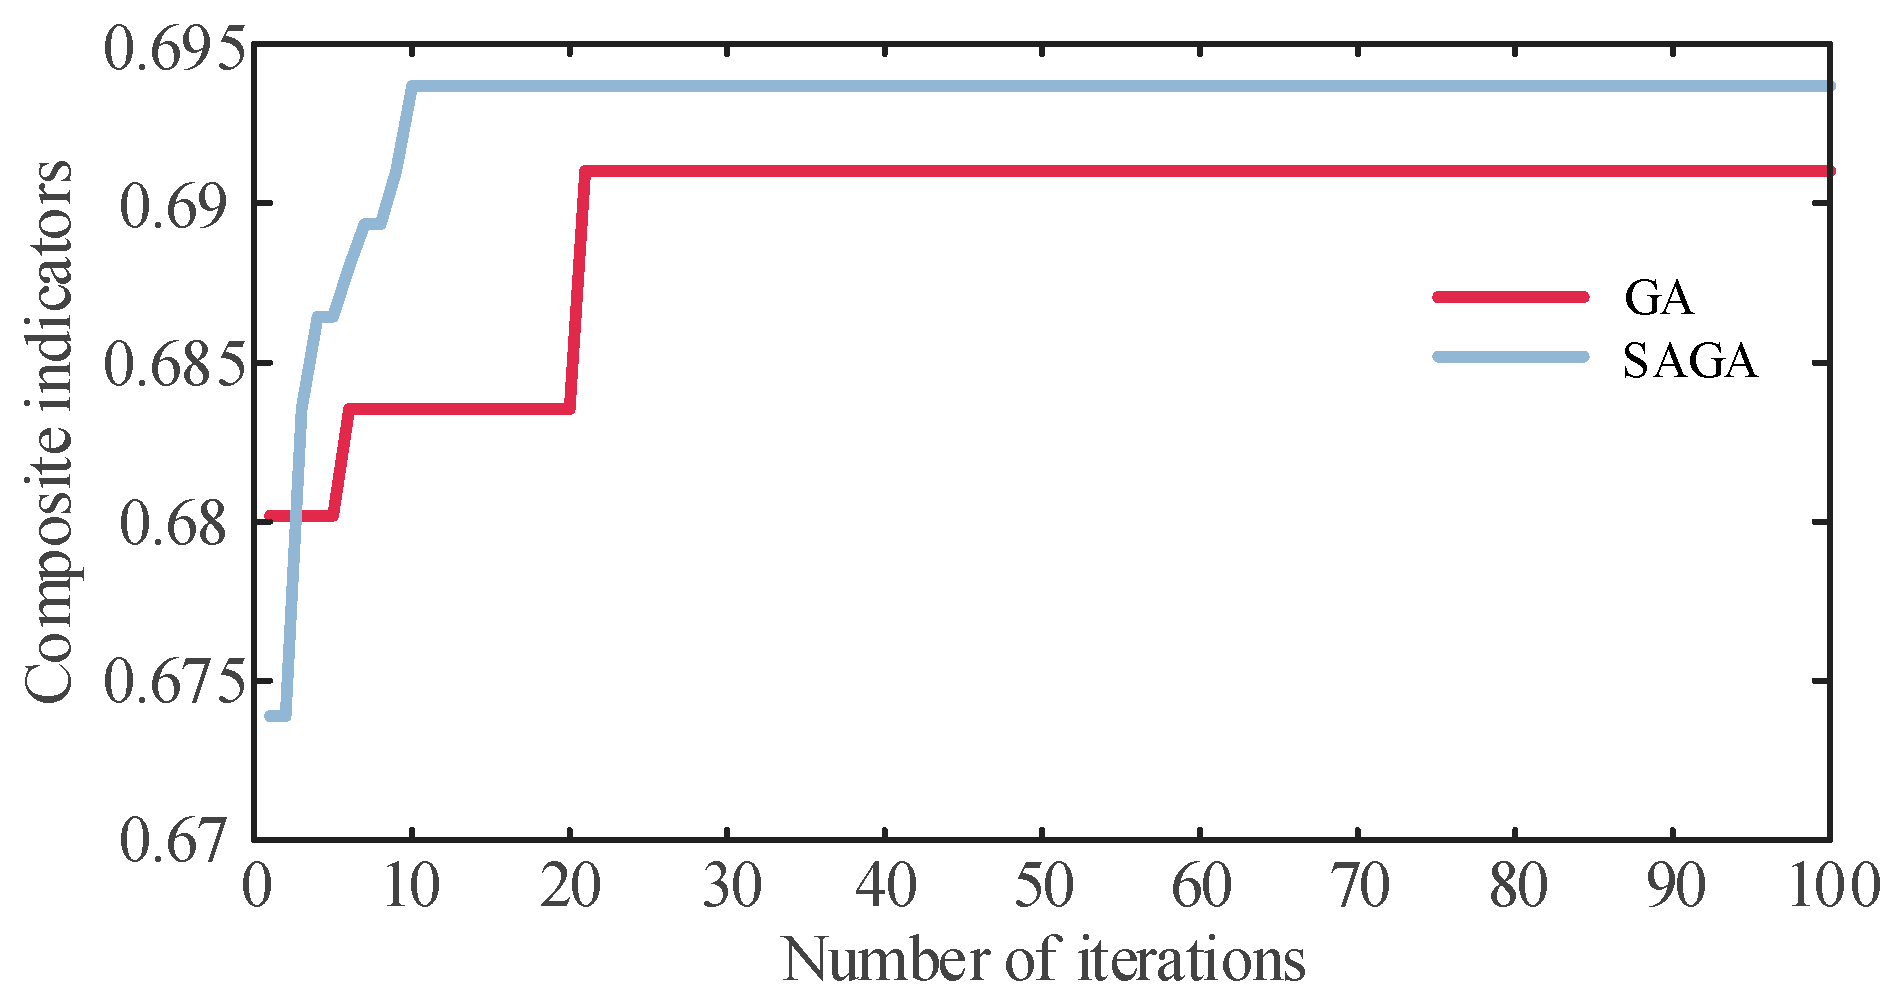
The GA algorithm and the improved SAGA algorithm used in scheme 2 were compared. The iterative curves of the comprehensive metrics are shown in Figure 7.
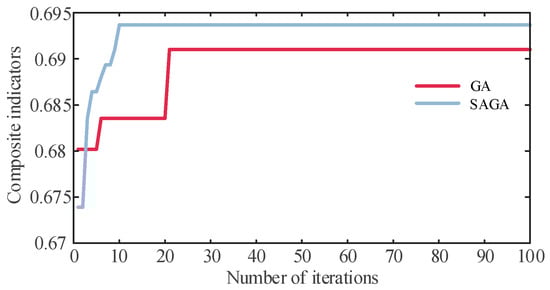
Figure 7.
Iterative curves of the comprehensive metrics.
The GA algorithm reaches a maximum value of 0.691 around the 20th time. The SAGA algorithm reaches a maximum value of 0.6937 around the tenth time. The SAGA algorithm converges the curve significantly faster than the GA algorithm.
5.2. Discussion of the Result of Distribution Network Cluster Division
From the clustering results, we can see that if only the degree of source–load power balance is considered, its functionality is not as good as that of source–load–storage power balance. Because the energy storage can increase the balance of active power in the cluster but increased access to the energy storage decreases the strength of the cluster structure in a distribution network, the modularity index of scheme 2 is reduced. The weights are important in balancing the two metrics and reasonably dividing the distribution network clusters. When the accessed capacity is large, the power balance index weight can be appropriately reduced to ensure a good structure of the cluster. In this paper, we set the same weights in order to ensure a good structure for the cluster and that the complementary power characteristics could be fully developed between nodes; both structural and functional requirements were taken into account.
For the solution to cluster partitioning, in this paper, the SAGA algorithm is adopted to compensate for the problem of local optimal solutions in the GA algorithm. The results show that the improved algorithm outperforms the base SA algorithm and effectively improves the computational accuracy and convergence speed. Genetic algorithms can better represent multiple metrics in a complex structured network of distribution network clusters. In the genetic algorithm solution process, the central problem is how to represent the connections between nodes. The chromosomes are encoded on the basis of the adjacency matrix of the network, using 0 s and 1 s to denote the on/off of a connection between nodes. During the iteration process, the values in the matrix are searched and modified randomly. The search is completed to form a new connectivity matrix, and the encoded individuals represent a kind of cluster division. This not only ensures connectivity between nodes but also reduces the search range and search time.
5.3. Results of Optimal Scheduling of Distribution Network Clusters
The results from the optimal scheduling comparison are shown in Table 3.
Table 3.
Comparison of optimized scheduling results.
Table 3 shows that the total cost of scheme 2 is CNY 26,138. The total daily cost of scheme 2 is reduced by 2.87% compared with that of scheme 1. Compared with scheme 1, the DG and ESS investment costs and operation and maintenance costs of scheme 2 are reduced by 1.45%. Mainly, the power transmission between clusters can reduce the output of energy storage, so the investment operation and maintenance costs are reduced. At the same time, an inter-cluster power interaction reduces the transmission of power to the higher-level grid, so scheme 2 has a 73% reduction in costs, which further leads to a 65% reduction in the penalty cost. However, scheme 2 has an inter-cluster power interaction cost determined by the self-imposed time-of-day tariffs between the clusters. In terms of the cost from network losses, since clustering division was not considered in scheme 1, the energy discharged from storage is larger. This results in more power being connected to the distribution network than in scheme 2, so the cost of net loss is reduced by 18% compared to scheme 2. The cluster optimal scheduling strategies of the two schemes are shown in Figure 8 and Figure 9.
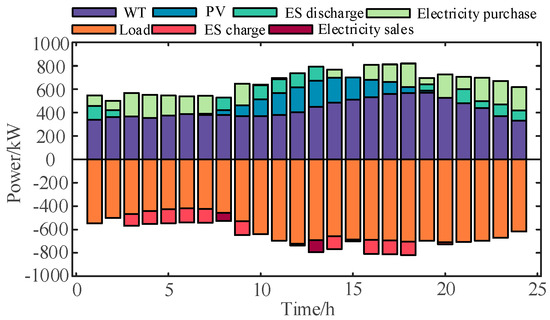
Figure 8.
Scheme 1 cluster−optimized scheduling strategy.
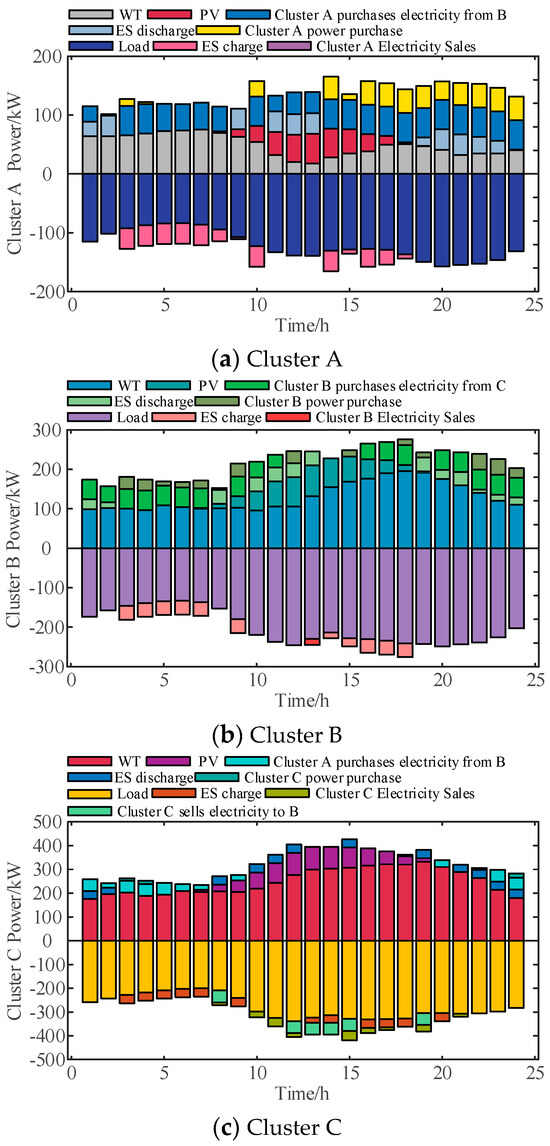
Figure 9.
Scheme 2 cluster−optimized scheduling strategy.
Figure 8 and Figure 9 show the cluster-optimized operation strategies for a day, respectively. The optimal dispatch strategy of scheme 1 requires power purchase from the higher-level grid at certain moments when the load demand cannot be met. It results in an increase in the cost of energy storage and power purchase. The optimal scheduling strategy of scheme 2 adopts a cluster division strategy where part of the power transmitted to the higher-level grid is converted into power that interacts between clusters. Cluster A purchases the largest amount of power, mainly because the DGs and energy storage outputs are smaller than the load but also due to the upper and lower limits of the contact line constraints. In order to meet the power balance within the cluster, cluster A also needs to purchase power from the higher-level grid, so its purchase power cost is the highest. Backward transfer of power occurs between clusters B and C, whereby power is sold from cluster C to cluster B. This occurs because the internal DG output of cluster C is greater than the load and storage consumption, and thus, the excess output can meet the load demand of cluster B. This also results in a small amount of power purchased by cluster C from cluster A and the higher-level grid, with a gain from the sale of power.
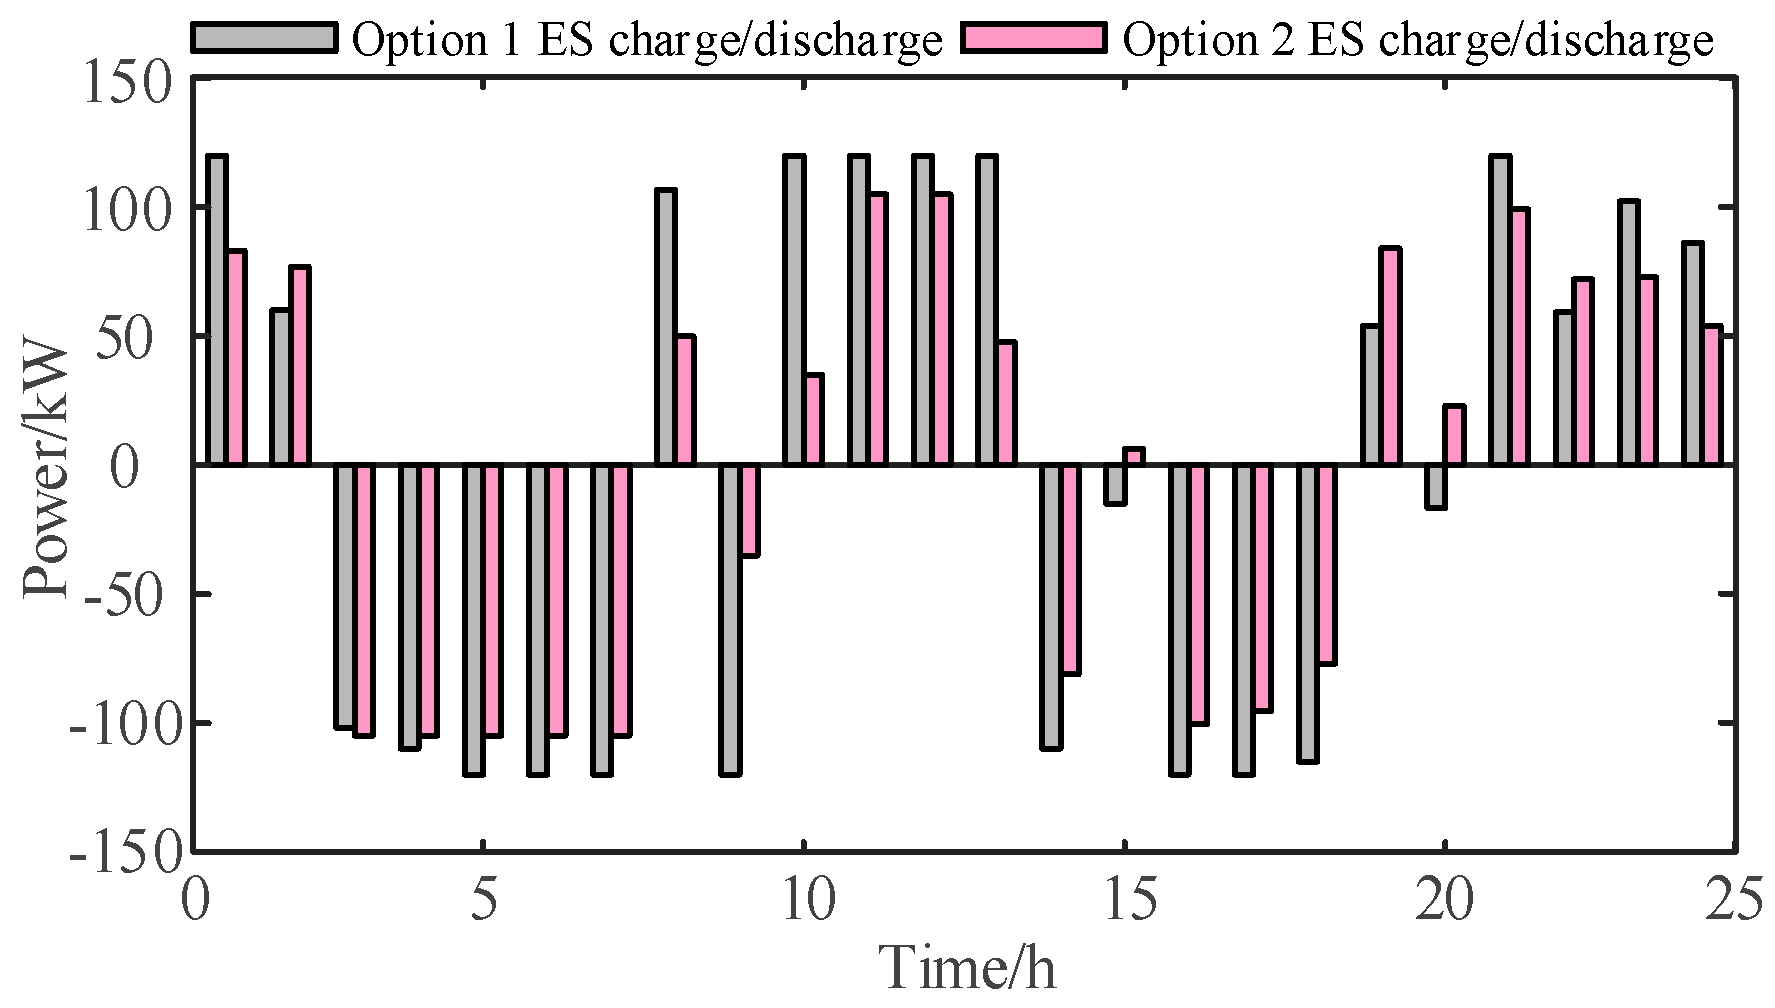
The charging/discharging power of the two schemes of ES is shown in Figure 10.
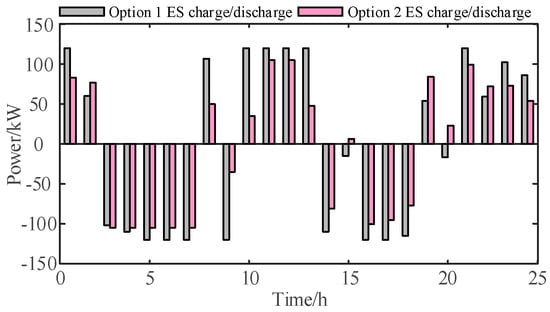
Figure 10.
ES charging and discharging for both schemes.
We can see that the average power of the energy storage for centralized optimal scheduling is 49.51 kW/h, and the average power for optimal scheduling after cluster division is 45.37 kW/h, which is a decrease of 8.3%; this reduction in power reduces the cost of the system. The energy storage was charged during 03:00–07:00, when loads were low, and during 16:00–18:00, when DG output was high, and discharged during 08:00–13:00 and 19:00–24:00, peak load periods. This scheduling effectively smooths the peak-to-valley differences in net loads and reduces power purchases from higher-level grids as well as cluster power transfers.
5.4. Discussion of the Results of Distribution Network Cluster Optimization Scheduling
From the results of the two optimal scheduling strategies, we can see that the optimal scheduling strategy considering distribution network cluster division is significantly better than that with a distribution network without division. The main economic difference is caused by the power interaction between the energy storage and cluster. The main reason for this is that the cost of energy storage is very high. If the cluster load-side demand can be satisfied by the interaction of power between clusters in optimized scheduling, the capacity and charging/discharging of energy storage can be effectively reduced, which not only reduces the cost of energy storage but also prolongs the service life of the energy storage. An inter-cluster power interaction through self-set time-sharing tariffs between clusters increases scheduling flexibility, reduces backward transmission of power to the higher-level grid, and improves the economic efficiency of the clusters themselves.
To achieve the objective of this paper, only economic indicators were used, which is not a comprehensive consideration. Therefore, consideration should also be given to adding distribution network security and reliability indicators, such as voltage excursion, network loss, etc., and analysis of power quality in distribution networks. In actual operation, due to the uncontrollability of wind and PV power, their output may exceed the scenarios set in the planning stage. There will be situations where clusters are unable to consume DG, and power is sent backward to the higher grid; thus, further research on inter-cluster interaction regulation strategies is required.
6. Conclusions
In this paper, in the context of new energy development and utilization and energy conservation for sustainable development, we aimed to address the problem of large-scale and decentralized access to distributed power sources and energy storage in a distribution network. Based on the idea of an ‘intra-cluster autonomy and inter-cluster coordination’ architecture, a strategy is proposed for achieving distributed optimal scheduling operation of the source, load, and storage based on the cluster-division method. The distributed optimization scheduling and operation of a source–load–storage cluster division are analyzed in the context of an IEEE33 node distribution system, and the following conclusions are obtained:
- The division of distribution networks using a comprehensive metrics approach to de-apply cluster optimization scheduling objectives can give full play to the advantages of cluster scheduling. Furthermore, a GA algorithm with simulated annealing doubles the computational efficiency of the basic GA algorithm while guaranteeing the validity of the computational results and realizing the efficient solution of distribution network cluster division.
- Considering the power interaction cost between clusters based on time-sharing tariffs in the optimal scheduling model can effectively reduce the amount of power sent back by the clusters to the higher-level grid, alleviate the power supply pressures of the higher-level grid, and at the same time, reduce energy-storage outputs and system-operation costs. The total operating costs can be reduced by 2.87% compared with optimal scheduling without distribution network clustering division.
- When energy storage is also considered during planning and operation, the distribution network’s comprehensive performance index can improve by 1.4% compared with considering only source and load. Not only is the balance between power and load in the cluster improved, but also the functionality of the distribution network is enhanced. In the scheduling phase, the energy storage regulating capacity can be fully utilized to improve costs.
- Dividing the distribution network into regions to effectively improve the regional distribution network’s capacity to absorb DG can improve energy efficiency, reduce inter-regional flow to reduce energy consumption, and enhance sustainability characteristics of new energy sources in distribution networks.
The research methodology in this paper can provide theoretical and decision-making support for the research on optimal distribution network cluster dispatch planning and for the development of new energy power systems with high penetration rates. However, the post-dispatch power quality problem was not considered, so the next steps will be to consider the zonal control of voltage after optimally dispatching clusters and to further study the inter-cluster voltage regulation strategy.
Author Contributions
Conceptualization, S.Q.; methodology, S.Q.; software, S.Q. and M.D.; validation, S.Q. and M.D.; formal analysis, S.Q.; investigation, W.H.; resources, W.H.; writing—original draft preparation, S.Q.; writing—review and editing, Y.D.; project administration, Y.D. All authors have read and agreed to the published version of the manuscript.
Funding
This research was funded by Shandong Provincial Natural Science Foundation of China, grant number ZR2021QE124.
Informed Consent Statement
Not applicable.
Data Availability Statement
The data presented in this study are available on request from the corresponding author.
Conflicts of Interest
Author Wenzhen Han was employed by the company Jining Power Supply Company of State Grid Shandong Electric Power Company. The remaining authors declare that the research was conducted in the absence of any commercial or financial relationships that could be construed as a potential conflict of interest.
Glossary
| Description of Some of the Symbols in This Article | |
| |
| active power. | |
| reactive power. | |
| active power–voltage phase angle sensitivity matrix. | |
| active power–voltage magnitude sensitivity matrix. | |
| reactive power–voltage phase angle sensitivity matrix. | |
| reactive power–voltage magnitude sensitivity matrix. | |
| active voltage sensitivity matrix. | |
| reactive voltage sensitivity matrix. | |
| ratio of voltage change values at node and node . | |
| active node voltage sensitivities of node itself. | |
| reactive node voltage sensitivities of node itself. | |
| active nodal voltage sensitivities between nodes. | |
| reactive nodal voltage sensitivities between nodes. | |
| weight of the edge connecting node and node . | |
| sum of all edge weights in the whole network. | |
| sum of the weights of all connected edges of nodes . | |
| sum of the weights of all connected edges of nodes . | |
| indicates that the two node regions belong to the same state. | |
| active balance of cluster. | |
| net power of cluster at time . | |
| total active dissipation capacity that can be provided by the DGs and ES in cluster . | |
| minimum active power required. | |
| active sensitivity of cluster. | |
| active voltage sensitivity of node in cluster . | |
| active balance of the whole network. | |
| number of cluster divisions. | |
| weighting factor. | |
| comprehensive indicator of cluster classification. | |
| cost. | |
| fixed annual rate. | |
| DG capacity of cluster. | |
| rated capacity of the energy storage. | |
| rated power of the energy storage. | |
| investment cost per unit of DG capacity. | |
| unit capacity cost of energy storage. | |
| unit power cost of energy storage. | |
| DG operation and maintenance costs. | |
| energy storage operation and maintenance costs. | |
| DG of cluster for a force at moment . | |
| output of stored energy of cluster at moment . | |
| power of cluster interacting with a higher-level grid at moment . | |
| power purchase price at time . | |
| price of electricity sold at moment . | |
| time-share price of electricity purchased and sold between clusters at time . | |
| power transmitted between moments of cluster through contact lines . | |
| network loss of cluster branch at moment . | |
| power loss cost. | |
| power transmitted from cluster to the higher-level grid at time . | |
| penalty factor. | |
| load of cluster at time . | |
| outputs of wind power for cluster at time . | |
| outputs of photovoltaic power for cluster at time . | |
| stored energy being charged/discharged for cluster at time . | |
| power transferred between clusters. | |
| lower limits of power transfer. | |
| upper limits of power transfer. | |
| lower power limits of the inter-cluster contact line. | |
| upper power limits of the inter-cluster contact line. | |
| lower limits of the energy storage power capacity. | |
| upper limits of the energy storage power capacity. | |
| energy storage capacity at moment . | |
| energy storage charging efficiencies. | |
| energy storage discharging efficiencies. | |
| lower bounds of the charge state. | |
| bounds of the charge state. | |
| initial charge state. | |
| |
| nodal. | |
| nodal. | |
| clusters. | |
| time. | |
| investor. | |
| capacity. | |
| power. | |
| DG operation and maintenance. | |
| DG operation and maintenance. | |
| distributed generator. | |
| energy storage. | |
| power network. | |
| time-sharing tariff. | |
| transmission lines. | |
| purchase of electricity. | |
| selling electricity. | |
| network loss. | |
| power loss. | |
| electrical load. | |
| wind power output. | |
| photovoltaic output. | |
| energy storage power. | |
| energy storage charge state. | |
References
- Li, S.; Hu, Y. A multi-criteria framework to evaluate the sustainability of renewable energy: A 2-tuple linguistic grey relation model from the perspective of the prospect theory. Sustainability 2022, 14, 4419. [Google Scholar] [CrossRef]
- Khatami, F.; Goharian, E. Beyond profitable shifts to green energies, towards energy sustainability. Sustainability 2022, 14, 4506. [Google Scholar] [CrossRef]
- Yang, X.D.; Xu, C.B.; Hu, H.B.; Yao, W.; Wen, J.Y.; Zhang, Y.B. Flexibility provisions in active distributed network with uncertainties. IEEE Trans. Sustain. Energy 2021, 12, 553–567. [Google Scholar]
- Wang, X.Q.; Sheng, X.D.; Qiu, W.X.; He, W.L.; Xu, J.; Xin, Y.; Jv, J.B. Fault reconfiguration strategies of active distribution network with uncertain factors for maximum supply capacity enhancement. IEEE Access 2022, 10, 72373–72380. [Google Scholar] [CrossRef]
- Shushpanov, I.; Suslov, K.; Ilyushin, P.; Sidorov, D.N. Towards the flexible distribution networks design using the reliability performance metric. Energies 2021, 14, 6193. [Google Scholar] [CrossRef]
- Zhong, J.; Li, K.J.; Sun, K.Q.; Liu, J.; Chang, X. Source-load-storage coordinated optimization dispatch for distribution networks considering source-load uncertainties. In Proceedings of the 2022 4th Asia Energy and Electrical Engineering Symposium (AEEES), Chengdu, China, 25–28 March 2022. [Google Scholar]
- Rao, Y.; Cui, X.; Zou, X.; Ying, L.; Tong, P.; Li, J. Research on distributed energy storage planning-scheduling strategy of regional power grid considering demand response. Sustainability 2023, 15, 14540. [Google Scholar] [CrossRef]
- Rao, S.N.V.B.; Kumar, X.V.P.; Pradeep, D.J.; Reddy, C.P.; Kraiem, H.; Al-Asad, J.F. Power quality improvement in renewable-energy-based microgrid clusters using fuzzy space vector PWM controlled inverter. Sustainability 2022, 14, 4663. [Google Scholar] [CrossRef]
- Miranbeigi, M.; Iman-Eini, H. Hybrid modulation technique for grid-connected cascaded photovoltaic systems. IEEE Trans. Smart Grid 2016, 63, 7843–7853. [Google Scholar] [CrossRef]
- Kroposki, B.; Bernstein, A.; King, J.; Vaidhynathan, D.; Zhou, X.Y.; Chang, C.Y.; Anese, E.D. Autonomous energy grids: Controlling the future grid with large amounts of distributed energy resources. IEEE Power Energy Mag. 2023, 21, 87–96. [Google Scholar] [CrossRef]
- Leksawat, S.; Schmelter, A.; Ortjohann, E.; Kortenbruck, J.; Holtschulte, D.; Premgamone, T.; Khaola-iead, K.; Morton, D. Demonstration of cluster-based power system automation for future smart grids. In Proceedings of the 2016 IEEE International Energy Conference, Leuven, Belgium, 4–8 April 2016. [Google Scholar]
- Wirasanti, P.; Ortjohann, E.; Schmelter, A.; Morton, D. Clustering power systems strategy the future of distributed generation. In Proceedings of the International Symposium on Power Electronics Power Electronics, Electrical Drives, Automation and Motion, Sorrento, Italy, 20–22 June 2012. [Google Scholar]
- Hui, H.; Li, R.; Zhao, Y.; Wang, M.; Mao, Z.Y.; Wang, X.R. Optimal Allocation Method of PV-Storage System in Clustered Distribution Network with Balanced Economy and Reliability. In Proceedings of the 2022 12th International Conference on Power and Energy Systems (ICPES), Guangzhou, China, 23–25 December 2022. [Google Scholar]
- Hoger, M.; Klimo, M.; Tkac, M. Clustering Technique for Enhanced Optimization and Control of Distribution Networks. In Proceedings of the 2024 ELEKTRO(ELEKTRO), Zakopane, Poland, 20-22 May 2024. [Google Scholar]
- Vallee, F.; Brunieau, G.; Pirlot, M.; Deblecker, O.; Lobry, J. Optimal wind clustering methodology for electrical network adequacy studies using non sequential Monte Carlo simulation. In Proceedings of the 2011 International Conference on Clean Electrical Power (ICCEP), Ischia, Italy, 14–16 June 2011. [Google Scholar]
- Biserica, M.; Foggia, G.; Chanzy, E.; Passelergue, J.C. Network partition for coordinated control in active distribution networks. In Proceedings of the 2013 IEEE Grenoble Conference, Grenoble, France, 16–20 June 2013. [Google Scholar]
- Preda, T.N.; Uhlen, K.; Nordgard, D.E. Clustering distributed generation using the instantaneous Euclidean Distance in polar coordinates. In Proceedings of the IEEE PES ISGT Europe 2013, Lyngby, Denmark, 6–9 October 2013. [Google Scholar]
- Heslop, S.F.; MacGill, I.F. Operational characteristics of a cluster of distributed photovoltaic systems. In Proceedings of the 2011 IEEE PES Innovative Smart Grid Technologies, Perth, WA, Australia, 13–16 November 2011. [Google Scholar]
- Wang, M.; Li, F.; Hong, F.; Wang, S.C. Application of improved cluster division method in active distribution network. In Proceedings of the 2021 5th International Conference on Green Energy and Applications (ICGEA), Singapore, 6–8 March 2021. [Google Scholar]
- Ding, M.; Liu, X.F.; Bi, R.; Hu, D.; Ye, B.; Zhang, J.J. A cluster segmentation approach for high penetration distributed power clusters using comprehensive performance metrics. Autom. Electr. Power Syst. 2018, 42, 47–52+141. (In Chinese) [Google Scholar]
- Vinothkumar, K.; Selvan, M.P. Hierarchical agglomerative clustering algorithm method for distributed generation planning. Int. J. Electr. Power Energy Syst. 2013, 56, 259–269. [Google Scholar] [CrossRef]
- Lv, N.J.; Liu, X.T.; Hu, J.J.; Zhang, H.B. Cluster partition method development for high penetration of distributed photovoltaics using intelligent algorithm and K-means. In Proceedings of the 2022 IEEE 5th International Conference on Electronics Technology (ICET), Chengdu, China, 13–16 May 2022. [Google Scholar]
- Cao, D.; Zhao, J.B.; Hu, W.H.; Ding, F.; Huang, Q.; Chen, Z.; Blaabjerg, F. Data-driven multi-agent deep reinforcement learning for distribution system decentralized voltage control with high penetration of PVs. IEEE Trans. Smart Grid 2021, 12, 4137–4150. [Google Scholar] [CrossRef]
- Kiran, D.; Abhyankar, A.R.; Panigrahi, B.K. Hierarchical clustering based zone formation in power networks. In Proceedings of the 2016 National Power Systems Conference, Bhubaneswar, India, 19–21 December 2016. [Google Scholar]
- Liao, K.L.; Wu, G.L.; Weng, H.D.; Zhang, L.Y.; Liu, L.J. Optimal configuration of capacity for hybrid energy storage based on ISDPC–K-means clustering and cluster division. In Proceedings of the 2023 Panda Forum on Power and Energy (PandaFPE), Chengdu, China, 27–30 April 2023. [Google Scholar]
- Zhao, B.; Xu, Z.C.; Xu, C.; Wang, C.S. Network partition-based zonal voltage control for distribution networks with distributed PV systems. IEEE Trans. Smart Grid 2018, 9, 4087–4098. [Google Scholar] [CrossRef]
- Zhao, J.J.; Zhu, J.D.; Li, Z.K.; Zhang, Y.; Liu, S.; Li, X.B. Two-stage intraday distributed optimal scheduling of distribution networks considering robust balancing of flexibility supply and demand. Autom. Electr. Power Syst. 2022, 46, 61–71. (In Chinese) [Google Scholar]
- Dong, H.Z.; Li, S.D.; Dong, H.Y.; Tian, Z.B. Coordinated scheduling strategy for distributed generation considering uncertainties in smart grids. IEEE Access 2020, 8, 86171–86179. [Google Scholar] [CrossRef]
- Miao, G.X.; Wang, X.; Yuan, L.; Wei, H.; Hui, M. Two-tier optimal scheduling of micro-grid cluster distribution system based on energy interaction. In Proceedings of the 2023 IEEE Sustainable Power and Energy Conference (ISPEC), Chongqing, China, 28–30 November 2023. [Google Scholar]
- Hu, D.; Ding, M.; Sun, L.; Zhang, J.J. Planning of high renewable-penetrated distribution systems considering complementarity and cluster partitioning. Energies 2019, 12, 2090. [Google Scholar] [CrossRef]
- Su, D.W.; Hao, Y.C.; Li, W.Q.; Dai, R.P.; Zhou, X.F. Cluster division and optimal scheduling of offshore wind power with energy storage based on fast unfolding algorithm. In Proceedings of the 2022 IEEE 5th International Electrical and Energy Conference (CIEEC), Nangjing, China, 27–29 May 2022. [Google Scholar]
- Su, H.Z.; Li, P.; Fu, X.P.; Yu, L.; Wang, C.S. Augmented sensitivity estimation based voltage control strategy of active distribution networks with PMU measurement. IEEE Access 2019, 7, 44987–44997. [Google Scholar] [CrossRef]
- Girvan, M.; Newman, M.E.J. Community structure in social and biological networks. Proc. Natl. Acad. Sci. USA 2002, 99, 7821–7826. [Google Scholar] [CrossRef]
- Chai, Y.Y.; Guo, L.; Wang, C.S.; Zhao, Z.Z.; Du, X.F.; Pan, J. Network partition and voltage coordination control for distribution networks with high penetration of distributed PV units. IEEE Trans. Power Syst. 2018, 33, 3396–3407. [Google Scholar] [CrossRef]
- Newman, M.E.J.; Girvan, M. Finding and evaluating community structure in networks. Phys. Rev. E 2004, 69, 026113. [Google Scholar] [CrossRef]
- Newman, M.E.J.; Girvan, M. Fast algorithm for detecting community structure in networks. Phys. Rev. E 2004, 69, 066133. [Google Scholar] [CrossRef]
- Du, H.W.; Wei, T.Z.; Xia, D.; Zhou, S.Y.; Han, T. Reactive voltage self-regulation and coordination control in distribution networks based on cluster dynamic partition. Autom. Electr. Power Syst. 2024, 48, 171–181. (In Chinese) [Google Scholar]
- Ding, J.; Zhang, Q.; Hu, S.; Wang, Q.; Ye, Q. Clusters partition and zonal voltage regulation for distribution networks with high penetration of PVs. IET Gener. Transm. Distrib. 2018, 12, 6041–6051. [Google Scholar] [CrossRef]
- Li, X.; Li, G.M.; Wang, Z.F.; Kuang, Z.J.; Chen, T.W.; Wang, T.L. A bi-level planning method of distributed renewable energy based on cluster division. In Proceedings of the 2022 12th International Conference on Power and Energy Systems (ICPES), Guangzhou, China, 23–25 December 2022. [Google Scholar]
- Seungchan, J.; Jae-Young, O.; Jaeho, L.; Seokhwa, O.; Moon, H.S.; Zhang, C.; Gadh, R.; Yoon, Y.O. Hybrid genetic algorithm with k-nearest neighbors for radial distribution network reconfiguration. IEEE Trans. Smart Grid 2024, 15, 2614–2624. [Google Scholar]
- Wang, W.T.; Tian, J. An improved nonlinear tuna swarm optimization algorithm based on circle chaos map and levy flight operator. Electronics 2022, 11, 3678. [Google Scholar] [CrossRef]
- Deng, S.; Yuan, C.G.; Yang, J.Q.; Zhou, A.H. Distributed mining for content filtering function based on simulated annealing and gene expression programming in active distribution network. IEEE Access 2017, 5, 2319–2328. [Google Scholar] [CrossRef]
- Mafarja, M.M.; Mirjalili, S. Hybrid whale optimization algorithm with simulated annealing for feature selection. Neurocomputing 2017, 260, 302–312. [Google Scholar] [CrossRef]
- Liu, H.; Li, J.F.; Ge, S.Y.; He, X.T.; Li, F.R.; Gu, C.H. Distributed Day-Ahead Peer-to-Peer Trading for Multi-Microgrid Systems in Active Distribution Networks. IEEE Access 2020, 8, 66961–66967. [Google Scholar] [CrossRef]
- Yang, J.; Gao, H.J.; Ye, S.Y.; Lu, L.; Liu, Y.B.; Liu, J.Y. Applying multiple types of demand response to optimal day-ahead stochastic scheduling in the distribution network. IET Gener. Transm. Distrib. 2020, 14, 4509–4519. [Google Scholar] [CrossRef]
- Dolatabadi, S.H.; Ghorbanian, M.; Siano, P.; Hatziargyriou, N.D. An enhanced IEEE33 Bus benchmark test system for distribution system studies. IEEE Trans. Power Syst. 2021, 36, 2565–2572. [Google Scholar] [CrossRef]


Disclaimer/Publisher’s Note: The statements, opinions and data contained in all publications are solely those of the individual author(s) and contributor(s) and not of MDPI and/or the editor(s). MDPI and/or the editor(s) disclaim responsibility for any injury to people or property resulting from any ideas, methods, instructions or products referred to in the content. |
© 2024 by the authors. Licensee MDPI, Basel, Switzerland. This article is an open access article distributed under the terms and conditions of the Creative Commons Attribution (CC BY) license (https://creativecommons.org/licenses/by/4.0/).