Article

Assessment of the Technical Impacts of Electric Vehicle Penetration in Distribution Networks: A Focus on System Management Strategies Integrating Sustainable Local Energy Communities

by
Samuel Borroy Vicente
1,2,
Gregorio Fernández
1,
Noemi Galan
1,
Andrés Llombart Estopiñán
1,
Matteo Salani
3,
Marco Derboni
3,
Vincenzo Giuffrida
3 and
Luis Hernández-Callejo
4,*
1
Fundacion CIRCE, Parque Empresarial Dinamiza, Avenida Ranillas 3-D, 1st Floor, 50018 Zaragoza, Spain
2
PhD Programme in Industrial Engineering, Universidad de Valladolid, 47002 Valladolid, Spain
3
IDSIA Dalle Molle Institute for Artificial Intelligence, University of Applied Sciences and Arts of Southern Switzerland (USI-SUPSI), Via La Santa 1, 6962 Lugano, Switzerland
4
Analysis and Diagnosis of Electrical Installations and Networks-Institute of Advanced Production Technologies (ADIRE-ITAP), Departamento Ingeniería Agrícola y Forestal, Universidad de Valladolid, Campus Duques de Soria, 42004 Soria, Spain
*
Author to whom correspondence should be addressed.
Sustainability 2024, 16(15), 6464; https://doi.org/10.3390/su16156464 (registering DOI)
Submission received: 15 June 2024 / Revised: 24 July 2024 / Accepted: 26 July 2024 / Published: 28 July 2024

Abstract

:
Aligned with the objectives of the energy transition, the increased penetration levels of electric vehicles as part of the electrification of economy, especially within the framework of local energy communities and distributed energy resources, are crucial in shaping sustainable and decentralized energy systems. This work aims to assess the impact of escalating electric vehicles’ deployment on sustainable local energy community-based low-voltage distribution networks. Through comparative analyses across various levels of electric vehicle integration, employing different charging strategies and system management approaches, the research highlights the critical role of active system management instruments such as smart grid monitoring and active network management tools, which significantly enhance the proactive management capabilities of distribution system operators. The findings demonstrate that increased electric vehicle penetration rates intensify load violations, which strategic electric vehicle charging management can significantly mitigate, underscoring the necessity of load management strategies in alleviating grid stress in the context assessed. This study highlights the enhanced outcomes derived from active system management strategies which foster collaboration among distribution system operators, demand aggregators, and local energy communities’ managers within a local flexibility market framework. The results of the analysis illustrate that this proactive and cooperative approach boosts system flexibility and effectively averts severe grid events, which otherwise would likely occur. The findings reveal the need for an evolution towards more predictive and proactive system management in electricity distribution, emphasizing the significant benefits of fostering robust partnerships among actors to ensure grid stability amid rising electric vehicle integration.

1. Introduction

Actors and processes participating in electric power systems, encompassing generation, transmission, distribution and consumption, as well as the electricity market’s configuration, are increasingly recognized as playing a pivotal role at the core of the global energy transition, which aims to alleviate dependence on fossil fuels and mitigate the effects of climate change. International initiatives such as the European Green Deal [1] and The United States Federal Green New Deal (GND) [2] promote policy proposals incentivizing the adoption of scenarios which allow the feasibility of the mentioned transition.
The International Energy Agency (IEA) has projected a relevant rise in electricity demand for the coming years [3], which is aligned with such scenarios. Although strict current data have not yet universally indicated such a trend in electricity demand, the growing development of new electro-intensive players such as data centers, and the great potential of electrification to mitigate emissions and decarbonize energy supply chains still support this idea, following global sustainability goals. Particularly, the segment whose electrification is expected to represent the highest impact on the reduction in CO2 emissions is the road transport sector, specifically within the light-duty vehicle section. In this sense, considering the IEA’s Net Zero Scenario, electrification accounts for about 7% of all mitigated emissions between 2020 and 2030, with electric vehicles (hereinafter EV) being responsible for the majority of these reductions [4].
The momentum in EV adoption is reflected in recent sales trends, underscoring the critical role of the sector in electrification efforts. In 2022, electric car markets experienced significant growth, with EVs comprising a total of 14% of all new cars sold, a remarkable increase from around 9% in 2021 and under 5% in 2020. The rising trend continued into 2023, with figures for the first quarter surpassing the ones of the same period in the previous year by about 25%. Moreover, the IEA forecasts that global EV sales will increase by around fourfold from 2022 to 2030 [5].
The integration of renewable energies represents a cornerstone for achieving the objectives of the energy transition, together with electrification. Additionally, as the installation of large new plants keeps growing, sustainable self-consumption based on renewable energies is particularly expected to experience relevant increases, with perspectives for renewable energies to reach about 40% of building electricity use supply by 2030 [6].
Specific advanced configurations of self-consumption and distributed energy resources (DER) are represented by local energy communities (LECs). An LEC can be defined as a collective of energy stakeholders (often including households, small businesses, and other local entities) that are geographically close and collaborate on generating (predominantly from renewable sources), consuming, sharing, and managing energy within their vicinity. Their growing adoption is driven not only by the maturing technologies and increasing cost-competitiveness of renewables but also by the growing societal commitment to environmental aspects and energy independence. Currently, LECs are in the development phase, both in terms of potential technology capabilities such as energy efficiency services, consumption (or even generation), and aggregation, and in regulatory aspects [7,8,9].
Ensuring the reliability and continuity of energy supply is a foundational expectation that is taken for granted in any approach to sustainable scenarios such as those pursued to meet the aforementioned energy transition objectives. To guarantee this, electricity networks are core elements with a backbone role that face the challenge of feeding the growing electricity demands, including emerging vectors such as electric mobility, and integrating new generation units based on renewable non-manageable primary resources. This task is particularly challenging for medium- (MV) and low-voltage (LV) distribution networks, since the widespread adoption of DERs will introduce profoundly different conditions compared to the ones these networks were originally designed to accommodate. Furthermore, regarding electric mobility penetration, the distribution networks need to address the issue of managing massive EV charging, due to the overall increase in energy consumption and peak demand, which consequently leads to a higher probability of grid congestions and larger distribution energy losses. Likewise, voltage deviations and phase unbalances can increase, resulting in adverse impacts on grid stability. Different works, such as those presented in references [10,11,12,13], expose potential challenges for distribution networks related to the integration of demands such as those of EVs and propose specific approaches, mainly focused on optimizing sizing, location, and charging processes.
The implementation of smart grid concepts and technologies allows for high levels of penetration of DER and new electricity demands; it represents not only a challenge, but also the means and instruments for achieving the sustainable transition objectives. Thus, power electronics-based technologies, digitalization, and advanced control methodologies for the integration of DER units within distribution networks, along with the evolution of procedures for transmission and distribution assets operation, contribute to the progress of energy systems towards more sustainable models, in line with energy transition goals [14,15,16,17,18,19]. Strategies that facilitate the coordination, management, and control of distributed resources and loads enhance the flexibility of the system. This flexibility is essential for addressing the fluctuations in supply from renewable sources, which are a fundamental characteristic of renewable generation [20,21]. Accordingly, the synergies of renewable generation and electrification, particularly those demands with manageability perspectives (such as evolving electric vehicle technology) which allow for mitigating the variability of primary sources, provide valuable tools for fostering the transition.
Actors such as prosumers, alongside aspects such as demand aggregation and the aforementioned LECs, become remarkably relevant for increasing the flexibility of distribution systems. Considering this evolving paradigm, enhancing network flexibility introduces both challenges and opportunities, notably in harmonizing the specific interests and priorities of prosumers/consumers with the collective operational requirements of the network [22]. Complementing the required technological advance of smart grids, mentioned above, the development of local energy markets (LEM) and local flexibility markets (LFM) aims to foster these essential synergies. LEMs and LFMs represent key innovations in the evolving landscape of energy systems. LEMs primarily focus on enabling peer-to-peer (P2P) trading of locally generated renewable energy among individual agents, aiming to maximize local consumption and empower prosumers to manage their energy surplus and deficits independently of fixed feed-in tariffs [23,24,25]. This model not only encourages the use of renewable energy but also promotes energy independence and community engagement in the energy market. LFMs, on the other hand, are designed to provide a marketplace for distribution system operators (DSOs) to procure flexibility services to avoid voltage violations and congestions. The emergence of LFMs is largely driven by the need to efficiently activate flexibility within the distribution network, a requirement increasingly recognized by energy regulators and facilitated by the EU Clean Energy Package through the introduction of renewable energy communities and citizen energy communities. A pivotal distinction in LFM differentiates between explicit and implicit markets. Explicit LFMs can be characterized by direct trading platforms where DSOs purchase flexibility services, whereas implicit LFMs integrate flexibility activation within the LEM through DSO-introduced price signals reflecting flexibility needs. This integration affects the LEM operations and the role of local energy market operators (LEMOs) [26,27,28,29].
The challenges and potential solutions associated with the integration of DERs and EVs into power systems are extensively examined by the existing technical literature. A significant emphasis is placed on ensuring stable connections for DERs and EVs and enhancing the efficiency of real-time operations. As underscored by the references cited above, this often involves the development and application of novel real-time control algorithms alongside the adoption of cutting-edge hardware and software solutions. Despite these exhaustive analyses, finding studies that specifically focus on developing scenarios based on the growth rates of DERs, LECs, and EVs, along with quantitatively evaluating the technical impacts of these scenarios on distribution networks, remains challenging. To address this gap, the line of research that frames the study presented in this paper is dedicated to defining and examining a spectrum of scenarios aligned with the objectives of the energy transition. Therefore, in their previous works within this line, presented in [30,31], the authors explored the technical impacts that the irruption and proliferation of renewable energy-based LECs can have on electrical distribution systems with growing perspectives for electrification, comparing reference systems from different areas. The obtained results show that the enhancement observed in the scenarios which consider LEC integration is remarkable, particularly in European scenarios, improving voltage, load, and loss indicators. Moreover, another key insight from this research is the superior readiness of meshed LV network topologies in accommodating the surge in electricity demand prompted by electrification efforts (as observed in North American benchmark systems). In addition, the work concluded that further analyses should be performed with regards to more complex structures, integrating additional elements aligned with the smart grid paradigm, such as storage systems or EVs.
The work presented in this paper evolves the research trajectory of the authors and indeed expands and deepens the exploration by focusing on enhanced system management approaches. It aims to investigate the impact of EVs within scenarios dominated by sustainable LEC penetration, specifically assessing the effects on network operation through various key performance indicators (KPIs) at different DER and EV penetration levels. This analysis evaluates diverse management strategies related to vehicle charging, alongside the roles of DSOs and market participants in managing flexibility assets and configuring energy markets. The innovative approach of the study integrates smart grid monitoring (SGM) and active network management (ANM) tools to proactively address grid stability challenges posed by varying levels of EV penetration. By combining these advanced system management strategies with comprehensive scenario analyses, the presented work provides novel insights into the practical implementation of smart grid technologies and market mechanisms. This research highlights the critical role of DSOs, demand aggregators, and LEC managers in optimizing the integration of DERs and EVs, ultimately contributing to the advancement of future energy infrastructures.
The findings indicate that forecasting network conditions and implementing active network management tools are invaluable for DSOs, with their effectiveness further amplified through collaborative strategies that leverage synergies with market operators, aggregators, and LEC managers. The methodology and results aim to arm decision-makers, system operators, and regulators with in-depth insights, paving the way for the advancement of future energy infrastructures. Additionally, this study sets a foundation for more detailed future analyses of network dynamics.
The structure of this paper is outlined as follows: Section 2 elaborates on the comprehensive methodology adopted for this research; Section 3 showcases the results and findings obtained; Section 4 engages in an in-depth discussion and examination of these findings; and Section 5 concludes the study by summarizing the key findings and proposing directions for future research.

2. Materials and Methods

To evaluate the technical impacts of EV penetration in sustainable distribution networks, this study is based on the analysis and comparison of scenarios which vary levels of EV penetration, individual charging methods, and system management strategies. Such scenarios are implemented within a representative European benchmark system, which represents urban distribution networks integrating a specific rate of PV-based LECs.
Quantitative evaluation is performed using simulation techniques, primarily focusing on the key operational variables of power systems, namely voltage and load levels, as they directly reflect the system’s condition and are influenced by changes in electricity demand, penetration of DER, and operation strategies.
The subsequent subsections provide detailed descriptions of the benchmark system and scenarios considered for analysis, including the system strategies, indicators, and simulation methods.

2.1. Benchmark System

The development of the benchmark system used for the present study relies on general criteria represented by IEEE European Low Voltage Test Feeder [32,33] as a foundational reference. Such a test system established by the IEEE Working Group of the Distribution System Analysis Subcommittee under the Power Systems Analysis, Computing, and Economics (PSACE) Committee, aims to provide a benchmark for the examination of LV feeders that are prevalent across Europe. The general criteria reflected in IEEE European Low Voltage Test Feeder, enriched with anonymized real data from European DSOs, result in the building of the representative benchmark system defined for the present work. For the sake of confidentiality and the broad applicability of the findings, this system has been designated as “Urban Network” for the purposes of this study, a name which indeed reflects its typology.
This subsection describes the structure of the Urban Network and outlines the modeling of EV demand within the network.

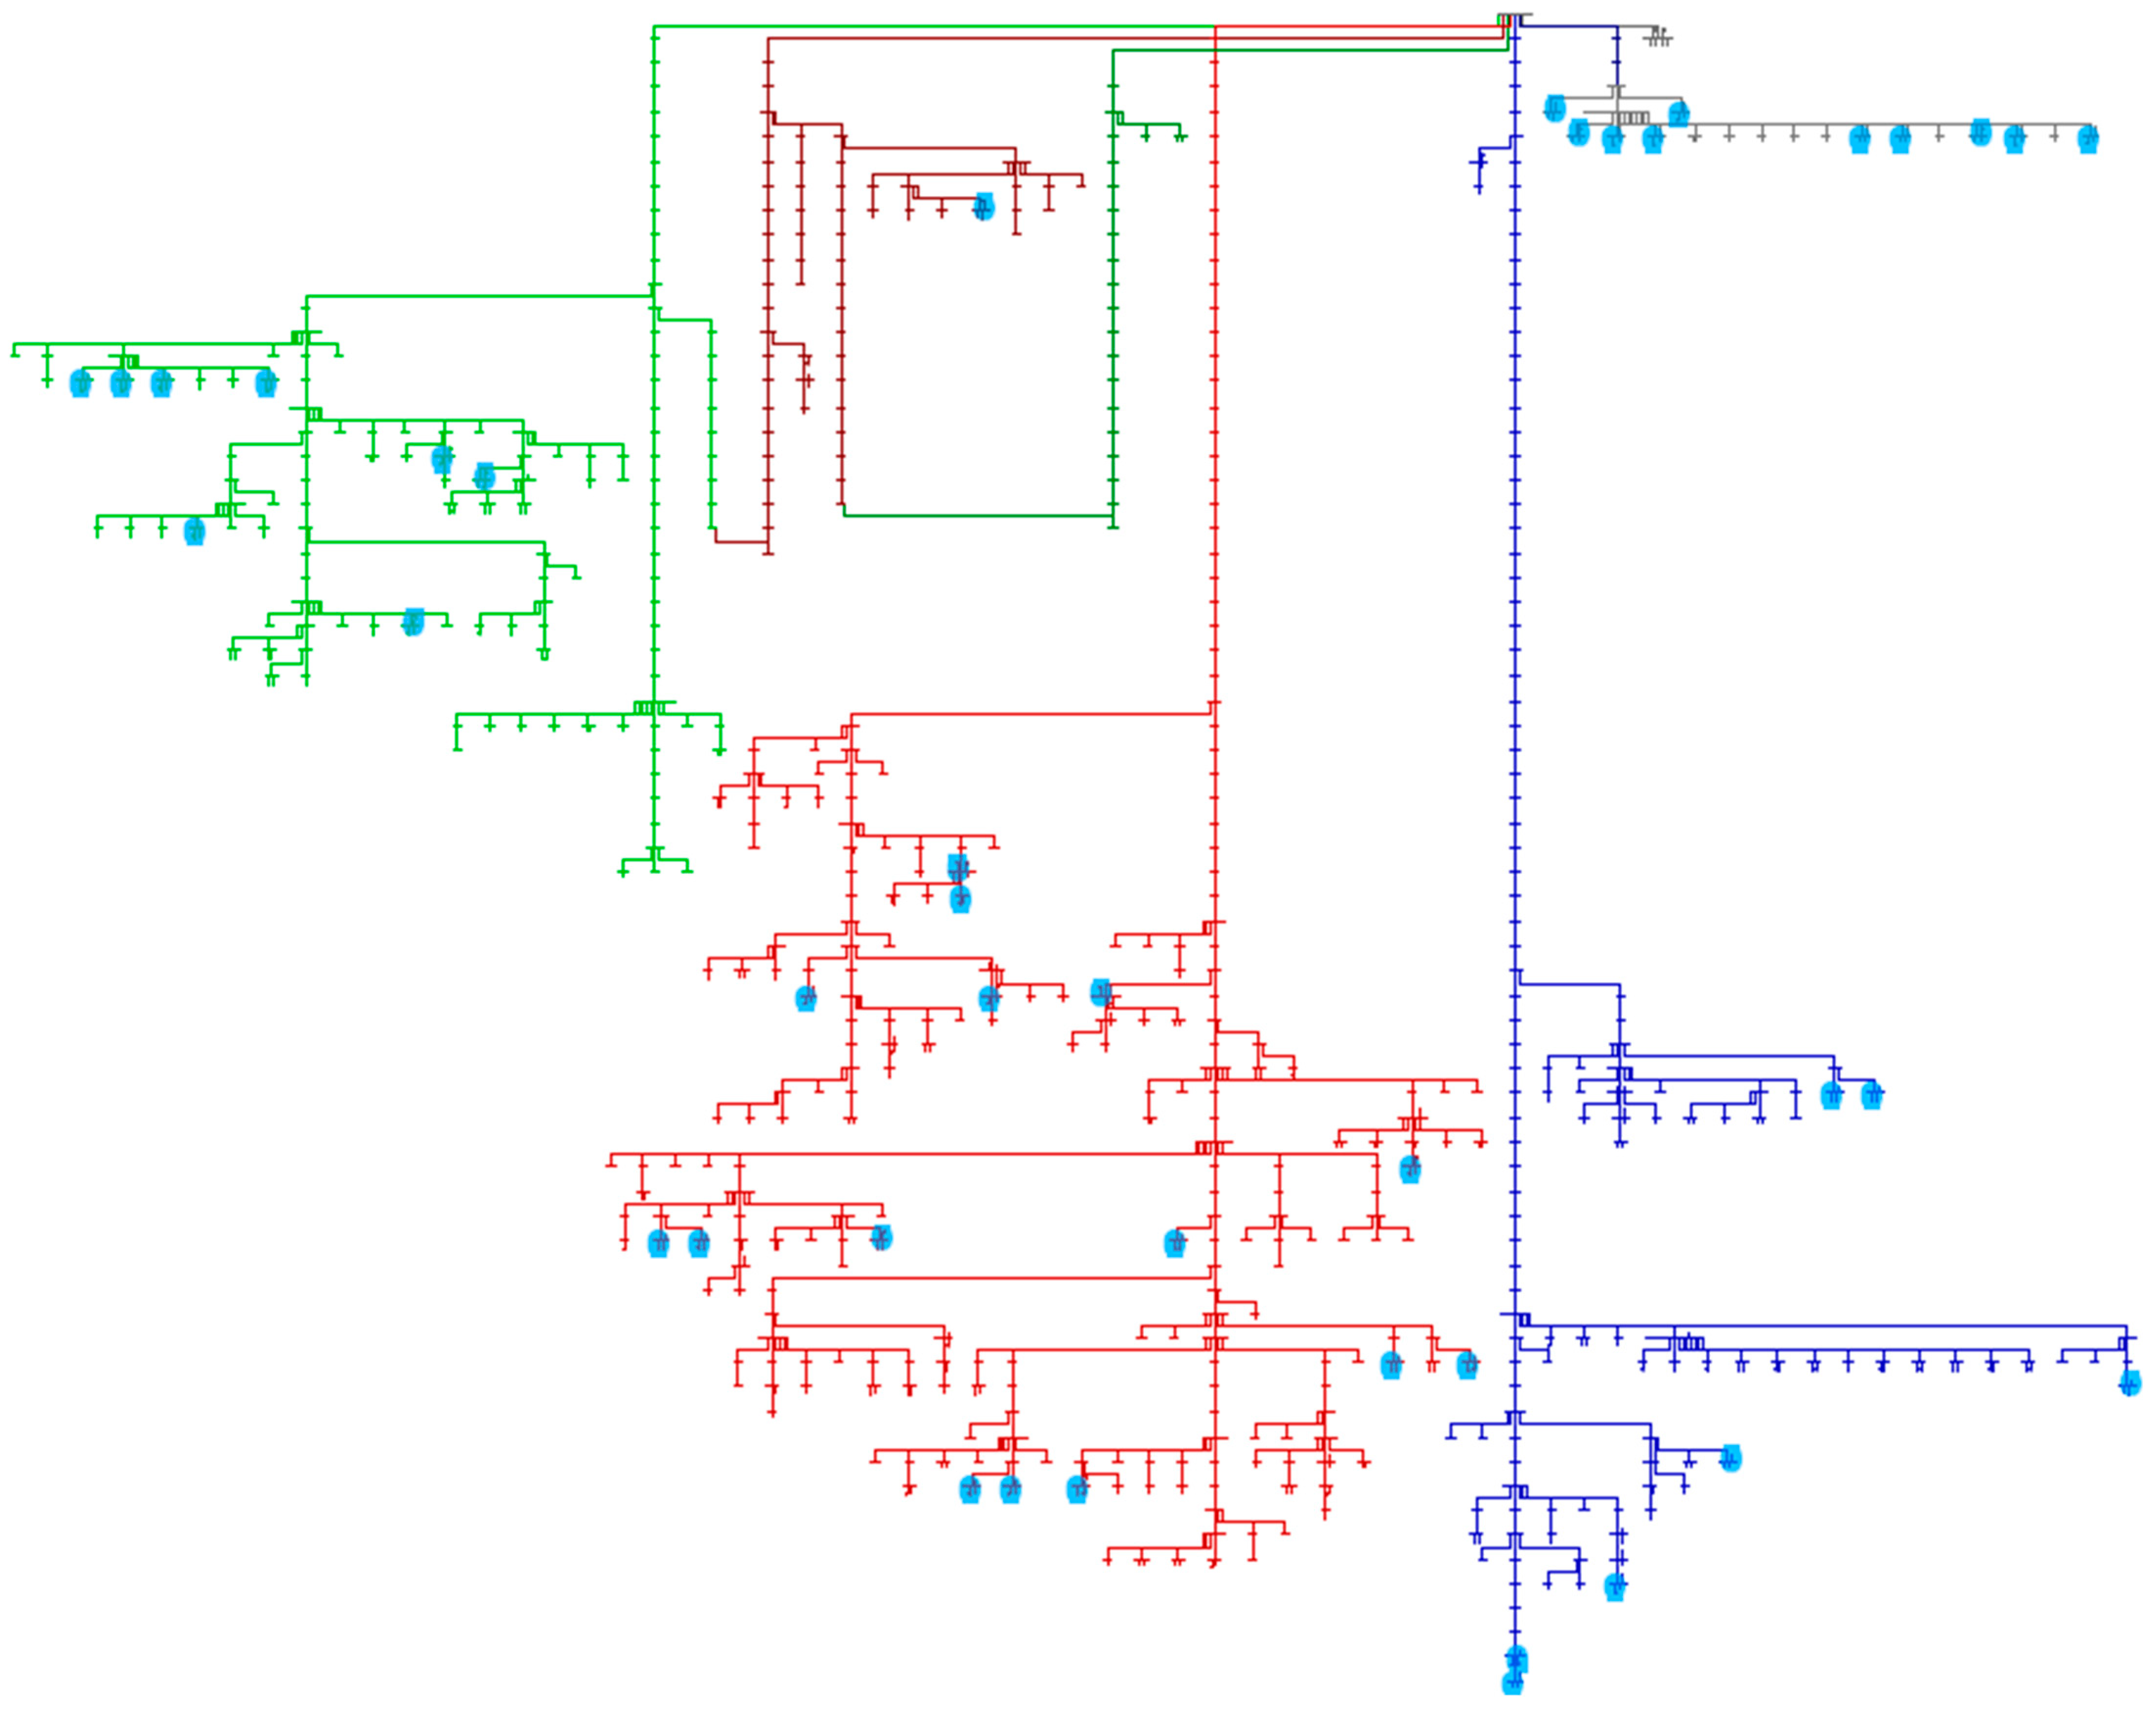
2.1.1. Urban Network

Figure 1 shows the one-line diagram of the benchmark Urban Network.
The Urban Network, defined as the testbench for the present study, is based on the topology sourced from a real urban distribution network in Southern Europe. Comprehensive datasets encompassing line characteristics, transformer specifications, generation capacities, and load demands were procured from a European DSO. These datasets allowed the construction and detailed modeling of the network within the dedicated simulation environment presented in Section 2.5. A high-level overview of the network’s configuration is included in reference [34], documented within its Appendix A. Characterized by a radial LV configuration, the Urban Network connects to a 20/0.4 kV secondary substation, distributing power across 193 distinct supply points. The data include minute-based load profiles at each supply point using anonymized real data, thereby preserving data confidentiality while ensuring the accuracy and applicability of the simulation. The diagram shown in Figure 1 focuses on the LV system connected to a MV/LV secondary substation (MV side is not included in the figure, in order to concentrate on the key information pertinent to the study). The radial configuration of the LV topology of the benchmark system and the different supply points can be observed, represented by dots along the LV lines.
The initial configuration includes a nominal inclusion of self-consumption PV units at two demand nodes. To model a base case scenario reflective of the relevant self-consumption rate, additional PV units have been algorithmically assigned to additional supply nodes (based on random designation), until PV adoption reached a threshold of 20% among the network users. The sizing of each PV installation is strategically determined based on a random selection within 50% to 75% of the maximum nominal demand at the respective connection points. Minute-based solar generation profiles for these additional PV units have been synthesized using generic publicly available solar data sources [35,36,37]. The locations of such PV installations within the network are distinctly highlighted for clarity in Figure 1, where their positions are indicated in blue on the one-line diagram.

2.1.2. Electric Vehicle Demand Modeling

EV consumption is incorporated into the network model described in Section 2.1.1, considering both individual charging units and public charging infrastructure to reflect a comprehensive EV charging ecosystem.
Regarding individual units, electrical connections are characterized by single-phase chargers with a power rating of 3.7 kW, aligning with standard specifications for residential EV chargers. Two types of generic charging profiles have been assigned and implemented in the model, according to the existing conventional load profile of each consumer: a residential profile catering to users who predominantly charge their vehicles overnight at home, and a commercial profile aimed at users who prefer charging their EVs during midday hours, typically at their workplaces.
Concerning public charging points, the benchmark system includes one station directly connected to the LV terminal of the secondary substation transformer. This station includes both fast charging points with capacities up to 100 kW and moderate charging points rated at 50 kW. To generate load profiles for these stations, a specially designed modeling tool has been utilized. This tool allows for the creation of diverse charging profiles, reflecting different start times, charging powers, battery capacities, and states of charge (SoC). Two main types of distributions are used to introduce variability: normal distribution for average values like battery capacities and SoC, and beta distribution for charging power. The normal distribution ensures that values such as battery capacities and SoC vary around a mean with specified standard deviations, while the beta distribution adjusts charging power values within a specified range, reflecting realistic charging behavior. Additionally, the tool accounts for different charging times and power fluctuations during charging cycles. The resulting demand profiles are aggregated to generate comprehensive load curves. This tool was developed and validated by the authors in the framework of the Horizon 2020 project INCIT-EV [38]. More details are included in the corresponding deliverables of the project.
The described charging points are integrated into the network model, incorporating the charging profiles determined by the management strategies explained in Section 2.2, and considering a deployment and utilization level based on the penetration levels specified in Section 2.4, where the total number of EVs connected, expressed as a fraction of the total consumers in the benchmark system, is specified for each scenario analyzed. This modeling ensures a holistic analysis of EV integration within the whole Urban Network model.

2.2. System Management Strategies

Strategies for managing the power system, encompassing both the role of DSOs for the operation of the distribution network and the regulatory and market framework, are crucial for the integration of DER units, LECs, and increasing levels of EV chargers (a focal point of this study). The technical impact of scenarios involving these different actors can vary significantly depending on the system management philosophy adopted. This subsection outlines the system management strategies considered and modeled in this work, which are named the Business As Usual DSO function and active system management.

2.2.1. Business AS Usual DSO Function
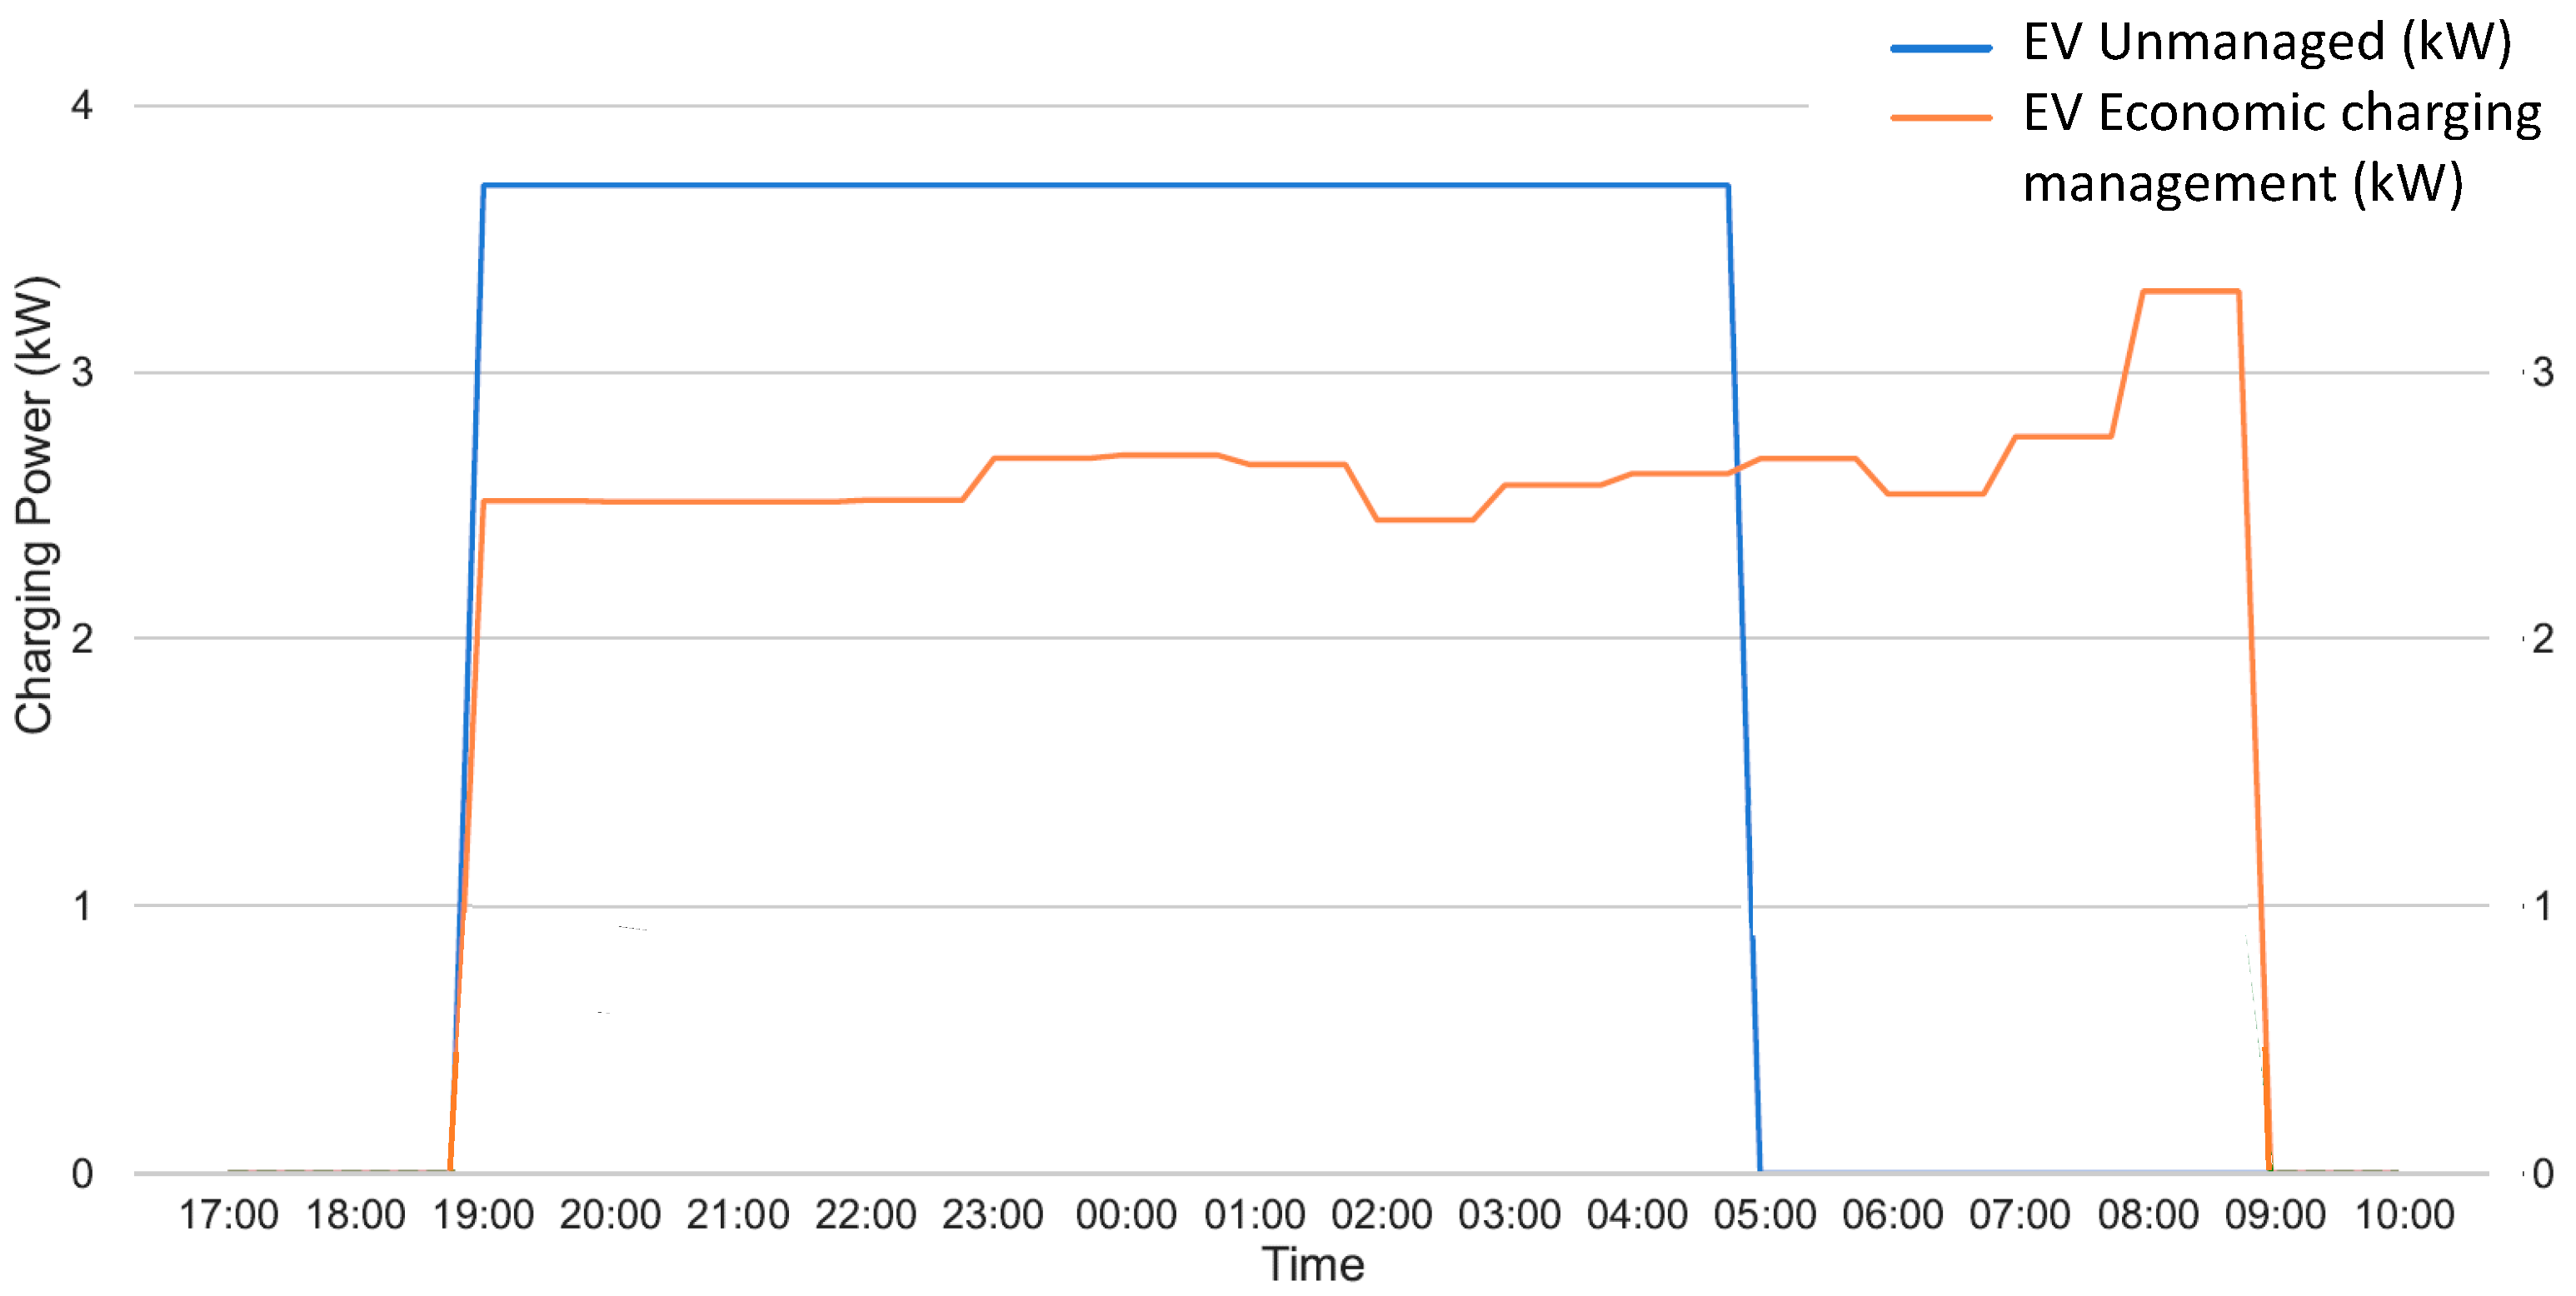
The first strategy considered for modeling the implication of the DSO and the electrical markets to deal with scenarios integrating DER and EV units assumes a conventional approach following current practices, therefore it is called hereinafter Business As Usual (BAU).
Under the BAU model, the existing market frameworks and DSO operational practices are maintained without the introduction of new specific market designs aimed at mitigating congestion or implementing advanced tools for DSOs to monitor and manage directly dispersed resources and manageable loads such as EVs.
Adopting the BAU framework from a systemic perspective, and given the particular emphasis on EV penetration evaluation in this work, two different strategies for individual EV charging processes have been considered and modeled: unmanaged charging and individual economic charging management.
  • Unmanaged EV charging:
    This type of charging does not consider any specific strategy for optimizing the charging process; instead, it takes into account the existing conventional load profile of each consumer, included in the benchmark system described in Section 2.1. In this approach, EVs adjust their charging profiles to align with the existing consumption patterns of the associated consumers. Consequently, a steady slow-charging process has been modeled, with an average charging duration of 8–10 h.
  • Individual economic EV charging management:
    The primary focus of this strategy is to accommodate most charging requests while minimizing the associated costs. Each charging request is characterized by several critical parameters, including the expected arrival time, the expected unplug time, the initial state of the battery charge, and the minimum desired state of charge at the unplug time. Additionally, each request incorporates the static properties of the EV, such as the maximum charging power and the battery capacity.
    This approach involves managing a set of charging stations, each characterized by several charging points, each with a maximum power rating (named Pmaxps in the algorithm used in this methodology), and an overall station power limit (Pmaxss). The methodology involves discretizing the time horizon into a number of N time slots of constant duration (Δt). The solution should satisfy the largest number of requests, ensuring that each EV is charged above its desired state of charge (S1r) before its desired unplug time (T1r). As a secondary objective, the recharging schedules should optimize either the monetary cost of all charging operations or a generalized cost function proportional to the power absorbed from the grid. Therefore, the charging management strategy operates within a predetermined time horizon, conveniently divided into constant time slots. During each of these slots, the strategy aims at optimizing costs associated with power consumption from the grid. Strategic management of these costs across all charging operations enhances the overall economic efficiency of the system.
    The mathematical model that informs the charging management strategy optimizes these charging requests and their respective parameters to create a charging schedule that minimizes monetary costs. In this context, the cost function is significantly influenced by the cost of absorbing constant power from the grid during a specific time slot. This cost consideration plays a pivotal role in the decision-making process of the model, underscoring the inherent cost-effectiveness of the approach. To achieve this, the algorithm considers the maximum power that can be absorbed in each time slot, both at individual stations (Pmaxts) and across all stations (Pmaxt). The charging power for each request (Prt+) and discharging power (Prt−) are assumed constant during each time slot. The algorithm also considers bidirectional charging, where vehicles can inject power back into the grid, and accounts for charging (η+) and discharging (η−) efficiencies. A binary decision variable (yrs) specifies whether a request is served at a station, with a penalty cost incurred for unserved requests. Another binary variable (xrt) indicates whether an EV is charging or discharging during a time slot. The mathematical model optimizes the overall cost, balancing the cost of charging power and the reward for injected power, while ensuring energy conservation and meeting the charging requirements of each EV.
    The strategy respects the specific power constraints of each charging station and the maximum power available for the entire set of stations at each time slot. These power constraints ensure that each charging station operates within its technical capacity. The primary constraints include ensuring each charge request can be served by only one station, setting the state of charge at plug-in and unplug times, and limiting the charging and discharging power to prevent overloading the stations. Additional constraints manage the overall power absorbed during each time slot and ensure that the number of requests served simultaneously does not exceed the number of available plugs at each station. These constraints ensure that the charging schedule is feasible and optimizes the use of available power resources.
    The strategy explained has been developed in the framework of the Horizon 2020 project PARITY [39] with more details provided in the corresponding deliverables.
Figure 2 illustrates an example of charging profiles, comparing unmanaged charging and individual economic charging management.
It can be observed that the unmanaged profile requests higher power concentrated in the first part of the available time while the economic charging management profile distributes it more evenly.

2.2.2. Active System Management

As an evolution of the practices considered for the BAU framework, advanced strategies aimed at facilitating the feasibility of sustainable systems with intensive DER and EV penetration levels are proposed and evaluated. These strategies include the adoption of novel management tools by DSO within the smart grid paradigm, alongside fostering collaboration between DSO and market agents like LEC operators and aggregators, with the common objective of allowing flexibility resources to be seamlessly and effectively incorporated into the system. Such a holistic approach includes implementation of local energy markets (LEM) integrated with LECs as well as local flexibility markets (LFM).
The novel management tools for DSO proposed for this study include functions as key elements for both evaluating the operation variables of the system and proactively acting with the aim of ensuring these variables are kept within healthy limits. Firstly, the smart grid monitoring tool (SGM) analyzes the status of the network in terms of voltage and load levels under a forecasting perspective. Consequently, based on such results, the active network management tool (ANM) activates different actions to pre-emptively address potential future network problems detected by SGM.
The SGM leverages accurate simulation models of the distribution network incorporating network topology and detailed characteristics of the elements. Particularly relevant for the purpose of the tool is to include the forecasted demand in the model and generation profiles for each node within the system. Such predictions are key input data for the SGM tool to conduct power flow analyses to evaluate the grid state over the assessed time horizon. In the strategy proposed, the tool operates in a long-term daily ahead mode, based on forecasts for the upcoming 24 h in 15 min intervals. Consequently, every 15 min, the tool performs analyses of 96 network states, each corresponding to the next 24 h in 15 min steps.
Taking the output of SGM, which offers the DSO an insight of the expected voltage and load levels for each 15 min step of the next 24 h, the forecasted condition of the system is categorized according to a “traffic light” approach. A “green” status represents that the network operates within normal parameters, while if any of the elements operate outside the pre-defined limits, two states are defined (“yellow” and “red”) depending on the severity of limits violations. The quantification of voltage and load limits considered for each state adheres to the general criteria established by power system operators. In this context, DSOs from various countries participating in the Horizon 2020 project PARITY [39], which frames the work presented in this paper, contributed to defining these limits. For voltage levels, the most severe events (“red”) do not exceed the limits established by regulations [40], allowing for intervention before these limits are surpassed. Regarding current levels, common criteria indicate that an overload situation is considered when current levels exceed 100% of the nominal value.
As it is explained below, the identification of future “yellow” and “red” states triggers subsequent actions within the proposed active system management strategy. Figure 3 represents this concept, including voltage and load limits defined for each state.
If the system analysis results in estimations of potential “yellow” or “red” states for any period in the next 24 h, the DSO acts preventively to avoid such events. The proposed strategies imply different types of collaborations among DSO and local energy market operators, including flexibility market approaches, integrating concepts of local energy markets and flexibility markets described in detail in references [41,42,43]. Different levels of intervention are defined, according to the severity of the events forecasted:
  • Yellow states:
    For “yellow” states (medium severity events) the strategy proposed in this study is based on the activation of an implicit flexibility market, enabling a mechanism where flexibility services, particularly those related to adjusting DER generation and electricity demand (this work notably focused on EV charging demand) in response to grid needs, are triggered by market signals rather than explicit commands or direct contracts (which are proposed for “red” states, as described below). This approach is embedded within existing electricity market structures and operates primarily through price signals for the required periods that encourage consumers, or prosumers, to adjust their electricity consumption or production behaviors without a direct request from the grid operators. Consequently, DSO role in this solution comprises an indirect intervention, not acting directly on flexibility resources but inducing market price signals so that during peak demand or when the grid is under stress, prices rise, encouraging reduction in consumption or feeding stored energy back into the grid (or in the case of EVs, activation of V2G capabilities).
  • Red states:
    If the traffic light status classification results in a forecast of a high severity event, the actions initiated by the ANM tool become notably more interventionist concerning the manageable elements (with this study particularly focusing on EV chargers), due to the potential critical impact of the forecasted situation on the health of the network. To address red states, two alternative solution approaches are proposed and assessed in this study: the first relies on the direct intervention of the DSO, and the second involves actions derived from the implementation of an explicit LFM. If both medium severity (yellow) events and high severity (red) events are forecasted, the whole local system is managed according to specific actions defined to manage red light events.
    The first approach prioritizes technical criteria and assumes that, as the grid faces stress due to constraint violations, the DSO is allowed to implement direct load control forcing manageable loads to be switched off or reduced. According to the traffic light classification and the outputs from the SGM tool, the DSO determines the total power reduction required to prevent a red state. Subsequently, this reduction is allocated evenly across all available EV charging units, emitting orders to reduce the charging power uniformly, independent of the initial charging power, eventually including the need to feed power back into the grid in the case of vehicles and charging stations with V2G capabilities.
    In the second approach for solving red light events, the DSO activates an explicit LFM market, which is designed to directly engage flexibility service providers and the DSO in a structured marketplace where flexibility needs, particularly for congestion management and voltage control, are explicitly traded. In this case, collaboration between DSOs, market operators, and agents such as demand aggregators and LEC operators and managers is instrumental in orchestrating the market dynamics to ensure energy demand and supply are balanced in a way that leverages local energy resources and flexibility services optimally to guarantee the security of the network.
    The explicit LFM operates analogously to ancillary services (AS) markets at the transmission system operator (TSO) level but is focused on the DSO’s needs for flexibility. In this model, the DSO places requests for flexibility on the LFM platform guided by needs forecasted by SGM and ANM tools. The process involves a range of pre-qualified flexibility providers, including aggregators and LEC operators and managers, responding to these requests with offers of flexibility services. The explicit LFM is designed to complement the LEM, where prosumers engage in peer-to-peer (P2P) trading. The LFM specifically addresses the need for operational flexibility to maintain grid stability, distinct from the energy trading activities in the LEM.
    With this approach, upon red state identification, the DSO calculates the power reduction required for avoiding the forecasted high severity events and activates the explicit LFM for the affected period, aiming at obtaining flexibility resources that solve such network constraints. Thus, the aggregator/LEC manager selected after providing the most competitive offer within such LFM implements the necessary adjustments to the demands (in this case, EV chargers) under its management to meet the flexibility needs requested by the DSO.

2.3. Impact Assessment Indicators

According to the methodology followed in the present work, the quantitative assessment of the impact of EV penetration on LEC-based sustainable distribution networks relies on the analysis of KPIs, through a series of scenarios applied to the defined benchmark system. The definition of the KPIs is aimed at reflecting the condition of voltage levels and load levels at the different nodes and elements of the LV distribution network under analysis, since these are variables highly representative of the status of a power system in steady state conditions. Furthermore, such parameters are strongly affected by electricity demand growth (in the present study, particularly from EVs) and DER penetration, both key factors of the scenarios related to the energy transition.
Particularly, the KPIs defined for this assessment quantify the number of occurrences of healthy limits violations:
  • Voltage levels KPI: This indicator tracks the number of occurrences of node voltage levels above or below healthy operational ranges.
  • Load levels KPI: This indicator measures the number of occurrences of line section load levels above healthy operational ranges, thus indicating overloads.
For each variable, every instance is counted as an occurrence when an element falls in the defined limits, considering the whole analyzed period. Two levels of range violations severity are considered to quantify the occurrences of voltage/load events, following the same criteria described above for the “traffic light” approach (see Figure 3). Table 1 summarizes the criteria defined to classify healthy limits violations for both voltage and load levels.

2.4. Scenarios

The scenarios analyzed in the present study are designed to reflect the progressive integration of EVs within the context of PV-based LEC, highlighting the synergy between sustainability goals and the electrification efforts which define the context of this work. The following Table 2 provides a summary of the scenarios developed for this analysis.
In terms of EV penetration, different levels have been assumed based on the proportion of consumers equipped with EV chargers. For individual chargers, the approach to allocating charging points mirrors the one used for initial PV unit penetration; namely, the baseline scenario for EV charger distribution incorporates a sustainable self-consumption model where the same consumers integrating PV units are also equipped with EV chargers. For subsequent scenarios following the baseline, the location of new EV chargers is determined randomly, reflecting a variety of potential future states of EV adoption. PV penetration is constant across the different scenarios, in order to keep the focus of the analysis on the growth of demand represented by EV chargers. This approach facilitates a clearer understanding of the impact that rising EV adoption has on the power system, without the variability introduced by fluctuating levels of PV integration.
Furthermore, the scenarios extend beyond EV penetration levels, including the treatment of individual EV charging strategies and power system management as primary considerations. As detailed in Section 2.2, the latter encompasses both technical control mechanisms for the distribution network and market configurations, which are essential for a comprehensive assessment. In this sense, given that the principal aim of active system strategies is to address potential events effectively, only the scenario with the highest level of EV penetration is considered for analyzing this system management approach. This ensures a focused assessment of the strategies’ impact on mitigating network challenges.

2.5. Simulation Methods

The results that feed the calculation process of the indicators described in Section 2.3 are obtained from power flow simulations. Based on the network model and scenarios implemented, simulations allow the study of the evolution of load and generation profiles along the analyzed period, and the subsequent effect on the state variables selected. A whole month has been considered for the analysis, considering one minute for the simulation step, therefore obtaining results for voltage and load levels for each element of the network for every minute of the analyzed month. The software platform selected to conduct such analyses is PowerFactory DIgSILENT (version 2022) [44] in which the network described in Section 2.1, considering the scenarios explained in Section 2.4, has been modeled.
The simulation methodology emulates the different system management strategies described in Section 2.2. Thus, for the BAU DSO function, the modeling of the EV charging profiles contemplates both explained strategies (unmanaged charging and individual economic charging management), therefore being a differential input for obtaining the results of the power flow analysis. In addition, within the framework of active system management, the simulations carried out emulate the operation of the SGM tool, obtaining the results of voltage and load levels which subsequently would feed the “traffic light” classification approach for event forecasting and management. Furthermore, to simulate the responses to identified voltage or load limit violations and to assess the efficacy of implemented solutions, the EV charging profiles adjusted according to the strategies under consideration (implicit LFM, explicit LFM, or direct load profile modifications by the DSO) are integrated into the system model. Next, power flow simulations are re-executed, integrating the resulting charging profiles and revealing the impacts of these management strategies.
Taking advantage of the capabilities of the simulation platform, a Python-based tool has been developed with the goal of generating a comprehensive database of occurrences of limit violations following criteria described in Section 2.3. This tool, applied for each scenario, automatically executes power flow simulations every minute considering the evolution of load and generation profiles along the whole period considered. After each simulation, the tool automatically records and captures voltage and load events considering the ranges specified in Table 1, storing the information in a structured database. This approach allows for an extensive analysis of network performance with respect to the defined KPIs.

3. Results

This section summarizes the results of the study performed for each scenario implemented in the benchmark system considering the different system management and charging strategies described above. According to the KPI’s definition detailed in Section 2.3, the results are expressed in terms of the number of occurrences of variables exceeding the limits defined in Table 1.

3.1. Results for Business As Usual (BAU) DSO Function Scenarios

The following subsections present the results obtained for the scenarios which consider the BAU fucntion of the DSO, contemplating the different individual strategies for EV chargers described in Section 2.2.1.

3.1.1. Unmanaged EV Charging

Results for voltage levels and overloads are presented next.
  • Voltage levels.
    Table 3 provides a summary of voltage violation results for each EV penetration scenario, based on a one-month analysis period.
    The data show an increase in medium severity voltage violations as EV penetration rises to 40% and 60%. No high severity violations are registered.
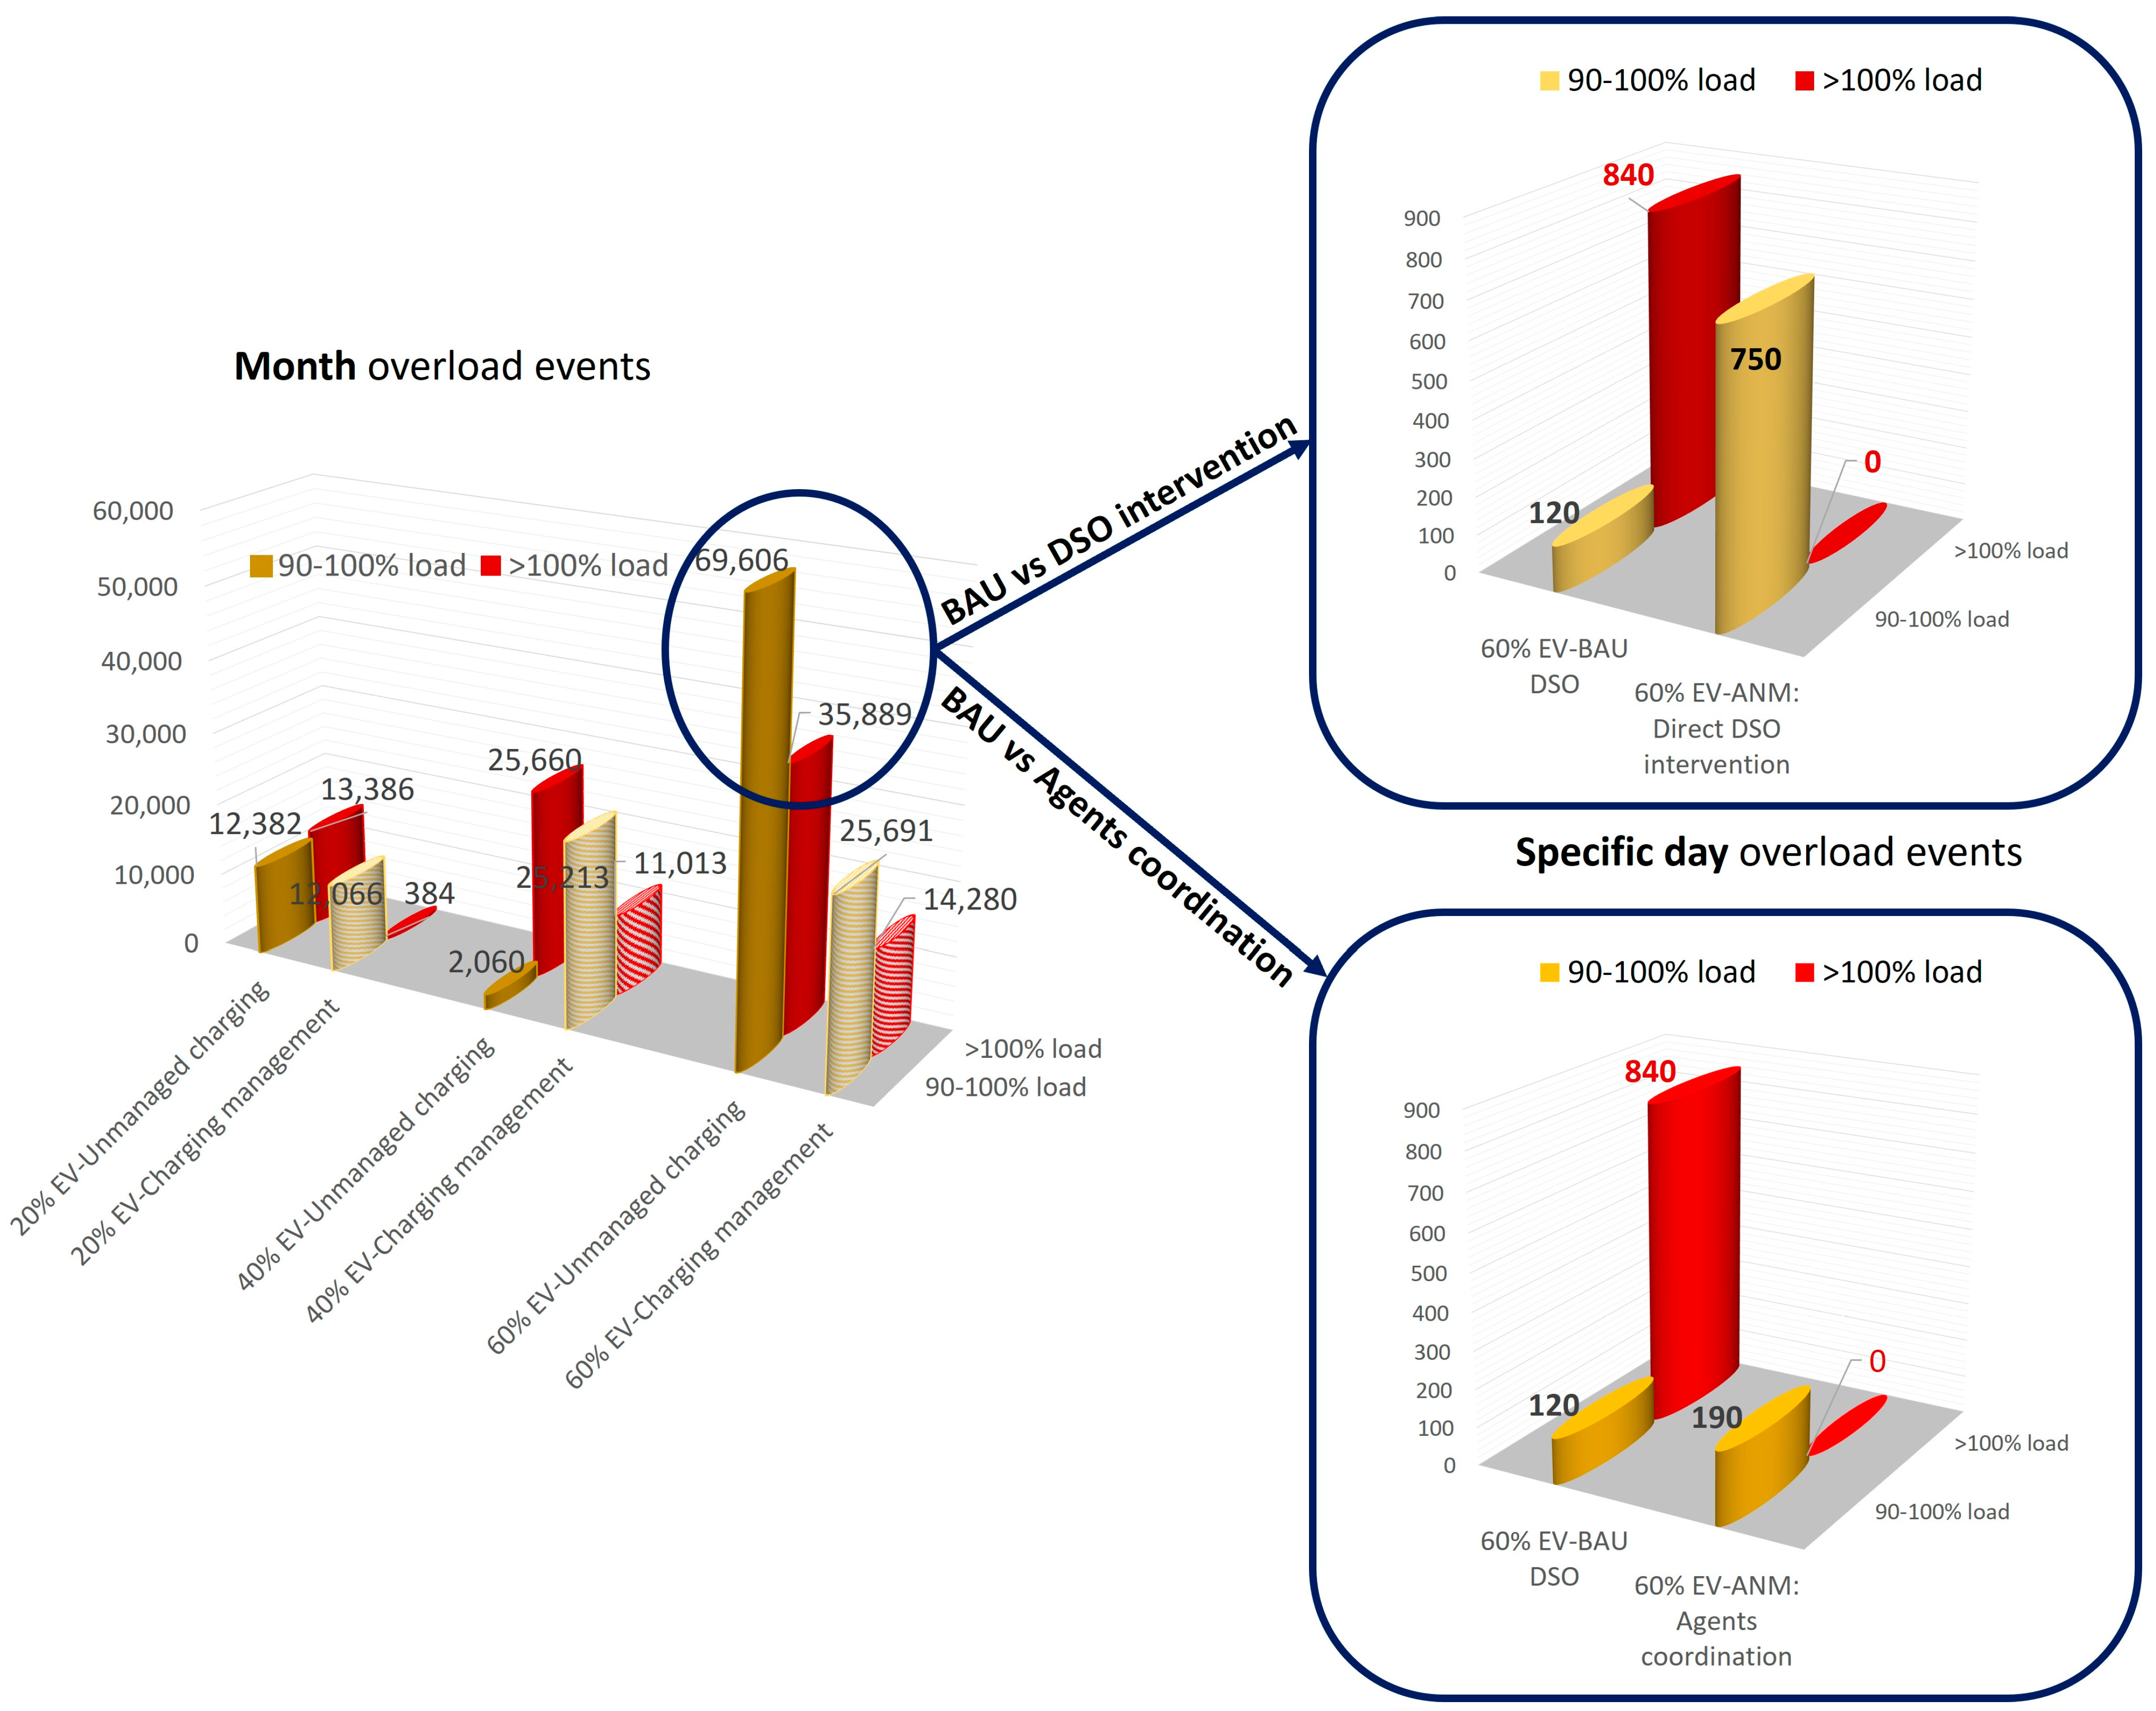
  • Load levels.
    Table 4 presents load level results for the different scenarios. For a penetration level of 20%, it can be observed that a significant number of overload cases, both medium and high severity, occur. As EV penetration rises from 20% to 60%, the number of medium severity cases initially declines from Scenario 1 to Scenario 2, while high severity cases relevantly increase. The reduction in medium severity cases is explained by a shift of some cases escalating to high severity. In Scenario 3, both medium and high severity cases see a substantial increase.

3.1.2. Individual Economic EV Charging Management

Results for voltage levels and overloads are presented next.
  • Voltage levels.
    Table 5 provides an overview of the node voltage results considering individual economic charging management over a one-month analysis period. The results indicate that only the highest level of EV penetration leads to the occurrence of medium severity voltage violations. No such violations are observed in the base case or the lower EV penetration scenarios. Furthermore, no high severity voltage violations are detected across all scenarios.
  • Load levels.
    Table 6 shows the overload results. It can be observed that as EV penetration growths the number of medium severity and high severity cases rises (although it does not linearly correlate with EV penetration increase), which underscores the necessity for additional measures to ensure the secure operation of the distribution network in scenarios with high levels of EV charging penetration.

3.1.3. Comparison of Results in BAU Scenarios

This subsection presents a quantitative comparison of voltage and load results for BAU DSO scenarios considering the two individual EV charging strategies studied.
  • Voltage levels.
    Table 7 presents a comparison of node voltage results, focusing specifically on medium severity voltage violations. The data reveal a significant difference, regarding impact on voltage violations, between the two strategies. At 40% EV penetration, the economic charging management strategy completely eliminates the voltage violations observed under unmanaged charging. Furthermore, at the higher EV penetration of 60%, the economic strategy drastically reduces the number of voltage violations by 71% compared to the unmanaged approach.
  • Load levels.
    Table 8 presents a comparison of overload results under both charging strategies. As can be seen, in the 20% EV penetration scenario, the individual economic charging management strategy results in a moderate decrease in medium severity overloads and a substantial reduction in high severity overloads. However, at 40% EV penetration, the economic charging management strategy leads to an increase in medium severity overloads, but a significant reduction in high severity overloads. The explanation for this behavior is that economic optimization adapts the duration and power of charging periods, resulting in more vehicles charging at the same time, although with lower peak consumption than in the unmanaged case, thus producing medium congestions instead of high ones, which are reduced.
    Finally, at the highest level of EV penetration considered (60%), the economic charging strategy results in substantial reductions in both medium and high severity overloads compared to the unmanaged approach. Nevertheless, as highlighted above, a relevant number of medium and high severity overload events occur even when implementing the individual economic charging strategy.

3.2. Results for Active System Management Scenarios

As detailed in Section 2.5, the methodologies encompassing active system management strategies have been modeled in the simulation platform to reflect their application within the context of this study. Given that the level of intervention from the DSO and market participants varies between yellow and red light event cases, as detailed in Section 2.2.2, the simulations presented in this subsection are focused on two specific days, one with only yellow light events, and another with both yellow and red light events, both days considering the highest EV penetration rate assessed (60% of users). Moreover, the analysis concentrates on overload events which, based on the findings from BAU scenarios, have been identified as critical.
This approach allows for a direct assessment of the effectiveness of the management strategies under review. Thus, power flow simulations for each specific day provide outcomes on events forecasted for the day, emulating the SGM tool. Following this, subsequent further simulations integrate the responses from operational and market strategies defined according to the severity of the events to be faced.

3.2.1. Yellow Light (Medium Severity) Events Day Management

Table 9 shows the results on overload yellow light events.
As can be observed, the actions implemented to prevent yellow light events, based on the application of implicit LFM, achieve avoiding the occurrence of such overloads.

3.2.2. Red Light (High Severity) Events Day Management

This subsection presents the results of one day with both red and yellow light events. In such cases, the whole local system is managed according to specific actions defined to manage red light events. As detailed in Section 2.2.2, two different alternatives are proposed to avoid the forecasted red light events, one based on direct DSO control over manageable loads (EV chargers), and an alternative one relying on cooperation between DSOs and market agents, aggregators, and LEC managers within an explicit LFM framework. The results for both approaches are presented next.
  • Direct DSO intervention.
    Table 10 shows the results regarding overload events, comparing the BAU and active system management scenarios under the direct DSO intervention approach. It can be observed that the actions of the DSO are effective in avoiding red state congestions. Nonetheless, there is an observed rise in medium severity events, since some potential red light events have been mitigated to yellow light status.
  • Agent’s coordination. Explicit LFM framework.
    Table 11 presents the results of overload events comparing the BAU and active system management scenarios based on the coordination of market agents/aggregator/LEC managers selected after the application of an explicit LFM framework. Aligned with the direct DSO intervention strategy, red light events are completely avoided. Additionally, while there is a marginal increase in the number of yellow light events, such figures remain within moderate bounds.

4. Discussion

The relationship between electric vehicle (EV) penetration and the operational stability of sustainable distribution networks is a critical issue in the broader context of the energy transition. The research presented in this article, using a series of methodically structured scenarios within a representative urban distribution network with integrated LECs as a testbed, examines this relationship through the prism of different levels of electric vehicle penetration, individual charging strategies, and different approaches for complete system management.
An immediate finding from the analysis of the results is the substantial increase in both medium and high severity load violations as EV penetration levels increase. Thus, under the Business As Usual framework (without implementing specific advanced system management strategies), the transition from 20% to 60% EV penetration culminates in a notable surge in high severity load violations, illustrating the pronounced impact of elevated EV integration on network stability. As a first step towards mitigating such adverse effects within a BAU scenario from a DSO perspective, the implementation of charging control techniques for individual application on EV chargers shows promising results. However, even though such insights into the comparative performance of unmanaged versus economically managed EV charging strategies further illuminate the potential of strategic EV load management in mitigating grid stress (the economic charging strategy, for instance, evidences a remarkable reduction in the number of load violations, illustrating the beneficial impacts of integrating demand response mechanisms into EV charging practices), severe overloads are still obtained in high EV penetration scenarios. This observation underscores the indispensable role of DSOs in pre-emptively addressing potential grid instabilities through advanced system management practices.
The effectiveness of the advanced system management strategies proposed in this research, based on smart grid monitoring (SGM) and active network management (ANM) tools, in mitigating these challenges is significant, according to the numerical results obtained. The proposed scheme provides tools for DSOs to undertake proactive measures, guided by the forecasted categorization of system conditions through a “traffic light” approach, which allows for averting potential grid instabilities. The results of the simulations performed demonstrate the complete avoidance of high severity voltage and load events when active system management strategies are applied, which is particularly relevant in scenarios with high EV penetration rates. Figure 4 offers a visual comparison of the overload events results obtained, considering the different approaches analyzed in this work. On the left side, the figure illustrates the number of medium and high severity events obtained over an entire month analyzed within the BAU framework, comparing different EV penetration scenarios and individual charging methodologies (thereby encapsulating the findings elaborated in Section 3.1). The right side of the figure zooms in on the outcomes for a specific day, focusing on the highest level of EV penetration examined in this research, representing the results explained in Section 3.2. This part of the picture includes both approaches for the active system management strategies described in Section 2.2.2, thus providing a comprehensive overview of the findings on overload events under varying operational strategies.

5. Conclusions

The work presented in this paper aims to assess the impact of increasing electric vehicle (EV) penetration on sustainable distribution networks, with a particular focus on local energy communities (LECs) supported by distributed energy resources (DERs). A variety of EV integration levels implemented on different scenarios that reflect diverse charging strategies and system management approaches are evaluated under the perspective of analyzing their effects on network stability indicators.
Key factors to this analysis are the roles of smart grid monitoring (SGM) and active network management (ANM) tools in enhancing the proactive capabilities of distribution system operators (DSOs). The findings obtained advocate for a paradigm shift in planning and operation methodologies for DSOs and the relevant actors of electricity distribution ecosystems, emphasizing the need for a proactive rather than a reactive approach to systems management, hinging on the predictive capabilities afforded by smart grid technologies.
As can be concluded from the results presented, among the two approaches for active system management strategies, the one relying on cooperation between DSOs and market agents within an explicit LFM framework offers even better outcomes. Therefore, the roles of demand aggregators and LEC managers emerge as crucial in this evolved grid management framework. By facilitating the coordination of dispersed energy resources and loads, these actors contribute significantly to the system’s overall flexibility, a critical attribute for accommodating the inherent variability of renewable energy sources. The implementation of LEM and LFM, as observed in the analyzed scenarios, plays a pivotal role in harmonizing the interests of various stakeholders, including prosumers and the broader energy community. These markets not only enhance grid resilience but also pave the way for a more democratized energy landscape, wherein consumers actively participate in energy generation, consumption, and sharing.
In light of these findings, future research directions will focus on refining the operational models of the SGM and ANM tools, exploring advanced algorithms for increasingly accurate prediction of grid states. Moreover, the evolving role of DSOs, in concert with demand aggregators and LEC managers, provides a highly valuable framework for further investigation, particularly in the context of facilitating seamless integration of LEMs and LFMs into existing energy markets. The evolution of this research framework will be focused on accommodating significantly expansive levels of self-consumption facilities, considering the integration of multiple renewable energy sources, such as wind (additional to solar power) [45]. In addition, the availability of various manageable electricity demand loads complementing EV charging, such as heating, ventilation, and air conditioning (HVAC) systems within residential and office buildings involved in LEC, will complement the sustainable LEC approach addressed. The growing penetration of distributed generation units may evolve towards a future where their capacity might surpass local demand levels; therefore, system management strategies will be further challenged to ensure grids’ stability, which include addressing uncertainties in renewable generation to enhance system robustness and incorporating scenario-based stochastic optimization techniques [46].

Author Contributions

Conceptualization, S.B.V., A.L.E. and L.H.-C.; methodology, S.B.V., G.F. and N.G.; software, G.F., N.G., M.S., M.D. and V.G.; validation, S.B.V., G.F. and N.G.; formal analysis, S.B.V. and G.F.; investigation, S.B.V., G.F., N.G., M.S., M.D. and V.G.; resources, G.F., N.G., M.S., M.D. and V.G.; writing—original draft preparation, S.B.V.; writing—review and editing, S.B.V., A.L.E. and L.H.-C.; visualization, S.B.V.; supervision, A.L.E. and L.H.-C. All authors have read and agreed to the published version of the manuscript.

Funding

This research has received funding from the European Union’s Horizon 2020 Framework Program for Research and Innovation under grant agreement no. 864319, project PARITY.

Institutional Review Board Statement

Not applicable.

Informed Consent Statement

Not applicable.

Data Availability Statement

Main data used for the study are contained in the article or available in the references included along the text. Some specific data used for modeling purposes and details on results are restricted and confidential within the PARITY project framework.

Acknowledgments

The authors thank all project PARITY partners (CERTH, CIRCE, UNICOSIA, HYPERTECH, MERIT, CUERVA, URBENER, BFS, HEDNO, CWATT, E.ON, AEM, SUPSI, HIVE, E7, QUE, UDEUSTO, MERITCH, EON-EIS) for supporting the research carried out, providing information on distribution grids and for their support and expertise, which was essential for the development of this research. In addition, this study has been carried out under the collaboration framework signed by CIRCE Technology Center and University of Valladolid.

Conflicts of Interest

The authors declare no conflict of interest.

References

  1. European Commission. Directorate-General for Communication, European Green Deal—Delivering on Our Targets. Publications Office of the European Union, 2021. Available online: https://data.europa.eu/doi/10.2775/373022 (accessed on 1 June 2022).
  2. Boyle, A.D.; Leggat, G.; Morikawa, L.; Pappas, Y.; Stephens, J.C. Green New Deal proposals: Comparing emerging transformational climate policies at multiple scales. Energy Res. Soc. Sci. 2021, 81, 102259. [Google Scholar] [CrossRef]
  3. IEA. Net Zero by 2050; IEA: Paris, France, 2021; Available online: https://www.iea.org/reports/net-zero-by-2050 (accessed on 16 May 2023).
  4. IEA. Electrification; IEA: Paris, France, 2022; Available online: https://www.iea.org/reports/electrification (accessed on 16 May 2023).
  5. IEA. Global EV Outlook 2023; IEA: Paris, France, 2023; Available online: https://www.iea.org/reports/global-ev-outlook-2023 (accessed on 16 May 2023).
  6. IEA Report (2022): Solar PV and Wind Supply about 40% of Building Electricity Use by 2030. Available online: https://www.iea.org/reports/solar-pv-and-wind-supply-about-40-of-building-electricity-use-by-2030 (accessed on 16 May 2023).
  7. Eichman, J.; Castelló, M.T.; Corchero, C. Reviewing and Exploring the Qualitative Impacts That Different Market and Regulatory Measures Can Have on Encouraging Energy Communities Based on Their Organizational Structure. Energies 2022, 15, 2016. [Google Scholar] [CrossRef]
  8. Moroni, S.; Antoniucci, V.; Bisello, A. Local Energy Communities and Distributed Generation: Contrasting Perspectives, and Inevitable Policy Trade-Offs, beyond the Apparent Global Consensus. Sustainability 2019, 11, 3493. [Google Scholar] [CrossRef]
  9. Ahmed, S.; Ali, A.; D’angola, A. A Review of Renewable Energy Communities: Concepts, Scope, Progress, Challenges, and Recommendations. Sustainability 2024, 16, 1749. [Google Scholar] [CrossRef]
  10. Ahmadi, B.; Shirazi, E. A Heuristic-Driven Charging Strategy of Electric Vehicle for Grids with High EV Penetration. Energies 2023, 16, 6959. [Google Scholar] [CrossRef]
  11. Liu, D.; Zeng, P.; Cui, S.; Song, C. Deep Reinforcement Learning for Charging Scheduling of Electric Vehicles Considering Distribution Network Voltage Stability. Sensors 2023, 23, 1618. [Google Scholar] [CrossRef] [PubMed]
  12. Heath, E.; Wolbertus, R.; Heller, R. Optimal Sizing of a Battery-Supported Electric Vehicle Charging Hub with a Limited-Capacity Grid Connection. World Electr. Veh. J. 2024, 15, 133. [Google Scholar] [CrossRef]
  13. Fakhrooeian, P.; Pitz, V.; Scheppat, B. Systematic Evaluation of Possible Maximum Loads Caused by Electric Vehicle Charging and Heat Pumps and Their Effects on Common Structures of German Low-Voltage Grids. World Electr. Veh. J. 2024, 15, 49. [Google Scholar] [CrossRef]
  14. Pijarski, P.; Kacejko, P.; Wancerz, M. Voltage Control in MV Network with Distributed Generation—Possibilities of Real Quality Enhancement. Energies 2022, 15, 2081. [Google Scholar] [CrossRef]
  15. Prashant; Siddiqui, A.S.; Sarwar; Althobaiti, A.; Ghoneim, S.S.M. Optimal Location and Sizing of Distributed Generators in Power System Network with Power Quality Enhancement Using Fuzzy Logic Controlled D-STATCOM. Sustainability 2022, 14, 3305. [Google Scholar] [CrossRef]
  16. Rana, M.; Atef, M.; Sarkar, R.; Uddin, M.; Shafiullah, G. A Review on Peak Load Shaving in Microgrid—Potential Benefits, Challenges, and Future Trend. Energies 2022, 15, 2278. [Google Scholar] [CrossRef]
  17. Milczarek, A.; Możdżyński, K. A Unified Data Profile for Microgrid Loads, Power Electronics, and Sustainable Energy Management with IoT. Energies 2024, 17, 1277. [Google Scholar] [CrossRef]
  18. Liu, G.; Sun, W.; Hong, H.; Shi, G. Coordinated Configuration of SOPs and DESSs in an Active Distribution Network Considering Social Welfare Maximization. Sustainability 2024, 16, 2247. [Google Scholar] [CrossRef]
  19. Lin, W.-C.; Hsiao, C.-H.; Huang, W.-T.; Yao, K.-C.; Lee, Y.-D.; Jian, J.-L.; Hsieh, Y. Network Reconfiguration Framework for CO2 Emission Reduction and Line Loss Minimization in Distribution Networks Using Swarm Optimization Algorithms. Sustainability 2024, 16, 1493. [Google Scholar] [CrossRef]
  20. Fernández, G.; Galan, N.; Marquina, D.; Martínez, D.; Sanchez, A.; López, P.; Bludszuweit, H.; Rueda, J. Photovoltaic Generation Impact Analysis in Low Voltage Distribution Grids. Energies 2020, 13, 4347. [Google Scholar] [CrossRef]
  21. Majeed, A.A.; Abderrahim, M.; Alkhazraji, A.A. Optimal Allocation of Photovoltaic-Green Distributed Generation for Maximizing the Performance of Electrical Distribution Networks. Energies 2024, 17, 1376. [Google Scholar] [CrossRef]
  22. Coignard, J.; Rigo-Mariani, R.; Debusschere, V. Individual and collective objectives in an energy community with network constraints. Sustain. Cities Soc. 2024, 101, 105083. [Google Scholar] [CrossRef]
  23. Klaassen, E.; Van der Laan, M. USEF White Paper—Energy and Flexibility Services for Citizens Energy Communities. USEF Foundation, 2019. Available online: https://www.usef.energy/app/uploads/2019/02/USEF-White-Paper-Energy-and-Flexibility-Services-for-Citizens-Energy-Communities-final-CM.pdf (accessed on 24 March 2024).
  24. Yu-Zhuo, Z.; Xin-Gang, Z.; Ling-Zhi, R.; Yi, Z. The development of the renewable energy power industry under feed-in tariff and renewable portfolio standard: A case study of China’s wind power industry. J. Clean. Prod. 2017, 168, 1262–1276. [Google Scholar] [CrossRef]
  25. Saif, A.U.N.I.; Khadem, S.K. Consumer-centric Electricity Market: Review of key European projects. In Proceedings of the 2020 17th International Conference on the European Energy Market (EEM), Stockholm, Sweden, 16–18 September 2020; pp. 1–6. [Google Scholar] [CrossRef]
  26. Jin, X.; Wu, Q.; Jia, H. Local flexibility markets: Literature review on concepts, models and clearing methods. Appl. Energy 2020, 261, 114387. [Google Scholar] [CrossRef]
  27. CEER. Flexibility Use at Distribution Level—A CEER Conclusion Paper. 2018. Available online: https://www.ceer.eu/wp-content/uploads/2024/04/2018_07_16_C18-DS-42-04_Flexibility_Use_at_Distribution_Level.pdf. (accessed on 28 March 2024).
  28. CEER. CEER Paper on Electricity Distribution Tariffs Supporting the Energy Transition. Council of European Energy Regulators, 2020. Available online: https://www.ceer.eu/wp-content/uploads/2024/04/C19-DS-55-04_CEER-paper-electricity-distribution-tariffs.pdf. (accessed on 28 March 2024).
  29. CEER. CEER Paper on DSO Procedures of Procurement of Flexibility. Council of European Energy Regulators, 2020. Available online: https://www.ceer.eu/wp-content/uploads/2024/04/C19-DS-55-05_Flexibility-procurement-2.pdf. (accessed on 28 March 2024).
  30. Borroy, S.; Marquina, D.; Llombart, A.; Hernández-Callejo, L. Effect of sustainable Local Energy Communities on low voltage distribution networks. In Proceedings of the V Iberoamerican Conference of Smart Cities—ICSC-CITIES 2022, Cuenca, Ecuador, 28–30 November 2022. [Google Scholar]
  31. Borroy, S.; Marquina, D.; Llombart, A.; Lamadrid, N.Z.; Hernandez-Callejo, L. Technical evaluation of European and North American sustainable benchmark scenarios based on renewable Local energy Communities penetration. Sustain. Energy Technol. Assess. 2023, 60, 103556. [Google Scholar] [CrossRef]
  32. The IEEE European Low Voltage Test Feeder. Available online: https://cmte.ieee.org/pes-testfeeders/ (accessed on 1 June 2022).
  33. The IEEE European Low Voltage Test Feeder: Resources Page. Available online: https://cmte.ieee.org/pes-testfeeders/wp-content/uploads/sites/167/2017/08/European_LV_Test_Feeder_v2.zip (accessed on 1 June 2022).
  34. Fernández, G.; Martínez, A.; Galán, N.; Ballestín-Fuertes, J.; Muñoz-Cruzado-Alba, J.; López, P.; Stukelj, S.; Daridou, E.; Rezzonico, A.; Ioannidis, D. Optimal D-STATCOM Placement Tool for Low Voltage Grids. Energies 2021, 14, 4212. [Google Scholar] [CrossRef]
  35. Pfenninger, S.; Staffell, I. Long-term patterns of European PV output using 30 years of validated hourly reanalysis and satellite data. Energy 2016, 114, 1251–1265. [Google Scholar] [CrossRef]
  36. Staffell, I.; Pfenninger, S. Using Bias-Corrected Reanalysis to Simulate Current and Future Wind Power Output. Energy 2016, 114, 1224–1239. [Google Scholar] [CrossRef]
  37. Available online: https://www.renewables.ninja/ (accessed on 1 April 2022).
  38. Horizon 2020 Project INCIT-EV. Available online: https://www.incit-ev.eu/ (accessed on 7 January 2022).
  39. Horizon 2020 Project PARITY. Available online: https://parity-h2020.eu/ (accessed on 1 June 2022).
  40. EN 50160; Voltage Characteristics of Electricity Supplied by Public Distribution Networks. European Committee for Electrotechnical Standardization (CENELEC): Brussels, Belgium, 2022.
  41. Pressmair, G.; Amann, P.; Rampinelli, C.B.; Kapassa, E.; Themistocleous, M.; Kapsalas, C.; Malavazos, C.; Zikos, S.; Timplalexis, C.; Aznar, G.F. Integration of Local Flexibility Market into the Existing Electricity Trading Frameworks. PARITY Project Deliverable D4.3. Available online: https://parity-h2020.eu/end-user-questionnaires-interviews/ (accessed on 28 March 2024).
  42. Pressmair, G.; Kapassa, E.; Casado-Mansilla, D.; Borges, C.E.; Themistocleous, M. Overcoming barriers for the adoption of Local Energy and Flexibility Markets: A user-centric and hybrid model. J. Clean. Prod. 2021, 317, 128323. [Google Scholar] [CrossRef]
  43. Skaltsis, G.; Zikos, S.; Makri, E.; Timplalexis, C.; Ioannidis, D.; Tzovaras, D. Exploiting the flexibility value of Virtual Power Plants through market participation in smart energy communities. In Virtual Power Plant Solution for Future Smart Energy Communities, 1st ed.; Heydarian-Forushani, E., Alhelou, H.H., Elghali, S.B., Eds.; CRC Press: Boca Raton, FL, USA, 2022. [Google Scholar] [CrossRef]
  44. DIgSILENT PowerFactory. Available online: https://www.digsilent.de/en/ (accessed on 1 June 2022).
  45. Ding, B.; Li, Z.; Li, Z.; Xue, Y.; Chang, X.; Su, J.; Jin, X.; Sun, H. A CCP-based distributed cooperative operation strategy for multi-agent energy systems integrated with wind, solar, and buildings. Appl. Energy 2024, 365, 123275. [Google Scholar] [CrossRef]
  46. Li, Z.; Su, S.; Jin, X.; Xia, M.; Chen, Q.; Yam, K. Stochastic and Distributed Optimal Energy Management of Active Distribution Networks Within Integrated Office Buildings. CSEE J. Power Energy Syst. 2024, 10, 504–517. [Google Scholar] [CrossRef]
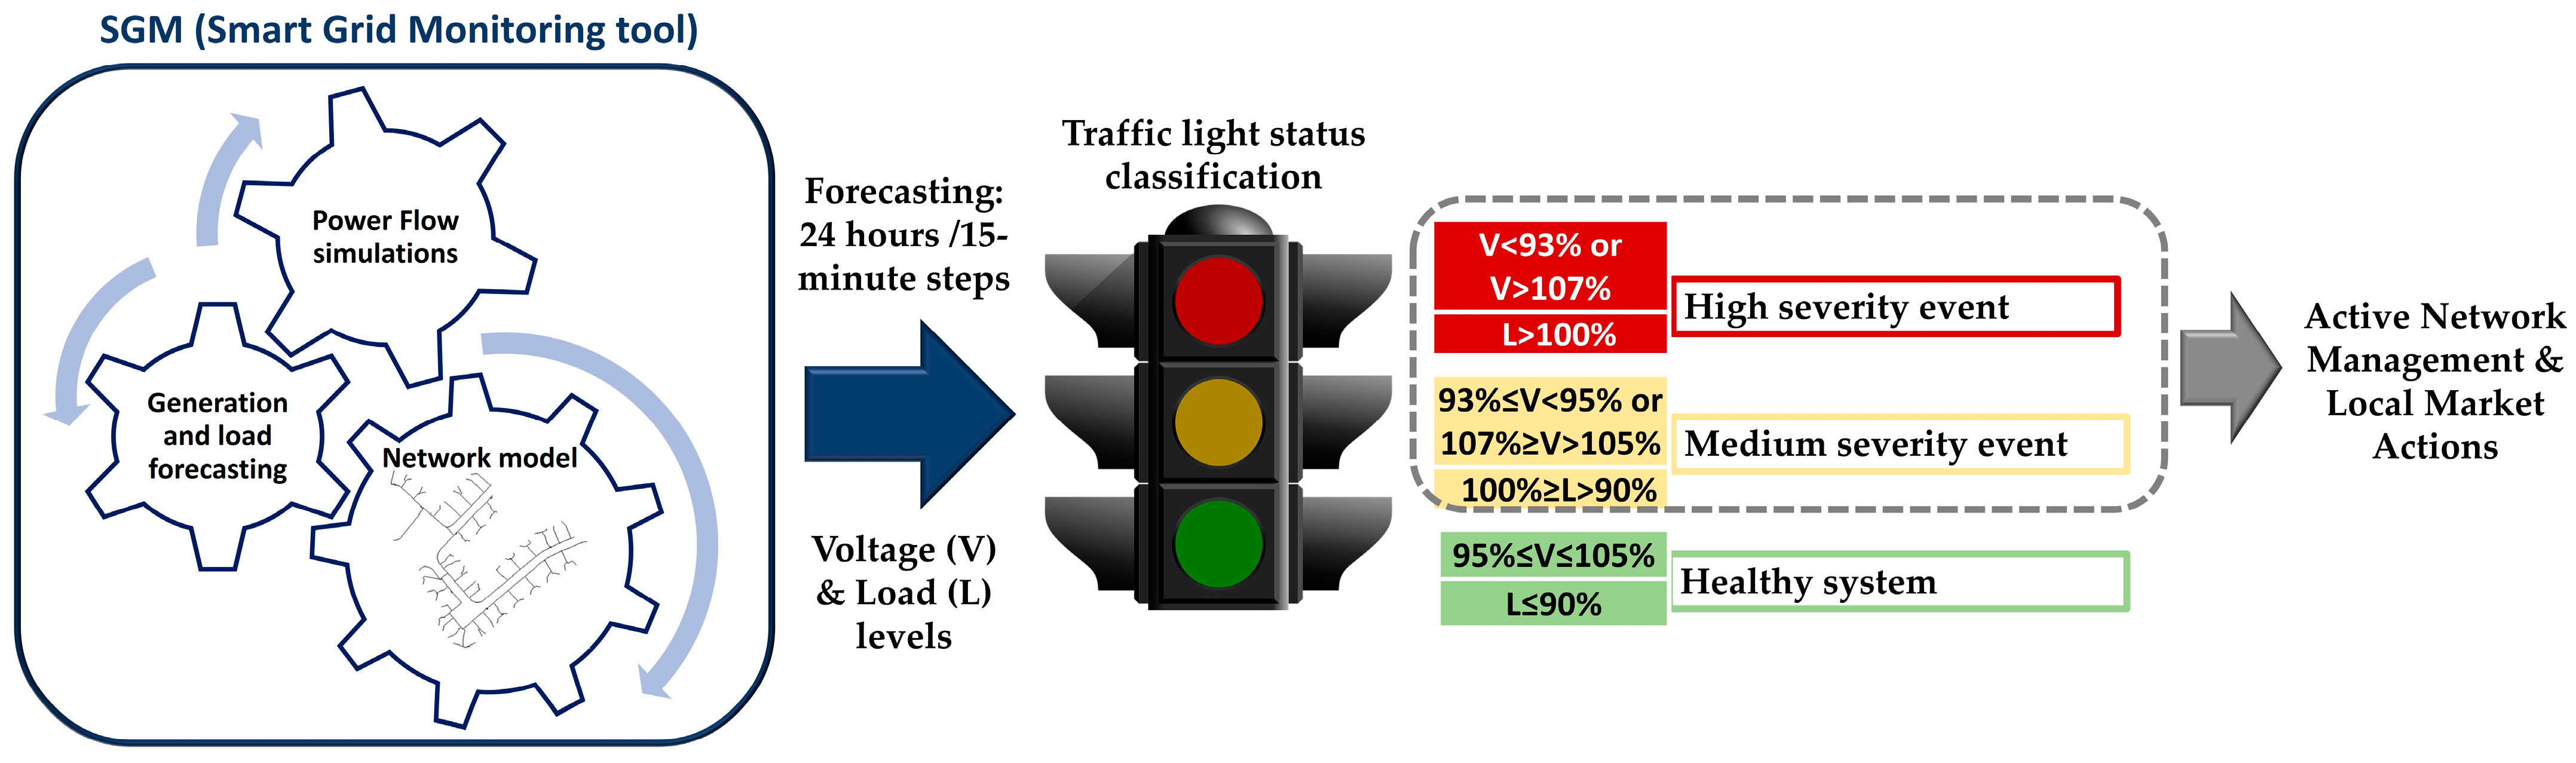
Figure 1. One-line diagram of the LV topology of the Urban Network. Supply points are represented by dots along the LV lines (to enhance clarity, each LV line is depicted in a different color). PV units’ locations are highlighted in blue color.
Sustainability 16 06464 g001
Figure 2. Example of two charging profiles (unmanaged vs. economic charging management) of an EV connected in the evening at 19:00.
Sustainability 16 06464 g002
Figure 3. Conceptual representation of active system management strategy. Voltage (V) and load level (L) limits are relative to nominal values.
Sustainability 16 06464 g003
Figure 4. Overload results comparison. Left side: month analysis results for BAU framework. Right side: day analysis results comparing BAU and active system management frameworks.
Sustainability 16 06464 g004
Table 1. Voltage and loads limits criteria. Limits relative to nominal values.
“Traffic Light” ClassificationSeverityVariableUrban Network
GreenNA (Healthy)Voltage (V)95% ≤ V ≤ 105%
Load level (L)L ≤ 90%
YellowMediumVoltage (V)93% ≤ V < 95% or
107% ≥ V > 105%
Load level (L)100% ≥ L > 90%
RedHighVoltage (V)V < 93% or
V > 107%
Load level (L)L > 100%
Table 2. Scenarios definition for urban benchmark system.
System Management StrategyEV Charging StrategyScenarioPV and EV Penetration Level
PV (% of Consumers)EV (% of Consumers)
Business As Usual DSO functionUnmanaged EV chargingBase case20%0%
Scenario 120%20%
Scenario 220%40%
Scenario 320%60%
Individual Economic EV charging managementBase case20%0%
Scenario 120%20%
Scenario 220%40%
Scenario 320%60%
Active System Management(Charging profiles according to ANM actions)Scenario 320%60%
Table 3. Voltage level results for BAU DSO function—unmanaged charging.
ScenarioNumber of Voltage Violations (One-Month Analysis)
Yellow Light: Medium Severity
93% ≤ V < 95%
Red Light: High Severity
V < 93%
Base case (no EV)00
Scenario 1: 20% PV–20% EV00
Scenario 2: 20% PV–40% EV8730
Scenario 3: 20% PV–60% EV49410
Table 4. Load level results for BAU DSO function—unmanaged charging.
ScenarioNumber of Load Violations (One-Month Analysis)
Yellow Light: Medium Severity
100% ≥ L > 90%
Red Light: High Severity
L > 100%
Base case (no EV)00
Scenario 1: 20% PV–20% EV12,38213,386
Scenario 2: 20% PV–40% EV206025,660
Scenario 3: 20% PV–60% EV69,60635,889
Table 5. Voltage level results for BAU DSO function—individual EV charging management.
ScenarioNumber of Voltage Violations (One-Month Analysis)
Yellow Light: Medium Severity
93% ≤ V < 95%
Red Light: High Severity
V < 93%
Base case (no EV)00
Scenario 1: 20% PV–20% EV00
Scenario 2: 20% PV–40% EV00
Scenario 3: 20% PV–60% EV14400
Table 6. Load level results for BAU DSO function—individual economic EV charging management.
ScenarioNumber of Load Violations (One-Month Analysis)
Yellow Light: Medium Severity
100% ≥ L > 90%
Red Light: High Severity
L > 100%
Base case (no EV)00
Scenario 1: 20% PV–20% EV12,066384
Scenario 2: 20% PV–40% EV25,21311,013
Scenario 3: 20% PV–60% EV25,69114,280
Table 7. Voltage level results comparison for BAU DSO function: unmanaged EV charging vs. individual economic EV charging management.
ScenarioNumber of Voltage Violations (One-Month Analysis)
Yellow Light: Medium Severity
93% ≤ V < 95%
Unmanaged EV ChargingIndividual Economic EV Charging ManagementDifference (%)
Base case (no EV)00NA
Scenario 1: 20% PV–20% EV00NA
Scenario 2: 20% PV–40% EV8730−100%
Scenario 3: 20% PV–60% EV49411440−71%
Table 8. Load level results comparison for BAU DSO function: unmanaged EV charging vs. individual economic EV charging management.
ScenarioNumber of Load Violations (One-Month Analysis)
Yellow Light: Medium Severity
100% ≥ L > 90%
Red Light: High Severity
L > 100%
Unmanaged EV ChargingIndividual Economic EV Charging ManagementDiff (%)Unmanaged EV ChargingIndividual Economic EV Charging ManagementDiff (%)
Base case (no EV)00NA00NA
Scenario 1: 20% PV–20% EV12,38212,066−3%13,386384−97%
Scenario 2: 20% PV–40% EV206025,2131124%25,66011,013−57%
Scenario 3: 20% PV–60% EV69,60625,691−63%35,88914,280−60%
Table 9. Load level results (yellow light events): BAU DSO function vs. active system management.
ScenarioNumber of Load Violations (One-Day Analysis)
Yellow Light: Medium Severity
100% ≥ L > 90%
BAU DSO FunctionActive System ManagementDifference (%)
Scenario 3: 20% PV–60% EV8400−100%
Table 10. Load level results: BAU DSO function vs. active system management (direct DSO intervention).
ScenarioNumber of Load Violations (One-Day Analysis)
Yellow Light: Medium Severity
100% ≥ L > 90%
Red Light: High Severity
L > 100%
BAU DSO FunctionActive System Management. Direct DSO InterventionDiff (%)BAU DSO FunctionActive System Management. Direct DSO InterventionDiff (%)
Scenario 3: 20% PV–60% EV120750525%8400−100%
Table 11. Load levels results: BAU DSO function vs. active system management (agents’ coordination).
ScenarioNumber of Load Violations (One-Day Analysis)
Yellow Light: Medium Severity
100% ≥ L > 90%
Red Light: High Severity
L > 100%
BAU DSO FunctionActive System Management. Agents CoordinationDiff (%)BAU DSO FunctionActive System Management. Agents CoordinationDiff (%)
Scenario 3: 20% PV–60% EV12019058%8400−100%
Disclaimer/Publisher’s Note: The statements, opinions and data contained in all publications are solely those of the individual author(s) and contributor(s) and not of MDPI and/or the editor(s). MDPI and/or the editor(s) disclaim responsibility for any injury to people or property resulting from any ideas, methods, instructions or products referred to in the content.

