Article

Exploring New Avenues in Sustainable Urban Development: Ecological Carbon Dynamics of Park City in Chengdu

1
Key Laboratory of the Evaluation and Monitoring of Southwest Land Resources (Ministry of Education), Sichuan Normal University, Chengdu 610068, China
2
The Faculty Geography Resource Sciences, Sichuan Normal University, Chengdu 610101, China
*
Author to whom correspondence should be addressed.
Sustainability 2024, 16(15), 6471; https://doi.org/10.3390/su16156471 (registering DOI)
Submission received: 20 June 2024 / Revised: 22 July 2024 / Accepted: 26 July 2024 / Published: 29 July 2024

Abstract

:
The close relationship between land use and carbon stock is crucial for regional carbon balance, territorial and spatial planning, and the sustainable development of ecosystems. As a pioneer of Park Cities, Chengdu plays a vital role in Chinese cities. To investigate the impact of Park City construction on carbon stock, this study adopted a new perspective, the Park City perspective, using the Integrated Valuation of Ecosystem Services and Trade-offs (InVEST) model to analyze the spatial and temporal differences in carbon stock. Additionally, we used Geographic Detector to analyze the driving factors of carbon stock in Chengdu. Based on the carbon peaking and carbon neutrality goals (peaking carbon dioxide emissions before 2030 and achieving carbon neutrality before 2060), we simulated the carbon stock in Chengdu for the years 2030 and 2060. Simultaneously, combining the Future Land Use Simulation (FLUS) model, we simulated the changing trends of carbon stock in Chengdu under three scenarios: the natural development scenario (NDS), cultivated land protection scenario (CLDS), and Park City scenario (PCS). The results show the following: (1) After the construction of the Park City, the quality of forest land improved, resulting in an increase in forest carbon stock by 1.19 × 10⁶ tons. (2) Compared to the scenario without Park City construction, the implementation of the Park City led to a total carbon stock increase of 3.75 × 10⁵ tons, with forest carbon stock increasing by 7.48 × 10⁵ tons. (3) The PCS is the most conducive to achieving the carbon peaking and carbon neutrality goals, with the highest carbon stock. (4) Carbon stock is mainly driven by socio-economic factors. Land use/land cover (LULC) has the greatest explanatory power, with a q value of 0.9. The Park City is of great significance for an increase in carbon stock in Chengdu.

1. Introduction

In recent years, the issue of global climate warming has become increasingly severe. Carbon stock, as one of the forefront hotspots in climate change and sustainable development research, is widely recognized [1]. Increasing the carbon stock in terrestrial ecosystems can reduce levels of carbon dioxide in the atmosphere [2,3], thereby mitigating the process of global climate warming. As a vital indicator of regional ecosystem stability, clarifying the distribution and variation of carbon stock helps drive sustainable development practices, spanning multiple domains including land planning, forest conservation, and agriculture improvement [4]. Simultaneously, it holds significant importance in biodiversity conservation, harmonizing the level of ecological economic development and maintaining the balance between ecosystem supply and demand [5].
Currently, research on carbon stock primarily focuses on the relationship between land use/cover change (LUCC) and carbon stock. In recent decades, the world has undergone rapid urbanization, resulting in a significant increase in construction land while concurrently decreasing ecological land such as forest and grassland, accelerating the process of LUCC [6,7]. This transformation has led to a decline in regional land carbon stock capacity, becoming a crucial factor affecting carbon stock variations [8,9,10]. Zhang et al. [11] combined the Future Land Use Simulation (FLUS) model with the Integrated Valuation of Ecosystem Services and Trade-offs (InVEST) model to simulate the impact of land use types on carbon stock in Wuhan. The results indicate that the carbon stock in Wuhan decreased by 2.518 million tons from 2000 to 2015. Yang et al. [12] investigated the impact of urbanization on carbon stock in Beijing, revealing a decrease of 1.9 million tons in carbon stock over a decade. However, it is currently believed that adjusting land use structure and optimizing layout is one of the most economically effective ways to mitigate the reduction of carbon stock [13]. Land use change is significantly influenced by policy factors, yet previous studies have primarily focused on the impact of land use change on carbon stock, with less attention given to the relationship between carbon stock and national territory spatial planning policies and ecological conservation policies. Therefore, formulating land use policies to regulate LUCC is essential to achieving dual goals of spatial development optimization and ecosystem protection [14,15]. Additionally, as carbon stock is one of the key indicators of ecosystem services, studying the response of carbon stock to national territory spatial planning policies and ecological conservation policies can help us better understand and address challenges related to carbon emissions and climate change.
Since the 21st century, the urbanization rate in China has steadily increased, reaching 63.9% in 2020. With the expansion of urban land and intensive carbon emissions, the impact of cities on the regional climate and the environment has become increasingly severe. Urban carbon sinks have thus become an important component in mitigating climate change [16]. For this purpose, China has been continuously exploring new pathways for urban development (such as the construction of the Park City in Chengdu since 2018), leveraging urban carbon sinks to facilitate the achievement of the carbon peaking and carbon neutrality goals. Chengdu, as one of the economic centers in southwestern China, serves as a demonstration area for Park Cities that embody sustainable principles [17]. To protect and restore natural ecosystems, actions such as conducting low-disturbance natural restoration, enhancing structural green ecological space planning and management, controlling the intensity of urban development and construction, and implementing ecological restoration are undertaken [18]. In the context of rapid urbanization, the construction of the Park City in Chengdu inevitably leads to adjustments and optimization in LUCC, resulting in corresponding changes in carbon stock. However, research on the relationship between land use change and carbon stock under different urban development paths is relatively scarce [19]. Park Cities represent a new trajectory for urban development in China, where ecology serves as the driving force behind urban construction, offering a novel model for Chinese urban development amidst rapid global urbanization. However, research on carbon stock in Chengdu has predominantly focused on specific land types such as forest carbon stock, lacking comprehensive analyses of other land use types and predictions of carbon stock based on future LULC (land use/land cover). Furthermore, there is a lack of studies examining the impact of Park Cities on carbon stock, with limited attention given to national territory spatial planning policies and ecological conservation policies.
The assessment methods of carbon stock mainly include biomass estimation, remote sensing inversion, and model simulation [20,21,22,23]. The accuracy of biomass estimation is high, but it cannot reflect the dynamic changes in regional carbon stock and other issues [24]. Remote sensing inversion utilizes methods such as stepwise regression combining field data with remote sensing imagery applications to build models. However, there are limitations such as errors in input parameters and the quality of remote sensing images affecting experimental results [25,26]. The InVEST model, widely used for regional-scale carbon stock estimation driven by land use, features simple acquisition of driving data, excellent visualization effects, high quantitative assessment accuracy, and strong comprehensive functionality [27,28,29]. The FLUS model is a model used to simulate land use changes under the influence of human activities and natural factors, as well as future land use scenarios. It consists of an artificial neural network (ANN) and an Adaptive Inertia Competition Mechanism. It is a simpler method for dealing with the complex and nonlinear relationships between land use and various driving factors [30]. The FLUS model has higher accuracy, allowing it to achieve results similar to the actual distribution of land use [31]. Furthermore, when analyzing the factors influencing the spatiotemporal changes in carbon stock, scholars mainly use econometric models, machine learning, and other methods. They often overlook the comprehensive analysis of the spatiotemporal heterogeneity of carbon stock from both natural and anthropogenic perspectives. The Geographic Detector is suitable for multi-factor impact analysis and can reveal spatial nonlinear relationships, thus improving the accuracy of spatiotemporal heterogeneity cause analysis. It has been widely applied in spatiotemporal differentiation studies of carbon stock at different scales.
Therefore, this study used a new perspective, the Park City perspective, to explore the changes in carbon stock in Chengdu and its driving factors. Additionally, this study conducted comparative analyses in terms of time and space. In terms of time, it compared the changes in carbon stock in Chengdu before and after the construction of Park City between 2012–2017 and 2018–2022, and utilized the Geographic Detector to analyze the driving mechanisms. In terms of space, it used the land use development probability from 2012 to 2017 to simulate the carbon stock in Chengdu in 2022 under the scenario without Park City construction, and compared it with the actual carbon stock in Chengdu in 2022. Furthermore, this study combined ecological conservation policies to predict the simulated carbon stock in Chengdu in 2030 and 2060, further exploring the impact of future Park City construction on carbon stock. This will provide a scientific basis and decision support for achieving the carbon peaking and carbon neutrality goals and also offer reference values for similar low-carbon urban planning goals. The main objectives of this study are as follows: (1) To clearly analyze the changes in carbon stock in Chengdu before and after the construction of Park City. (2) Using the Geographic Detector to explore the driving mechanisms of carbon stock. (3) Simulating the carbon stock in Chengdu in 2022 under the scenario without Park City construction and evaluating the impact of Park City construction on carbon stock. (4) Coupling the InVEST and FLUS models, combined with Chengdu’s national territory spatial planning policies and ecological conservation policies, to predict the developmental trends of carbon stock in Chengdu under the NDS, CLDS, and PCS.

2. Research Methodology

2.1. Study Area

Located in the western Sichuan Basin (102°54′–104°53′ E, 30°05′–31°26′ N), Chengdu covers a total area of 14,335 km2 (Figure 1). The terrain within the city is complex, with higher elevations in the west gradually sloping down towards the east. Approximately one-third of the city’s terrain consists of high mountains, one-third of hills, and one-third of plains, forming a unique landscape. Chengdu has a subtropical monsoon climate characterized by concurrent rainy and hot seasons, favorable water and heat conditions, and distinct four seasons, with an annual precipitation ranging from 734.8 to 1142.3 mm and an average annual temperature of 15–18 °C. By 2023, the permanent population of Chengdu exceeded 21.19 million, with an urbanization rate of 80.5% and a GDP of CNY 2207.47 billion. Chengdu is one of China’s major central cities closest to Europe in Southwest China and one of the key nodes in the Belt and Road Initiative in the western region. Since 2018, Chengdu has embarked on the construction of Park City, placing greater emphasis on spatial planning and ecological conservation. Over the past five years, the urban green space area in Chengdu has continuously expanded, and the land use structure has been continuously optimized, which has played a positive role in increasing the carbon stock of terrestrial ecosystems.

2.2. InVEST Model

The carbon stock module of the InVEST model estimates the total carbon stock in a region or within a specific spatiotemporal period based on the current land use classification, utilizing four fundamental carbon pools: above-ground carbon pool, below-ground carbon pool, soil carbon pool, and dead organic carbon pool. Specifically, the above-ground pool refers to the carbon stock of living plants on the surface, the below-ground pool refers to carbon in plant roots, the soil pool includes organic carbon in the soil and carbon in weathering products, and the dead organic carbon pool refers to the carbon contained in deceased plants. The InVEST model assesses land use within a region to calculate the total carbon stock in the area. The calculation formula is Equation (1) [32]:
C _ t o t a l = C _ a b o v e + C _ b e l o w + C _ s o i l + C _ d e a d
where C_total denotes the overall carbon stock of soil and organisms in the study area; C_soil denotes the soil carbon stock per unit area, i.e., soil carbon density (t/hm2); C_above, C_below, and C_dead denote the above-ground vegetation carbon stock per unit area (t/hm2), below-ground vegetation carbon stock (t/hm2), and carbon stock of dead organic matter, including dead branches and leaves (t/hm2).
To ensure the consistency and accuracy of carbon density data, priority is given to using measured data from Chengdu City and its surrounding areas. The carbon density data in this study refer to measured data from the Chengdu Plain by Zhang et al. [33] and previous research data by Xie et al. [34] (Table 1).

2.3. FLUS Model

The data utilized for land use simulation in the FLUS model consist of land use data, land use driving data, and constraint factor data. Following the model’s input requirements, the land use type data are reclassified into six primary land use types: cultivated land, forest land, grassland, water area, unused land, and construction land. Thirteen significant land use driving factors are selected from aspects such as terrain, climate, environment, spatial planning, accessibility, and economy.

2.3.1. Probability Estimation of Suitability

Based on the land use types in Chengdu City during three periods from 2012 to 2022, annual average rainfall, annual average temperature, slope, soil type, and other factors were selected as driving factors. In the suitability probability estimation module of the artificial neural network, the land use types of the base period were fitted with multiple spatial driving factors. The method for estimating suitability probability using the artificial neural network is given in Equation (2) [35]:
s p ( p k , t ) = j ω j , k × s i g m o i d n e t j p , t = j ω j , k 1 + e n e t j p , t
where wj,k is an adaptive weight between the hidden layer and the output layer, and it is adjusted during the training process. netj(p,t) denotes the signal received by the neuron j in the input layer at pixel p at training time t. sigmoid () is the excitation function from the hidden layer to the output layer.

2.3.2. Adaptive inertia Coefficient

Application of the FLUS model with a roulette wheel selection-based adaptive inertial competition mechanism to address the uncertainty and complexity of land use type inter-conversion under the combined influence of natural processes and human activities, and calculation of comprehensive rules based on Equation (3) [36]:
I k t =   I k t ,   ( i f   D t 2   D t 1 ) I k t 1 × D k t 2 D k t 1 ,   (   i f   0 > D t 2 > D t 1   )   I k t 1 × D k t 2 D k t 1 ,   (   D t 1 > D t 2 > 0 )  
where I k t is the inertia coefficient for land use type p at iteration time t; D t 1 and D t 2 refer to the difference between land use grid allocation and macro demand of land use type p at times t – 1 and t − 2.

2.3.3. Precision Validation

In this study, the Kappa coefficient was utilized for accuracy assessment. The simulated results were then compared against actual land use data to validate the land use simulation for Chengdu in 2030. The calculation method is given in Equation (4):
K a p p a = P 0 P c P p P c
where Kappa is the simulation accuracy index; Pc is the estimated simulation accuracy under the random state; P0 is the actual simulation accuracy. When 0.6 < Kappa ≤ 0.8, it indicates a good simulation effect; when 0.4 < Kappa ≤ 0.6, it indicates that the simulation effect is effective; when Kappa ≤ 0.4, it indicates a poor simulation effect [37].

2.3.4. Geographic Detector

The Geographic Detector is a set of statistical methods used to detect spatial differentiation and reveal the driving forces behind it. It includes four detectors: differentiation and factor detection, interaction detection, risk area detection, and ecological detection. Differentiation and factor detection analysis aim to detect the spatial differentiation of Y and determine to what extent a factor X explains the spatial differentiation of attribute Y. The expression is as follows [38]:
q = 1 h = 1 L N h σ h 2 N σ 2 = 1 S S W S S T
S S W = h = 1 L N h σ h 2
S S T = N σ 2
where h = 1, ..., L represents the strata of variable Y or factor X , indicating categories or zones; Nh and N are the number of units in stratum h and the entire area, respectively; σ h 2 and σ 2 are the variance of Y values in stratum h and the entire area. S S W and S S T represent the sum of within-stratum variances and the total variance of the entire area, respectively. The range of q is [0,1], where a higher value indicates a more pronounced spatial differentiation of Y.

2.3.5. Scenario-Based Land Use Prediction

Many factors affect urban development and land use change. In simulating future land use, it is essential to consider various factors that influence urban development and land use changes comprehensively. Therefore, this study adjusted the transition probabilities, intensities, and directions between different land types by adding planning restricted areas and setting parameters. By integrating the “Ecological Protection Red Line Plan of Sichuan Province” and the “Protection Plan for Farmland and Permanent Prime Farmland in Chengdu (2021–2035)”, three scenarios were established: the natural development scenario (NDS), farmland protection scenario (CLDS), and Park City scenario (PCS).
The NDS simulated future development based on the land use transformation patterns in Chengdu from 2010 to 2020, without considering the restrictive effects of planning policies on LUCC. The CLDS aimed to simulate the impacts and environmental effects of farmland protection policies and farmland reclamation activities. It included permanent prime farmland protection zones as restricted conversion areas to strictly enforce farmland protection measures. The PCS incorporated Chengdu’s ecological red lines as limiting factors and combined them with ecological conservation and restoration policies, such as the construction of forest parks and urban green spaces, to enhance ecological management efforts. Lastly, model parameters were set according to the characteristics of different development scenarios and imported into the model for computation (Table 2 and Table 3).

3. Results and Analysis

3.1. Land Use Change

3.1.1. Spatial and Temporal Land Use Change Characteristics

Cultivated land predominates as the primary land use type in Chengdu, extensively distributed across the central and eastern regions (Figure 2). Forest land is primarily located in the western Longmen Mountain and eastern Longquan Mountain areas, while construction land, although widespread, is mainly concentrated in the central region. Conversely, unused land occupies a relatively small area, suggesting an overall high degree of land utilization in Chengdu.
The comprehensive land use dynamic degrees for the periods 2012–2017, 2017–2022, and 2012–2022 were 1.27%, 0.54%, and 0.9%, respectively (Table 4). During 2012–2017, the comprehensive land use dynamic degree was the highest, while during 2017–2022, it was the lowest. Across land types, the single-dynamic degree of forest land was the highest during 2017–2022, reaching 5.15%, with an area increase of 628.8 km2. Cultivated land experienced the smallest dynamic degree at −1.71%, resulting in a decrease of 900.8 km2. The dynamic degree of construction land was the highest at 2.90%, with an area increase of 196.6 km2, while unused land had the smallest dynamic degree. Cultivated land dominates land use in Chengdu, accounting for over 60%. The areas of forest land, grassland, and construction land significantly increased, while cultivated land, water areas, and unused land continued to decrease. Throughout 2012–2022, construction land experienced the highest comprehensive dynamic degree at 4.37%, increasing by 471.96 km2, with its proportion rising from 7.54% to 10.83%. Forest land followed, with an increase of 806.84 km2.

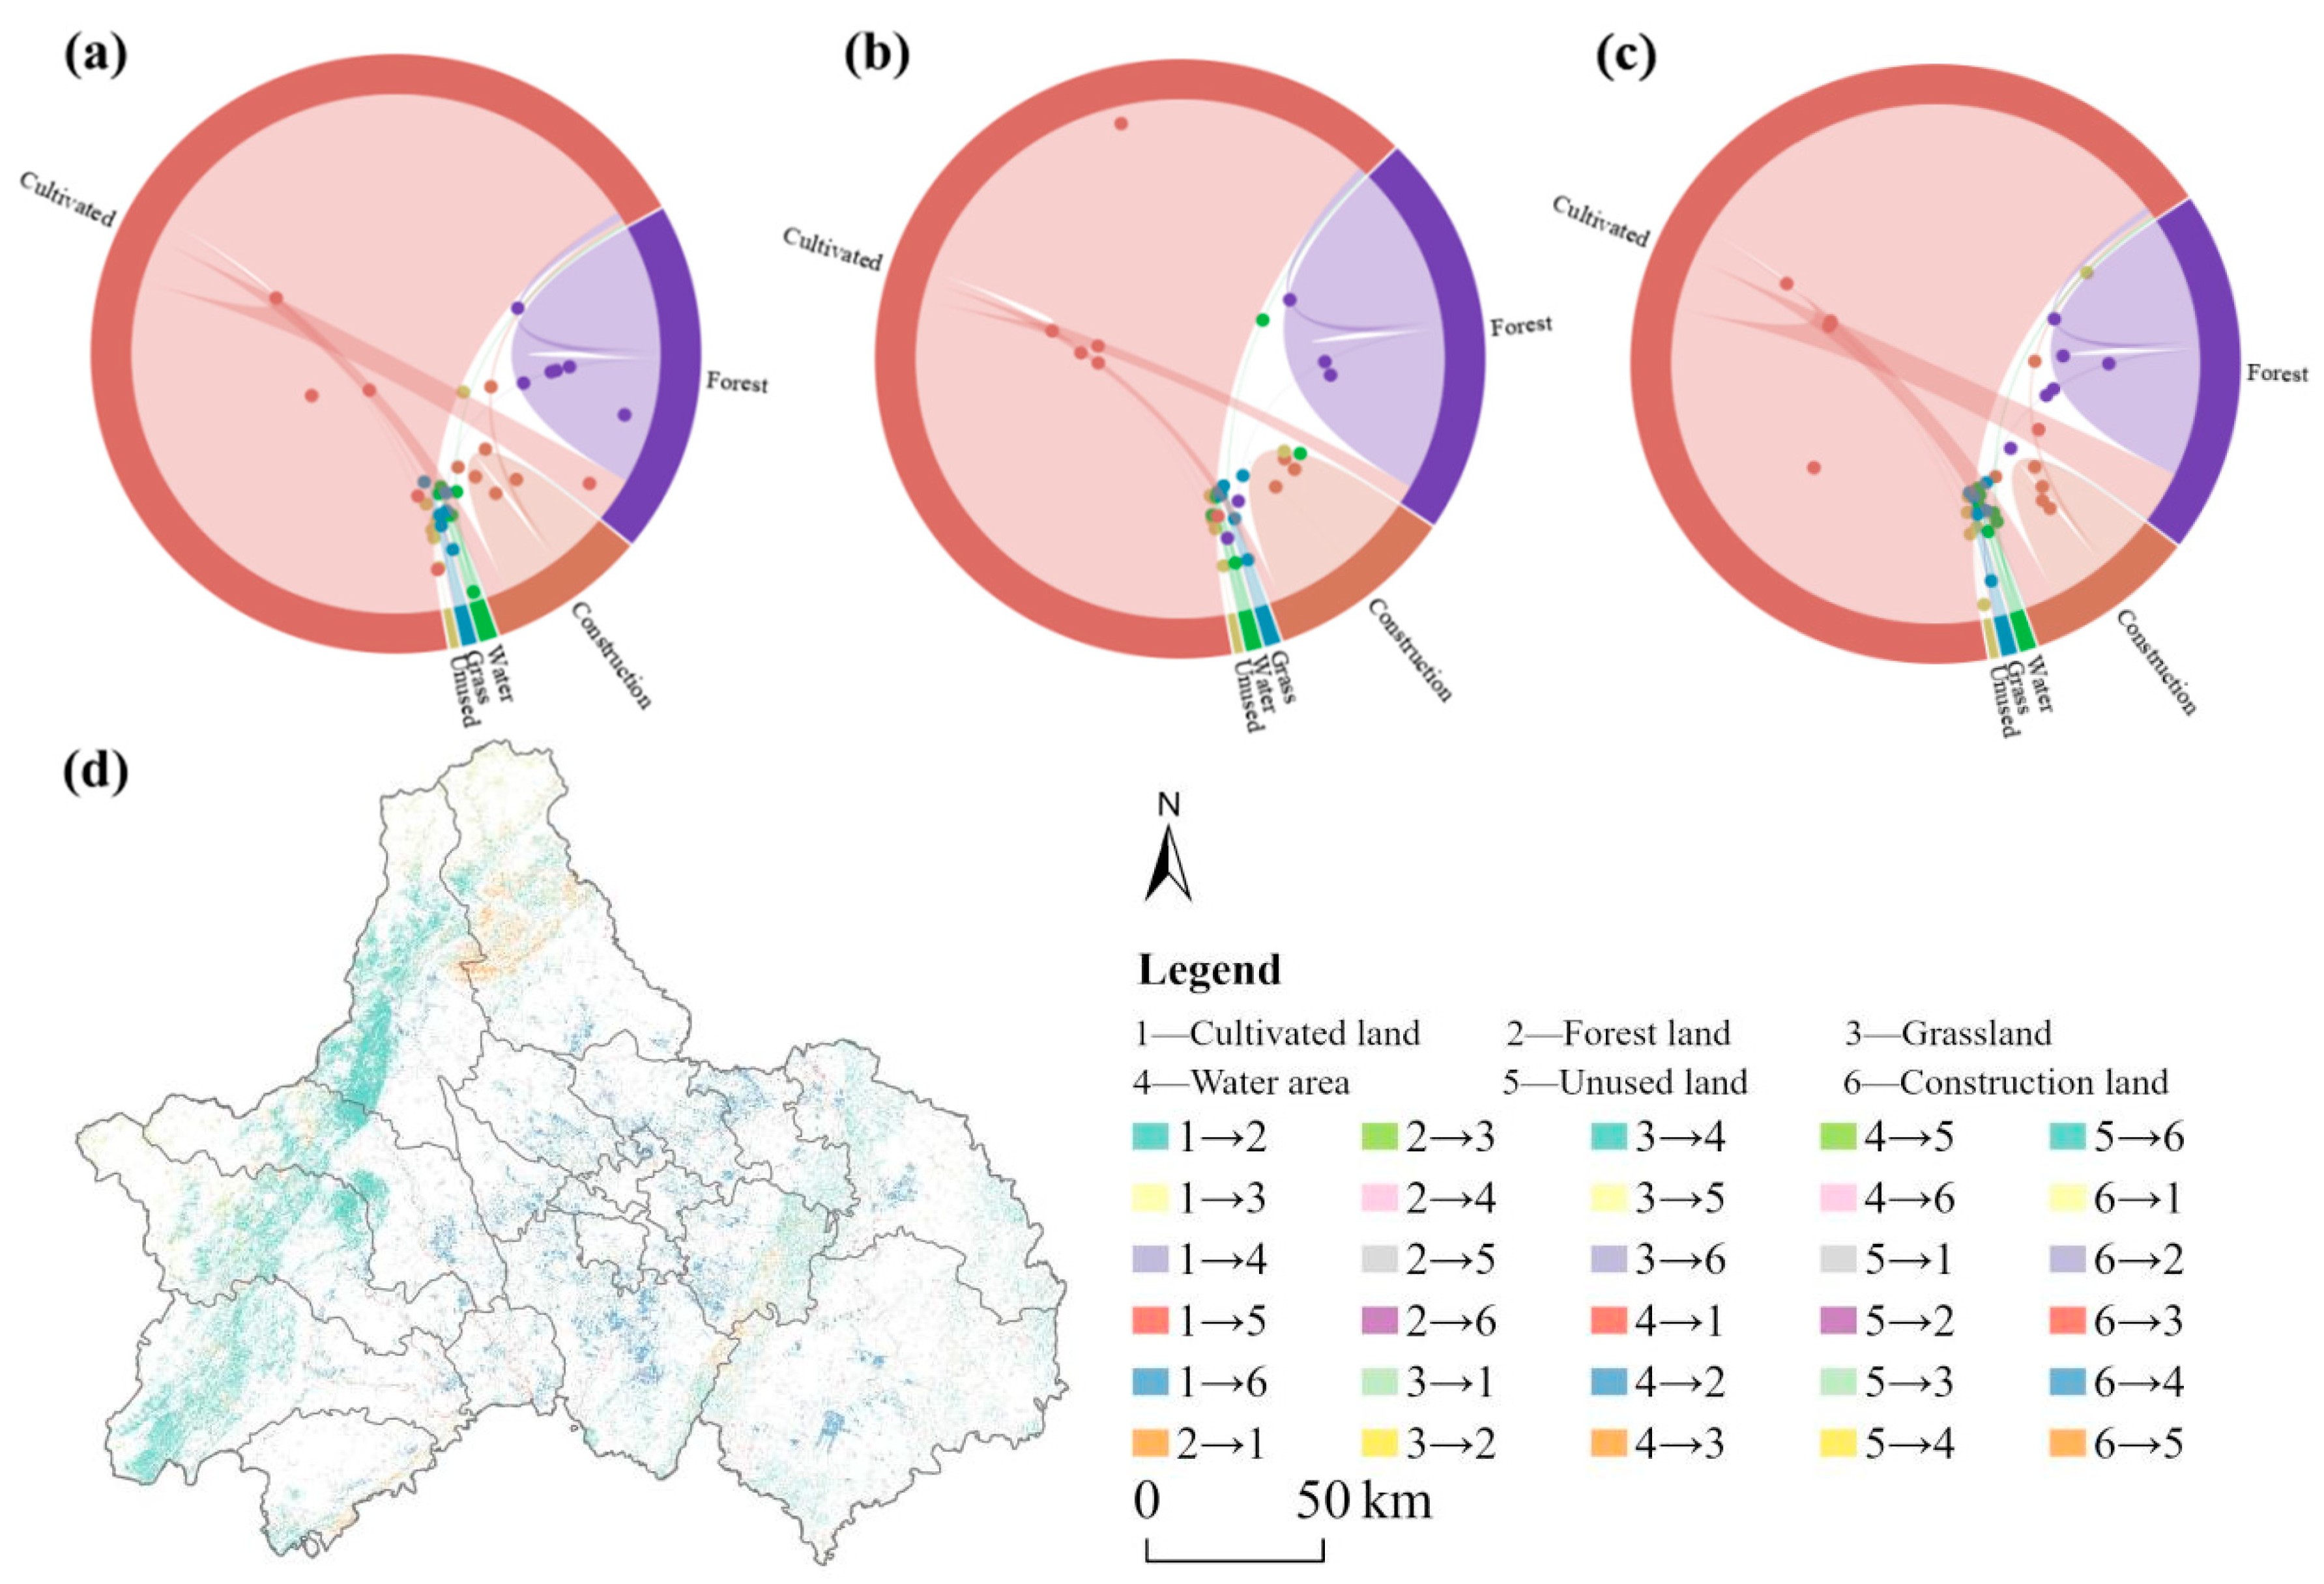
3.1.2. Transformation of Land Use in Chengdu from 2012 to 2022

During the period from 2012 to 2022, there was a significant land transfer (Figure 3), with cultivated land and forest land accounting for the most substantial areas, at 1517.22 km2 and 152.62 km2, respectively. Cultivated land primarily shifted towards forest land (944.25 km2) and construction land (540.26 km2), while forest land transitioned towards grassland (17.32 km2) and cultivated land (154.68 km2). From 2012 to 2017, cultivated land and forest land remained the dominant land types in terms of transfer, with areas of 1187.73 km2 and 173.26 km2. Between 2017 and 2022, cultivated land shifted by 530.52 km2 to other land use types, while forest land transferred 155.67 km2.
Under the guidance of the Park City concept, Chengdu has seen a reduction in the transfer of ecologically sensitive land, such as forest land, to other land use types. Instead, land use transfer primarily originates from cultivated land. Additionally, the areas of cultivated land and water area transferred have also decreased. This indicates that Chengdu, while experiencing rapid economic development, prioritizes ecological conservation under the principles of sustainable development.

3.1.3. Multi-Scenario Simulation of Future Land Use

We used the FLUS model to simulate land use types in Chengdu for the years 2030 and 2060 under multiple scenarios (Figure 4 and Figure 5). The kappa coefficient is 0.77, and the overall classification accuracy reaches 0.88, both exceeding 0.75, indicating a good simulation effect.
In 2030, land use in Chengdu will continue to be dominated by cultivated land and forest land, with cultivated land accounting for over 55% and forest land approximately one-fourth. Compared to 2020, under the NDS, urban expansion will be more evident, with a construction land of 1966.01 km2, an increase of 458.12 km2. Under the CLDS, cultivated land preservation will be better, covering an area of 8254.45 km2, a decrease of 1089.46 km2 compared to 2020. In the PCS, the forest land area will increase significantly to 3868.45 km2, an increase of 635.75 km2, with a notable increase in forest coverage in the Longquan Mountain region.
In 2060, the cultivated land area in Chengdu will continue to decrease, while forest land and construction land will continue to increase. Under the NDS, the cultivated land area will be the lowest, at 5923.95 km2, but there will be a relatively high area of construction land at 3038.17 km2. This suggests that without specific intervention, Chengdu may witness a significant amount of land being used for urban development, potentially impacting the protection of cultivated land and the stability of the ecosystem. Under the CLDS, the cultivated land area will be the highest, reaching 6401.84 km2, indicating the effectiveness of policies aimed at protecting cultivated land. Compared to the NDS, the area of construction land will remain relatively unchanged, indicating that while protecting cultivated land, urban development will be managed reasonably. Under the PCS, both forest area and cultivated land area will be relatively high, at 5119.45 km2 and 5943.68 km2, respectively. The implementation of ecological restoration policies will have a positive effect on increasing forest coverage and protecting cultivated land.
Among the three scenarios, the NDS has the largest area of construction land, indicating unrestricted urban development. Under the CLDS, there is a greater emphasis on the protection of cultivated land, with a larger cultivated land area compared to other scenarios. In the PCS, there is a greater focus on spatial planning and ecological conservation, leading to an optimized land use structure and more coordinated urban development and ecological protection.

3.2. Carbon Stock Changes

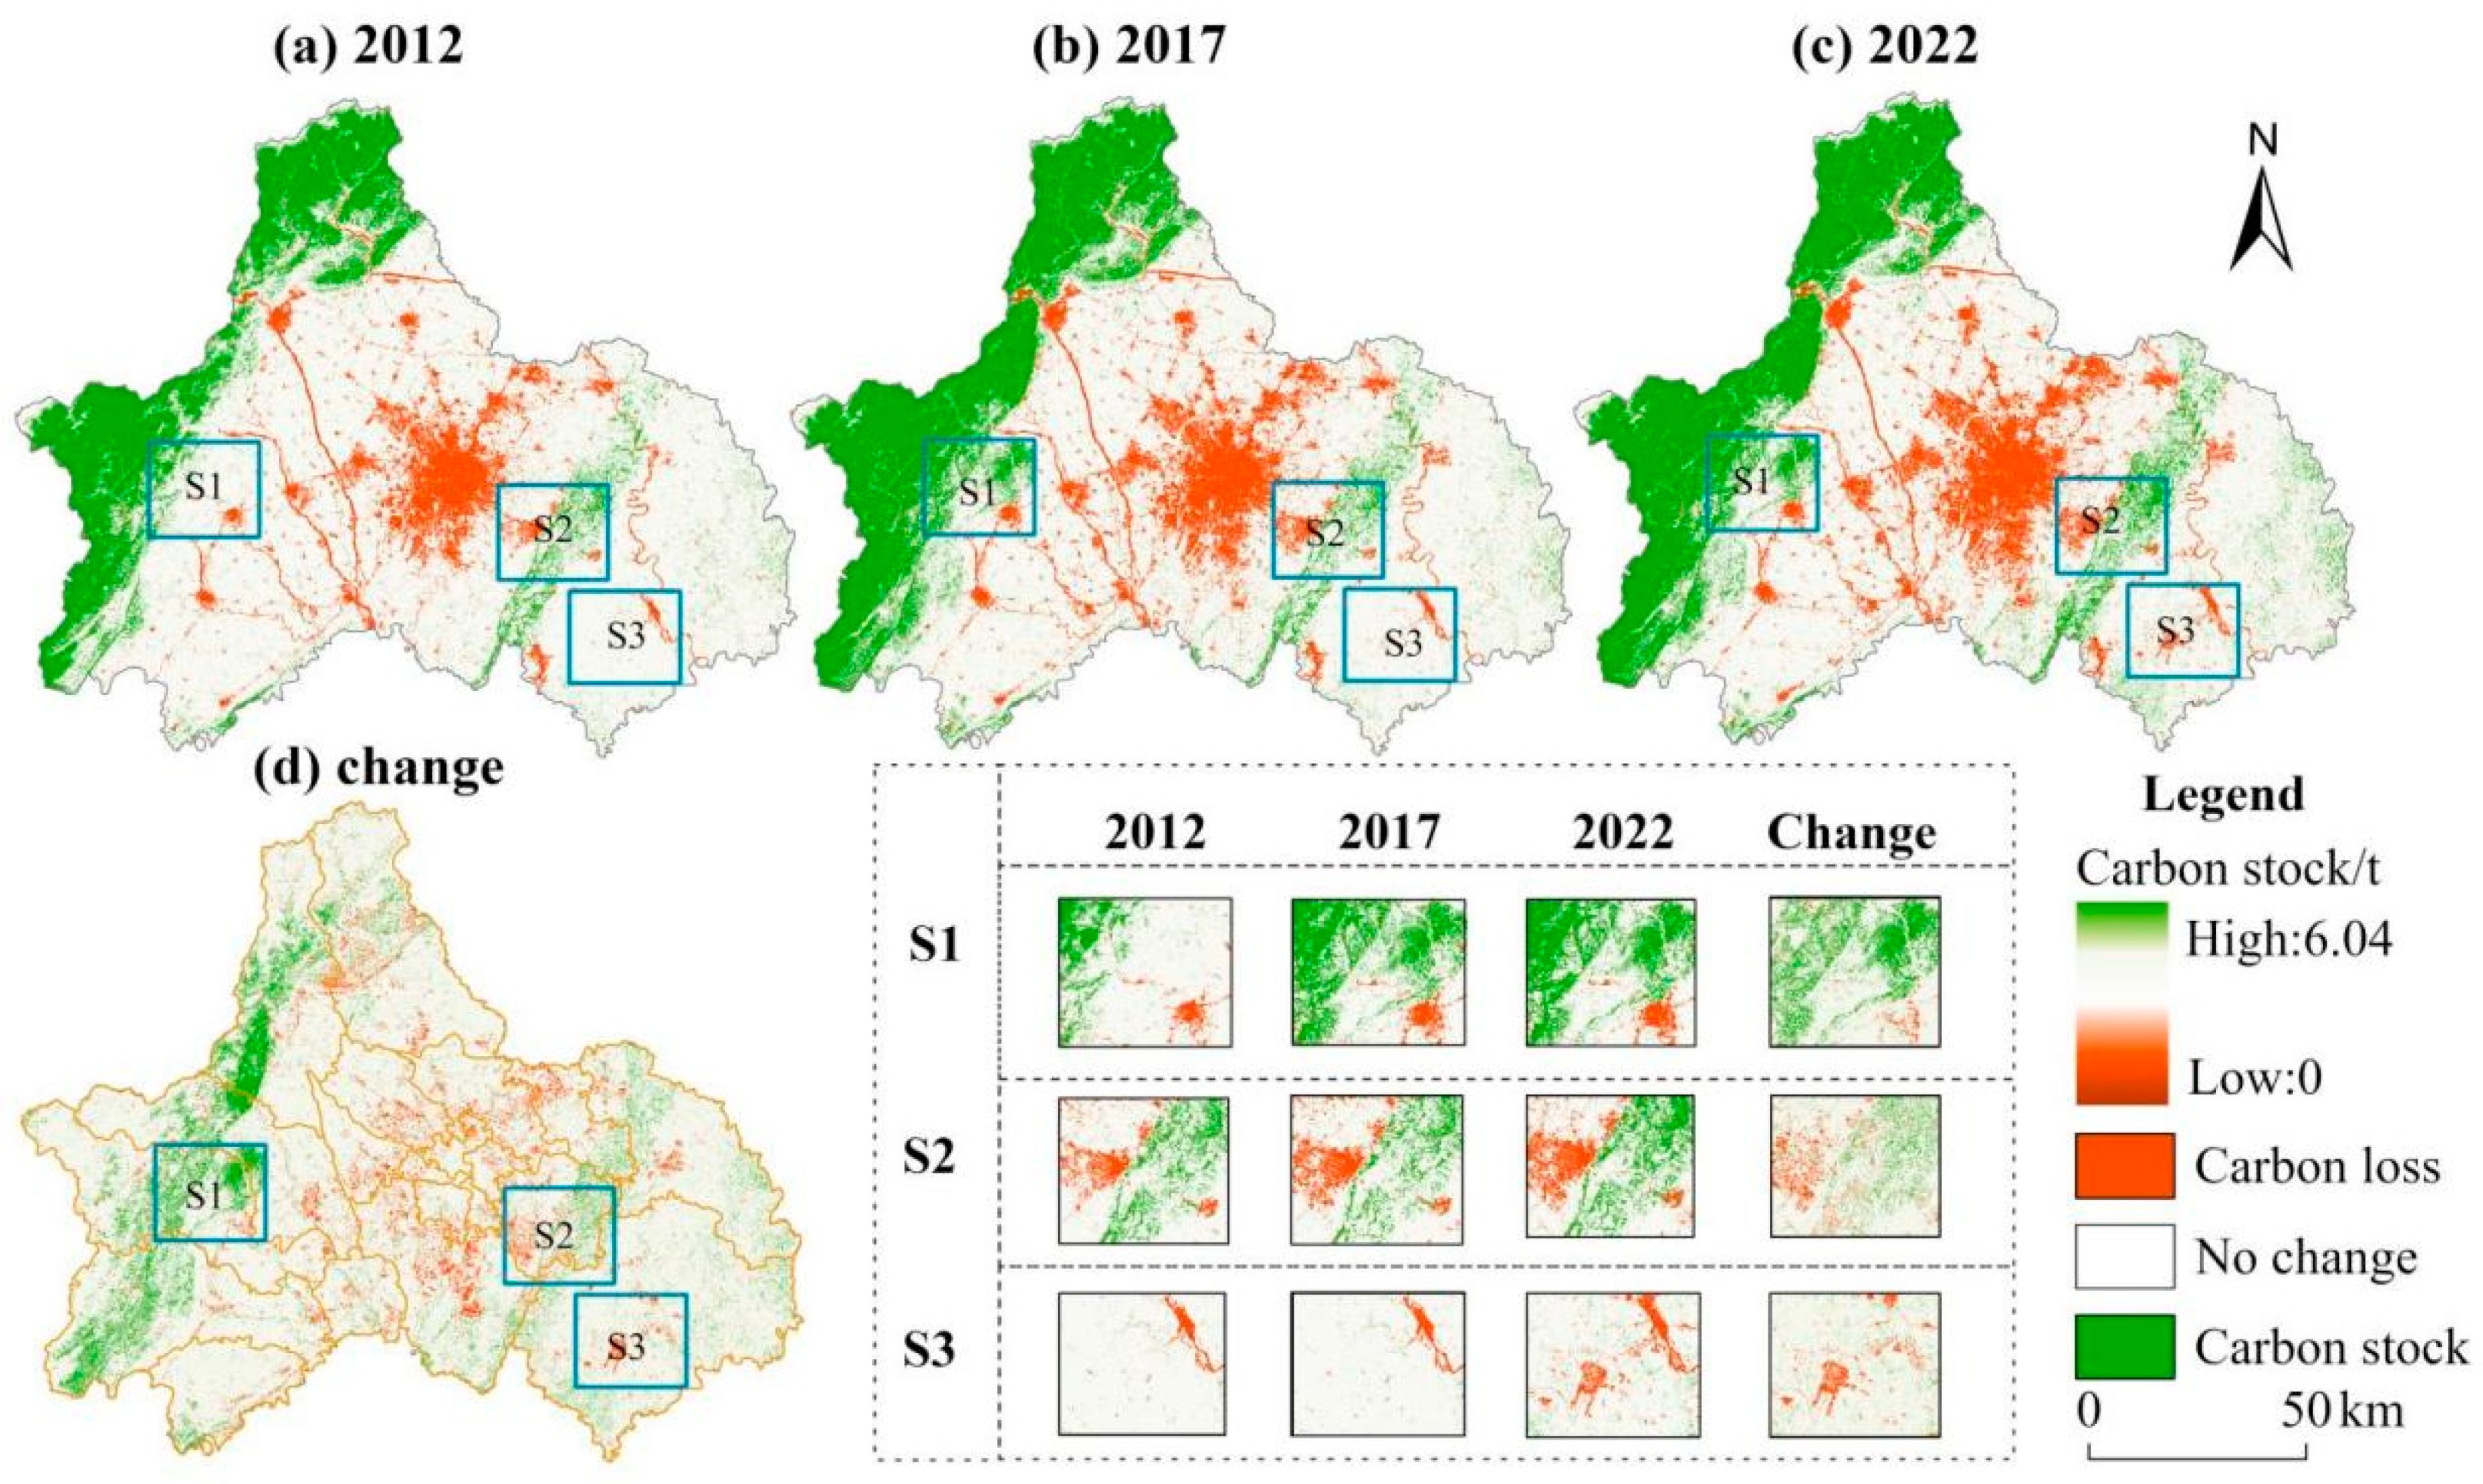
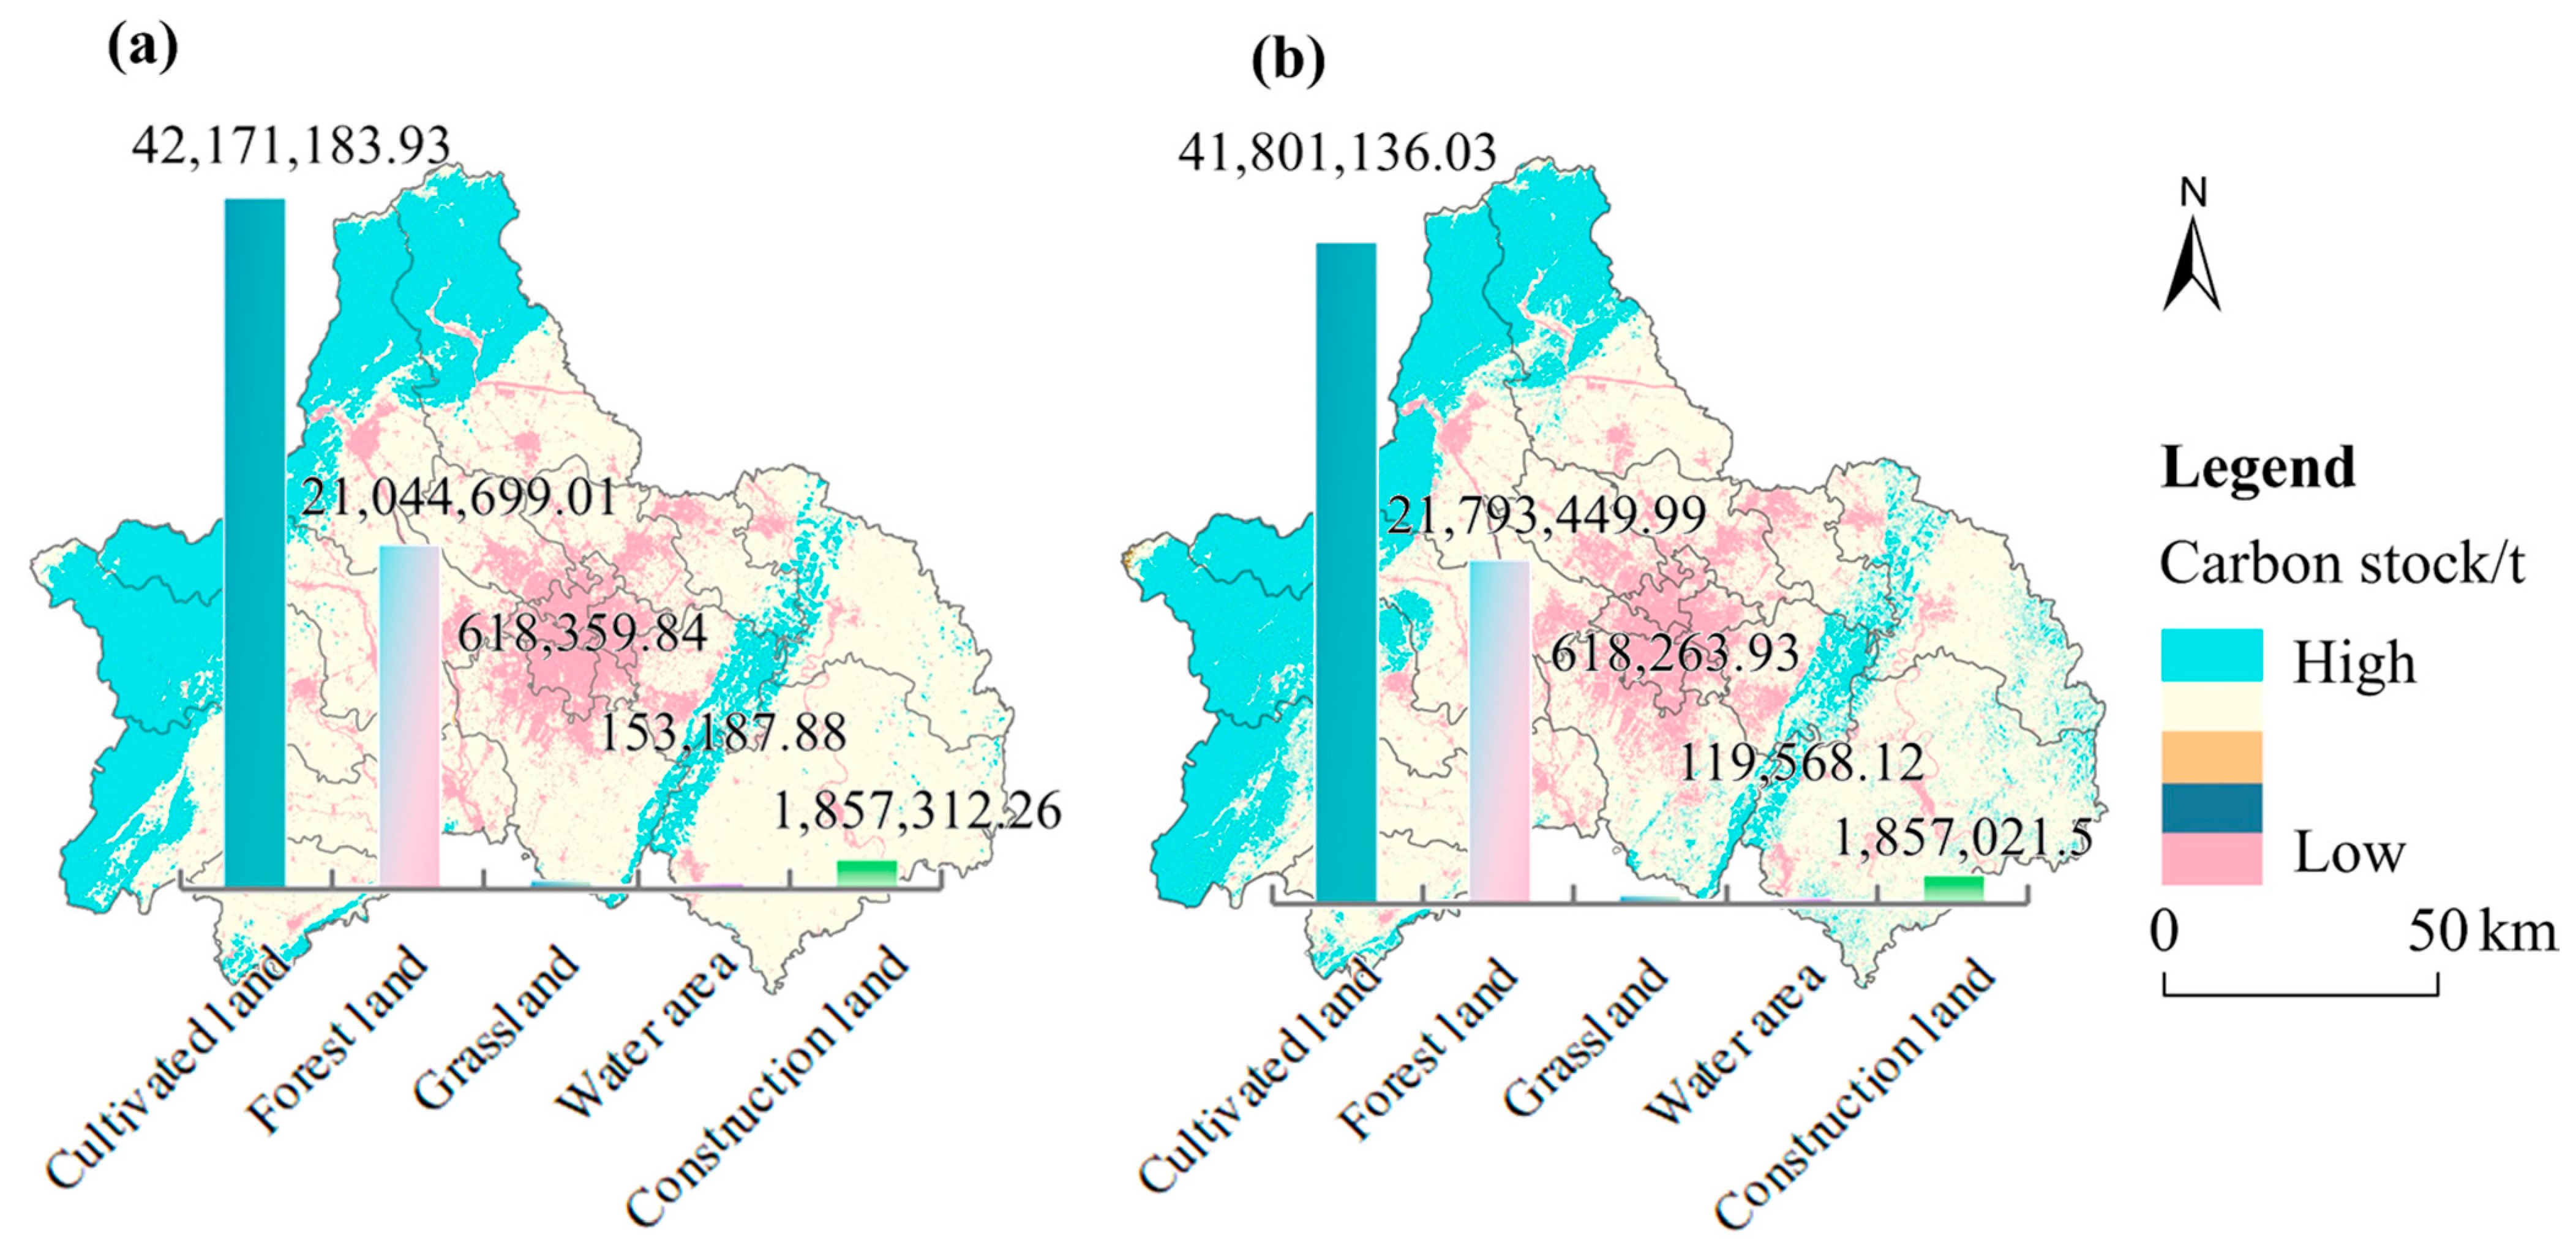
3.2.1. Spatial and Temporal Characteristics of Carbon Stock

From 2012 to 2022, the overall carbon stock in Chengdu showed an upward trend (Figure 6). Additionally, Chengdu exhibited a distribution pattern of carbon stock with higher values in the western and northern regions and lower values in the central area (Figure 7). High-value carbon stock areas were mainly concentrated in the Longmen Mountain area in the western and northern parts of Chengdu, characterized by forest and grassland as the primary land use types. Low-value carbon stock areas were found in the urban areas of Chengdu, dominated by construction land and unused land. Due to the increase in forest, grassland, and construction land area, the carbon stock of these land types increased by 5.41 × 10⁶ tons, 6.31 × 10⁴ tons, and 5.64 × 10⁵ tons, respectively. Conversely, the reduction in cultivated land and water body area led to a decrease in carbon stock by 5.67 × 10⁶ tons and 3.1 × 10⁴ tons, respectively, from 2012 to 2022.
During the period from 2012 to 2017, the implementation of forest-nurturing policies in the Longmen Mountain area led to an expansion of the high-value carbon stock zone. Additionally, forest land, grassland, and construction land contributed to an increase in carbon stock by 4.22 × 10⁶ tons, 2.1 × 10⁴ tons, and 3.29 × 10⁵ tons, respectively. The reduction in cultivated land and water area resulted in a decrease in carbon stock by 4.06 × 10⁶ tons and 8.34 × 10³ tons. From 2017 to 2022, as part of the Park City construction process, ecological conservation and restoration efforts improved the quality of forest land, leading to an increase in forest carbon stock by 1.19 × 10⁶ tons. Especially in 2022, due to continuous greenway construction, grassland carbon stock increased by 5.72 × 10⁴ tons compared to the previous year. However, carbon stock in cultivated land and water areas decreased by 1.62 × 10⁶ tons and 2.27 × 10⁴ tons, respectively.

3.2.2. The Impact of Park City Construction on Carbon Stock

To explore the impact of Park City construction on carbon stock, Chengdu initiated the construction of the Park City in 2018. The temporal and spatial variations in carbon stock in Chengdu were analyzed, dividing the period into pre-Park City construction (2012–2017) and post-Park City construction (2018–2022) periods. The results indicate that from 2012 to 2017, due to forest-nurturing policies in the Longmen Mountain area, the high-value carbon stock zone expanded, notably in the western regions near Dayi and the border with Chongzhou. Additionally, forest land, grassland, and construction land contributed to an increase in carbon stock by 4.22 × 10⁶ tons, 2.1 × 10⁴ tons, and 3.29 × 10⁵ tons, respectively. The reduction in cultivated land and water area led to a decrease in carbon stock by 4.06 × 10⁶ tons and 8.34 × 10³ tons, respectively.
From 2017 to 2022, as part of the Park City construction process, ecological restoration and urban green space development were conducted, leading to an improvement in the quality of forest land and an increase in forest carbon stock by 1.19 × 10⁶ tons. With the establishment of Longquan Mountain Forest Park and other parks, significant increases in carbon stock were observed in Longquan Mountain, as well as in the eastern regions of Jintang and Jianyang. The construction of Park City has facilitated an increase in carbon stock, particularly noticeable in the eastern regions of Chengdu.
To further investigate the significance of Park City construction on carbon stock in Chengdu, this study utilized the land use development probability from 2012 to 2017 to simulate the land use in Chengdu in 2022 (with a Kappa coefficient of 0.75). The InVEST model was employed to calculate the carbon stock in Chengdu in 2022 (Figure 8). The prediction shows that the carbon stock in Chengdu in 2022 is estimated to be 6.58 × 10⁷ tons, which is 3.75 × 10⁵ tons less than the actual value in 2022. This indicates that Park City construction has a positive impact on carbon stock in Chengdu and is of significant importance for enhancing carbon stock.
In terms of carbon stock for each land use type, the carbon stock of cultivated land, water area, and construction land in Chengdu in 2022 is lower than simulated values. The carbon stock of grassland remains relatively consistent. Specifically, the simulated carbon stock of forest land in 2022 is estimated to be 2.10 × 10⁷ tons, which is 3.43% lower than the actual carbon stock in 2022, equivalent to 7.48 × 10⁵ tons. This suggests that under the guidance of the Park City concept, forest ecosystems are better preserved, and the carbon sink function of forest ecosystems is more fully realized.

3.2.3. Future Changes in Carbon Stock under Different Scenarios

In 2030, Chengdu’s carbon stock under the NDS, CLDS, and PCS will be 6.615 × 10⁷ tons, 6.614 × 10⁷ tons, and 6.616 × 10⁷ tons, with the highest carbon stock projected under the PCS (Figure 9). Compared to 2022, Chengdu’s carbon stock in 2030 is expected to decrease under all scenarios, with reductions of 4.01 × 10⁴ tons, 5.22 × 10⁴ tons, and 2.85 × 10⁴ tons for the NDS, CLDS, and PCS, respectively. By 2060, Chengdu’s carbon stock will continue to decrease, with projected values of 6.537 × 10⁷ tons, 6.429 × 10⁷ tons, and 6.542 × 10⁷ tons under the NDS, CLDS, and PCS, respectively.
In terms of carbon stock for each land use type, cultivated land will have the highest carbon stock in Chengdu in 2030, followed by forest land, construction land, and grassland, with water area having the lowest carbon stock. Additionally, as the area of cultivated land continues to decrease, the carbon stock of cultivated land will show a decreasing trend. With an increase in forest land and construction land area, the carbon stock of forest land and construction land will continue to rise, with the carbon stock of forest land increasing most significantly. By 2060, the area of forest land will continue to increase, surpassing cultivated land to become the land cover type with the highest carbon stock. Under the NDS, CLDS, and PCS, the carbon stock of forest land will be 7.65106 tons, 2.21106 tons, and 7.58106 tons higher than that of cultivated land, respectively.
In all three scenarios, both in 2030 and 2060, the PCS will exhibit the highest carbon stock levels. Continued construction of the Park City will promote the restoration and expansion of ecosystems such as forest and grassland, thereby enhancing the level of carbon stock and effectively mitigating carbon loss. The total carbon stock under the scenario of cultivated land protection will be slightly lower than that of other scenarios. This is because, under the CLDS, the area of other land types will be restricted, resulting in a certain degree of limitation on the growth of carbon stock.

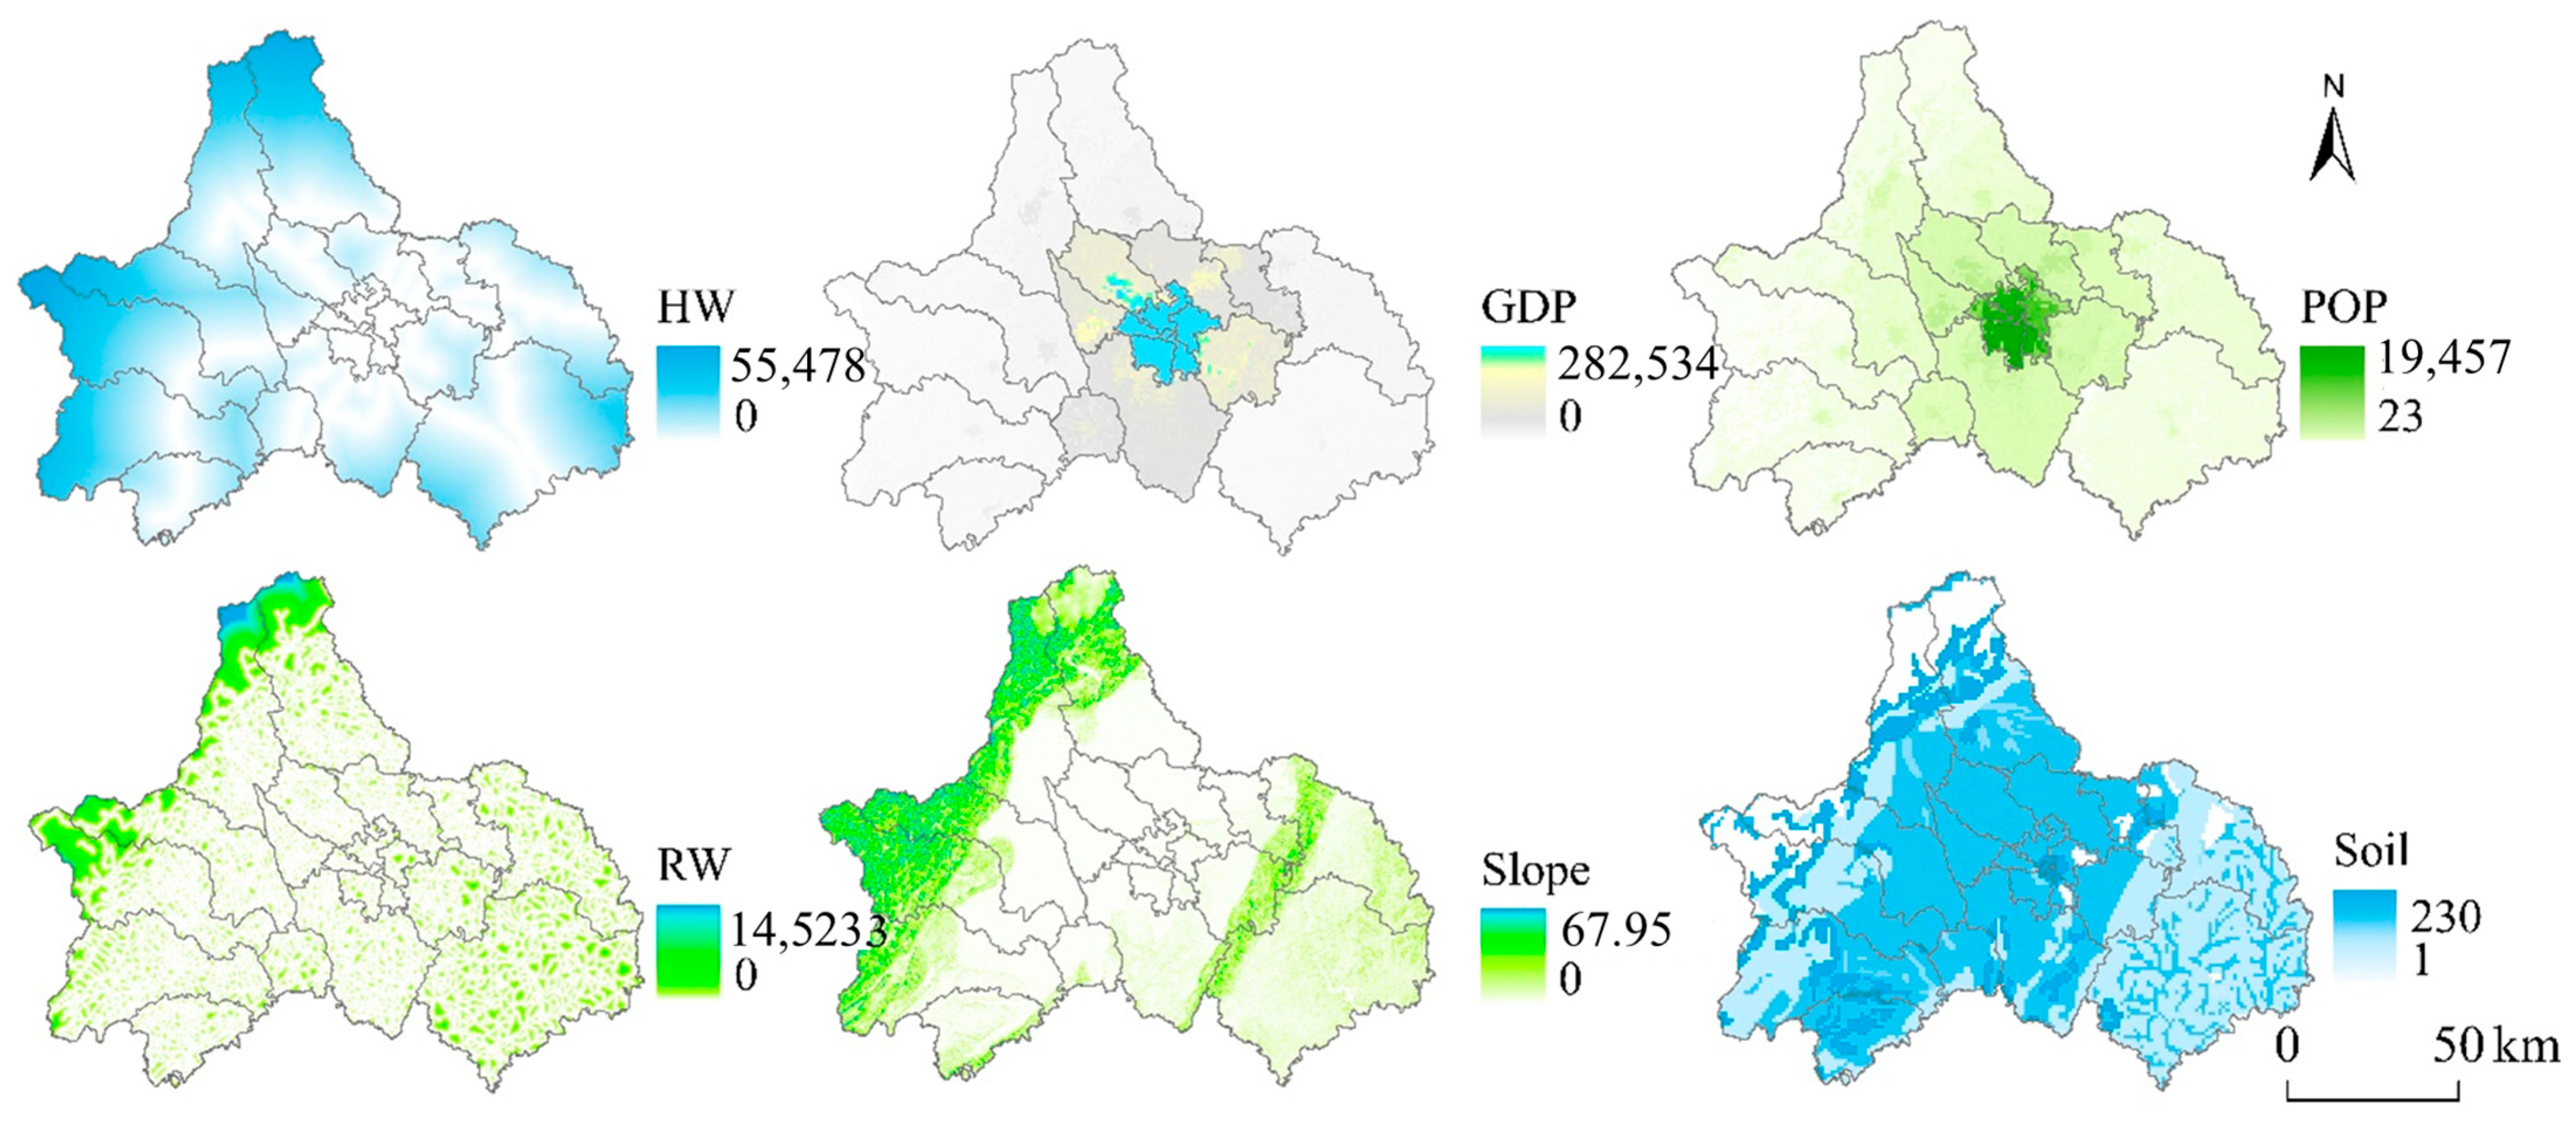
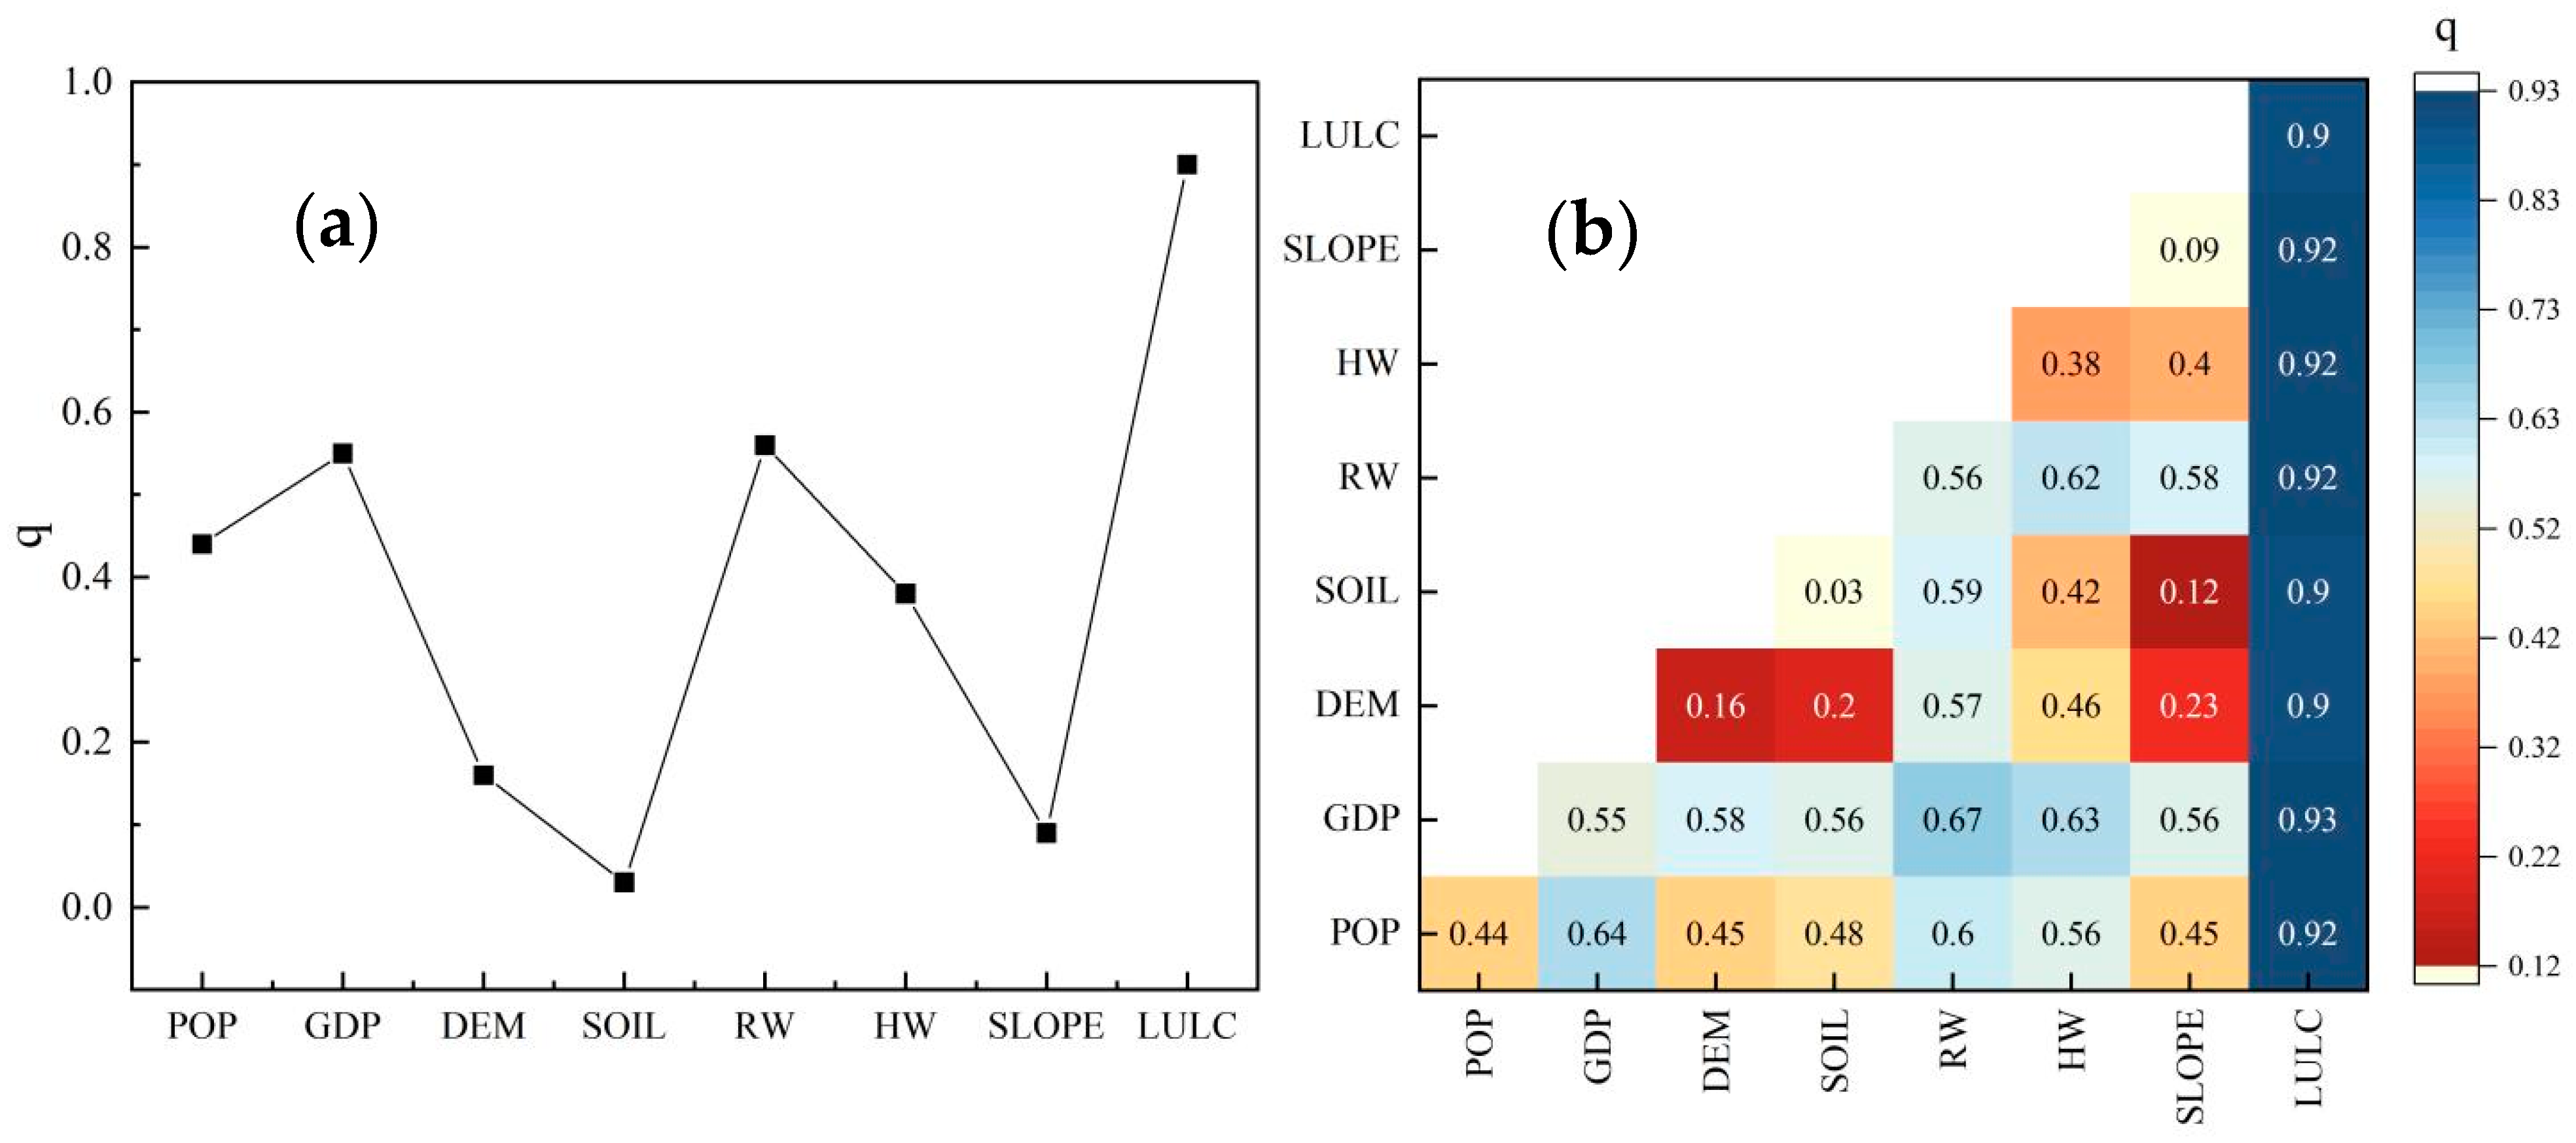
3.2.4. Carbon Stock Driving Mechanisms

To investigate the driving mechanisms of carbon stock in Chengdu, eight influencing factors were selected from the natural and socio-economic aspects for factor detection using Geographic Detectors. The natural factors include DEM, SOIL (Soil type), and SLOPE, while the socio-economic factors include LULC, POP, GDP, RW, and HW (Figure 10).
In terms of single-factor driving, LULC had the highest explanatory power on the distribution of carbon stock, with a q value of 0.9, indicating that carbon stock is most influenced by land use (Figure 11). Following this, RW and GDP also had significant impacts on carbon stock, with q values both exceeding 0.5. POP and HW had q values of 0.44 and 0.38, lower than 0.5, but still more influential than natural factors. Among the natural factors, DEM had a q value of 0.16, higher than SLOPE and SOIL. SOIL had the lowest q value at only 0.03, indicating the smallest impact on carbon stock.
Regarding two-factor driving, the interactions between factors were mainly enhancing. Among them, the interaction of LULC∩GDP was the strongest, with a q value of 0.93. Following this were the interactions of LULC with other factors, with q values all reaching 0.9, once again highlighting LULC as the primary factor influencing carbon stock differentiation. Additionally, the interactions of RW∩GDP, POP∩GDP, HW∩GDP, RW∩HW, and RW∩POP were also relatively strong, with q values all exceeding 0.6. The interactions of natural factors were weaker, with DEM∩SOIL and DEM∩SLOPE having q values of 0.2 and 0.23, while the SOIL∩SLOPE interaction was the weakest at only 0.12.

4. Discussion

4.1. Reasons for Changes in Carbon Stock in Chengdu

This study analyzed the impact of Park City construction on carbon stock in Chengdu City from a Park City perspective using the InVEST model in terms of time and space, and identified the driving factors of carbon stock through Geographic Detectors. Additionally, policy factors were integrated using the FLUS model to simulate future carbon stock under different scenarios, providing an in-depth analysis of the impact of Park City construction on carbon stock.
The carbon stock in Chengdu from 2012 to 2022 exhibited an overall increasing trend, closely related to the changes in land use within the city. As the area of forest land increased, its carbon stock also rose, consistent with findings from some scholars’ research [39,40]. During the period from 2012 to 2022, the carbon stock of forest land increased by 5.41 × 10⁶ tons. Among this increase, the construction of Park Cities contributed to a rise in forest land carbon stock by 7.48 × 10⁵ tons. Furthermore, in 2060, the carbon stock of forest land amounted to 3.43 × 10⁷ tons, surpassing that of cultivated land, thus becoming the main contributor to the increase in carbon stock. This aligns with the results of studies conducted in Beijing, Tianjin, and other areas by Gong et al. [41,42]. Additionally, the improvement in carbon stock in Chengdu is closely associated with the ecological conservation policies implemented in the city. Chengdu, being one of the key cities in Sichuan Province for the Grain for Green Project, has achieved significant success in increasing forest coverage, reducing soil erosion, and promoting ecological environment construction [43]. By 2022, Chengdu’s forest coverage rate reached 40.5%. Concurrently, the construction of the Park City in Chengdu strictly adheres to ecological red lines and permanent prime farmland, limiting the expansion of construction land and promoting an increase in forest land area by 806.84 km2, thereby optimizing Chengdu’s land use structure. This has also facilitated the increase in carbon stock.
To explore the driving mechanisms of carbon stock in Chengdu, eight factors including POP, GDP, DEM, SOIL, RW, HW, SLOPE, and LULC were selected as influencing factors, and a Geographic Detector was used for detection (Figure 11). The results indicate that the distribution of carbon stock in Chengdu is primarily driven by socio-economic factors, with less influence from natural factors. LULC is the most significant factor affecting carbon stock distribution, and its interaction with other factors also significantly impacts carbon stock. As LULC is heavily influenced by policy and other socio-economic factors, adjusting land use structure through policy planning is crucial for enhancing carbon stock.
However, this study also diverges from the conclusions of other scholars [44,45]. Through forecasting, the future carbon stock in Chengdu shows a declining trend across all three scenarios. Chengdu has experienced rapid development in recent years, attracting a substantial influx of population and driving swift urban spatial expansion. This has led to a rapid increase in construction land, which has constrained the development of ecological land and hindered further increases in carbon stock. This trend is expected to intensify in the future. Despite efforts to protect forest and grassland in the PCS, the rapid economic development is still expected to lead to a downward trend in carbon stock in Chengdu in the future. Among the three scenarios, the PCS has the highest carbon stock, reaching 6.62 × 10⁷ tons in 2030 and 6.54 × 10⁷ tons in 2060. This indicates that ecological conservation policies can mitigate the loss of carbon stock. The carbon stock in the NDS is higher than that in the CLDS, which is also where this study differs from other research results [46]. Due to the ongoing implementation of the Grain for Green Project in Chengdu, the area of forest land is rapidly increasing, resulting in a greater probability of forest land development in the NDS. Consequently, Chengdu’s future forest land area grows rapidly, resulting in a larger forest land area. Since forest land is a primary contributor to carbon stock enhancement, the forest land carbon stock in 2030 and 2060 under the NDS is, respectively, 4.37 × 10⁴ tons and 3.29 × 10⁶ tons higher than that under the CLDS. The CLDS exhibits the lowest carbon stock due to the protection of cultivated land, which restricts the area of other land types and thus limits the growth of carbon stock to a certain extent.

4.2. Research Challenges and Uncertainties

During the construction of the Park City, the area of forest and grassland increased significantly, leading to an increase in carbon stock. However, the carbon stock change rate in water area was the lowest at −20.60%, indicating that water area was not adequately utilized during the Park City construction process. Through projections, it is evident that the future carbon stock in Chengdu is declining across all three scenarios, reflecting some challenges still present in Park City construction. The significant increase in demand for construction land area, reaching 3038.17 km2 by 2060, restricts the expansion of ecological land such as forest land and grassland, limiting their ability to act as carbon sinks effectively. Therefore, in the future, the following measures could be taken:
  • Park City construction should be continued. Practice has shown that the construction of the Park City can optimize the structure of land use and improve the quality of ecological land use. In the PCS, carbon stock is higher than in other scenarios, which can help mitigate the loss of urban carbon stock and promote the achievement of the carbon peaking and carbon neutrality goals.
  • Strengthen ecological restoration efforts, especially in controlling the use of ecological land. By continuous ecological restoration, enhance the ecological quality of forest and grassland, and fully utilize their carbon sequestration function.
  • Emphasize the protection of water areas. Restoring damaged aquatic ecosystems through ecological restoration projects, including vegetation recovery and wetland restoration, can enhance the carbon stock capacity of water areas. Rehabilitating healthy aquatic ecosystems contributes to improving carbon sequestration efficiency.
  • Strictly control the conversion of construction land. Clearly define the boundaries between ecological land and construction land, and strictly control the scope and speed of land conversion for construction. Simultaneously, promote green building and low-carbon urban development to reduce the impact of construction land on the ecological environment.
However, this study also has some limitations. Firstly, 13 factors such as annual average TEM, GDP, and POP were used as driving factors to simulate the land use structure of Chengdu in 2030 and 2060, while in reality, there are many more factors influencing land use change. Secondly, the empirical parameters set in the FLUS model may introduce uncertainties to the model’s accuracy. Lastly, the InVEST model itself has limitations, as it only considers the impact of changes in various land types on carbon stock, overlooking factors such as temperature, humidity changes, and the influence of plant conditions on carbon density. In future research, it is crucial to fully recognize that carbon density is influenced by many factors and is not a fixed value. More consideration should be given to factors affecting carbon density and its interannual variability to obtain more accurate results.

4.3. The Practical Significance of Park City Construction

The construction of the Park City contributes to the achievement of the carbon peaking and carbon neutrality goals. Park City construction increases carbon stock by 3.75 × 10⁵ tons, with forest ecosystem carbon stock increasing by 7.48 × 10⁵ tons. Through simulation, the PCS emerges as the one with the highest carbon stock for both 2030 and 2060, with carbon stocks reaching 6.62 × 10⁷ tons and 6.54 × 10⁷ tons, respectively. Currently, the world has entered the era of global climate change, posing significant threats to sustainable development. In response, China has proposed carbon peaking and carbon neutrality goals. While increasing energy consumption and greenhouse gas emissions are inevitable realities, besides energy conservation and emissions reduction, carbon sequestration and stock must also be pursued to increase carbon stock. Forest ecosystems are the main source of carbon sequestration in China’s terrestrial ecosystems, playing a positive role in global climate mitigation. Park Cities emphasize the concept of urban ecological civilization, emphasizing the co-prosperity of cities and greenery. On one hand, constructing an ecological green space network strengthens structural green ecological space planning and control; on the other hand, controlling the intensity of urban development and implementing ecological restoration and landscape reconstruction.
The construction of Park City has a profound practical significance on carbon stock, providing a new path and strategy for the sustainable development of cities. With the emergence of urban issues, more sustainable urban design is increasingly valued. Examples of such efforts include postmodern urbanism and ecological urbanism, which emerged in the late 20th century to address contemporary urban issues and promote sustainable urban planning and design. Various forms of cities such as Garden Cities, Ecological Cities, Low-carbon Cities, and Smart Cities have appeared, aiming to promote the balance of social, economic, and environmental aspects through planning and design to create a healthier, fairer, and more enduring urban environment. Park Cities represent a new model of sustainable urban development that increases green space coverage and improves the ecological environment to promote the increase of carbon stock in forests and other ecological lands. This not only helps to enhance the city’s carbon absorption and fixation capacity and increase terrestrial ecosystem carbon stock, but also strengthens ecological environment protection and enhances the city’s ecological health level. Furthermore, the construction of Park Cities can reduce carbon dioxide concentration in the air and decrease carbon emissions, thereby improving air quality, which is of great significance for the sustainable development of cities.
Park Cities represent a new model for urban development in China amidst rapid global urbanization, and they are crucial for achieving high-quality development and ecological civilization construction. They not only provide guidance for the construction of other Park Cities such as Shenzhen and Shanghai but also offer references and construction insights for urbanized areas worldwide, providing a new path for increasing carbon stock and mitigating global climate change.

5. Conclusions

After the construction of Park City, the quality of forest land has improved, resulting in an increase in forest land carbon stock by 1.19 × 10⁶ tons. There has been a significant increase in carbon stock in Longquan Mountain and areas in the eastern part of Chengdu, such as Jintang and Jianyang.
The Park City construction has played a positive role in increasing carbon stock. Compared to scenarios without Park City construction, the implementation of Park City has led to a total carbon stock increase of 3.75 × 10⁵ tons in Chengdu, with forest land carbon stock increasing by 7.48 × 10⁵ tons.
The PCS is most conducive to achieving the carbon peaking and carbon neutrality goals. Among the three scenarios for the future, carbon stock is highest under the PCS, reaching 6.62 × 10⁷ tons in 2030 and 6.54 × 10⁷ tons in 2060. Carbon stock under the NDS follows, while the CLDS exhibits the lowest carbon stock. This is attributed to the protection of cultivated land in the CLDS, which limits the area of other land types and consequently restricts the growth of carbon stock to a certain extent.
Carbon stock is closely related to LUCC. A reduction in cultivated land leads to a decrease in its carbon stock, while an increase in forest land and construction land area results in higher carbon stock for these land types. Forest land is the primary contributor to the increase in carbon stock, with an increase of 5.41 × 10⁶ tons from 2012 to 2022. In 2060, forest land carbon stock surpasses cultivated land carbon stock, becoming the land cover type with the highest carbon stock.

Author Contributions

Conceptualization, L.T. and H.L.; methodology, L.T.; software, L.T., J.W., and L.X.; validation, L.T., J.W., L.X., and H.L.; formal analysis, L.T.; investigation, H.L.; resources, L.T. and J.W.; data curation, L.T.; writing—original draft preparation, L.T.; writing—review and editing, L.T.; visualization, L.T.; supervision, L.T.; project administration, L.T.; funding acquisition, H.L. All authors have read and agreed to the published version of the manuscript.

Funding

This research was funded by Humanities and Social Sciences Project of the Ministry of Education of the Peoples Republic, grant number 21YJCZH099; National Natural Science Foundation of China, grant number 41401089, 41741014; Science and Technology Project of Sichuan Province, grant number 2023NSFSC1979 and the Basic Application Research Project of Science and Technology Department of Sichuan Province, grant number 2020YJ0118.

Institutional Review Board Statement

Not applicable.

Informed Consent Statement

Not applicable.

Data Availability Statement

The data presented in this study are available upon request from the corresponding author.

Conflicts of Interest

The authors declare no conflict of interest.

References

  1. Wang, B.; Mu, C.C.; Lu, H.C.; Li, N.; Zhang, Y.; Ma, L. Ecosystem carbon stock and sink/source of temperate forested wetlands in Xiaoxing’anling, northeast China. J. For. Res. 2022, 33, 839–849. [Google Scholar] [CrossRef]
  2. Fowzia, A.; Erika, M.; Adam, C.; Tsedekech, G.W.; Csaba, G.; Melenya, O.C.; Evans, D.; Stephen, O.; Marta, F. Effects of land use change and topography on the quantity and distribution of soil organic carbon stocks on Acrisol catenas in tropical small-scale shade cocoa systems of the Ashanti region of Ghana. Catena 2022, 216, 106366. [Google Scholar]
  3. Wang, Q.; Yang, C.H.; Wang, M.L.; Zhao, L.; Zhao, Y.C.; Zhang, Q.P.; Zhang, C.Y. Decoupling analysis to assess the impact of land use patterns on carbon emissions: A case study in the Yellow River Delta efficient eco-economic zone, China. J. Cleaner Prod. 2023, 412, 137415. [Google Scholar] [CrossRef]
  4. Nave, L.E.; DeLyser, K.; Domke, G.M.; Holub, S.M.; Janowiak, M.K.; Keller, A.B.; Peters, M.P.; Solarik, K.A.; Walters, B.F.; Swanston, C.W. Land use change and forest management effects on soil carbon stocks in the Northeast U.S. Carbon Balance Manag. 2024, 19, 5. [Google Scholar] [CrossRef] [PubMed]
  5. Qu, S.J.; Han, L.; Huang, X.; Yang, N.N.; Guo, Q.H. Analysis of the spatiotemporal evolution of carbon reserves in Shanxi province under different scenarios in the future. Environ. Sci. 2023, 1–20. [Google Scholar] [CrossRef]
  6. Sun, L.Q.; Chen, J.; Li, Q.L.; Huang, D. Dramatic uneven urbanization of large cities throughout the world in recent decades. Nat. Commun. 2020, 11, 5366. [Google Scholar] [CrossRef] [PubMed]
  7. Zhen, J.C.; Xie, B.G.; You, X.B. Spatio-temporal characteristics of habitat quality based on land-use changes in Guangdong Province. Acta Ecol. Sin. 2022, 42, 6997–7010. [Google Scholar]
  8. Liang, G.M.; Xiao, Y.; Liu, M.M.; Lin, S.; Wu, Z.L.; Hu, X.S. Simulation and elicitation of land use and carbon stock changes in Fuzhou under the background of traffic planning. J. Nat. Resour. 2023, 38, 3074–3092. [Google Scholar]
  9. Li, B.B.; Li, P.P.; Yang, M.Y.; Xiao, H.B.; Xu, M.X.; Liu, G.B. Land-use conversion changes deep soil organic carbon stock in the Chinese Loess Plateau. Land. Degrad. Dev. 2021, 32, 505–517. [Google Scholar] [CrossRef]
  10. Zhu, G.F.; Qiu, D.D.; Zhang, Z.X.; Sang, L.Y.; Liu, Y.W.; Wang, L.; Zhao, K.; Ma, H.; Xu, Y.; Wan, Q. Land-use changes lead to a decrease in carbon stock in arid region, China. Ecol. Indic. 2021, 127, 107770. [Google Scholar] [CrossRef]
  11. Zhang, B.; Li, L.; Xia, Q.Y.; Dong, J. Land use change and its impact on carbon stock under the constraints of “three lines”: A case study of Wuhan City circle. Acta Ecol. Sin. 2022, 42, 2265–2280. [Google Scholar]
  12. Yang, X.L.; Xie, M.K.; Zhang, Y.L.; Liu, D.G. Influencing mechanism of urbanization on carbon stock in urban and rural ecological spaces: A case study of Beijing. J. Chin. Urban For. 2023, 21, 98–105+142. [Google Scholar]
  13. Fu, K.X.; Jia, G.D.; Yu, X.X.; Chen, L.X. Analysis of temporal and spatial carbon stock changes and driving mechanism in Xinjiang region by coupled PLUS-InVEST-Geodector model. Environ. Sci. 2024, 1–19. [Google Scholar] [CrossRef]
  14. Hersperger, M.A.; Oliveira, E.; Pagliarin, S.; Palka, S.; Verburg, P.; Bolliger, J.; Grădinaru, S. Urban land-use change: The role of strategic spatial planning. Glob. Environ. Chang. 2018, 51, 32–42. [Google Scholar] [CrossRef]
  15. Wu, J.J.; Tang, Z.F.; Lü, F.Z.; Yang, K.J. Ultrasonic guided wave focusing in waveguides with constant irregular cross-sections. Ultrasonics 2018, 89, 1–12. [Google Scholar] [CrossRef] [PubMed]
  16. Shi, T.M.; Wang, D.; Tang, Y.; Li, P.Y.; Chu, Y.Q. Research progress on calculation method and impact factors of carbon sequestration capacity in urban eco-systems. J. Appl. Ecol. 2023, 34, 555–565. [Google Scholar]
  17. Li, P.Y.; Wan, Q.Y. Current situation and reflection on the design of Dong’an Lake Park in Chengdu guided by the concept of Park City. Sichuan Arch. 2023, 43, 52–54. [Google Scholar]
  18. He, X.; Yin, F.; Wang, J.X. Research on the landscape planning path of carbon sequestration enhancement in the background of Park City—Taking Chengdu as an example. J. Environ. Ecol. 2024, 6, 31–36+58. [Google Scholar]
  19. Ren, D.Z.; Liao, X.Y.; Xiao, Q.G.; Lai, C.H.; Song, F.; Meng, S.M.; Peng, X.Q. Carbon stock and spatial distribution pattern of forest vegetation in Chengdu. J. West China For. Sci. 2021, 50, 74–81. [Google Scholar]
  20. Ji, B.; He, J.L.; Wang, Z.J.; Jiang, Q. Characteristics and composition of vegetation carbon stock in natural grassland in Ning-xia, China. J. Appl. Ecol. 2021, 32, 1259–1268. [Google Scholar]
  21. Guo, Y.; Wei, Y.Q.; Ouyang, C.Y. Research on LIM-based simulation of carbon stock baseline scenario in urban trees: Taking the green space of a university in Beijing as an example. Beijing For. Univ. 2022, 44, 111–120. [Google Scholar]
  22. Piao, S.L.; Fang, J.Y.; Ciais, P.; Peylin, P.; Huang, Y.; Sitch, S.; Wang, T. The carbon balance of terrestrial ecosystems in China. Nature 2009, 458, 1009–1013. [Google Scholar] [CrossRef] [PubMed]
  23. Zhao, S.Q.; Liu, S.G.; Sohl, T.; Young, C.; Werner, J. Land use and carbon dynamics in the southeastern United States from 1992 to 2050. Environ. Res. Lett. 2013, 8, 044022. [Google Scholar] [CrossRef]
  24. Zhao, H.F.; Li, X.D.; Zhang, D.; Xiao, R.X. Aboveground biomass in grasslands in Qinghai Province estimated from MODIS data and its influencing factors. Acta Pratacult. Sin. 2020, 29, 5–16. [Google Scholar]
  25. Zhang, X.C.; Zhu, H.Z.; Zhong, H.P.; Zhu, H.P.; Cheng, Y.D.; Jin, G.L.; Shao, X.M. Assessment of above-ground biomass of grassland using remote sensing, Yili, Xinjiang. Acta Pratacult. Sin. 2015, 24, 25. [Google Scholar]
  26. Xu, W.Y.; Jin, X.B.; Yang, X.H.; Wang, Z.Q.; Liu, J.; Wang, D.; Shan, W.; Zhou, Y. The estimation of forest vegetation biomass in China in spatial grid. J. Nat. Resour. 2018, 33, 1725–1741. [Google Scholar]
  27. Sui, Y.Z.; Sun, D.P.; Li, S.J.; Xu, Y.C.; Wu, J.J. Study of coastal zone ecosystem restoration in the context of carbon stock change: A case of Dongying City. Acta Ecol. Sin. 2021, 41, 8112–8123. [Google Scholar]
  28. Chen, X.; Yu, L.; Hou, S.; Liu, T.; Li, X.Y.; Li, Y.Y.; Du, Z.; Li, C.; Wu, H.; Gao, G.; et al. Unraveling carbon stock dynamics and their determinants in China’s Loess Plateau over the past 40 years. Ecol. Indic. 2024, 159, 111760. [Google Scholar] [CrossRef]
  29. Babbar, D.; Areendran, G.; Sahana, M.; Sarma, K.; Raj, K.; Sivadas, A. Assessment and prediction of carbon sequestration using Markov chain and InVEST model in Sariska Tiger Reserve, India. J. Cleaner Prod. 2021, 278, 123333. [Google Scholar] [CrossRef]
  30. Liu, X.P.; Liang, X.; Li, X.; Xu, X.C.; Ou, J.P.; Chen, Y.M.; Li, S.; Wang, S.; Pei, F. A future land use simulation model (FLUS) for simulating multiple land use scenarios by coupling human and natural effects. Landscape. Urban Plan. 2017, 168, 94–116. [Google Scholar] [CrossRef]
  31. Fang, Z.S.; Zhong, C.R.; Wang, F.X.; Cheng, C.; Lü, X.B.; Chen, X. Spatia-temporal evolution and prediction of ecosystem carbon stock on Hainan island by coupling InVEST and FLUS models. Bull. Soil Water Conserv. 2023, 43, 320–329+342. [Google Scholar]
  32. Shen, L.; Zeng, Q. Multiscenario simulation of land use and land cover in the Zhundong mining area, Xinjiang, China. Ecol. Indic. 2022, 145, 109608. [Google Scholar] [CrossRef]
  33. Zhang, Y. Study on Carbon Emission Effect in Chengdu Plain Area Based on LUCC. Master’s Thesis, Sichuan Normal University, Sichuan, China, 2018. Volume 5. p. 25. [Google Scholar]
  34. Xie, G.; Wu, L.P.; Chen, M. Characterization of the evolution of spatial and temporal patterns of carbon stock in Chengdu based on land use change. Environ. Impact Assess. 2023, 45, 104–112. [Google Scholar]
  35. Zhang, Y.; Yu, P.H.; Tian, Y.S.; Chen, H.T.; Chen, Y.Y. Exploring the impact of integrated spatial function zones on land use dynamics and ecosystem services tradeoffs based on a future land use simulation (FLUS) model. Ecol. Indic. 2023, 150, 110246. [Google Scholar] [CrossRef]
  36. Li, J.Y.; Gong, J.; Guldmann, J.; Li, S.C.; Zhu, J. Carbon dynamics in the northeastern Qinghai–Tibetan Plateau from 1990 to 2030 using Landsat land use/cover change data. Remote Sens. 2020, 12, 528. [Google Scholar] [CrossRef]
  37. Yao, L.J.; Yue, B.R.; Pan, W.T.; Zhu, Z.B. Spatio-temporal evolution and multi-scenario simulation of carbon stock in counties based on FLUS and InVEST models. J. Chin. Urban For. 2023, 21, 152–158. [Google Scholar]
  38. Meng, F.M.; Luo, M.; Sa, C.L.; Wang, M.L.; Bao, Y.H. Quantitative assessment of the effects of climate, vegetation, soil and groundwater on soil moisture spatiotemporal variability in the Mongolian Plateau. Sci. Total Environ. 2021, 809, 152198. [Google Scholar] [CrossRef] [PubMed]
  39. Yue, S.J.; Ji, G.G.; Chen, W.Q.; Huang, J.C. Spatial and temporal variability characteristics of future carbon stocks in Anhui province under different SSP scenarios based on PLUS and InVEST models. Land 2023, 12, 1668. [Google Scholar] [CrossRef]
  40. Wei, Z.Z.; Dong, B.; Xu, H.F.; Xu, Z.L.; Lu, Z.P.; Liu, X. Spatio-temporal evolution and scenario prediction of carbon stock in typical wetlands in the Poyang Lake region. Bull. Soil Water Conserv. 2023, 43, 290–300. [Google Scholar]
  41. Gong, S.X.; Zhang, Y.H.; Li, Y.H. Spatio-temporal variation and prediction of carbon stock in Beijing–Tianjin–Hebei region–A PLUS–InVEST model approach. J. Arid. Land. 2023, 37, 20–28. [Google Scholar]
  42. Xu, D.; Yu, C.Q.; Lin, W.P.; Yao, J.; Zhou, W.Y. Spatiotemporal Evolution and Prediction of Land Use and Carbon Stock in Shanghai. Land 2024, 13, 267. [Google Scholar] [CrossRef]
  43. Ji, M.; Liu, H.C.; Li, W.; Liu, C.C.; Wang, Y.J.; Zhang, L.; Deng, M.R.; Shen, X.Y.; Liu, L.J.; Pan, K.W. The present situation and strategies of the follow-up industry development of the defarming-and-reafforestation program in Chengdu city. J. Sichuan For. Sci. Technol. 2013, 34, 91–94. [Google Scholar]
  44. Zhao, T.; Meng, J.J. Spatio-Temporal Evolution of Land Use and Resulting change in Carbon Stock in chengdu Plain Economic Zone (CPEZ), China. Mtn Res. 2023, 41, 648–661. [Google Scholar]
  45. Wu, D.; Zhu, K.G.; Zhang, S.; Huang, C.G.; Li, J. Evolution Analysis of Carbon Stock in Chengdu-Chongqing Economic Zone Based on PLUS Model and InVEST Model. Ecol. Environ. Monit. Three Gorges 2022, 7, 85–96. [Google Scholar]
  46. Wang, Z.Y.; Wu, F.; Wan, D.; Zhang, K.; Li, L.B.; Huang, C.H. Multi-scenario simulation of the impact of regional land use change on carbon reserve. China Environ. Sci. 2023, 43, 6063–6078. [Google Scholar]
Figure 1. Study area. (a) Chengdu City’s geographic location; (b) Chengdu City’s elevation; (c) Chengdu City’s administrative divisions; (d) Chengdu City’s land use distribution.
Sustainability 16 06471 g001
Figure 2. Chengdu 2012–2022 land use.
Sustainability 16 06471 g002
Figure 3. Land use transfer: (a) 2012–2017, (b) 2017–2022, (c) 2012–2022, (d) land use type transition changes from 2012 to 2022.
Sustainability 16 06471 g003
Figure 4. Land use area with multiple scenic spots in Chengdu from 2030 to 2060.
Sustainability 16 06471 g004
Figure 5. Land use in 2030 and 2060.
Sustainability 16 06471 g005
Figure 6. Carbon stock changes in Chengdu from 2012 to 2022.
Sustainability 16 06471 g006
Figure 7. Spatial distribution of carbon stock in Chengdu from 2012 to 2022.
Sustainability 16 06471 g007
Figure 8. (a) Simulated carbon stock in 2022, (b) actual carbon stock in 2022.
Sustainability 16 06471 g008
Figure 9. Future carbon stock in Chengdu under different scenarios.
Sustainability 16 06471 g009
Figure 10. Driving factors of carbon stock. DEM, Digital Elevation Model; SOIL, soil type; SLOPE, slope; LULC, land use/land cover; POP, population; GDP, Gross Domestic Product; RW, distance to railway; HW, distance to highway.
Sustainability 16 06471 g010
Figure 11. (a) Single-factor detection, (b) dual-factor detection.
Sustainability 16 06471 g011
Table 1. Carbon density data for Chengdu (Mg of C/ha).
Land Use TypeC_aboveC_belowC_SoilC_Dead
Cultivated land8.9213.0722.850.19
Forest land1214.8732.817.413
Grassland9.7912.0624.491.101
Water area009.411
Unused land0000
Construction land3.408.560
Table 2. FLUS model simulated 2030 multi-scenario land neighborhood weights.
Development ScenariosCultivated LandForest LandGrasslandWater AreaUnused LandConstruction Land
NDS0.2910.2860.10.0950.0120.268
CLDS0.2310.3260.120.0950.0120.248
PCS0.2910.2960.10.0950.0120.248
NDS, natural development scenario; CLDS, farmland protection scenario; PCS, Park City scenario.
Table 3. Multi-scenario for parameter settings in land use transfer matrix.
Development ScenariosLand Use TypeCultivated LandForest LandGrasslandWater AreaUnused LandConstruction Land
NDSCultivated land111111
Forest land111111
Grassland111111
Water area000100
Unused land111111
Construction land000001
CLDSCultivated land110001
Forest land111001
Grassland111000
Water area000100
Unused land111111
Construction land100001
PCSCultivated land111001
Forest land111001
Grassland111000
Water area011100
Unused land111111
Construction land010001
NDS, natural development scenario; CLDS, farmland protection scenario; PCS, Park City scenario.
Table 4. Land use dynamics degree by category from 2012 to 2022.
Land Use Dynamics DegreeLand Use Type2012–20172017–20222012–2022
Single-dynamic degree (%)Cultivated land−1.71−0.75−1.20
Forest land5.151.163.30
Grassland0.761.461.14
Water area−1.11−3.19−2.06
Unused land0.52−6.03−2.83
Construction land5.102.904.37
Comprehensive land use dynamic degree (%)1.270.540.9
Disclaimer/Publisher’s Note: The statements, opinions and data contained in all publications are solely those of the individual author(s) and contributor(s) and not of MDPI and/or the editor(s). MDPI and/or the editor(s) disclaim responsibility for any injury to people or property resulting from any ideas, methods, instructions or products referred to in the content.

