
Land Cover and Socioeconomic Analysis for Recommended Flood Risk Reduction Strategies in Java Island, Indonesia

Abstract
:1. Introduction
2. Materials and Methods
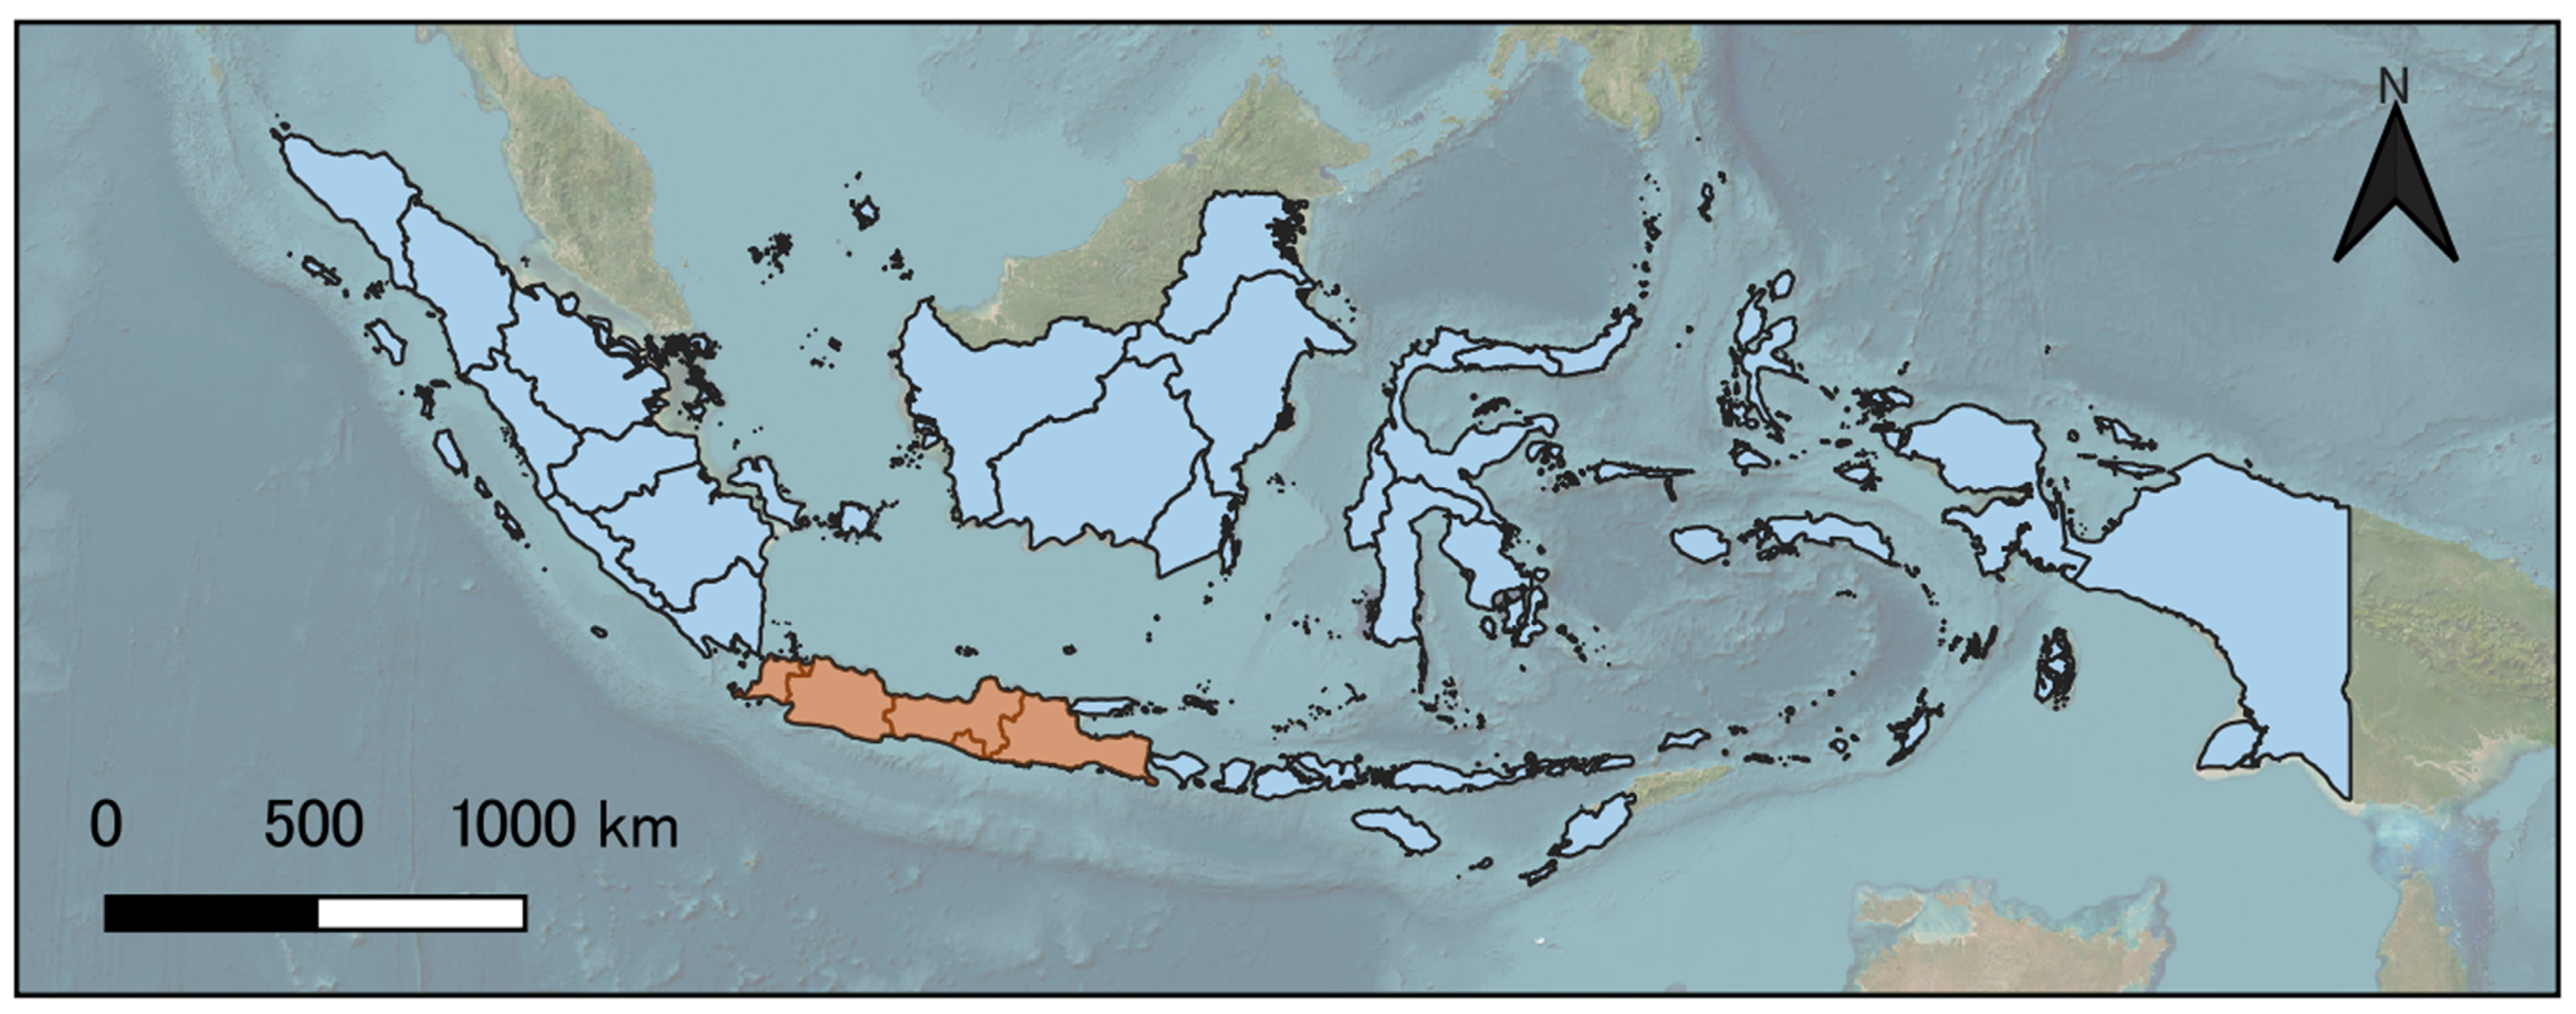
2.1. Study Area
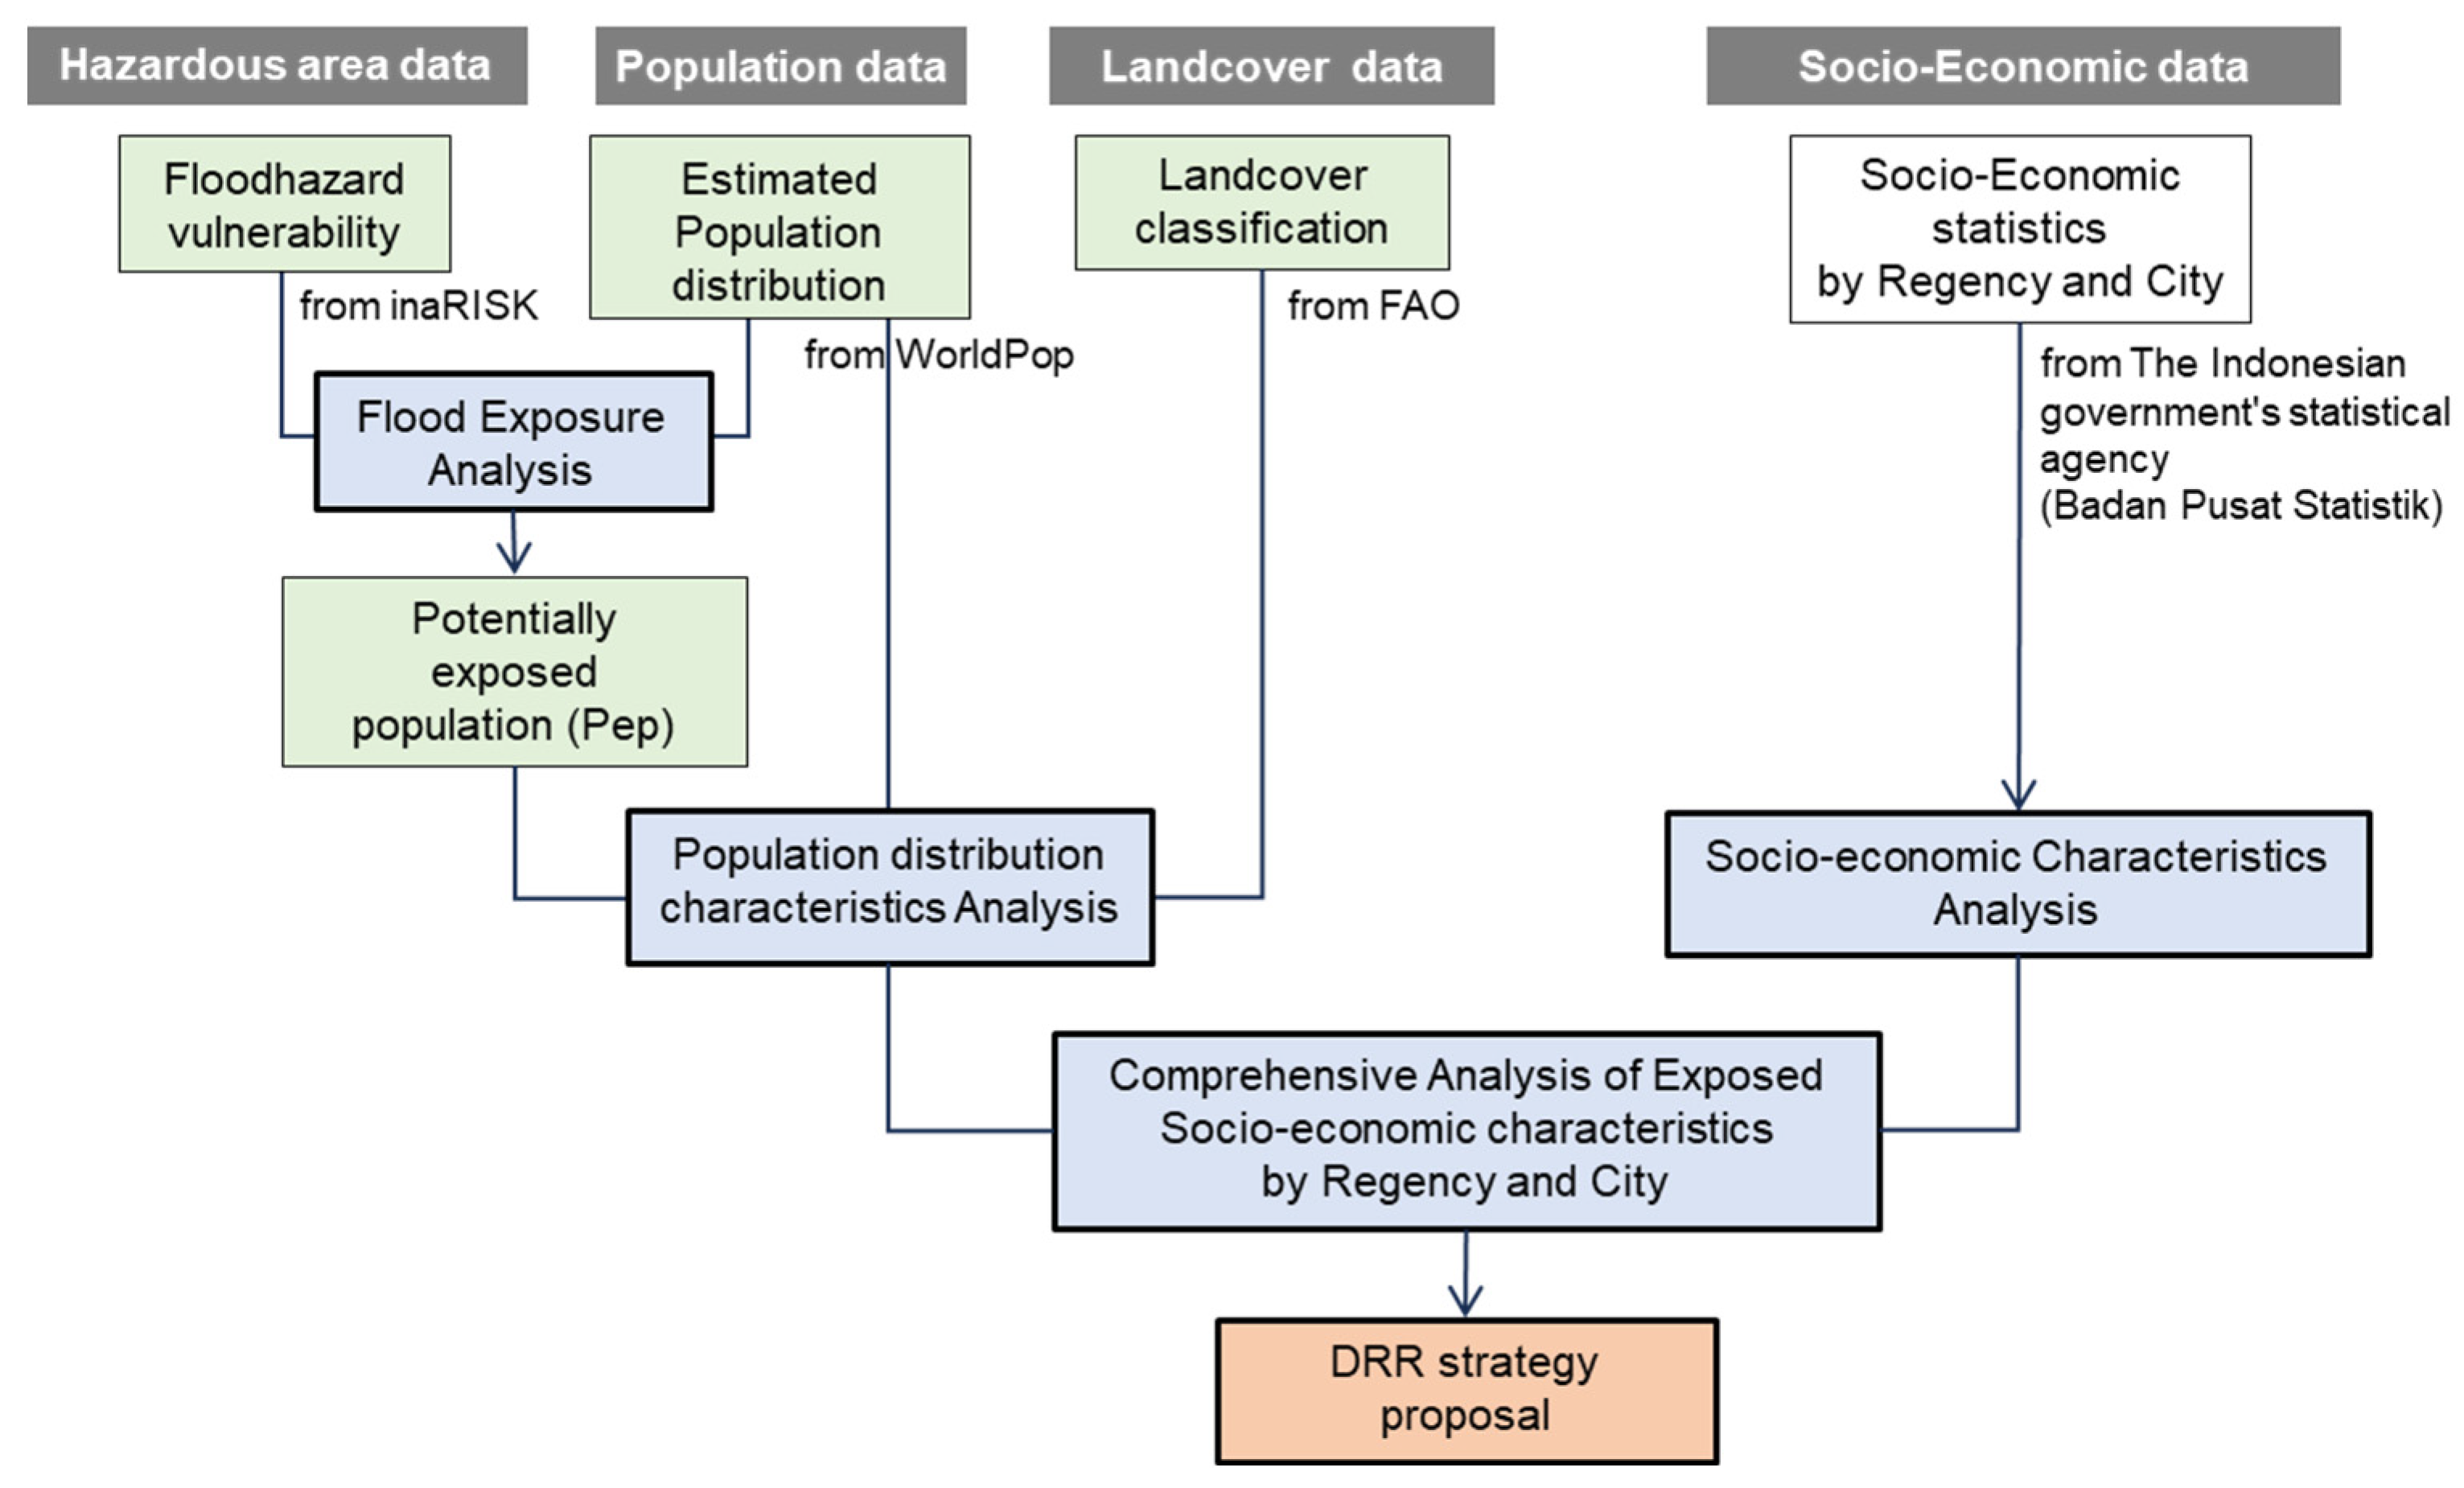
2.2. Method Framework and Materials
2.2.1. Outline
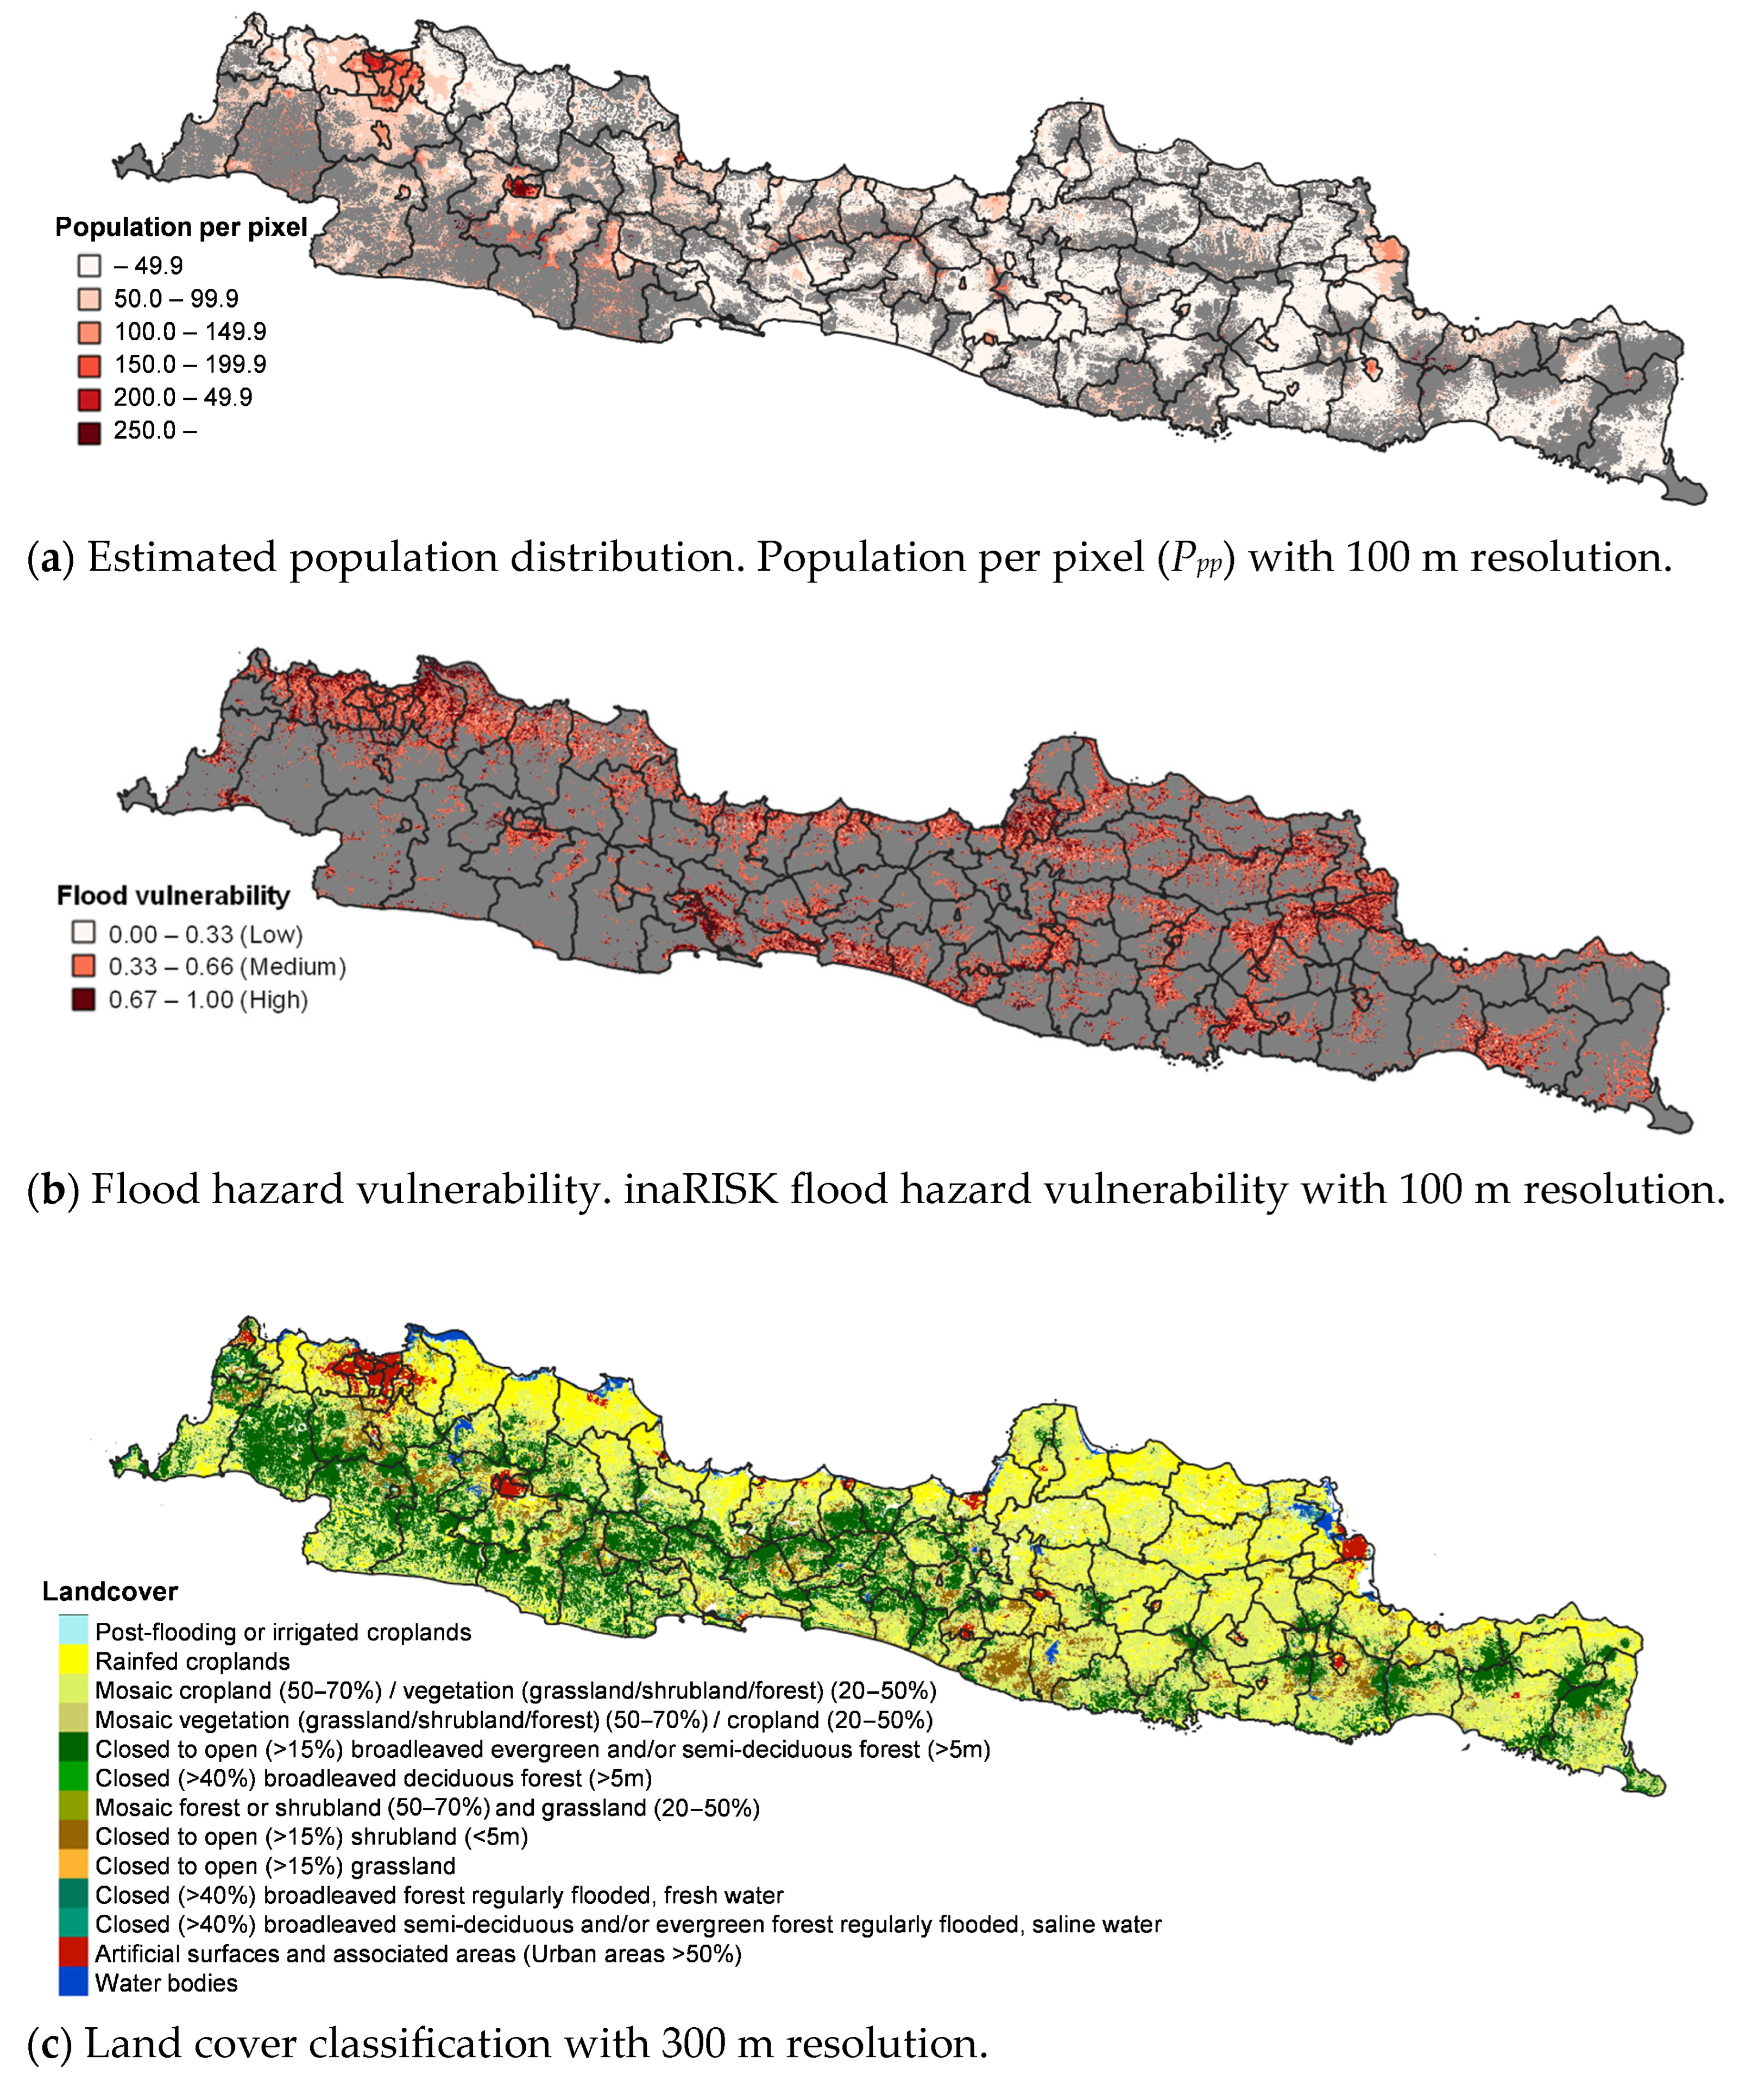
2.2.2. Materials
2.3. Analysis
2.3.1. Flood Exposure Analysis
2.3.2. Comprehensive Analysis of Exposed Socioeconomic Vulnerability
3. Results
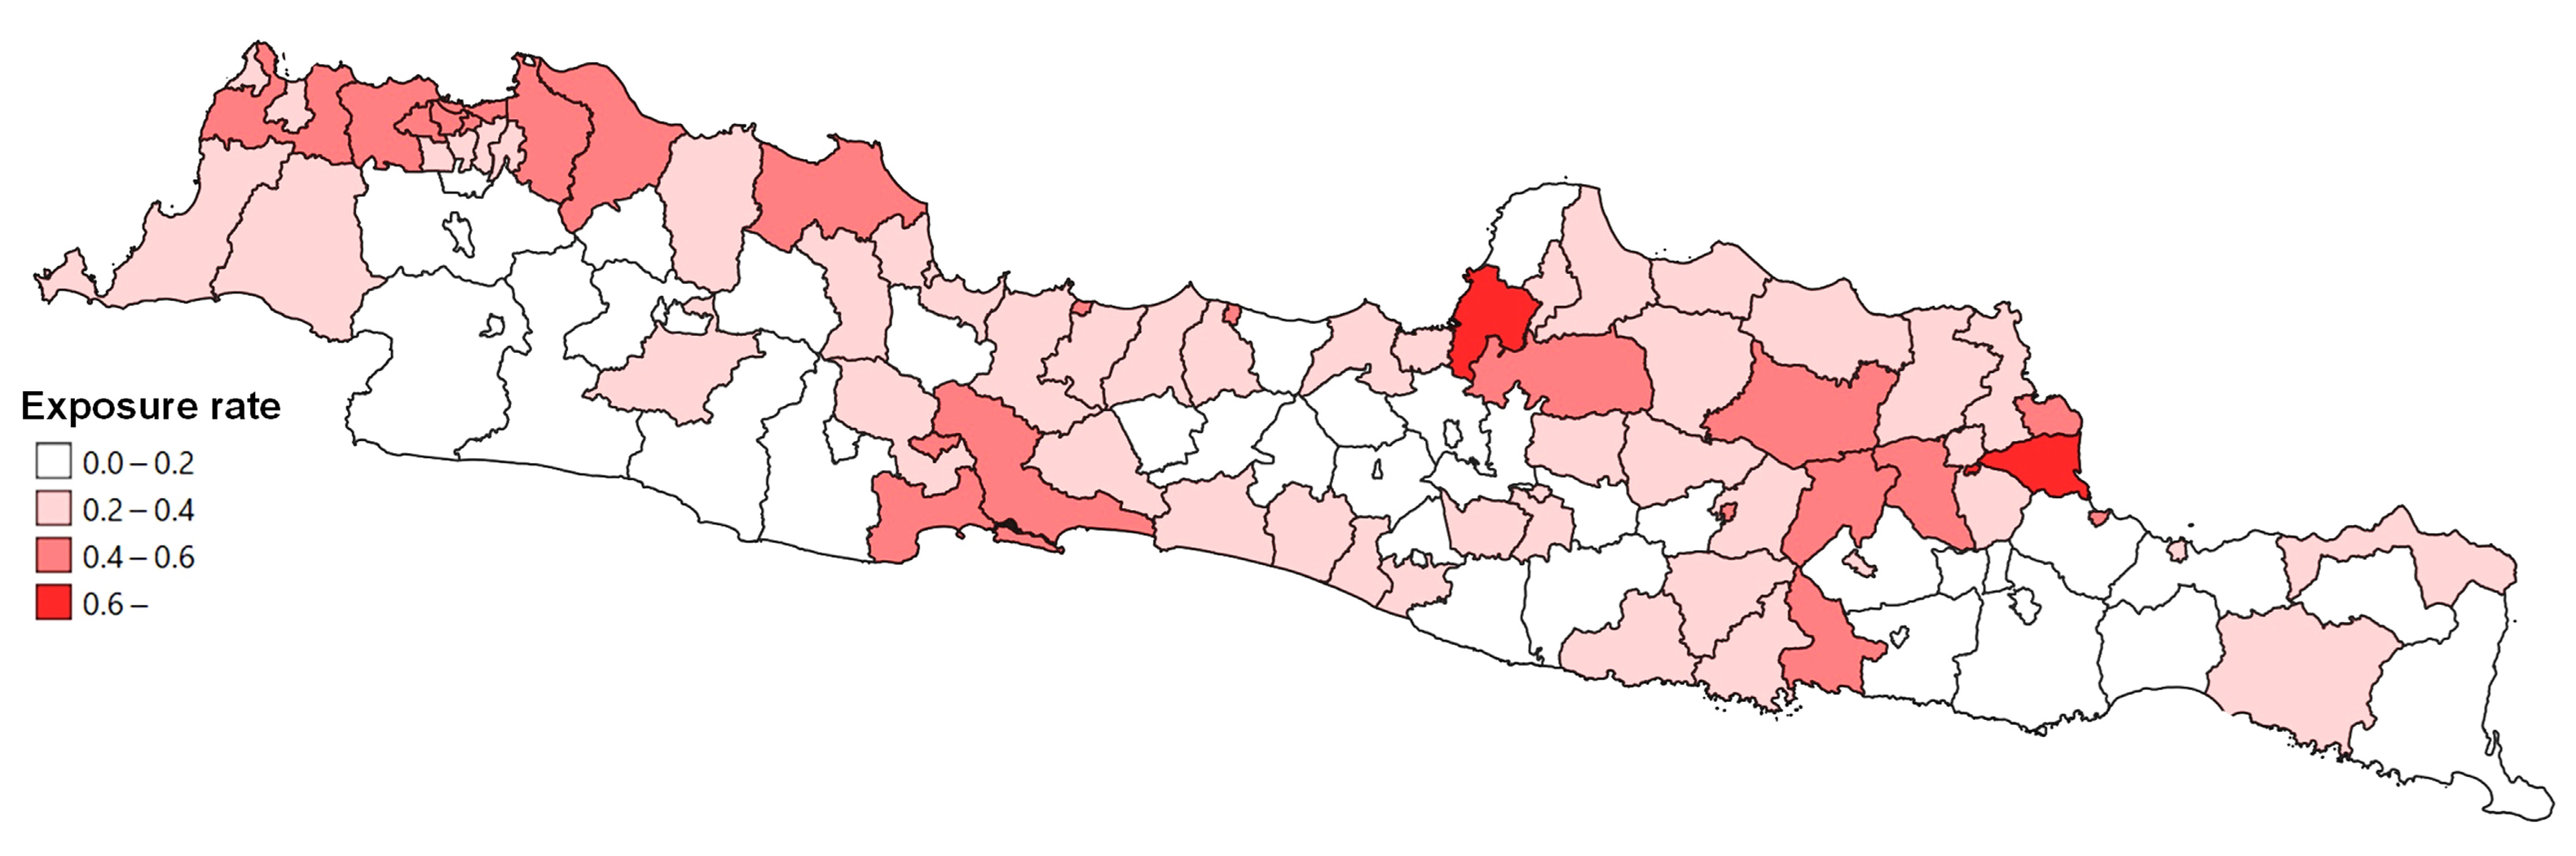
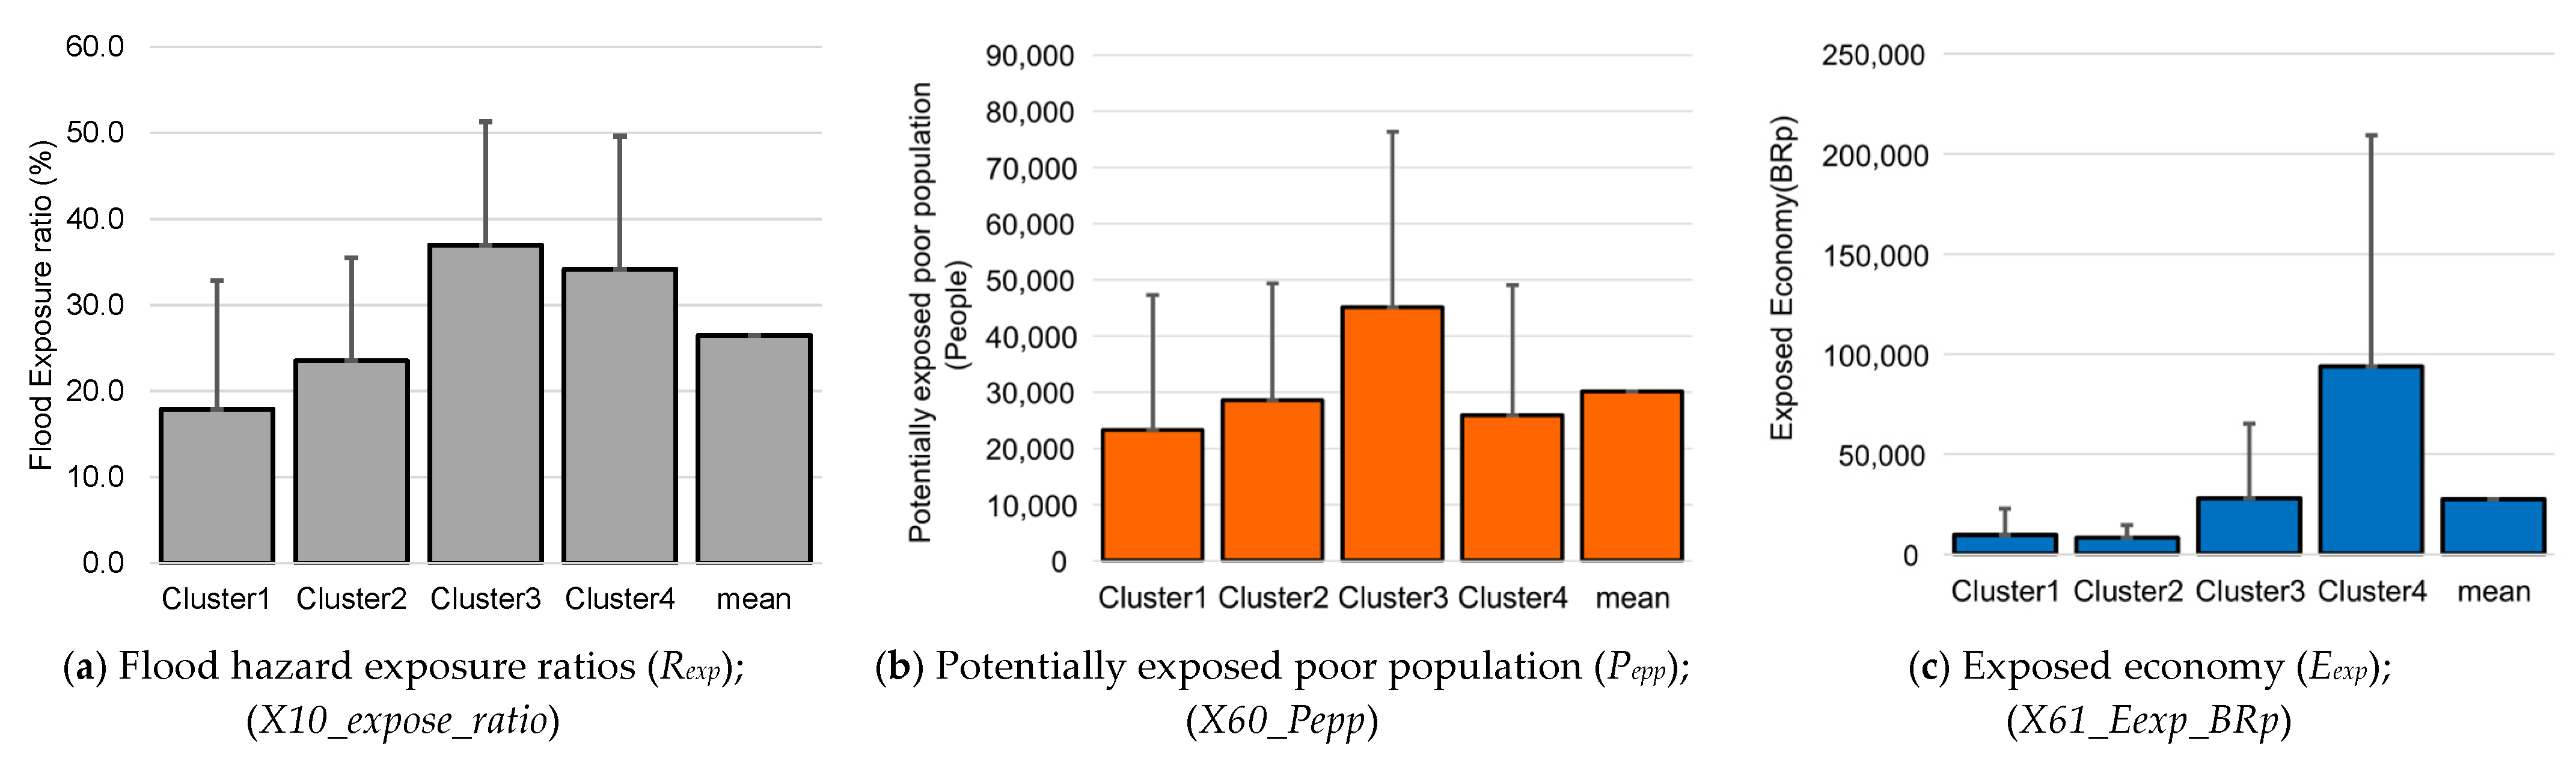
3.1. Flood Exposure Analysis Result
3.2. Population Distribution Characteristics Analysis Result
3.2.1. The Population Composition by Land Cover Type
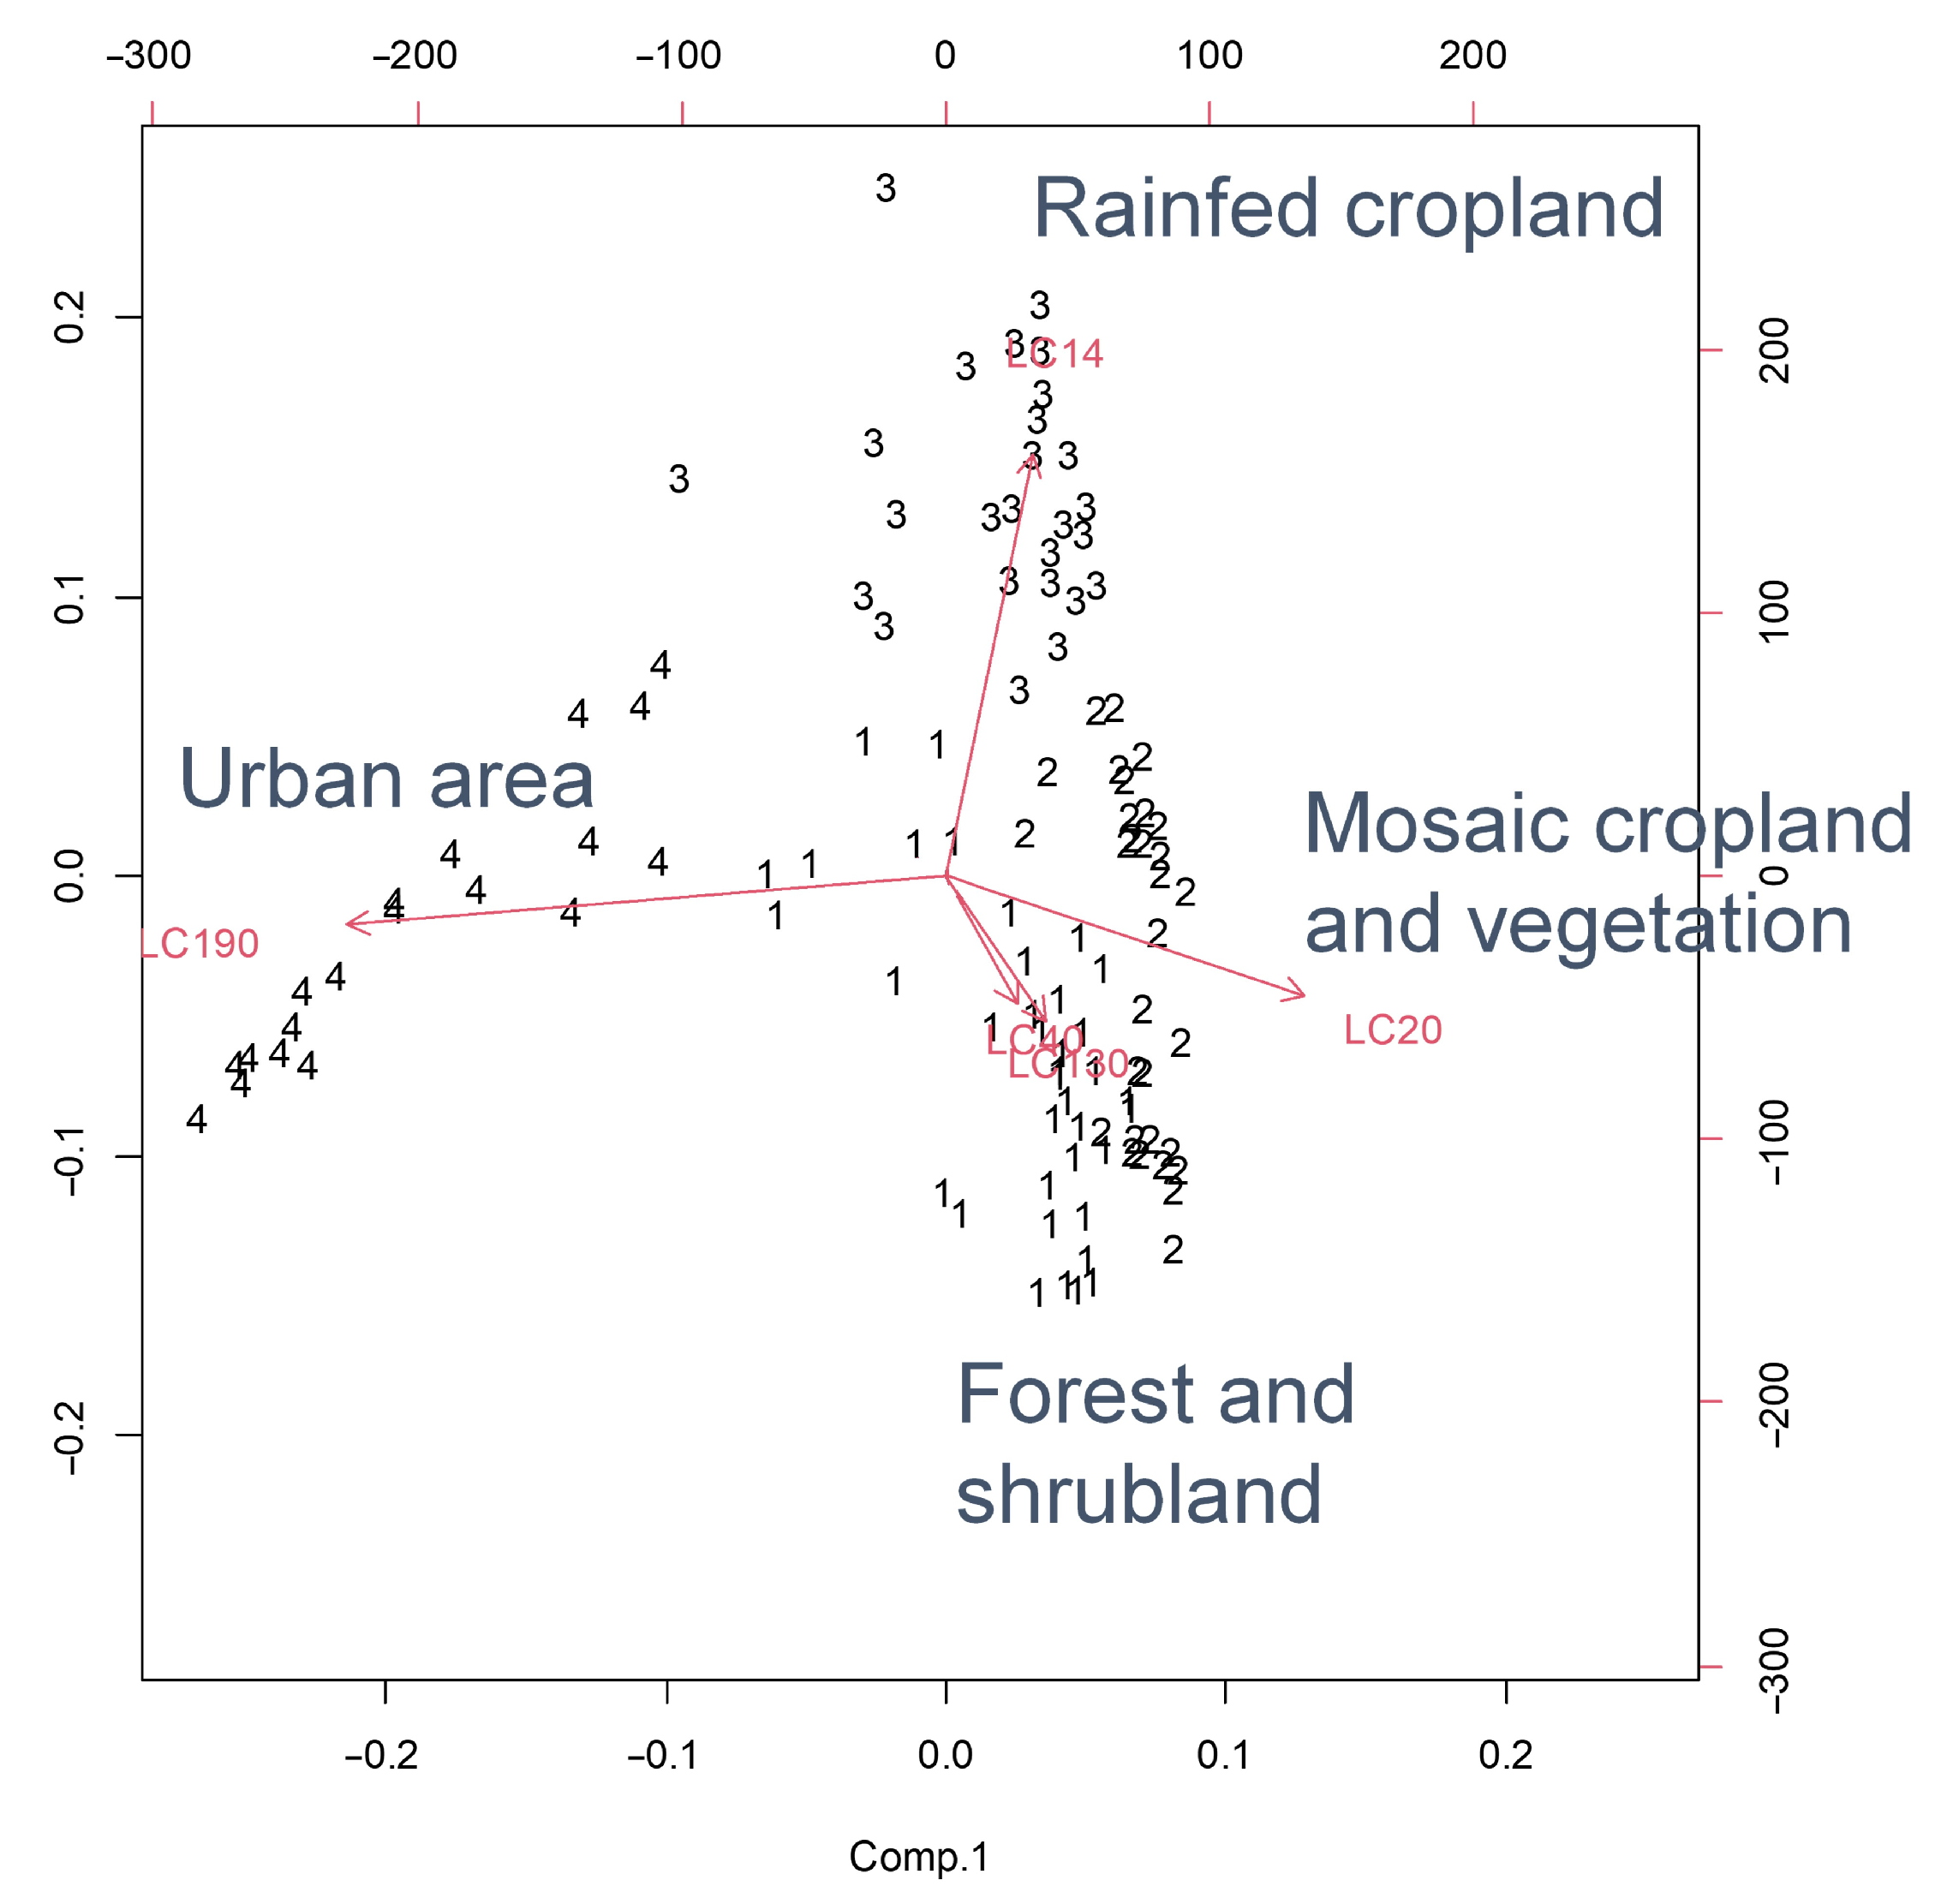
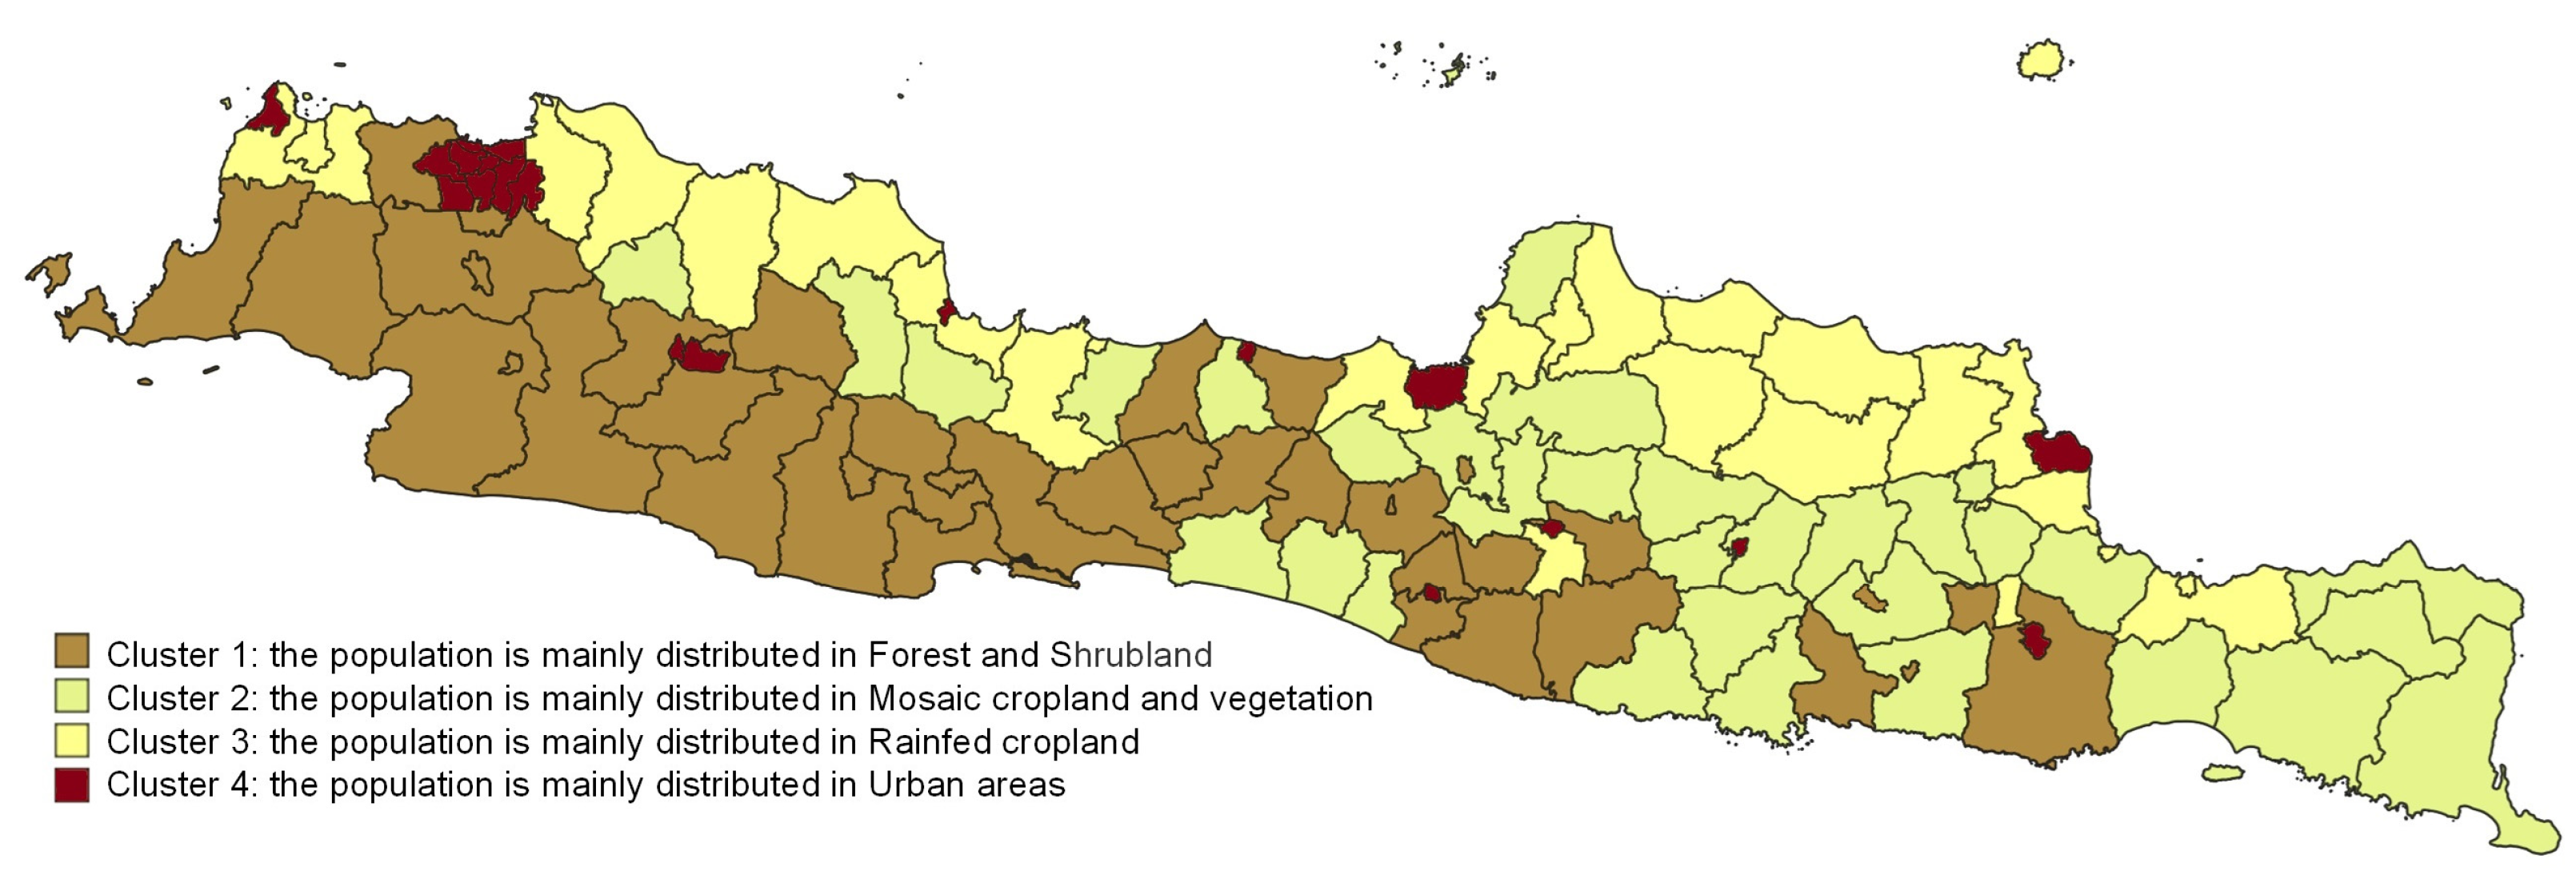
3.2.2. Cluster Analysis for the Population Composition by Land Cover Type
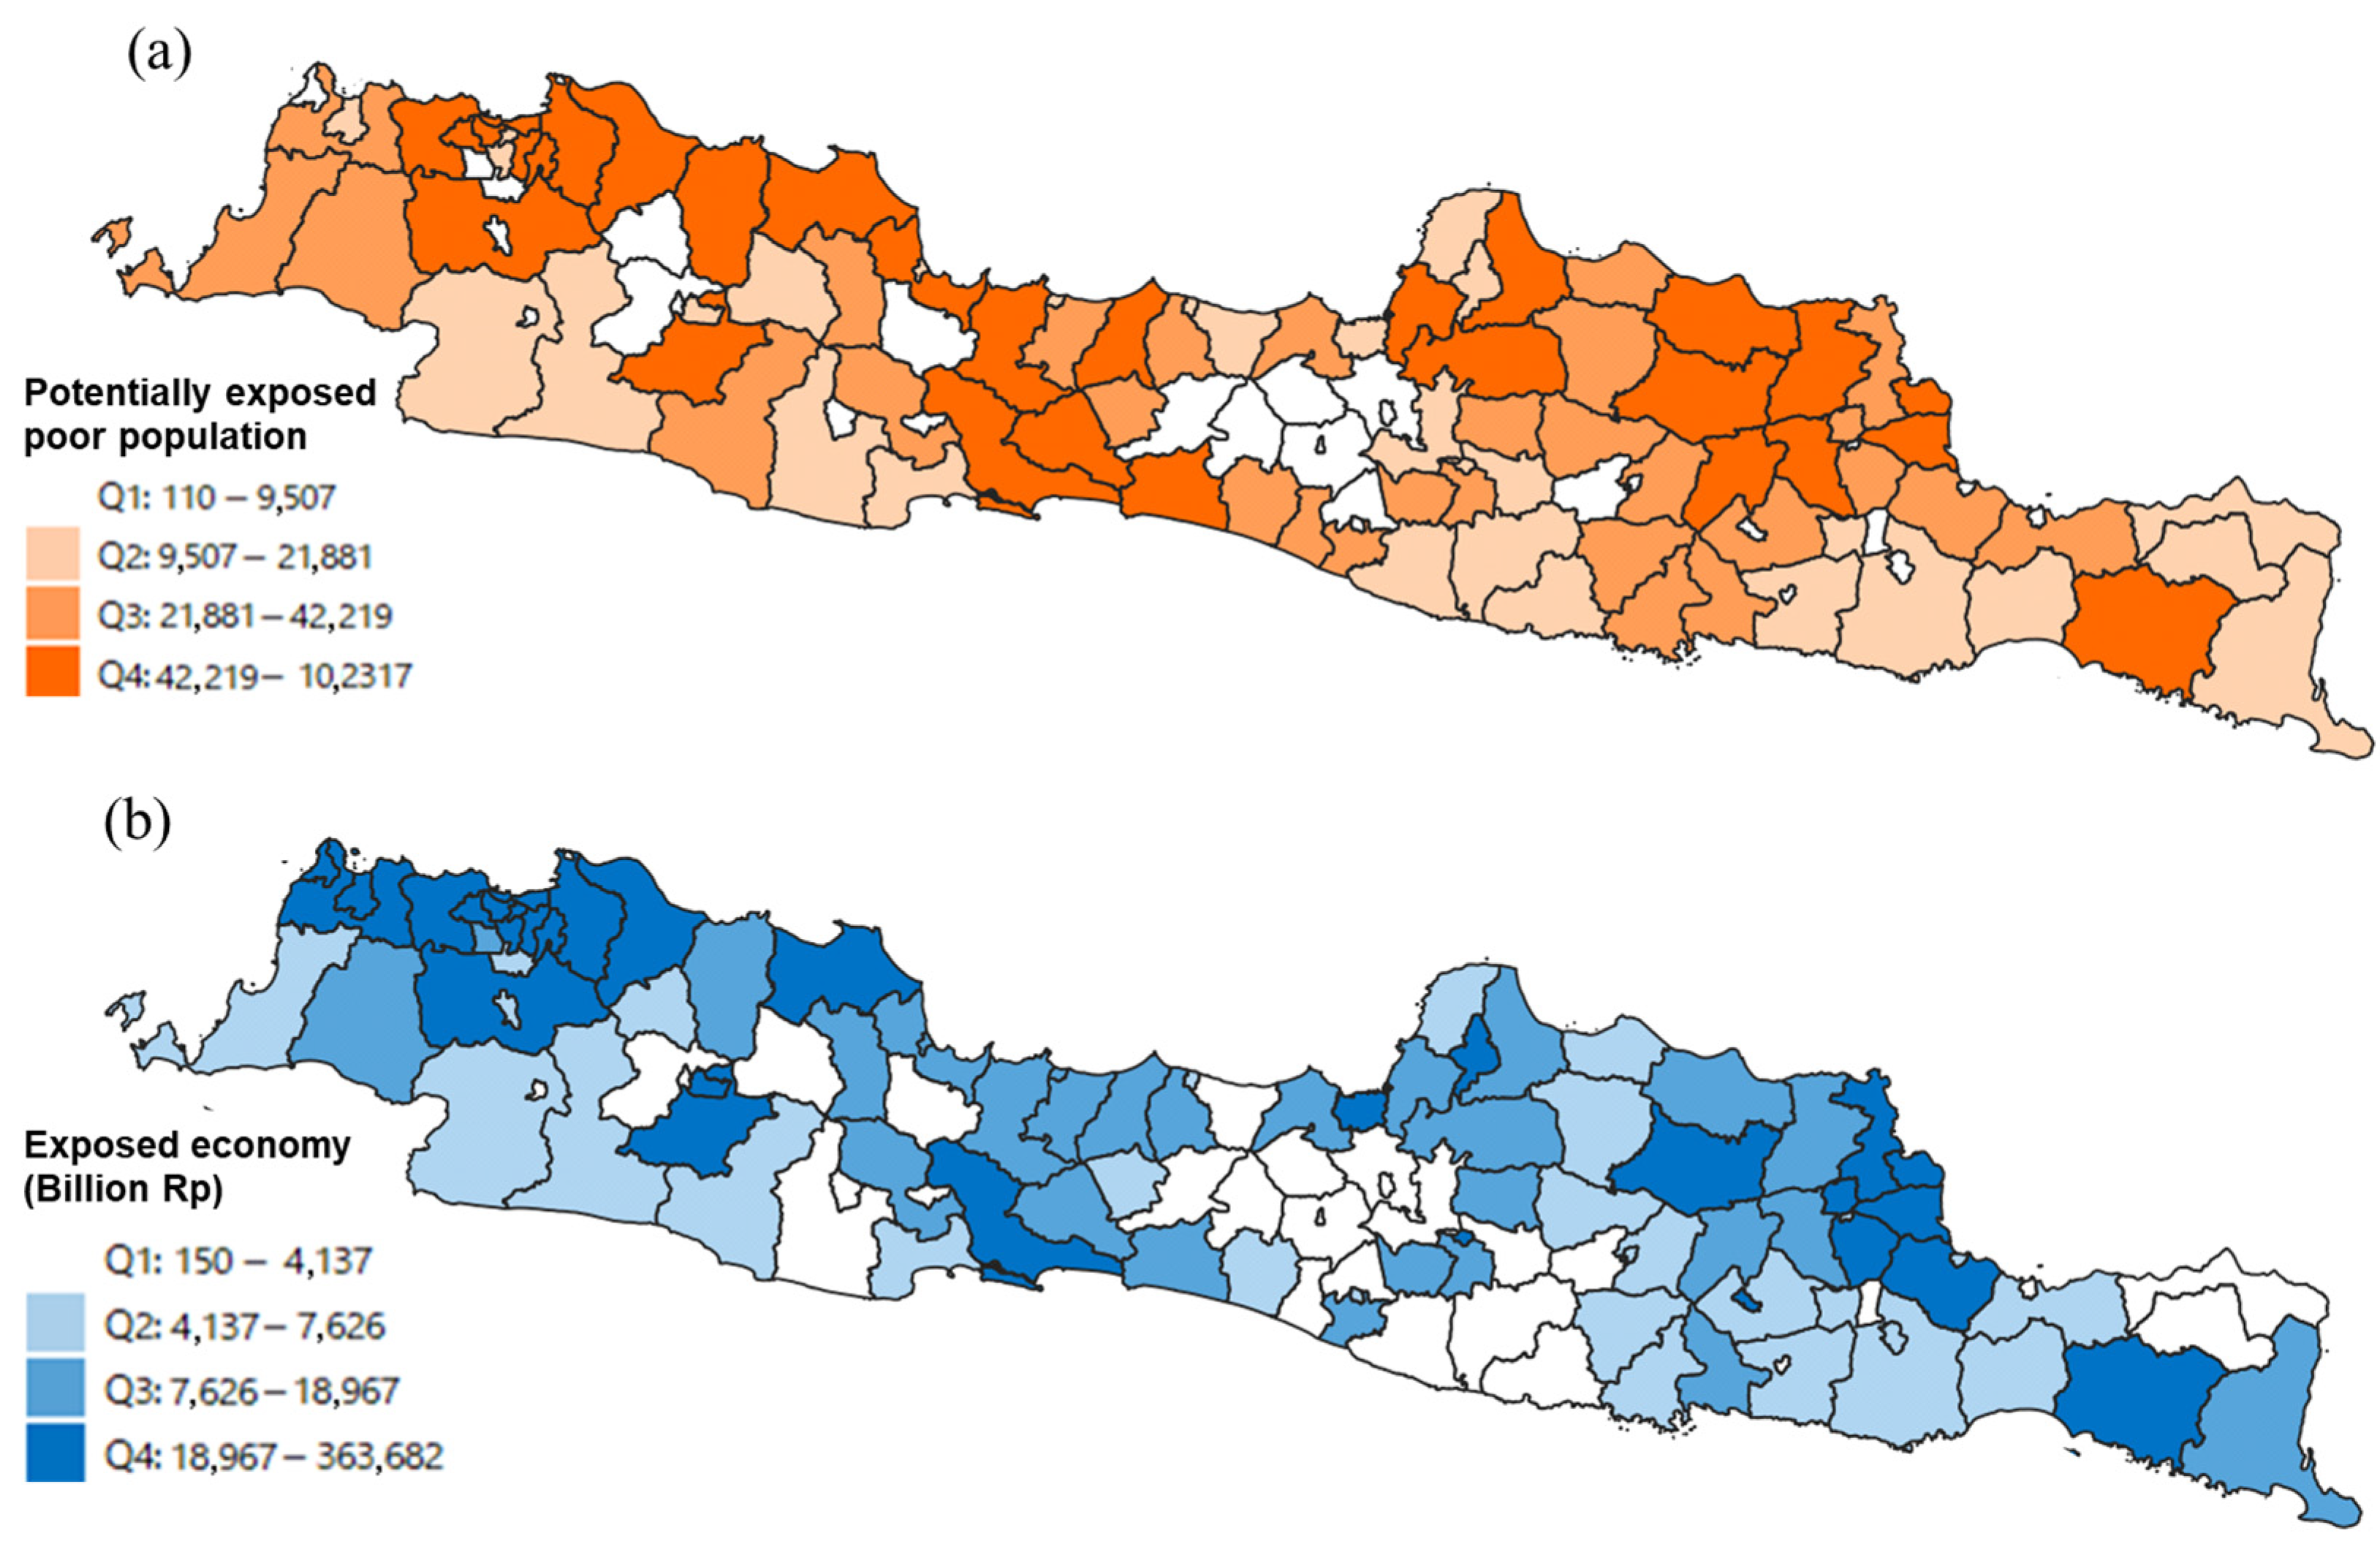
3.3. Comprehensive Analysis Result
3.3.1. Statistically Significant Correlations
3.3.2. Analysis Focused on Cluster Classification with the Land Cover Component
4. Discussion
- Step 1: Identify the poor population and economic size exposed to flood hazards in each administrative district. Utilize socioeconomic data to identify vulnerable communities and economic assets at risk of flood damage.
- Step 2-1: Examine the general direction of DRR measures with reference to land cover types. Tailor DRR strategies for predominant land cover types within each cluster by considering each strategy’s specific advantages and weaknesses.
- Step 2-2: Obtain detailed information on each district or city from the socioeconomic database. Analyze socioeconomic indicators, such as poverty rates, education levels, and economic activities, to identify additional vulnerabilities and prioritize DRR interventions.
- Step 3: Assignment of specific measures at the land use planning level based on the relationship between population distribution and hazard risk. Develop targeted land use planning and zoning regulations that mitigate exposure to flood hazards while promoting sustainable development and community resilience.
5. Conclusions
Author Contributions
Funding
Institutional Review Board Statement
Informed Consent Statement
Data Availability Statement
Acknowledgments
Conflicts of Interest
References
- Hoegh-Guldberg, O.; Jacob, D.; Taylor, M.; Bindi, M.; Brown, S.; Camilloni, I.; Diedhiou, A.; Djalante, R.; Ebi, K.L.; Engelbrecht, F.; et al. Impacts of 1.5 °C Global Warming on Natural and Human Systems. In Global Warming of 1.5 °C. An IPCC Special Report on the Impacts of Global Warming of 1.5 °C above Pre-Industrial Levels and Related Global Greenhouse Gas Emission Pathways, in the Context of Strengthening the Global Response to the Threat of Climate Change, Sustainable Development, and Efforts to Eradicate Poverty; Masson-Delmotte, V., Zhai, P., Pörtner, H.-O., Roberts, D., Skea, J., Shukla, P.R., Pirani, A., Moufouma-Okia, W., Péan, C., Pidcock, R., et al., Eds.; Cambridge University Press: Cambridge, UK; New York, NY, USA, 2018; pp. 175–312. [Google Scholar] [CrossRef]
- Jati, R.; Udrekh; Purba, R.S.; Shalih, O.; Adi, A.W.; Wiguna, S.; Shabrina, F.Z.; Rizqi, A.; Putra, A.S.; Karimah, R.; et al. RBI Risiko Bencana Indonesia “Memahami Risiko Sistemik di Indonesia”; Pusat Data, Informasi, dan Komunikasi Kebencanaan BNPB: Jakarta, Indonesia, 2023; p. 30. ISBN 978-602-5693-29-8. Available online: https://inarisk.bnpb.go.id/BUKU-RBI-2022/mobile/index.html (accessed on 13 June 2024).
- Haryanto, B.; Lestari, F.; Nurlambang, T. Extreme Events, Disasters, and Health Impacts in Indonesia. In Extreme Weather Events and Human Health; Akhtar, R., Ed.; Springer: Cham, Switzerland, 2020; pp. 227–245. [Google Scholar] [CrossRef]
- Cutter, S.L.; Emrich, C.T.; Morath, D.P.; Dunning, C.M. Integrating social vulnerability into federal flood risk management planning. J. Flood Risk Manag. 2012, 6, 332–344. [Google Scholar] [CrossRef]
- Chen, W.; Cutter, S.L.; Emrich, C.T.; Shi, P. Measuring social vulnerability to natural hazards in the Yangtze River Delta region, China. Int. J. Disaster. Risk Sci. 2013, 4, 169–181. [Google Scholar] [CrossRef]
- Koks, E.E.; Jongman, B.; Husby, T.G.; Botzen, W.J.W. Combining hazard, exposure and social vulnerability to provide lessons for flood risk management. Environ. Sci. Policy 2015, 47, 42–52. [Google Scholar] [CrossRef]
- Sigit, A.; Koyama, M.; Harada, M. Flood risk assessment focusing on exposed social characteristics in Central Java, Indonesia. Sustainability 2023, 15, 16856. [Google Scholar] [CrossRef]
- Djalante, R.; Thomalla, F.; Sinapoy, M.S.; Carnegie, M. Building Resilience to natural hazards in Indonesia: Progress and challenges in implementing the Hyogo framework for action. Nat. Hazards 2012, 62, 779–803. [Google Scholar] [CrossRef]
- Wheater, H.; Evans, E. Land use, water management and future flood risk. Land Use Policy 2009, 26, S251–S264. [Google Scholar] [CrossRef]
- Rahayu, R.; Mathias, S.A.; Reaney, S.; Vesuviano, G.; Suwarman, R.; Ramdhan, A.M. Impact of land cover, rainfall and topography on flood risk in West Java. Nat. Hazards 2023, 116, 1735–1758. [Google Scholar] [CrossRef]
- Handayani, W.; Chigbu, U.E.; Rudiarto, I.; Putri, I.H.S. Urbanization and increasing flood risk in the northern coast of Central Java—Indonesia: An assessment towards better land use policy and flood management. Land 2020, 9, 343. [Google Scholar] [CrossRef]
- Winsemius, H.C.; Jongman, B.; Veldkamp, T.I.E.; Hallegatte, S.; Bangalore, M.; Ward, P.J. Disaster risk, climate change, and poverty: Assessing the global exposure of poor people to floods and droughts. Environ. Dev. Econ. 2018, 23, 328–348. [Google Scholar] [CrossRef]
- Severino, R.C.; Thomson, E.; Hong, M. (Eds.) Southeast Asia in a New Era: Ten Countries, One Region in ASEAN; ISEAS Publishing: Singapore, 2010; p. 86. [Google Scholar]
- Maps of Indonesia. Available online: https://www.worldatlas.com/maps/indonesia (accessed on 30 March 2024).
- Ferijal, T.; Batelaan, O.; Shanafield, M. Spatial and temporal variation in rainy season droughts in the Indonesian Maritime continent. J. Hydrol. 2021, 603, 126999. [Google Scholar] [CrossRef]
- Mulyasari, F.; Shaw, R.; Takeuchi, Y. Urban Flood Risk Communication for Cities. In Community, Environment and Disaster Risk Management (Climate and Disaster Resilience in Cities); Shaw, R., Sharma, A., Eds.; Emerald Group Publishing Limited: Leeds, UK, 2011; Volume 6, pp. 225–259. [Google Scholar] [CrossRef]
- The Spatial Distribution of Population in 2020, Indonesia. Available online: https://hub.worldpop.org/geodata/summary?id=49726 (accessed on 30 March 2024).
- Land Cover of Indonesia—Globcover (22 Classes). Available online: https://data.apps.fao.org/catalog/iso/f3f61bb2-78bf-4aba-a5ba-e708183336ec (accessed on 30 March 2024).
- Head of the National Disaster Management Agency (BNPB) of Indonesia. Perka BNPB No.2 of 2012. Available online: https://bnpb.go.id/storage/app/media/uploads/24/peraturan-kepala/2012/perka-2-tahun-2012-tentang-pedoman-umum-pengkajian-resiko-bencana.pdf (accessed on 30 March 2024).
- Gross Regional Domestic Product of Regencies/Municipalities in Indonesia 2018–2022. Available online: https://www.bps.go.id/en/publication/2023/06/14/99ca8a81cd97e69dc04a31bc (accessed on 30 March 2024).
- Merz, B.; Blöschl, G.; Vorogushyn, S.; Dottori, F.; Aerts, J.C.J.H.; Bates, P.; Bertola, M.; Kemter, M.; Kreibich, H.; Lall, U.; et al. Causes, impacts and patterns of disastrous river floods. Nat. Rev. Earth Environ. 2021, 2, 592–609. [Google Scholar] [CrossRef]
- Merz, B.; Kreibich, H.; Schwarze, R.; Thieken, A. Review article “Assessment of economic flood damage”. Nat. Hazards Earth Syst. Sci. 2010, 10, 1697–1724. [Google Scholar] [CrossRef]
- Harig, S.; Immerz, A.; Weniza; Griffin, J.; Weber, B.; Babeyko, A.; Rakowsky, N.; Hartanto, D.; Handayani, T.; Weber, R. The tsunami scenario database of the Indonesia Tsunami Early Warning System (InaTEWS): Evolution of the coverage and the involved modeling approaches. Pure Appl. Geophys. 2020, 177, 1379–1401. [Google Scholar] [CrossRef]
- Habib, A.; Shahidullah, M.; Ahmed, D. The Bangladesh Cyclone Preparedness Program. A Vital Component of the Nation’s Multi-Hazard Early Warning System. In Institutional Partnerships in Multi-Hazard Early Warning Systems; Golnaraghi, M., Ed.; Springer: Berlin/Heidelberg, Germany, 2012. [Google Scholar]
- Van der Wulp, S.A.; Dsikowitzky, L.; Hesse, K.J.; Schwarzbauer, J. Master Plan Jakarta, Indonesia: The Giant Seawall and the need for structural treatment of municipal wastewater. Mar. Pollut. Bull. 2016, 110, 686–693. [Google Scholar] [CrossRef] [PubMed]
- Steenhuis, M. The Deltaworks: Heritage and new space for a changing world. In Water & Heritage—Material, Conceptual and Spiritual Connections; Sidestone Press: Leiden, The Netherlands, 2015; pp. 331–350. ISBN 978-90-8890-278-9. [Google Scholar]
- Tanwattana, P. Systematizing Community-Based Disaster Risk Management (CBDRM): Case of urban flood-prone community in Thailand upstream area. Int. J. Disaster. Risk Reduct. 2018, 28, 798–812. [Google Scholar] [CrossRef]
- Cuya-Antonio, O.C.; Antonio, H.D.P. Effectiveness of the Barangay Disaster Risk Reduction and Management Committees (BDRRMCs) in flood-prone barangays in Cabanatuan City, Philippines. Open Access Libr. J. 2017, 4, 1–16. [Google Scholar] [CrossRef]
- Zoning for Coastal Flood Resiliency: Planning for Resilient Neighborhoods. Available online: https://www.nyc.gov/assets/planning/download/pdf/plans-studies/flood-resiliency-update/zoning-for-flood-resiliency.pdf (accessed on 30 March 2024).
- Evers, M. Integrative river basin management: Challenges and methodologies within the German planning system. Environ. Earth Sci. 2016, 75, 1085. [Google Scholar] [CrossRef]
- FONDEN: Mexico’s Natural Disaster Fund—A Review. Available online: https://documents1.worldbank.org/curated/en/408711468286527149/pdf/753220WP0P130800Box374323B00PUBLIC0.pdf (accessed on 30 March 2024).
- Gurenko, E.; Lester, R.; Mahul, O.; Gonulal, S.O. Earthquake Insurance in Turkey: History of the Turkish Catastrophe Insurance Pool; World Bank: Washington, DC, USA, 2006; ISBN 0-8213-6583-5. [Google Scholar]
- Tinh, P.H.; MacKenzie, R.A.; Hung, T.D.; Vinh, T.V.; Ha, H.T.; Lam, M.H.; Hanh, N.T.H.; Tung, N.X.; Hai, P.M.; Huyen, B.T. Mangrove restoration in Vietnamese Mekong Delta during 2015–2020: Achievements and challenges. Front. Mar. Sci. 2022, 9, 1043943. [Google Scholar] [CrossRef]
- Porras, I.; Chacón-Cascante, A. Costa Rica’s Payments for Ecosystem Services Programme; International Institute for Environment and Development: London, UK, 2018; Available online: https://www.jstor.org/stable/resrep16747 (accessed on 13 June 2024).


| Group | Name | Data Type | Target Year |
|---|---|---|---|
| Hazardous area data | inaRISK floodhazard vulnerability (layer_bahaya_banjir_bandang) 1 | Raster dataset, resolution: 3 arc-second | - |
| Population data | Indonesia 100 m population 2 | Raster dataset, resolution: 3 arc-second | 2020 |
| Land cover | Land cover of Indonesia—GlobCover (22 classes) 3 | Polygon dataset, resolution: 300 m | 2005 |
| Socioeconomic data | Total population Percentage of population by age group (0–14, 15–64, 65–) Population of poor people 4 | Text data Read and input the numbers in the table shown in the PDF of statistical reports published for each administrative division. | 2021 |
| Expenditures per month in B40, M40, and T20 categories 5 Percentage of population aged 15 and over per educational rank 6 | |||
| Percentage of population aged 15 and over per educational rank in B40, M40, and T20 categories | Excel download data from website | 2020 | |
| Gross Regional Domestic Product (administrative district per person) | Excel download data from website | 2020 |
| Number_Variable Name | Mean | S.D. | Description (Unit, Definition) | Official Data | Analysis Result |
|---|---|---|---|---|---|
| X01_Pop_fix | 1,294,377 | 855,313 | Total population by administrative district based on statistical data (people) | Yes | |
| X02_Age0–14 | 22.1 | 2.4 | Percentage of population under 14 years old (%) | Yes | |
| X03_Age15–64 | 69.3 | 2.2 | Percentage of population from 15 to 64 years old (%) | Yes | |
| X04_Age65– | 8.6 | 2.8 | Percentage of population over 65 years old (%) | Yes | |
| X05_Pop_15- | 998,405 | 635,750 | Population over 15 years old (people) | Yes | |
| X06_Poor_Pop | 116,628 | 74,635 | Population of poor people (people) | Yes | |
| X07_Poor_ratio | 9.3 | 3.4 | Poor population ratio (%, X07 = X06/X01) | ||
| X08_Pop_sum | 1,332,225 | 1,016,048 | Total population from flood exposure analysis | Yes | |
| X09_Pep_sum | 359,683 | 386,969 | Potentially exposed population (Pep) from flood exposure analysis | Yes | |
| X10_expose_ratio | 26.5 | 16.0 | Exposure ratio for flood hazard (%, X10 = X09/X08) | Yes | |
| X11_Pop_Ed_NoSch | 134,010 | 101,533 | Population aged 15 and over without an elementary school graduation certificate (people) | ||
| X12_Pop_Ed_El_Sch | 271,562 | 202,275 | Population aged 15 and over with elementary school graduation (people) | ||
| X13_Pop_Ed_JH_Sch | 226,010 | 149,897 | Population aged 15 and over with junior high school graduation (people) | ||
| X14_Pop_Ed_SH_Sch | 369,061 | 309,812 | Population aged 15 and over with high school graduation and above (people) | ||
| X15_Pop_B40_NoSch | 68,417 | 49,745 | Population aged 15 and over without an elementary school graduation certificate (people), B40 class | ||
| X16_Pop_B40_El_Sch | 125,381 | 94,096 | Population aged 15 and over with elementary school graduation (people), B40 class | ||
| X17_Pop_B40_JH_Sch | 97,602 | 69,240 | Population aged 15 and over with junior high school graduation (people), B40 class | ||
| X18_Pop_B40_SH_Sch | 108,857 | 92,817 | Population aged and 15 over with high school graduation and above (people), B40 class | ||
| X19_Pop_M40_NoSch | 50,416 | 39,843 | Population aged 15 and over without an elementary school graduation certificate(people), M40 class | ||
| X20_Pop_M40_El_Sch | 110,221 | 83,378 | Population aged 15 and over with elementary school graduation (people), M40 class | ||
| X21_Pop_M40_JH_Sch | 91,572 | 59,572 | Population aged 15 and over with junior high school graduation (people), M40 class | ||
| X22_Pop_M40_SH_Sch | 148,048 | 129,989 | Population aged and 15 over with high school graduation and above (people), M40 class | ||
| X23_Pop_T20_NoSch | 16,337 | 14,242 | Population aged and 15 over without an elementary school graduation certificate (people), T20 class | ||
| X24_Pop_T20_El_Sch | 37,471 | 29,468 | Population aged 15 and over with elementary school graduation (people), T20 class | ||
| X25_Pop_T20_JH_Sch | 37,665 | 25,074 | Population aged 15 and over with junior high school graduation (people), T20 class | ||
| X26_Pop_T20_SH_Sch | 108,655 | 86,766 | Population aged and 15 over with high school graduation and above (people), T20 class | ||
| X30_B40_Cost_Rp | 589,141 | 169,366 | Expenditures per household member in class B40 per month (Rp) | Yes | |
| X31_M40_Cost_Rp | 1,162,257 | 402,502 | Expenditures per household member in class M40 per month (Rp) | Yes | |
| X32_T20_Cost_Rp | 2,810,395 | 1,192,257 | Expenditures per household member in class T20 per month (Rp) | Yes | |
| X33_Total.Annual.Expenditure_BRp | 19,647 | 16,957 | Total annual expenditure of the total population (billion Rp) | ||
| X34_GRDP_BRp | 81,311 | 126,834 | Gross Regional Domestic Product (BRp) | Yes | |
| X35_Income_per_person_TRp | 60,893 | 84,374 | GRDP divided by population (TRp) | Yes | |
| X36_Income_Expenditure_Ratio | 3.9 | 5.5 | Ratio of total income to total expenses (X36 = X34/X33) | ||
| X40_Ed_NoSch | 13.3 | 7.1 | Percentage of the population aged 15 and over without an elementary school graduation certificate (%) | Yes | |
| X41_Ed_El_Sch | 26.1 | 9.7 | Percentage of the population aged 15 and over with elementary school graduation (%) | Yes | |
| X42_Ed_JH_Sch | 22.2 | 2.6 | Percentage of the population aged and 15 over with junior high school graduation (%) | Yes | |
| X43_Ed_SH_Sch | 38.3 | 15.4 | Percentage of the population aged 15 and over with high school graduation and above (%) | Yes | |
| X44_B40_NoSch | 17.3 | 8.4 | Percentage of the population aged 15 and over without an elementary school graduation certificate (%), B40 class | Yes | |
| X45_B40_El_Sch | 30.1 | 9.3 | Percentage of the population aged 15 and over with elementary school graduation (%), B40 class | Yes | |
| X46_B40_JH_Sch | 24.0 | 3.1 | Percentage of the population aged 15 and over with junior high school graduation (%), B40 class | Yes | |
| X47_B40_SH_Sch | 28.6 | 13.3 | Percentage of the population aged 15 and over with high school graduation and above (%), B40 class | Yes | |
| X48_M40_NoSch | 12.4 | 7.0 | Percentage of the population aged 15 and over without an elementary school graduation certificate (%), M40 class | Yes | |
| X49_M40_El_Sch | 26.4 | 10.7 | Percentage of the population aged 15 and over with elementary school graduation (%), M40 class | Yes | |
| X50_M40_JH_Sch | 22.6 | 3.2 | Percentage of the population aged 15 and over with junior high school graduation (%), M40 class | Yes | |
| X51_M40_SH_Sch | 38.6 | 17.0 | Percentage of the population aged 15 and over with high school graduation and above (%), M40 class | Yes | |
| X52_T20_NoSch | 8.0 | 5.5 | Percentage of the population aged 15 and over without an elementary school graduation certificate (%), T20 class | Yes | |
| X53_T20_El_Sch | 18.2 | 9.5 | Percentage of the population aged 15 and over with elementary school graduation (%), T20 class | Yes | |
| X54_T20_JH_Sch | 18.4 | 4.7 | Percentage of the population aged and 15 over with junior high school graduation (%), T20 class | Yes | |
| X55_T20_SH_Sch | 55.4 | 17.3 | Percentage of the population aged 15 and over with high school graduation and above (%), T20 class | Yes | |
| X60_Pepp | 30,114 | 25,998 | Potentially exposed poor population (people, X60 = X06 × X10) | Yes | |
| X61_Eexp_BRp | 27,374 | 58,742 | Exposed economy (BRp, X61 = X34 × X10) | Yes |
| Strategy | Advantage | Weakness |
|---|---|---|
| Early Warning Systems | Timely alerts, Potential for reducing casualties. | Dependence on infrastructure, False alarms. |
| Infrastructure Development | Enhanced resilience, Protection of assets. | High cost, Environmental impact. |
| Community Engagement and Preparedness | Empowering communities, Local knowledge. | Variable community response, Resource constraints. |
| Land Use Planning and Zoning | Mitigation of exposure, Sustainable development. | Implementation challenges, Resistance. |
| Insurance and Risk Transfer Mechanisms | Financial protection, Incentive for risk reduction. | Limited coverage, Affordability. |
| Ecosystem-Based Approaches | Natural flood defenses, Ecological benefits. | Time-intensive, Potential conflicts. |
| Strategy | Consideration | Cluster |
|---|---|---|
| Early Warning Systems | Early warning systems offer timely alerts and the potential to reduce casualties, making them valuable tools for disaster preparedness. However, their effectiveness is contingent upon robust infrastructure and the risk of false alarms. In urban areas, where populations are densely concentrated and infrastructure is relatively well developed, early warning systems can play a pivotal role in minimizing flood impacts. In rural areas, it is expected that the response will take the form of indigenous local knowledge (ILK) rather than modern early warning systems. | Cluster 4 |
| Infrastructure Development | Infrastructure development, such as flood barriers and drainage systems, can enhance resilience and protect assets against flood hazards. In urban areas, there are many assets exposed to flooding, so it is worthwhile to invest in preventing this. Nevertheless, the high cost and environmental impact associated with large-scale infrastructure projects pose significant challenges. In agricultural areas, where populations are distributed across mosaic croplands and rainfed croplands, targeted infrastructure investments can bolster flood resilience while supporting livelihoods. | Clusters 1, 2, 3, and 4 |
| Community Engagement and Preparedness | Engaging communities in disaster preparedness initiatives empowers residents and leverages their invaluable knowledge of the terrain. However, community responses may vary, and resource constraints can impede effective implementation. In rural areas, where populations rely heavily on agriculture and have limited access to formal resources, community-based approaches can foster resilience and facilitate rapid response during flood events. | Clusters 1, 2, and 3 |
| Land Use Planning and Zoning | The rainfed croplands and urban areas tend to have higher exposure rates to flooding. Land use planning and zoning measures, including floodplain regulations and green infrastructure implementation, can mitigate exposure to flood hazards while promoting sustainable development in floodplains and urban areas. Nevertheless, implementation challenges and resistance from stakeholders may hinder effective land use planning efforts. In forested areas and urban fringes, where ecosystems play a crucial role in flood regulation, integrated land use planning strategies can balance conservation with development needs. | Clusters 3 and 4 |
| Insurance and Risk Transfer Mechanisms | Insurance and risk transfer mechanisms provide financial protection against flood-related losses and incentivize risk reduction practices. However, limited coverage and affordability issues may constrain their effectiveness, particularly in rural and low-income areas. In economically vibrant urban centers, where financial resources are relatively abundant, insurance schemes can serve as an additional layer of protection for businesses and homeowners. | Cluster 4 |
| Ecosystem-Based Approaches | Ecosystem-based approaches harness the natural flood mitigation capacities of ecosystems, such as wetlands and mangroves, to reduce flood risk and enhance ecological resilience. Nevertheless, these approaches require time-intensive planning and may encounter conflicts with existing land uses. In rural and forested areas, where ecosystems provide critical ecosystem services, ecosystem-based approaches can complement traditional DRR measures and safeguard biodiversity. | Clusters 1, 2, and 3 |
| Strategy | Practical Steps | Examples and Case Studies |
|---|---|---|
| Early Warning Systems | Assessment and Planning: Conduct a comprehensive risk assessment to identify flood-prone areas and establish a baseline of current early warning capabilities. | |
| Technology Deployment: Install advanced weather monitoring and forecasting systems, such as radar and satellite-based technologies. | ||
| Communication Networks: Develop robust communication networks to disseminate alerts quickly to the affected population. | ||
| Community Training: Train local communities and authorities on how to respond to warnings and conduct regular drills. | ||
| Infrastructure Development | Site Selection: Identify high-risk flood zones using topographical and hydrological data. | |
| Design and Construction: Design flood barriers, levees, and drainage systems tailored to local conditions. Ensure designs are resilient to extreme weather events. | ||
| Environmental Impact Assessment: Conduct thorough environmental assessments to minimize negative impacts on ecosystems. | ||
| Maintenance Plans: Establish long-term maintenance plans to ensure the infrastructure remains effective. | ||
| Community Engagement and Preparedness | Community Mapping: Engage communities in mapping flood-prone areas and identifying vulnerabilities. | |
| Educational Programs: Develop and implement educational programs on flood risks and preparedness measures. | ||
| Local DRR Committees: Establish local disaster risk reduction (DRR) committees to coordinate community efforts. | ||
| Resource Mobilization: Facilitate access to resources and support for community-driven projects. | ||
| Land Use Planning and Zoning | Floodplain Mapping: Develop detailed floodplain maps to guide land use planning. | |
| Zoning Regulations: Implement zoning regulations that restrict development in high-risk areas and promote green infrastructure. | ||
| Public Participation: Engage stakeholders in planning processes to ensure compliance and address concerns. | ||
| Incentive Programs: Create incentives for developers to incorporate flood-resistant designs and practices. | ||
| Insurance and Risk Transfer Mechanisms | Risk Assessment: Conduct detailed assessments to determine flood risk levels and appropriate insurance premiums. | |
| Product Development: Develop affordable insurance products tailored to different socioeconomic groups. | ||
| Awareness Campaigns: Raise awareness about the benefits of insurance and how to access it. | ||
| Public-Private Partnerships: Encourage collaboration between governments, insurance companies, and communities to expand coverage. | ||
| Ecosystem-Based Approaches | Ecosystem Restoration: Restore and protect natural floodplains, wetlands, and mangroves to enhance their flood mitigation capacities. | |
| Sustainable Land Management: Promote agricultural and forestry practices that support ecosystem health and resilience. | ||
| Integrated Planning: Incorporate ecosystem-based approaches into broader land use and development plans. | ||
| Community Involvement: Engage local communities in ecosystem management and conservation efforts. |
Disclaimer/Publisher’s Note: The statements, opinions and data contained in all publications are solely those of the individual author(s) and contributor(s) and not of MDPI and/or the editor(s). MDPI and/or the editor(s) disclaim responsibility for any injury to people or property resulting from any ideas, methods, instructions or products referred to in the content. |
© 2024 by the authors. Licensee MDPI, Basel, Switzerland. This article is an open access article distributed under the terms and conditions of the Creative Commons Attribution (CC BY) license (https://creativecommons.org/licenses/by/4.0/).
Share and Cite
Sigit, A.; Harada, M. Land Cover and Socioeconomic Analysis for Recommended Flood Risk Reduction Strategies in Java Island, Indonesia. Sustainability 2024, 16, 6475. https://doi.org/10.3390/su16156475
Sigit A, Harada M. Land Cover and Socioeconomic Analysis for Recommended Flood Risk Reduction Strategies in Java Island, Indonesia. Sustainability. 2024; 16(15):6475. https://doi.org/10.3390/su16156475
Chicago/Turabian StyleSigit, Adityawan, and Morihiro Harada. 2024. "Land Cover and Socioeconomic Analysis for Recommended Flood Risk Reduction Strategies in Java Island, Indonesia" Sustainability 16, no. 15: 6475. https://doi.org/10.3390/su16156475