Abstract
As global warming intensifies and the frequency of extreme weather events rises, posing a major threat to the world’s economy and sustainable development, accurate forecasting of future extreme events is of great significance to mankind’s response to extreme weather events and to the sustainable development of society. Global Climate Models (GCMs) have limitations in their applicability at regional scales due to their coarse resolution. Utilizing dynamical downscaling methods based on regional climate models (RCMs) is an essential approach to obtaining high-resolution climate simulation information in future. This study represents an attempt to extend the use of the Providing REgional Climates for Impacts Studies (PRECIS) regional climate model by employing the BCC-CSM2-MR model from the Beijing Climate Center to drive it, conducting downscaling experiments over China at a spatial resolution of 0.22° (25 km). The simulation and prediction of daily maximum and minimum temperatures across the China region are conducted, marking a significant effort to expand the usage of PRECIS with data from alternative GCMs. The results indicate that PRECIS performs well in simulating the daily maximum and minimum temperatures over the China region, accurately capturing their spatial distribution and demonstrating notable simulation capabilities for both cold and warm regions. In the annual cycle, the simulation performance of PRECIS is superior to its driving GCM, particularly during cold months (i.e., December and from January to May). Regarding future changes, the daily extreme temperatures in most regions are projected to increase gradually over time. In the early 21st century, the warming magnitude is approximately 1.5 °C, reaching around 3 °C by the end of the century, with even higher warming magnitudes exceeding 4.5 °C under the SSP585 scenario. Northern regions will experience greater warming magnitudes than southern regions, suggesting faster increases in extreme temperatures in higher latitudes. This paper provides forecasts of extreme temperatures in China, which will be useful for studying extreme events and for the government to make decisions in response to extreme events.
1. Introduction
The intensification of climate global warming has emerged as one of the foremost threats to human society in the 21st century [1]. Unlike the climate-mean state, extreme events present heightened risks to economies, communities, and ecosystems [2,3]. The incidence of extreme weather events is on the rise, particularly concerning the escalating occurrences of extreme heat and cold globally, posing significant challenges to the world’s economic and social development [4,5]. For instance, during the 2024 Chinese Spring Festival travel season, the central and eastern regions of China experienced the most potent winter precipitation since 2009. Freezing rain was recorded in 32 counties and districts in Hubei Province, an occurrence rarely seen in the past 15 years, affecting a total of 1.518 million people [6]. Furthermore, on 22 June 2023, the entire Beijing-Tianjin-Hebei region of China was gripped by scorching temperatures. Dagang in Tianjin and Tanghekou in Beijing weather stations both reached 41.8 °C, shattering historical temperature records [7].
Global Climate Models (GCMs) are indispensable tools for studying current climate characteristics and phenomena, understanding past climate evolution patterns, and predicting future climate changes. Scientists from various countries use different global climate system models to conduct simulation and prediction experiments, particularly focusing on large-scale climate simulations. However, due to the relatively low spatial resolution of GCMs (typically above 100 km), their results often struggle to reflect regional climate distribution characteristics and high-frequency climate variability. Therefore, enhancing the output resolution of model results through certain downscaling techniques can effectively address the aforementioned issues.
The dynamical downscaling method based on Regional Climate Models (RCMs) is an important approach to obtain future high-resolution climate simulation information. This method primarily involves nesting regional climate models within global models to predict regional future climate change scenarios. Currently, widely used RCMs include models such as Weather Research and Forecasting (WRF), Regional Climate Mode (RegCM), and PRECIS [8,9]. These RCMs, to some extent, can effectively simulate the geographical distribution and seasonal variation characteristics of temperature and precipitation at the regional scale. Among them, PRECIS, developed by the Hadley Meteorological Center in the UK, is one of the most popular regional climate models in the world. For example, R. Rajbhandari et al. [10] utilized PRECIS to study future climate change in the Indus River Basin under the IPCC SRES A1B scenario and conducted impact assessments. Mehdi Torabi et al. [11] employed PRECIS for spatial downscaling to assess changes in the intensity-duration-frequency curves of floods under future climate change impacts, providing a basis for urban flood management. Wang et al. [12] filled the gap in high-resolution regional climate change research in eastern Canada for the 21st century under three emission scenarios, RCP2.6, RCP4.5, and RCP8.5, using the PRECIS regional climate model. Li et al. [13] used meteorological data generated by the PRECIS regional climate model under RCP4.5 and RCP8.5 scenarios to assess the impact of future climate change on soybean yield in Northeast China. Using the PRECIS regional climate model projections of daily maximum and minimum temperatures and precipitation to drive the Variable Infiltration Capacity (VIC) hydrological model, Lu et al. [14] examined changes in mean monthly and annual runoff and the occurrence of extreme events including floods and droughts across the region over the next two periods (2001–2030 and 2016–2045). Zhang et al. [15] used the PRECIS dynamic downscaling model to predict the high-humidity regions in China under two scenarios of RCP4.5 and RCP8.5 at a resolution of 25 km. Using the PRECIS regional climate model, Zhang et al. [16] used 20 Global Climate Models and PRECIS to assess their ability to reproduce average trends in mean temperature, maximum temperature, minimum temperature, diurnal temperature difference, and average trends in extreme events represented by Frost Days and Heat Wave Days.
Although the PRECIS regional climate model has been widely used worldwide, previous studies have predominantly relied on the Hadley Centre’s GCM as a driver, with very few utilizing other GCMs to drive the PRECIS model. Undoubtedly, this has greatly limited the exploratory applications of the PRECIS model. Therefore, in this study, we employ the BCC-CSM2-MR model from the Beijing Climate Center to drive the PRECIS model for simulating extreme temperatures (i.e., daily maximum and minimum temperatures) in China. This includes historical simulations from 1979 to 2004 and future projections for the periods 2021–2050 (2030s) and 2070–2099 (2080s) under SSP245 and SSP585 scenarios. The output provides high spatial resolution (0.22°) extreme temperature data.
2. Data and Methods
2.1. PRECIS Regional Climate Model
As one of the most widely used regional climate simulation and prediction tools globally, the PRECIS regional climate model was developed by the Hadley Centre of the UK Met Office. Due to its highly encapsulated and integrated visualization model system, it possesses strong usability, practicality, and interactivity. The model offers two grid types with different spatial resolutions: 25 km (0.22°) and 50 km (0.44°). Unlike other regional climate models, PRECIS incorporates important physical processes such as dynamic flow, atmospheric sulfur cycling, cloud and precipitation, radiation processes, and surface schemes [17,18]. Its driving data are sourced from the climate model family of Met Office Hadley Centre in the UK. Although operationally convenient, PRECIS is limited in its application to some extent due to the inability to utilize GCMs from other institutions, attributed to differences in file formats.
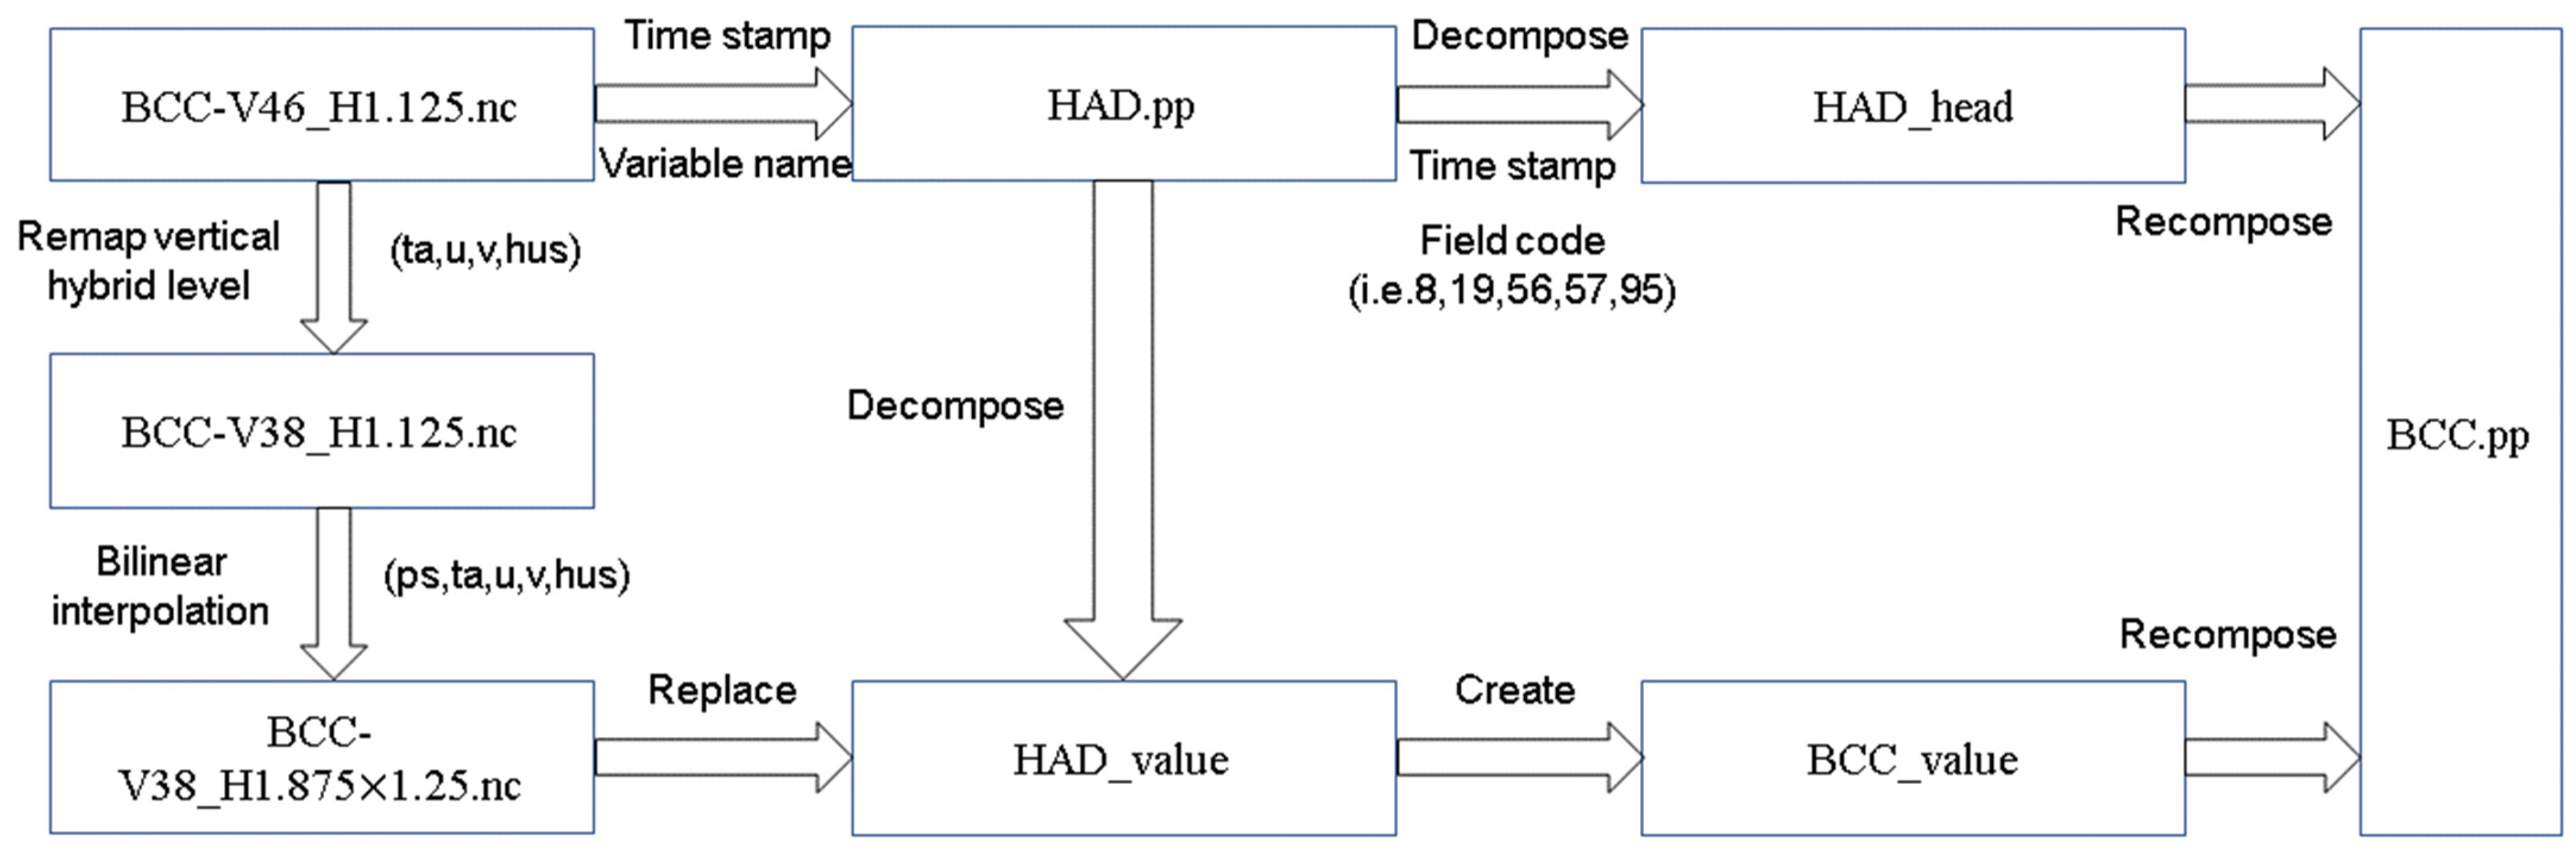
The default PRECIS input and output format is the “PP” format based on the Met Office in the UK. It is organized according to specific data structures and stored in binary format. However, the commonly used meteorological format is NetCDF (network Common Data Form), which has the advantages of self-descriptiveness and machine-independent representation of scientific data, thus enjoying widespread use [19,20]. In this study, we attempt to generate initial and boundary fields from the results of the BCC-CSM2-MR model derived from the Beijing Climate Center to drive the PRECIS model for dynamical downscaling regional climate simulation experiments in China region. The first step involves converting the data format of BCC-CSM2-MR into the “PP” format (based on the HadGEM2-ES). The converted driving elements mainly include temperature, radial wind, meridional wind, and specific humidity at different pressure levels, along with a surface pressure indicator. Additionally, the coordinate system and spatiotemporal resolution of BCC-CSM2-MR need to be converted to match the format required by PRECIS, as follows:
The process of converting NetCDF format to “PP” format is illustrated in Figure 1. To begin with, the variables (i.e., hus, ta, u, v, and ps) of BCC-CSM2-MR are interpolated vertically and horizontally to match the spatial resolution of HadGEM2-ES. Secondly, the “PP” format file of HadGEM2-ES containing the same variables is split into header and numerical modules. Finally, the numerical module of BCC-CSM2-MR after interpolation is used to replace the numerical module of HadGEM2-ES and combined with the header module of HadGEM2-ES to reassemble a new “PP” format file.
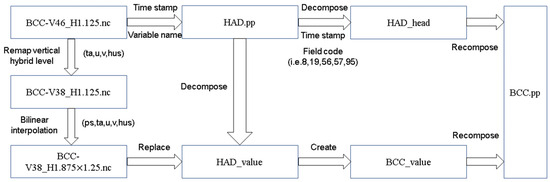
Figure 1.
Conversion from NetCDF to “pp” format.
2.2. Data
This study utilizes the CN05.1 dataset (hereinafter referred to as CN05) of maximum and minimum temperatures from 1979 to 2004 to verify the result of PRECIS downscaling BCC-CSM2-MR. CN05, developed by the National Climate Center of the China Meteorological Administration, is an observational dataset with a spatial resolution of 0.25° × 0.25°. It is interpolated from data collected at approximately 2000 national observation stations since 1961. This dataset is widely used for climate simulation validation in China [21,22,23]. Similarly, BCC-CSM2-MR was also developed by the National Climate Center of the China Meteorological Administration, and its land surface component is BCC-AVIM2, the atmospheric model component is BCC-AGCM3-MR, horizontal spatial resolution is T106 (~110 km), vertical stratification reaches 46 layers, and the top layer of the model is 1.459 hPa [24].
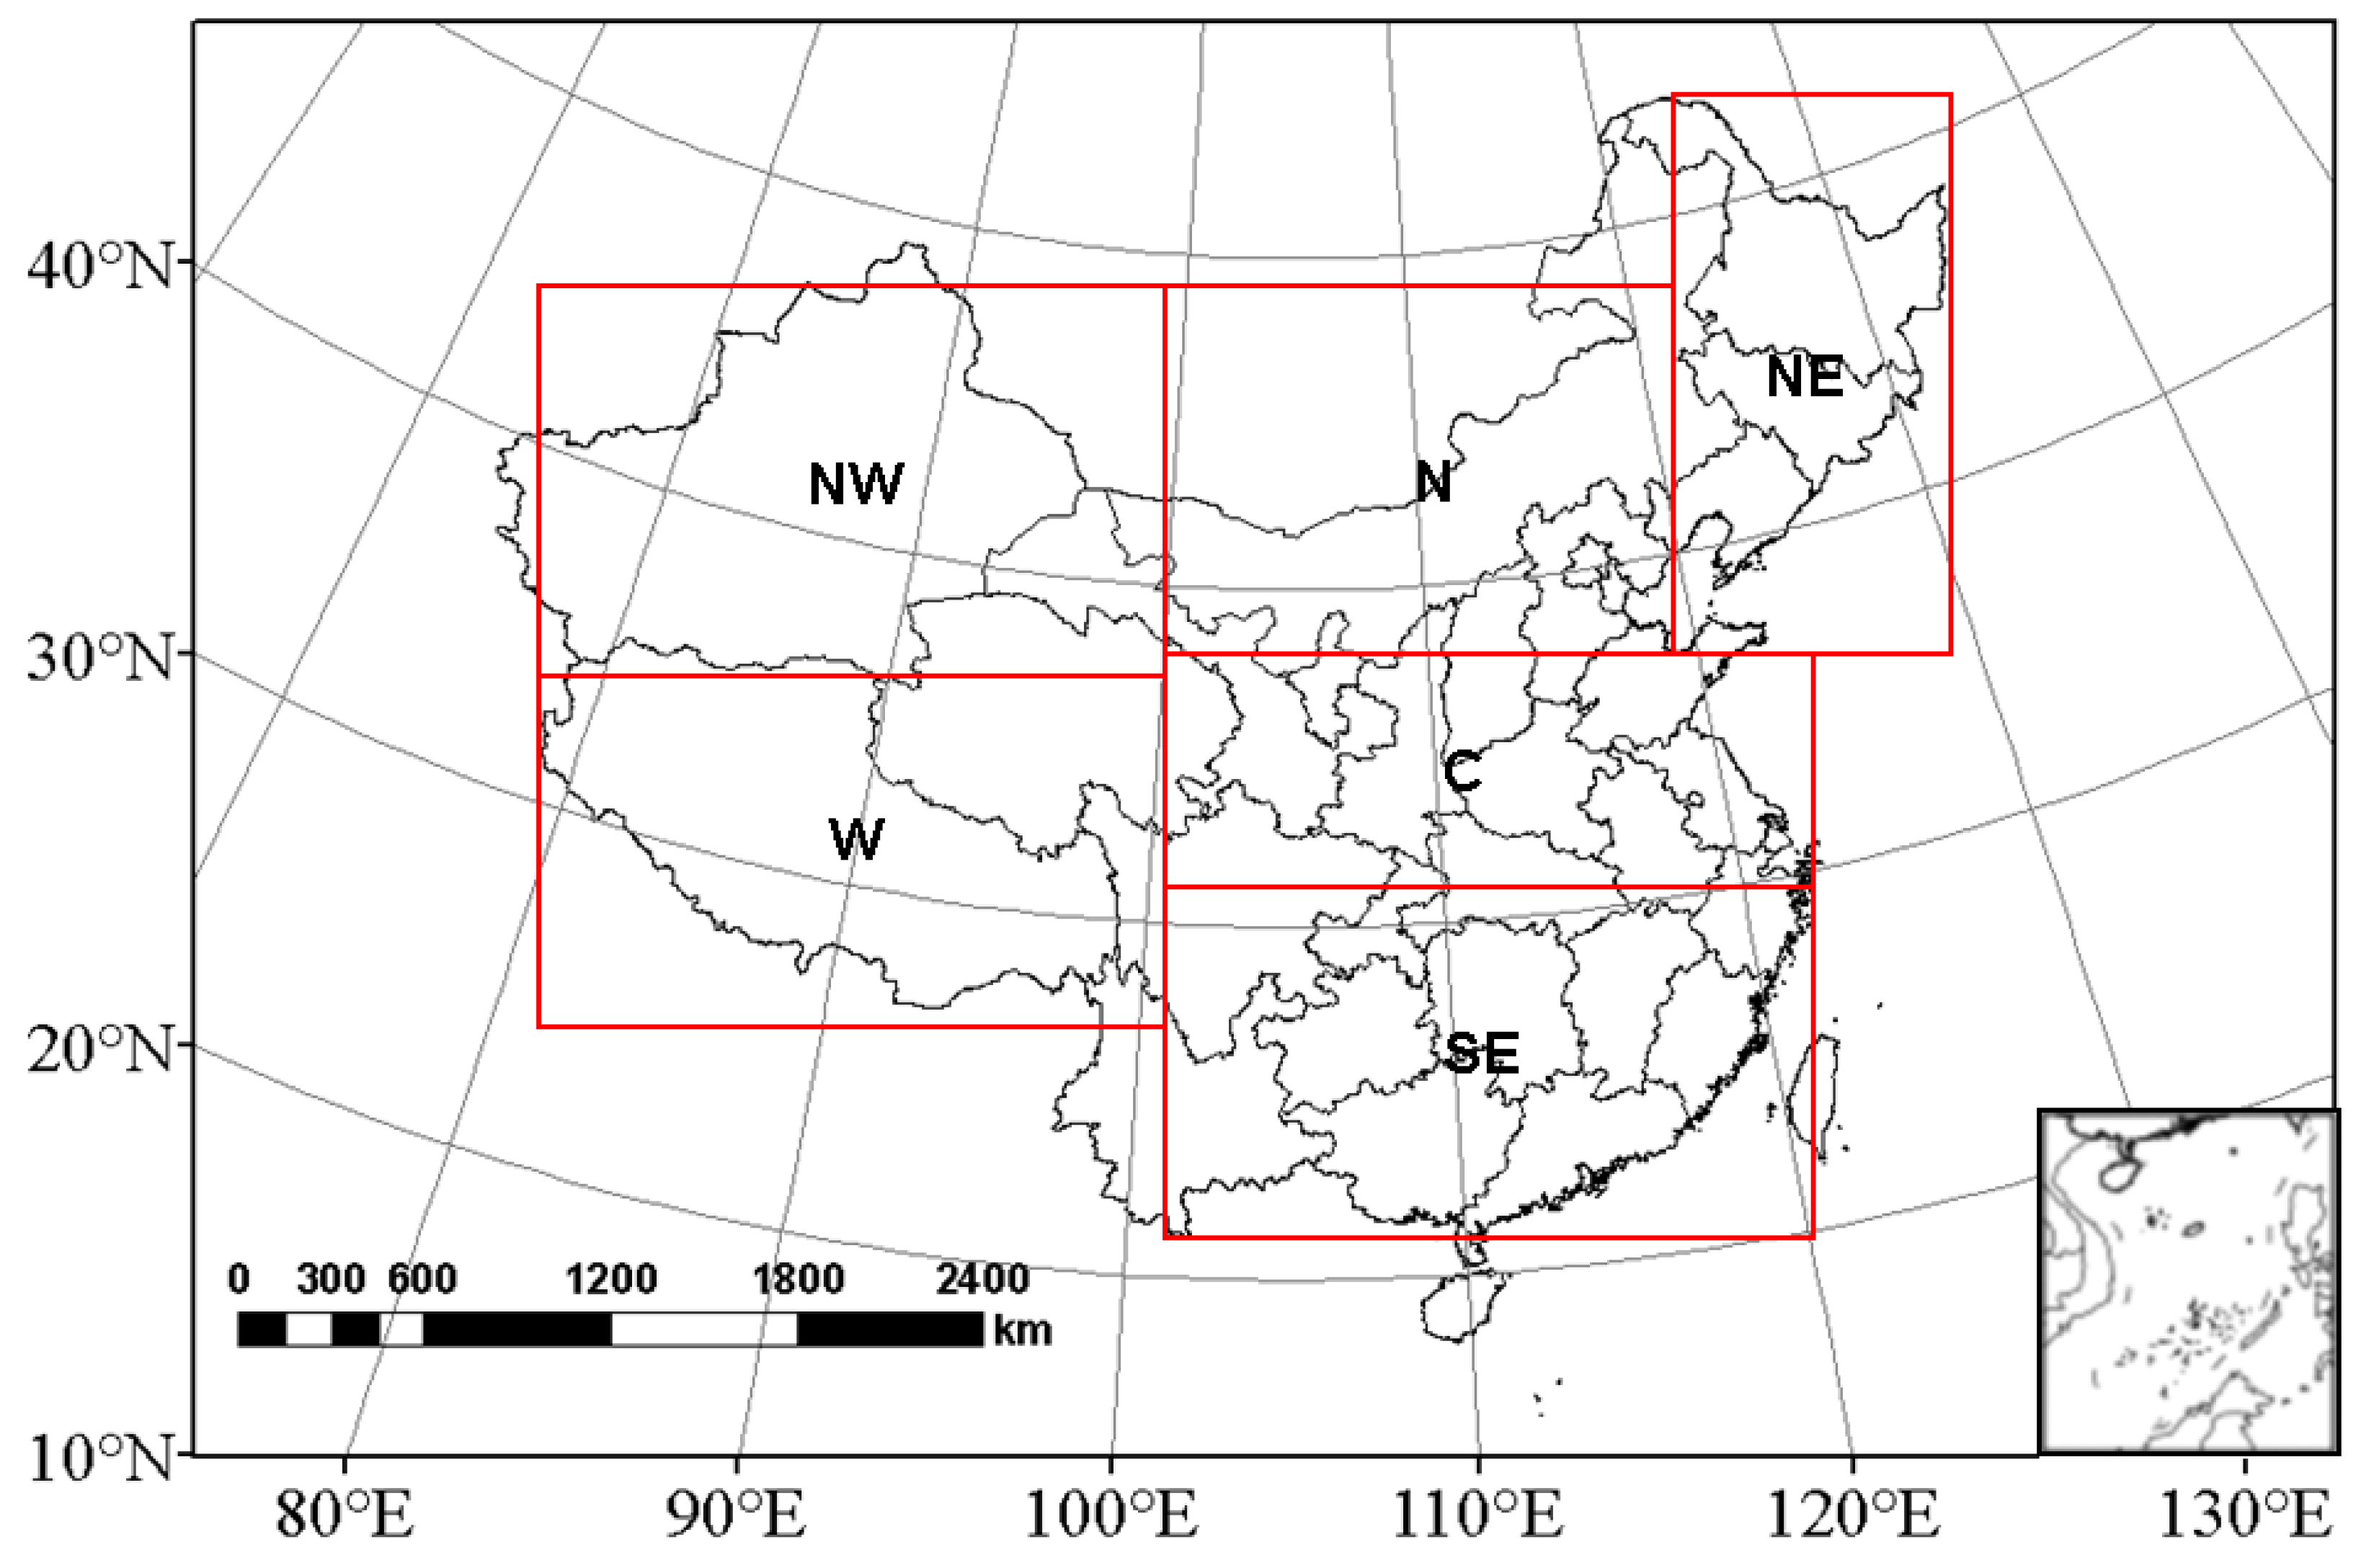
The experimental regions in this study are depicted in Figure 2. Based on different climatic characteristics, the region is divided into six sub-regions (sub-region latitudes and longitudes delineated as shown in Table 1): Northeast (NE), North (N), Northwest (NW), West (W) or the Qinghai–Tibet Plateau (QTP), Southeast (SE), and Central (C). Using the period from 1979 to 2004 as the baseline, the simulation performance of PRECIS is validated. Under the SSP245 and SSP585 emission scenarios, the changes in daily maximum and minimum temperatures in the early (2021–2050, 2030s) and late (2070–2099, 2080s) 21st century are estimated.
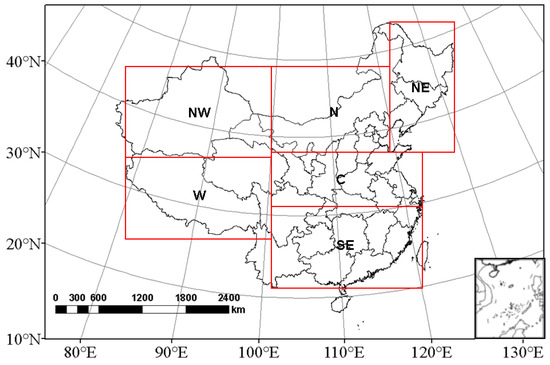
Figure 2.
Experiment domain and the sub-regions in China.

Table 1.
Latitude and longitude information for the sub-regions.
In this study, three metrics, namely root mean square error (RMSE), correlation coefficient (R), and mean absolute error (MAE), are employed to evaluate the simulation performance of PRECIS and GCM in China and its six sub-regions. To facilitate validation, the simulated data from PRECIS and its driving BCC-CSM2-MR are interpolated using bilinear interpolation to match the 0.25° × 0.25° grid resolution (consistent with CN05). The seasons are divided into winter (December to February, DJF), spring (March to May, MAM), summer (June to August, JJA), and autumn (September to November, SON).
3. Results
3.1. Historical Validation
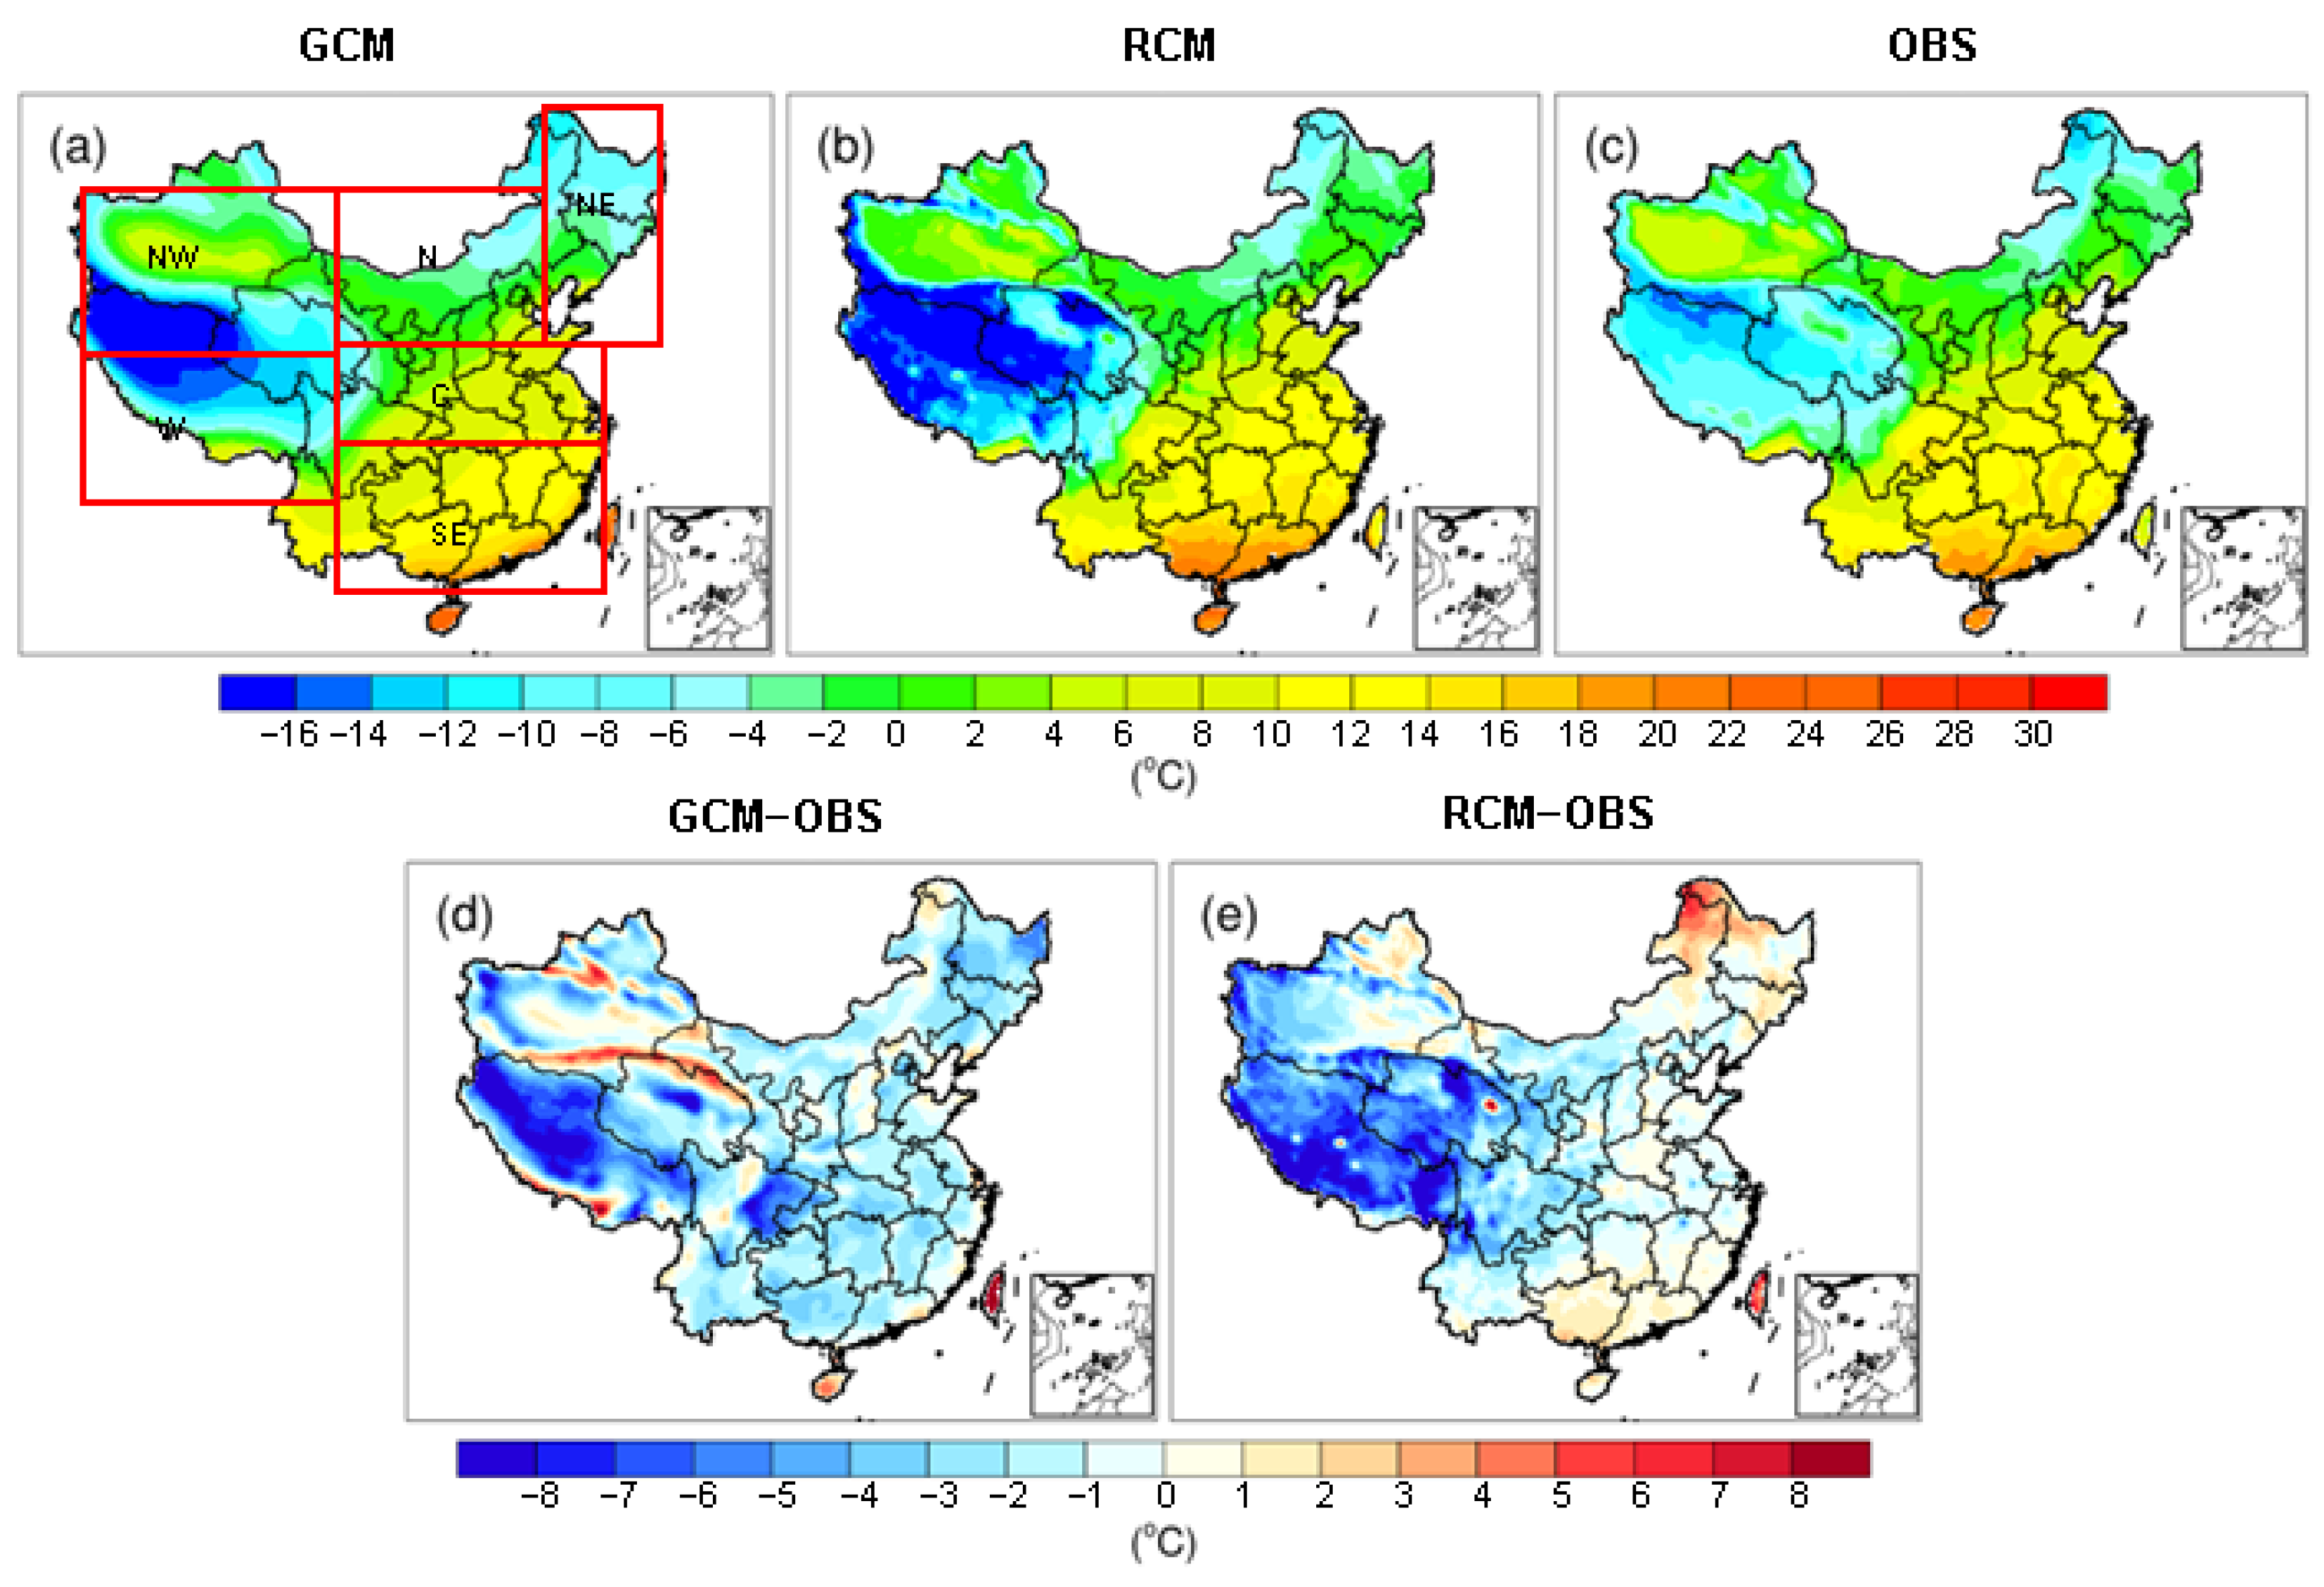
The spatial distributions of daily maximum and minimum temperatures before and after the dynamical downscaling by PRECIS, along with their biases from CN05, are illustrated in Figure 3 and Figure 4. Overall, PRECIS and its driving BCC-CSM2-MR demonstrate good performance in reproducing the spatial distribution of extreme temperatures across China. For daily maximum temperature, the Qinghai–Tibet Plateau, located in the western region, is characterized by a distinct cold center, while the southeastern region exhibits a warm center, features accurately captured by both models. However, compared to CN05, PRECIS, and BCC-CSM2-MR also exhibit different magnitudes of biases. The BCC-CSM2-MR model tends to underestimate both maximum and minimum temperatures nationwide, whereas PRECIS shows significant improvement, particularly in the northern regions. However, in some areas of the southeastern and northwestern regions, PRECIS appears to exhibit signs of excessive correction, resulting in warmer simulated daily maximum temperatures. Regarding daily minimum temperatures, PRECIS generally outperforms its driving data across eastern China yet still tends to overestimate temperatures to the northernmost extent. Additionally, regardless of maximum or minimum temperatures, both models consistently exhibit significant underestimation in the Tibet region, indicating that the climatic simulation performance of this area has not been improved through dynamical downscaling.
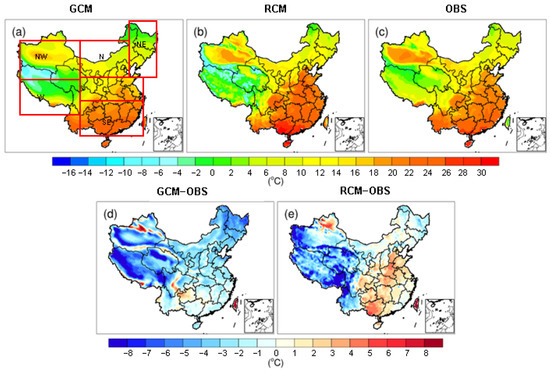
Figure 3.
Spatial distribution in simulating the daily maximum temperature for PRECIS and its driving GCM (BCC-CSM2-MR) ((a–c) are GCM, PRECIS, and observed daily maximum temperature, respectively; (d,e) are GCM and RCM minus the observation).

Figure 4.
Spatial distribution in simulating the daily minimum temperature for PRECIS and its driving GCM (BCC-CSM2-MR) ((a–c) are GCM, PRECIS, and observed daily minimum temperature, respectively; (d,e) are GCM and RCM minus the observation).
In order to measure the performance of both models in simulating the spatial distribution of extreme temperatures, this study computed the R, RMSE, and MAE between the simulations and observation for China and its six sub-regions (Table 2). Overall, PRECIS exhibits a significant advantage over GCM in all three metrics, particularly in the Northeast region. For maximum temperature, the R values range from 0.926 to 0.99, RMSE from 4.949 to 1.462, and MAE from −4.85 to −1.03 before and after downscaling. For minimum temperature, before and after downscaling, the correlation coefficient values range from 0.914 to 0.963, RMSE from 2.977 to 1.863, and MAE from −2.58 to 1.16. In the western region, compared to BCC-CSM2-MR, the PRECIS simulation has not shown more improvements in terms of both maximum and minimum temperatures, although the correlation coefficient for minimum temperature is better than that for maximum temperature. Other quantitative indicators (i.e., RMSE and MAE) demonstrate poorer performance from PRECIS, indicating that dynamical downscaling introduces more errors in complex western regions.
Table 2.
Correlation coefficient (R), root mean square error (RMSE), and mean absolute error (MAE) before (GCM) and after downscaling (RCM) for daily maximum temperature and minimum temperature (in parenthesis) compared to the CN05.
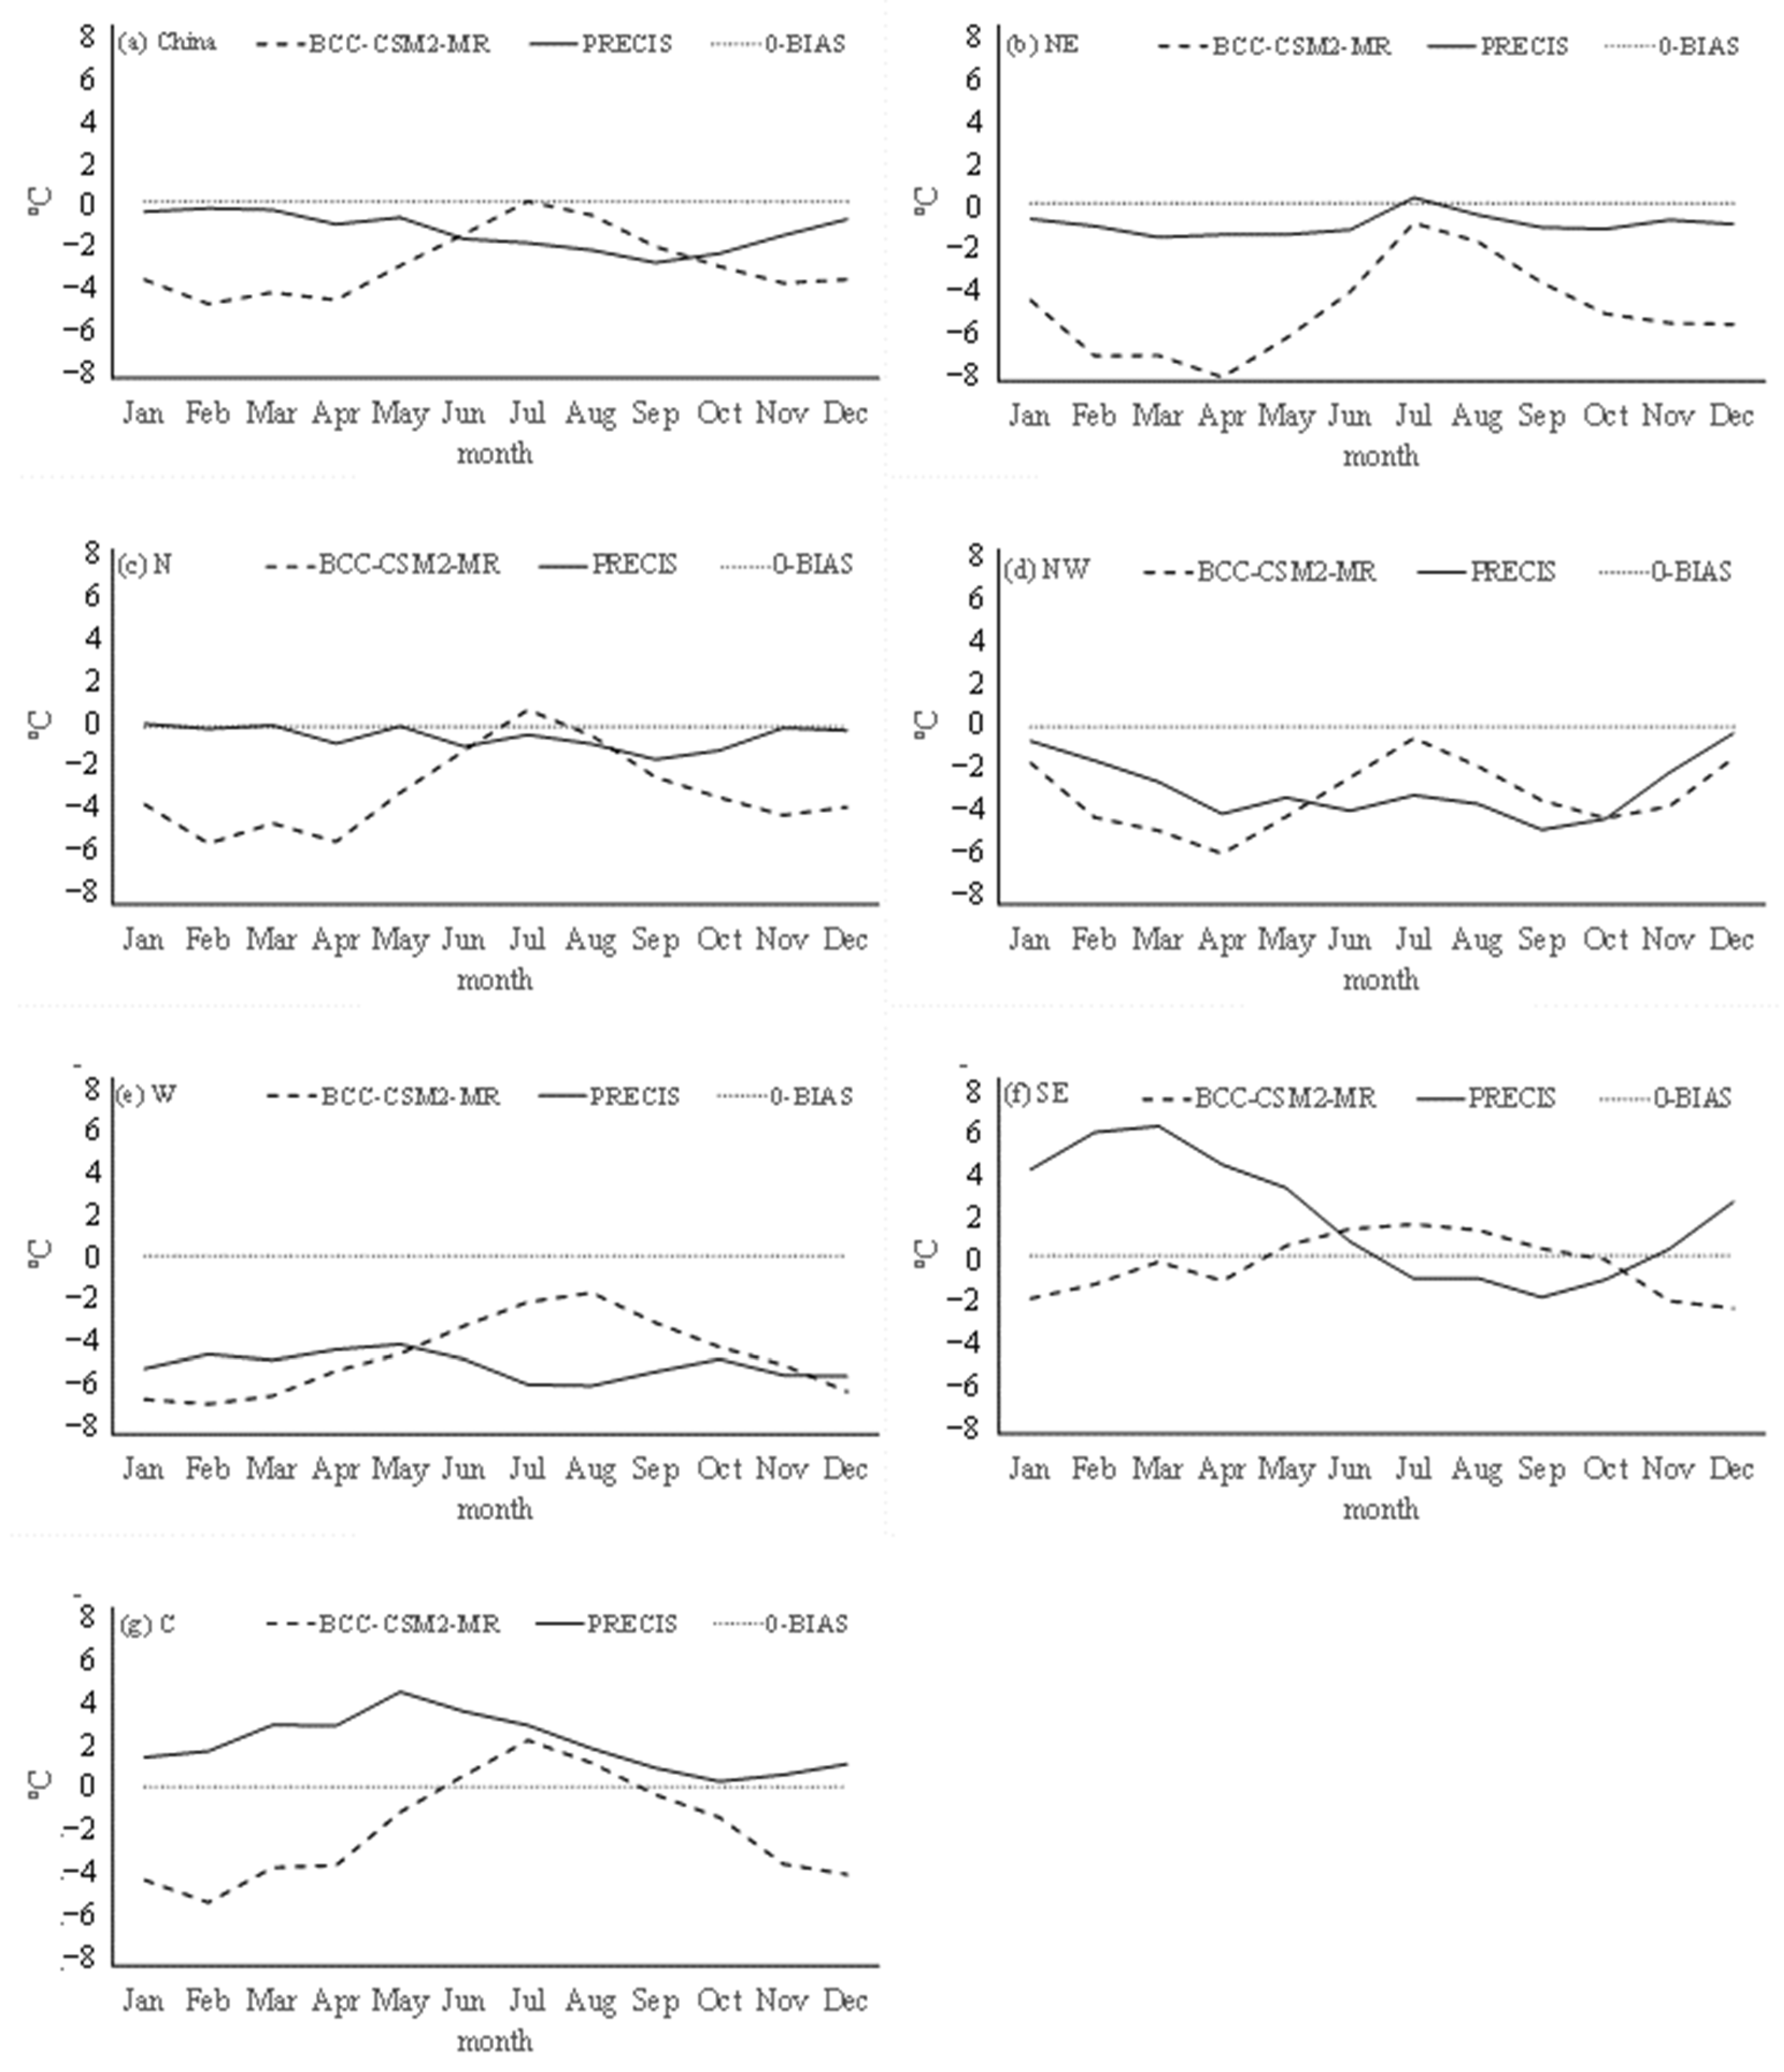
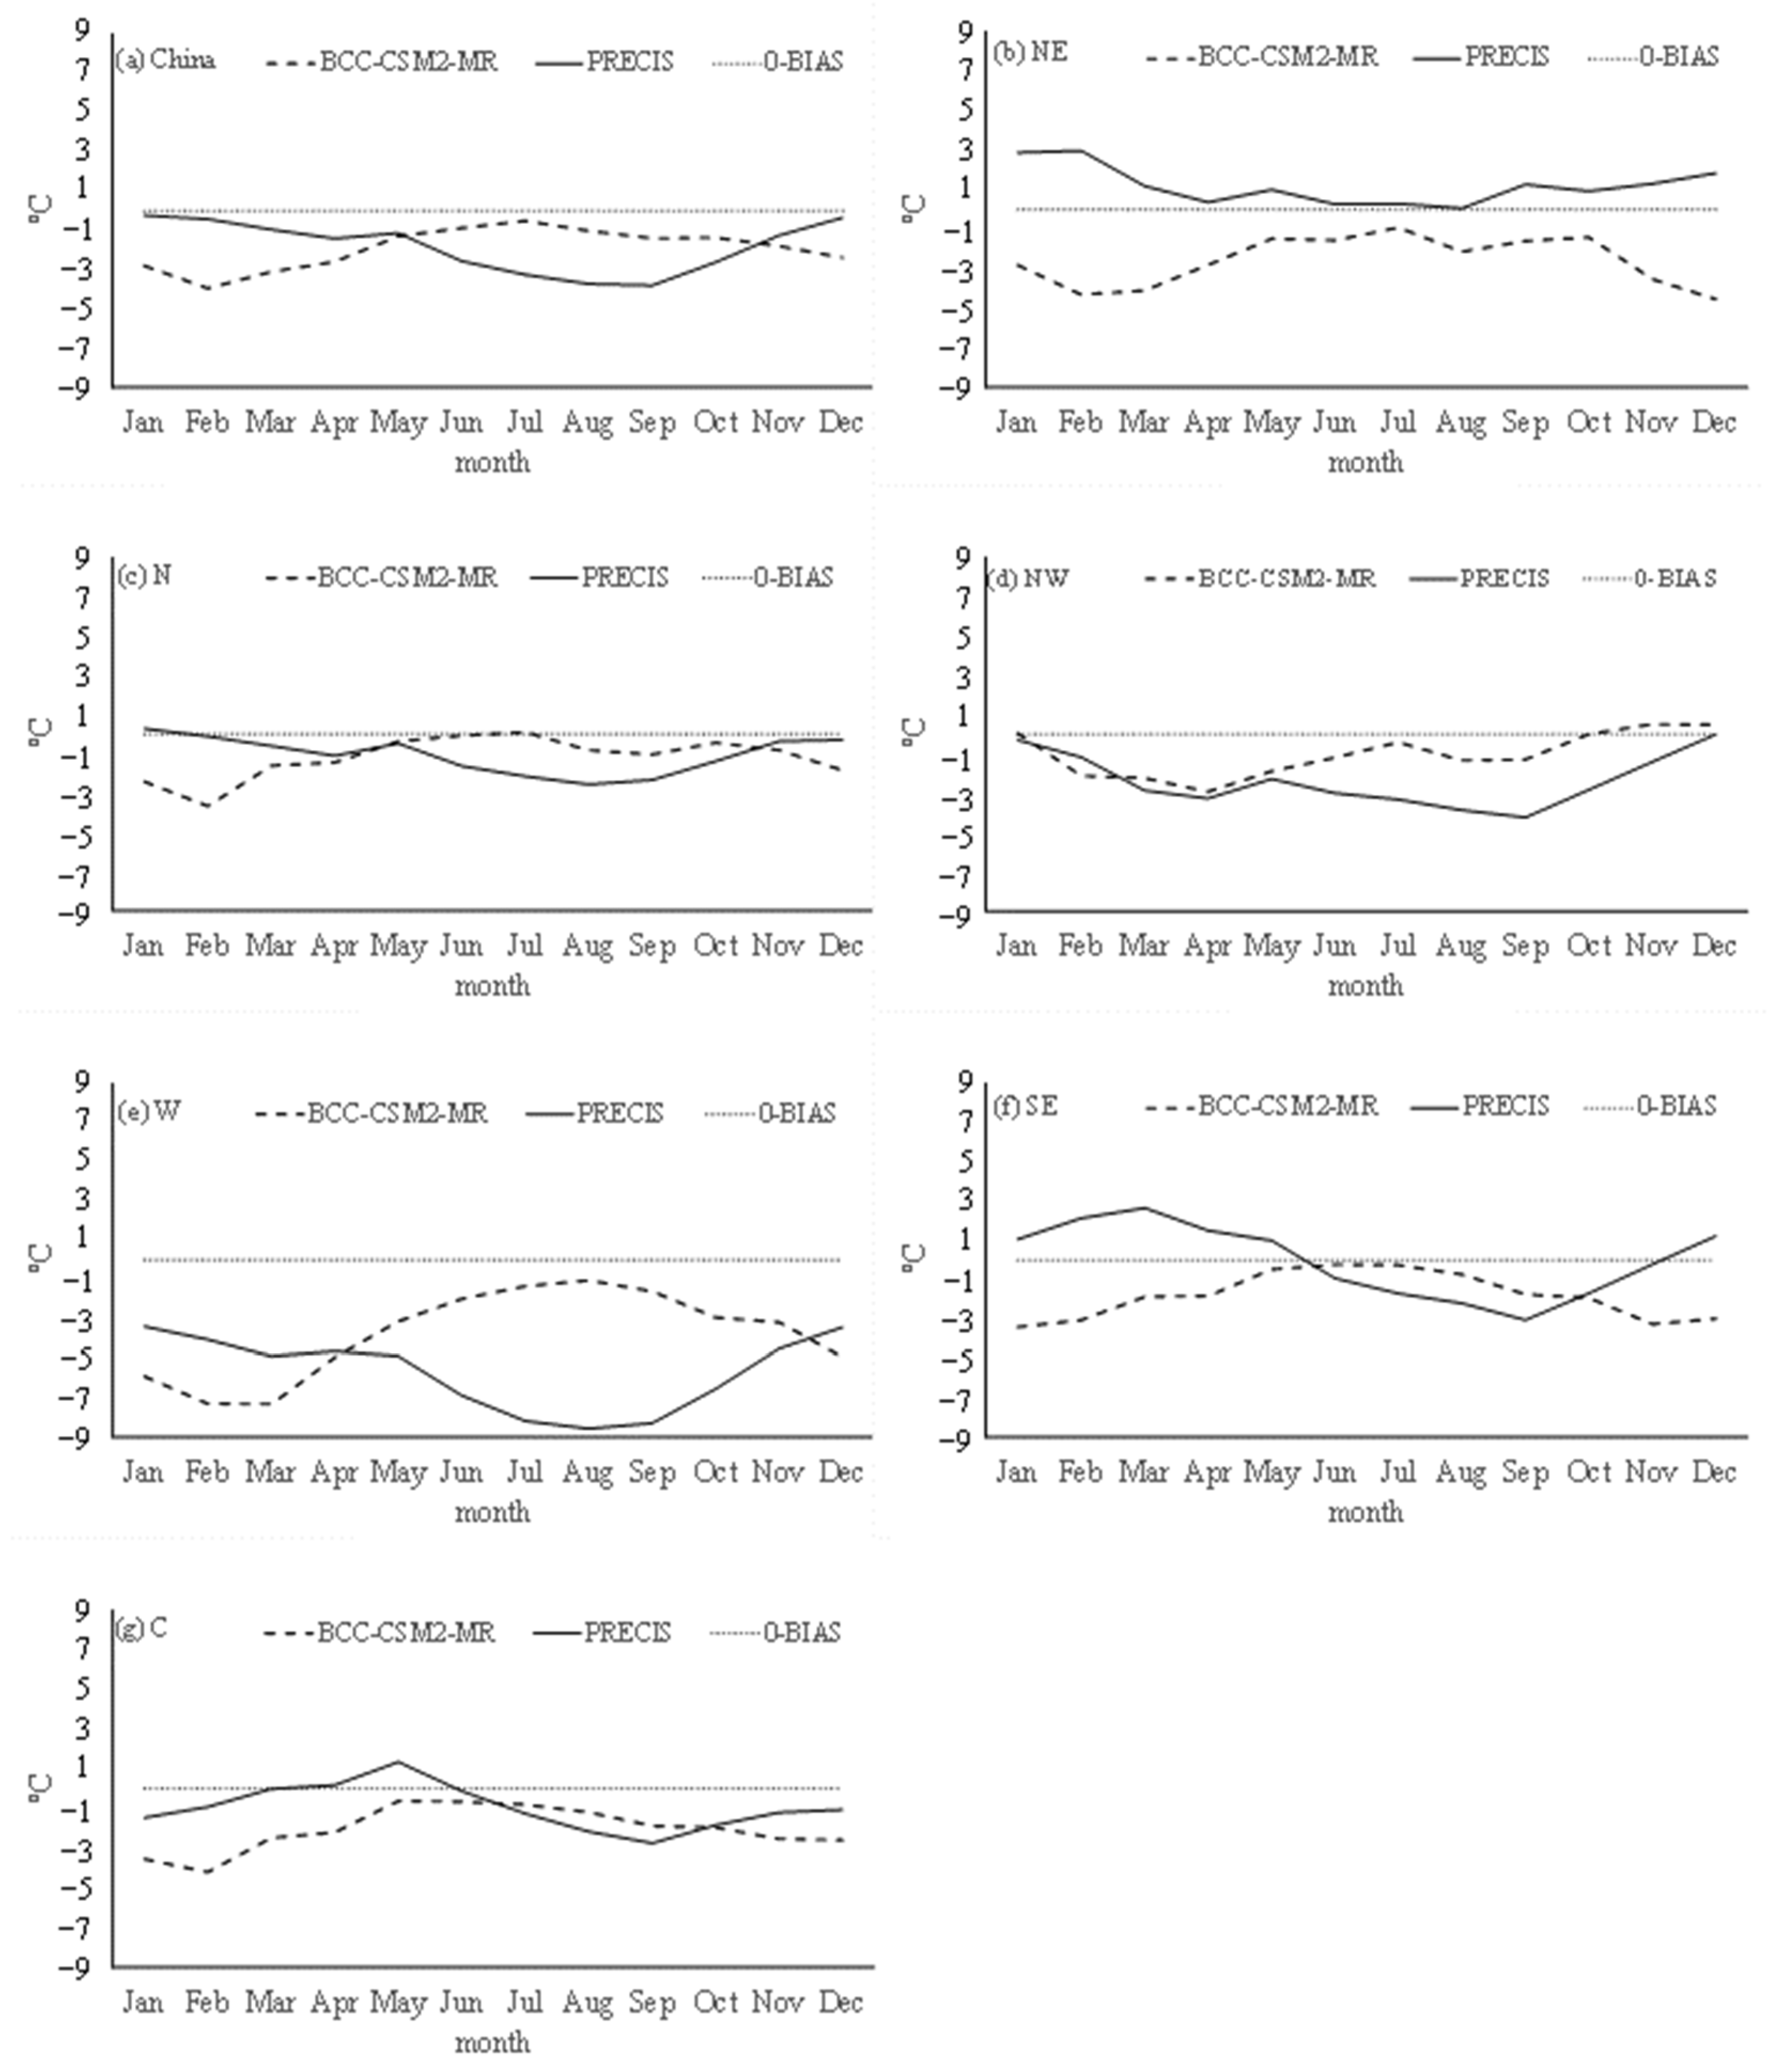
In the annual cycle, the biases of daily maximum and minimum temperatures between BCC-CSM2-MR and PRECIS are viewed in Figure 5 and Figure 6. Overall, PRECIS performs better than BCC-CSM2-MR in simulating these extreme temperatures, especially during relatively cold months (i.e., December and from January to May). When considering regional variations, PRECIS exhibits notably superior performance in simulating extreme temperatures in the northeast and northern regions compared to GCM, which matches the spatial distribution characteristics of PRECIS. However, in the northeast region, PRECIS tends to overestimate the minimum temperature, opposite to the underestimation tendency of BCC-CSM2-MR. Except for some months in the southeast and central regions where overestimation occurs, most regions show underestimation. In the western region, PRECIS performs relatively poorly compared to its driving GCM, although there is a slight improvement from December to April. Nevertheless, both PRECIS and its driving data from BCC-CSM2-MR exhibit significant biases relative to the observed data.
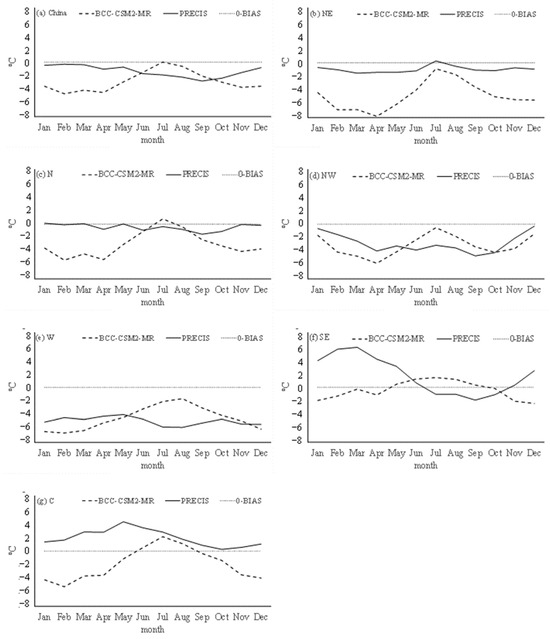
Figure 5.
The biases of daily maximum temperature for PRECIS and BCC-CSM2-MR compared to the CN05 in an annual cycle ((a–g) are China region, Northeast region, East region, Northwest region, West region, Southeast region, and Central region).
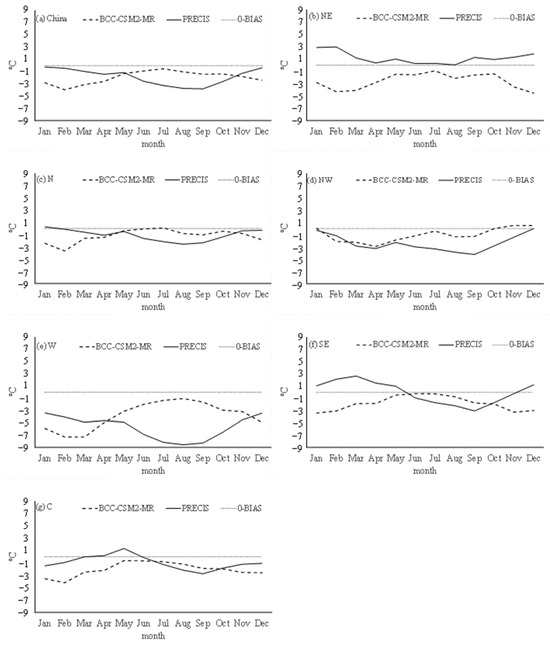
Figure 6.
The biases of daily minimum temperature for PRECIS and BCC-CSM2-MR compared to the CN05 in an annual cycle ((a–g) are China region, Northeast region, East region, Northwest region, West region, Southeast region, and Central region).
3.2. Future Changes
3.2.1. Changes in Spatial Distribution
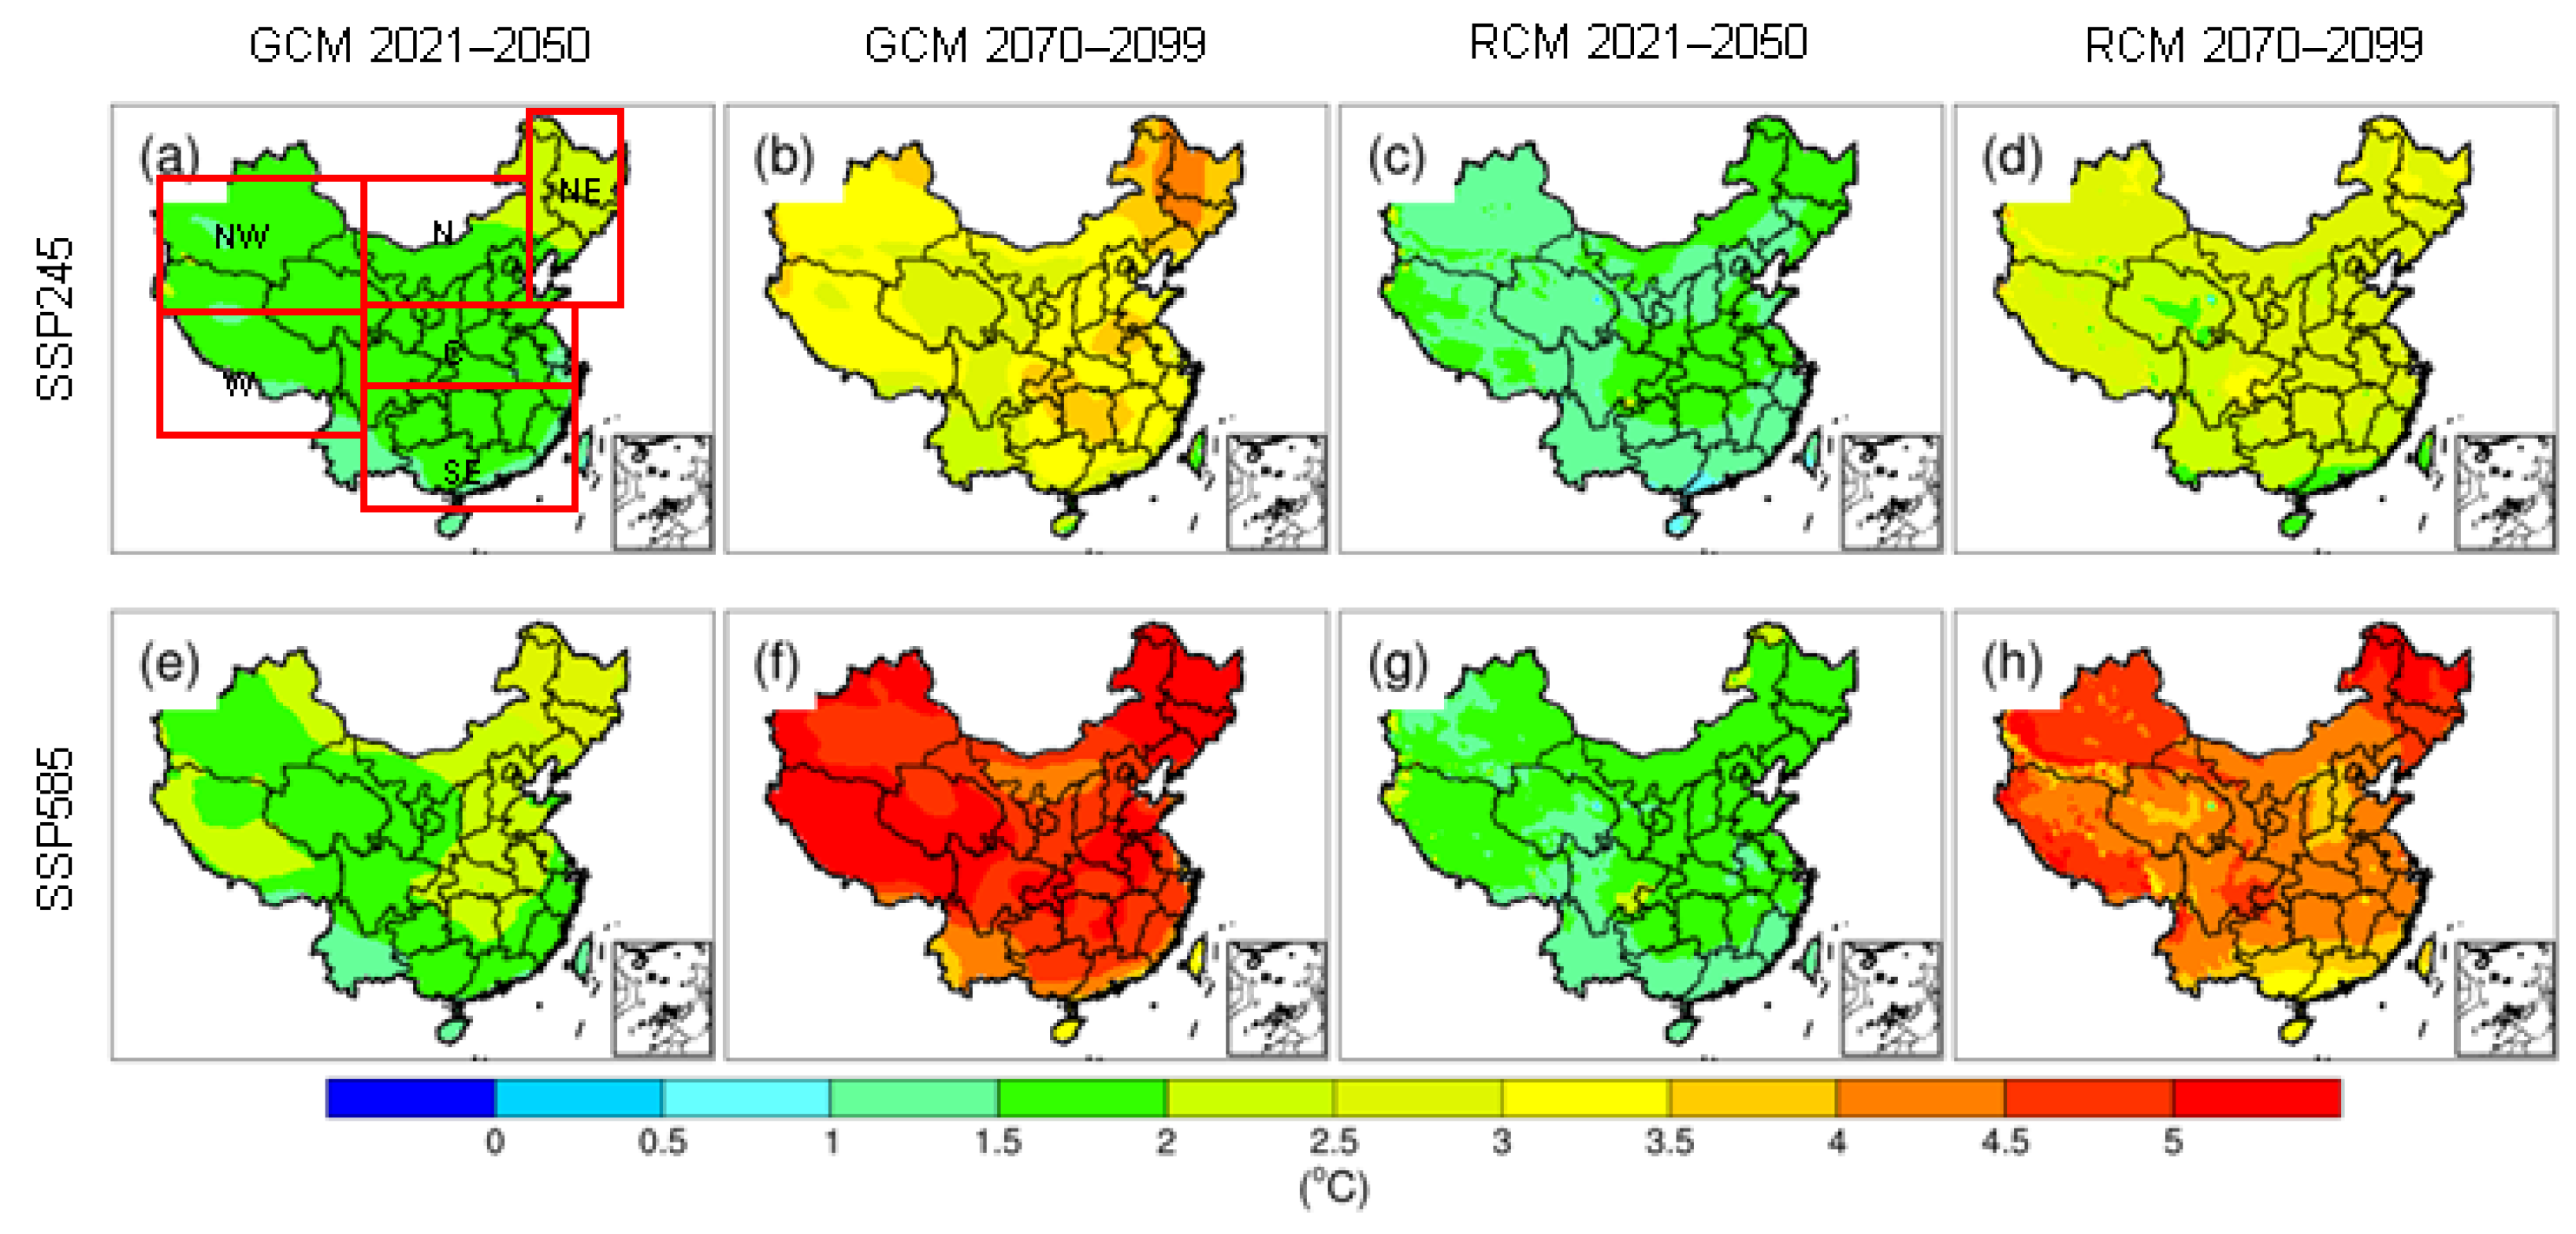
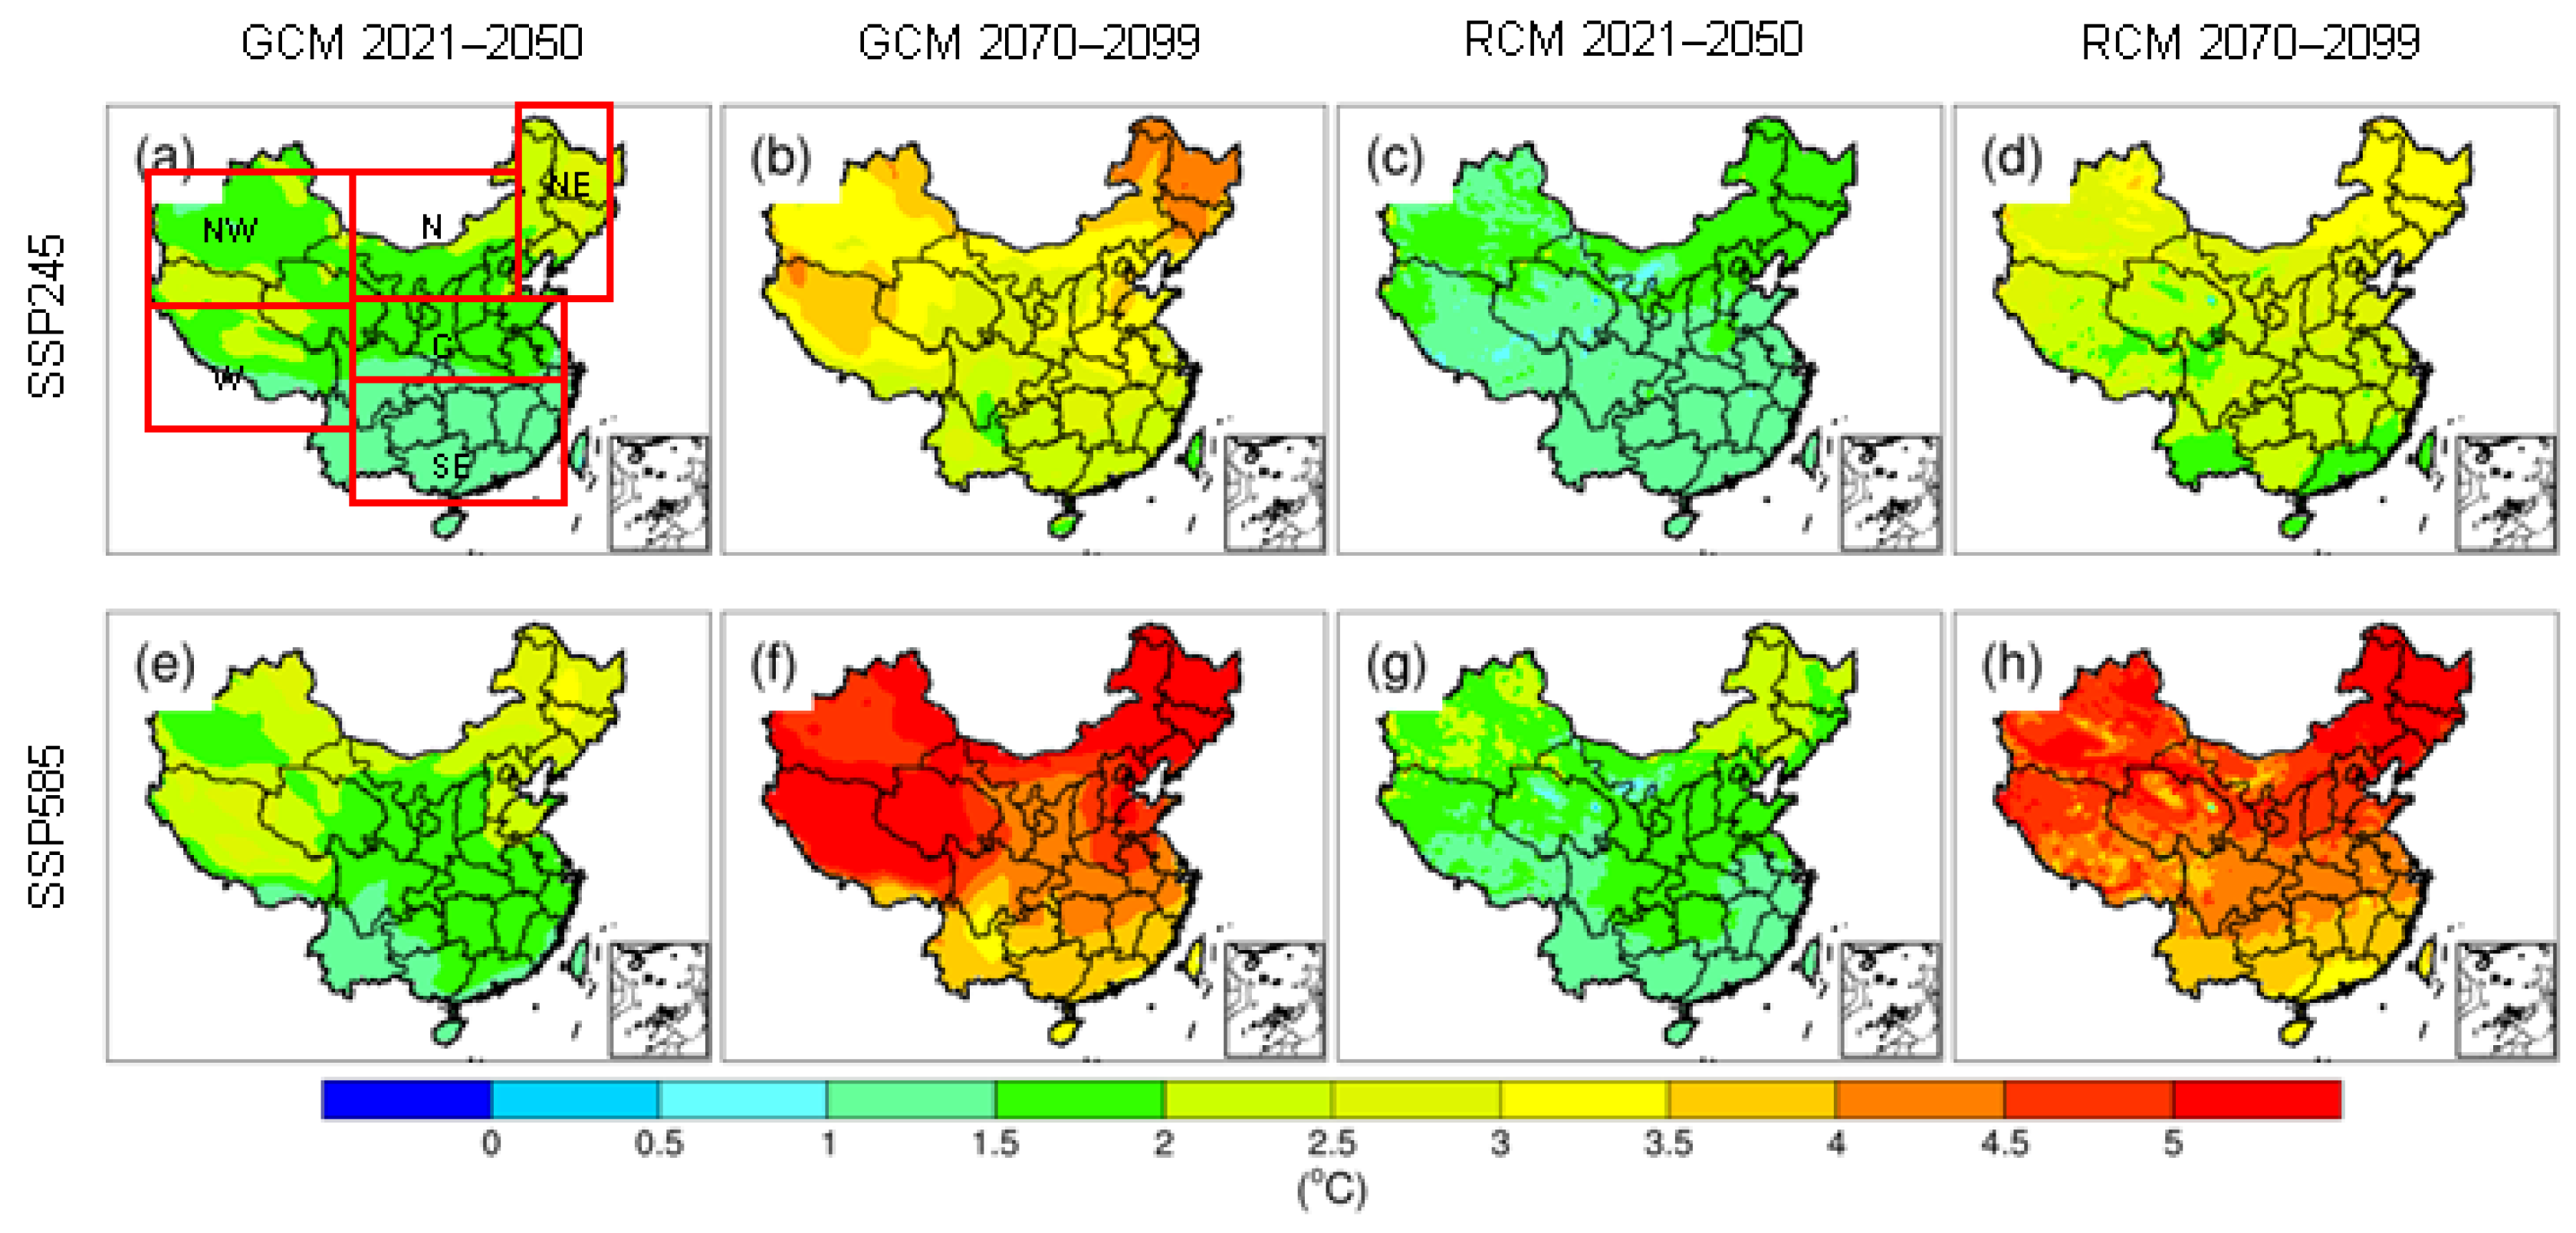
The changes in daily maximum and minimum temperatures for different future scenarios and periods predicted by PRECIS and BCC-CSM2-MR are illustrated in Figure 7 and Figure 8, respectively. Overall, both maximum and minimum temperatures show similar increasing trends in the future, with greater warming observed in the latter half of the 21st century (2080s) compared to 2021–2050 (2030s), and SSP585 exhibiting more warming than SSP245. Specifically, in the early part of the century, the spatial distribution of extreme temperatures under SSP245 and SSP585 scenarios is similar, with temperature increases ranging from approximately 1–2 °C in most regions and some areas (i.e., Northeast China) experiencing rises of 2–3 °C. By the latter part of the century, most regions will experience temperature increases exceeding 3 °C, with more pronounced warming under the SSP585 scenario. From the before-and-after perspective of downscaling, it appears that the warming magnitude projected by PRECIS for the two future periods is slightly smaller compared to the GCM.

Figure 7.
Changes in daily maximum temperature under SSP245 and SSP585 scenarios (the first row (a–d) is the SSP245 scenario, the second row (e–h) is the SSP585 scenario, the first column (a,e) is the projected change in daily maximum temperature in 2021–2050 for GCM, the second column (b,f) is 2070–2099 for GCM, the third column (c,g) is 2070–2099 for RCM, and the last column (d,h) is 2070–2099 for RCM).

Figure 8.
Changes in daily minimum temperature under SSP245 and SSP585 scenarios (the first row (a–d) is the SSP245 scenario, the second row (e–h) is the SSP585 scenario, the first column (a,e) is the projected change in daily minimum temperature in 2021–2050 for GCM, the second column (b,f) is 2070–2099 for GCM, the third column (c,g) is 2070–2099 for RCM, and the last column (d,h) is 2070–2099 for RCM).
As shown in Figure 9, Figure 10, Figure 11 and Figure 12, the trend of the seasonal maximum and minimum temperature changes projected by PRECIS appears similar to the trend in annual, though some differences in spatial distribution. Under the SSP585 scenario, extreme temperatures in season are projected to experience greater increases compared to the SSP245 scenario, indicating the influence of greenhouse gas emissions on temperature rise. For PRECIS, the change in extreme temperatures is less pronounced in spring compared to other seasons. For instance, under the SSP245 scenario, in the 2030s, extreme temperatures across China are projected to rise by approximately 0.5 °C, with the Northeast region experiencing greater warming in autumn and winter during the latter half of the century. Under the SSP585 scenario, during the early part of the century, the differences in extreme temperature changes compared to the SSP245 scenario are relatively minor. However, by the latter part of the century, most regions are projected to experience temperature increases exceeding about 3 °C, with certain areas, such as parts of the Northeast region, witnessing temperature even rises of over 7 °C (Figure 9 and Figure 10). For BCC-CSM2-MR, the trend in extreme temperature changes seems to align with that of PRECIS but with higher magnitudes of warming (Figures S1 and S2).
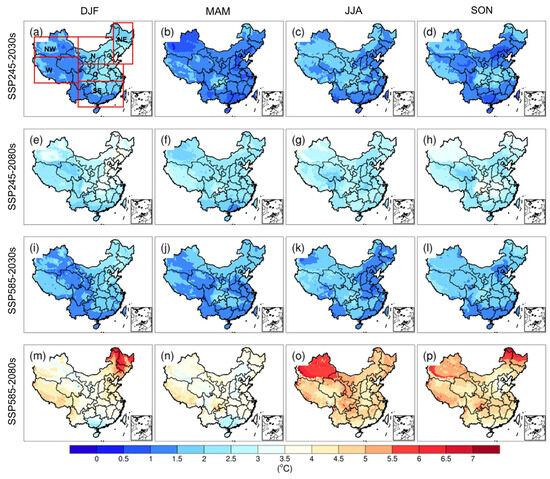
Figure 9.
Changes in seasonal maximum temperature projected by PRECIS under different SSP scenarios and periods. The seasonal maximum temperature changes in winter (DJF (a,e,i,m)), spring (MAM (b,f,j,n)), summer (JJA (c,g,k,o)), and autumn (SON (d,h,l,p)) are shown from the first column to the fourth column.
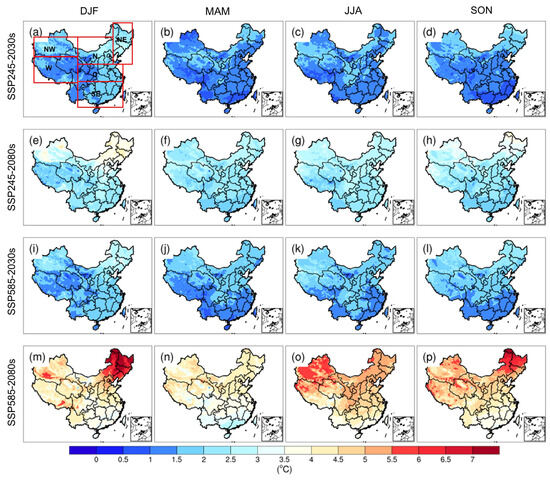
Figure 10.
Changes in seasonal minimum temperature projected by PRECIS under different SSP scenarios and periods. The seasonal maximum temperature changes in winter (DJF (a,e,i,m)), spring (MAM (b,f,j,n)), summer (JJA (c,g,k,o)), and autumn (SON (d,h,l,p)) are shown from the first column to the fourth column.
3.2.2. Annual Cycle Changes
The projected changes in extreme temperatures on the annual cycle in China and its six sub-regions by PRECIS and BCC-CSM2-MR are investigated further. Overall, under the SSP245 scenario, the changes in extreme temperatures are smaller than under the SSP585 scenario, with smaller increases in the early 21st century compared to the late century.
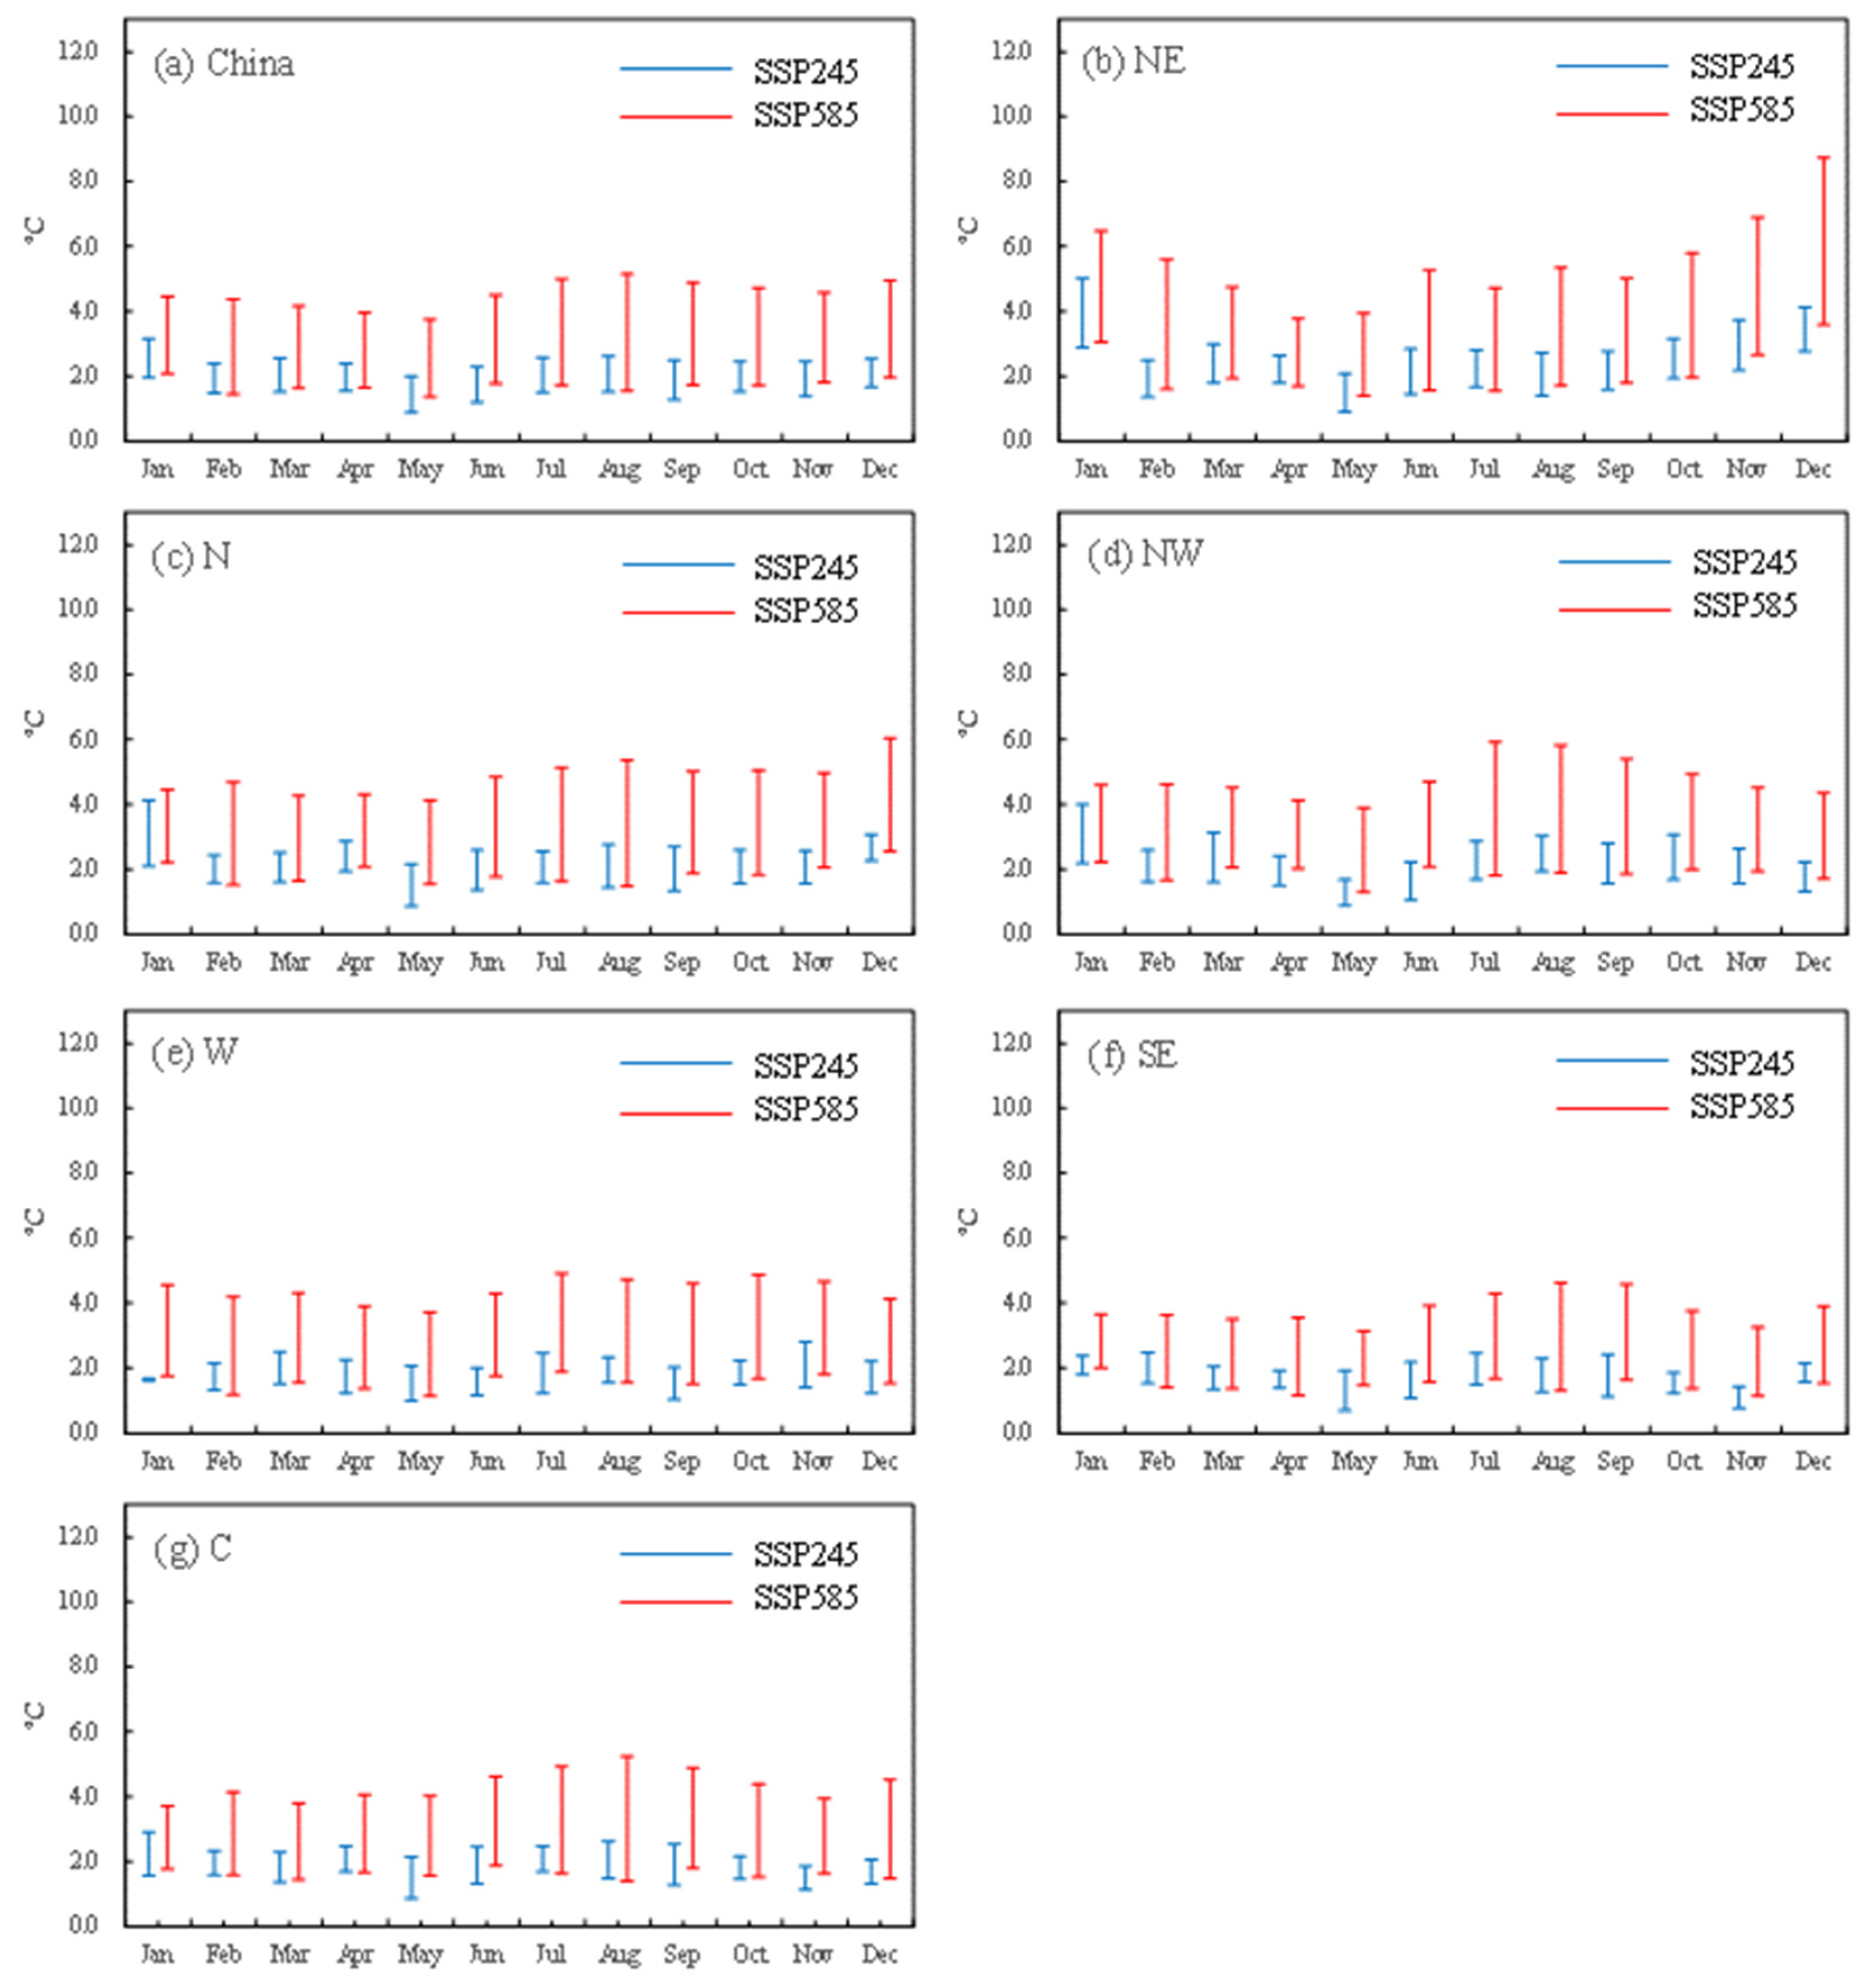
Specifically for PRECIS, extreme temperature increases in the Northeast region are more pronounced compared to other regions, particularly in January, November, and December. Taking extreme temperatures in December as an example, under the SSP245 scenario, the maximum temperature increases by approximately 2.6 °C and 3.6 °C in the 2030s and 2080s, respectively, while the minimum temperature increases by approximately 2.8 °C and 4.1 °C, respectively. Under the SSP585 scenario, the maximum temperature increases by approximately 3.2 °C and 7.7 °C at the beginning and end of the century, respectively (Figure 11), while the minimum temperature increases by approximately 3.6 °C and 8.7 °C, respectively (Figure 12).
Compared to PRECIS, BCC-CSM2-MR exhibits similar spatial distribution characteristics in extreme temperatures but with greater magnitudes of warming. The Northeast region remains the area with the most pronounced temperature changes, especially for the minimum temperature. For instance, in December, under the SSP245 scenario, the maximum temperature increases by approximately 3.6 °C and 5.3 °C in the 2030s and 2080s, respectively, while the minimum temperature increases by approximately 4.1 °C and 6.8 °C, respectively. Under the SSP585 scenario, the maximum temperature increases by approximately 4.5 °C and 9.2 °C at the beginning and end of the century, respectively (Figure S3), while the minimum temperature increases by approximately 5.6 °C and 12.0 °C, respectively (Figure S4).
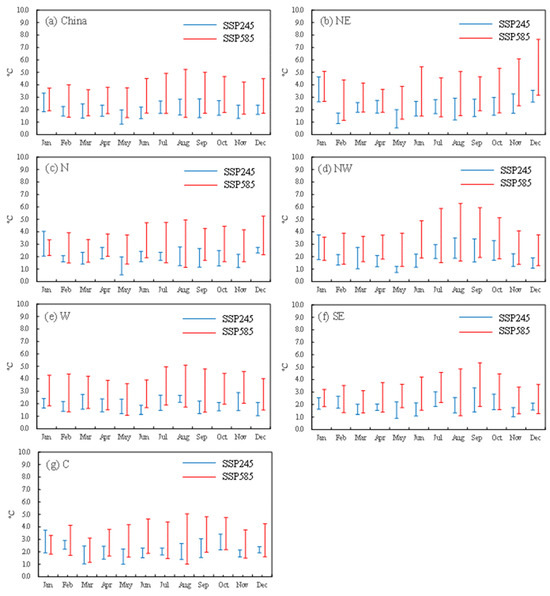
Figure 11.
Projected changes in maximum temperatures in the annual cycle in China and its sub-regions by PRECIS ((a–g) are China region, Northeast region, East region, Northwest region, West region, Southeast region, and Central region).
Figure 11.
Projected changes in maximum temperatures in the annual cycle in China and its sub-regions by PRECIS ((a–g) are China region, Northeast region, East region, Northwest region, West region, Southeast region, and Central region).
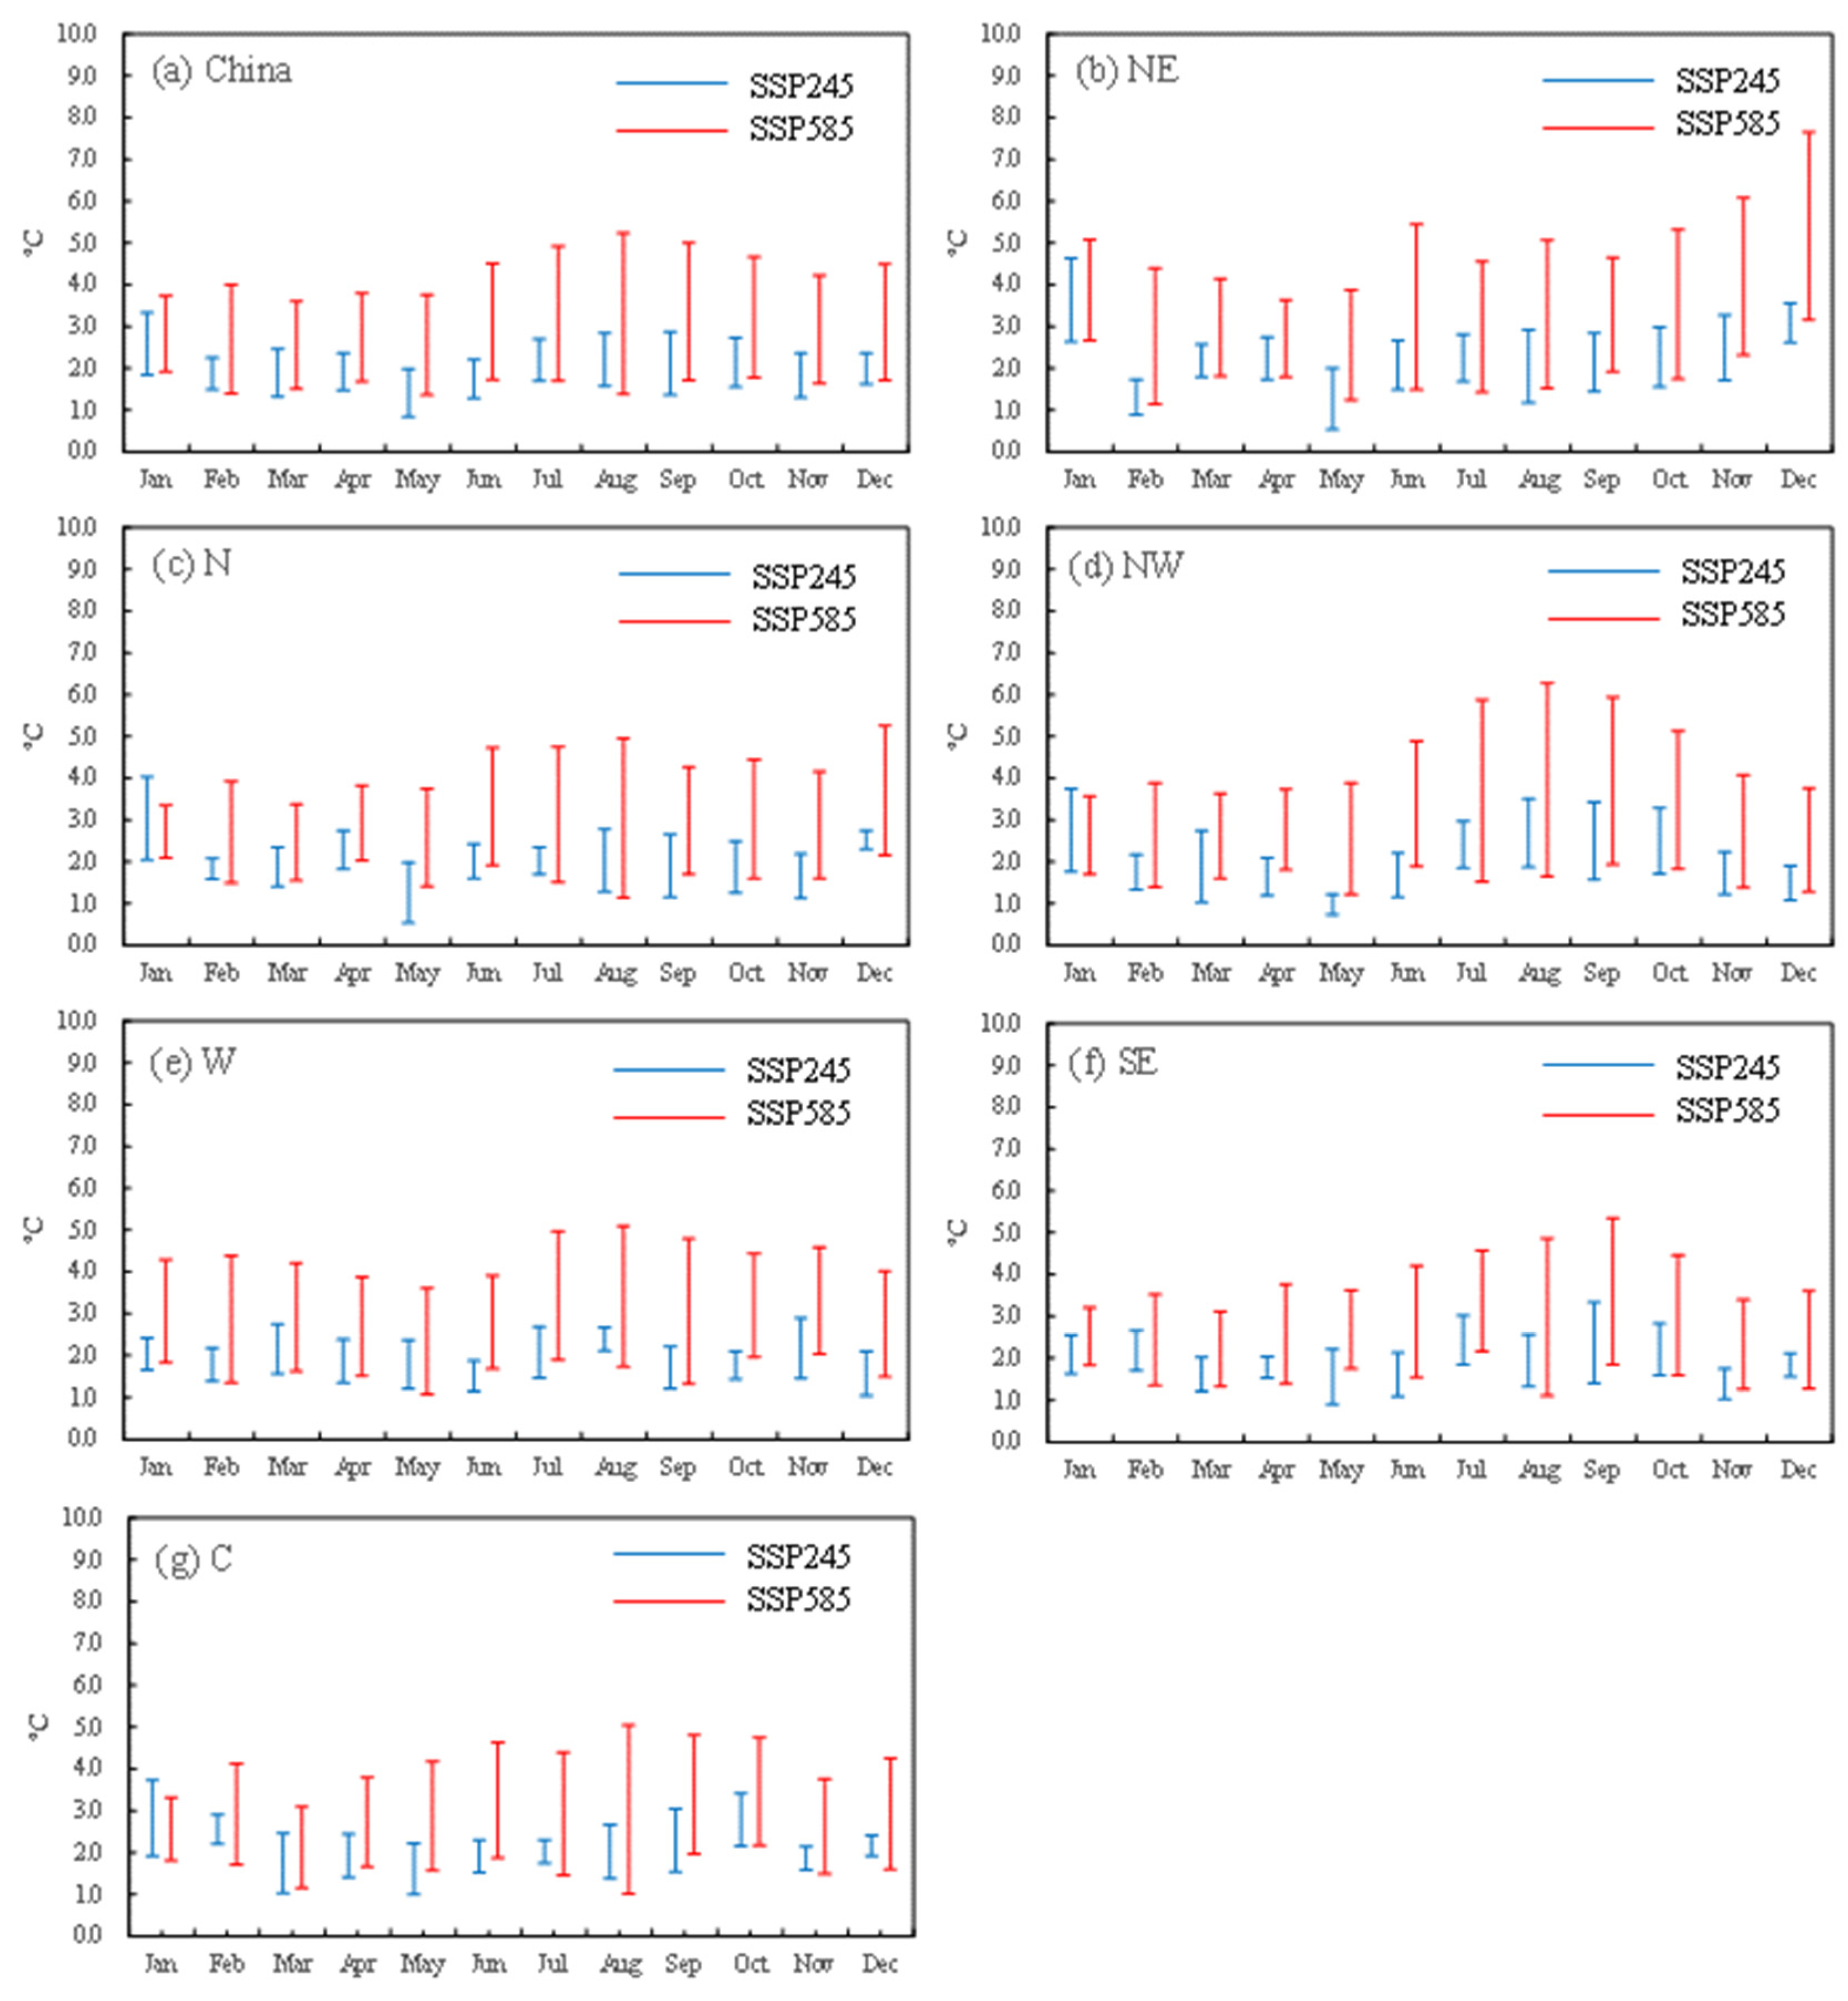
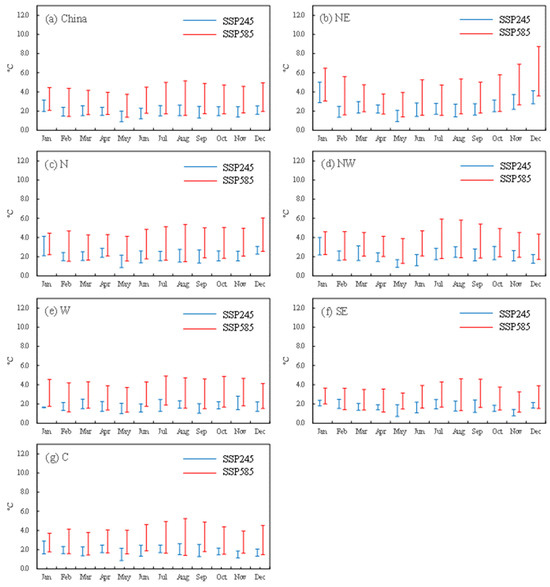
Figure 12.
Projected changes in minimum temperatures in the annual cycle in China and its sub-regions by PRECIS ((a–g) are China region, Northeast region, East region, Northwest region, West region, Southeast region, and Central region).
Figure 12.
Projected changes in minimum temperatures in the annual cycle in China and its sub-regions by PRECIS ((a–g) are China region, Northeast region, East region, Northwest region, West region, Southeast region, and Central region).
4. Discussions
In this study, we employed the BCC-CSM2-MR model from the Beijing Climate Center to drive PRECIS conducting downscaling experiments over China. In spatial, we found that PRECIS does not outperform relative to GCM in simulating the extreme daily temperature in the regions with extremely high elevations, such as the Qinghai–Tibet Plateau. Previous studies also provided some evidence suggesting that regional climate simulation experiments may not necessarily improve upon coarser-resolution GCMs in certain areas [25]. Several factors could contribute to this phenomenon.
Firstly, observational data has limitations. It is well known that the Qinghai–Tibet Plateau exhibits a high-altitude and cold climate, leading to a scarcity of observational stations. Even where stations exist, the quality of the monitored data may be questionable. In this study, the CN05.1 observational dataset was utilized, which is interpolated from over 2000 observation stations across China using certain techniques. However, the distribution of these stations across the country is uneven, as illustrated in [26]. It can be observed that stations in the western region are notably fewer than those in the eastern region. Particularly in the Qinghai–Tibet Plateau, the lack of observational data and poor data quality contribute to uncertainties in the observational dataset. Evaluating climate model results using such data as a reference may introduce certain errors. Subsequent research may consider incorporating multiple comparative datasets, such as re-analysis data, to further validate the model’s performance.
Secondly, excessive bias correction was introduced by RCM. Regardless of whether it concerns maximum or minimum temperatures, both the BCC-CMS2-ES and PRECIS models consistently display significant underestimation in the Tibet region, with indications of some instances of excessive correction. This suggests that the climatic simulation performance of this area has not been improved through dynamical downscaling. During the dynamic downscaling process, PRECIS appears to demonstrate signs of excessive correction in certain areas. For instance, in the southern part of the Qinghai–Tibet Plateau, the Himalayas, and the Kunlun Mountains, some initially overestimated daily minimum temperature is instead underestimated during the downscaling process by PRECIS. One possible explanation for this phenomenon is that the high-resolution PRECIS model may capture more land cover types, such as snow cover, glaciers, and permafrost, which melt and absorb heat in context of warming, consequently leading to cooler temperatures [27].
In conclusion, for regions with complex terrain and climatic characteristics like the Qinghai–Tibet Plateau, it may be necessary to conduct sensitivity analyses on the physical parameterization schemes used in regional climate models, such as radiation schemes, convection schemes, and land surface schemes, to identify the most suitable parameterization optimization scheme for the region. Furthermore, due to its intricate topography, employing more refined terrain and vegetation data to drive climate models should also be attempted in future experiments to achieve better simulation results.
Moreover, some bias correction approaches can further improve the over/underestimation of PRECIS. Here, we added a quantile mapping (QM) method to correct the bias of PRECIS. This method is often used in the correction of GCMs [28,29]. Specifically, we added the Logistic and Normal distributions as the probability distribution functions to correct the daily maximum and minimum temperatures simulated by PRECIS. The results are shown in Figures S5 and S6 (see Supplementary Materials). Indeed, these biases have been significantly reduced after correction, and the spatial distribution across the entire China region is nearly consistent with CN05. From the distribution of biases (Figure S6), the errors after correction with both methods are very small, especially with the Normal bias correction method, where the overall error is around 0.5 °C, demonstrating excellent performance of the method. However, it is important to note that the choice of different bias correction methods may result in varying correction performance. The results from the Logistic correction are slightly worse compared with the Normal.
However, while statistical methods can effectively reduce such errors, there is a caveat. Since these correction methods rely solely on mathematical relationships, it is impossible to understand the underlying physical mechanisms. Furthermore, some studies suggest that although statistical methods can closely approximate observational results, they may struggle to improve temporal trends and could even lead to overfitting issues [30,31].
5. Conclusions
PRECIS, as a widely used regional climate model, is limited in its exploration of regional climate change possibilities by being exclusively powered by the GCM of the UK Hadley Centre. This study attempts to employ the BCC-CSM2-MR model from the Beijing Climate Center to drive the PRECIS model at a spatial resolution of 0.22° (25 km) for downscaling experiments over China. We simulated the daily maximum and minimum temperatures over the historical period (1979–2004) for the China region, using the CN05.1 dataset as observational data to validate the performance of the PRECIS simulations. Future temperature predictions for the periods 2021–2050 and 2070–2099 were made under the SSP245 and SSP585 scenarios.
PRECIS performs well in simulating the maximum and minimum temperatures over the China region, accurately reproducing their spatial distribution and showing good performance in simulating both cold and warm regions. However, there is a slight cold bias in the reproduction of maximum and minimum temperatures driven by the BCC-CSM2-MR, which could be attributed to the land surface modeling and cloud fraction schemes inherent to the BCC-CSM2-MR model [32,33]. Nevertheless, there is a noticeable improvement in results after downscaling with PRECIS. On an annual cycle scale, the simulation performance of PRECIS is superior to its driving GCM, particularly during cold months (i.e., December and from January to May), where the biases in simulating maximum and minimum temperatures are larger.
Regarding future changes, most regions’ daily extreme temperatures are projected to increase gradually over time. In the early 21st century, the warming magnitude is approximately 1.5 °C, reaching around 3 °C by the end of the century, with even higher warming magnitudes more than 4.5 °C under the SSP585 scenario. During the same period, the warming magnitude is greater under the SSP585 scenario compared to SSP245, indicating greenhouse gases as the primary driving factor for extreme temperature changes [34]. Northern regions experience greater warming magnitudes than southern regions, suggesting faster increases in extreme temperatures in higher latitudes, consistent with previous studies [35]. Seasonally, regardless of the scenario (SSP245 or SSP585), the increase in extreme temperatures is less pronounced in spring compared to other seasons. Analyzing changes in various subregions of China reveals that the northeastern region experiences more pronounced increases in extreme temperatures, especially in January, November, and December.
Supplementary Materials
The following supporting information can be downloaded at: https://www.mdpi.com/article/10.3390/su16073030/s1, Supplementary Materials: Figures S1–S6.
Author Contributions
Conceptualization and methodology, J.G.; validation, Y.W. and X.W.; writing, H.J. and W.L.; project administration, W.L. All authors have read and agreed to the published version of the manuscript.
Funding
This paper is supported by SGCC Science and Technology Project “Research on the Design and Quantitative Impact of the National Energy Rights Market Mechanism under the Transformation of Energy Consumption “Dual Control” to Carbon “Dual Control”” (SGZJDK00FZJS2310075).
Institutional Review Board Statement
Not applicable.
Informed Consent Statement
Not applicable.
Data Availability Statement
The sources of the open data used in this study are explained in the methodology section and are listed in the references.
Conflicts of Interest
The authors declare no conflict of interest.
References
- Ma, Y.; Li, H.; Qin, P.; Cheng, B.; Feng, F.; Zhang, Y.; Jiao, H. Extreme temperatures and circulatory mortality in a temperate continental monsoon climate city in Northeast China. Environ. Sci. Pollut. Res. 2023, 30, 21661–21670. [Google Scholar] [CrossRef] [PubMed]
- Meehl, G.A.; Karl, T.; Easterling, D.R.; Changnon, S.; Pielke, R., Jr.; Changnon, D.; Evans, J.; Groisman, P.Y.; Knutson, T.R.; Kunkel, K.E.; et al. An introduction to trends in extreme weather and climate events: Observations, socioeconomic impacts, terrestrial ecological impacts, and model projections. Bull. Am. Meteorol. Soc. 2000, 81, 413–416. [Google Scholar] [CrossRef]
- IPCC. Climate Change 2014: Synthesis Report. In Contribution of Working Groups I, II and III to the Fifth Assessment Report of the Intergovernmental Panel on Climate Change; Pachauri, R.K., Meyer, L.A., Eds.; IPCC: Geneva, Switzerland, 2014; p. 151. [Google Scholar]
- Cole, S. Fourth warmest year in continued warming trend, according to NASA. In NOAA News February 2018; NASA: Washington, DC, USA, 2019; Volume 6. [Google Scholar]
- Garg, T.; Gibson, M.; Sun, F. Extreme temperatures and time use in China. J. Econ. Behav. Organ. 2020, 180, 309–324. [Google Scholar] [CrossRef]
- Wu, Z.; Chen, Q. “General Mobilization” in Hubei Province to fight against snow and ice disaster. National Business Daily, 8 February 2024. [Google Scholar]
- Beijing Daily. 41.1 °C! June 22 High temperature broke the city in June historical extreme high temperature orange alert issued 23, 24 days may still reach 40 °C. Beijing Daily, 23 June 2023. [Google Scholar]
- Nayak, S.; Mandal, M.; Maity, S. Assessing the impact of Land-use and Land-cover changes on the climate over India using a Regional Climate Model (RegCM4). Clim. Res. 2021, 85, 1–20. [Google Scholar] [CrossRef]
- Trinh, T.Q. Modeling high-resolution precipitation by means of a regional climate model coupled with a machine learning algorithms: Application to Dong Nai-Sai Gon river watershed. AGU Fall Meet. Abstr. 2020, 2020, H165-0008. [Google Scholar]
- Rajbhandari, R.; Shrestha, A.B.; Kulkarni, A.; Patwardhan, S.K.; Bajracharya, S.R. Projected changes in climate over the Indus river basin using a high resolution regional climate model (PRECIS). Clim. Dyn. 2015, 44, 339–357. [Google Scholar] [CrossRef]
- Torabi, M.; Shokoohi, A. Extracting and Evaluating Future Intensity-Duration-Frequency Curves of the Present Century Using Dynamic Time and Space Down-Scaling (Case Study: Rasht City). Iran. J. Soil Water Res. 2023, 54, 429–440. [Google Scholar]
- Wang, X.; Guo, J.; Fenech, A.; Farooque, A.A. Future climate projections for Eastern Canada. Clim. Dyn. 2022, 59, 2735–2750. [Google Scholar] [CrossRef]
- Li, Y.; Chang, J.; Gao, X.; Zhang, L.; Wang, L.; Ren, C. A case study on the impacts of future climate change on soybean yield and countermeasures in Fujin city of Heilongjiang province, China. Front. Agron. 2024, 6, 1257830. [Google Scholar] [CrossRef]
- Lu, G.-H.; Xiao, H.; Wu, Z.-Y.; Zhang, S.-L.; Li, Y. Assessing the impacts of future climate change on hydrology in Huang-Huai-Hai region in China using the PRECIS and VIC models. J. Hydrol. Eng. 2013, 18, 1077–1087. [Google Scholar] [CrossRef]
- Zhang, M.; Guo, Z.-Y.; Dong, G.-T.; Tan, J.-G. Projected heat wave increasing trends over China based on combined dynamical and multiple statistical downscaling methods. Adv. Clim. Chang. Res. 2023, 14, 758–767. [Google Scholar] [CrossRef]
- Zhang, L.; Xu, Y.; Meng, C.; Li, X.; Liu, H.; Wang, C. Comparison of statistical and dynamic downscaling techniques in generating high-resolution temperatures in China from CMIP5 GCMs. J. Appl. Meteorol. Climatol. 2020, 59, 207–235. [Google Scholar] [CrossRef]
- Bowling, L.C.; Lettenmaier, D.P.; Nijssen, B.; Graham, L.; Clark, D.B.; El Maayar, M.; Essery, R.; Goers, S.; Gusev, Y.M.; Habets, F.; et al. Simulation of high-latitude hydrological processes in the Torne-Kalix basin: PILPS Phase 2 (e): 1: Experiment description and summary intercomparisons. Glob. Planet. Chang. 2003, 38, 1–30. [Google Scholar] [CrossRef]
- Cao, L.; Dong, W.; Xu, Y.; Zhang, Y.; Sparrow, M. Validating the runoff from the PRECIS model using a large-scale routing model. Adv. Atmos. Sci. 2007, 24, 855–862. [Google Scholar] [CrossRef]
- Rew, R.; Davis, G. NetCDF: An interface for scientific data access. IEEE Comput. Graph. Appl. 1990, 10, 76–82. [Google Scholar] [CrossRef]
- Nicholls, Z.; Lewis, J.; Makin, M.; Nattala, U.; Zhang, G.Z.; Mutch, S.J.; Tescari, E.; Meinshausen, M. Regionally aggregated, stitched and de-drifted CMIP-climate data, processed with netCDF-SCM v2. 0.0. Geosci. Data J. 2021, 8, 154–198. [Google Scholar] [CrossRef]
- Luo, Y.; Xu, C.; Chu, Z.; Sun, Q.; Chen, L. Application of CN05. 1 meteorological data in watershed hydrological simulation: A case study in the upper reaches of Kaidu River basin. Adv. Clim. Chang. Res. 2020, 16, 287. [Google Scholar]
- Luan, L.; Zhai, P. Changes in rainy season precipitation properties over the Qinghai-Tibet Plateau based on multi-source datasets. Adv. Clim. Chang. Res. 2023, 19, 173. [Google Scholar]
- Yang, L.; Liang, X.; Yin, J.; Xie, Y.; Fan, H. Evaluation of the Precipitation of the East Asia regional reanalysis system mainly over mainland China. Int. J. Climatol. 2023, 43, 1676–1692. [Google Scholar] [CrossRef]
- Xin, X.; Wu, T.; Zhang, J.; Li, W.; Zhang, Y.; Fang, Y.; Jie, W.; Zhang, L.; Shi, X.; Li, J.; et al. Introduction of BCC models and its participation in CMIP6. Adv. Clim. Chang. Res. 2019, 15, 533. [Google Scholar]
- Yu, E.; Sun, J.; Chen, H.; Xiang, W. Evaluation of a high-resolution historical simulation over China: Climatology and extremes. Clim. Dyn. 2014, 45, 2013–2031. [Google Scholar] [CrossRef]
- Wu, J.; Gao, X.J. A gridded daily observation dataset over China region and comparison with the other datasets. Chin. J. Geophys. 2013, 56, 1102–1111. (In Chinese) [Google Scholar]
- Guo, D.; Wang, H. Comparison of a very-fine-resolution GCM with RCM dynamical downscaling in simulating climate in China. Adv. Atmos. Sci. 2016, 33, 559–570. [Google Scholar] [CrossRef]
- Maraun, D. Bias Correction, Quantile Mapping, and Downscaling: Revisiting the Inflation Issue. J. Clim. 2013, 26, 2137–2143. [Google Scholar] [CrossRef]
- Cannon, A.J.; Sobie, S.R.; Murdock, T.Q. Bias Correction of GCM Precipitation by Quantile Mapping: How Well Do Methods Preserve Changes in Quantiles and Extremes? J. Clim. 2015, 28, 6938–6959. [Google Scholar] [CrossRef]
- Cannon, A.; Piani, C.; Sippel, S. Bias correction of climate model output for impact models. In Climate Extremes and Their Implications for Impact and Risk Assessment; Elsevier: Amsterdam, The Netherlands, 2020; pp. 77–104. [Google Scholar]
- Kusumastuti, C.; Jiang, Z.; Mehrotra, R.; Sharma, A. A signal processing approach to correct systematic bias in trend and variability in climate model simulations. Geophys. Res. Lett. 2021, 48, e2021GL092953. [Google Scholar] [CrossRef]
- Nie, S.; Fu, S.; Cao, W.; Jia, X. Comparison of monthly air and land surface temperature extremes simulated using CMIP5 and CMIP6 versions of the Beijing Climate Center climate model. Theor. Appl. Climatol. 2020, 140, 487–502. [Google Scholar] [CrossRef]
- Wu, T.; Lu, Y.; Fang, Y.; Xin, X.; Li, L.; Li, W.; Jie, W.; Zhang, J.; Liu, Y.; Zhang, L.; et al. The Beijing Climate Center climate system model (BCC-CSM): The main progress from CMIP5 to CMIP6. Geosci. Model Dev. 2019, 12, 1573–1600. [Google Scholar] [CrossRef]
- Xu, W.; Lin, T.; Lei, X.; Chen, Y.; Gao, L. Anthropogenic emissions and land use/cover change contributions to extreme temperature changes over China. Atmos. Res. 2023, 292, 106845. [Google Scholar] [CrossRef]
- Qiu, J.; Yang, X.; Cao, B.; Chen, Z.; Li, Y. Effects of urbanization on regional extreme-temperature changes in China, 1960–2016. Sustainability 2020, 12, 6560. [Google Scholar] [CrossRef]


Disclaimer/Publisher’s Note: The statements, opinions and data contained in all publications are solely those of the individual author(s) and contributor(s) and not of MDPI and/or the editor(s). MDPI and/or the editor(s) disclaim responsibility for any injury to people or property resulting from any ideas, methods, instructions or products referred to in the content. |
© 2024 by the authors. Licensee MDPI, Basel, Switzerland. This article is an open access article distributed under the terms and conditions of the Creative Commons Attribution (CC BY) license (https://creativecommons.org/licenses/by/4.0/).