Article

Predicting the Invasion Range of the Common Myna, Acridotheres tristis Linnaeus, 1766 in Egypt under Climate Change

1
Department of Zoology, Faculty of Science, Suez Canal University, Ismailia 41522, Egypt
2
Biotechnology Institute, Suez Canal University, Ismailia 41522, Egypt
3
Plant Protection Research Institute, Giza 12618, Egypt
4
Department of Zoology and Entomology, Faculty of Science (Boys), Al-Azhar University, Cairo 11884, Egypt
5
Department of Environmental Basic Sciences, Faculty of Graduate Studies and Environmental Research, Ain Shams University, Cairo 11566, Egypt
*
Author to whom correspondence should be addressed.
Sustainability 2024, 16(15), 6495; https://doi.org/10.3390/su16156495 (registering DOI)
Submission received: 31 May 2024 / Revised: 19 July 2024 / Accepted: 22 July 2024 / Published: 29 July 2024
(This article belongs to the Section Air, Climate Change and Sustainability)

Abstract

:
The common myna bird (Acridotheres tristis Linnaeus, 1766) is widely recognized as one of the most formidable invasive avian species globally. The bird poses significant challenges due to its ability to outcompete a variety of native cavity-nesting birds. Additionally, the common myna is a notable agricultural pest and a substantial threat to indigenous biodiversity. The current study is focused on understanding the distribution pattern of the common myna (Acridotheres tristis Linnaeus, 1766) in Egypt and the significant favorable conditions to predict the invasion scale of the bird to the Egyptian fauna. To determine the environmental variables influencing the invasion range of the common myna in Egypt, a Species Distribution Model (SDM) was employed. The current work documented 117 invasion sites of the species from February to December 2023. The predicted habitats are mainly concentrated close to the Nile Delta of Egypt, the Suez Canal region, North and South Sinai, in addition to scattered areas on the Red Sea coast, along the riverbanks of Upper Egypt, in addition to a few northwestern areas of the Western Desert. The most significant environmental factors affecting the establishment were the Minimum Temperature of the Coldest Month, the Mean Temperature of the Coldest Quarter, and Elevation. The current invaded areas comprise about 0.8% of Egypt (8240 km2 out of roughly one million km2). We found that this is significant and of concern due to the expectation of increasingly favourable conditions due to global warming; this will turn this invasive species into a real threat to Egyptian ecosystems due to its aggressive competition with native cavity-nesting birds, its impact as an agricultural pest, and its potential to disrupt local biodiversity.

1. Introduction

Climate change and Invasive Alien Species (IAS) are considered two of the biggest challenges to biodiversity and the provision of essential ecosystem services [1]. IAS is a group of non-native species that negatively affect the environment or society [2] by outcompeting important native species or preying on them; they often limit already scarce resources of food and water. Invasive species can also drastically alter the composition and structure of communities [3].
Climate change is expected to have a significant impact on IAS dynamics globally, as it can encourage their establishment and spread through Changing temperature, humidity, rainfall, and drought [4]. Warmer air and water temperatures may also make it easier for species to spread along previously unreachable natural and man-made routes [1]. This can present new opportunities for them to become invasive, while native species are likely to shift their geographic ranges into new territories. In addition, natural ecosystems have become less resilient to biological invasions as a result of climate change [4]. The interaction dynamics of invasive species and climate change range from global patterns to patterns at local sites and species populations, and they are not exclusive to any one region or habitat [1].
The common myna (Acridotheres tristis Linnaeus, 1766) is considered one of the worst invasive bird species in the world due to its capacity to outcompete numerous native cavity-nesting species, as well as its role as an agricultural nuisance and threat to native biodiversity [5]. The typical flight distance of common mynas is only three kilometers, and they are primarily sedentary [6]. In urban or semi-urban settings, it is frequently found thriving close to people [7].
The Myna, which is native to Southeast Asia and India, is renowned for its capacity to spread across new lands and endure a variety of environmental challenges. It spreads rapidly, reaching even arid regions [8]. Its range is currently growing worldwide, and according to the Global Invasive Species Database, the International Union for Conservation of Nature (IUCN) named it one of the “100 World’s Worst Invasive Alien Species” [9].
The Myna is recorded in several regions in the Middle East, including Palestine, Turkey [10], Lebanon [11], Israel [12], Egypt [13], Jordan [14], Gaza [15], and the West Bank [16]. This invasive bird was originally noted in Egypt in 1998 at Ain Sukhna. From 2008 to 2010, records were found in numerous areas around North Sinai [13].
The Myna has a significant ecological and economic threat in non-native regions. As an invasive bird species, it engages in aggressive competition with indigenous avian populations for essential resources such as food sources and nesting sites. This competitive dynamic can result in the decline of native bird populations, as the myna often succeeds in displacing them from their established habitats [17]. Also, it is known to engage in aggressive behaviors that disrupt the reproductive success of native avian populations. This includes the eviction of indigenous birds from their nests, the destruction of eggs, and the killing of chicks in order to take over nesting sites [18]. The Myna exhibits a generalist feeding strategy, taking advantage of a wide variety of food sources. This opportunistic approach allows the myna to exploit a range of prey, from insects and small invertebrates to reptiles and the nestlings or fledglings of other bird species. The myna’s adaptability and lack of specialized feeding requirements enable it to outcompete and displace native species that may have more specialized dietary needs [19]. The common myna, due to its adaptability and widespread distribution, can harbor and transmit a variety of pathogens and parasites. These can include viral, bacterial, and parasitic agents that may be detrimental to the health of native wildlife species, as well as zoonotic diseases that can potentially impact human populations. The myna’s ability to thrive in close proximity to human settlements increases the risk of disease transmission between the invasive bird and both wildlife and human communities [20]. The common myna’s aggressive and opportunistic behavior allows it to outcompete and displace native bird species from their ecological niches. This displacement can lead to a shift in the relative abundances and diversity of the local avian community, potentially resulting in the decline or extirpation of certain indigenous species [21].
The common myna is known to target and consume a wide range of agricultural crops, including fruits, vegetables, and cereal grains. The myna’s opportunistic feeding behavior and ability to thrive in close proximity to human settlements allow it to exploit these valuable food sources, often causing significant damage to the crops. This crop damage can translate into substantial economic losses for farmers, as the reduced yields and quality of the affected produce can directly impact their livelihoods and profitability [22].
In addition to the structural damage caused by their nesting behaviors, the common myna droppings can also have a detrimental impact on the appearance and condition of buildings and monuments. The accumulation of myna excrement can lead to the defacement of these structures, necessitating frequent cleaning and restoration efforts to maintain their aesthetic and historical value [19]. The presence of the common myna in popular tourist destinations can have a detrimental impact on the natural beauty and biodiversity that often attract visitors to these locations. Furthermore, the damage caused by the myna to historical sites and monuments can negatively affect cultural tourism, leading to broader economic consequences [23]. The implementation of control and management strategies to address the invasive myna population requires substantial financial resources. Local governments and conservation organizations tasked with mitigating the myna’s impacts often face significant financial burdens associated with the various control methods employed, including trapping, poisoning, and habitat modification [24].
Therefore, the myna poses a substantial threat to Egypt’s ecosystems and economy. Its impact on native species, agricultural productivity, infrastructure, and tourism necessitates the development and implementation of effective management strategies. Ongoing research and monitoring are crucial to mitigate the negative effects of this invasive species and protect Egypt’s biodiversity and economic interests.
The novelty of this study is that it is the first study on the dynamics of the early distribution of common myna in Egypt. We attempt to predict the potential expansion of Myna in Egypt and the expected new habitat expansion and describe the anthropogenic drivers of this expansion. The Species Distribution Model systems (SDMs) were employed for this purpose. SDMs are typically helpful in assisting regulatory decision-making and providing information for setting priorities for management actions [14,25]. Occurrence data were used to train the model we provide here. We included factors such as human landscape modifications and significant Egypt-specific climate variables.
Using the SMDs, the current study aims to shed light on the drawbacks of global warming and the climatic changes that affect the invasion range scenarios of birds. The changes in the ecological systems and the species response to the changes under different climatic variations were estimated. A monitoring study will be designed, and a seasonal survey for the invasive common myna in different types of habitats in Egypt is proposed to identify the environmental variables for the study areas.

2. Materials and Methods
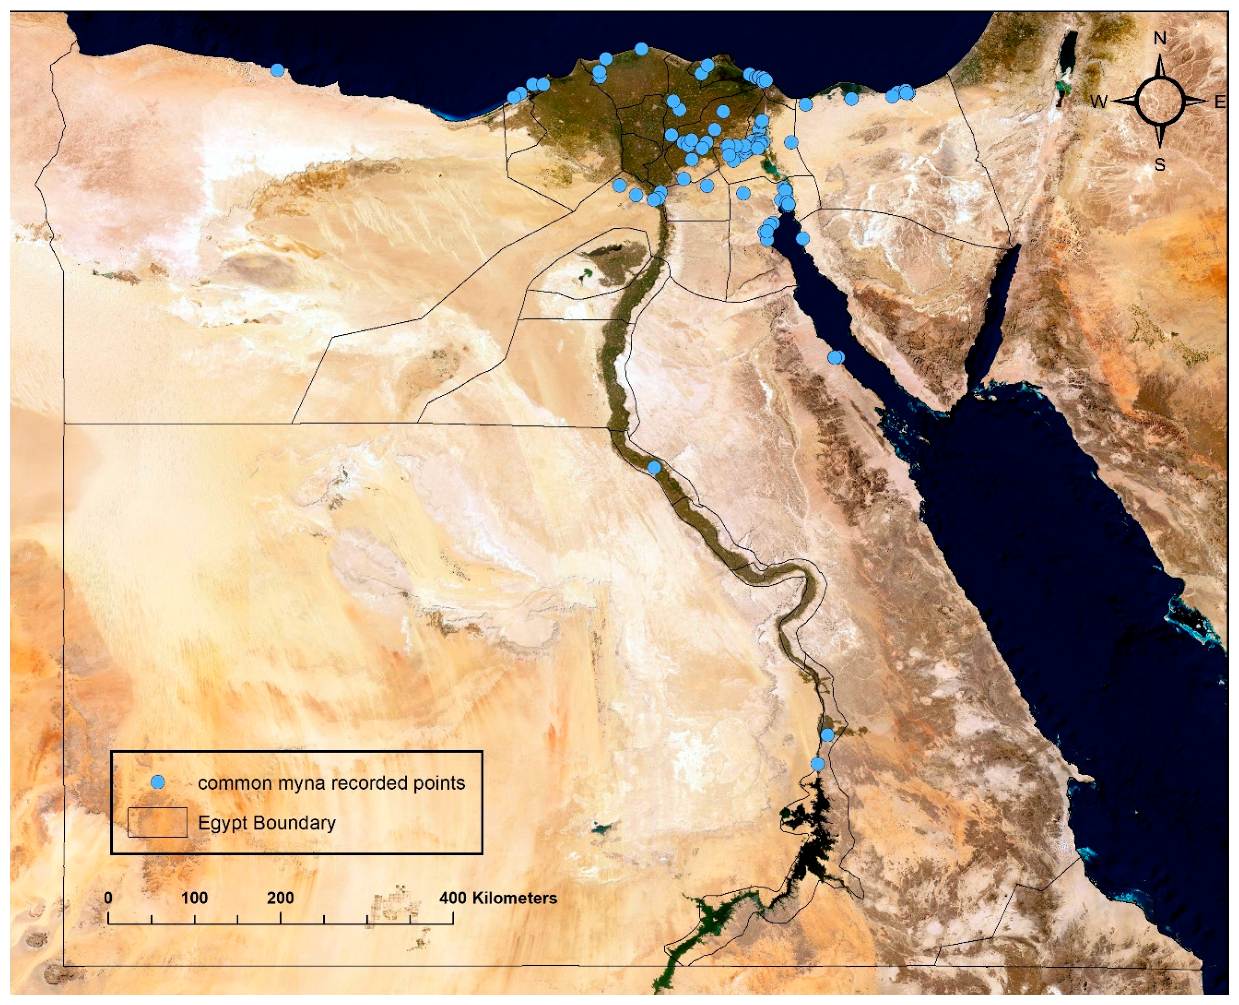
2.1. Study Area

The current study covers several localities in Egypt. The chosen monitoring locations for common myna (Acridotheres tristis Linnaeus, 1766) were Cairo, Giza, Alexandria, Matrouh, Dakahlia, Port Said, Damietta, Ismailia, Suez, Sharqia, Kafr El Sheikh, Red Sea coast, Asyut, and Aswan, in addition to north and south Sinai (Figure 1). Monthly surveys were carried out between February 2023 to December 2023. In total, 117 sites of invasion for common myna in Egypt were surveyed.

2.2. Mapping and Environmental Data Selection

Potentially expected distributions of common myna in some localities of Egypt were modeled using the MaxEnt 3.4.4 program (the Center for Biodiversity and Conservation at the American Museum of Natural History (AMNH) with the default parameters (one replicate, maximum number background points equal to 10,000, one regularization multiplier. A 25% random test percentage, replicated run type of cross-validation, and one replicate) [26]. For the study region, MaxEnt software (version 3.4.4.) employs layers of environmental factors such as climatic and topographic factors in addition to presence points [27].
MaxEnt can be used to analyze the habitat needs of species [28], the effects of future climate change on the distribution of species [29], the monitoring of species invasions [30,31], and the importance of protected areas [32]. The selection of environmental factors primarily considers how to limit the spread of species and how spatial correlations between variables are affected [33]. The present study chooses suitable climatic and topographic variables for modeling the distribution of common myna [34,35].
The World Climatic database was used to download 19 standard bioclimatic variables in addition to altitude with 2.5-min spatial resolutions for the current and future conditions [36] (Table 1). BCC-CSM2-MR: A Medium-resolution version of the Beijing Climate Center Climate System Model was used for future prediction of the suitable areas for common myna from 2021 to 2100 under the scenarios of SSP126 and SSP585. The use of a medium-resolution climate model can provide a suitable balance between spatial resolution and computational efficiency, making it a viable choice for regional-scale studies, such as modeling species distributions in Egypt [19].
BCC-CSM2-MR is powered by Shared Socioeconomic Pathways (SSPs) to generate a range of new emission scenarios [37]. The Beijing Climate Center (BCC) Climate System Model is a comprehensive climate modeling framework that has gained recognition for its robust representation of a wide range of climate processes and their intricate interactions. This level of detail is crucial for accurately projecting future climate scenarios and understanding their potential impacts on the distribution and habitat suitability of various species [22]. In contrast to SSP585, which envisions a social economy centered on fossil fuels and heavy energy usage, SSP126 depicts a society that transitions to sustainable development [38]. The inclusion of SSP126 and SSP585 Scenarios allows the model to assess how varying climate scenarios might influence the future distribution of the common myna in Egypt.
Additionally, the FAO Soils Portal’s database was used to retrieve the soil type data set for the study area [39]. Furthermore, the Global Human Settlement layers and the Degree of Urbanization Settlement Model Grid (SMOD) were downloaded from the global urban region dataset belonging to The NASA Socioeconomic Data and Application Centre (SEDAC) [40]. The MODIS Land Cover Type Product (MCD12Q1) was used to map the study area’s land cover [41].
Finally, air quality parameters, including the Aerosol Index (AI), Methane (CH4), Carbon Monoxide (CO), Formaldehyde (HCHO), Nitrogen Dioxide (NO2), Ozone (O3), and Sulfur Dioxide (SO2), were downloaded as raster layers for the study area from ESA Sentinel-5P precursor/TROPOMI imagery at 10 m resolution (https://apps.sentinel-hub.com/eo-browser/) (accessed on 8 July 2023)” [42].
The common myna distribution points (csv format) were converted into raster data using ArcGIS 10.3. Using the Spatial Analyst tool in the ArcGIS toolbox, the attribute values of the 33 environmental variables for common myna were then retrieved. Then, the environment variable layer format needed to be transformed to the ASCII format required by the Maxent software.
Recent method was followed to determine the extent of the contribution of the MaxEnt model [43]; using the internal jackknife test followed by computation of pairwise correlations and then removing variables with a Pearson’s correlation with r > 0.75 to mitigate the effects of multi-collinearity and over-fitting. Therefore, only 10 variables (including Mean Diurnal Range, Temperature Seasonality, Minimum Temperature of Coldest Month, Mean Temperature of Coldest Quarter, Precipitation Seasonality, Precipitation of Warmest Quarter, elevation, soil type, landcover, and the Global Human Settlement layers Degree of Urbanization Settlement Model Grid (SMOD) were eventually utilized on the basis of their jackknife variable contribution, and multicollinearity.
Mean Diurnal Range, Temperature Seasonality, Minimum Temperature of oldest Month, Mean Temperature of Coldest Quarter, Precipitation Seasonality, and Precipitation of Warmest Quarter were chosen to capture the climatic conditions influencing the distribution and habitat suitability of the common myna [17,21].
Elevation is a key factor that influences the local climate and weather patterns. As elevation increases, there is a general trend of decreasing temperature and increasing precipitation. This altitudinal gradient creates diverse microclimate conditions, which can vary significantly over relatively short distances [18]. Also, the characteristics of the soil and land cover in a given area are important factors that can influence the distribution and habitat suitability for various species [19]. Furthermore, the process of urbanization and the associated changes in land use and habitat characteristics can have significant impacts on the distribution and population dynamics of certain species, such as the common myna [24].
According to [43], the habitat distribution of common myna was classified into four levels: (0–5%) unsuitable presence, (6–35%) poorly suitable presence, (36–70%) moderately suitable presence, and (71–100%) highly suitable presence.

3. Model Validation

In the context of species distribution modeling, two important methods for assessing model performance and robustness are the Area Under the Receiver Operating Characteristic Curve (AUC) and cross-validation techniques [20]. The Area Under the Receiver Operating Characteristic Curve (AUC) is a commonly employed metric for assessing the performance of binary classification models, which are frequently utilized in species distribution modeling. This metric quantifies the model’s capability to differentiate between presence and absence data points, with values ranging from 0 to 1. An AUC score of 0.5 signifies that the model’s performance is no better than random guessing, while a value of 1 indicates perfect discrimination. Notably, AUC is a threshold-independent measure, meaning it evaluates the model’s performance across all possible thresholds for classifying a data point as either presence or absence. Higher AUC values are indicative of superior model performance and enhanced ability to accurately predict the distribution of the species under investigation [22]. Cross-validation assesses the model’s performance by partitioning the records into training and testing sets multiple times, ensuring a more reliable estimate of its ability to generalize to new, unseen instances [44].

4. Result

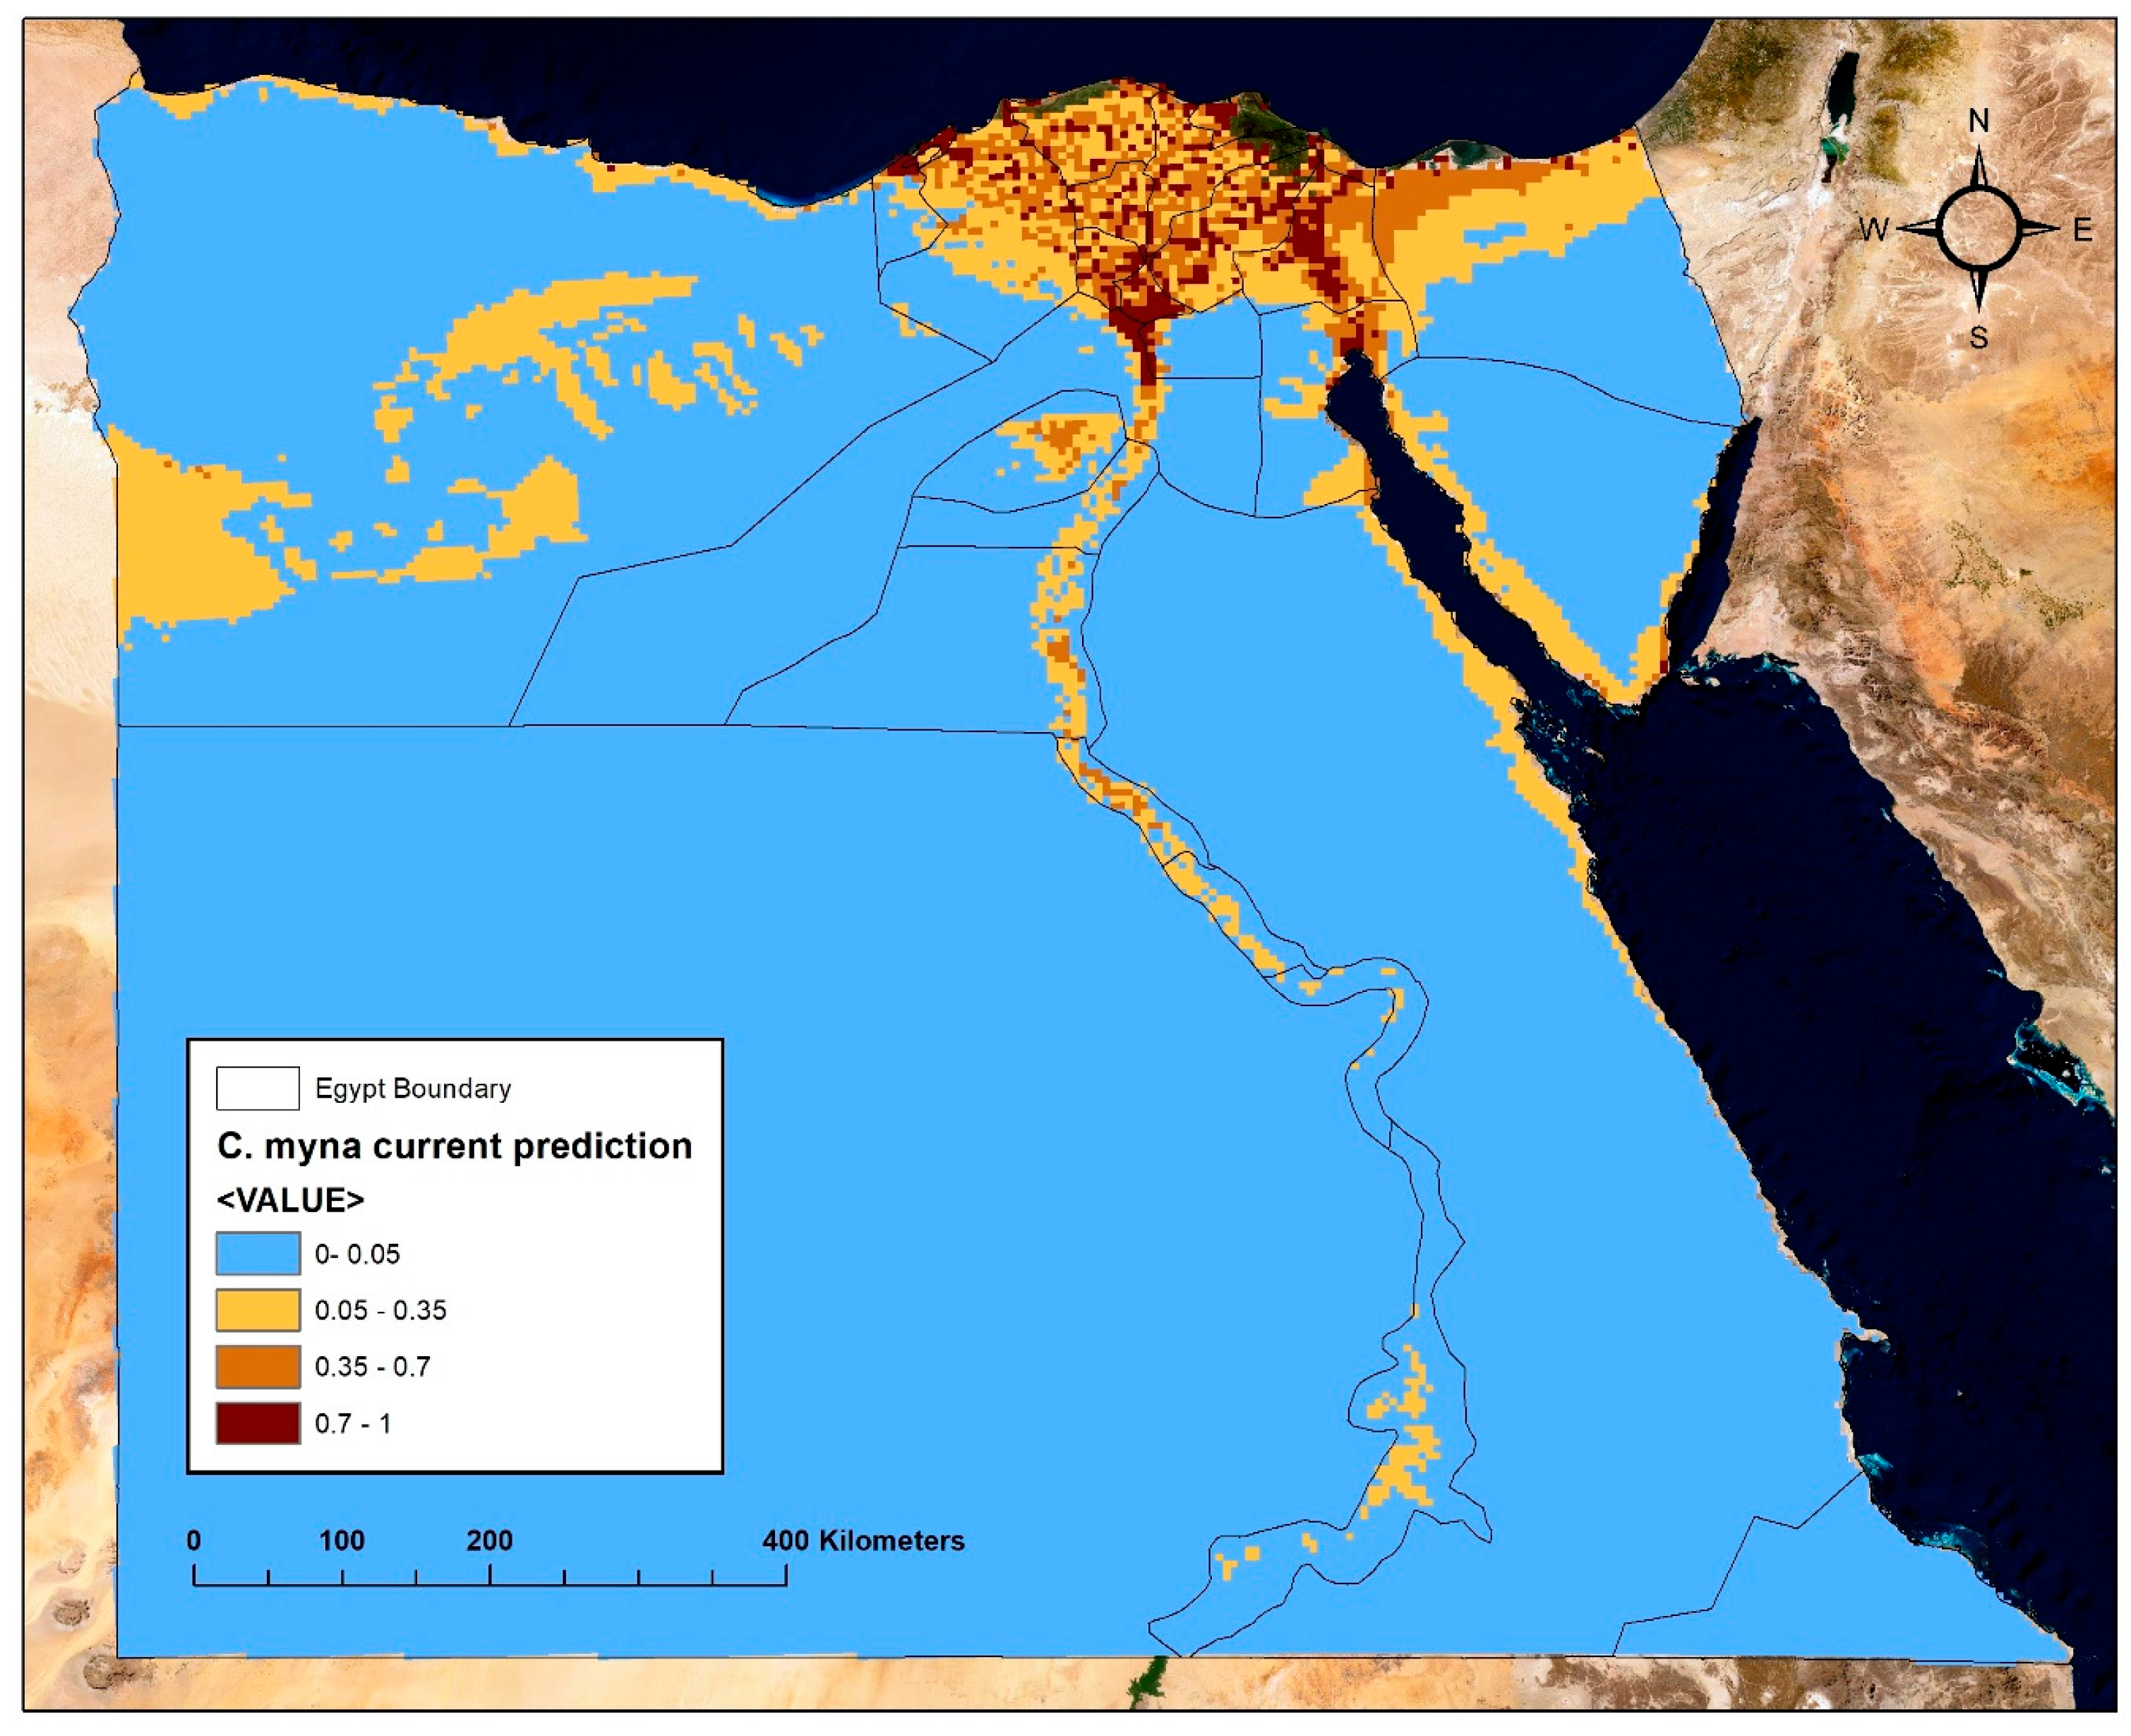
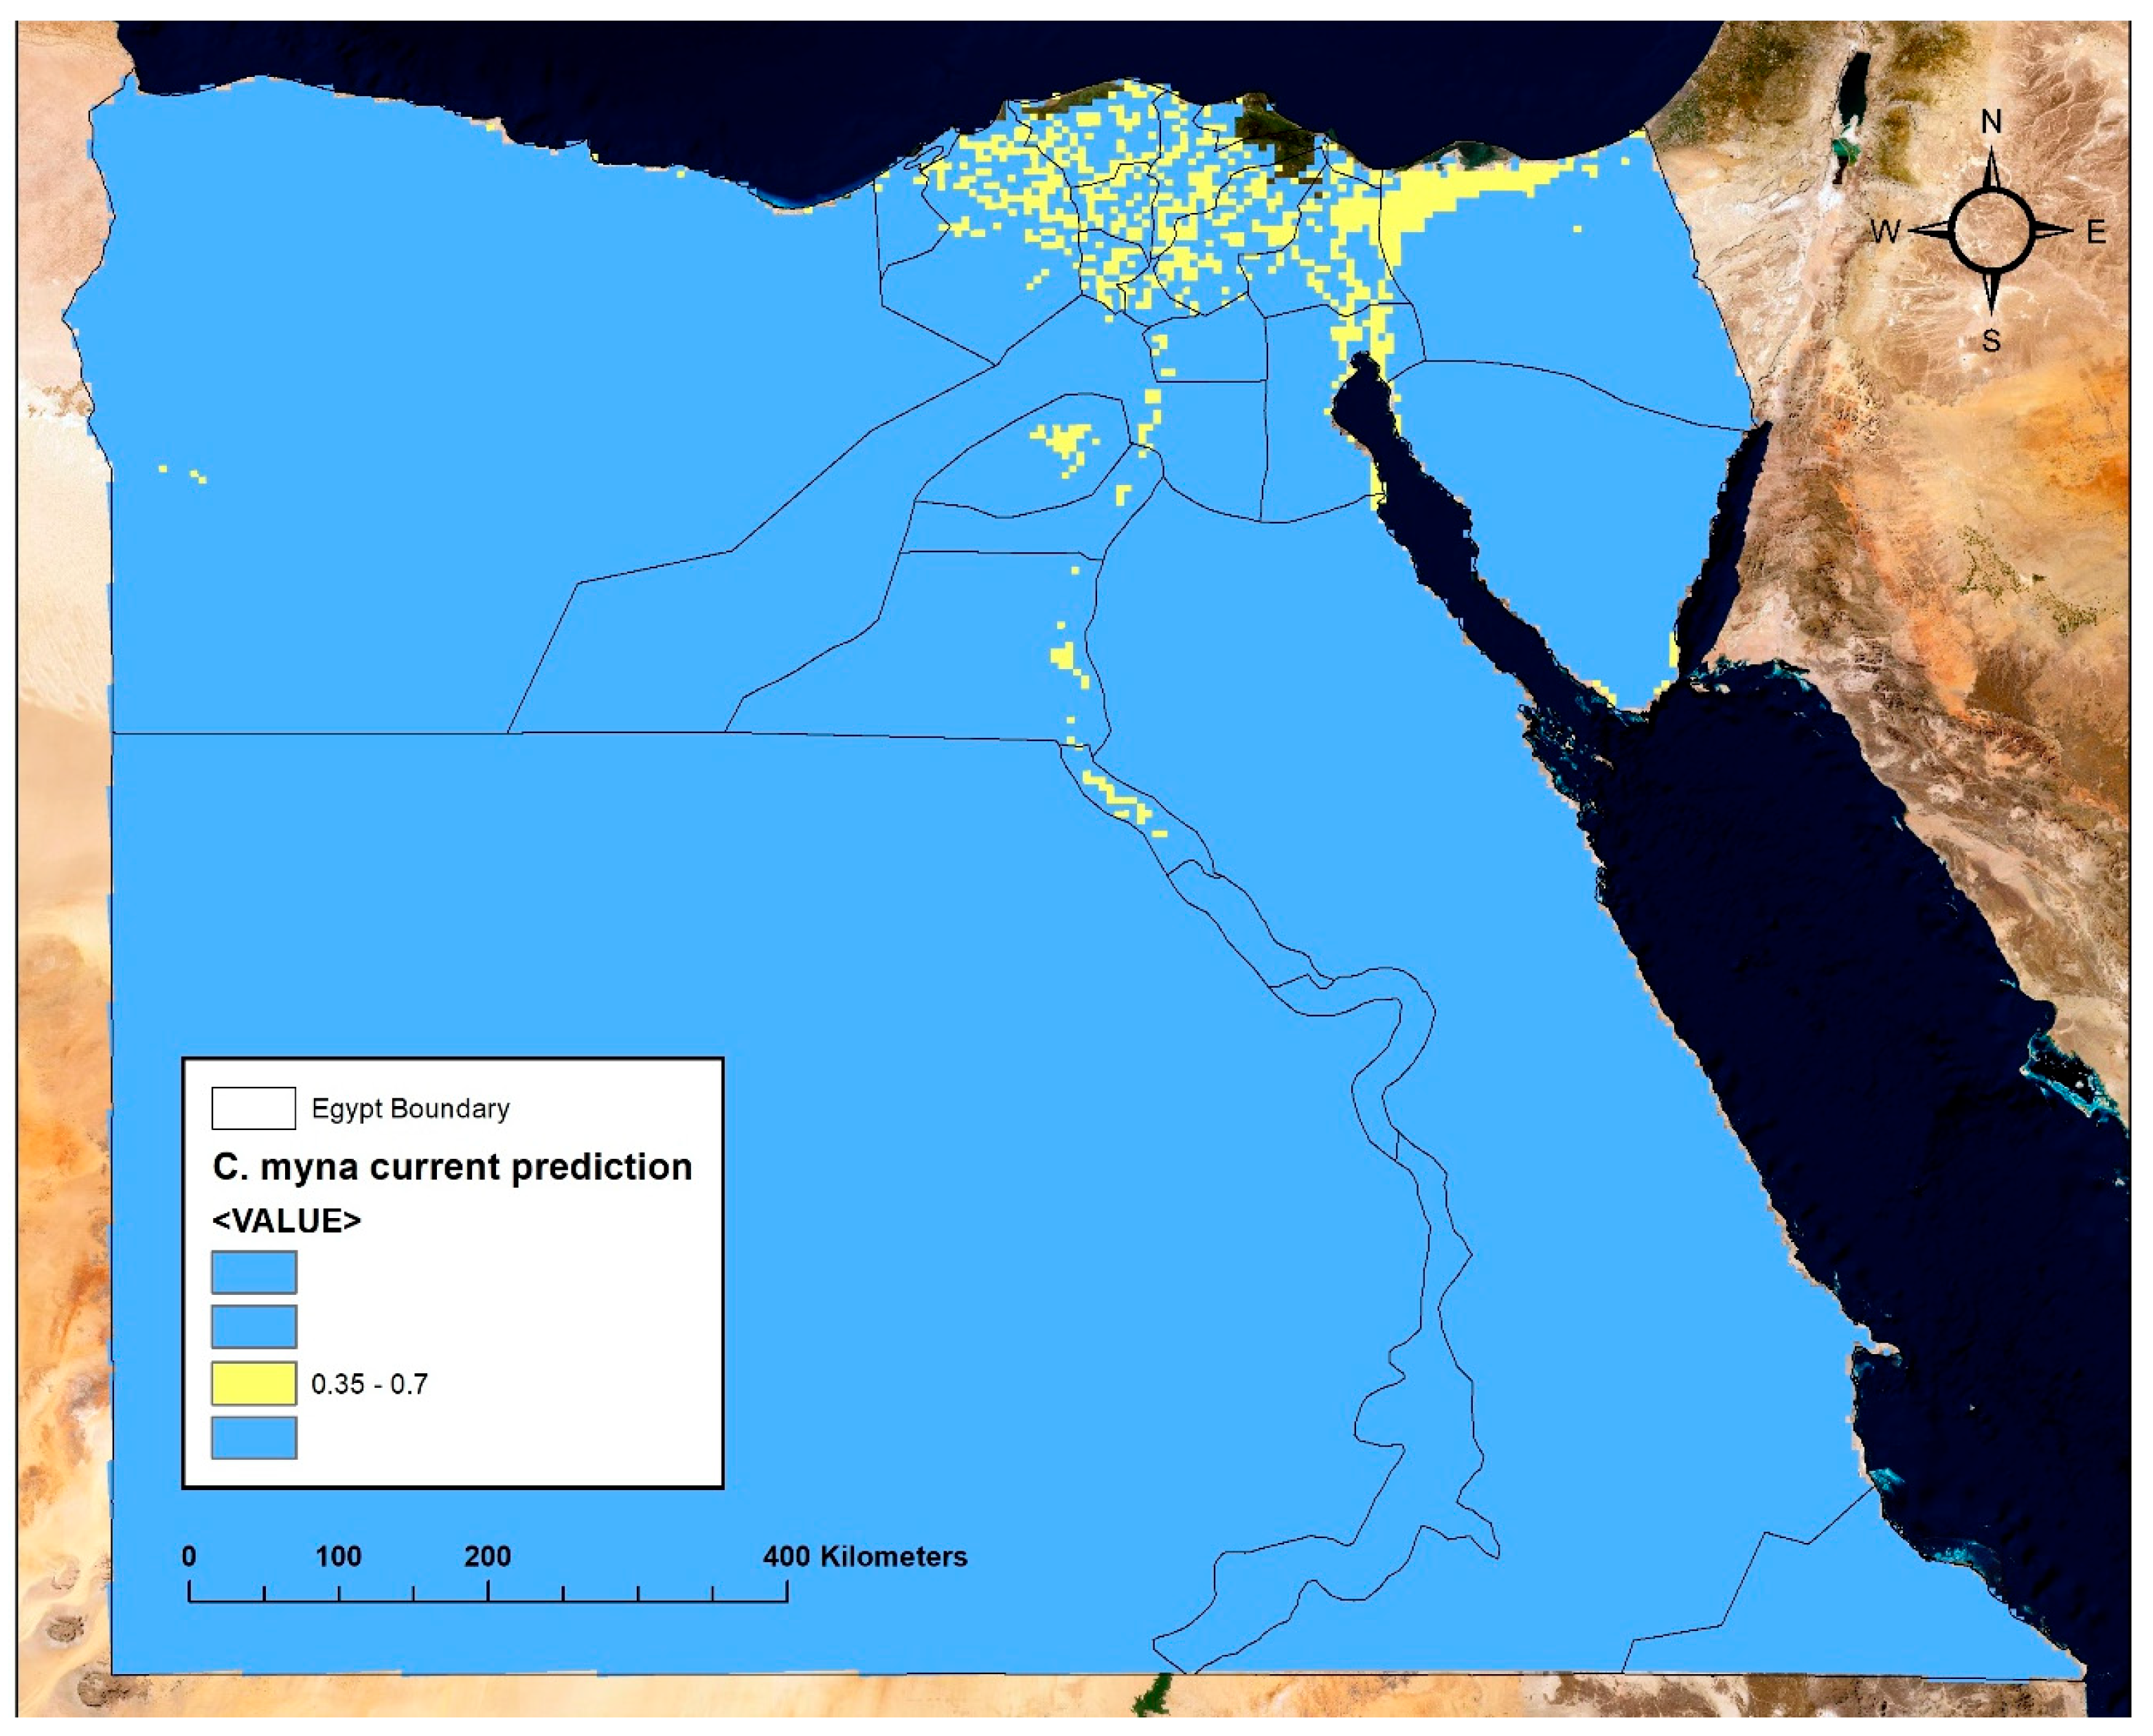
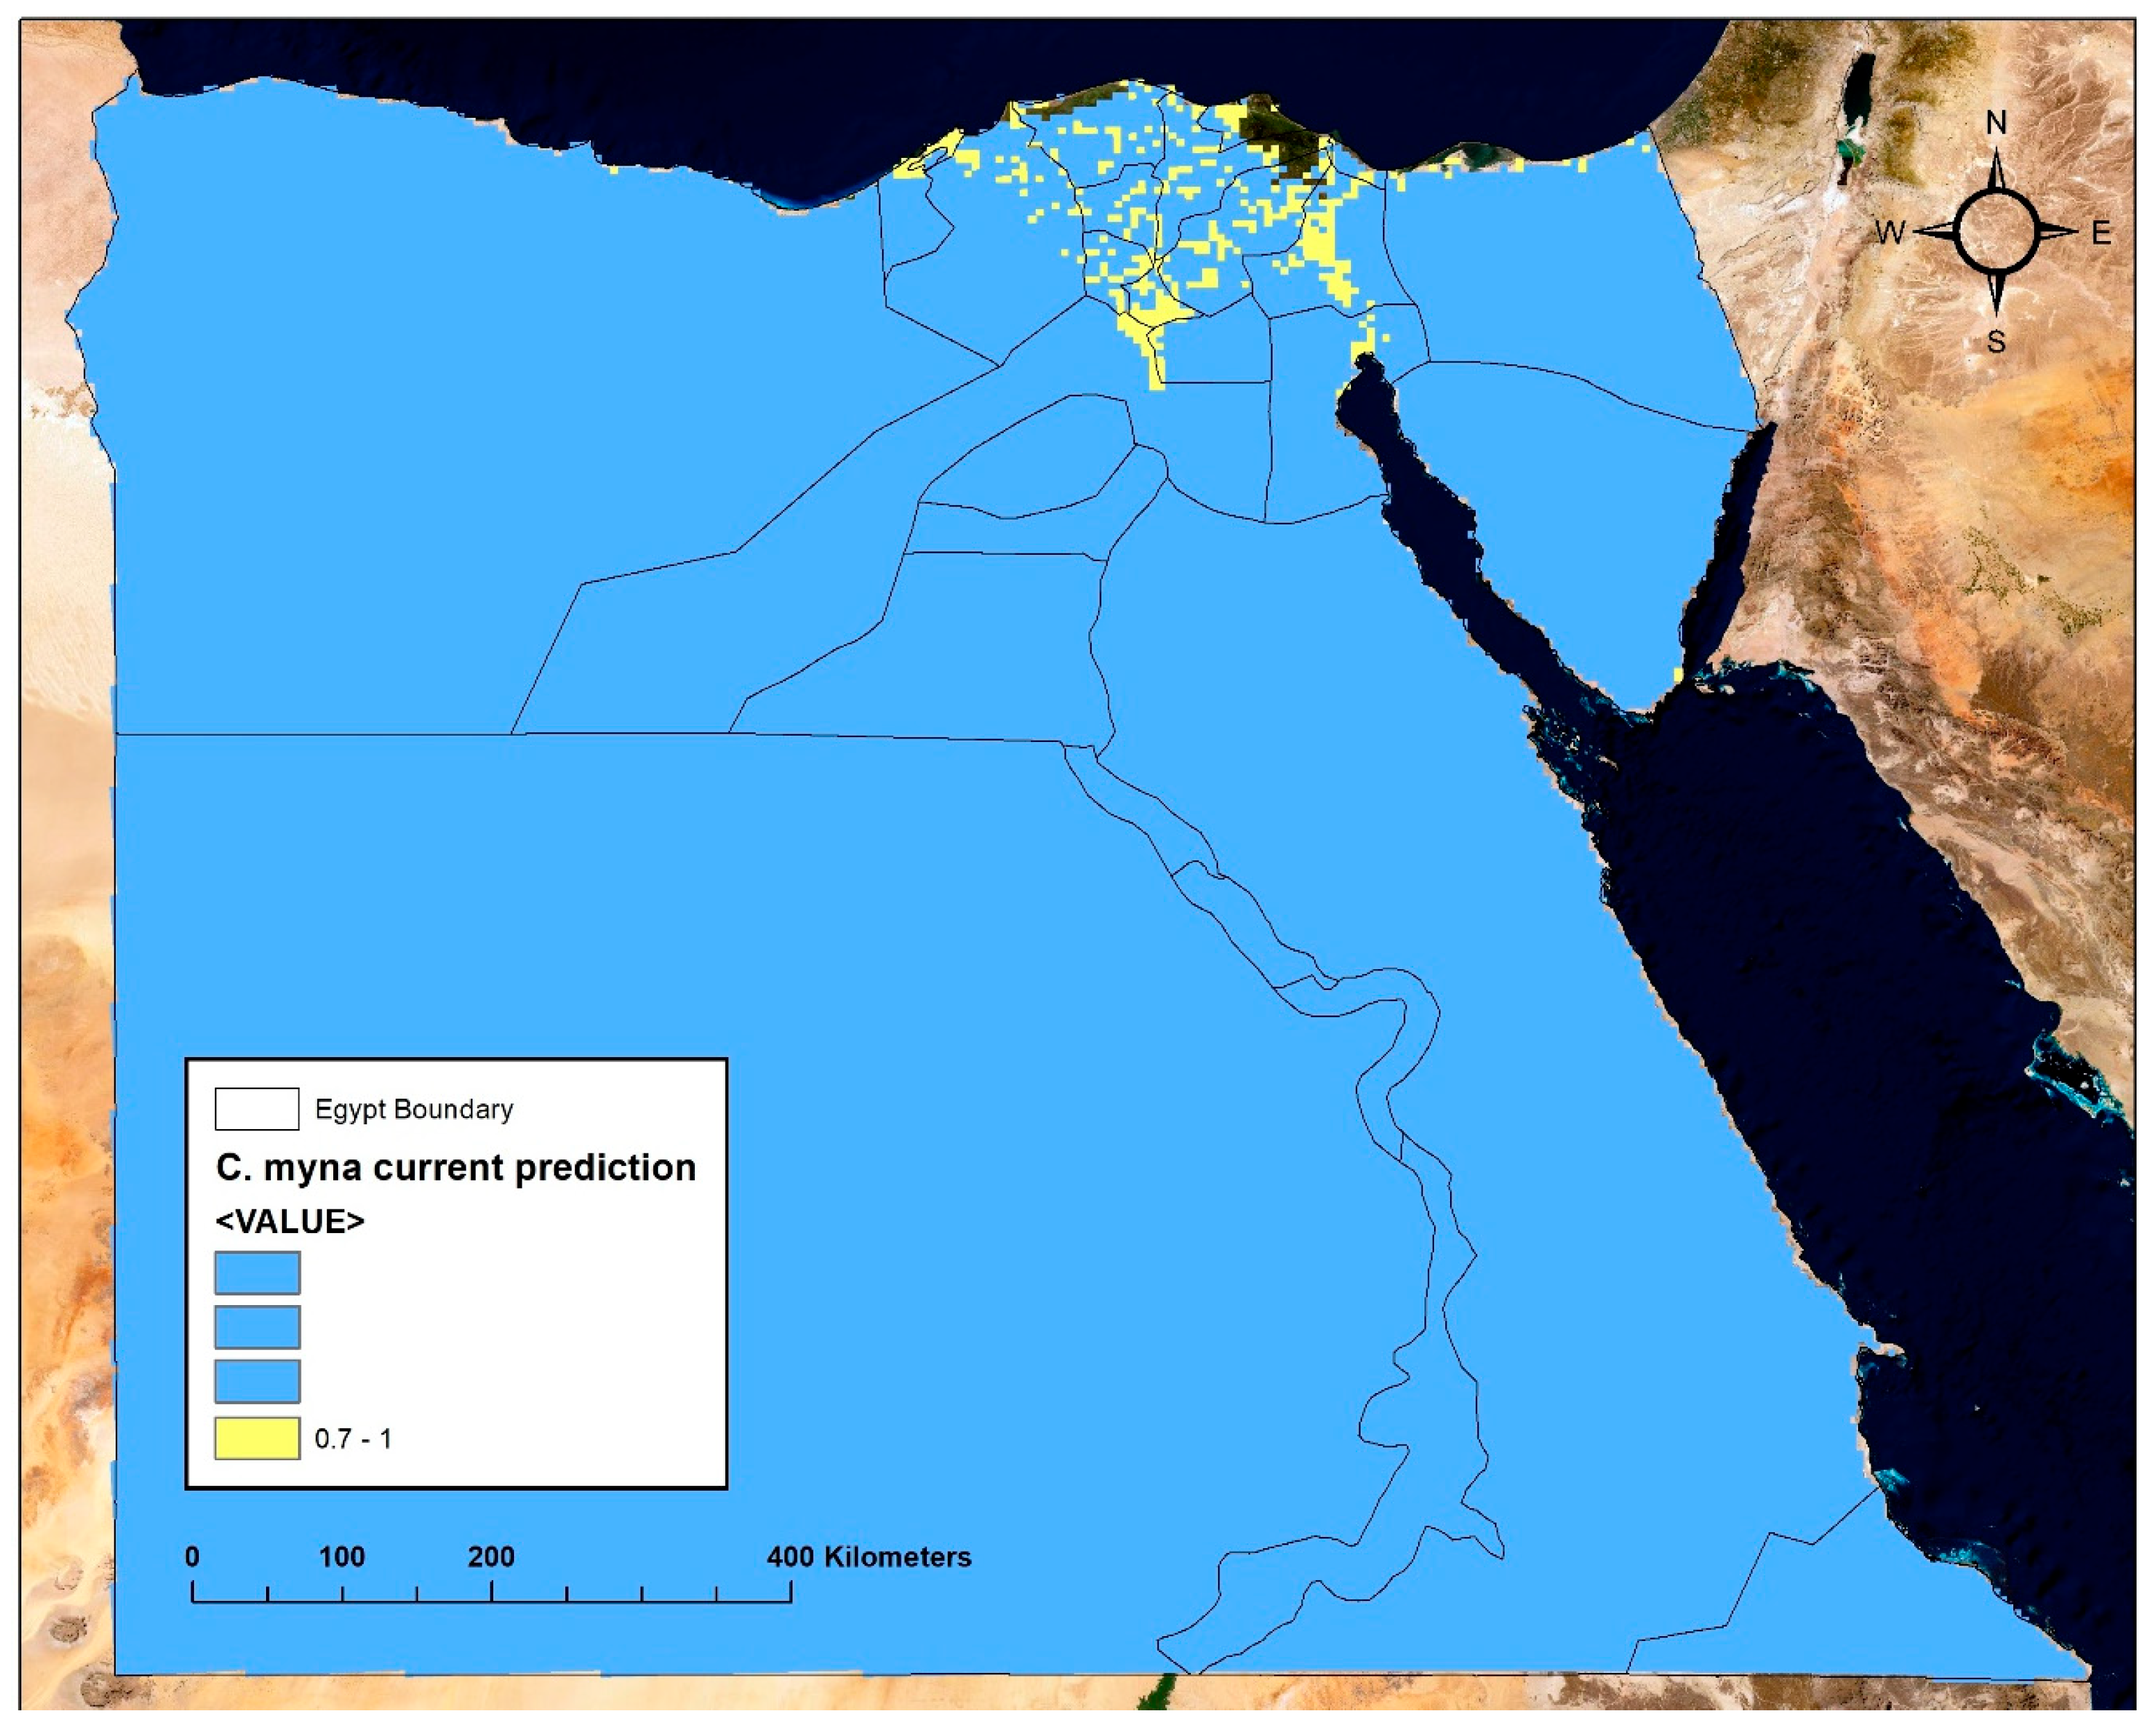
4.1. Spatial Prediction Model of Common Myna in Egypt under Current Conditions

The ecological niche model (=SDM) for common myna is shown in (Figure 2). The predicted distribution habitat of the bird is mainly concentrated in some localities close to the Nile Delta of Egypt, the Suez Canal region, North Sinai, some regions on the Red Sea coast, some regions overlooking the course of the Nile River in upper Egypt, some areas in the western desert north region, in addition to some areas in south Sinai. The Area Under the Curve (AUC) for the training points was 0.976, and for the test, points were 0.958, with a standard deviation of 0.015. The AUC value indicates excellent discrimination for common myna. The minimum training presence among training points was 0.002, while the fractional predicted area was 0.390, and the omission rate for test points was zero.

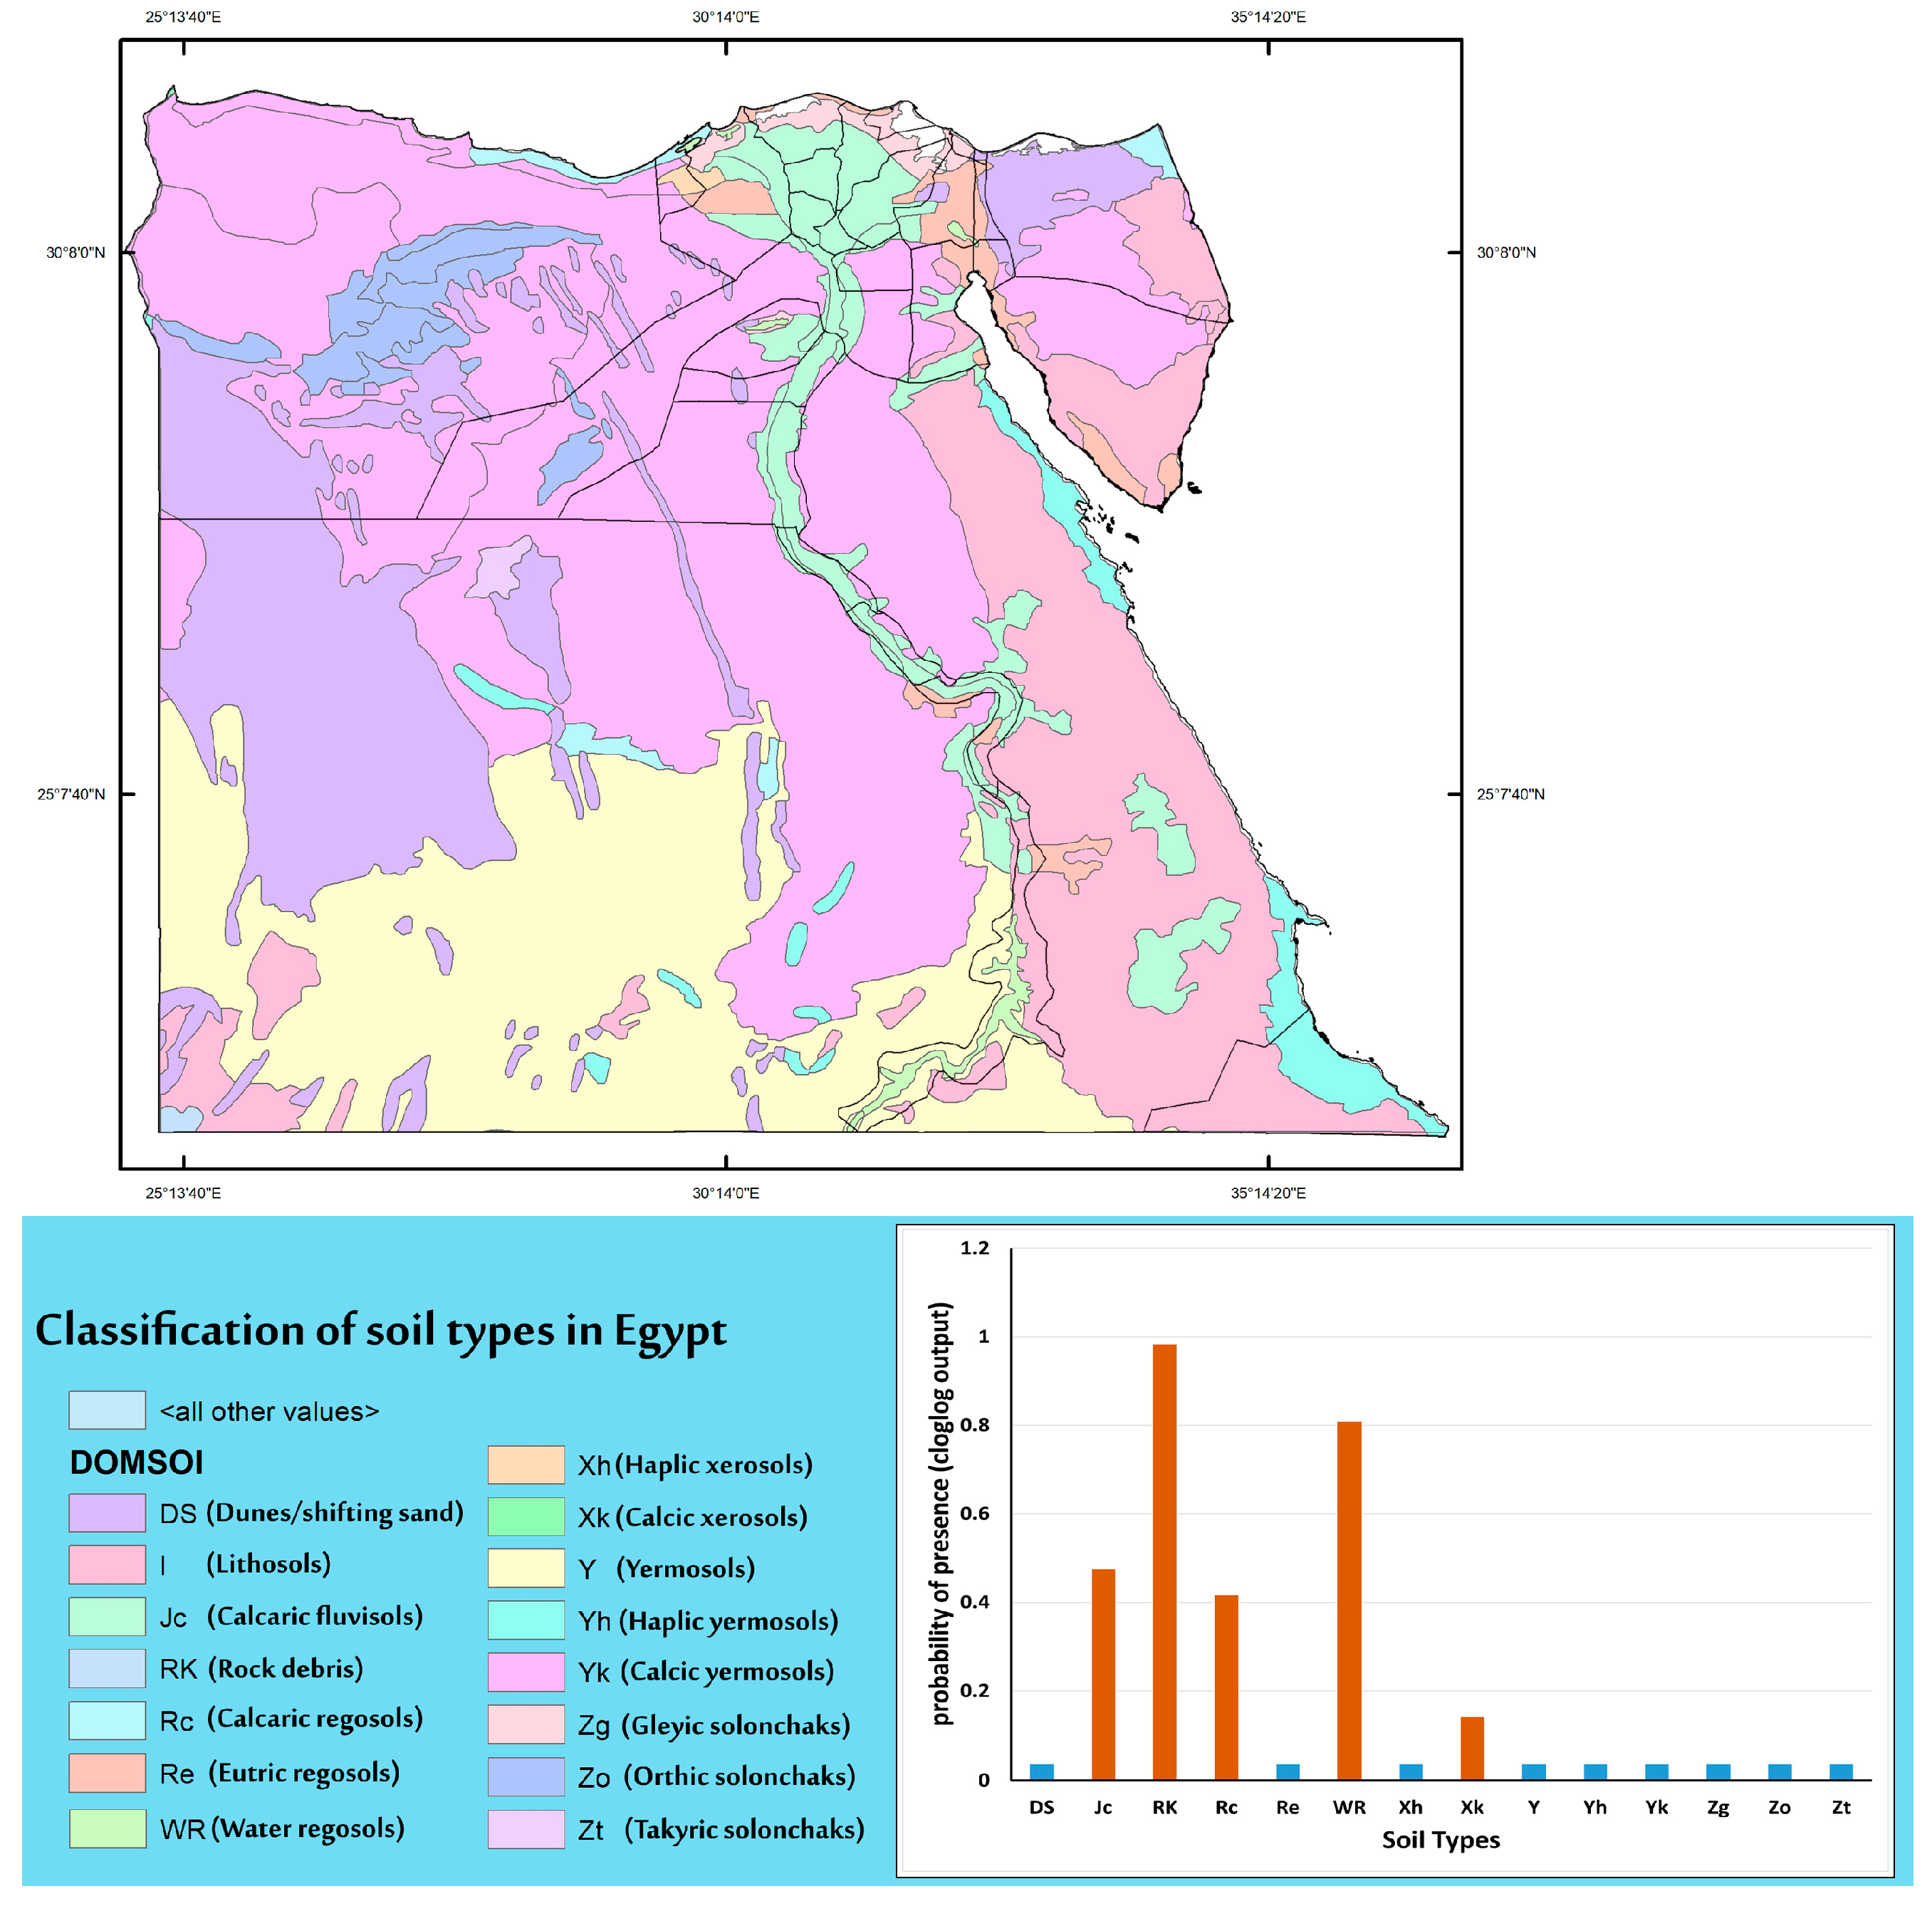
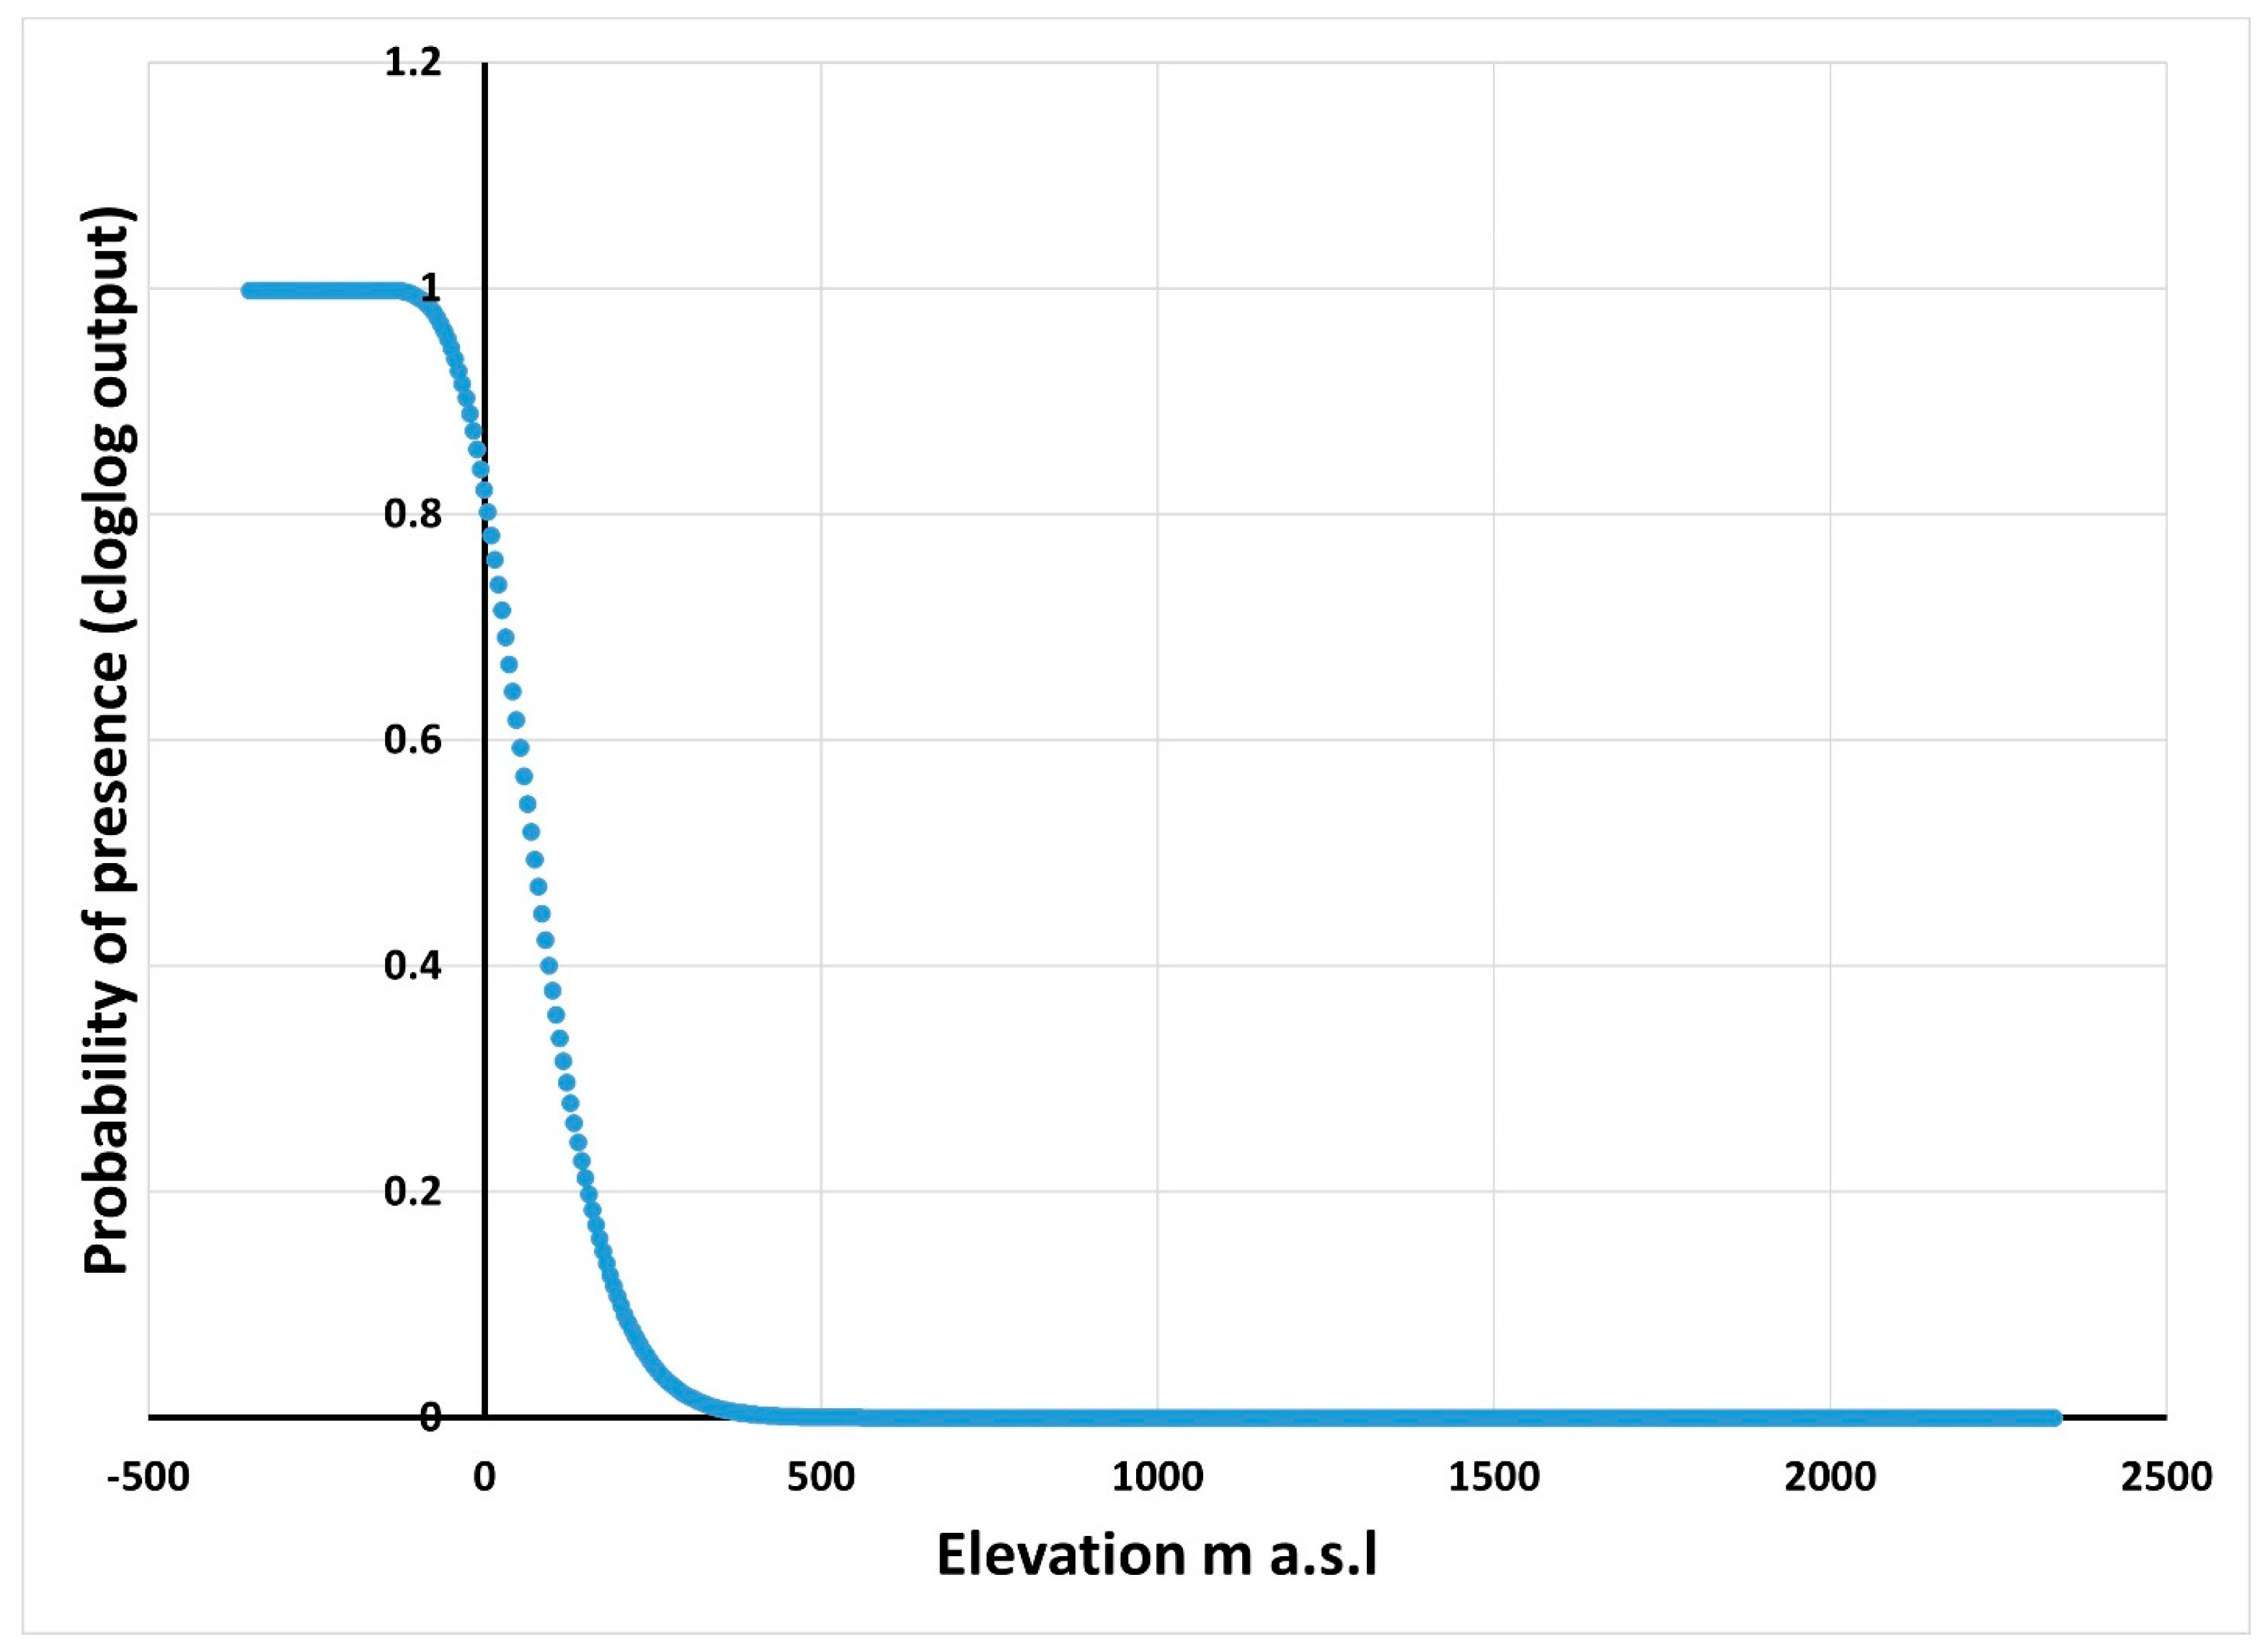
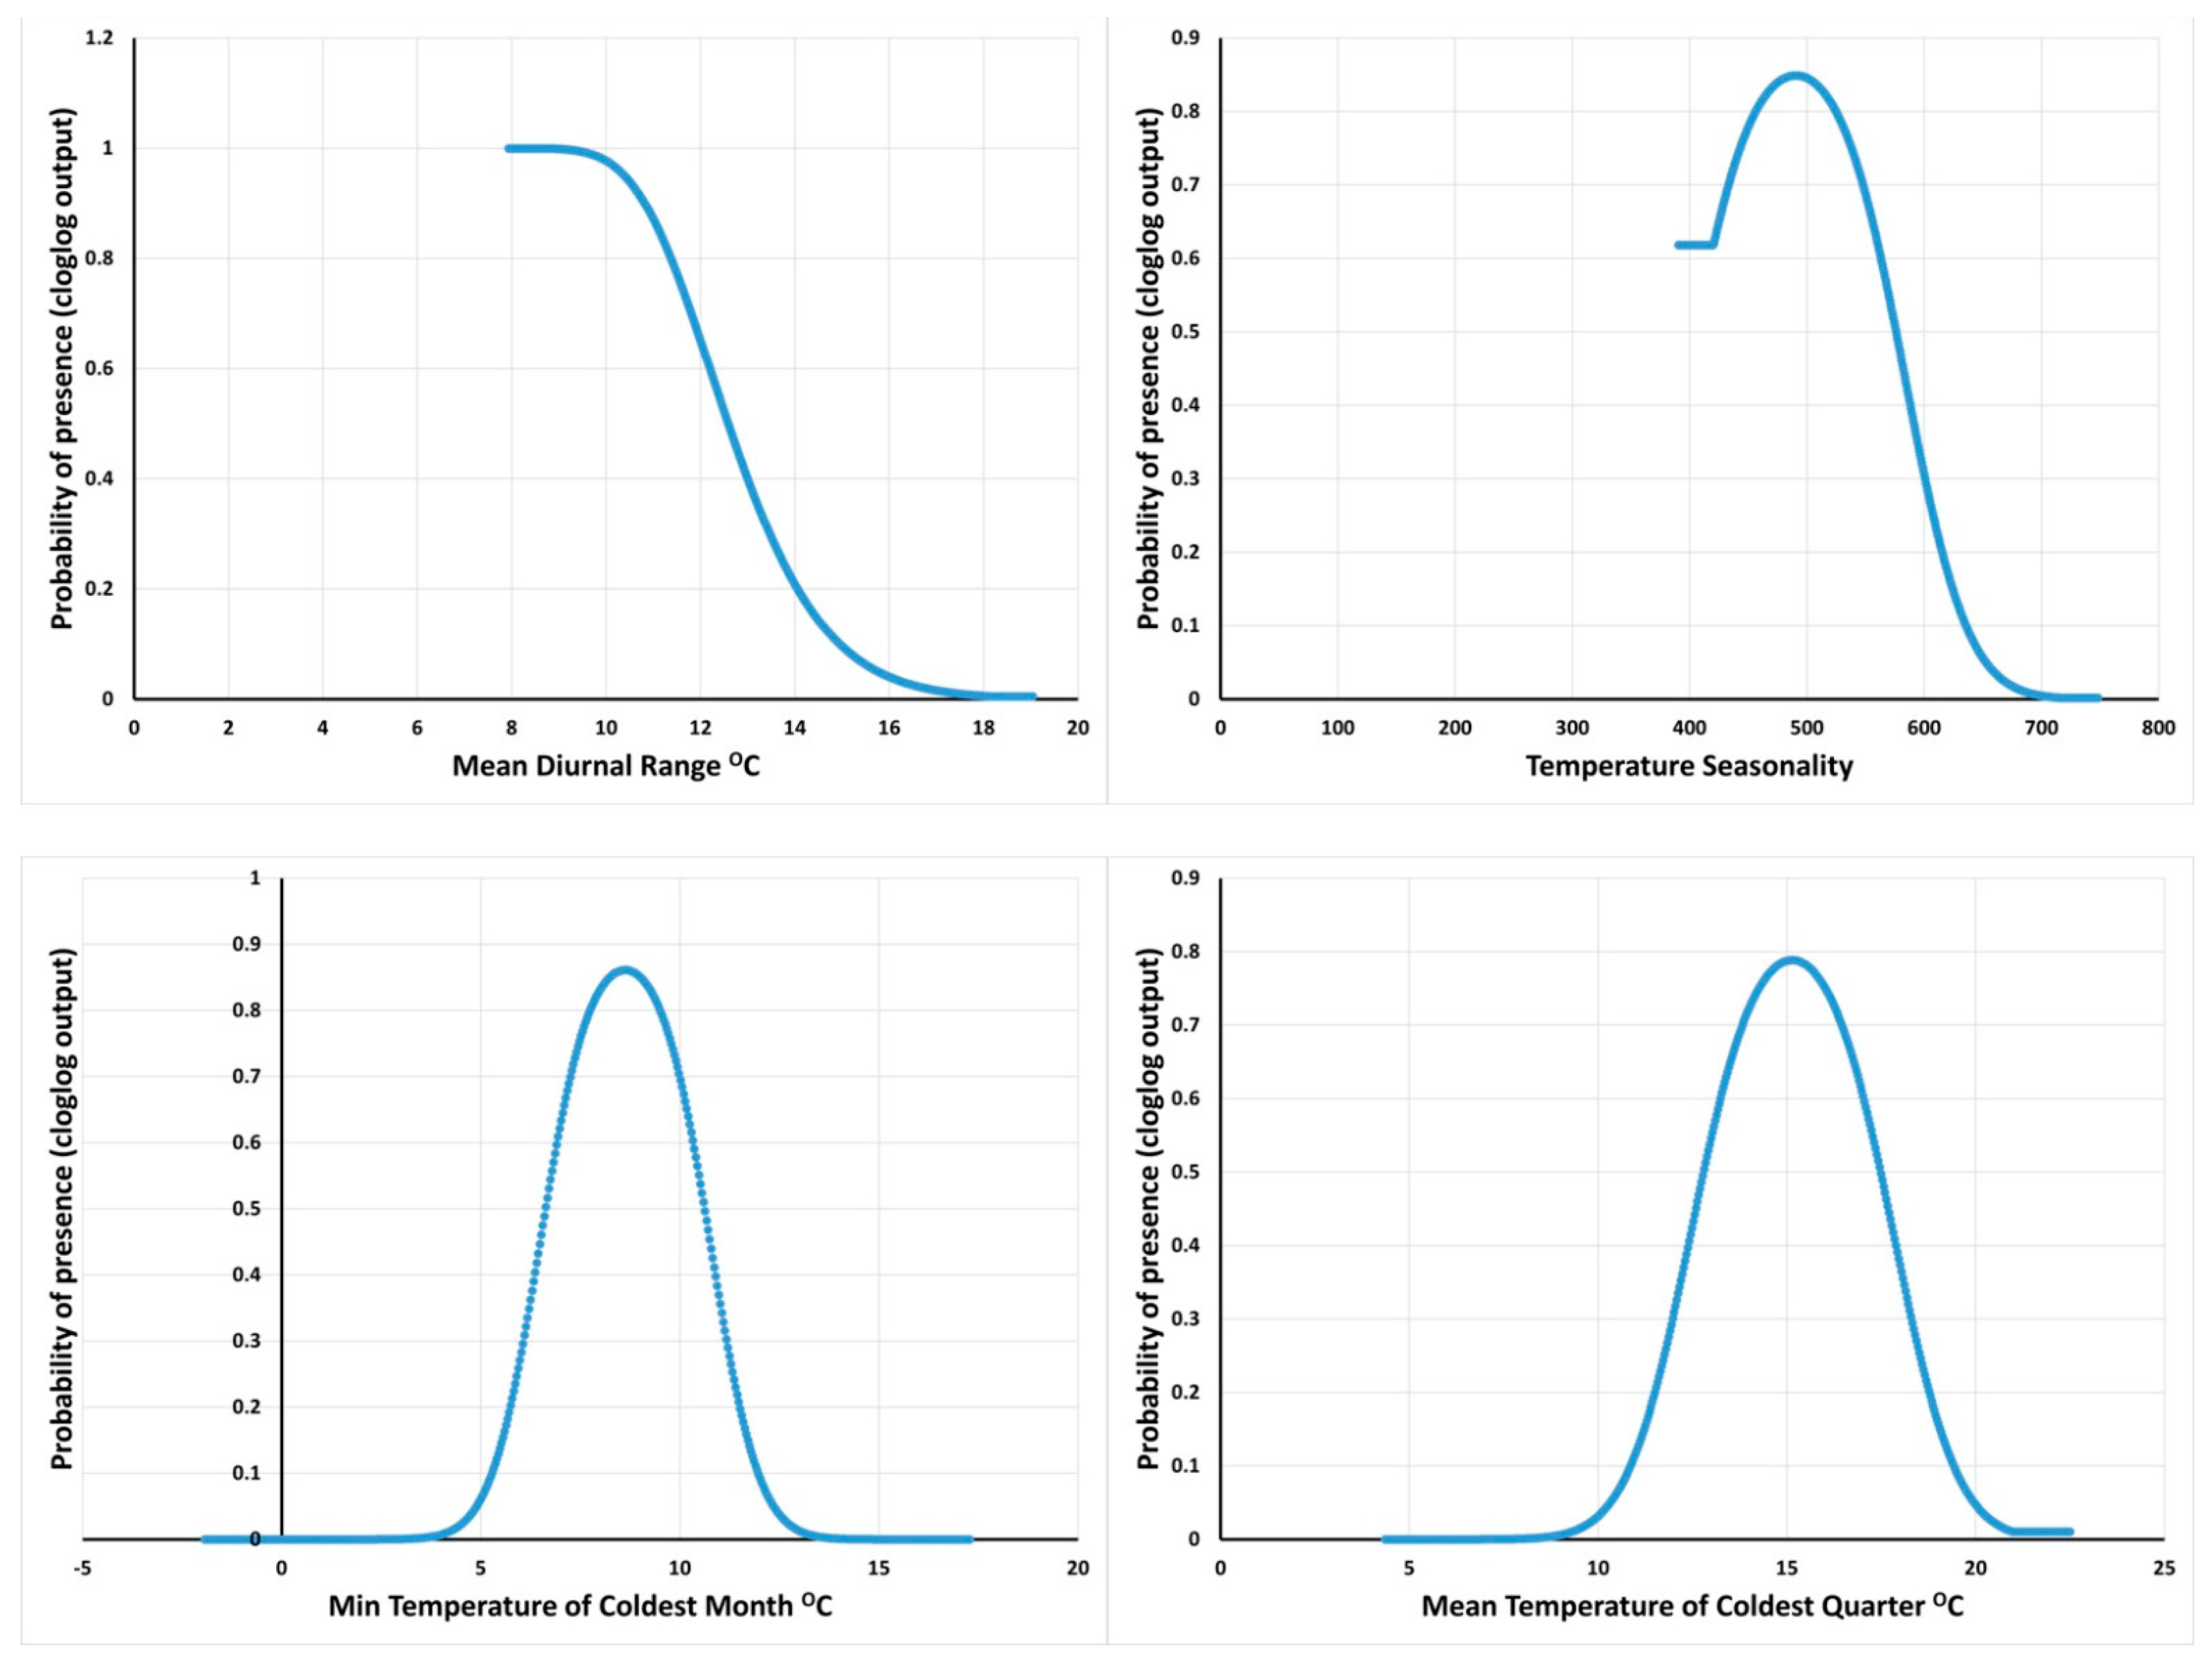
4.2. The Effect of Environmental Variables on Species Distribution Model of Common Myna in Egypt under Current Conditions

The environmental variables with the highest contribution value were the Degree of Urbanization Settlement Model Grid (SMD), Soil Types, Temperature Seasonality, and Mean Diurnal Range (Figure 3, Figure 4, Figure 5, Figure 6 and Figure 7). Considering the outputs of permutation importance, the Minimum Temperature of the Coldest Month, Mean Temperature of the Coldest Quarter, and Elevation were the environmental variables that affected the predicted habitats of common myna in Egypt (Table 2).
The suitable habitats of common myna in Egypt were concentrated in two urbanization categories (Figure 3): high-density urban cluster (has at least 50,000 inhabitants in the cluster) followed by low-density rural cluster (with a density of at least 50 inhabitants per square km).
The most suitable soil types for common myna (Figure 4) were Rock debris (RK), Calcaric regosols (Rc), Water regosols (WR), Calcaric fluvisols (Jc), and Calcic aerosols (Xk).
The response curves of the environmental variables that have affected the predicted habitats of common myna are shown in (Figure 5 and Figure 6). The suitable elevation range of common myna was −124 to 2109 ma.s.l; while estimating the probabilities of temperature variables, Bio2 varied from 8.5 to 18.2 °C, whereas Bio4 varied from 419.2 to 718.1. Additionally, Bio6 for common myna was −0.3 to15.9 °C, whereas Bio11 varied from 5.9 to 21 °C.
The common myna prefers to live in areas of croplands/natural vegetation, urban and build-up lands, and open shrubland (Figure 7).
Areas of the potential current distribution for common myna are shown in (Table 3). Out of 997,387.7 km2 of the total area of Egypt, common myna’s potential unsuitable areas equate to 902,673.1 km2 (90.5% of the total area). With a focus on moderately suitable habitat (0.36–0.70) (Figure 8), habitat suitability for common myna is 16,971.8 km2 (1.7% of the total area). While, in the Highly suitable habitat level (0.71–1.0) (Figure 9), highly habitat suitability for common myna is 8240.5 km2 (0.8% of the total area, which is a significant space for the invasion of common myna).
Under the current environmental conditions, the common myna distribution center in Egypt is in the west of the Fayoum governorate (Figure 14). This is due to the observed distribution pattern of Myna, as the distribution center is in the radius of the total spread circle in Egypt.

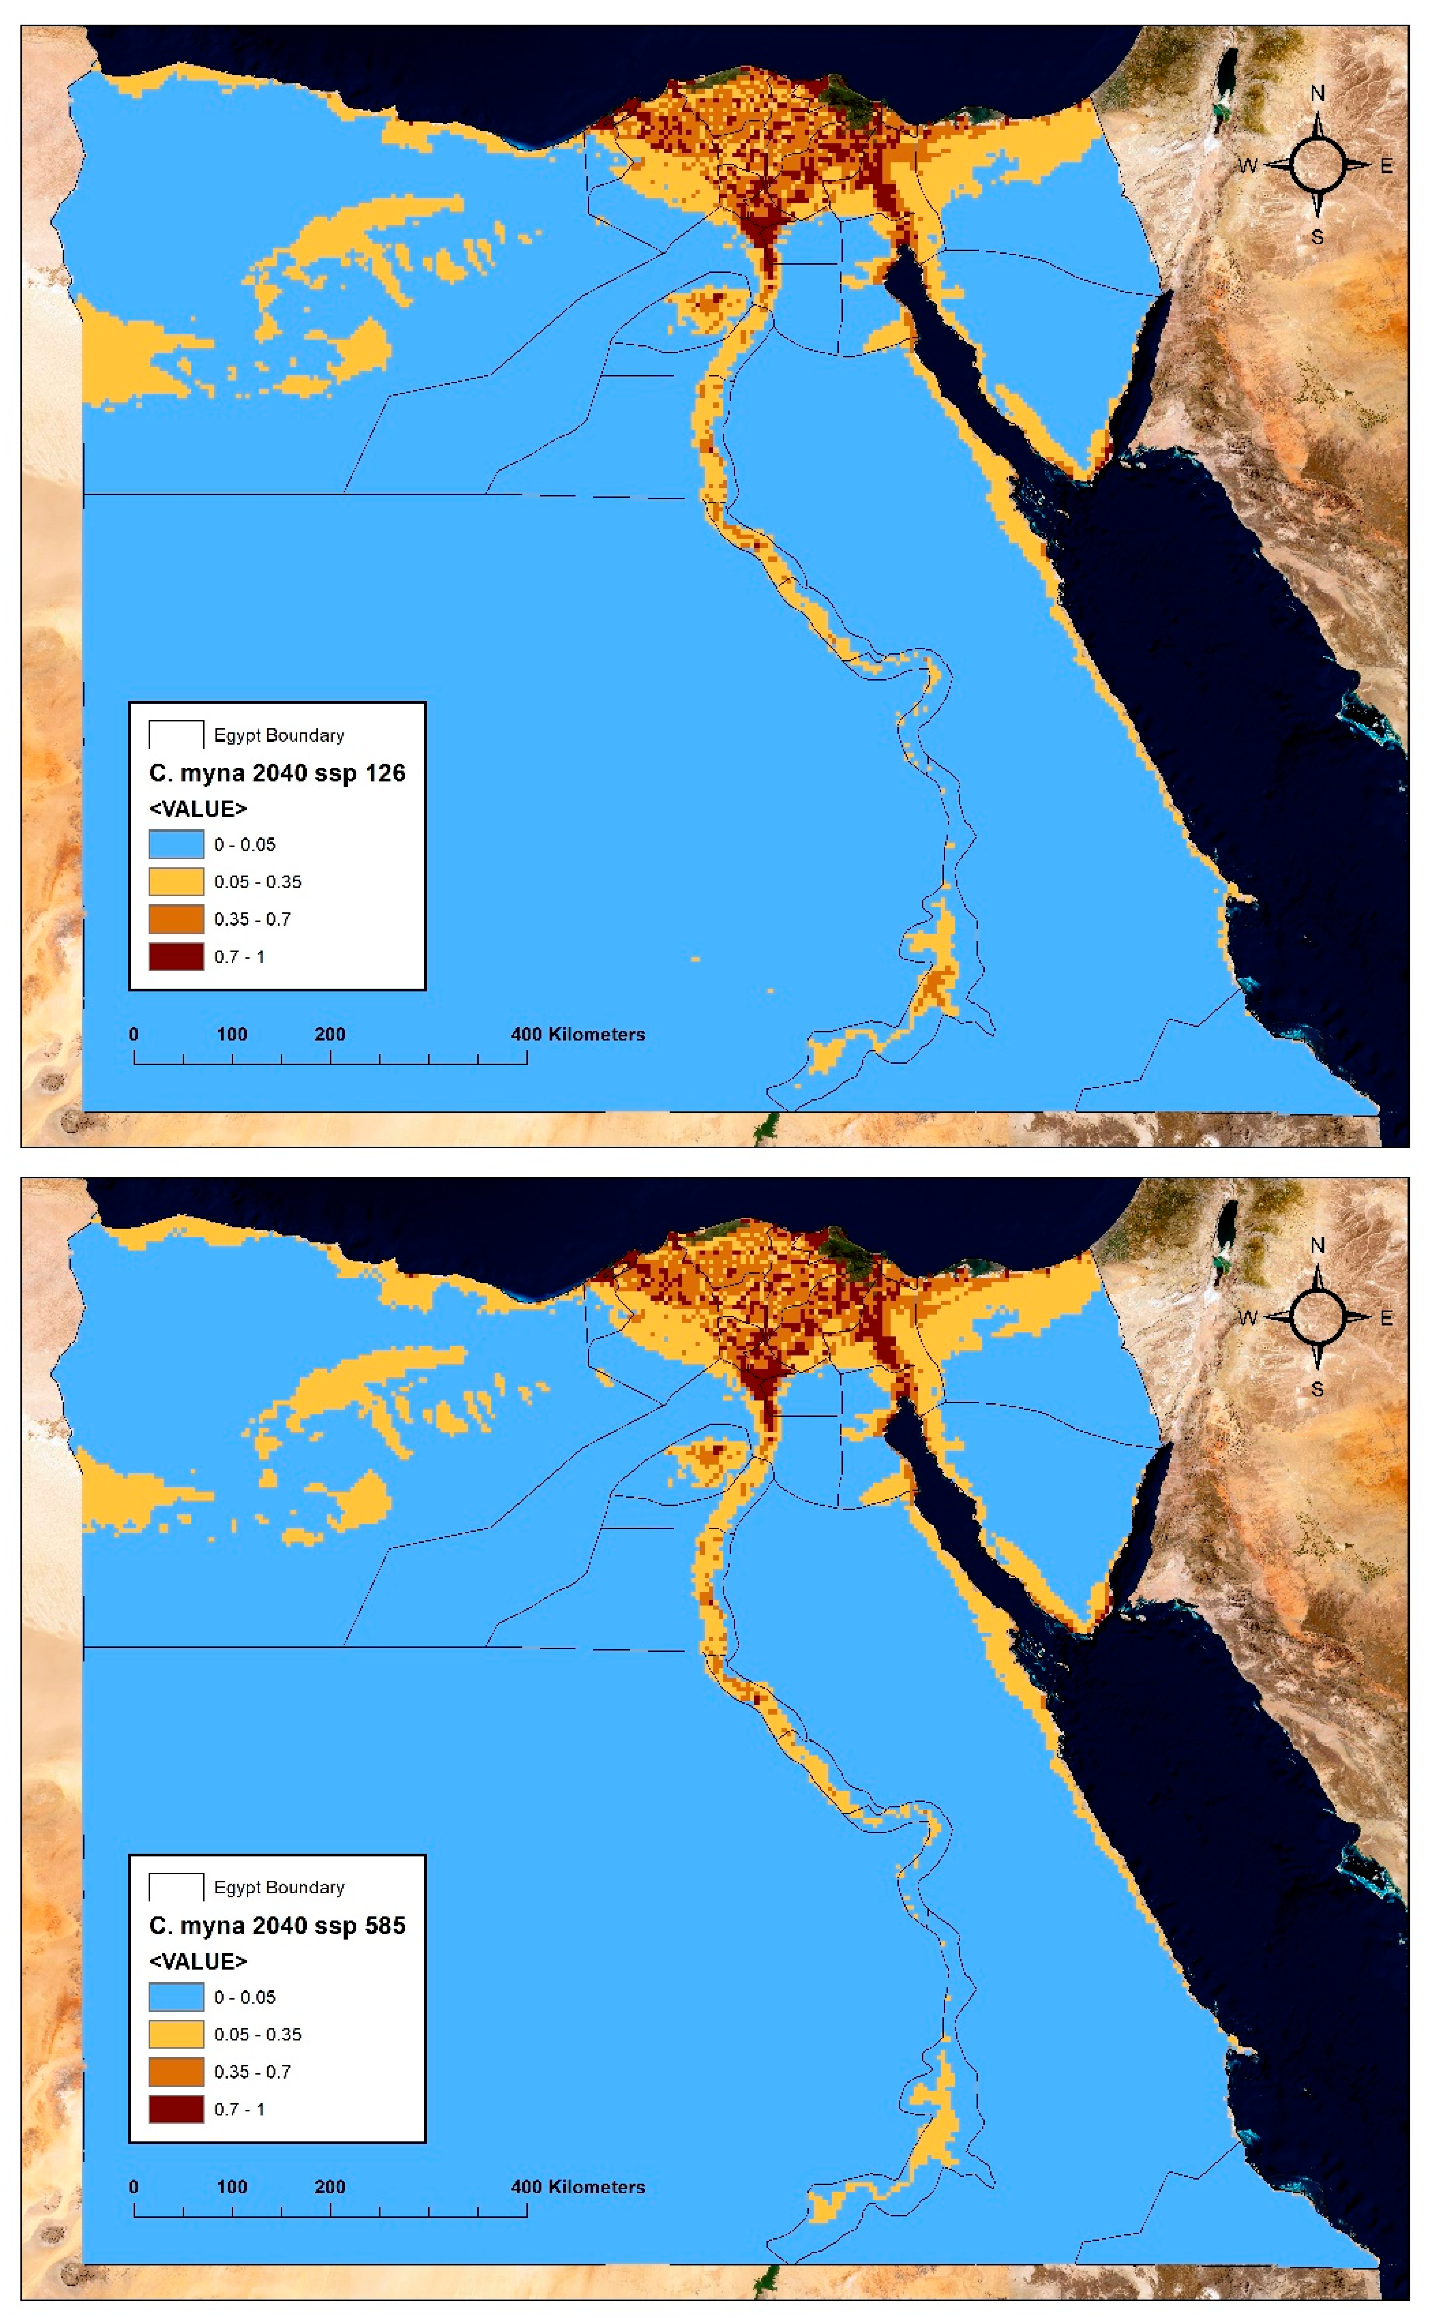
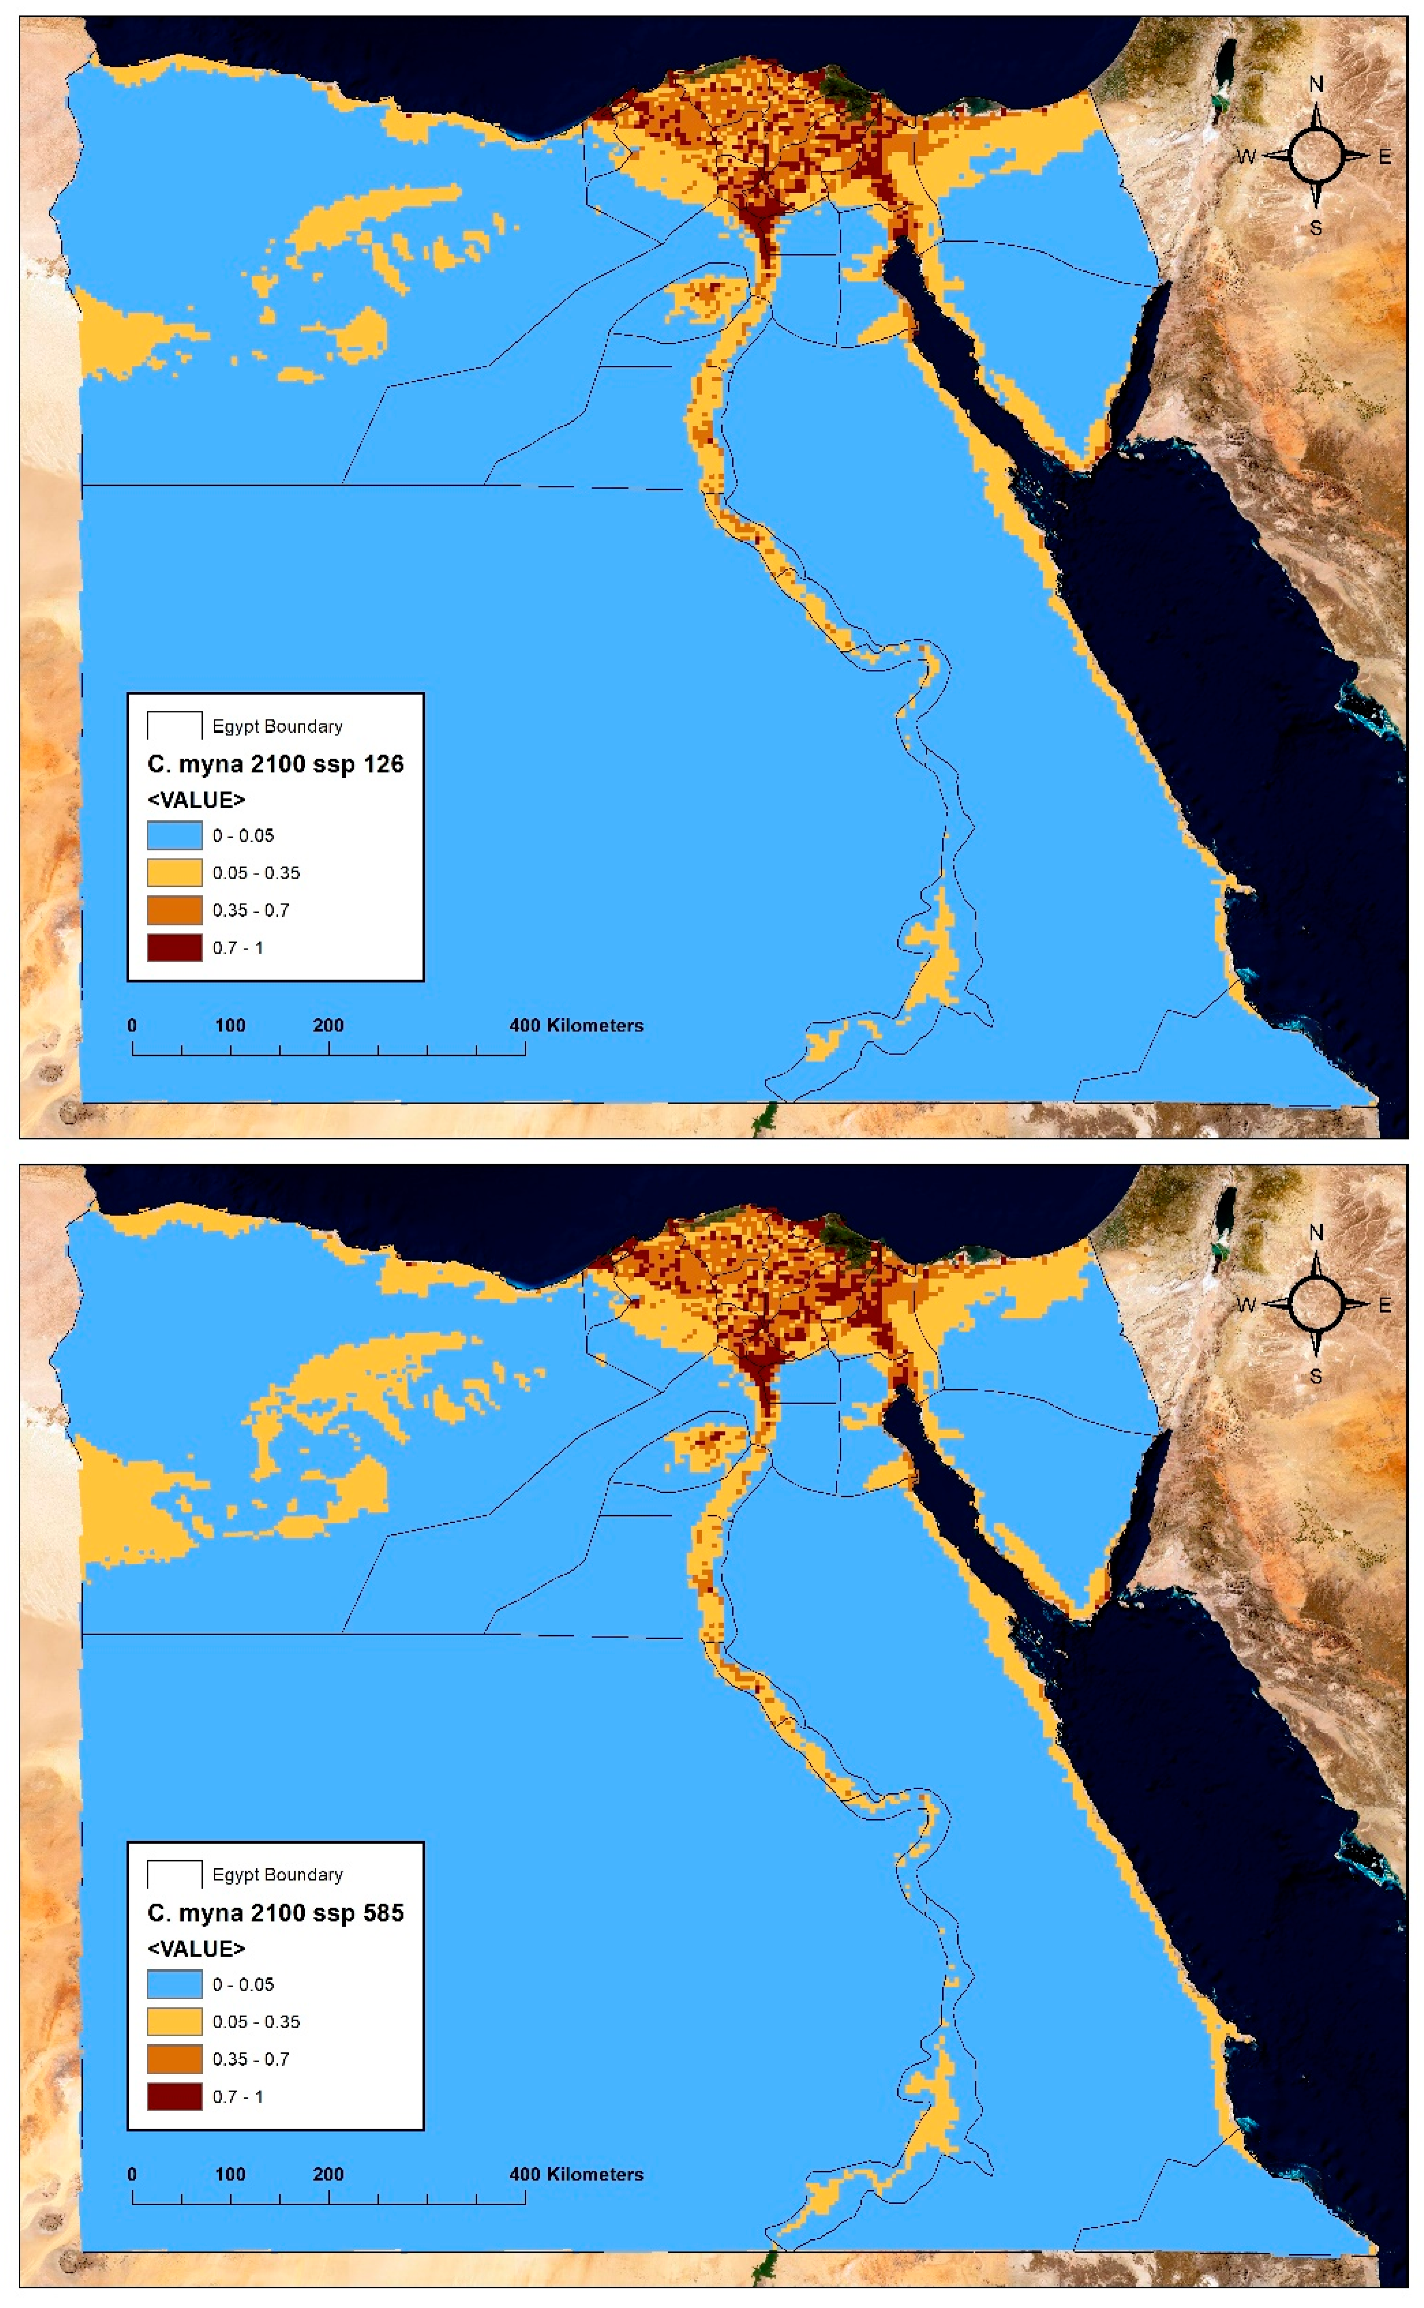
4.3. The Predicted Invasion Range of Common Myna under Future Global Warming Scenarios in Egypt

When compared to the potential current distribution, the predicted climate map under the BCC-CSM2-MR model for 2040, 2060, 2080, and 2100 resulted in an increase in suitable habitats for common myna (Figure 10, Figure 11, Figure 12 and Figure 13 and Table 4). Climate warming has increased the availability of habitats that are highly suitable for common myna in both the minimum (SSP 126) and maximum (SSP 585) emissions scenarios. By 2100, habitat suitability will increase at the highly suitable habitat class (≥0.71) by 5.7% and 12.9%, according to SSP 126 and SSP 585 emissions scenarios, respectively. Focusing on moderately suitable habitat (0.36–0.70), there was an increasing gain in areas suitable for common myna by 13.6% and 9.1% according to SSP 126 and SSP 585 emissions scenarios, respectively. In contrast, the potential unsuitable areas for common myna (≤0.05) within all of Egypt would decrease by 0.2% and 1.5% according to SSP 126 and SSP 585 emissions scenarios, respectively.

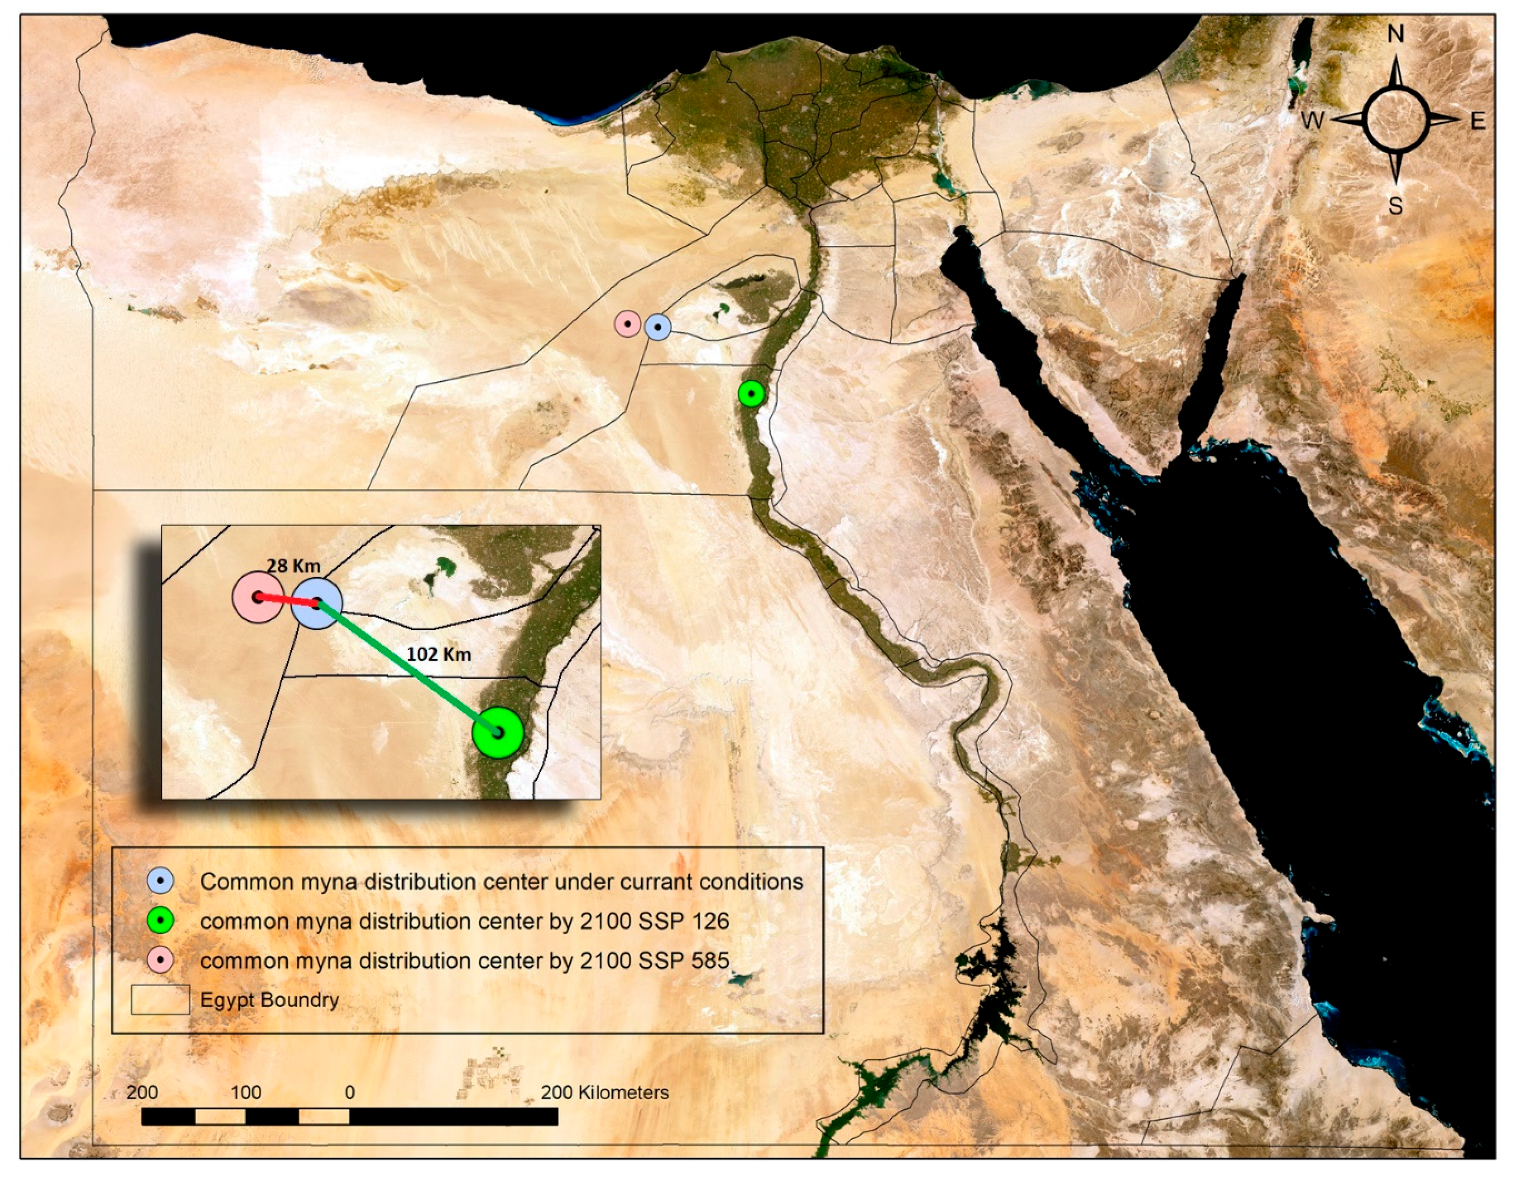
4.4. Analysis of the Suitable Distribution Center for Common Myna under Future Climate Scenario

The transfer of the distribution center of common myna represented the change of distribution habitats; the distribution center of common myna by 2100 under each scenario was shown in (Figure 14). In the SSP 126 emissions scenario, the distribution center moved about 102 km from the current center to the southeast. In the SSP 585 emissions scenario, the distribution center moved about 28 km from the current center to the northwest. Therefore, under future high emissions scenarios, the distribution center showed some northward migration when compared to the current conditions.

5. Discussion

Given their negative effects on the environment, figuring out the distribution and possible ranges of invasive species has become crucial [16]. Several factors, such as the biotic habitat, the ability of the species to disperse, lack of natural enemies, reproduction intensity, short generation time, resource availability, adaptability to human proximity, and environmental conditions, influence the spread of invasive species [45,46,47,48]. Nonetheless, these variables are typically hard to measure, and trustworthy information is frequently hard to obtain, particularly for understudied species. For this reason, it has been proposed that these factors might reduce the accuracy of the correlation models used to evaluate species distribution. As a result, environmental factors are the primary consideration for defining or predicting a species’ range [49]. Climate or a species’ adaptability to a particular habitat in an urban environment are two variables that are commonly used to explain invasion patterns [50].
In recent decades, the fields of ecology and invasion biology have witnessed a rise in the utilization of species distribution models, often known as environmental niche models (SDM) [51,52]. Invasive species distributions can be predicted from older records by using MaxEnt to construct species distribution models (SDM) using climatic, anthropogenic, and environmental factors [16]. Several studies have shown that, when compared to other species distribution models, the MaxEnt model is an acceptable simulation [53] Out of the 16 models, MaxEnt achieved the best prediction accuracy [53].
While the SDM provides valuable insights into the potential distribution of the common myna in Egypt under current and future climate conditions, several limitations and uncertainties should be considered. The accuracy and spatial resolution of the environmental data layers, such as climatic, topographic, and soil data, employed in species distribution modeling (SDM) can have a significant impact on the precision and reliability of the model’s predictions. Higher-resolution data can provide more detailed insights into the microhabitat preferences and environmental requirements of the target species, in this case, the common myna (Acridotheres tristis) [21]. The reliability and completeness of the presence data used in species distribution modeling (SDM) can have a significant impact on the accuracy and reliability of the model outputs. Limitations or biases in the sampling of species occurrences can lead to the under- or overestimation of habitat suitability, particularly in areas with sparse data [54]. The Beijing Climate Center Climate System Model (BCC-CSM2-MR) provides medium-resolution projections of future climate conditions under various shared socioeconomic pathways (SSPs), such as SSP126 and SSP585. While these projections offer valuable insights into potential future climate scenarios, it is essential to acknowledge the inherent uncertainties associated with climate modeling and their implications for assessing the potential range shifts of species, exemplified here by the common myna (Acridotheres tristis) [55]. Addressing these limitations through improved data collection, model refinement, and sensitivity analyses can enhance the robustness of predictions and support more effective conservation and management strategies.
The present study showed that, under the current climatic situations, the highly suitable habitat of common myna mainly exists within the Suez Canal region, North Sinai, and some regions on the Red Sea coast. This result is consistent with the documented distribution seen in the literature [13]. This implies that its current distribution in locations close to Coastal areas constitutes its climate optimum. This has supported the opinion of [56] who reported that one of the biggest risks to endangered island species is the presence of invasive predators, which are present on most marine islands and coastal zones. Furthermore, this can be explained by the ability of many invasive birds to actively disperse long distances to colonize marine islands and coastal zones without anthropogenic assistance [57].
The models’ output also identified a few topographically and climatically appropriate locations in Egypt, such as the Nile Delta in locations close to significant agricultural activity, some regions overlooking the course of the Nile River in the south, and some areas in the western desert north region. This is in addition to some areas in South Sinai where there is no historical or literary evidence to support the existence of common myna previously. However, more surveys in these locations are recommended to look for new populations of common myna or to find out what factors contributed to the species’ failure to spread to all acceptable areas.
The present work showed that the current distribution and expansion of the common myna are mostly caused by climate variables. This was contrary to the opinion of [58] who showed that rather than climate variables, anthropogenic influences are primarily responsible for the current distribution and expansion of the common myna.
Under current conditions, the MaxEnt outputs indicated that the common myna invasion range in Egypt was more influenced by the minimum temperature of the coldest month, the mean temperature of the coldest quarter, and elevation. This is consistent with variables affecting the common myna globally presence reported by [16]. They showed that the variance seen in the model was better explained by elements pertaining to temperature stability or range, such as maximum or lowest temperatures. Since these predictors can distinguish between regions with identical mean temperatures but greater minimum-maximum ranges, this accurately illustrates the Mynas’ tolerance to temperature variations. Additionally, according to the present results, common mynas occurrence is highest in moderately temperature environments. This is consistent with the findings of [16], who showed that the common myna presence is highest in environments with moderate temperature stability.
The ecological balance is altered by urbanization, which encourages the spread of alien species and limits the areas that are accessible to native species [59]. Urbanization leads to habitat fragmentation and species invasion near urban centers, which has significant negative effects on the environment (predation, hybridization, and competition), as well as the economy (agricultural, livestock, forestry, and human health) in the regions where they are introduced [60].
Our results showed that the common myna prefers to reside in open shrubland, urban and built-up regions, and croplands with natural vegetation. This is consistent with the view of [16,61] who showed that the primary determinant of the suitability of the habitat for common myna is urbanization. The current results also showed that the highly suitable habitats of common myna in Egypt are concentrated in high-density urban clusters. This is consistent with the findings of [62] who reported that the prevalence of invasive species in urban settings, including the Myna, and the pattern of land use indicated a greater preference for urban constructions over native vegetation. Proximity to urbanized regions and high environmental tolerance have enabled range expansion [16]. This can be explained as a result of the reduced risk of predation in conjunction with greater quantities and consistency of food supplies, which provide for high avian population densities in urban areas [63]. Additionally, microclimates and the chance to avoid the effects of cold or hot and dry weather conditions are enhanced in urban environments [64].
A species’ climatic envelope, which includes temperature ranges, precipitation patterns, and other climate-related factors, is impacted by human-caused global warming [65]. Invasive species are anticipated to have more possibilities due to their flexibility to disturbance, a wider range of biogeographic conditions, and environmental controls. This is a result of climate change impacts such as warmer temperatures and increases in CO2 concentrations [1]. MaxEnt predictions for the years 2040, 2060, 2080, and 2100 revealed that the predicted invasion range of common myna would increase under future conditions in both the minimum and maximum emissions scenarios. Warmer air temperatures may also make it easier for species to travel over previously unreachable natural and man-made routes of distribution [1]. Furthermore, as the climate warms, the geographically acceptable habitat of species’ climatic envelopes will shift substantially, possibly to regions not occupied by species under current conditions [66]. Therefore, this species will migrate to cooler, wetter areas, mainly uphill or toward the poles, to follow their envelopes of climate suitability [67]. This clarifies why, under the future maximum emissions scenarios, the distribution center of common myna has shifted to the northwest of Egypt. The Mediterranean Sea’s cooling influence, which helps reduce air temperatures, especially in the summer, is beneficial to Egypt’s northern and northwest areas. In contrast to the hotter, drier desert winds that affect the southern regions, these places also benefit from cooler Mediterranean winds. Due to reduced urbanization and the cooling impact of the water, rural and coastal areas in the north and northwest generally remain cooler, even though big urban centers like Cairo may experience somewhat higher temperatures due to the urban heat island effect [68,69].
To address the threat posed by the invasive common myna (Acridotheres tristis) in Egypt, a comprehensive set of policy recommendations can be implemented; Strengthen border controls and foster international cooperation to prevent the unintentional introduction of common mynas through trade and travel [70], Identify high-risk areas based on species distribution modeling (SDM), develop targeted trapping and removal programs, and regularly monitor the effectiveness of these efforts [71], Educate the public, stakeholders, and relevant industries about the negative impacts of common mynas on native biodiversity, and encourage responsible pet ownership practices [72], Enact and enforce regulations on the import, sale, and ownership of common mynas and other potentially invasive species, including the implementation of a permitting system [71], Establish ongoing surveillance and monitoring programs to track the distribution, abundance, and impacts of common mynas and other invasive species, and use the findings to inform adaptive management strategies [72], and Promote multi-agency coordination and international cooperation to develop and implement integrated invasive species management plans [73].

6. Conclusions

Decision-makers who aim to stop, remove, or control introduced species must have a thorough understanding of the invasion process and the variables impacting the invasion range expansion. According to the presented results, the main causes of the common myna’s present distribution and expansion are those related to climate change and human activity. As a baseline for tracking and prioritizing activities to minimize spread and impacts, this study offers a national baseline regarding the distribution of the invasive common myna and its future potential spread.
Conservation efforts should prioritize areas identified as potential hotspots for common myna invasion based on Species Distribution Model (SDM) predictions. This allows for efficient allocation of resources to areas most at risk. Implement adaptive management strategies that can be adjusted based on ongoing monitoring and new data to effectively respond to the dynamic nature of species invasions and climate change impacts. Also, continuous monitoring of common myna populations and their habitats is essential to detect early signs of invasion and expansion, allowing for timely intervention. It is obvious that the influx of dispersing birds from surrounding countries is contributing to the rapid distribution of common myna in Egypt. As such, additional focus, rapid action, and collaboration are all important issues that should be considered.
Future Research Directions include the refinement of Species Distribution Models (SDMs) by Utilizing higher resolution environmental data to improve the accuracy of SDMs, and better predict fine-scale habitat suitability for the common myna, Conducting long-term studies to assess the ecological impacts of common myna invasions on native species and ecosystems, and Analyzing the genetic diversity of common myna populations to identify potential sources of invasion and understand the genetic factors contributing to their invasive success.

Author Contributions

F.M.S. and M.K. conceived and designed the research. M.K., M.A.I., S.H.R. and D.M.M. collected the data. G.M.O., S.H.R. and M.K. analyzed the data and wrote the manuscript. M.K. was a major contributor to writing the manuscript. G.M.O., F.M.S. and M.K. made critical reviews and approved the final version. All authors have read and agreed to the published version of the manuscript.

Funding

This project was funded by the Academy of Scientific Research and Technology (ASRT).

Institutional Review Board Statement

Scientific research ethic committee—Faculty of Science—Suez Canal University, Ismailia, Egypt declares that the research protocol submitted by: Gamal M. Orabi, Fayez M. Semida, Doaa M. Medany, Mohamed A. Issa, Sanad H. Ragab, Mohamed Kamel Entitled: Predicting the invasion range of the Common Myna (Acridotheres tristis Linnaeus, 1766) in Egypt under climate change, was approved by the committee under the code number: REC321/2024 through the committee meeting on: 7 May 2024 The animal study protocol was approved by the ethic committee—Faculty of Science—Suez Canal University, Ismailia, Egypt (REC321/2024 through the committee meeting on: 7 May 2024).

Informed Consent Statement

Not applicable.

Data Availability Statement

Data are contained within the article.

Acknowledgments

The authors would like to thank the Academy of Scientific Research and Technology (ASRT) for funding this project.

Conflicts of Interest

The authors declare no conflicts of interest.

References

  1. Burgiel, S.; Muir, A. Invasive Species, Climate Change and Ecosystem-Based Adaptation: Addressing Multiple Drivers of Global Change Global Invasive Species Programme; Global Invasive Species Programme (GISP): Nairobi, Kenya, 2010. [Google Scholar]
  2. Blackburn, T.M.; Essl, F.; Evans, T.; Hulme, P.E.; Jeschke, J.M.; Kühn, I.; Kumschick, S.; Marková, Z.; Mrugała, A.; Nentwig, W. A unified classification of alien species based on the magnitude of their environmental impacts. PLoS Biol. 2014, 12, e1001850. [Google Scholar] [CrossRef] [PubMed]
  3. Mainka, S.A.; Howard, G.W. Climate change and invasive species: Double jeopardy. Integr. Zool. 2010, 5, 102–111. [Google Scholar] [CrossRef] [PubMed]
  4. Finch, D.M.; Butler, J.L.; Runyon, J.B.; Fettig, C.J.; Kilkenny, F.F.; Jose, S.; Frankel, S.J.; Cushman, S.A.; Cobb, R.C.; Dukes, J.S. Effects of Climate Change on Invasive Species. In Invasive Species in Forests and Rangelands of the United States: A Comprehensive Science Synthesis for the United States Forest Sector; Springer: Berlin/Heidelberg, Germany, 2021; pp. 57–83. [Google Scholar]
  5. Charter, M.; Izhaki, I.; Mocha, Y.B.; Kark, S. Nest-site competition between invasive and native cavity nesting birds and its implication for conservation. J. Environ. Manag. 2016, 181, 129–134. [Google Scholar] [CrossRef] [PubMed]
  6. Feare, C.; Craig, A. Starlings and Mynas; Princeton University Press: Princeton, NJ, USA, 1999. [Google Scholar]
  7. Grarock, K.; Tidemann, C.R.; Wood, J.T.; Lindenmayer, D.B. Are invasive species drivers of native species decline or passengers of habitat modification? A case study of the impact of the common myna (Acridotheres tristis) on A ustralian bird species. Austral Ecol. 2014, 39, 106–114. [Google Scholar] [CrossRef]
  8. Gal, A. Attitude Construction toward Invasive Species through an Eco-Humanist Approach: A Case Study of the Lesser Kestrel and the Myna. Educ. Sci. 2023, 13, 1076. [Google Scholar] [CrossRef]
  9. Pagad, S.; Bisset, S.; Genovesi, P.; Groom, Q.; Hirsch, T.; Jetz, W.; Ranipeta, A.; Schigel, D.; Sica, Y.V.; McGeoch, M.A. The Global Register of Introduced and Invasive Species: Country Compendium. bioRxiv 2022, 2022-04. [Google Scholar] [CrossRef] [PubMed]
  10. Can Bilgin, C. First record of the common Myna (Acridotheres tristis) from Ankara, Turkey. Zool. Middle East 1996, 13, 25–26. [Google Scholar] [CrossRef]
  11. Bara, T. Bird notes from Lebanon, including two new species. Sandgrouse 2002, 24, 44–45. [Google Scholar]
  12. Holzapfel, C.; Levin, N.; Hatzofe, O.; Kark, S. Colonisation of the Middle East by the invasive Common Myna Acridotheres tristis L., with special reference to Israel. Sandgrouse 2006, 28, 44. [Google Scholar]
  13. Rabia, B.; El Din, M.B.; Rifai, L.; Attum, O. Invasive species breeding in Sinai, Egypt. Sandgrouse 2015, 37, 87–89. Available online: https://osme.org/wp-content/uploads/2023/07/Common-Myna-Acridotheres-tristis-a-new-invasive-species-breeding-in-Sinai-Egypt.pdf (accessed on 30 May 2024).
  14. Khoury, F.; Alshamlih, M. First Evidence of Colonization by Common Myna Acridotheres tristis in Jordan, 2013–2014. 2016. Available online: https://library.wcs.org/doi/ctl/view/mid/33065/pubid/PUB15555.aspx (accessed on 30 May 2024).
  15. Abd Rabou, A.F.N. Bird fauna encountered at the main campus of the Islamic University of Gaza, Gaza City, Palestine. Biodivers. J. Biol. Divers. 2019, 20, 604–614. [Google Scholar] [CrossRef]
  16. Magory Cohen, T.; McKinney, M.; Kark, S.; Dor, R. Global invasion in progress: Modeling the past, current and potential global distribution of the common myna. Biol. Invasions 2019, 21, 1295–1309. [Google Scholar] [CrossRef]
  17. Lowe, S.; Browne, M.; Boudjelas, S.; De Poorter, M. 100 of the World’s Worst Invasive Alien Species: A Selection from the Global Invasive Species Database; Invasive Species Specialist Group Auckland: Auckland, New Zealand, 2000; Volume 12. [Google Scholar]
  18. Grarock, K.; Tidemann, C.R.; Wood, J.; Lindenmayer, D.B. Is it benign or is it a pariah? Empirical evidence for the impact of the common myna (Acridotheres tristis) on Australian birds. PLoS ONE 2012, 7, e40622. [Google Scholar] [CrossRef] [PubMed]
  19. Dhami, M.K.; Nagle, B. Review of the Biology and Ecology of the Common Myna (Acridotheres tristis) and Some Implications for Management of this Invasive Species; School of Biological Sciences, The University of Auckland: Auckland, New Zealand, 2010. [Google Scholar]
  20. Craig, A.; Feare, C. Starlings and Mynas; A&C Black: Edinburgh, UK, 2010. [Google Scholar]
  21. Kumschick, S.; Gaertner, M.; Vilà, M.; Essl, F.; Jeschke, J.M.; Pyšek, P.; Ricciardi, A.; Bacher, S.; Blackburn, T.M.; Dick, J.T.A. Ecological impacts of alien species: Quantification, scope, caveats, and recommendations. BioScience 2015, 65, 55–63. [Google Scholar] [CrossRef]
  22. Bomford, M.; Sinclair, R. Australian research on bird pests: Impact, management and future directions. Emu 2002, 102, 29–45. [Google Scholar] [CrossRef]
  23. Faggi, A.; Dadon, J.R. Environmental problems associated with tourism activities in Punta Lara Natural Reserve (Argentina). Int. J. Environ. Sustain. Dev. 2011, 10, 19–29. [Google Scholar]
  24. Tidemann, C.R. Mitigation of the Impact of Mynas on Biodiversity and Public Amenity; School of Resources, Environment & Society, The Australian National University, 2001; Available online: https://fennerschool-associated.anu.edu.au/myna/minimise_files/Myna_Mitigation_PhaseI.pdf (accessed on 30 May 2024).
  25. Araújo, M.B.; Anderson, R.P.; Márcia Barbosa, A.; Beale, C.M.; Dormann, C.F.; Early, R.; Garcia, R.A.; Guisan, A.; Maiorano, L.; Naimi, B. Standards for distribution models in biodiversity assessments. Sci. Adv. 2019, 5, eaat4858. [Google Scholar] [CrossRef] [PubMed]
  26. Phillips, S.J.; Anderson, R.P.; Dudík, M.; Schapire, R.E.; Blair, M.E. Opening the black box: An open-source release of Maxent. Ecography 2017, 40, 887–893. [Google Scholar] [CrossRef]
  27. Phillips, S. A brief tutorial on Maxent, versions: 3.3.1. Lessons Conserv. 2016, 3, 108–135. [Google Scholar]
  28. Comino, E.; Fiorucci, A.; Rosso, M.; Terenziani, A.; Treves, A. Vegetation and Glacier Trends in the area of the Maritime Alps Natural Park (Italy): MaxEnt application to predict habitat development. Climate 2021, 9, 54. [Google Scholar] [CrossRef]
  29. Wang, R.; Jiang, C.; Liu, L.; Shen, Z.; Yang, J.; Wang, Y.; Hu, J.; Wang, M.; Hu, J.; Lu, X. Prediction of the potential distribution of the predatory mite Neoseiulus californicus McGregor in China using MaxEnt. Glob. Ecol. Conserv. 2021, 29, e01733. [Google Scholar] [CrossRef]
  30. Bertolino, S.; Sciandra, C.; Bosso, L.; Russo, D.; Lurz, P.W.W.; Di Febbraro, M. Spatially explicit models as tools for implementing effective management strategies for invasive alien mammals. Mammal Rev. 2020, 50, 187–199. [Google Scholar] [CrossRef]
  31. Raffini, F.; Bertorelle, G.; Biello, R.; D’Urso, G.; Russo, D.; Bosso, L. From nucleotides to satellite imagery: Approaches to identify and manage the invasive pathogen Xylella fastidiosa and its insect vectors in Europe. Sustainability 2020, 12, 4508. [Google Scholar] [CrossRef]
  32. Chang, Y.; Chang, C.; Li, Y.; Liu, M.; Lv, J.; Hu, Y. Predicting dynamics of the potential breeding habitat of Larus saundersi by MaxEnt model under changing land-use conditions in wetland nature reserve of Liaohe Estuary, China. Remote Sens. 2022, 14, 552. [Google Scholar] [CrossRef]
  33. Anderson, R.P.; Martínez-Meyer, E.; Nakamura, M.; Araújo, M.B.; Peterson, A.T.; Soberón, J.; Pearson, R.G. Ecological Niches and Geographic Distributions (MPB-49); Princeton University Press: Princeton, NJ, USA, 2011. [Google Scholar]
  34. Worthington, T.A.; Zhang, T.; Logue, D.R.; Mittelstet, A.R.; Brewer, S.K. Landscape and flow metrics affecting the distribution of a federally-threatened fish: Improving management, model fit, and model transferability. Ecol. Model. 2016, 342, 1–18. [Google Scholar] [CrossRef]
  35. Zhang, J.; Jiang, F.; Li, G.; Qin, W.; Li, S.; Gao, H.; Cai, Z.; Lin, G.; Zhang, T. Maxent modeling for predicting the spatial distribution of three raptors in the Sanjiangyuan National Park, China. Ecol. Evol. 2019, 9, 6643–6654. [Google Scholar] [CrossRef] [PubMed]
  36. Fick, S.E.; Hijmans, R.J. WorldClim 2: New 1-km spatial resolution climate surfaces for global land areas. Int. J. Climatol. 2017, 37, 4302–4315. [Google Scholar] [CrossRef]
  37. Tebaldi, C.; Debeire, K.; Eyring, V.; Fischer, E.; Fyfe, J.; Friedlingstein, P.; Knutti, R.; Lowe, J.; O’Neill, B.; Sanderson, B. Climate model projections from the Scenario Model Intercomparison Project (ScenarioMIP) of CMIP6. Earth Syst. Dynam. 2021, 12, 253–293. [Google Scholar] [CrossRef]
  38. Skeie, R.B.; Myhre, G.; Hodnebrog, Ø.; Cameron-Smith, P.J.; Deushi, M.; Hegglin, M.I.; Horowitz, L.W.; Kramer, R.J.; Michou, M.; Mills, M.J. Historical total ozone radiative forcing derived from CMIP6 simulations. Npj Clim. Atmos. Sci. 2020, 3, 32. [Google Scholar] [CrossRef]
  39. Nachtergaele, F.; van Velthuizen, H.; Verelst, L.; Batjes, N.H.; Dijkshoorn, K.; van Engelen, V.W.P.; Fischer, G.; Jones, A.; Montanarela, L. The harmonized world soil database. In Proceedings of the 2010 19th World Congress of Soil Science, Soil Solutions for a Changing World, Brisbane, Australia, 1–6 August 2010; pp. 34–37. [Google Scholar]
  40. Center for International Earth Science Information Network—CIESIN, Columbia University. Gridded Population of the World, Version 4 (GPWv4): Population Density; NASA Socioeconomic Data and Applications Center (SEDAC): Palisades, NY, USA, 2016. [Google Scholar] [CrossRef]
  41. Sulla-Menashe, D.; Friedl, M.A. User Guide to Collection 6 MODIS Land Cover (MCD12Q1 and MCD12C1) Product; Usgs: Reston, VA, USA, 2018; Volume 1, p. 18. [Google Scholar]
  42. De Smedt, I.; Romahn, F.; Eichmann, K.U.; Lambert, J.C.; Loyola, D.; Veefkind, J.P.; Dehn, A.; Zehner, C. S5P mission performance centre formaldehyde [L2_HCHO_] readme. Eur. Space Agency 2020, 7, 2021. [Google Scholar]
  43. Wei, B.; Wang, R.; Hou, K.; Wang, X.; Wu, W. Predicting the current and future cultivation regions of Carthamus tinctorius L. using MaxEnt model under climate change in China. Glob. Ecol. Conserv. 2018, 16, e00477. [Google Scholar] [CrossRef]
  44. Boyce, M.S.; Vernier, P.R.; Nielsen, S.E.; Schmiegelow, F.K.A. Evaluating resource selection functions. Ecol. Model. 2002, 157, 281–300. [Google Scholar] [CrossRef]
  45. Davis, M.A.; Grime, J.P.; Thompson, K. Fluctuating resources in plant communities: A general theory of invasibility. J. Ecol. 2000, 88, 528–534. [Google Scholar] [CrossRef]
  46. Keane, R.M.; Crawley, M.J. Exotic plant invasions and the enemy release hypothesis. Trends Ecol. Evol. 2002, 17, 164–170. [Google Scholar] [CrossRef]
  47. Soberón, J. Grinnellian and Eltonian niches and geographic distributions of species. Ecol. Lett. 2007, 10, 1115–1123. [Google Scholar] [CrossRef] [PubMed]
  48. Møller, A.P.; Díaz, M.; Flensted-Jensen, E.; Grim, T.; Ibáñez-Álamo, J.D.; Jokimäki, J.; Mänd, R.; Markó, G.; Tryjanowski, P. Urbanized birds have superior establishment success in novel environments. Oecologia 2015, 178, 943–950. [Google Scholar] [CrossRef]
  49. Elith, J. Predicting Distributions of Invasive Species. In Invasive Species: Risk Assessment and Management; Cambridge University Press: Cambridge, MA, USA, 2017; p. 10. [Google Scholar]
  50. Murray, J.V.; Stokes, K.E.; van Klinken, R.D. Predicting the potential distribution of a riparian invasive plant: The effects of changing climate, flood regimes and land-use patterns. Glob. Change Biol. 2012, 18, 1738–1753. [Google Scholar] [CrossRef]
  51. Gallien, L.; Douzet, R.; Pratte, S.; Zimmermann, N.E.; Thuiller, W. Invasive species distribution models–how violating the equilibrium assumption can create new insights. Glob. Ecol. Biogeogr. 2012, 21, 1126–1136. [Google Scholar] [CrossRef]
  52. Fraser, D.L.; Aguilar, G.; Nagle, W.; Galbraith, M.; Ryall, C. The house crow (Corvus splendens): A threat to New Zealand? ISPRS Int. J. Geo-Inf. 2015, 4, 725–740. [Google Scholar] [CrossRef]
  53. Mao, M.; Chen, S.; Ke, Z.; Qian, Z.; Xu, Y. Using MaxEnt to predict the potential distribution of the little fire ant (Wasmannia auropunctata) in China. Insects 2022, 13, 1008. [Google Scholar] [CrossRef] [PubMed]
  54. Elith, J.; Graham, C.H.; Anderson, R.P.; Dudík, M.; Ferrier, S.; Guisan, A.; Hijmans, R.J.; Huettmann, F.; Leathwick, J.R.; Lehmann, A. Novel methods improve prediction of species’ distributions from occurrence data. Ecography 2006, 29, 129–151. [Google Scholar] [CrossRef]
  55. IPCC. Climate change 2007: The physical science basis. Agenda 2007, 6, 333. [Google Scholar]
  56. Duenas, M.-A.; Hemming, D.J.; Roberts, A.; Diaz-Soltero, H. The threat of invasive species to IUCN-listed critically endangered species: A systematic review. Glob. Ecol. Conserv. 2021, 26, e01476. [Google Scholar]
  57. Avery, M.L.; Feare, C.J. Control or eradication: Problems in the management of invasive birds. In Invasive Birds: Global Trends and Impacts; CABI Wallingford UK: Wallingford, UK, 2020; pp. 350–362. [Google Scholar]
  58. Khoury, F.; Saba, M.; Alshamlih, M. Anthropogenic not climatic correlates are the main drivers of expansion of non-native common myna Acridotheres tristis in Jordan. Manag. Biol. Invasions 2021, 12, 640. [Google Scholar] [CrossRef]
  59. Zhang, S.; Lei, F.; Liu, S.; Li, D.; Chen, C.; Wang, P. Variation in baseline corticosterone levels of Tree Sparrow (Passer montanus) populations along an urban gradient in Beijing, China. J. Ornithol. 2011, 152, 801–806. [Google Scholar] [CrossRef]
  60. Pimentel, D.; Lach, L.; Zuniga, R.; Morrison, D. Environmental and economic costs of nonindigenous species in the United States. BioScience 2000, 50, 53–65. [Google Scholar] [CrossRef]
  61. Magory Cohen, T.; Hauber, M.E.; Akriotis, T.; Crochet, P.A.; Karris, G.; Kirschel, A.N.G.; Khoury, F.; Menchetti, M.; Mori, E.; Per, E. Accelerated avian invasion into the Mediterranean region endangers biodiversity and mandates international collaboration. J. Appl. Ecol. 2022, 59, 1440–1455. [Google Scholar] [CrossRef]
  62. Menon, M.; Mohanraj, R. Temporal and spatial assemblages of invasive birds occupying the urban landscape and its gradient in a southern city of India. J. Asia-Pac. Biodivers. 2016, 9, 74–84. [Google Scholar] [CrossRef]
  63. Shochat, E.; Lerman, S.B.; Katti, M.; Lewis, D.B. Linking optimal foraging behavior to bird community structure in an urban-desert landscape: Field experiments with artificial food patches. Am. Nat. 2004, 164, 232–243. [Google Scholar] [CrossRef] [PubMed]
  64. Pell, A.S.; Tidemann, C.R. The ecology of the common myna in urban nature reserves in the Australian Capital Territory. Emu-Austral Ornithol. 1997, 97, 141–149. [Google Scholar] [CrossRef]
  65. Hijmans, R.J.; Graham, C.H. The ability of climate envelope models to predict the effect of climate change on species distributions. Glob. Change Biol. 2006, 12, 2272–2281. [Google Scholar] [CrossRef]
  66. Bellard, C.; Bertelsmeier, C.; Leadley, P.; Thuiller, W.; Courchamp, F. Impacts of climate change on the future of biodiversity. Ecol. Lett. 2012, 15, 365–377. [Google Scholar] [CrossRef] [PubMed]
  67. Laczko, F.; Aghazarm, C. Migration, Environment and Climate Change: Assessing the Evidence; International Organization for Migration (IOM): New York City, NY, USA, 2009. [Google Scholar]
  68. El-Sharkawy, M.A. Climatological studies on temperature distribution in Egypt. Meteorol. Atmos. Phys. 1988, 39, 33–42. [Google Scholar]
  69. Streutker, D.R. A remote sensing study of the urban heat island of Houston, Texas. Int. J. Remote Sens. 2002, 23, 2595–2608. [Google Scholar] [CrossRef]
  70. Tobin, P.C. Managing Invasive Species. F1000Research 2018, 7, 1686. [Google Scholar] [CrossRef] [PubMed]
  71. Pluess, T.; Cannon, R.; Jarošík, V.; Pergl, J.; Pyšek, P.; Bacher, S. When are eradication campaigns successful? A test of common assumptions. Biol. Invasions 2012, 14, 1365–1378. [Google Scholar] [CrossRef]
  72. Woodford, D.J.; Richardson, D.M.; MacIsaac, H.J.; Mandrak, N.E.; Van Wilgen, B.W.; Wilson, J.R.U.; Weyl, O.L.F. Confronting the wicked problem of managing biological invasions. NeoBiota 2016, 31, 63–86. [Google Scholar] [CrossRef]
  73. Moffitt, L.J.; Osteen, C.D. Prioritizing invasive species threats under uncertainty. Agric. Resour. Econ. Rev. 2006, 35, 41–51. [Google Scholar] [CrossRef]
Figure 1. Map of Egypt showing the monitoring sites of the common myna (Acridotheres tristis Linnaeus, 1766).
Sustainability 16 06495 g001
Figure 2. The predicted distribution range of common myna according to the MaxEnt model under current conditions. (Map source: google Maps and FGSER, GIS unit).
Sustainability 16 06495 g002
Figure 3. Probability of common myna distribution under different degrees of urbanization (brown color indicates highest level classes).
Sustainability 16 06495 g003
Figure 4. Probability of common myna distribution under different soil types in Egypt (brown color indicates highest level classes).
Sustainability 16 06495 g004
Figure 5. Probability of common myna distribution according to elevation in Egypt.
Sustainability 16 06495 g005
Figure 6. Probability of common myna distribution under different temperature variables.
Sustainability 16 06495 g006
Figure 7. Probability of common myna distribution under different land cover types (green color indicates the highest level classes).
Sustainability 16 06495 g007
Figure 8. The predicted moderately suitable habitat of common myna in Egypt under current conditions.
Sustainability 16 06495 g008
Figure 9. The predicted highly suitable habitat of common myna in Egypt under current conditions.
Sustainability 16 06495 g009
Figure 10. The predicted invasion range of the common myna is based on predicted climate change in 2040 under two global warming scenarios, SSP 126 and SSP 585. Habitat suitability classes include (0–5%) unsuitable habitat, (6–35%) poorly suitable habitat, (36–70%) moderately suitable habitat, and (71–100%) highly suitable habitat.
Sustainability 16 06495 g010
Figure 11. The predicted invasion range of the common myna is based on predicted climate change in 2060 under two global warming scenarios, SSP 126 and SSP 585. Habitat suitability classes include (0–5%) unsuitable habitat, (6–35%) poorly suitable habitat, (36–70%) moderately suitable habitat, and (71–100%) highly suitable habitat.
Sustainability 16 06495 g011
Figure 12. The predicted invasion range of the common myna is based on predicted climate change in 2080 under two global warming scenarios, SSP 126 and SSP 585. Habitat suitability classes include (0–5%) unsuitable habitat, (6–35%) poorly suitable habitat, (36–70%) moderately suitable habitat, and (71–100%) highly suitable habitat.
Sustainability 16 06495 g012
Figure 13. The predicted invasion range of the common myna is based on predicted climate change in 2100 under two global warming scenarios, SSP 126 and SSP 585. Habitat suitability classes include (0–5%) unsuitable habitat, (6–35%) poorly suitable habitat, (36–70%) moderately suitable habitat, and (71–100%) highly suitable habitat.
Sustainability 16 06495 g013
Figure 14. The distribution pattern of common myna in Egypt under current and future environmental conditions for 2100. (Correction to the label inside the map: common myna distribution centers are under prevalent conditions with future expectations).
Sustainability 16 06495 g014
Table 1. Climatic variables were utilized to build the model.
The Climatic Variables
Temperature variables
1 “Annual Mean Temperature”.
2 “Mean Diurnal Range.
3 “Isothermality “.
4 “Temperature Seasonality”.
5 “Max Temperature of Warmest Month”.
6 “Min Temperature of Coldest Month”.
7 “Temperature Annual Range”.
8 “Mean Temperature of Wettest Quarter”.
9 “Mean Temperature of Driest Quarter”.
10 “Mean Temperature of Warmest Quarter”.
11 “Mean Temperature of Coldest Quarter”.
Precipitation variables
12 “Annual Precipitation”.
13 “Precipitation of Wettest Month”.
14 “Precipitation of Driest Month”.
15 “Precipitation Seasonality”.
16 “Precipitation of Wettest Quarter”.
17 “Precipitation of Driest Quarter”.
18 “Precipitation of Warmest Quarter”.
19 “Precipitation of Coldest Quarter”.
Table 2. Estimates for the average contribution of the climatic factors used in common myna MaxEnt modeling.
VariablePercent ContributionPermutation Importance
GHSL-urban-smod57.61.7
Soil type16.83.7
Bio0412.11.2
Bio025.80.3
Landcover2.20.2
Elevation1.810.2
Bio111.430.7
Bio150.90.7
Bio060.950.8
Bio180.50.3
Table 3. The current predicted distribution range of common myna in Egypt (km2).
Predicted ClassCommon MynaPredicted Distribution Range %
(0–5%) Unsuitable habitat902,673.052890.5%
(6–35%) Poorly suitable habitat69,502.451166.9%
(36–70%) Moderately suitable habitat16,971.766541.7%
(71–100%) Highly suitable habitat8240.5083310.8%
Total area997,387.7788100%
Table 4. Predicted invasion range changes (km2) for common myna in 2040, 2060, 2080, and 2100 under two global warming scenarios, SSP 126 and SSP 585, compared to the potential current distribution. In brackets (+) gain (green color) and (−) loss (orange color) invasion range (in km2).
Predicted ClassCurrentFuture Scenarios
SSP 126SSP 585
20402060208021002040206020802100
(0–5%)
Unsuitable habitat
902,673.1897,070.3895,782.1893,798.7900,137.5898,440.3895,516.3892,571.8888,748.1
−5602.7−6890.9−8874.4−2535.5−4232.7−7156.8−10,101.3−13,925.1
(6–35%)
Poorly suitable habitat
69,502.4572,303.873,796.575,514.169,257.171,036.173,694.376,965.980,810.1
+2801.4+4294.1+6011.7−245.4+1533.6+4191.8+7463.5+11,307.7
(36–70%)
Moderately suitable habitat
16,971.7719,077.918,914.319,159.719,282.419,261.919,057.518,934.818,525.8
+2106.1+1942.6+2187.9+2310.6+2290.2+2085.7+1962.9+1554.1
(71–100%)
Highly suitable habitat
8240.5088935.78894.88915.38710.88649.59119.88915.39303.8
+695.2+654.3+674.8+470.3+408.9+879.3+674.8+1063.3
Disclaimer/Publisher’s Note: The statements, opinions and data contained in all publications are solely those of the individual author(s) and contributor(s) and not of MDPI and/or the editor(s). MDPI and/or the editor(s) disclaim responsibility for any injury to people or property resulting from any ideas, methods, instructions or products referred to in the content.

