Article

Performance Evaluation of the Electro-Fenton Process for Distillery Wastewater Treatment

by
Keerthana Rani Minnalkodi Senguttuvan
*,
Kanmani Sellappa
and
Saranya Kuppusamy
Centre for Environmental Engineering, Department of Civil Engineering, College of Engineering Guindy, Anna University, Chennai 600025, Tamil Nadu, India
*
Author to whom correspondence should be addressed.
Sustainability 2024, 16(15), 6512; https://doi.org/10.3390/su16156512
Submission received: 4 July 2024 / Revised: 23 July 2024 / Accepted: 24 July 2024 / Published: 30 July 2024
(This article belongs to the Section Sustainable Water Management)

Abstract

:
A fair amount of India’s gross domestic product is contributed by distilleries, which are considered the backbone industries of India. Distilleries indeed play key roles in India’s exports. Distillery wastewater is recognized as one of the recalcitrant wastewaters, containing extremely high organic loading and having an adverse impact when released into the environment. The aim of the present study was to optimize the conditions required for attaining improved COD removal efficiency in distillery wastewater through an electro-Fenton (EF) process. The effect of various operating parameters, viz. H2O2 dosage (555–2220 mg L−1), spacing between the iron electrodes (2–6 cm), electrode dipping area (35–65 cm2), initial pH (2–9), and constant voltage supply (5–15 V), were investigated by carrying out the EF process in batch mode. As a result of the EF study, COD removal efficiency of 79.5% for an initial COD of 5500–6000 mg L−1 was achieved for the distillery wastewater under the condition of 1665 mg L−1 H2O2, 2.5 cm of spacing between the electrodes, 55 cm2 of electrode dipping area, pH 3, and constant voltage supply of 5 V. In the same study, the kinetics of the process was also investigated, and it obeyed the pseudo-first-order reaction. The EF process effectively degrades complex organic compounds in distillery wastewater into simpler, potentially less toxic substances, as demonstrated by gas chromatography–mass spectrometry (GC-MS) analysis and pathway elucidation. The central composite design (CCD) of the response surface methodology (RSM) model was used to optimize the COD removal in distillery wastewater through the EF process. In line with the batch experimental results, RSM projections also indicated that the optimum conditions required for attaining a maximum of 70.8% COD removal efficiency in distillery wastewater are found to be 1402 mg L−1 H2O2 dosage, 3 cm electrode spacing, 60 cm2 dipping area, 5 V voltage, and pH 2.18. The research data supported the conclusion that the EF process is feasible for distillery wastewater treatment, which preferably can be applied extensively.

1. Introduction

Distilleries are identified as one of the highly polluting industries under the “red category” in India [1,2,3]. Molasses, a byproduct from the sugar industry, is the most essential raw material used in distillery units for the production of ethanol using the fermentation process. Fermentation and distillation are the major processes in distillery units. A large amount of highly colored spent wash remains after the distillation of alcohol from the fermented broth. About 8–15 L of complex effluent is generated per liter of alcohol [4,5]. Distillery spent wash contains high concentrations of inorganic total dissolved solids (17,160–20,460 mg L−1), total dissolved solids (TDSs) (85,000–110,000 mg L−1), total suspended solids (TSS) (4500–7000 mg L−1), chemical oxygen demand (COD) (85,000–110,000 mg L−1), acidity (5200–8000 mg L−1), biochemical oxygen demand (BOD) (25,000–35,000 mg L−1), conductivity (26–31 mS cm−1), sulfate (13,100–13,800 mg L−1), ammoniacal nitrogen (800–1100 mg L−1), chlorides (4500–8400 mg L−1), phenols (3000–4000 mg L−1), phosphate (1500–2200 mg L−1), and total nitrogen (4200–4800 mg L−1), as well as an acidic pH (4–4.6) [6]. The characteristics of the distillery effluent and quantity of effluent may vary considerably based on the fermentation and distillation process adopted, the location of the distillery unit, and the raw material utilized for the fermentation process. In addition, the pollution monitoring agency of India (Central Pollution Control Board—CPCB) has published the standard for the release of distillery effluent to discharge in surface water (COD < 0.1 kg m−3) and sewers (COD < 0.3 kg m−3; BOD < 0.1 kg m−3) [7]. Hence, distillery effluent must be treated before being discharged into the environment due to legal restrictions and the conservation of natural life.
A dark-colored pigment, melanoidin, a byproduct of amino carbonyl sugar formed due to the Maillard amino carbonyl reaction, is the major color pollutant present in distillery effluent of the ethanol fermentation process, which gives a dark brown color to the spent wash. The chemical formula of melanoidin is C17–18H26–27O10N. The molecular weight is in the range of 5000–40,000 g mol−1 [8]. It is highly acidic in nature. Various physical, chemical, and biological methods, such as catalytic wet air oxidation [4,9], nanocatalytic ozonation [10], bioadsorption [11], sequencing batch reactors [12], membrane bioreactors [13], microfiltration [14], nanofiltration [15], coagulation [8], adsorption [1,16], biomethanization [17], and enzymatic treatment [18], have been employed to treat distillery effluent containing melanoidin. However, the treatment efficiencies of these methods are quite low due to the poor biodegradability of melanoidin [19]. Also, these techniques were found unsuitable due to the increased expenses for upkeep and operation, high chemical requirements, and the production of huge volumes of secondary waste (byproducts) [3].
In recent decades, advanced oxidation processes (AOPs) have been developed as alternatives to conventional methods for the treatment of recalcitrant pollutants. The most powerful oxidizing agent, the hydroxyl radical (•OH), is produced in situ by AOPs [20]. The electro-Fenton (EF) process has received much attention lately as it results in efficient hydroxyl and hydroperoxyl radical production [21]. Devarnejad et al. [22] explained the EF process, which proceeds by the following chain reactions:
Hydroxyl radical (OH°) and Fe3+ ions are generated from the classical Fenton reaction between Fe2+ and H2O2, as given in Equation (1).
H2O2 + Fe2+ → Fe3+ + OH + OH
Hydroxyl radicals are also generated at the surface of the high oxygen over the voltage anode from the oxidation of water molecules, as shown in Equation (2).
H2O → H+ + OH + e
Also, the produced ferric ion from Equation (1) can be reduced to a ferrous ion by electrochemical regeneration of Fe2+ ions on the cathode surface, as shown in Equation (3).
Fe3+ + e → Fe2+
The EF process has the particularity to generate in situ hydrogen peroxide (H2O2) by reducing dissolved oxygen in the cathode, as shown in Equation (4). The anode material plays an essential role in the EF process [23].
O2 + 2H+ + 2e → H2O2
The treatment of distillery effluent using the EF process has been explored in various studies. Different technologies like electrocoagulation (EC), photo (UV), and sono (US) have been combined to enhance the efficiency in removing color, COD, and other pollutants from distillery effluent. For instance, a study demonstrated that the EF process achieved almost 39.66% COD removal at an electrolysis time of 3 h and dilution of 10% distillery effluent at a slightly acidic pH of 5.5 using a ruthenium oxide-coated titanium mesh acting as the anode and stainless steel as the cathode [24] and 44% decolorization from distillery effluent using carbon (graphite) electrodes at a 0.5 cm inter-electrode distance, pH 3, 4 A current density, 20 mg L−1 FeSO4, and 3 h of electrolysis time [25]. Additionally, the EF process with Ti-RuO2 anodes, when combined with algal treatment in a sequential system, showed promising results in terms of 92% COD, 76% TOC, and 82% TN removal, along with energy reclamation and biomass productivity [26]. These findings highlight the potential of the EF process, either alone or in combination with other technologies, for the effective treatment of distillery effluent. The current study focuses on the treatment of distillery effluent using the EF process, wherein iron (Fe-Fe) electrodes are used for distillery effluent treatment by varying parameters such as H2O2 dosage, spacing between the electrodes, dipping area of electrodes, initial pH, and voltage supply. The kinetic investigation was also carried out for optimal conditions, and the reaction order was determined based on the best fit. Additionally, gas chromatography–mass spectrometry (GC-MS) analysis was employed to identify intermediate byproducts generated during pollutant degradation. It is noteworthy that such comprehensive GC-MS studies are lacking in the current literature, highlighting the novelty and importance of this research in understanding the EF process’s effectiveness and mechanism for treating distillery effluent.
Recently, statistical methods have been considered a useful tool for the determination of different processes for removing pollutants. Response Surface Methodology (RSM) is one of these statistical models for experimental design. The key advantages of RSM are the determination of optimal theoretical conditions with a lower number of trials and a larger interaction of variables in determining the final elimination formula. Various studies have been reported on the removal of contaminants from aqueous solutions using RSM [22,27,28]. The two most common designs generally used in the RSM model are central composite design (CCD) and Box–Behnken designs. Thus, the RSM model, viz., CCD, was also tested in this study to evaluate the efficiency of the EF process for the treatment of distillery effluent under different conditions.
It is important to note that this study on the EF process for treating distillery effluent strongly aligns with sustainability goals by addressing significant environmental and economic challenges posed by the distillery industry. By advancing sustainable technologies and practices in distillery wastewater treatment, this research contributes to environmental conservation, enhances resource efficiency, and promotes regulatory compliance within the industry. These efforts support long-term environmental stewardship and contribute to achieving sustainable development goals.

2. Materials and Methodology

The distillery wastewater sample was collected from a distillery industry near Chengalpattu, Tamil Nadu, India. The wastewater sample collected in a high-density polyethylene (HDPE) bottle was immediately transferred and stored at 4 ℃ until further analysis. Chemicals such as sodium hydroxide pellets (NaOH; 97% purity) (RANKEM, Haryana, India), hydrogen peroxide (H2O2; 30% w/w) (RANKEM, Haryana, India), and sulfuric acid (H2SO4; 98% w/w) (MERCK, Darmstadt, Germany) were used for the EF process. The reagents used for COD analysis were prepared using chemicals such as potassium dichromate (K2Cr2O7; >99% purity) (MERCK, Darmstadt, Germany), silver sulfate (Ag2SO4; ≥98% purity) (RANKEM, Haryana, India), mercuric sulfate (≥99% purity) (HgSO4; RANKEM, Haryana, India), and ammonium iron (II) sulfate hexahydrate [(NH4)2 Fe(SO4)2·6 H2O; 99% purity] (Sigma Aldrich, Burlington, NJ, USA). Direct current (DC) (0–30 V/0–5 A) (VARTECH 3005B MODEL, Karnataka, India) was used for the power supply. Commercially available iron plates procured from metal traders in India were used as electrodes.

2.1. Analytical Procedure

All the analysis conducted in this study was carried out using the standard protocols detailed in Table 1. Initially, the pH of the distillery wastewater sample was measured using a Multiparameter Bench Top Meter (EUTECH Instruments, Thermo Fisher Scientific, Mumbai, India). The total solids (TS) and TSS were thereafter estimated by the gravimetric method using a hot air oven (HASTHAS, Chennai, India). BOD was assessed using Winkler’s method. The sample COD was estimated by the closed reflux titrimetric method using the COD Digestor (QUADRATES 320, Wolfsburg, Germany). Phosphorous (P) and sulfates (SO42−) were determined using the stannous chloride method and the turbidimetric method, respectively. The physico-chemical characteristics of the wastewater sample used in this study are detailed in Table 1.

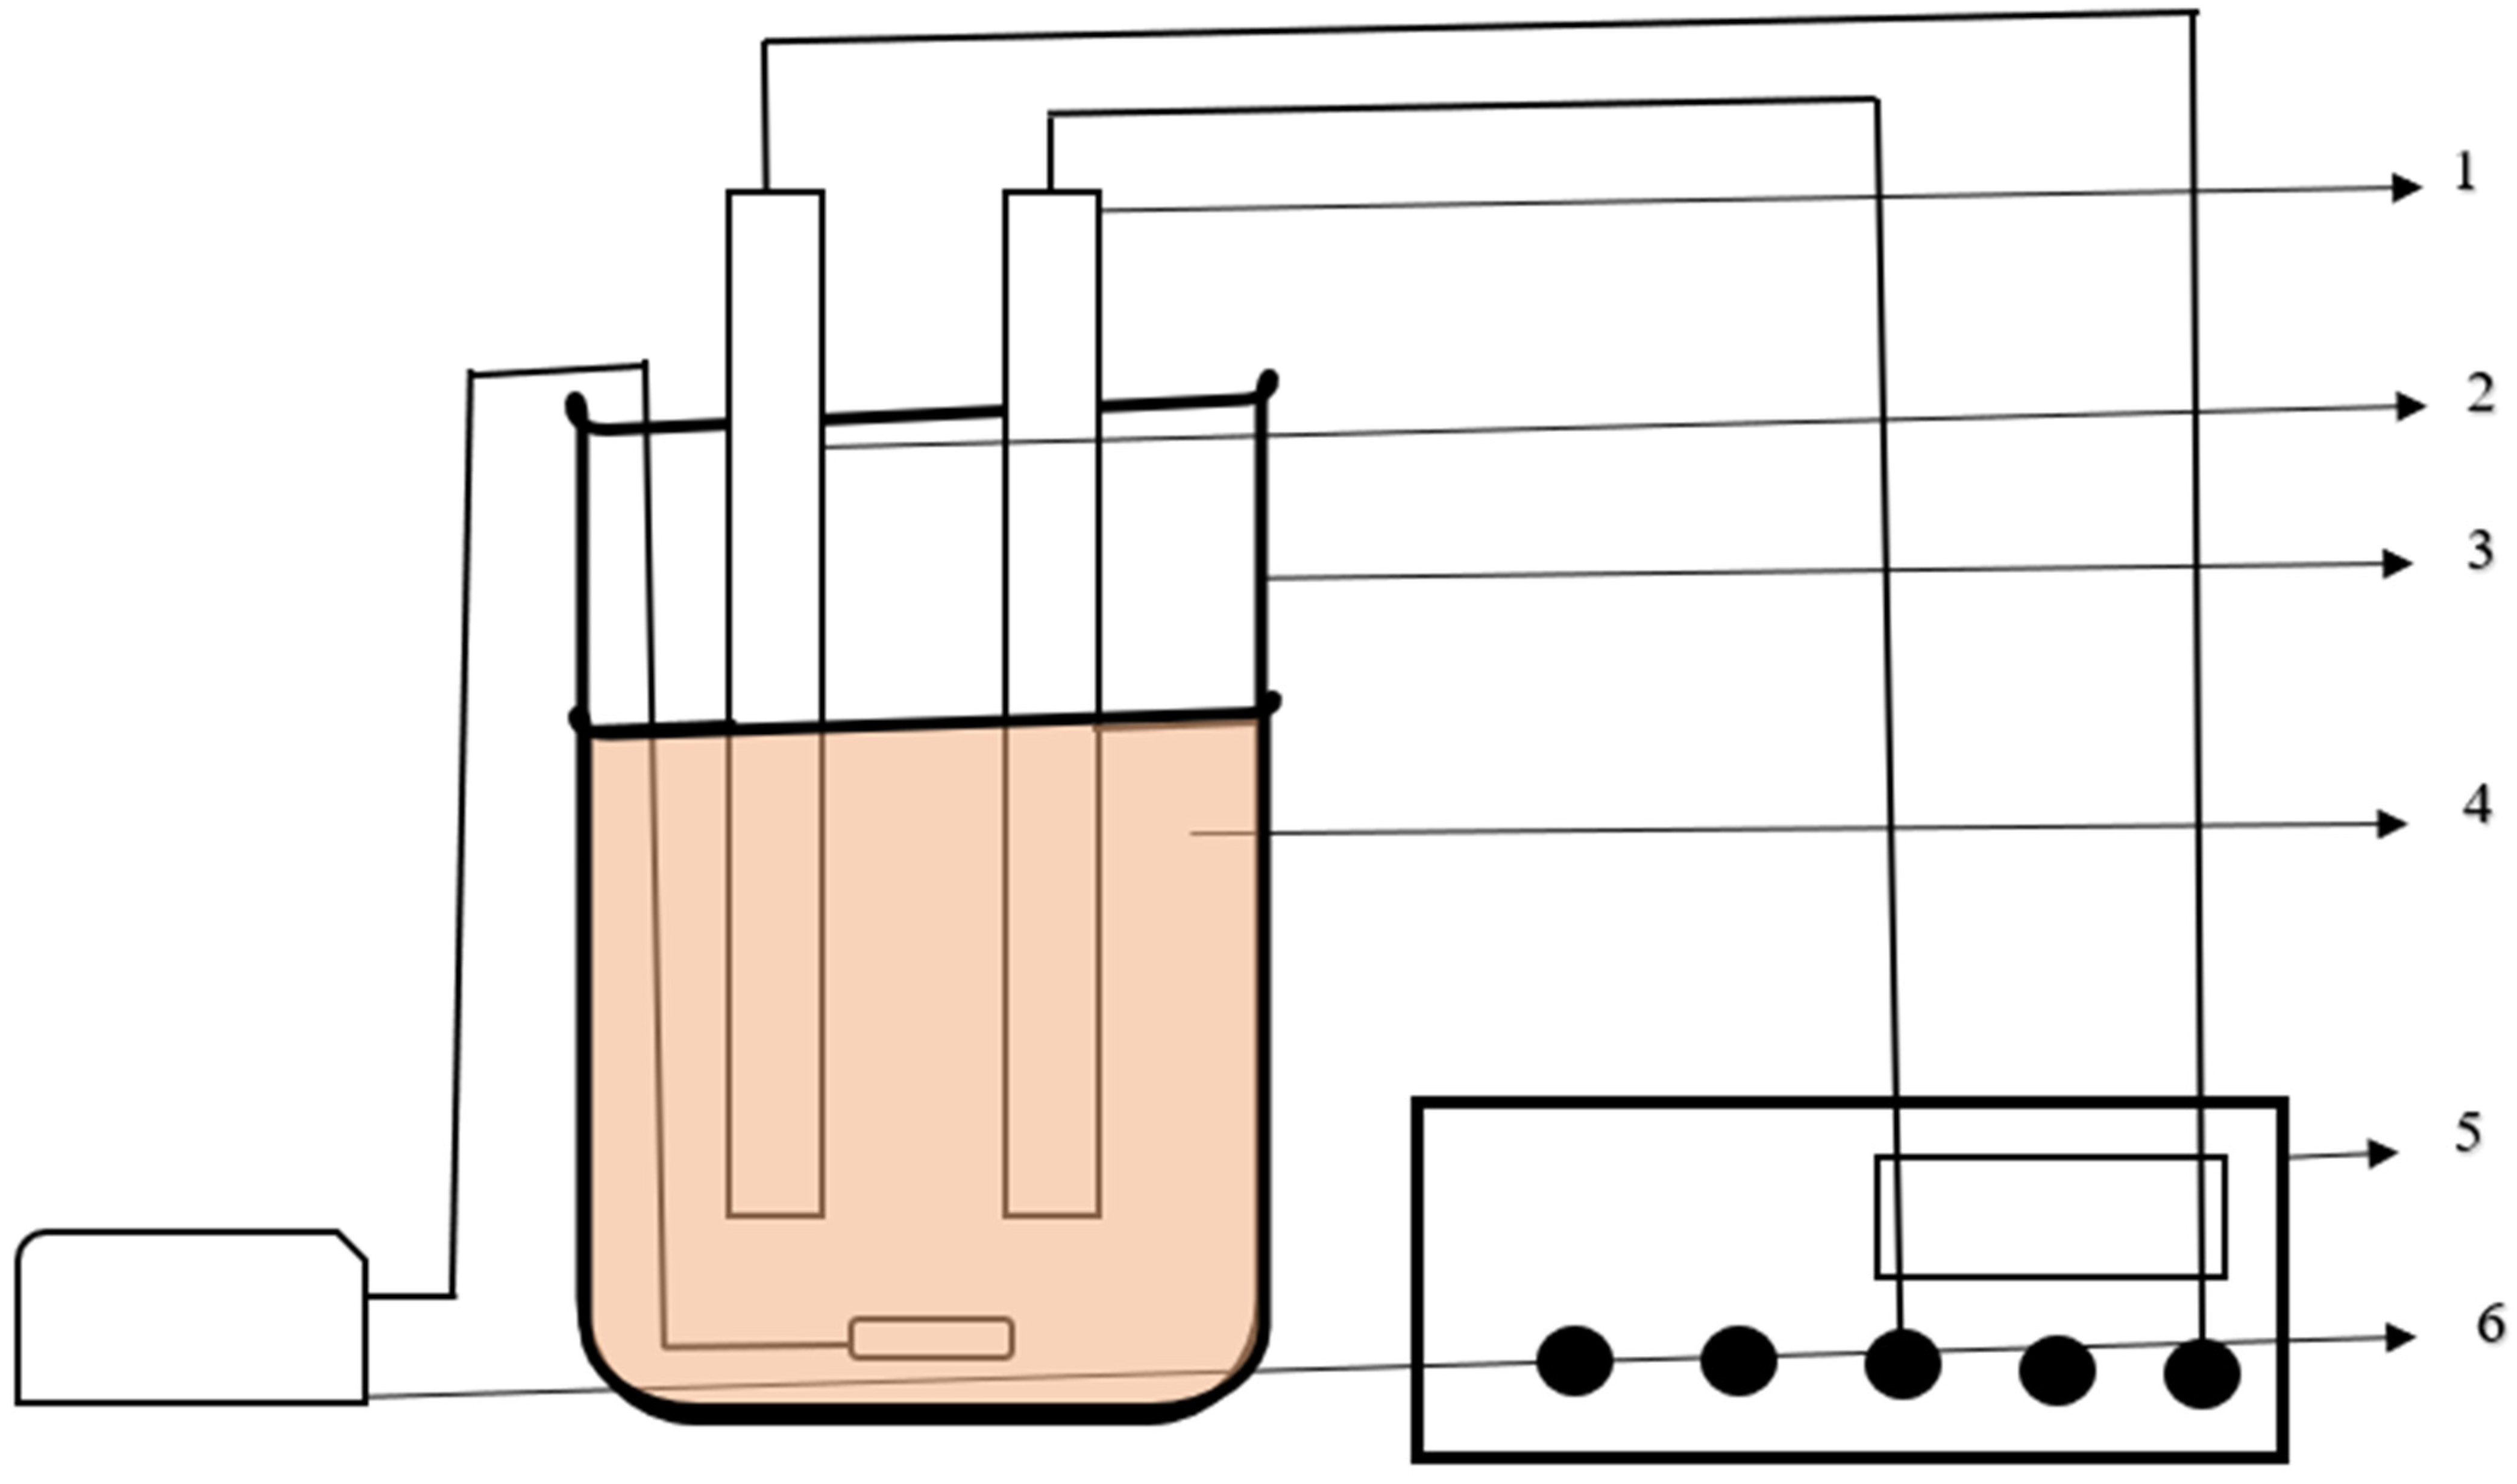
2.2. Batch Reactor Setup

The EF reactor used in this study was a glass cylindrical reactor with a 1 L capacity. About 600 mL of the distillery wastewater was used for each batch experiment. Two parallel facing iron plates of 10 cm × 5 cm × 0.3 cm were used as the anode and cathode electrodes for the EF process. The anode and cathode were connected to a DC power source (0–30 V/0–5 A). A fish tank aerator (MODEL 108, Gujarat, India) was used for continuous aeration. The dipping area of an electrode was 45 cm2, the spacing between the electrodes was maintained as 4 cm, the voltage supply was 5 V, and the electrolysis process was carried out at actual pH initially, and thereafter, the respective optimization studies were carried out under different conditions. A schematic diagram of the reactor is given in Figure 1. The electrolysis process was conducted for 1.5 h. About 5 mL of sample was collected every 10 min and analyzed immediately.

2.3. Batch Optimization Studies

To optimize the conditions required for acquiring higher COD removal efficiency by the EF process, batch experiments were conducted by varying the pH of the wastewater sample and altering the voltage supply, dipping area, and spacing between the electrodes. The initial pH of the distillery wastewater sample was varied between 2 and 9 by the addition of 1 N H2SO4 and 1 N NaOH. The voltage supply (V) was adjusted for the whole study in the range of 5 to 15. The dipping area of the electrode and spacing between the electrodes were adjusted by changing the position of the electrodes in the range of 45–65 cm2 and 2.5–6 cm, respectively. The same iron electrode was used for the whole study. The electrodes were washed with 1N H2SO4, 1N NaOH solution, and distilled water at regular intervals. By varying one parameter and keeping the other as constant, the electrolysis process was conducted.

2.4. COD Analysis

The samples collected at regular time intervals (every 10 min for a total duration of 1.5 h) were digested for 2 h @ 150 °C in a COD digestor along with K2Cr2O7 solution as digestion solution and COD acid reagents (H2SO4 and Ag2SO4) in a culture tube. About 2.5 mL of the collected sample, 1.5 mL of digestion solution, and 3.5 mL of COD acid reagent were used for digestion. Digested samples were then titrated at room temperature (30 ± 2 °C) against a ferrous ammonium sulfate solution (FAS; 0.01 N). Ferroin was used as the indicator, and COD (in mg/L) was calculated using the formula given in Equation (5).
COD   = ( a b ) N 8 1000 A m o u n t   o f   S a m p l e   ( mL )
where a is the volume of FAS solution for titration against blank (distilled water) in mL, b is the volume of FAS solution for titration against the sample in mL, N is the normality of FAS, and 8 is the milliequivalent weight of oxygen.
COD removal efficiency (%) was then calculated from Equation (6).
COD   R e m o v a l   E f f i c i e n c y = ( C 0 C C 0 ) 100
where C0 and C are the differences in the COD concentration before and after the electrolysis process [27,29,30].

2.5. Specific Current Consumption

Specific current consumption (Ec) is one of the defining parameters in electrochemical processes and determining its practical and economical usefulness in industry is of importance. Current efficiency can be determined using Equation (7), where v is the voltage in volts (V), I is the average current intensity (A), T is the electrolysis process time (h), V is the volume of effluent treated (L), and C0 and C are the differences in the COD concentration before and after the electrolysis process, respectively [27].
E c = v I T 1000 ( C 0 C )     V

2.6. GC-MS Analysis

The intermediate compounds generated during the EF process were detected using GC-MS analysis. An Agilent 6890 GC system from Agilent Technologies, Santa Clara, USA, equipped with a CTC headspace autosampler and a DB624 capillary column (film thickness—8 µm; inner diameter—0.32 mm; length—30 m) was utilized for the analysis of selected samples collected from the batch study under optimized conditions. The mobile phase used for the analysis was helium gas at a flow rate of 1000 mL min−1. Mass spectrometry was conducted under the following conditions: Electron Multiplier Bias (EMB) mode—relative; relative voltage—200 V; resulting EM voltage—2235 V; detector temperature set at 250 °C. Original distillery wastewater was also subjected to analysis using the same GC-MS setup and conditions to compare the profiles of intermediate compounds before and after treatment with the EF process.

2.7. Statistical Analysis

RSM coupled with CCD was used to evaluate and determine the optimal conditions for the major influencing factors such as H2O2 dosage (A), spacing between the electrodes (B), dipping area of electrodes (C), initial pH (D), and applied voltage (E); as well as the effect of independent variables such as COD removal and the interaction between these variables on response performance. This study was designed at four levels (1, 2, 3, 4) with four factors according to Table 2. Minitab version 22.1 software was also used for ANOVA data analysis.

3. Results and Discussion

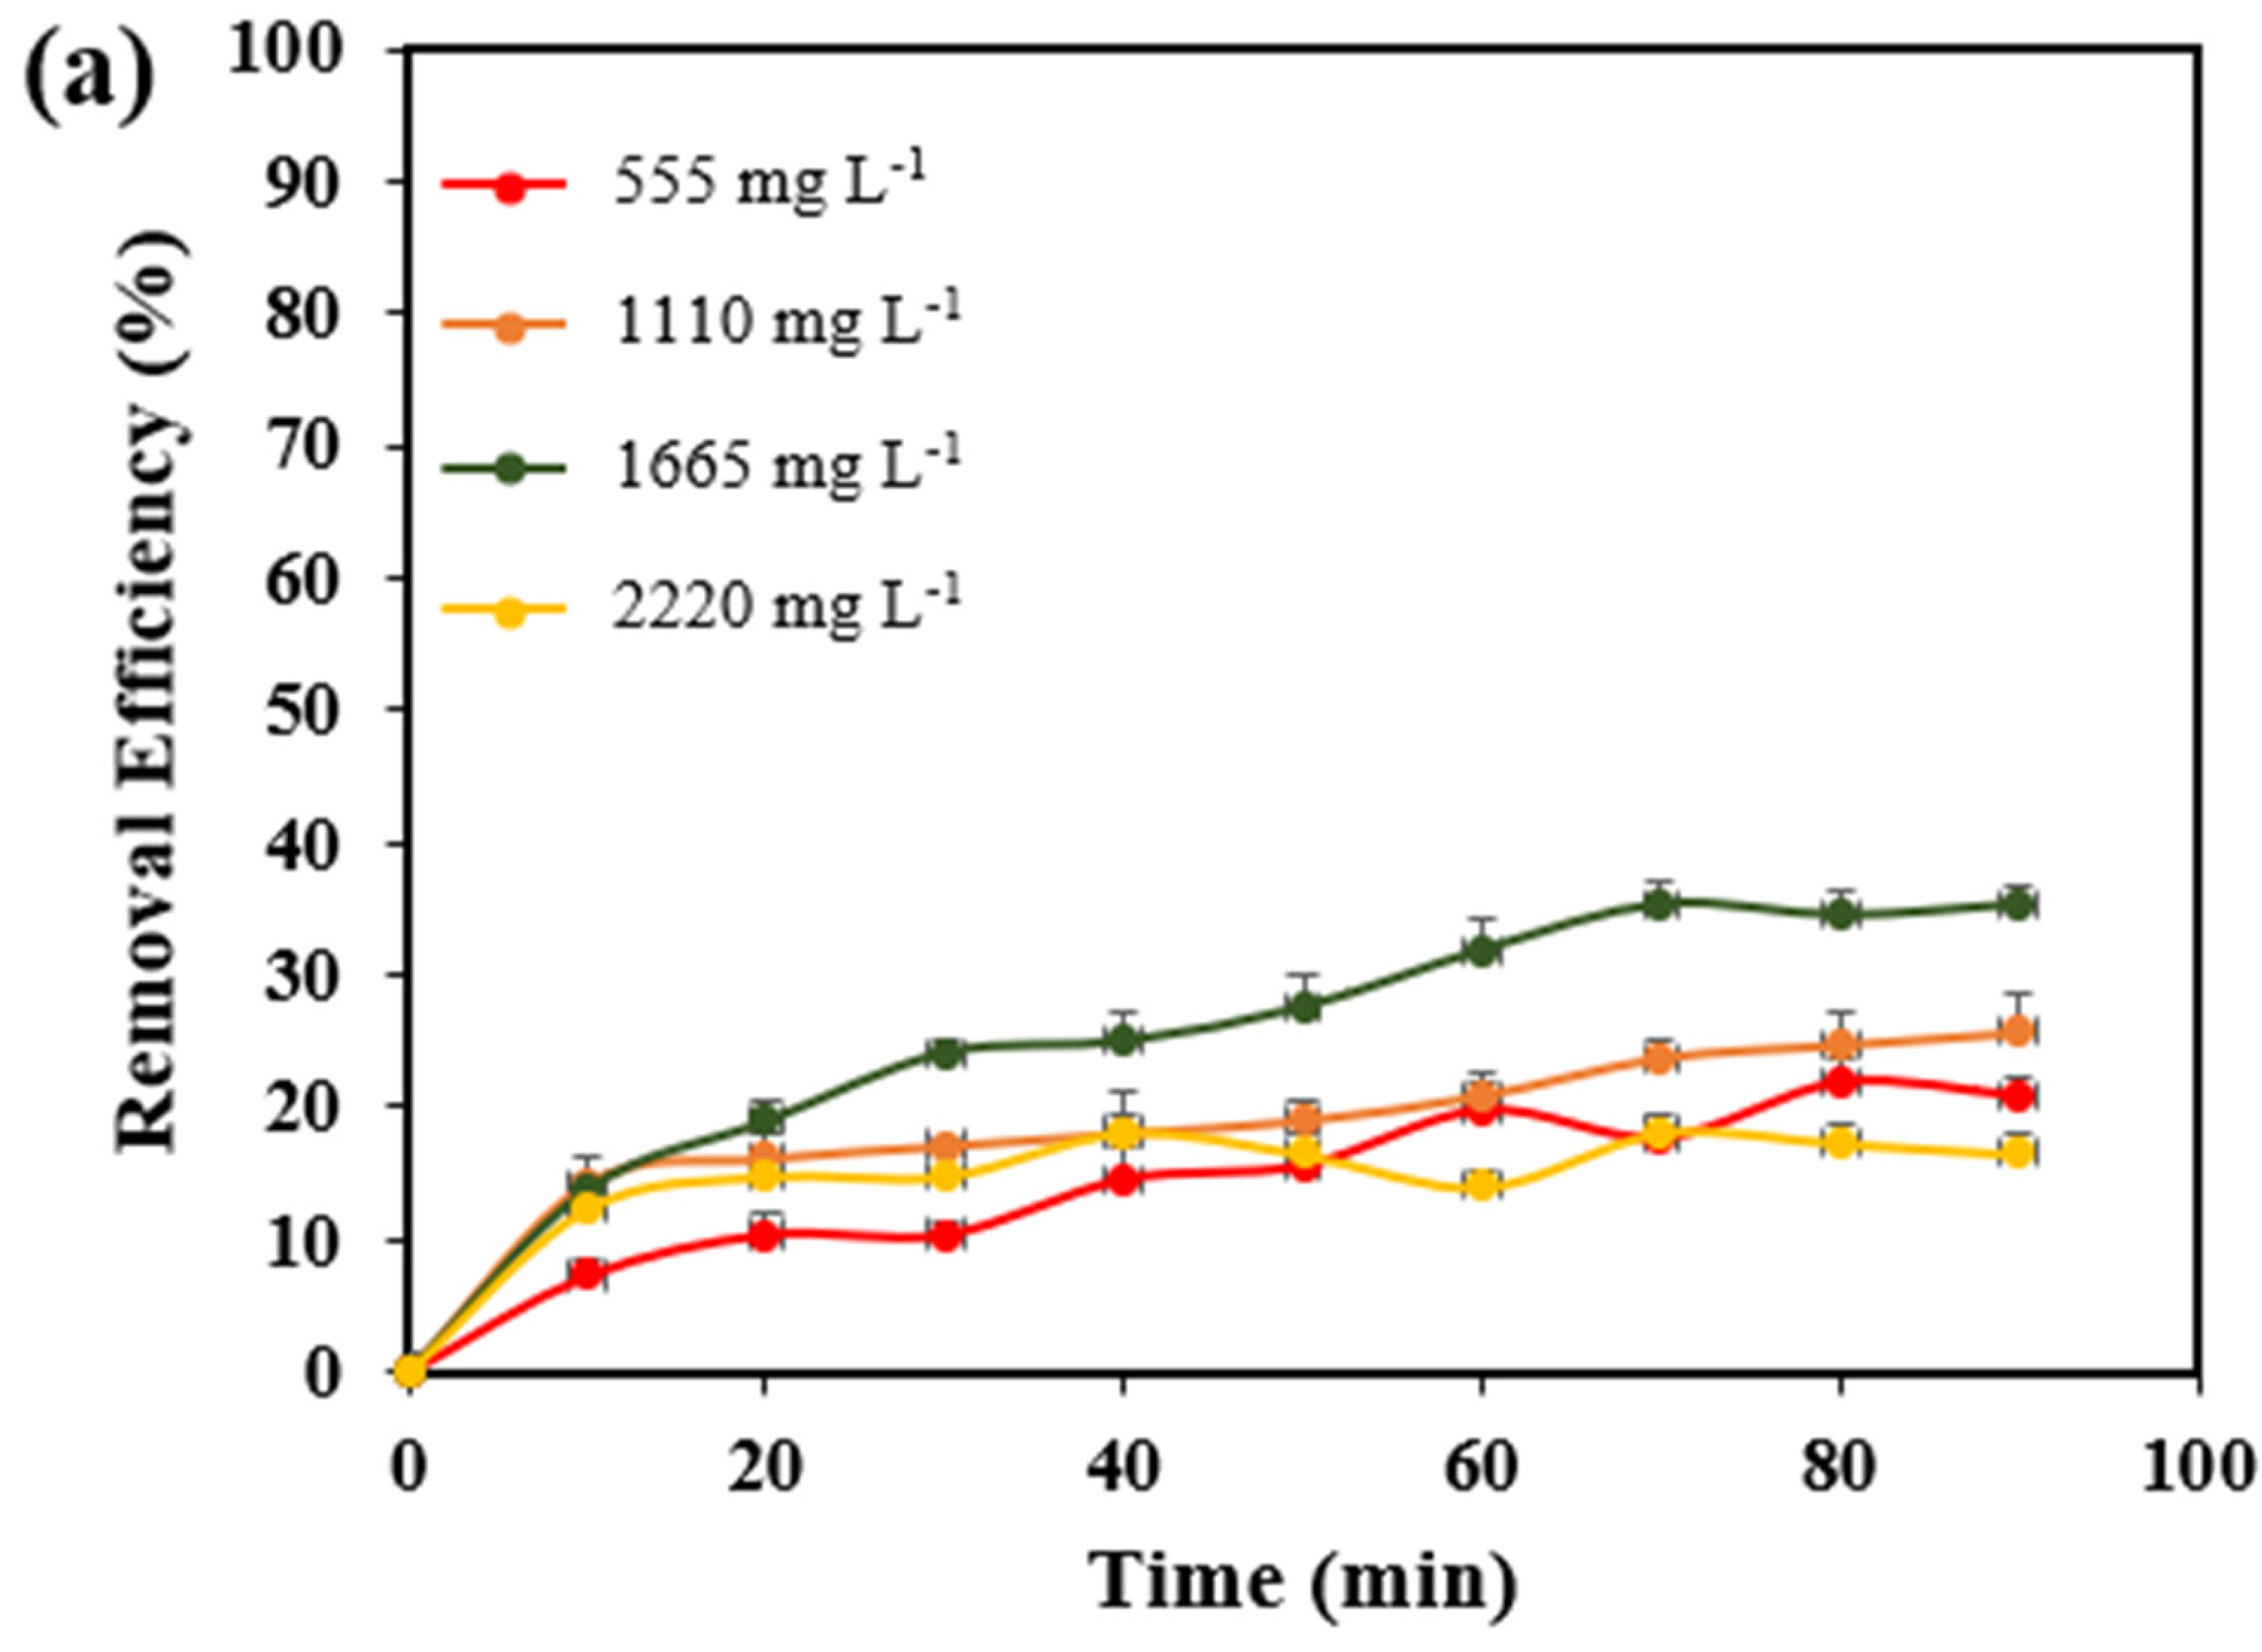
3.1. Optimization of H2O2 Dosage

To achieve the highest possible elimination of organic contaminants and better COD removal efficiency in wastewater, it is crucial to determine an ideal H2O2 dosage. Hence, a batch study on the influence of H2O2 dosage on COD removal efficiency in distillery wastewater was conducted by adjusting H2O2 within a range of 555 to 2220 mg L−1, i.e., 5 to 20% of the theoretical H2O2 dosage. Other experimental conditions, including spacing between the electrodes (4 cm), electrode dipping area (45 cm2), continuous voltage (5 V), and solution pH (4), were maintained as constant. The maximum COD removal efficiencies attained in distillery wastewater with an initial COD of as high as 5500–6000 mg L−1 were 21.9% at 80 min, 25.7% at 90 min, 35.3% at 70 min, and 18.2% at 40 min, when the H2O2 dosage was 555 mg L−1, 1110 mg L−1, 1665 mg L−1, and 2220 mg L−1, respectively. As shown in Figure 2a, at a concentration of 1665 (13%) mg L−1 of H2O2 dosage, the highest level of COD removal efficiency (35.3%) was achieved, thereby establishing it as the optimal dosage. The specific current consumption increased with increasing H2O2 dosage (9.18 to 19.07 Wh g−1 COD).
Mostly, the degradation efficiency of organic pollutants increases with an increase in the H2O2 concentration. Hameed and Lee [31] described this phenomenon and stated that the addition of H2O2 increases the rate of organic pollutant degradation by allowing an enrichment of hydroxyl radical (OH°) formation. Subsequently, the COD removal efficiency is expected to enhance in wastewater. However, a higher H2O2 dose in turn increases the operational costs and also becomes a powerful OH° scavenger, thereby causing negative effects on organic pollutant degradation [32]. Generally, excess H2O2 would produce hydroperoxyl radicals (HO2°), as shown in Equation (8).
H2O2 + OH° → HO2° + H2O
Although HO2° is a potential oxidizing agent and is capable of triggering radical chain mechanisms, its oxidation capacity typically falls short in comparison to that of the OH° radicals [33]. The oxidative degradation of organic compounds in wastewater occurs exclusively through the interaction between OH° and the HO2° radicals, significantly lowering the reactivity as given in Equations (9) and (10), and subsequently reducing organic pollutant degradation [34,35].
HO2° + OH° → H2O + O2
H2O2 + HO2° → OH° + O2 + H2O
Previously, Malik et al. [10] explored distillery wastewater treatment by the oxidation process and witnessed reductions in color, COD, and toxicity. Rafiee et al. [36] witnessed that the COD of effluent decreased to the lowest possible (51.5% change) when the dose of H2O2 was 40 mg L−1. Afolabi et al. [37] recorded COD removal of 93.16% in brewery wastewater using the EF process with a H2O2 dosage of 2000 mg L−1. When the H2O2 dosage was increased to 4000 mg L−1, the COD removal efficiency decreased. Hakika et al. [38] treated sugarcane vinasse using the EF process and found 48.1% COD removal at a H2O2 to COD ratio of 0.62 and a H2O2 to Fe3+ ratio of 50 g g−1. According to Sarto et al. [39], higher H2O2 ceases the production of OH° and produces HO2° which has a weaker oxidation potential than OH°, resulting in a decrease in the rate of organic degradation in wastewater. Indeed, surplus addition of H2O2 should be avoided in the EF process, since excess amounts of H2O2 contribute to COD [37].

3.2. Optimization of Spacing between the Electrodes

The most suitable electrode spacing is essential in all electrochemical processes for better efficiency [40]. According to Chen et al. [41], when the spacing between the cathode and anode is too small, considerably large quantities of particle electrodes would drift away from the anode and cathode, causing the inability of the particle electrodes to polarize, thus reducing the removal efficiency of pollutants. On the other hand, with a large anode–cathode gap, resistance would increase, resulting in an increase in input energy and causing massive waste of electrical energy on side reactions, including H2 and O2 release. Longer or shorter electrode spacing strongly influences the wastewater treatment efficiency of the EF process, as reported in previous literature [42,43]. Hence, in this study, the electrode spacing was varied between 2 and 6 cm, and the other conditions (H2O2 dosage: 1665 mg L−1; dipping area of the electrode: 45 cm2; voltage: 5 V; solution pH: 4) were maintained as constant, and the COD removal efficiency in distillery wastewater was determined. As can be seen in Figure 2b, a decrease in the COD removal efficiency (25.9%) was observed when the spacing between electrodes was increased from 4 to 6 cm. Conversely, the COD removal efficiency (64.3%) increased with a decrease in the distance between electrodes (from 4 cm to 2.5 cm). Thus, about 2.5 cm of distance between the electrodes was concluded to be the optimal electrode spacing for accelerated pollutant degradation in distillery wastewater by the EF process. The specific current consumption increased with increasing the distance between the electrodes (12.3 to 27.35 Wh g−1 COD).
According to Yasri et al. [44] and Priyadharshini and Saravanakumar [30], when the distance between the electrodes is less, there will be an increase in current flow and a decrease in cell resistance, as per Ohm’s law. Reducing the distance between electrodes has the potential to mitigate the limitations imposed by mass transfer on the transport of organic pollutants towards the electrode surface, thereby enhancing their electrochemical conversion. On the other hand, when the electrodes are placed too close, the Fe2+ ion produced by electrical reduction, as given in Equation (11) in continuation with Fe2+ ions, is easily oxidized to Fe3+ ions at the anode (Equation (12)), which reduces the COD removal efficiency in wastewater.
Fe3+ + e → Fe2+ (Cathode)
Fe2+ → Fe3+ + e (Anode)
In a similar investigation, Xiao et al. [45] witnessed a superior organic pollutant removal and efficient COD removal when the electrodes were spaced at a distance of 2 cm compared with 0.5 cm and 3.5 cm. He and Zhou [34] and Behrouzeh et al. [46] witnessed a significant increase in electrical energy consumption and a decrease in COD removal efficiency with a greater increase in the distance between the electrodes in the EF process.

3.3. Optimization of Electrode Dipping Area

The dipping area of the electrode is also one of the factors that influence the COD removal efficiency in wastewater by the EF process. According to Meddah et al. [47], an increase in the electrode dipping area and current density results in an increase in the concentration of Fe2+; this is a prerequisite and crucial in an EF process. Fe3+ is produced through the oxidation of Fe2+, and the concentration of both Fe2+ and Fe3+ considerably affects the overall effectiveness of the pollutant degradation and the resultant COD removal efficiency in wastewater [43,48]. In the current study, the area of electrode dipping was varied in the range of 35 to 65 cm2, and the potential of COD removal in distillery wastewater was explored while the other factors were maintained as constant as follows: H2O2 dosage as 1665 mg L−1; spacing between the electrodes as 2.5 cm2; constant voltage as 5 V; solution pH as 4. The COD removal efficiency was found to increase (up to 71.4%) with an increase in the electrode dipping area, i.e., from 45 to 55 cm2 (Figure 2c). The COD removal efficiency was reduced to 36.7% when the electrode dipping area was reduced to 35 cm2. As the concentration of Fe2+ increased with an increase in the electrode dipping area, the rate of COD removal showed an initial incline followed by a subsequent decline, as can be seen in Figure 2c. The observed trend could be attributed to the phenomenon that the increased levels of Fe2+ lead to greater production of OH°, a highly powerful oxidizing agent accountable for the accelerated decomposition of COD in the solution [49,50]. Upon further expansion of the surface area to 65 cm2, a notable decrease in the rate of COD removal to 65% was observed. This reduction may potentially be attributed to an excess of Fe2+ reacting with OH°, resulting in a significant production of Fe3+ as illustrated in Equation (13), consequently leading to the increased formation of iron sludge.
OH° + Fe2+ → Fe3+ + OH
Additionally, the interaction of hydrogen peroxide with Fe3+ leads to the formation of HO2° (Equation (14)), causing a decline in the catalytic oxidation ability for decomposing COD and a rise in the energy usage of the procedure [51].
Fe3++ H2O2 → HO2° + H+ + Fe2+
In this study, an electrode dipping area of 55 cm2 was concluded to be the optimum for use in further experiments. Divyapriya and Nidheesh [52] stated that iron coated graphene electrodes can influence the removal efficiency of COD in wastewater without adding any external chemicals. Conversely, Wang et al. [53] found that the COD removal efficiency of using Fe electrodes was lower compared with Al electrodes. Wang et al. [54] recorded maximum COD removal efficiency (71.9%) when the Fe-Fe electrodes and H2O2 were added to the EF system at an initial pH of 3 after reaction for 3 h. In the future, the combination of different electrodes could be explored for efficient COD removal in distillery wastewater by the EF process. The specific current consumption was reduced with increasing the electrode dipping area (24.9 to 16.1 Wh g−1 COD).

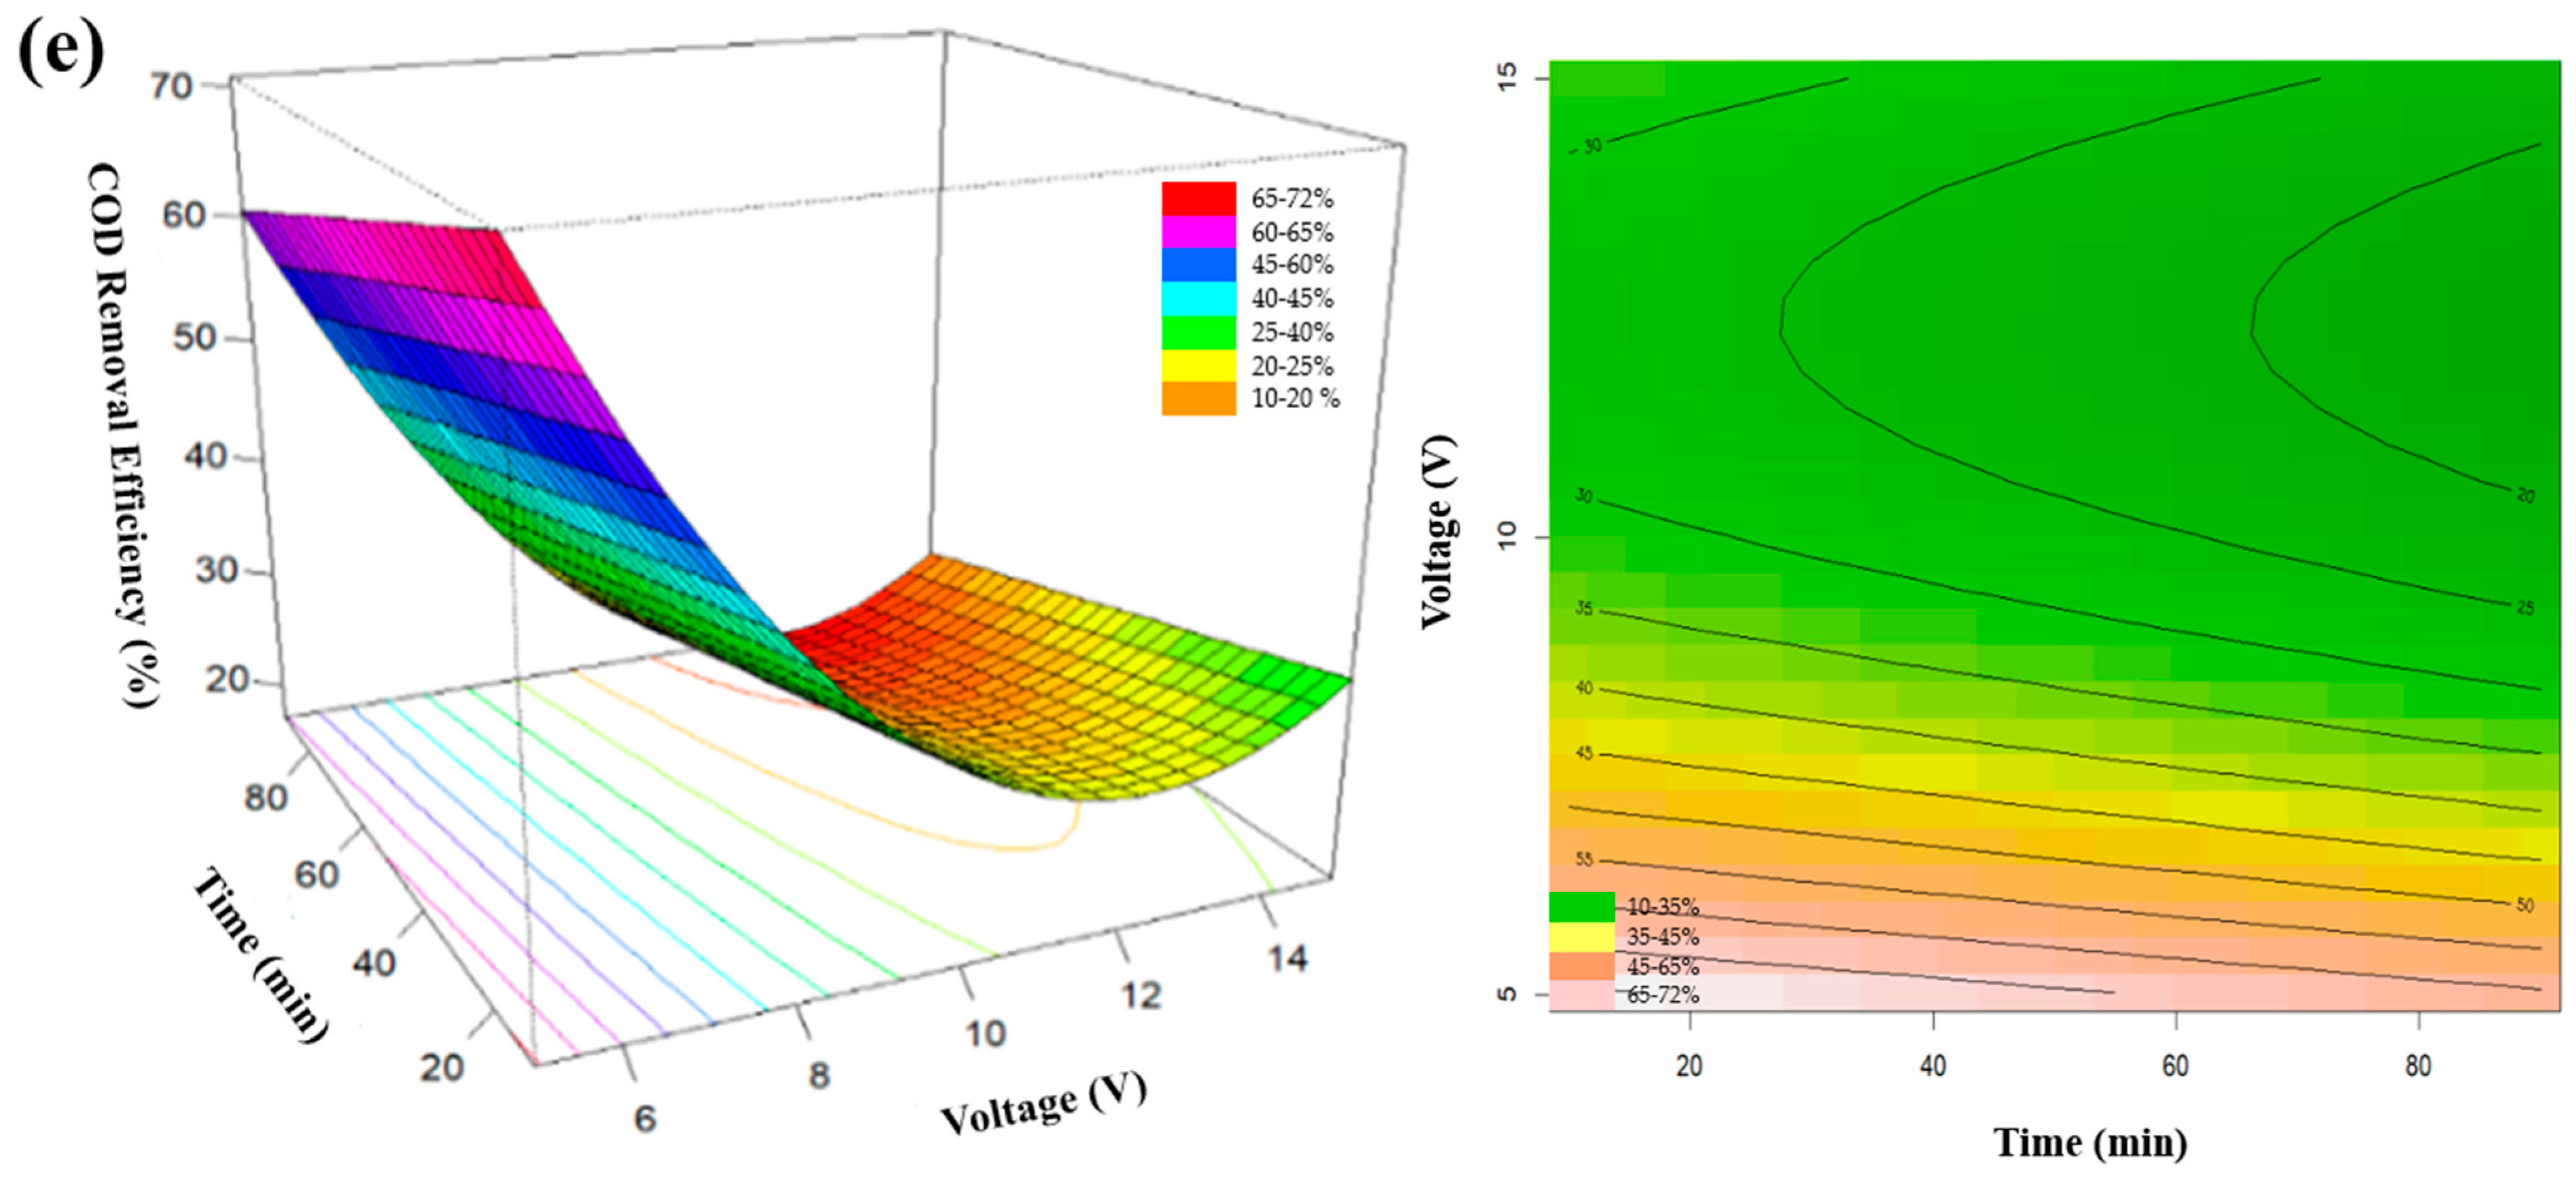
3.4. Optimization of Applied Voltage

The EF process is regulated by the applied current density or voltage supply, which is regarded as a crucial electrokinetic parameter in this procedure due to the fact that the quantity of electrons needed for the reduction of O2 is influenced by the applied current, the number of metal ions that separate from the electrode surface, and the cost of the treatment process. Consequently, the concentration of the electro-generated oxidizing mediator species is established by the level of the applied current [55,56]. Figure 2d shows the COD removal with time at different current voltage supplies (5 to 15 V) with 1665 mg L−1 H2O2 dosage, 2.5 cm electrode spacing, 55 cm2 electrode dipping area, and solution pH 4. In this study, when the current density in terms of constant voltage supply was increased from 5 to 7.5 V, a higher COD removal efficiency of 76.4% at an electrolysis time of 20 min was achieved. A further increase in constant voltage supplies from 7.5 to 15 V caused more than 50% of COD removal at the electrolysis time of 10 min. The specific current consumption at 5 V was 23.94 Wh g−1 COD. Likewise, specific COD removal/unit energy at 5 V accounted for 15.03 g COD Wh−1. The findings make it clear that increasing the current density to a certain point may speed up the reaction rate, which in turn enhances the elimination of contaminants [57,58]. Raising the current flow through the sample causes the iron electrodes to break down even more and produces OH°, which raises the current density and ultimately improves the process efficiency [59,60].
Like this study, Alkurdi and Abbar [61] found that an increase in current density led to an increase in the efficiency of COD removal in wastewater. However, an excessive increase in electric current could lead to an increase in the occurrence of unfavorable and interfering reactions within the reactor, thereby reducing the effectiveness of the process [62]. Behrouzeh et al. [46] and Chen et al. [63] explained that the excessive current density generally results in an escalation in the rate of regeneration of Fe2+ ions, which is forced by the continuous reduction of Fe3+ ions occurring at the cathode’s surface in the reactor as per Equation (11). Subsequently, the excess amounts as indicated in Equation (13) prompt the elimination of OH° and thereby limit the organic pollutant degradation. Further, elevating the current intensity also amplifies interfering reactions, such as the release of O2 and H gases from the surfaces of the anode and cathode, in accordance with Equations (15) and (16), respectively.
2H2O → 4H+ + O2 + 4e (Anode)
2H+ + 2e → H2 (Cathode)
Additionally, when OH° is introduced into the electrochemical reactor, it disintegrates into H2O at elevated voltages and reduces the COD removal efficiency, as can be seen in Equation (17).
H2O2 + 2H+ + 2e → 2H2O (Cathode)
In a study focusing on the treatment of leachate, Zhang et al. [64] observed that the efficiency of COD removal reached 89.2% when the applied current was 250 mA; however, it decreased to 79.3% when the current was increased to 300 mA. Li et al. [65] witnessed 100% organic pollutant removal at 15, 20, and 25 mA cm−2 current densities during 12 to 16 min electrolysis processes. Yao et al. [66] recorded an increase in COD removal efficiency from 78.4 to 95.3% as the current density increased from 5.0 to 12.5 mA cm−2. Ghimire et al. [67]’s experiment showed 97.6% pollutant removal at an electric voltage of 5 V, whereas only 68% of the pollutant was removed at 3 V in domestic wastewater. It is thus important to note that adjusting the applied current density is crucial to achieving a balance between the desired efficiency and energy expenditures in the EF process [34]. The results of this study were consistent with the results of organic pollutant removal by the EF process studied by Hasani et al. [28], Wang et al. [53], and Martinex and Bahena [68].

3.5. Optimization of Initial pH

pH is one of the significant parameters in the EF process, as it influences the production of OH° and the concentration of Fe2+ and Fe3+ ions that determines the COD removal efficiency in wastewater [67]. In this study, when the solution pH was adjusted from 4 to 3, it significantly improved the COD removal efficacy from 57 to 79.5% over a period of 1 h (Figure 2e). Further, reducing the solution pH to 2 caused a decrease in the COD removal efficiency to 30%. Ghanbari and Moradi [69] and Ozcan et al. [70] have reported that the optimal pH for the EF process is approximately 3. The specific current consumption and specific COD removal/ unit energy were reduced by increasing the pH of the sample. In optimum conditions, the specific current consumption and specific COD removal/unit energy were 18.47 Wh g−1 COD and 24.33 g COD Wh−1, respectively. Typically, the EF reaction takes place under acidic conditions, with pH levels typically falling between 2 and 4, and the most favorable pH value identified by Davarnejad and Azizi [71] for the generation of OH° was 2.8. In this study, the efficiency of the EF process experienced a significant decline at elevated pH levels, particularly above 5. This phenomenon can be attributed to the instability of H2O2 in neutral to alkaline conditions, leading to rapid decomposition into O2 and H2O [72]. Generally, Fe3+ begins to precipitate as amorphous Fe(OH)3(s) above pH 5. By partially coating the electrode surface, the production of Fe(OH)3(s) prevents Fe2+ regeneration and also lowers the dissolved Fe3+ concentration, thereby limiting pollutant degradation [73].
Yazici Guvenc et al. [74] reported a poor efficiency in COD removal at pH > 3, as it caused the formation of ferric hydroxide complexes with a much lower catalytic capability than Fe2+. Furthermore, a low pH also promotes H2 evolution, according to Equation (18), reducing the number of active sites for generating Fe2+ ions.
H2O + e → 1/2H2 + OH
But for the reasons listed below, extremely low pH values also have a negative impact on system performance. First, under low pH levels, H2 evolution is also encouraged, which lowers the quantity of protons available to produce H2O2 (Equation (17)) and encourages H2O2 breakdown (Equation (16)) [53,75]. Second, due to their sluggish reaction with H2O2, iron complex species (Fe(H2O)6)2+) decrease the pace at which OH is generated in low-pH environments [76]. The occurrence of Fe(H2O)62+ is also influenced by the concentration of Fe2+. Ultimately, H2O2 tends to produce stable oxonium ions (H3O2+) in the presence of highly concentrated protons, which decreases H2O2’s reactivity with Fe2+ and ultimately reduces COD removal efficiency in wastewater [34,72]. Ayoub [77] indicated 93.5% COD removal at optimum values of pH 3, H2O2 dose of 8.4 g L−1, and reaction time of 50 min. Adimi et al. [78] recorded an optimum COD removal of 65% at pH 2.96 and a reaction time of 89.5 min in petrochemical wastewater. Wang et al. [75] also showed that increasing the solution pH had a negative effect on COD removal efficiency, and 3 was the optimal solution pH for maximum COD removal in wastewater.

3.6. Determination of Kinetics

The speed of chemical reactions is commonly assessed using kinetic models. The determination of the reaction rate is calculated in terms of concentration per unit time [79]. The decrease in the concentration of the reactant in the unit time or the increase in the concentration of the product in the unit time is the basis for calculating the reaction rate [80]. In this paper, the kinetics of the process were assessed using the pseudo-first-order kinetic model at the optimum conditions as achieved in previous stages.
The equation used for calculating the pseudo-first-order model for COD removal in distillery wastewater is given in Equation (19), as described by Behrouzeh et al. [46] and Eddy et al. [81].
L n ( C 0 C ) = k t
where C0 and C are the initial and final COD concentrations, respectively, and k is the removal rate constant value. The rate constant value is calculated by plotting Ln(C0/C) vs. contact time (t). Half-life is then calculated using Equation (20) as given by Bajpai and Katoch [82].
t1/2 = 0.693/k
The pseudo-first-order model results related to COD removal in distillery effluent are shown in Figure 3. As detected, the regression coefficient (R2) for the pseudo-first-order model was 0.944, which indicated the suitability of the pseudo-first-order model. The result of this study is consistent with the findings of Hasani et al. [28] and Babuponnusami and Muthukumar [83]. The parameters of the kinetics shown in Figure 4 indicated the presence of a good linear relationship. Moreover, it was witnessed that the COD removal in distillery effluent by the EF process follows pseudo-first-order kinetics; the obtained results showed that the studied system has excellent potential for the treatment of distillery effluent. The rate constant (k) of the pseudo-first-order model for COD removal in distillery effluent by the EF process was 0.0242 min−1. Similar studies conducted by Li et al. [19], Behrouzeh et al. [46], Ting et al. [84], Sopaj et al. [85], and Gamarra-Giiore et al. [86] showed that the degradation of organic pollutants by the EF process follows pseudo-first-order kinetics. In addition, the half-life (t1/2) of COD removal in the studied system was 28.63 min. Likewise, Hasani et al. [28] observed a t1/2 of 27.4 min for organic pollutant removal using the EF process from aqueous solutions.

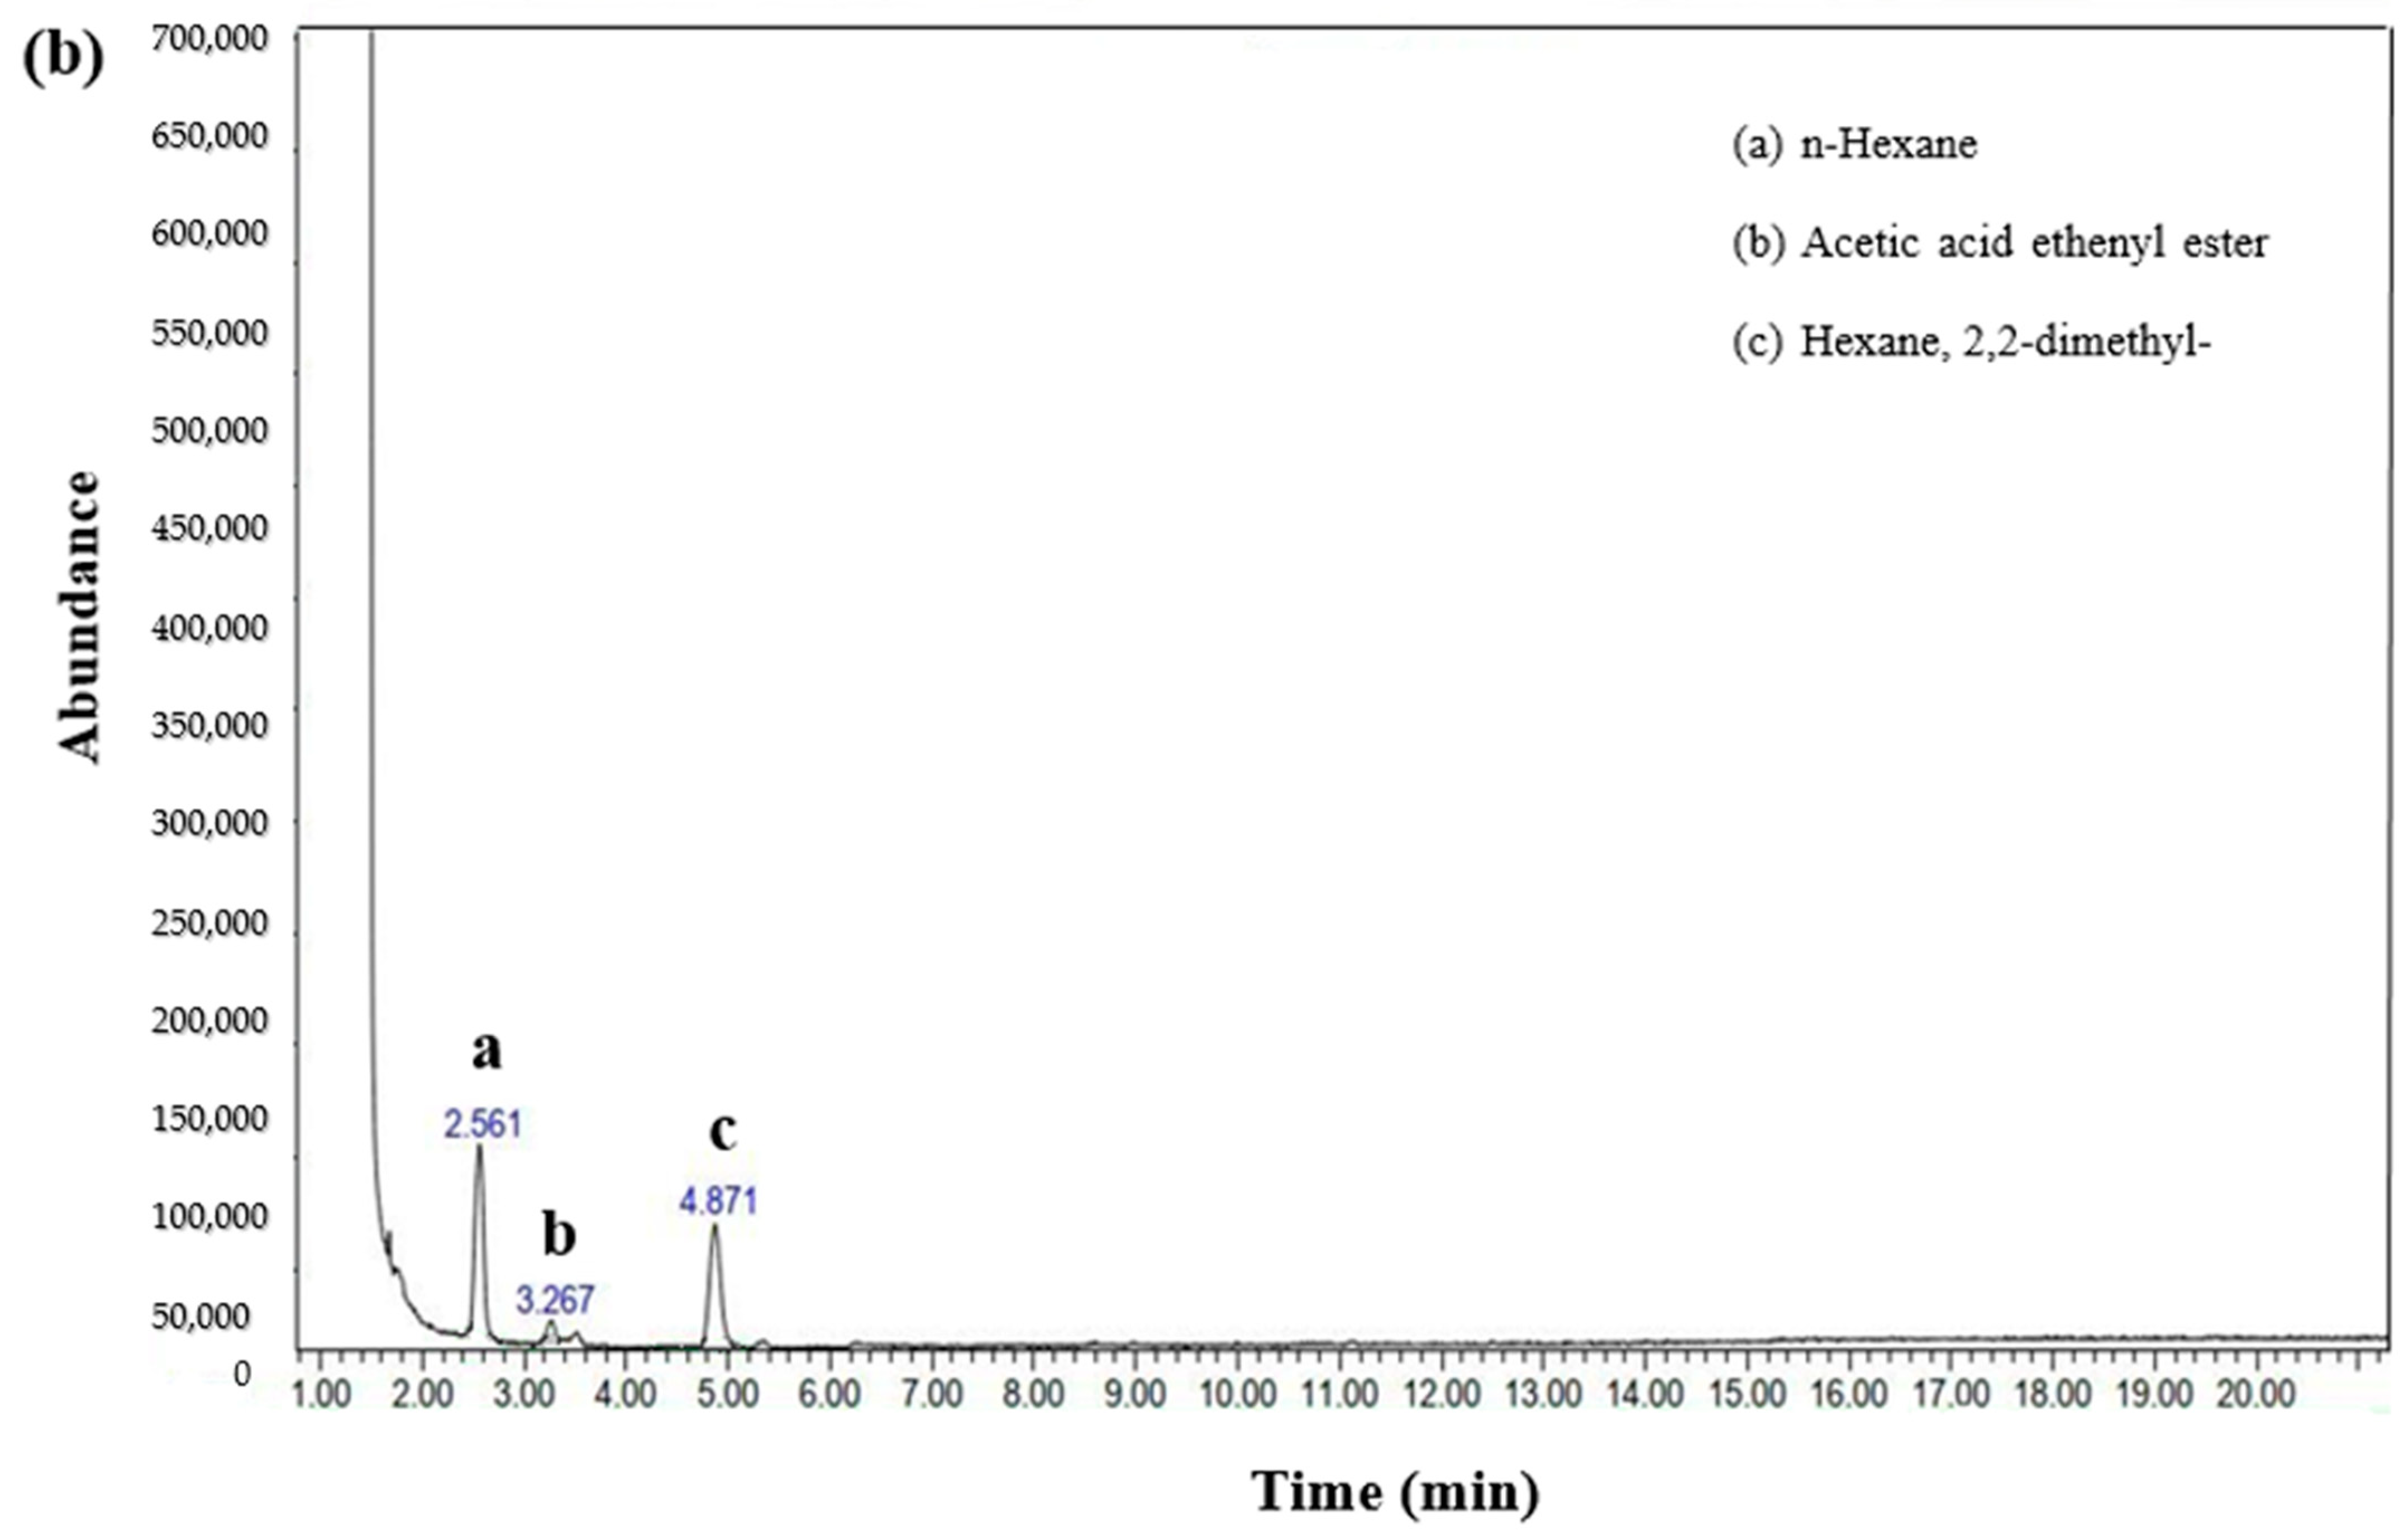
3.7. Organic Compound Transformation in Distillery Wastewater via the EF Process: GC-MS Insights

The GC-MS analysis identified several organic compounds in raw distillery wastewater and their corresponding retention times: 1-Ethynyl-2-methylbicyclo [3.1.0]hexane (118 g mol−1) (C9H10) (RT: 6.72 min), diacetone alcohol (116 g mol−1) (C6H12O2) (RT: 7.97 min), 2,4-Diphenyl-1-butene (208 g mol−1) (C16H16) (RT: 20.69 min), 3-cyclohexene-1-carboxylic acid (126 g mol−1) (C7H10O2) (RT: 21.34 min), 1-methylsilacyclohexane (114 g mol−1) (C6H14Si) (RT: 21.49 min), and Carbamic acid, 2-(dimethylamino)ethylester (247 g mol−1) (C13H17N2O3) (RT: 26.7 min), as shown in Figure 4a. These compounds were initially present in the distillery wastewater with a high chemical oxygen demand (COD) level of 6000 mg L−1. After treatment with the EF process under optimized conditions (5 V voltage supply, pH 3, 5000 mg L−1 H2O2 dosage, 2.5 cm electrode spacing, and 55 cm2 electrode dipping area) for 30 min, GC-MS analysis detected byproducts with lower molecular masses: n-Hexane (86 g mol−1) (C6H14) (RT: 2.56 min), Acetic acid ethenyl ester (86 g mol−1) (C4H6O2) (RT: 3.26 min), and 2,2-dimethyl Hexane (114 g mol−1) (C8H18) (RT: 4.87 min) as illustrated in Figure 4b. These byproducts are potentially less toxic when the treated wastewater is discharged back into the environment, highlighting the efficacy of the EF process in reducing biological toxicity, similar to observations by Hasani et al. [28] using sono-electro-Fenton processes.
The EF process induces the degradation of the original compounds in distillery wastewater through specific pathways. For instance, n-Hexane (C6H14) forms through the hydrogenation of longer-chain hydrocarbons present in the wastewater, likely derived from breakdown products such as 1-Ethynyl-2-methylbicyclo[3.1.0]hexane or 2,4-Diphenyl-1-butene. Acetic acid ethenyl ester (C4H6O2) is generated through esterification reactions involving acetic acid and an ethenyl group, potentially originating from the oxidation or fragmentation of larger organic molecules like diacetone alcohol. Similarly, 2,2-dimethyl hexane (C8H18) is likely produced via isomerization or rearrangement reactions of hexane derivatives in the wastewater, possibly originating from other hexane isomers or alkyl-substituted compounds like 1-methylsilacyclohexane. These pathways illustrate the critical role of hydroxyl radicals generated during the EF process in oxidizing and degrading diverse organic contaminants, converting complex nitrogen-containing compounds into simpler, less harmful substances. Ultimately, this transformation process enhances the quality of distillery wastewater prior to its discharge into the environment.

3.8. ANNOVA and RSM-CCD Optimization Statistical Model

In addition to data analysis using ANOVA, the RSM approach using CCD was employed for modeling. Similar to Jasni et al. [87], Bouyakhsass et al. [88], and Kumar [89], the current investigation also used RSM and CCD as an optimization technique. In this study, H2O2 dosage, spacing between the electrodes (ES), dipping area of the electrode (DA), initial solution pH, and applied voltage supply were studied as variables (independent factors). Each independent variable was coded, and their four values are given in Table 2. COD removal efficiency was considered to be the dependent factor (response). The selection of variable values and their ranges was based on preliminary assessments, as illustrated in Table 3, which presents the experimental conditions. The dependent variables were accommodated within quadratic regression models, and the appropriateness of the fit was assessed. The evaluation of the model considered parameters such as R2, predicted R2, coefficient of variance, and the p-values of the model. The outcomes of the analysis of variance (ANOVA) derived from Minitab version 22.1 software for COD removal in distillery wastewater via EF, along with the significance of the quadratic model and coded coefficient, are detailed in Table 4a,b. The model is considered statistically significant since the p-value was less than 0.05. The coefficients of the standardized equation and the F-value emphasized the notable impact of pH and electrode spacing. Moreover, the correlation coefficient (R2 = 0.91) was found to align with the adjusted correlation coefficient (R2adjusted = 0.804), indicating a satisfactory fit for the proposed model. Hence, the refined quadratic model demonstrated a good alignment with the dataset. Notably, at lower pH levels (pH < 4), an enhancement in COD removal efficiency was observed with decreased electrode spacing, whereas at higher pH levels (pH > 4), the efficiency diminished with an increase in electrode spacing. Augmented distance between the electrodes resulted in increased bulk resistance within the electrolyte medium and required a higher potential difference to sustain galvanostatic conditions. The excess energy provided was dissipated as heat, with increased temperatures corresponding to a higher electric current [27]. The equation for computing COD removal is provided in Equation (21).
Regression equation in uncoded units:
COD Removal Efficiency = 94.5 − 0.0162 H2O2 dosage − 11.20 ES + 0.777 DA − 16.8 pH − 1.24 voltage
From the RSM-CCD results, the optimal conditions required for yielding a maximum COD removal efficiency (70.8%) in distillery wastewater treatment by the EF process were calculated to be 1408 mg L−1 of H2O2 dosage, 3 cm of electrode spacing, 60 cm2 electrode dipping area, 5 V of voltage supply, pH of 2.18, and 60 min reaction time (Table 3). The RSM-CCD results highlighted that all the independent variables had a significant effect on COD removal in distillery wastewater through the EF process. Similar observations were made by Basturk et al. [90] for medical laboratory wastewater treatment by the EF process. Table 5 shows that the consistency between the predicted and actual values for COD removal is good. Hence, there is a good fit between the experimental data and the data estimated by the model, as reported by Ozturk et al. [91]. This indicates that the experimental results describe the relationship of factors to each other and the responses to distillery wastewater treatment well. It could be concluded that the proposed RSM model for COD removal in distillery wastewater through the EF process is satisfactory, and there is no reason to suspect any incompatibility.
RSM 3-D and contour graphs are given in Figure 5. Both the response surface and contour graphs shown in Figure 5 are a function of a variable being kept constant at the center, while the other variables took values within the determined limits. RSM 3-D graphs were developed based on the RSM equations, which provided a three-dimensional view of COD removal and contained different combinations of independent variables. Figure 5 shows the co-effect of independent parameters on COD removal, and the data distributions were within the acceptable range for the response. A similar observation was made by Hasani et al. [28], where the RSM-CCD model performed well in predicting the actual response surface.

4. Conclusions

Based on the findings of this study, several key parameters significantly influence the effectiveness of the EF process for treating distillery wastewater. Specifically, the optimal H2O2 dosage, electrode spacing, dipping area, applied voltage, and pH were determined to be 1665 mg L−1, 2.5 cm, 55 cm2, 5 V, and 3, respectively. Under these optimized conditions, the EF process achieved a remarkable COD removal efficiency of up to 79.5% within just 1 h, even when starting with high COD concentrations ranging from 5500 to 6000 mg L−1 in the distillery wastewater. The EF process operates through a pseudo-first-order reaction mechanism when these optimal conditions are met, indicating efficient degradation kinetics for organic pollutants. Importantly, the study employed RSM, which proved instrumental in streamlining the experimental design, minimizing the number of trials, and reducing consumable expenses. RSM projections further suggested that adjusting the H2O2 dosage, electrode spacing, dipping area, voltage, and pH to 1402 mg L−1, 3 cm, 60 cm2, 5 V, and 2.18, respectively, could still achieve a significant COD removal efficiency of 70.8%. Additionally, GC-MS analysis provided insights into the EF-treated distillery wastewater, revealing the transformation of complex organic compounds into less toxic byproducts such as n-hexane and acetic acid ethenyl ester. This transformation underscores the EF process’s efficacy in reducing environmental toxicity and enhancing the quality of discharged wastewater.
Looking forward, the study emphasizes the potential for further optimizing EF parameters for broader industrial applications beyond distillery wastewater. Future research directions could focus on refining treatment protocols to enhance efficiency and scalability while investigating the long-term environmental impacts of EF-generated byproducts. Such advancements are crucial for advancing sustainable wastewater management practices, aligning with global efforts towards environmental stewardship and regulatory compliance.

Author Contributions

Conceptualization, K.R.M.S.; methodology, K.R.M.S.; software, K.R.M.S.; validation K.R.M.S.; formal analysis, K.R.M.S.; investigation, K.R.M.S.; resources, K.R.M.S.; data curation, K.R.M.S.; writing—original draft preparation, K.R.M.S.; writing—review and editing, K.R.M.S. and S.K.; visualization, K.R.M.S.; supervision, K.S.; project administration, K.R.M.S.; funding acquisition, K.R.M.S. All authors have read and agreed to the published version of the manuscript.

Funding

This research received no external funding.

Institutional Review Board Statement

Not applicable.

Informed Consent Statement

Not applicable.

Data Availability Statement

All data generated or analyzed during this study are included in this article.

Conflicts of Interest

There are no conflicts of interest among the authors of this manuscript.

References

  1. Fito, J.; Tefera, N.; Van Hulle, S.W. Adsorption of distillery spent wash on activated bagasse fly ash: Kinetics and thermodynamics. J. Environ. Chem. Eng. 2017, 5, 5381–5388. [Google Scholar] [CrossRef]
  2. Singh, G.; Bakshi, S.; Bandyopadhyay, K.K.; Bose, S.; Nayak, R.; Paul, D. Enhanced biodegradation of melanoidin pigment from spentwash using PDMS-immobilized microbes via ‘repeated addition’ strategy. Biocatal. Agric. Biotechnol. 2021, 33, 101990. [Google Scholar] [CrossRef]
  3. Verma, R.; Kundu, L.M.; Pandey, L.M. Enhanced melanoidin removal by amine-modified Phyllanthus emblica leaf powder. Bioresour. Technol. 2021, 339, 125572. [Google Scholar] [CrossRef] [PubMed]
  4. Chandra, T.S.; Malik, S.N.; Suvidha, G.; Padmere, M.L.; Shanmugam, P.; Mudliar, S.N. Wet air oxidation pretreatment of biomethanated distillery effluent: Mapping pretreatment efficiency in terms color, toxicity reduction and biogas generation. Bioresour. Technol. 2014, 158, 135–140. [Google Scholar] [CrossRef] [PubMed]
  5. Zurita, F.; Vymazal, J. Opportunities and challenges of using constructed wetlands for the treatment of high-strength distillery effluents: A review. Ecol. Eng. 2023, 196, 107097. [Google Scholar] [CrossRef]
  6. Kumar, S.D.; Mande, A.B.; Premalatha, M.; Sivasankar, T. Experimental studies on the impact of porous bed-induced solar evaporation (PBISE) and thermal degradation of the solid content of the distillery effluent using cocopeat—A sustainable approach. J. Clean. Prod. 2022, 377, 134250. [Google Scholar] [CrossRef]
  7. CPCB. Pollution Control Acts, Rules and Notifications Issued Thereunder; Central Pollution Control Board: Delhi, India, 2006. [Google Scholar]
  8. Prasad, R.K. Color removal from distillery spent wash through coagulation using Moringa oleifera seeds: Use of optimum response surface methodology. J. Hazard. Mater. 2009, 165, 804–811. [Google Scholar] [CrossRef] [PubMed]
  9. Suresh, S.; Shankar, R.; Chand, S. Treatment of distillery waste water using catalytic wet air oxidation. J. Future Eng. Technol. 2010, 6, 36. [Google Scholar]
  10. Malik, S.N.; Khan, S.M.; Ghosh, P.C.; Vaidya, A.N.; Das, S.; Mudliar, S.N. Nano catalytic ozonation of biomethanated distillery wastewater for biodegradability enhancement, color and toxicity reduction with biofuel production. Chemosphere 2019, 230, 449–461. [Google Scholar] [CrossRef]
  11. Ziaei-Rad, Z.; Nickpour, M.; Adl, M.; Pazouki, M. Bioadsorption and enzymatic biodecolorization of effluents from ethanol production plants. Biocatal. Agric. Biotechnol. 2020, 24, 101555. [Google Scholar] [CrossRef]
  12. Prost-Boucle, S.; Pelus, L.; Becheau, E.; Cervoise, L.; Troesch, S.; Molle, P. Combination of sequencing batch reactor and vertical flow treatment wetlands: A full-scale experience for rum distillery wastewater treatment in a tropical climate. Nat.-Based Solut. 2023, 3, 100056. [Google Scholar] [CrossRef]
  13. Satyawali, Y.; Balakrishnan, M. Treatment of distillery effluent in a membrane bioreactor (MBR) equipped with mesh filter. Sep. Purif. Technol. 2008, 63, 278–286. [Google Scholar] [CrossRef]
  14. Basu, S.; Mukherjee, S.; Kaushik, A.; Batra, V.S.; Balakrishnan, M. Integrated treatment of molasses distillery wastewater using microfiltration (MF). J. Environ. Manag. 2015, 158, 55–60. [Google Scholar] [CrossRef]
  15. Rai, U.K.; Muthukrishnan, M.; Guha, B.K. Tertiary treatment of distillery wastewater by nanofiltration. Desalination 2008, 230, 70–78. [Google Scholar] [CrossRef]
  16. Parande, A.K.; Sivashanmugam, A.; Beulah, H.; Palaniswamy, N. Performance evaluation of lowcost adsorbents in reduction of COD in sugar industrial effluent. J. Hazard. Mater. 2009, 168, 800–805. [Google Scholar] [CrossRef]
  17. Siles, J.A.; García-García, I.; Martín, A.; Martín, M.A. Integrated ozonation and biomethanization treatments of vinasse derived from ethanol manufacturing. J. Hazard. Mater. 2011, 188, 247–253. [Google Scholar] [CrossRef]
  18. Sangave, P.C.; Pandit, A.B. Enhancement in biodegradability of distillery wastewater using enzymatic pretreatment. J. Environ. Manag. 2006, 78, 77–85. [Google Scholar] [CrossRef]
  19. Li, D.; Zheng, T.; Liu, Y.; Hou, D.; Yao, K.K.; Zhang, W.; Song, H.; He, H.; Shi, W.; Wang, L.; et al. A novel Electro-Fenton process characterized by aeration from inside a graphite felt electrode with enhanced electrogeneration of H2O2 and cycle of Fe3+/Fe2+. J. Hazard. Mater. 2020, 396, 122591. [Google Scholar] [CrossRef]
  20. Mousset, E.; Frunzo, L.; Esposito, G.; van Hullebusch, E.D.; Oturan, N.; Oturan, M.A. A complete phenol oxidation pathway obtained during electro-Fenton treatment and validated by a kinetic model study. Appl. Catal. B Environ. 2016, 180, 189–198. [Google Scholar] [CrossRef]
  21. Sánchez-Sánchez, C.M.; Expósito, E.; Casado, J.; Montiel, V. Goethite as a more effective iron dosage source for mineralization of organic pollutants by electro-Fenton process. Electrochem. Commun. 2007, 9, 19–24. [Google Scholar] [CrossRef]
  22. Rezgui, S.; Ghazouani, M.; Bousselmi, L.; Akrout, H. Efficient treatment for tannery wastewater through sequential electro-Fenton and electrocoagulation processes. J. Environ. Chem. Eng. 2022, 10, 107424. [Google Scholar] [CrossRef]
  23. Prasad, R.K.; Srivastava, S.N. Electrochemical degradation of distillery spent wash using catalytic anode: Factorial design of experiments. Chem. Eng. J. 2009, 146, 22–29. [Google Scholar]
  24. David, C.; Arivazhagan, M.; Tuvakara, F. Decolorization of distillery spent wash effluent by electro oxidation (EC and EF) and Fenton processes: A comparative study. Ecotoxicol. Environ. Saf. 2015, 121, 142–148. [Google Scholar] [CrossRef]
  25. Johnson, I.; Krishnan, C.; Kumar, M. A sequential electrochemical oxidation–algal photobioreactor system for the treatment of distillery wastewater. J. Environ. Chem. Eng. 2023, 11, 110208. [Google Scholar] [CrossRef]
  26. Davarnejad, R.; Mohammadi, M.; Ismail, A.F. Petrochemical wastewater treatment by electro-Fenton process using aluminum and iron electrodes: Statistical comparison. J. Water Process Eng. 2014, 3, 18–25. [Google Scholar] [CrossRef]
  27. Johnson, I.; Kumar, M. Electrochemical oxidation of distillery wastewater by dimensionally stable Ti-RuO2 anodes. Environ. Technol. Innov. 2020, 20, 101181. [Google Scholar] [CrossRef]
  28. Hasani, K.; Peyghami, A.; Moharrami, A.; Vosoughi, M.; Dargahi, A. The efficacy of sono-electro-Fenton process for removal of Cefixime antibiotic from aqueous solutions by response surface methodology (RSM) and evaluation of toxicity of effluent by microorganisms. Arab. J. Chem. 2020, 13, 6122–6139. [Google Scholar] [CrossRef]
  29. Jiad, M.M.; Abbar, A.H. Efficient wastewater treatment in petroleum refineries: Hybrid electro-fenton and photocatalysis (UV/ZnO) process. Chem. Eng. Res. Des. 2023, 200, 431–444. [Google Scholar] [CrossRef]
  30. Rajesh, R.P.; Saravanakumar, M.P. Leachate xenobiotics electrocatalytic degradation and simultaneous carbon quantum dots synthesis for anti-counterfeiting applications. Inorg. Chem. Commun. 2023, 158, 111673. [Google Scholar] [CrossRef]
  31. Hameed, B.H.; Lee, T.W. Degradation of malachite green in aqueous solution by Fenton process. J. Hazard. Mater. 2009, 164, 468–472. [Google Scholar] [CrossRef]
  32. Wang, J.; Wang, S. Reactive species in advanced oxidation processes: Formation, identification and reaction mechanism. Chem. Eng. J. 2020, 401, 126158. [Google Scholar] [CrossRef]
  33. Priyadarshini, M.; Das, I.; Ghangrekar, M.M.; Blaney, L. Advanced oxidation processes: Performance, advantages, and scale-up of emerging technologies. J. Environ. Manag. 2022, 316, 115295. [Google Scholar] [CrossRef] [PubMed]
  34. He, H.; Zhou, Z. Electro-Fenton process for water and wastewater treatment. Crit. Rev. Environ. Sci. Technol. 2017, 47, 2100–2131. [Google Scholar] [CrossRef]
  35. Titchou, F.E.; Zazou, H.; Afanga, H.; El Gaayda, J.; Akbour, R.A.; Nidheesh, P.V.; Hamdani, M. Removal of organic pollutants from wastewater by advanced oxidation processes and its combination with membrane processes. Chem. Eng. Process.-Process Intensif. 2021, 169, 108631. [Google Scholar] [CrossRef]
  36. Rafiee, M.; Sabeti, M.; Torabi, F.; Rahimbakhsh, A. COD Reduction of Aeration Effluent by Utilizing Optimum Quantities of UV/H2O2/O3 in a Small-Scale Reactor. Processes 2022, 10, 2441. [Google Scholar] [CrossRef]
  37. Afolabi, O.A.; Adekalu, K.O.; Okunade, D.A. Electro-Fenton treatment process for brewery wastewater: Effects of oxidant concentration and reaction time on BOD and COD removal efficiency. J. Eng. Appl. Sci. 2022, 69, 42. [Google Scholar] [CrossRef]
  38. Hakika, D.C.; Sarto, S.; Mindaryani, A.; Hidayat, M. Decreasing COD in sugarcane vinasse using the fenton reaction: The effect of processing parameters. Catalysts 2019, 9, 881. [Google Scholar] [CrossRef]
  39. Sarto, S.; Paesal, P.; Tanyong, I.B.; Laksmana, W.T.; Prasetya, A.; Ariyanto, T. Catalytic degradation of textile wastewater effluent by Peroxide oxidation assisted by UV light irradiation. Catalysts 2019, 9, 509. [Google Scholar] [CrossRef]
  40. Thanapimmetha, A.; Srinophakun, P.; Amat, S.; Saisriyoot, M. Decolorization of molasses-based distillery wastewater by means of pulse electro-Fenton process. J. Environ. Chem. Eng. 2017, 1, 2305–2312. [Google Scholar]
  41. Chen, F.; Jiang, F.; Zhu, Y.; Hua, Z.; Wang, L.; Ma, J.; Liang, H.; Tsiakaras, P. Three-dimensional electro-Fenton system with steel-slag based particle electrode for the treatment of refinery spent caustic. J. Environ. Chem. Eng. 2024, 12, 112429. [Google Scholar] [CrossRef]
  42. Lu, M. Advanced treatment of aged landfill leachate through the combination of aged-refuse bioreactor and three-dimensional electrode electro-Fenton process. Environ. Technol. 2021, 42, 1669–1678. [Google Scholar] [CrossRef]
  43. Quang, H.H.P.; Dinh, N.T.; Thi, T.N.T.; Bao, L.T.N.; Yuvakkumar, R.; Nguyen, V.H. Fe2+, Fe3+, Co2+ as highly efficient cocatalysts in the homogeneous electro-Fenton process for enhanced treatment of real pharmaceutical wastewater. J. Water Process Eng. 2022, 46, 102635. [Google Scholar] [CrossRef]
  44. Yasri, N.; Hu, J.; Kibria, M.G.; Roberts, E.P. Electrocoagulation separation processes. In Multidisciplinary Advances in Efficient Separation Processes; American Chemical Society: Washington, DC, USA, 2020; pp. 167–203. [Google Scholar]
  45. Xiao, Z.; Cui, T.; Wang, Z.; Dang, Y.; Zheng, M.; Lin, Y.; Song, Z.; Wang, Y.; Liu, C.; Xu, B.; et al. Energy-efficient removal of carbamazepine in solution by electrocoagulation-electrofenton using a novel P-rGO cathode. J. Environ. Sci. 2022, 115, 88–102. [Google Scholar] [CrossRef]
  46. Behrouzeh, M.; Parivazh, M.M.; Danesh, E.; Dianat, M.J.; Abbasi, M.; Osfouri, S.; Rostami, A.; Sillanpää, M.; Dibaj, M.; Akrami, M. Application of Photo-Fenton, Electro-Fenton, and Photo-Electro-Fenton processes for the treatment of DMSO and DMAC wastewaters. Arab. J. Chem. 2022, 15, 104229. [Google Scholar] [CrossRef]
  47. Meddah, S.; Samar, M.E.H.; Bououdina, M.; Khezami, L. Outstanding performance of electro-Fenton/ultra-violet/ultra-sound assisted-persulfate process for the complete degradation of hazardous pollutants in contaminated water. Process Saf. Environ. Prot. 2022, 165, 739–753. [Google Scholar] [CrossRef]
  48. Sires, I.; Garrido, J.A.; Rodriguez, R.M.; Brillas, E.; Oturan, N.; Oturan, M.A. Catalytic behavior of the Fe3+/Fe2+ system in the electro-Fenton degradation of the antimicrobial chlorophene. Appl. Catal. B Environ. 2007, 72, 382–394. [Google Scholar] [CrossRef]
  49. Deng, F.; Olvera-Vargas, H.; Zhou, M.; Qiu, S.; Sirés, I.; Brillas, E. Critical review on the mechanisms of Fe2+ regeneration in the electro-Fenton process: Fundamentals and boosting strategies. Chem. Rev. 2023, 123, 4635–4662. [Google Scholar] [CrossRef]
  50. Mulai, T.; Kumar, J.E.; Kharmawphlang, W.; Sahoo, M.K. UV light and Fe2+ catalysed COD removal of AO 8 using NaOCl as oxidant. Chemosphere 2024, 356, 141747. [Google Scholar] [CrossRef]
  51. Fan, A.; Shi, Y.; Liu, Y.; Tan, P.; Chen, Y.; Qiu, H.; Xu, B.; Lan, G. Three-dimensional electrochemical Fenton degradation of CIP by doping Ce and Cu in Jacaranda shell base as particle electrodes. J. Environ. Chem. Eng. 2024, 12, 112377. [Google Scholar] [CrossRef]
  52. Divyapriya, G.; Nidheesh, P.V. Importance of graphene in the electro-Fenton process. ACS Omega 2020, 5, 4725–4732. [Google Scholar] [CrossRef]
  53. Wang, C.T.; Hu, J.L.; Chou, W.L.; Kuo, Y.M. Removal of color from real dyeing wastewater by Electro-Fenton technology using a three-dimensional graphite cathode. J. Hazard. Mater. 2008, 152, 601–606. [Google Scholar] [CrossRef] [PubMed]
  54. Wang, C.T.; Chou, W.L.; Kuo, Y.M. Removal of COD from laundry wastewater by electrocoagulation/electroflotation. J. Hazard. Mater. 2009, 164, 81–86. [Google Scholar] [CrossRef] [PubMed]
  55. Khaleel, G.F.; Ismail, I.; Abbar, A.H. Kinetic modeling of a solar photo-electro-Fenton process for treating petroleum refinery wastewater. Case Stud. Chem. Environ. Eng. 2023, 8, 100460. [Google Scholar] [CrossRef]
  56. Asaithambi, P.; Yesuf, M.B.; Govindarajan, R.; Periyasamy, S.; Niju, S.; Pandiyarajan, T.; Kadier, A.; Nguyen, D.D.; Alemayehu, E. Sono-alternating current-electro-Fenton process for the removal of color, COD and determination of power consumption from distillery industrial wastewater. Sep. Purif. Technol. 2023, 319, 124031. [Google Scholar] [CrossRef]
  57. Keerthi, V.V.; Balasubramanian, N. Removal of heavy metals by hybrid electrocoagulation and microfiltration processes. Environ. Technol. 2013, 34, 2897–2902. [Google Scholar] [CrossRef] [PubMed]
  58. Sultana, S.; Choudhury, M.R.; Bakr, A.R.; Anwar, N.; Rahaman, M.S. Effectiveness of electro-oxidation and electro-Fenton processes in removal of organic matter from high-strength brewery wastewater. J. Appl. Electrochem. 2018, 48, 519–528. [Google Scholar] [CrossRef]
  59. Ma, L.; Zhou, M.; Ren, G.; Yang, W.; Liang, L. A highly energy-efficient flow-through electro-Fenton process for organic pollutants degradation. Electrochim. Acta 2016, 200, 222–230. [Google Scholar] [CrossRef]
  60. Hua, G.; Zhicheng, X.; Dan, Q.; Dan, W.; Hao, X.; Wei, Y.; Xiaoliang, J. Fabrication and characterization of porous titanium-based PbO2 electrode through the pulse electrodeposition method: Deposition condition optimization by orthogonal experiment. Chemosphere 2020, 261, 128157. [Google Scholar] [CrossRef] [PubMed]
  61. Alkurdi, S.S.; Abbar, A.H. Removal of COD from petroleum refinery wastewater by electro-coagulation process using SS/Al electrodes. IOP Conf. Ser. Mater. Sci. Eng. 2020, 870, 012052. [Google Scholar] [CrossRef]
  62. Reategui-Romero, W.; Morales-Quevedo, S.E.; Huanca-Colos, K.W.; Figueroa-Gomez, N.M.; King-Santos, M.E.; Zaldivar-Alvarez, W.F.; Flores-Del Pino, L.V.; Yuli-Posadas, R.A.; Bulege-Gutierrez, W. Effect of current density on COD removal efficiency for wastewater using the electrocoagulation process. Desalination Water Treat. 2020, 184, 15–29. [Google Scholar] [CrossRef]
  63. Chen, T.C.; Chen, T.E.; Lu, M.C.; Bellotindos, L.M. Removal of COD from TFT-LCD wastewater by electro-Fenton technology using a tubular reactor. J. Environ. Eng. 2017, 43, 04017018. [Google Scholar] [CrossRef]
  64. Zhang, H.; Choi, H.J.; Huang, C.P. Treatment of landfill leachate by Fenton’s reagent in a continuous stirred tank reactor. J. Hazard. Mater. 2006, 136, 618–623. [Google Scholar] [CrossRef]
  65. Li, M.; Cheng, J.L.; Song, J.; Zhang, Z.X.; Wu, Q.; Zhao, H.M.; Feng, N.X.; Han, W.; Yeung, K.L.; Zhou, S.; et al. Elimination of chloramphenicol through electro-fenton-like reaction: Reaction mechanism and electron transfer pathway. NPJ Clean Water 2023, 6, 39. [Google Scholar] [CrossRef]
  66. Yao, J.; Mei, Y.; Jiang, J.; Xia, G.; Chen, J. Process optimization of electrochemical treatment of COD and total nitrogen containing wastewater. Int. J. Environ. Res. Public Health 2022, 19, 850. [Google Scholar] [CrossRef]
  67. Ghimire, U.; Jang, M.; Jung, S.P.; Park, D.; Park, S.J.; Yu, H.; Oh, S.E. Electrochemical removal of ammonium nitrogen and COD of domestic wastewater using platinum coated titanium as an anode electrode. Energies 2019, 12, 883. [Google Scholar] [CrossRef]
  68. Martínez, S.S.; Bahena, C.L. Chlorbromuron urea herbicide removal by electro-Fenton reaction in aqueous effluents. Water Res. 2009, 43, 33–40. [Google Scholar] [CrossRef]
  69. Ghanbari, F.; Moradi, M. A comparative study of electrocoagulation, electrochemical Fenton, electro-Fenton and peroxi-coagulation for decolorization of real textile wastewater: Electrical energy consumption and biodegradability improvement. J. Environ. Chem. Eng. 2015, 3, 499–506. [Google Scholar] [CrossRef]
  70. Özcan, A.; Özcan, A.A.; Demirci, Y. Evaluation of mineralization kinetics and pathway of norfloxacin removal from water by electro-Fenton treatment. Chem. Eng. J. 2016, 304, 518–526. [Google Scholar] [CrossRef]
  71. Davarnejad, R.; Azizi, J. Alcoholic wastewater treatment using electro-Fenton technique modified by Fe2O3 nanoparticles. J. Environ. Chem. Eng. 2016, 4, 2342–2349. [Google Scholar] [CrossRef]
  72. Nidheesh, P.V.; Gandhimathi, R. Trends in electro-Fenton process for water and wastewater treatment: An overview. Desalination 2012, 299, 1–15. [Google Scholar] [CrossRef]
  73. Sun, M.; Chen, F.; Qu, J.; Liu, H.; Liu, R. Optimization and control of Electro-Fenton process by pH inflection points: A case of treating acrylic fiber manufacturing wastewater. Chem. Eng. J. 2015, 269, 399–407. [Google Scholar] [CrossRef]
  74. Guvenc, S.Y.; Dincer, K.; Varank, G. Performance of electrocoagulation and electro-Fenton processes for treatment of nanofiltration concentrate of biologically stabilized landfill leachate. J. Water Process Eng. 2019, 31, 100863. [Google Scholar] [CrossRef]
  75. Wang, C.; Chou, W.; Chung, M.; Kuo, Y. COD removal from real dyeing wastewater by electro-Fenton technology using an activated carbon fiber cathode. Desalination 2010, 253, 129–134. [Google Scholar] [CrossRef]
  76. Kavitha, V.; Palanivelu, K. Destruction of cresols by Fenton oxidation process. Water Res. 2005, 39, 3062–3072. [Google Scholar] [CrossRef] [PubMed]
  77. Ayoub, M. Fenton process for the treatment of wastewater effluent from the edible oil industry. Water Sci. Technol. 2022, 86, 1388–1401. [Google Scholar] [CrossRef] [PubMed]
  78. Adimi, M.; Mohammadpour, M.; Fathinejadjirandehi, H. Treatment of petrochemical wastewater by modified electro-fenton method with nano porous aluminum electrode. J. Water Environ. Nanotechnol. 2017, 2, 186–194. [Google Scholar]
  79. Qiu, S.; He, D.; Ma, J.; Liu, T.; Waite, T.D. Kinetic modeling of the electro-Fenton process: Quantification of reactive oxygen species generation. Electrochim. Acta 2015, 176, 51–58. [Google Scholar] [CrossRef]
  80. Samarghandi, M.; Rahmani, A.; Asgari, G.; Ahmadidoost, G.; Dargahi, A. Photocatalytic removal of cefazolin from aqueous solution by AC prepared from mango seed+ ZnO under uv irradiation. Glob. Nest J. 2018, 20, 399–407. [Google Scholar]
  81. Eddy, N.O.; Ukpe, R.A.; Ameh, P.; Ogbodo, R.; Garg, R.; Garg, R. Theoretical and experimental studies on photocatalytic removal of methylene blue (MetB) from aqueous solution using oyster shell synthesized CaO nanoparticles (CaONP-O). Environ. Sci. Pollut. Res. 2023, 30, 81417–81432. [Google Scholar] [CrossRef]
  82. Bajpai, M.; Katoch, S.S. Techno-economical optimization using Box-Behnken (BB) design for COD and chloride reduction from Hospital wastewater by electro-coagulation. Water Environ. Res. 2020, 1387, 1–15. [Google Scholar]
  83. Babuponnusami, A.; Muthukumar, K. Advanced oxidation of phenol: A comparison between Fenton, electro-Fenton, sono-electro-Fenton and photo-electro-Fenton processes. Chem. Eng. J. 2022, 183, 1–9. [Google Scholar] [CrossRef]
  84. Ting, W.P.; Lu, M.C.; Huang, Y.H. Kinetics of 2, 6-dimethylaniline degradation by electro-Fenton process. J. Hazard. Mater. 2009, 161, 1484–1490. [Google Scholar] [CrossRef] [PubMed]
  85. Sopaj, F.; Oturan, N.; Pinson, J.; Podvorica, F.; Oturan, M.A. Effect of the anode materials on the efficiency of the electro-Fenton process for the mineralization of the antibiotic sulfamethazine. Appl. Catal. B Environ. 2016, 199, 331–341. [Google Scholar] [CrossRef]
  86. Gamarra-Güere, C.D.; Dionisio, D.; Santos, G.O.S.; Lanza, M.R.V.; de Jesus Motheo, A. Application of Fenton, photo-Fenton and electro-Fenton processes for the methylparaben degradation: A comparative study. J. Environ. Chem. Eng. 2022, 10, 106992. [Google Scholar] [CrossRef]
  87. Jasni, A.B.; Kamyab, H.; Chelliapan, S.; Arumugam, N.; Krishnan, S.; Din, M.F.M. Treatment of wastewater using response surface methodology: A brief review. CET J. Chem. Eng. Trans. 2020, 78, 534. [Google Scholar]
  88. Bouyakhsass, R.; Souabi, S.; Rifi, S.K.; Bouaouda, S.; Taleb, A.; Madinzi, A.; Kurniawan, T.A.; Anouzla, A. Applicability of central composite design and response surface methodology for optimizing treatment of landfill leachate using coagulation-flocculation. Chem. Eng. Res. Des. 2023, 197, 669–684. [Google Scholar] [CrossRef]
  89. Kumar, K.A. Optimization for removal of COD and BOD through RSM-CCD by activated sludge treatment process for pharmaceutical wastewater. J. Environ. Nanotechnol. 2023, 12, 68–86. [Google Scholar] [CrossRef]
  90. Basturk, I.; Varank, G.; Murat Hocaoglu, S.; Yazici Guvenc, S. Medical laboratory wastewater treatment by electro-fenton process: Modeling and optimization using central composite design. Water Environ. Res. 2021, 93, 393–408. [Google Scholar] [CrossRef]
  91. Ozturk, D.; Dagdas, E.; Fil, B.A.; Bashir, M.J. Central composite modeling for electrochemical degradation of paint manufacturing plant wastewater: One-step/two-response optimization. Environ. Technol. Innov. 2021, 21, 101264. [Google Scholar] [CrossRef]
Figure 1. Schematic diagram of the reactor used for the study. (1) Anode; (2) Cathode; (3) Reactor; (4) Wastewater sample; (5) DC power supply; (6) Aerator. Black dots in the image signify the adjusting knobs for voltage and current.
Sustainability 16 06512 g001
Figure 2. COD removal efficiency by EF process in distillery wastewater under different conditions including (a) H2O2 dosage, (b) electrode spacing, (c) dipping area, (d) initial pH, and (e) voltage supply.
Sustainability 16 06512 g002aSustainability 16 06512 g002bSustainability 16 06512 g002c
Figure 3. Pseudo-first-order kinetics for COD removal in distillery wastewater by the EF process at optimum conditions (Voltage: 5 V; pH: 3; H2O2 dosage: 1665 mg L−1; Spacing between the electrode: 2.5 cm; Electrode dipping area: 55 cm2).
Sustainability 16 06512 g003
Figure 4. GC-MS profiles of organic compounds extracted from (a) raw distillery wastewater and (b) treated distillery wastewater.
Sustainability 16 06512 g004aSustainability 16 06512 g004b
Figure 5. RSM (left) and contour (right) plots for the optimal conditions ((a) spacing between the electrode, (b) dipping area of electrode, (c) H2O2 dosage, (d) initial pH and (e) voltage supply) required for efficient COD removal by the EF process in distillery wastewater.
Sustainability 16 06512 g005aSustainability 16 06512 g005bSustainability 16 06512 g005c
Table 1. Physico-chemical characteristics of distillery wastewater effluent.
S. No.ParameterMethod Adopted—Code of SpecificationValue
1.pHIS: 3025 Part 11:1983 (Reaff:2017)4.11
2.ColorIS: 3025 Part 4: 2021Dark brown
3.COD (mg L−1)IS: 3025 Part 58:2006 (Reaff:2017)69,420
4.BOD (mg L−1)IS: 3025 Part 44:1993 (Reaff:2019)20,680
5.TS (mg L−1)IS: 3025 Part 15:1984 (Reaff:2019)64,090
6.TSS (mg L−1)IS: 3025 Part 17:1984 (Reaff:2017)2490
7.TP (mg L−1)IS: 3025 Part 31:1988 (Reaff:2019)231.4
8.SO42− (mg L−1)IS: 3025 Part 11:1983 (Reaff:2017)12,152
Table 2. Independent variables and different levels of experimental design.
Independent VariableSignUnit1234
H2O2 dosageAmg L−1555111016652220
Spacing between the electrodeBcm22.534
Dipping area of electrodeCcm235455565
Initial pHD-2347
Applied voltageEV57.51015
Table 3. Experimental conditions.
H2O2 Dosage (mg L−1)ES
(cm)
DA (cm2)pHVoltage (v)Ci
(mg L−1)
Cf
(mg L−1)
COD Removal Efficiency
(%)
555454.045.04608360021.9
1110454.045.05040374425.7
1665454.045.05568360035.3
2220454.045.05808494414.9
1665452.045.05474278449.1
1665452.545.05376192064.3
1665453.045.04944240051.5
1665352.545.05232302442.2
1665552.545.05376153671.4
1665652.545.05232177666.1
1665552.525.05568230458.6
1665552.535.05376110479.5
1665552.575.04944283242.7
1665552.537.55280124876.4
1665552.5310.05232230456.0
1665552.5315.05808268853.7
Table 4. (a) Statistical models obtained from the analysis of variance for the response surface model for the optimization of COD removal from distillery wastewater. (b) Coded coefficients.
(a)
SourceDFAdj. SSAdj. MSF-Valuep-ValueSignificance
Model54330.20866.047.090.004R2 = 91.30 %
R2adj. = 80.43 %
R2pred. = 36.56%
Mean = 47.98
Std. Dev. = 18.91
Coef. Var. = 39.4
Linear54330.20866.047.090.004
H2O2 dosage11.041.040.010.028
ES11794.721794.7214.680.003
DA1538.29538.294.400.062
pH1420.56420.5613.440.003
Voltage1168.33168.331.380.068
Error10340.8485.210
Total155552.50
(b)
TermEffectCoef.SE Coef.T-Valuep-ValueVIF
Constant 39.496.416.160.000
H2O2 dosage−1.36−0.687.38−0.090.9281.14
ES36.4118.204.753.830.0031.34
DA27.4913.756.552.100.0621.25
pH26.8313.417.231.850.0081.13
Voltage−13.57−6.785.78−1.170.2681.23
Table 5. Experimental vs. predicted (by the RMS method) optimal conditions for COD removal by the EF process in distillery wastewater.
Independent variableCoded VariableEquation for Polynomial ModelOptimum Condition for COD Removal
X1X2Experimental ValuePredicted Value by RSM Method
CodedPredicted
Time
(min)
Independent VariableEfficiency
(%)
X1X2Time
(min)
Independent VariableEfficiency
(%)
H2O2 (mg L−1) T i m e 50 50 H 2 O 2 1665 1665 FO (X1, X2) + PQ (X2)701665 mg L−135.300.0−0.16501402 mg L−132.94
ES (cm) T i m e 50 50 E S 3 3 FO (X1, X2) + PQ (X2)702.5 cm64.301.260.11503 cm53.03
EDA
(cm2)
T i m e 50 50 E D A 50 50 FO (X1, X2) + TWI (X1, X2) + PQ (X1, X2)6055 cm270.640.730.28760 cm268.26
pH T i m e 50 50 p H 3 3 FO (X1, X2) + PQ (X1, X2)60379.460.52−0.2775.932.1868.3
V (V) T i m e 50 50 V 7.5 7.5 FO (X1, X2) + PQ (X2)605 V79.46−0.8−0.33105 V70.78
ES—Spacing between the electrodes; EDA—Electrode dipping area; V—Voltage; FO—First-order polynomial terms (β0 + β1X1 + β2X2); PQ—Pure quadratic polynomial terms (β11X12 + β22X22); TWI—Two-way interaction polynomial terms (β12X1X2).
Disclaimer/Publisher’s Note: The statements, opinions and data contained in all publications are solely those of the individual author(s) and contributor(s) and not of MDPI and/or the editor(s). MDPI and/or the editor(s) disclaim responsibility for any injury to people or property resulting from any ideas, methods, instructions or products referred to in the content.

