Article

Optimisation of the Circular Economy Based on the Resource Circulation Equation

1
Business School, Shaoxing University, Shaoxing 312000, China
2
School of Management, Cranfield University, Cranfield MK43 0AL, UK
3
School of Accounting, Hangzhou Dianzi University, Hangzhou 310018, China
*
Author to whom correspondence should be addressed.
Sustainability 2024, 16(15), 6514; https://doi.org/10.3390/su16156514 (registering DOI)
Submission received: 17 May 2024 / Revised: 4 July 2024 / Accepted: 12 July 2024 / Published: 30 July 2024

Abstract

:
The lack of effective evaluation methods and implementation guidelines has led to frequent obstacles in the process of circular economy in enterprises. The efficiency equation for resource circulation can effectively evaluate the efficiency of an enterprise’s circular economy resource circulation from three perspectives: input, circulation, and output. Additionally, it delves into each link to identify weak points, offering guidance for optimising the enterprise’s circular economy. Utilising a value flow analysis within the context of a circular economy, this paper evaluates circular economy efficiency using a resource circulation efficiency equation. It conducts factor analysis across three dimensions: resource input, resource circulation, and waste output. This analysis aims to evaluate the corresponding resource productivity, added value output rate, and environmental efficiency. Factor decomposition techniques were then employed to identify the underlying factors contributing to poor circular economy outcomes. Furthermore, based on the relationships among three resource circulation indicators, this paper forecasts the potential advantages of integrating circular economy improvement measures and proposes practical optimisation approaches. The enhanced resource circulation efficiency resulting from the proposed optimisation approaches was validated through a case study with an aluminium company.

1. Introduction

The increasing global population, production, and consumption levels are rapidly depleting the scarce resources of our planet [1]. Increased consumption, rapid production processes, and the emergence of short-life products have intensified the demand for natural resources [2]. The transformation to a sustainable and resource-based economy needs to transform the linear economy based on the production-consumption-waste model into the circular economy (CE), which depends on the production-consumption-reuse framework [3]. CE advocates reducing absolute resource input and striking a balance between the dimensions of sustainable development [4]. The objective is to extend the lifespan of resources, maximise their usefulness and value, and improve the effectiveness of resource utilisation and waste management [5]. This is pursued through strategies such as reuse, renovation, manufacturing, and recycling [6]. The established concept of CE in business operations is encapsulated by the 3R principle (reducing, reusing, and recycling), as acknowledged by Ludlow et al. [7] However, there is a recent trend towards more nuanced hierarchies involving briefer loops, such as redesign, refurbish, and repurpose, resulting in a variable number of imperatives that begin with the letter “R”. This indicates that the literature is characterised by contrasting interpretations of CE, as highlighted by Reike, D. et al. [8].
In addition to the different interpretations of CE, many other issues remain unresolved. For example, there are still no objective and direct methods for effectively evaluating the effects of CE implementation, identifying improvement potential within production processes or the entire industrial chain, determining specific focus areas for improvement, or predicting the impact of various improvement measures. Previous studies have primarily concentrated on environmental efficiency and the rate of resource utilisation within material flow analysis [9]. They predominantly employed a singular technical approach, excluding economic considerations, to assess the impact of CE. This univariate technical approach failed to translate resource utilisation rates and environmental efficiency into economic indicators, making it challenging to visually represent enterprise resource utilisation levels and to facilitate cross-enterprise and resource comparisons. Moreover, it neglected the input-circulation-output dynamics of material flows at the enterprise level, contradicting the fundamental “3R” principle of CE. Owing to these limitations, employing a single technical approach within material flow analysis is insufficient to provide direct guidance for CE implementation by enterprises [10].
This study aims to develop an approach to evaluate circular economy efficiency using a resource circulation efficiency equation with the following research objectives:
(1)
Developing an evaluation method that can synthesise economic benefits, environmental benefits, and social benefits to evaluate the effect of enterprise circular economy and make up for the shortcomings of the existing indicators such as incomplete evaluation and strong subjectivity.
(2)
Proposing a comprehensive and effective optimisation method of CE, which can analyse the defects existing in the implementation of CE by enterprises from the internal mechanism of circular economy
(3)
Predicting the environmental and economic benefits generated from implementing the CE optimisation method.
In this study, the efficiency of resource circulation is defined by employing both technical analysis metrics from material flow analysis and the economic indicators of Material Flow Cost Accounting (MFCA). To correspond with the input-circulation-output dynamics of material flows, resource circulation efficiency is gauged through three key measures: resource productivity, added value output rate, and environmental efficiency. A comprehensive evaluation index system is formulated to assess resource circulation efficiency and gauge the extent of CE implementation. Utilising these three factors, an optimisation index system is devised to offer recommendations for enhancing CE at the enterprise level.

2. Literature Review

Since K. Baulding (1966) [11] put forward the concept of “CE” in 1960s, there have been more and more research on the evaluation of the CE effect and efficiency. The evaluation of CE is mainly divided into three levels: macro level, meso level, and micro level of enterprises. Aiming at micro-level CE, the existing research usually uses the total added value method, factor analysis method, material flow analysis method, life cycle assessment method, integral questionnaire survey method, energy analysis method, and grey Delphi method [12,13]. These evaluation methods can be roughly divided into three categories.
The first category of research identifies the key factors that affect CE through mathematical modelling. Huyen et al. [14] used the best-worst method (BWM) and linear goal programming technology to evaluate the effects of CE, and Govindan et al. [15] used fuzzy DEMATEL methodology to quantify the various critical success factors of CE; Tian et al. [16] developed an infinite life cycle evaluation model to re-evaluate the resource efficiency and environmental impacts of CE system; Chen et al. [17] assessed the afforested efficiency by non-oriented Network SBM model in China; Ding et al. [18] employed the cooperative game network data envelopment analysis and created an extended Malmquist index (EMI) to assess CE performance and its dynamic evolution. In mathematical modelling, assumptions must be made to simplify real-world problems and to describe inputs and desired outputs based on assumption; hence, it is difficult to represent real-world systems in terms of mathematical relationships [13]. Mathematical models also lack understanding of the CE’s internal mechanism and cannot accurately grasp the exact connotations of the CE [19].
The second category is to comprehensively evaluate the CE model by constructing an evaluation index system. The evaluation index system can be divided into a single index and a comprehensive index. A single index is a single indicator, such as sustainability rate, resource recycling rate, and resource output rate [16,20,21]. For example, EMF’s Material Recycling Index (MCI) is a popular framework that measures the material recycling rate of products by considering the core recycling economy strategy and the expected life of materials [22]. Rem designed a micro-index to measure the economic value of products recovered through a recycling strategy [23]. A comprehensive index usually involves all aspects of CE evaluation. It needs to determine the indexes from each dimension of CE, and determine the weight of each index by AHP and other methods. Maldonado-Romo & Aldape-Pérez [24] introduced a sustainable cycle index comprising five facets: economy, society, environment, cycle, and performance. They conducted a case study focusing on smartphones to illustrate their framework. Vardopoulos et al. [25] used the driving force-pressure-state-impact-response (DPSIR) model to construct an index system to evaluate the feasibility of implementing CE management in major Greek cities. Nowakowski & Król [26] developed a coupling method using the analytic hierarchy process (AHP) and preference ranking to construct an evaluation index system; such an index system elected the best utilisation mode of the waste recycling economy. Gu et al. [27] used principal component research to comprehensively evaluate the recycling economy. Although the evaluation index system can evaluate the efficiency of CE from all levels, it does not really understand the essence of the efficiency of CE because of the lack of correlation among various indexes [28].
The third category is to evaluate the sustainability of the CE model through system flow analysis. Antonopoulos et al. [29] analysed the material flow of the CE model of plastic recycling and put forward guiding suggestions for the government. Puntillo et al. [30] focused on the reorganisation of material, information, and energy flows to achieve greater resource efficiency through the reuse, remanufacturing, and recycling of materials. Meglin et al. [31] combined material flow analysis, input-output analysis, and life cycle assessment to the environmental and economic benefits of building materials. Simple material flow analysis ignores the unity of material and value within an enterprise and the internal logical relationship between the “circular” chain of the whole production process, and there is still a gap in the decision-making requirements of enterprise managers for the information needed for the development of CE.
Evidently, mathematical models lack the comprehension and exploration of the internal workings of the CE and thus cannot precisely capture its true essence. While evaluation index systems can assess CE efficiency across different tiers, they fall short of grasping the fundamental nature of CE efficiency due to the absence of interconnectedness among diverse indicators. Basic system flow analysis overlooks the integrated nature of materials and value within an enterprise as well as the inherent logical interplay within the “circular” chain spanning the entire production process. Consequently, this approach remains distant from meeting the informational requirements that enterprise managers need for informed decision-making in CE development.
CE system not only requires the synchronous improvement of economic benefits, social benefits, and ecological benefits but also needs to pay attention to the interrelation among the three dimensions and the implementation of the “3R” principle in the implementation process of CE [3]. Therefore, the evaluation of CE efficiency and the optimisation of CE effects need a comprehensive index. This evaluation index should not only consider the improvement of economic, social, and environmental benefits but also study the correlation of three-dimensional indicators. It is crucial to focus on diminishing resource input and waste generation during the production process of CE while emphasising the reuse and recycling of resources in the production and circulation of resources [32].

3. Research Methods

3.1. The Definition of Resource Circulation Efficiency

The efficiency of resource circulation comes from the theory of resource value flow. Resource flow is the extension of MFCA under the background of CE [33,34], which combines with the LCA method to form a binary cost accounting, evaluation, and optimisation system. In recent years, many scholars have started to analyse the relative cost of enterprises with resource value streams [35,36] and have conducted special research on eco-industrial parks and social logistics circulation from the perspective of circular industry [37,38]. At the enterprise level, scholars often use the value stream method to calculate and analyse the company’s related costs so as to determine the key improvements in its production process and reduce its commodity consumption and production costs [39].
The efficiency of resource circulation is an index [34,40] to evaluate the efficiency of CE by introducing the added value of resource circulation at the level of value flow based on the ecological efficiency of material flow and the accounting principle of resource value flow, namely,
R e s o u r c e   c i r c u l a t i o n   e f f i c i e n c y = a d d e d   v a l u e   o f   r e s o u r c e   c i r c u l a t i o n e x t e r n a l   e n v i r o n m e n t a l   d a m a g e   v a l u e
Here, the value of external environmental damage is the economic index of external environmental damage caused by pollutant discharge, which measures the size of environmental benefits. Its reduction conforms to the application of the reduction principle [41], while the added value of resource circulation is an economic index. Through the difference between the final output value of resource circulation and the cost of input resources, it is concluded that the main way to improve the added value of resource circulation lies in improving its processing degree and utilisation efficiency [42,43]. Therefore, the core content of resource circulation efficiency can be understood as improving the efficiency of resource utilisation and reducing the output of waste based on careful consideration of environmental and economic benefits; this achieves the purpose of measuring the efficiency of reduction, recycling, and reuse in a CE.
Compared with other indicators for evaluating CE, the resource circulation efficiency index, as defined in Formula (1), not only measures the economic benefits of enterprises but also evaluates the environmental benefits (reflected in the denominator of external environmental damage). The added value of resource circulation also covers social benefits and is closely aligned with the “3R” principle of CE, making it easier to measure the effect of CE [40].

3.2. The Factorisation of the Resource Circulation Efficiency

According to research on resource value flow, most of the resources in the production process are exported in the form of qualified products or wastes, except for a small part that circulates within the enterprise or is reduced to nature. Based on the material form of the circulation of resources, the value of resource circulation can also be divided into two parts: effective utilisation value (positive products) and abandoned loss value (negative products) [34,44]. The loss of resources not only occupies the value of resources and encroaches on the economic interests of enterprises but also places a great burden on the environment and causes damage benefits due to the external discharge of wastes [45]. The lost value of resources and the environmental damage value contained in waste are the key reasons for improving the CE [22]. In the circulation of resources, by tracking and reflecting the material and value information, such as resource input, circulation, output, and abandonment, we can clearly identify the whole state of resource circulation, reveal the main nodes of resource consumption and loss, ‘visualise’ its improvement potential, and serve the enterprise’s internal CE optimisation decision [46]. Moreover, by tracking the material and value information in the process of resource circulation, we can calculate the economic and environmental efficiency in the process of resource circulation and then evaluate the comprehensive effect of the CE to provide a basis for decision-making.
Factor analysis, as an important research method, is used to synthesise many related variables, extract common factors, including the information of the original variables in the common factors as much as possible, minimise the loss of information, and obtain a comprehensive index according to the factor score equation. The evaluation of CE just applies this property and integrates several indicators into one to evaluate the development of CE. In the process of CE development, we need to know the status of CE development, and it is necessary to conduct a comprehensive evaluation of CE. According to the comprehensive analysis of CE, it is of great significance to identify the development deficiencies and make targeted improvements according to the factors that hinder the development of CE. The IPAT model is an analytical framework that combines human driving forces with the core factors of environmental issues [47]. It decomposes the environmental impact and pressure into a combination of three factors: population growth, wealth level, and technical level, and guides human environmental activities. Therefore, this paper, referring to the IPAT model and factor analysis method, considers that the resource circulation efficiency index, which evaluates the level of CE, is decomposed into the product of three factors that affect its final value. The relationships between the resource circulation efficiency index and the three factors can be depicted in an input-output transformation system, as shown in Figure 1.
The resource circulation efficiency index, representing the efficiency of the whole input-output transformation system, studies the causal relationships, action mechanisms, and change effects among the output value, the added value of resource circulation, and resource productivity. Using factor analysis, resource circulation efficiency can be expressed as
R t i = R p i × V a i × E c i
The respective meanings of the factors are shown in Table 1.
Resource productivity ( R p i ) is a factor of resource input, which is defined as the ratio of resource input quantity to output value. It is used to measure the relative saving degree of enterprise resource input under the premise of constant or increased output value and corresponds to the principle of “reduction” of CE development.
Value-added output rate ( V a i ) is measured by the relative proportion of the added value of resource circulation and the effective utilisation value of resources under the condition of constant output and the principle of a “reusing” economy.
Environmental efficiency ( E c i ) factor is the export core factor of waste discharge, which reflects the external environmental damage value of environmental pollutants discharged into the environment by unit resource investment, and embodies the principle of “recycling”.
Resource circulation efficiency ( R c i ) is the general factor to measure the efficiency of CE, which indicates the degree of resource utilisation and environmental protection. Among them, the economic added value reflects the degree of exploitation and utilisation of resource value, which is a maximum factor, and the external environmental damage value reflects the absolute degree of environmental load, which is a minimum factor. R c i can comprehensively reflect the implementation degree of CE at enterprises and other economic entities. The resource circulation efficiency index in Formula (1) not only evaluates the amount of resource input, output, and discharge but also assesses the effective utilisation value of resources and the added value of resource circulation, which measures profit, interest, tax, and labour costs. Moreover, pollutant discharge is directly connected to waste recycling, and it has special comprehensiveness and intuition that other indicators do not have when used to measure the efficiency of enterprise CE.

3.3. Optimising CE Efficiency Based on the Resource Circulation Efficiency Index

The resource circulation efficiency index calculates the resource utilisation and emission efficiency from the input, circulation, and output in the process of resource circulation. Thus, CE efficiency can be effectively measured by the rational use of the resource circulation equation.

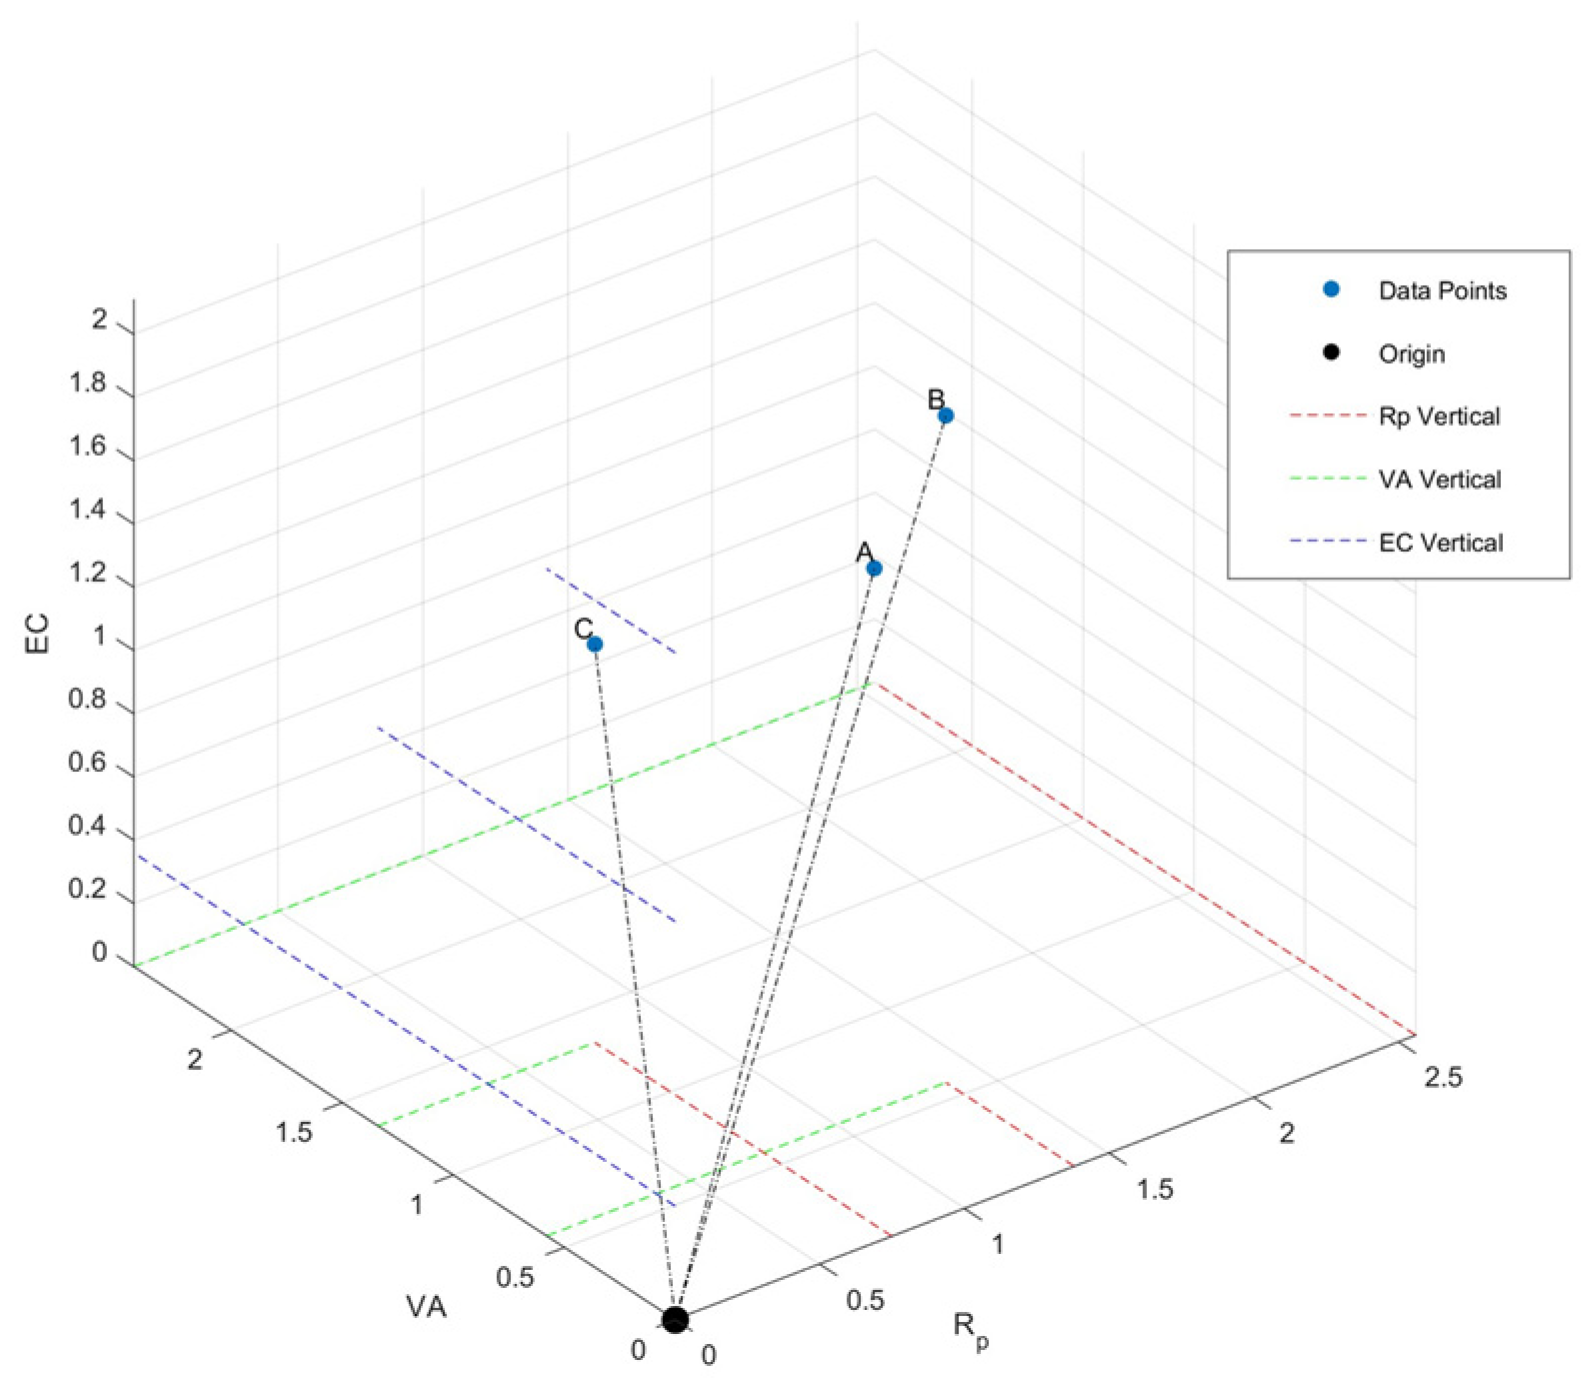
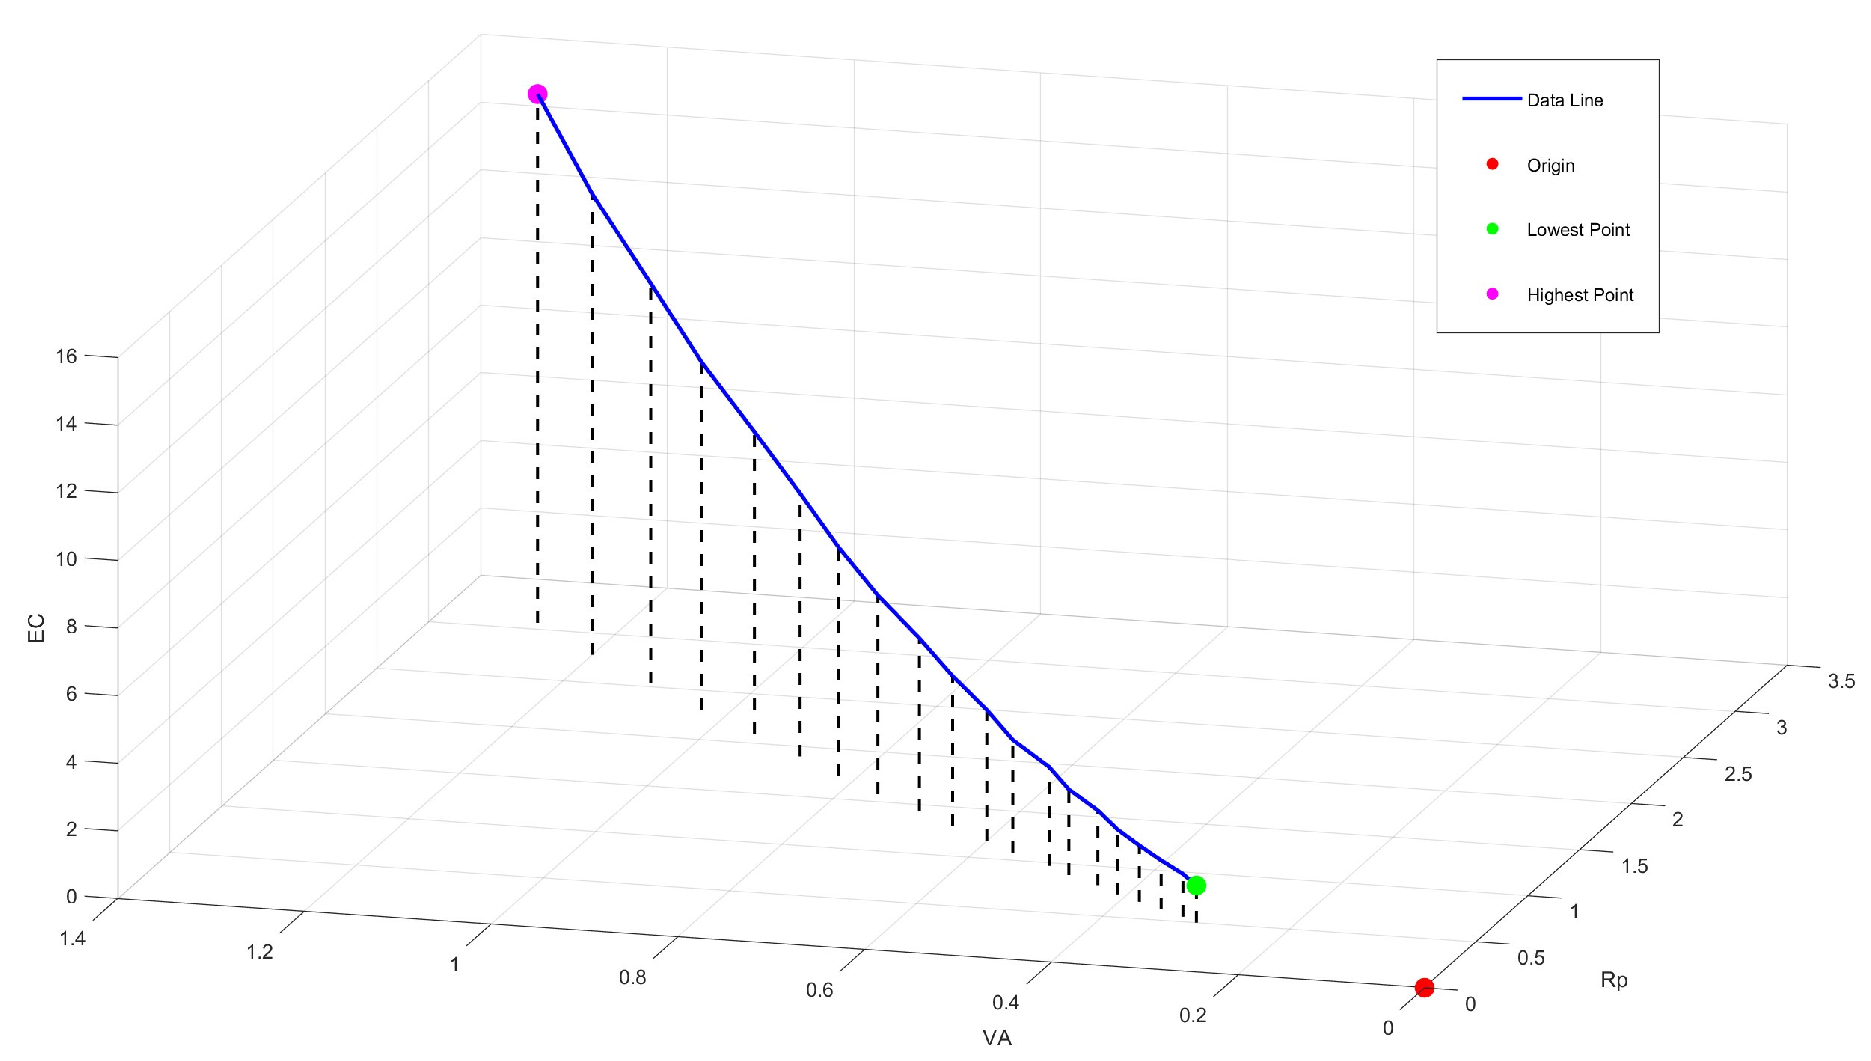
3.3.1. Three-Dimensional Diagnosis and Analysis of Circular Economy Efficiency

The three factors of resource circulation efficiency, namely resource productivity, value-added output rate, and environmental efficiency, can be depicted in a three-dimensional diagram, as shown in Figure 2.
By analysing the resource circulation efficiency of production units or processes using three-dimensional factors, we can identify potential points for improvement. Figure 2 shows the resource circulation efficiency of three different processes in an enterprise, with the three points A, B, and C in the figure corresponding to different levels of resource circulation efficiency. The original point (0,0,0) represents zero resource productivity, value-added output rate, and environmental efficiency, which leads to resource circulation efficiency. The farther away A, B, and C are from the original point, the higher the level of CE. According to the positions of A, B, and C in Figure, we can rank the improvement potential as C > B > A. Point C is closest to the coordinate origin; therefore, it has the greatest improvement potential. Analysing the positions of the factors represented by point C, it can be seen that the resource productivity ( R p i ) position is relatively low, the value-added output rate ( V a i ) is high, and the environmental efficiency ( E c i ) position is high. Among multiple production enterprises or processes, the point with relatively low resource circulation efficiency is the point with improvement potential. Therefore, it can be determined that the improvement potential of point C is higher than that of points A and B, and mainly lies in the control of resource productivity, that is, improvement in the aspect of resource input.
After determining the point of improvement potential and decomposing the resource circulation efficiency index into the three factors, we can determine the areas for improvement based on the three factors to implement CE measures and improve resource circulation efficiency. Resource productivity ( R p i ) refers to the relative saving ratio of the enterprise’s resource investment under the premise that the output value scale or economic benefits are unchanged or even increased; this reflects the principle of resource input reduction and corresponds to the ‘input’ link in the production process of a CE. Measures can be taken to reduce the input of primary resources, for example, replacing primary resources with renewable resources to improve resource productivity [16]. The value-added output rate ( V a i ) is the relative proportion between the added value of resource circulation and the effective utilisation value of resources, and it reflects the principle of resource reuse and corresponds to the ‘circulation’ link in CE production. We should consider the methods of deep processing, fine processing, or reducing the rejection rate and remanufacturing to improve the value-added output rat [8]. Environmental efficiency ( E c i ) refers to the value of external damage from waste discharged into the environment under the condition of constant input resources. The external environmental damage caused by waste is directly connected with waste recycling, which reflects the principle of recycling and corresponds to the ‘export’ link of CE production. Methods such as recycling waste can be considered to improve environmental efficiency [7]. Thus, by comparing the resource efficiency index (or factor) of a process with other processes or standard indexes (or factors), we can discern the direction for refining the process.
Following this analysis principle, we can draw a conclusion that point B in Figure 2 should focus on improving the value-added output rate in the resource circulation link. Point A should focus on improving the environmental efficiency factor, that is, controlling export reduction and recycling.

3.3.2. Factor Decomposition Analysis of Resource Circulation Efficiency

According to Formula (2) and Table 1, the efficiency of resource circulation can be evaluated using the three factors (resource input, circulation, and output), and the analysis and decision optimisation framework of CE value flow can be constructed. By decomposing the continuous factors of the indicators in the three links of resource circulation, we can further analyse the deep reasons for enterprise resource circulation and design a hierarchical structure model and comprehensive evaluation index system with multiple levels, multiple modules, and multiple indicators. On one hand, the indicators of each resource circulation link can be decomposed into distinct components that are unrelated to one another. From this perspective, the efficiency of resource circulation can be evaluated based on the indicators of each link (input, circulation, and output); alternatively, factors resulting from decomposition can be used for separate evaluation and analysis. On the other hand, based on the key indicators of the three links of the material circulation process, the analysis model of the resource circulation equation can be constructed through proportional action among the indicators of resource input, consumption, flow, pollutant discharge, product cost, added value, and income. We can also refer to the evaluation methods of resource productivity and environmental efficiency and the IPAT equation and seek strict quantitative, logical relationships among the core indicators [47]. The meaning of each factor is shown in Table 2.
(1)
Decomposition of resource productivity indicators at the input end
At the input end of resources, the essence of resource productivity is making more with less input, which is an important indicator for measuring sustainable development and the efficiency of using natural resources in production activities. According to the definition of resources, resources can be divided into materials, energy, and other resources, and can also be divided into new resources and secondary utilisation resources [8]. Based on this, Resource Productivity ( R p i ) can be further decomposed into 5 sub-factors, including E s i , M s i , and O s i , and presented in a mathematical equation as below:
R p i = e f f e c t i v e   u t i l i s a t i o n   v a l u e   o f   r e s o u r c e s   r e s o u r c e   i n p u t   v a l u e = e f f e c t i v e   u t i l i s a t i o n   v a l u e   o f   r e s o u r c e s   r e s o u r c e   i n p u t   v a l u e × r e s o u r c e   i n p u t   v a l u e r e s o u r c e   i n p u t   v a l u e = e f f e c t i v e   u t i l i s a t i o n   v a l u e   o f   r e s o u r c e s   i n p u t   v a l u e   o f   r a w   m a t e r i a l s + e n e r g y   i n p u t   v a l u e + o t h e r   m a t e r i a l s   v a l u e × n e w   r e s o u r c e   v a l u e + s e c o n d a r y   r e s o u r c e   i n p u t   v a l u e r e s o u r c e   i n p u t   v a l u e = 1 i n p u t   v a l u e   o f   r a w   m a t e r i a l s + e n e r g y   i n p u t   v a l u e + o t h e r   m a t e r i a l s   v a l u e e f f e c t i v e   u t i l i s a t i o n   v a l u e   o f   r e s o u r c e s   × ( n e w   r e s o u r c e   v a l u e r e s o u r c e   i n p u t   v a l u e + s e c o n d a r y   r e s o u r c e   i n p u t   v a l u e r e s o u r c e   i n p u t   v a l u e )
Through simplification, the above equation is converted to:
R p i = 1 1 / E s i + 1 / M s i + 1 / O s i × N R r i + U R r i
Decomposition of resource productivity into raw material productivity ( M s i ), energy productivity ( E s i ) and other resource productivity resources ( O s i ) can clearly understand the effect of various resources used in the process. Differentiating input resources according to new resources and secondary resources can go deep into the source of resources, judge the problems existing in the efficiency of resource input of enterprises, and judge the reasons for the formation of resource productivity in detail so as to serve the optimisation of CE.
(2)
Decomposition of end value-added output rate at circulation end
In resource circulation, according to MFCA and value flow analysis, the added value should be the difference between the effective utilisation value of resources and the input resource cost. The cost of input resources can be divided into the cost of effective utilisation of resources and the cost of resources lost in waste according to the different value flows. Due to the operation of the CE, the internal recycling cost should also be added [48]. Therefore, the output rate of added value can be decomposed into three formulas: effective utilisation rate of resource cost ( R S r i ), waste cost loss rate ( W L r i ) and internal recycling utilisation rate ( R U r i ):
V a i = a d d e d   v a l u e   o f   r e s o u r c e   c i r c u l a t i o n e f f e c t i v e   u t i l i s a t i o n   v a l u e   o f   r e s o u r c e s = e f f e c t i v e   u t i l i s a t i o n   v a l u e   o f   r e s o u r c e s i n p u t   r e s o u r c e s   v a l u e e f f e c t i v e   u t i l i s a t i o n   v a l u e   o f   r e s o u r c e s = 1 i n p u t   r e s o u r c e s   v a l u e e f f e c t i v e   u t i l i s a t i o n   v a l u e   o f   r e s o u r c e s = 1 e f f e c t i v e   c o s t   o f   r e s o u r c e s + w a s t e   l o s s   c o s t i n t e r n a l   r e c y c l i n g   c o s t e f f e c t i v e   u t i l i s a t i o n   v a l u e   o f   r e s o u r c e s
Mathematically, the above equation becomes
V a i = 1 R S r i + W L r i R U r i
After decomposing the value-added output rate, enterprises can analyse the waste and recycling of resources and provide support for resource recycling.
(3)
Decomposition of environmental efficiency index at output end
In the output, the environmental efficiency ( E c i ) is formulated using two sub-factors, pollution damage value per unit added value ( E A V i ) and recovery rate of the added value ( E R r i ):
E c i = r e s o u r c e   i n p u t   v a l u e e x t e r n a l   d a m a g e   v a l u e = 1 e x t e r n a l   d a m a g e   v a l u e / r e s o u r c e   i n p u t   v a l u e = 1   ( p o t e n t i a l   v a l u e   o f   p o l l u t a n t s r e c o v e r y   a n d   d i s p o s a l   v a l u e ) / r e s o u r c e   i n p u t   v a l u e
E c i = 1 E A V i E R r i
Environmental efficiency ( E c i ) is the ratio between the external environmental damage value and the added value, in which the external environmental damage value mainly depends on the environmental impact caused by the discharged wastes. The amount of waste discharged consists of the difference between the total amount of waste produced and the waste recycled. To control the value of external environmental damage, on the one hand, we should reduce the total amount of waste produced in the production process; on the other hand, we should increase the degree of recycling, and finally reduce pollution and improve environmental efficiency.
Through further factor analysis of the efficiency of resource circulation, we can discover the reasons for its low efficiency and make targeted improvement plans.

3.3.3. Optimisation Planning Analysis

Based on the efficiency of resource circulation and the results of the factor analysis, enterprises can identify possible factors in the CE that require improvement and develop corresponding improvement strategies. Using the resource circulation index and decomposition factor analysis, enterprises can also predict the effect on the CE caused by the change in a single factor.
(1)
Single-factor change analysis. Under the condition that other factors remain unchanged, the influence of changing a single factor on the resource circulation efficiency ( R c i ) is analysed. If the resource productivity ( R p i ) is increased, the resource circulation efficiency ( R c i ) will increase at the same time, while other factors remain unchanged. Or, even if the environmental efficiency ( E c i ) is reduced if the output rate of added value ( V a i ) increases year-on-year, it will not affect the overall efficiency of resource circulation ( R c i ) and will not lead to a decline in the CE’s overall efficiency. Assuming that the effective utilisation value of resources in an enterprise remains unchanged and the resource recycling rate increases, the input value of new resources will decrease while the transfer value will increase, which will eventually enhance the value-added output rate ( V a i ) . Meanwhile, an increase in the resource recycling rate will drive down resource abandonment loss and improve environmental efficiency ( E c i ) .
The single-factor change model of the resource circulation equation can be applied to different levels of enterprises; it can also be used to analyse the CE’s target of specific waste. Japanese scholar Kaya Yoyichi put forward the famous “Kaya Formula”, it is considered that the emission of CO2 depends on population, per capita GDP, energy consumption per unit GDP, and emission per unit energy consumption [49]. Drawing lessons from Yoyichi’s analytical thinking and considering the efficiency of resource circulation, we can decompose CO2 emissions into the product of resource input and resource circulation efficiency by replacing population, resource productivity, energy consumption per unit of GDP, and CO2 emissions per unit of added value.
E P c = R I i × R p i × V a i × H c i
where E P c refers to CO2 emissions, and R I i refers to the financial values of input resources, including raw materials and energy supplies, H c i . Refers to CO2 emissions per unit of added value.
Based on this formula, according to the set CO2 emission target, we can consider improving the efficiency through different factors and finally achieve the CO2 emission goal. In the analysis and evaluation of enterprises’ CO2 efficiency, if there are many production processes or products or if there are many links in the industrial chain, detailed evaluation can consider processes, products, or links. In addition, it can be assumed that a certain factor is constant, such as the added value of resource circulation or CO2 emissions, and that when another factor changes, the enterprise’s CO2 efficiency changes in a certain period.
(2)
Multi-factor structure linkage analysis. In the practice of CE, the efficiency of resource circulation is usually not attributed to a change in a single factor but to multiple factors. Due to the interdependencies among factors, a change in one factor causes changes in other factors. When enterprises implement CE policies, they can make use of this rule to make optimal plans. For example, in the production process, recycling resources will reduce the amount of waste discharged to the environment, reduce the waste discharge per unit resource, and improve the environmental efficiency ( E c i ) . On the other hand, it will increase the utilisation of resources and increase the output rate of added value ( V a i ) . Combined with the multiplier effect of time and process, the effect of CE optimisation will be more promising. The resource circulation efficiency of the base period is marked as R t 0 , and it is assumed that the average speed of environmental efficiency improvement caused by the increase in resource recovery ( E c i ) is g . After n stages of m processes, the environmental efficiency ( E c i ) should change from the original E c 0 to E c 0 1 + g n + m ; The corresponding rate that affects the value-added output rate is g After n stages of m processes, the value-added output rate should change from V a 0 to V a 0 1 + g n + m . The resource circulation efficiency at that time becomes:
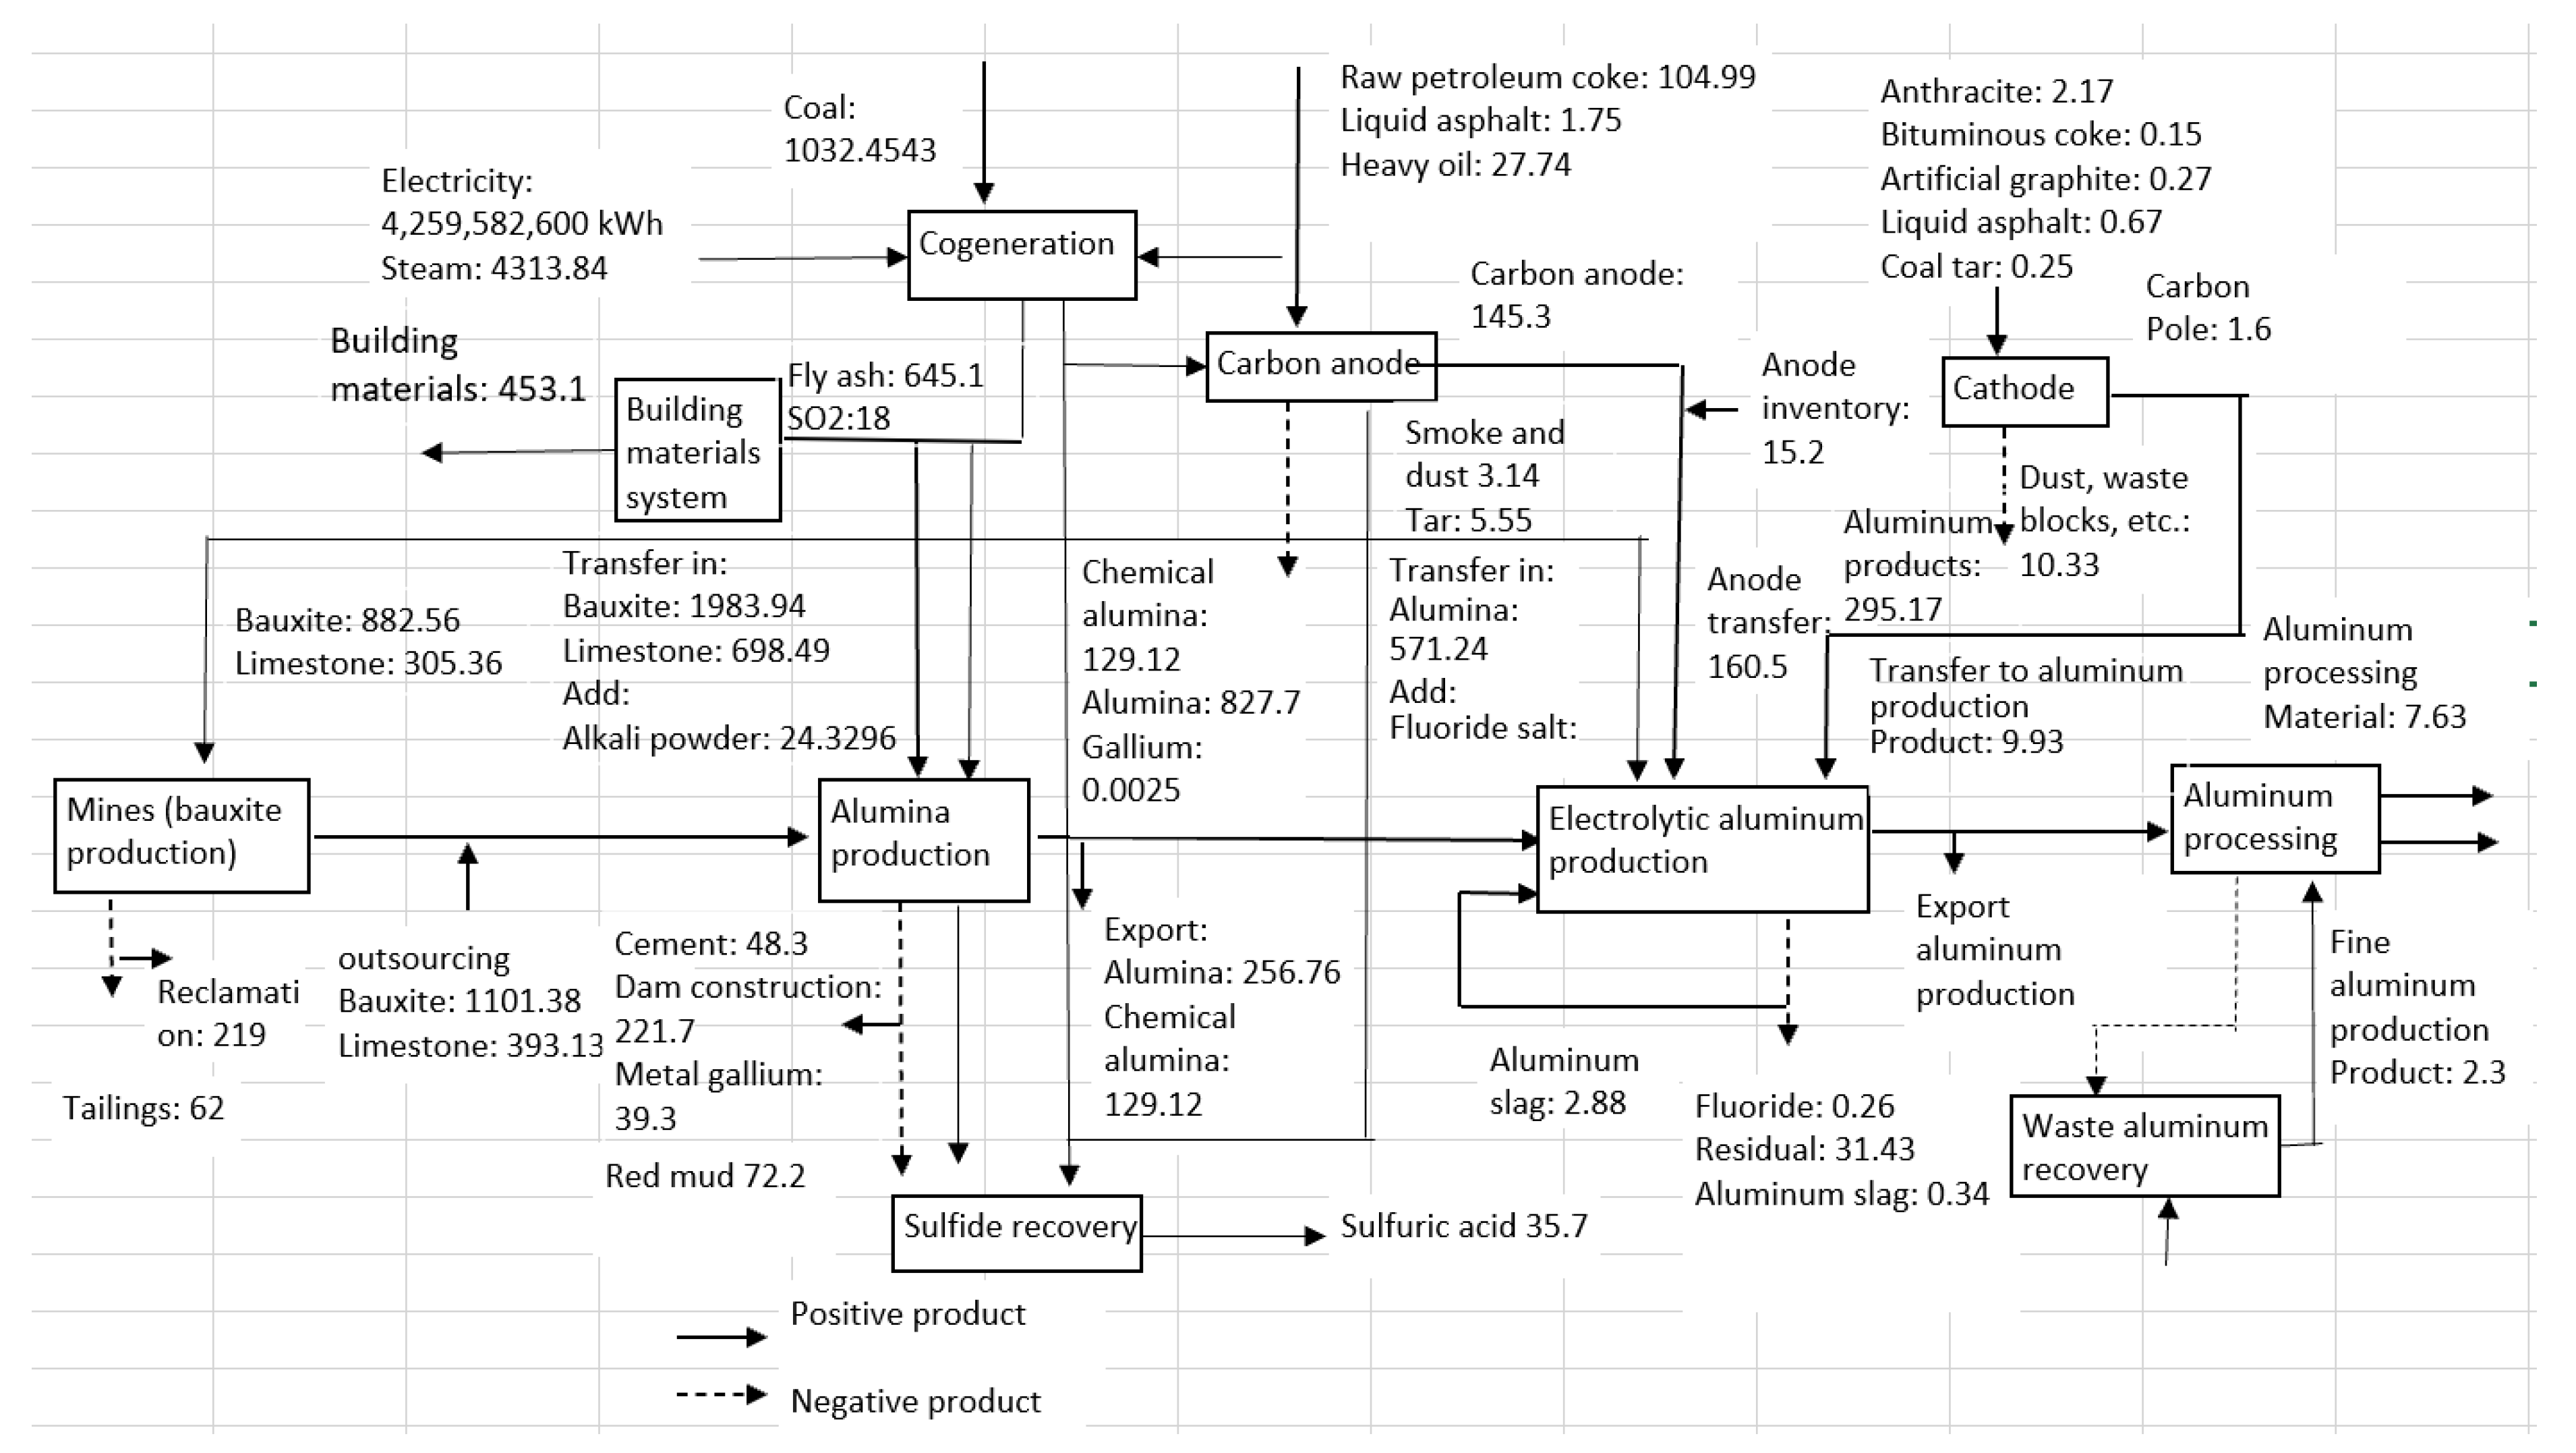
R t n = R p i × V a i × E c i = R p i 1 × V a 0 × 1 + g n + m × E c 0 × 1 + g n + m = R p i 0 × V a 0 × E c 0 × 1 + g n + m × 1 + g n + m = R t 0 × 1 + g n + m × 1 + g n + m
When implementing CE principles, enterprises can establish benchmark ranges for each index based on industry standards and benchmarks. They can then create an optimisation framework, as illustrated in the three-dimensional chart of resource circulation efficiency in Figure 3. This involves plotting the index points representing resource circulation efficiency prior to circular economy implementation. Subsequently, enterprises can set CE implementation targets based on their specific circumstances and devise feasible optimisation pathways from the three-dimensional chart.
By applying the multi-factor change principle of the resource flow efficiency equation, enterprises can predict the circular economy effect of changes across multiple indicators. Additionally, they can reverse this approach by breaking down their desired circular economy goals into multiple stages or processes, determining the necessary optimisation speed for each stage, and ultimately achieving effective circular economy practices.

4. Case Study

The purpose of the resource circulation efficiency equation (Formula (2)) is to establish the logical relationships between the environmental load, resource energy consumption, waste discharge, effective utilisation value of resources, the added value of resource transfer, the output of resource input, and other indicators. The equation of the linkage between the various factors leads to changes in comprehensive reflection regarding enterprise resource input, linking product production to the overall effect of each section of waste output. The external stakeholders of the enterprise’s resource efficiency, cycle efficiency, and resource circulation efficiency can gain a deep understanding and a comprehensive and objective evaluation of different levels of the enterprise’s economic, social, and environmental development.
As a case study, an aluminium company is located in a western province of China, with an annual output of 400,000 tonnes of electrolytic aluminium, 1.2 million tonnes of alumina, 270,000 tonnes of carbon products, and a variety of high-value-added products. These include more than 40 varieties in four major product series, mainly alumina, aluminium, aluminium products, and carbon products. The production process of raw aluminium is often accompanied by a large amount of consumption and waste discharge, which has always been the focus of improving the CE [38]. The resource value flow analysis method, based on element flow analysis, can evaluate the resource circulation and the resulting value circulation in the enterprise’s production process of aluminium products and reform the production process of the CE. In this case study, we compare the efficiencies of an enterprise’s CE operation in two different time periods: before the CE was launched (that is, prior to the current production mode) and after the CE was gradually launched (i.e., the current mode of combining cleaner production with some CE measures). However, more importantly, we can use the resource circulation efficiency index to find the weak links existing in the enterprise’s CE process and explore them.

4.1. Case Enterprise Resource Circulation Efficiency Status

According to the production characteristics of the aluminium company, the whole production process of the aluminium company is divided into four main nodes: bauxite mining, alumina production, electrolytic aluminium production, and aluminium processing, with four auxiliary nodes: thermal power plant, carbon anode, and carbon cathode. The cost inputs and element inflow and outflow paths, such as the material flow route before improvement (2015) and the corresponding material energy system, are shown in Figure 4. In this production process, all resources come from the outside world, and the whole process presents a linear production structure. A large number of non-conforming products and wastes generated in the production process are directly discharged into the external environment:
The primary data sources in this study are derived from the monthly technical quality report, accounting records, and environmental protection statistics of the aluminium company. The monthly technical quality report compiles material balance data on resource inputs and outputs during the production process. The resource input values are determined by multiplying the resource quantities by the corresponding unit prices. Following the calculation principle of MFCA and value flow analysis [43,50], the aluminium company’s resource utilisation value is computed based on aluminium elements in the production process as the allocation basis. The resource’s added value is then calculated by deducting the input value from the output value. In order to facilitate comprehensive comparison, the efficiency of resource circulation ( R c i ) in this case is all measured by monetary units. In the aspect of the environmental load of pollutants, the total external environmental damage value is obtained by multiplying the amount of waste discharged in the production process of the aluminium company by the unit environmental damage value of the corresponding waste, drawing lessons from the Japanese LIME coefficient. Based on this, the resource circulation efficiency of this aluminium company is obtained, as shown in Table 3:
Based on the information provided in the table regarding resource productivity ( R p i ), value-added output rate ( V a i ), and resource circulation efficiency ( R c i ), it is possible to analyse the weak links in each process through a horizontal comparison approach. This involves prioritising the examination of relevant CE standards and indicators to determine the optimal direction for development. From the perspective of this company’s resource circulation efficiency ( R c i ), aluminium processing and electrolytic aluminium have the best efficiency, while bauxite mining, thermal power plants, and carbon anodes have the lowest efficiency.
The comparison of the company’s resource productivity ( R p i ) shows that the resources of the bauxite mining and thermal power plants and aluminium oxide are high, while those of carbon anode, electrolytic aluminium, and aluminium processing are low. The resource production efficiency ( R p i ) reflects the value output of effective utilisation of resources per unit resource input: the higher the value, the better. Therefore, the company should maintain the resource production advantages of alumina and bauxite, and improving the resource productivity of carbon and electrolytic aluminium should be the key issue to be considered by the aluminium company.
From the comparison of the value-added output rate ( V a i ) of this aluminium company, it can be found that the recycling efficiency of alumina and bauxite is high, while that of carbon is low. The output rate of added value reflects the industrial added value multiple of the effective utilisation value of unit total materials, and the results still show that bauxite and alumina have high-profit concentrations, while the performance of the carbon anode is poor. Electrolytic aluminium and aluminium processing perform moderately in this respect. As aluminium processing involves wide product differentiation, there is still much scope for improving recycling efficiency.
The efficiency of resource circulation ( R c i ) reflects the external damage cost per unit of added value. The larger the value, the greater the impact of this production on the social and environmental load. From the comparison of this company’s resource circulation efficiency, it is found that bauxite, carbon, and alumina are the main contributors to environmental load, especially bauxite mining, which is the source of the aluminium industry. Therefore, how to improve the resource circulation efficiency coefficient of bauxite, carbon, and alumina is a key issue for the aluminium company to promote CE. In addition, electrolytic aluminium, aluminium processing, and refined aluminium have good resource circulation efficiency, especially aluminium processing and refined aluminium, with the differentiated competition; hence, this should be the key development direction of this aluminium company to improve the CE.

4.2. Selection of Optimisation Measures

According to the analysis of the resource circulation efficiency ( R c i ) and the ratio of internal factors, the aluminium company can consider adopting the following measures to optimise its CE:
(1)
Measures to improve resource productivity at the input end
From the aluminium company’s resource productivity index analysis, bauxite, thermal power plants, and carbon efficiency are the lowest, and enterprises should take measures to improve them. According to the analysis of Formula (3), the improvement in resource productivity can be considered from the aspects of raw material productivity ( M s i ), energy productivity ( E s i ), and other resource productivity ( O s i ). In bauxite production, the price of raw materials accounts for a large proportion of the cost, so the improvement in raw material productivity is mainly considered. According to the analysis of Formula (3), resource productivity should also consider the value of the input rate of new resources and secondary resources, so consider the method of replacing the original resources with renewable resources to improve. Specific measures include the following:
Utilisation of secondary aluminium.
Aluminium is an industrial structural metal with the highest recyclability and the greatest recycling benefit. After use, it can be almost completely recycled without being corroded, such as in aluminium doors, windows, and cans. Compared with the production process of primary aluminium, the recovery process of regenerated aluminium can not only save ore materials but also reduce a large amount of energy consumption and waste emissions because it does not require a smelting process. It is estimated that the energy consumption of recycling waste aluminium is only equivalent to 4.5% of the total energy needed in the process from bauxite mining to alumina extraction to primary aluminium electrolysis, and ingot casting [51]. Company A invested 1 billion yuan in building an annual output of 100,000 tonnes of recycled aluminium project. After the project is put into operation, it can save 1.4 billion hours of electricity and 1 million tonnes of water compared with the production of primary aluminium of the same scale and reduce sulfur dioxide emissions by 0.6 million tonnes and carbon dioxide emissions by 80,000 tonnes, that is, the power consumption per tonne of recycled aluminium is reduced by 14,000 kWh, water is saved by 10 tonnes, sulfur dioxide emissions are reduced by 0.06 tonnes, carbon dioxide emissions are reduced by 0.8 tonnes, and asphalt dust and fluorine pollution are not generated.
Refining gallium.
Because bauxite contains scattered gallium, although its content is extremely low (about 0.004%), it is enriched in the alumina production process because of its similarity with alumina and its compounds. The company should consider using an alkaline reagent as a desorption agent to develop a new desorption process, which can greatly improve the recovery rate of gallium. At present, based on gallium production in the Shandong Branch and Henan Branch, this method should be promoted in alumina production enterprises with a sintering process in Zhengzhou and Shanxi as soon as possible to improve the utilisation rate of ore materials [52]. The aluminium company produces 117,000 tonnes of red mud every month, the utilisation rate is increased to 20%, gallium can be extracted 255.25 kg every month, the sales income reaches 597,029.8, and the external environmental damage is reduced by 732,044.
(2)
Improving the value-added efficiency of the circulation end.
From the analysis of the efficiency index (value-added output rate) at the circulation end, the improvement should focus on carbon production and aluminium processing production. According to the analysis of Formula (4), to improve the output rate of added value, we should focus on the resource cost-effective utilisation rate (RSri), waste cost loss rate (WLri), and internal cycle utilisation rate. Specific measures that can be taken include the following:
Cascade utilisation of energy.
The energy is utilised step-by-step according to its grade, and the irreversible process is carried out in the direction of reducing the energy grade. Cascade utilisation can improve the energy utilisation efficiency of the whole system and is an important measure of energy saving. It is considered that the deep value development of energy can be achieved by means of post-ore enrichment and digestion technology, waste heat power generation, and cascade utilisation of water materials [53]. After improvement, the comprehensive energy consumption of alumina can be reduced from 1324 kg standard coal per tonne to 864 kg standard coal per tonne, with a reduction rate of 35%. At the same time, the production quantity of ash and slag is also reduced, so that the emission of sulfur dioxide is reduced by 91.72%, and finally, the cost is reduced by ¥9,758,424.83, and the sulfur dioxide treatment fee is reduced by ¥230,400.
(3)
Measures to improve environment efficiency at the output end
From the aluminium company’s environmental efficiency indicators, the focus of improvement should be on bauxite, carbon, and alumina processes. A large amount of waste is generated in these processes, which ultimately affects the circular economy efficiency of enterprises. According to the analysis of Formula (5), environmental efficiency should be optimised from the aspects of pollutant production (EAVi) per unit of added value of resource circulation and recovery rate (Erri) per unit of added value of resource circulation. Specific measures that can be taken include:
Recovery and utilisation of red mud.
Red mud is the most important waste in the process of alumina smelting. A company needs to pay a lot of labour and land costs in order to arrange red mud. Red mud waste can be used to produce two products: cement and baking-free brick [54]. Mixing red mud with limestone, sandstone, gypsum, and other materials can produce cement through a certain process. By mixing red mud with fly ash, aggregate, gypsum, lime powder, and other materials, baking-free bricks can be produced through a certain process. A company produces 117,000 tonnes of red mud every month, 10% of which is used to produce cement, so it can produce 25,740 tonnes of cement. If 10% is used to produce baking-free bricks, the number of baking-free bricks will be 1,450,800, which will increase the gross profit from cement sales by ¥1,570,651.81, and the gross profit from baking-free bricks by ¥87,048. Reducing the discharge of red mud will generate huge environmental benefits and reduce the external damage cost by ¥1,767,600.
Comprehensive utilisation of tailings.
This process can avoid the waste of tailings. Except for a few tailings used for reclamation, the others are stored in tailings ponds, which are harmful to some extent. In addition, the aluminium company has been exploring the use of tailings to produce intermediate products to produce high value-added products such as low-temperature ceramics, high-grade ceramic wood, 4 A zeolite, etc., to achieve the purpose of comprehensive utilisation and deep development of materials. It is possible to consider methods such as selecting tailings to prepare imitation stone in order to strengthen the comprehensive utilisation of multiple tailings and improve the company’s resource circulation efficiency [55]. According to the calculation, the aluminium company can increase the recovery rate to 94.27%, the amount of lost concentrate in tailings mud can be recovered to 112.89 t, and the reclamation rate can be increased to 53.42%. After increasing the reclamation rate, the value of reclaimed land will increase by ¥875,500, and the same amount of mine land will be exchanged with reclaimed farmland, saving ¥3,670,900 in land costs. Considering the value of the equipment to be invested in the process and the corresponding cost of infrastructure, the internal economic benefit can be saved by ¥670,500, and the external damage can be reduced by ¥1,380,100.

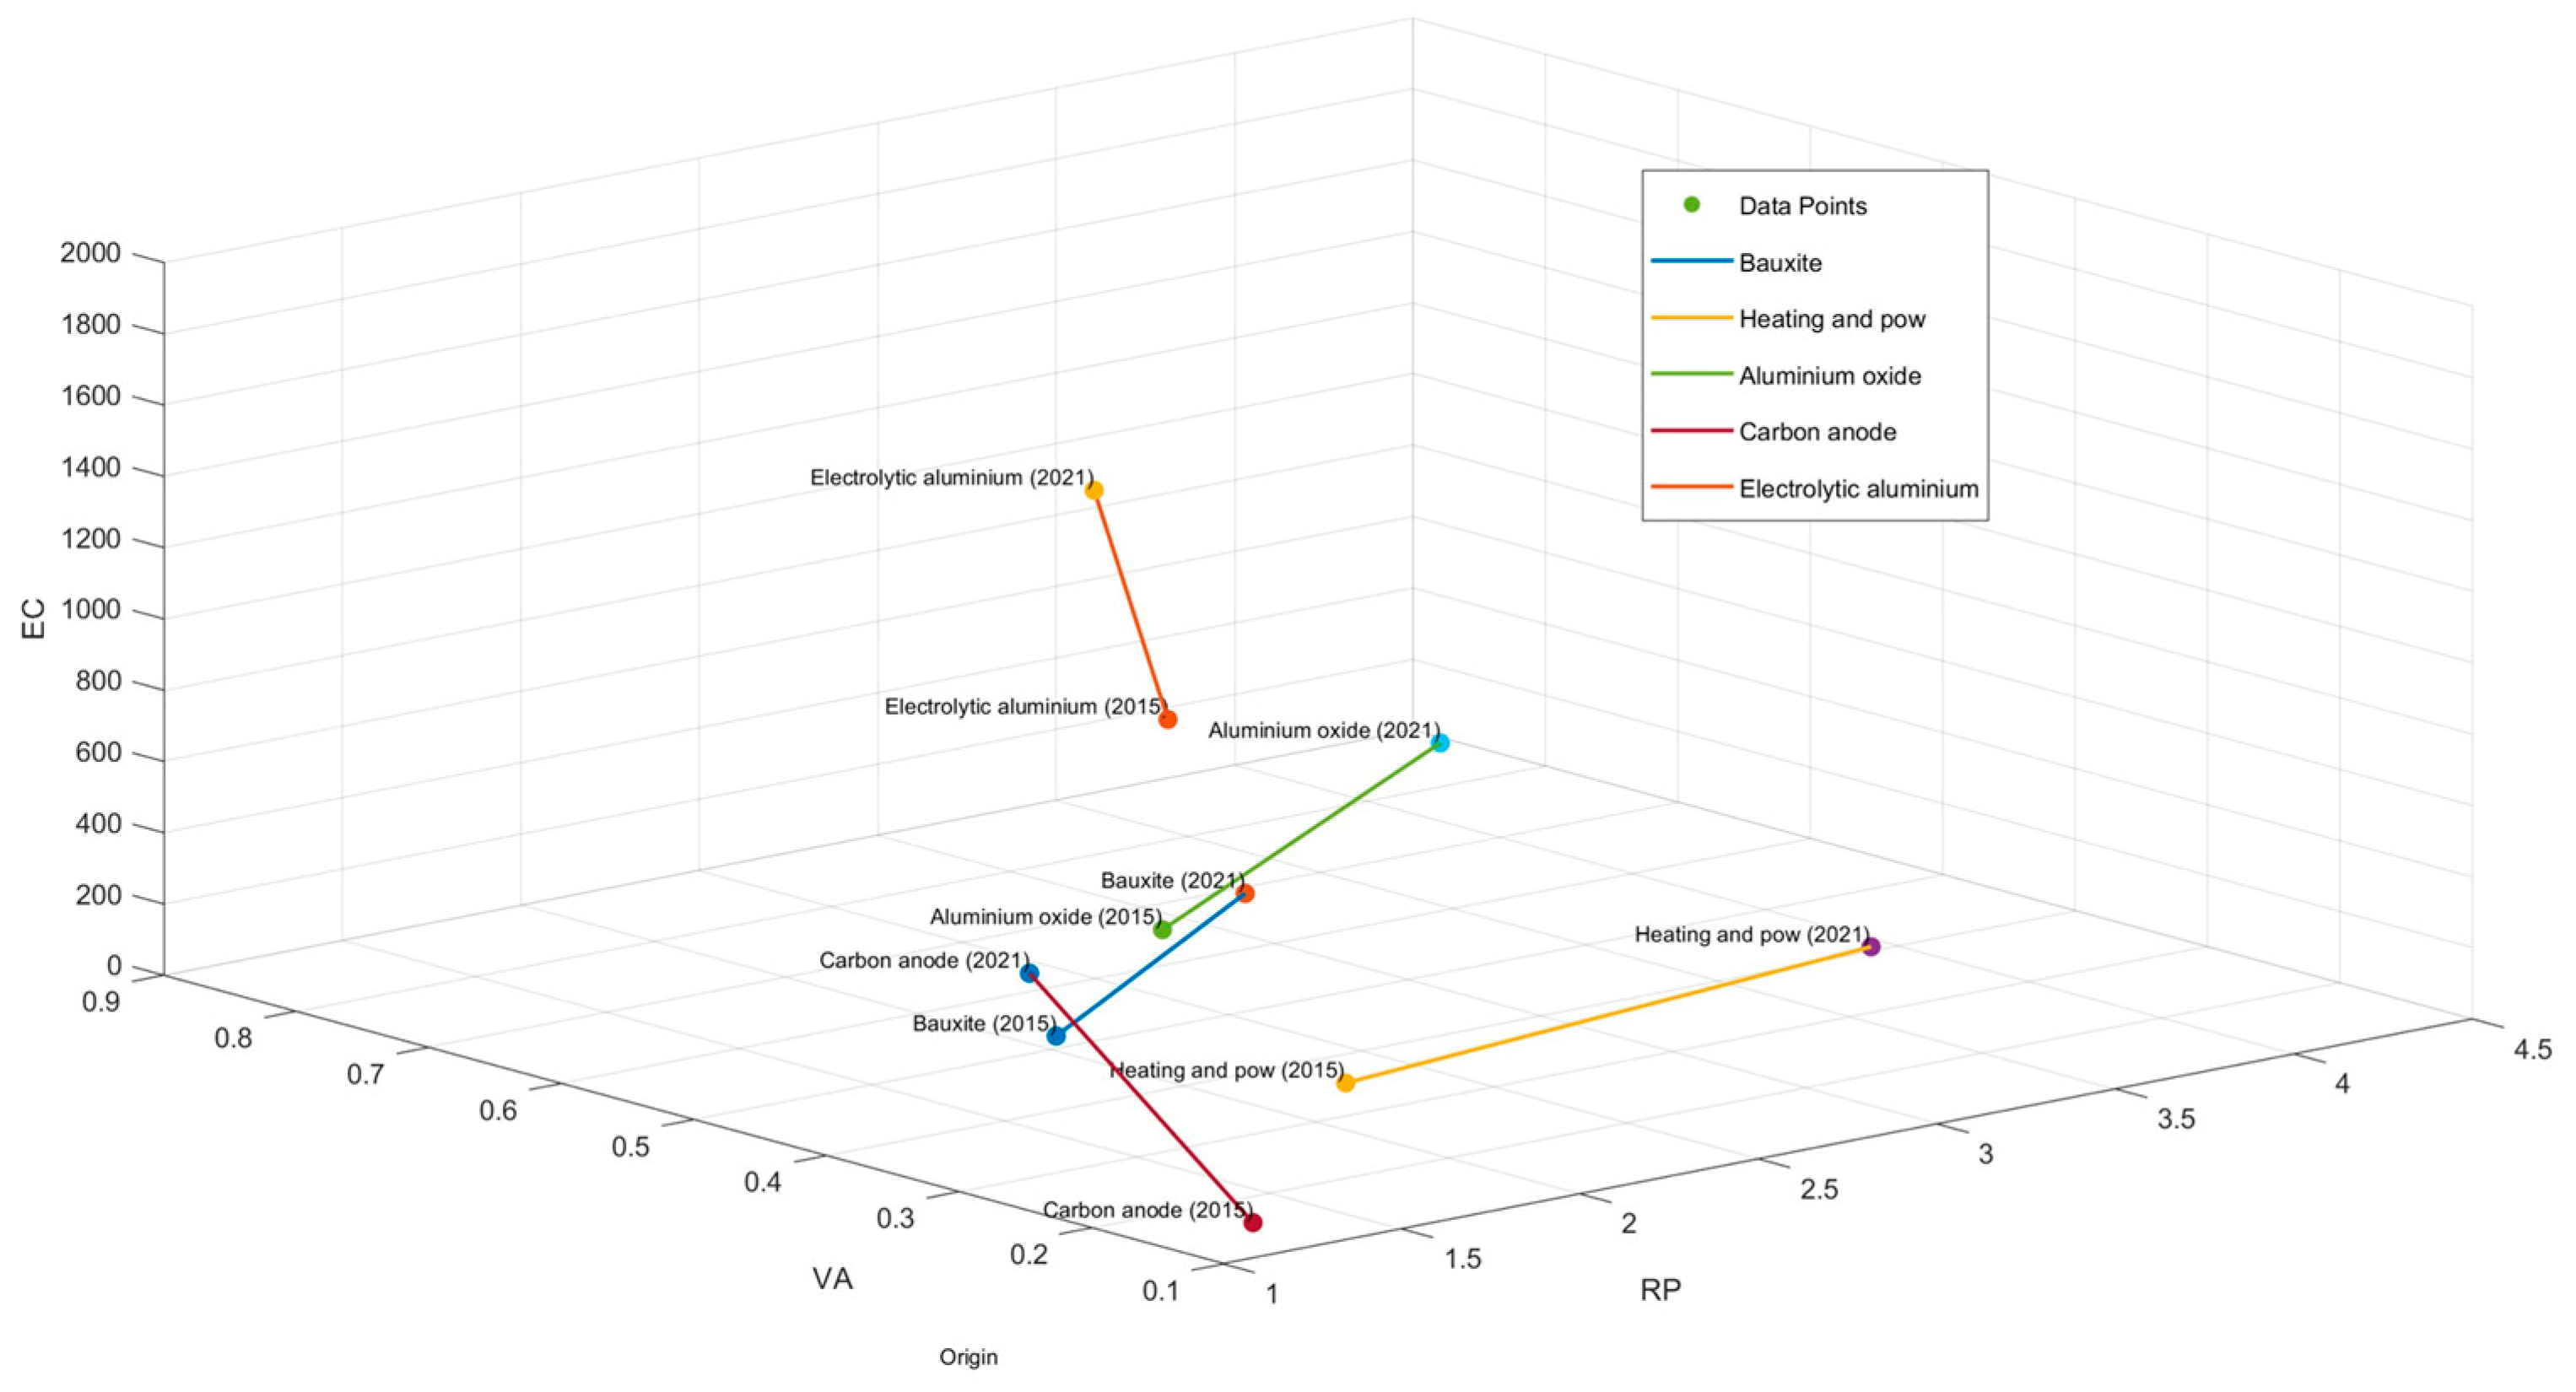
4.3. Optimisation Results and Comparison

Following the above optimisation measures, the estimated resource circulation diagram of the aluminium company in 2021 is shown in Figure 5.
The effective utilisation value of resources in each production system is determined by the product of the product output and the selling price of each system. However, after removing the factors of price changes, the industrial added value is distributed in a similar way to the previous one—that is, on the basis of industrial added value, it is distributed according to the proportion of the effective utilisation value and resource input difference of each production system to the sum of the effective utilisation value and resource input difference. Similarly, the calculation of waste discharge for each production system adopts the same method as above—that is, the waste generated by different production systems is distributed step-by-step. If one production system produces one or several exclusive wastes, the amount of waste will be directly included in the production system; if two or more production systems produce a certain kind of waste at the same time, it will be distributed according to the output of each production system. According to the above data on resource input, effective utilisation value and added value of industrial resources, and environmental pollutant discharge, the improved resource circulation efficiency ( R c i ) can be obtained as shown in Table 4:
The effects before and after optimisation are compared in Figure 6 (The source point of the arrow indicates the factor before improvement, and the point indicated by the arrow indicates the situation after improvement):
Comparing the resource circulation efficiency ( R c i ) of various production systems in this aluminium company, it can be seen that in the bauxite system, the main improvement lies in the change of environmental benefit and effective utilisation value of resources caused by the reclamation of tailings, which is manifested in the reduction of resource productivity ( R p i ) and the sharp decline of resource circulation efficiency. In the alumina system, the extraction method of gallium and iron in red mud was adopted, which not only increased the output and the value-added output, but also greatly reduced the amount of red mud discharged to the environment. In the resource input link, the relative savings of resources are 388.201 million yuan and 267.190 million yuan, respectively, indicating that the resource-saving level of the alumina production system of this aluminium company had been substantially improved since the CE was launched, which brought additional resource cost savings. In the links of resource output and waste generation, the external environmental damage costs of red mud, tailings, and industrial waste in the alumina production system of this aluminium company are also reduced, at the values of ¥1,066,227,500 and ¥410,401,300, respectively. In addition, the emission of SO2 has also been reduced to a certain extent, and the cost saving from reduced environmental damage is ¥246,606,900.
In the electrolytic aluminium system, due to the adoption of energy-saving and emission-reduction technology-three-degree optimisation control technology of the electrolytic cell, stable operation of the electrolytic cell, improvement of current efficiency, reduction of material consumption and energy consumption, and reduction of the anode effect and PFC emission are achieved. From the input of materials to the development of CE, the cost savings of all resources are positive, among which the cost savings of electric power, alumina, etc., are large, and the relative savings of materials are estimated to be ¥877,340,700 and ¥250,664,700, respectively. This indicates that the resource-saving level of the electrolytic aluminium production system in this aluminium company has been greatly improved since the development of the CE, bringing additional relative economic benefits of resource cost savings. In the link between material output and waste generation, the external environmental damage cost of industrial waste and ash in the company’s electrolytic aluminium production system is also relatively large, at ¥181,498,900 and ¥297,895,800, respectively. However, it is expected that some fluoride will be discharged after the development of CE, so the external environmental damage cost brought to the electrolytic aluminium production system of this aluminium company is ¥2,937,529,800.
In other systems, the sequential utilisation of energy and adoption of cleaner production technology have yielded favourable outcomes in terms of resource circulation. In the carbon system, spanning from the material input phase to the development of CE practices, all instances of material input cost savings exhibit positivity. For instance, for petroleum coke and heavy oil, the relative material savings amount to ¥103,997,700 and ¥155,013,000, respectively. In the link between material output and waste generation, notable reductions in external environmental damage costs have been achieved within the caron production system of the aluminium company. Specifically, the savings are ¥100,832,700 for industrial waste, ¥165,344,900 for ash, and ¥59,558,600 for industrial wastewater. In the context of the aluminium processing system, relative savings translate to ¥14,859,100 and ¥31,316,900 for material input, and ¥4,840,000 for external environmental damage costs related to material output and waste generation. The assessment diagram depicted in Figure 5 illustrates the efficiency of resource circulation ( R c i ) and data related to various factors within each of the company’s production systems prior to the implementation of the CE approach. The data show that in terms of waste discharge per unit of resource, the alumina production system exhibits the highest effective utilisation value, followed by the electrolytic aluminium production system, whereas the carbon and aluminium processing production systems demonstrate significantly lower values. This observation underscores the substantial scale of the company’s front-end industry prior to the initiation of the CE strategy. However, the rear high-end industry, primarily responsible for generating high-value-added products, appears notably underdeveloped. Consequently, this imbalance inevitably leads to significant challenges concerning resource management, energy consumption, waste generation, and limited economic and environmental advantages.
Similarly, we can analyse the accumulated industrial added value and waste emissions of the aluminium company post-implementation of CE and evaluate the resource circulation efficiency of each production system and the situation relative to the overall resource circulation efficiency of that year so as to see the trends and the links that need to be improved. Therefore, the efficiency evaluation chart for each of the company’s production systems post the implementation CE can be obtained, as shown in Figure 7.
In Figure 7, the dashed arrows reflect the trajectory of change in the resource transfer efficiency ( R c i ) for each production system within the aluminium company. The solid line indicates the overall directional shift in the resource circulation efficiency for the whole aluminium company. The purple line illustrates the resource flow efficiency in 2015 prior to the initiation of the CE, while the blue line signifies the resource flow efficiency post-CE implementation in 2021. By comparing the linear trajectories of individual production systems, it becomes evident that the resource circulation efficiency index value for the alumina production system before optimisation was initially lower than the annual aggregate efficiency index value. Similarly, poor performance was observed in the thermal power plants and carbon processes before the optimisation efforts. However, following the introduction of CE, substantial enhancements in resource flow efficiency have been achieved in both processes. Moreover, there has been a marked improvement in resource circulation efficiency across the board for other processes.

5. Discussions of Findings

(1)
The resource circulation efficiency equation and associated evaluation methods could measure both environmental and economic benefits. They effectively assess circular economy implementation efficiency by decomposing the indicators according to the resource flow path. This approach not only aligns with the “3R” principle of the circular economy but also identifies optimisation pathways, offering clear guidance for enterprises to implement the circular economy.
(2)
However, the evaluation method system presented in this paper has limitations. It relies heavily on acquiring data related to physical quantities, costs, environmental factors, and technologies; these data were sourced from various literature, production site specifications, financial records, and environmental management reports. The broad range of data sources and the complexity of accounting processes somewhat compromise result accuracy. The cost-benefit analyses in the case studies are partly theoretical, requiring further validation to ascertain the actual economic and environmental benefits during implementation.
(3)
When the resource cycle efficiency equation optimises a circular economy, it may also produce results that do not meet our expectations. One possible reason is the cost-benefit comparison of optimisation measures; another is the lack of motivation for enterprises to improve; they may be more inclined to improve economic benefits rather than environmental benefits, or to improve economic benefits while ignoring environmental benefits, which will eventually lead to the decline of resource recycling efficiency, especially in some areas with poor environmental protection concepts. This requires that, in addition to economic power, there also needs to be other external power to promote the improvement of circular economy efficiency.
(4)
To improve accuracy and applicability, enterprises should consider establishing relevant databases for information collection when implementing the resource recycling efficiency equation for circular economy optimisation. A comprehensive database not only provides more reliable data sources but also facilitates long-term data comparison across different periods, enabling more effective cost-benefit analyses of optimisation measures.

6. Conclusions

This paper argues that CE serves a dual purpose: (i) enhancing economic metrics related to product output and (ii) technical indicators like resource utilisation efficiency and environmental effectiveness. CE necessitates the consideration of economic, environmental, and social impacts. Thus, the paper devises a CE assessment model based on the resource circulation efficiency equation. Leveraging this equation-based evaluation, it proposes an optimisation strategy for CE at the enterprise level.
(1)
The resource circulation efficiency equation draws inspiration from the resource value distribution theory within the value flow analysis. It posits that waste’s value encompasses both the loss of resources and potential environmental harm. This method’s formulated resource circulation efficiency equation encompasses not only economic gains (resource recycling value) but also addresses environmental benefits (external environmental damage value) and social advantages (economic added value). By quantifying these three dimensions, the resulting assessment and analysis system becomes more comprehensive and succinct.
(2)
The resource circulation efficiency equation is dissected into three components: input, circulation, and output—aligned with the CE’s “3R” principle. Here, the resource input’s productivity corresponds to CE’s “reduction” principle, while the output’s value-added rate relates to the “recycling” concept. Furthermore, environmental efficiency aligns with the CE’s “reuse” objective. These segments form a visual decision-making tool, aiding enterprises in making optimal CE choices.
(3)
Employing the resource circulation efficiency equation as a foundation, the use of a three-dimensional diagram, factorisation, and optimisation planning analysis empowers enterprises to streamline CE practices. By applying this methodology, the case study company enhances resource circulation efficiency, demonstrating the practical effectiveness of this approach.
(4)
The case study used in this paper is limited to an aluminium company located in the western province of China and does not represent other industries or regions. Theoretically, the evaluation model is suitable for most process-oriented production enterprises, but due to many limitations, it has not been applied at a larger level. Therefore, the universality of this model still has some defects and needs more case verification. In addition, the resource circulation efficiency equation and its optimisation model are based on the value stream analysis of the circular economy, and the data comes from the value stream analysis. Therefore, the proposed index system is more applicable to enterprises that actually apply value stream analysis.

Author Contributions

Conceptualization, S.L. and Y.X.; methodology, S.L. and Y.X.; software, S.L. and W.L.; validation, Y.X.; formal analysis, S.L. and Y.X.; investigation, S.L., W.L. and Y.X.; resources, W.L.; data curation, S.L.; writing—original draft preparation, S.L.; writing—review and editing, W.L. and Y.X. All authors have read and agreed to the published version of the manuscript.

Funding

This work was supported by the National Social Science Foundation of China (No.:21BGL184).

Institutional Review Board Statement

Not applicable.

Informed Consent Statement

Not applicable.

Data Availability Statement

Data will be made available on request.

Conflicts of Interest

The authors declare that they have no known competing financial interests or personal relationships that could have appeared to influence the work reported in this paper.

References

  1. Mahroof, K.; Omar, A.; Rana, N.P.; Sivarajah, U.; Weerakkody, V. Drone as a Service (DaaS) in promoting cleaner agricultural production and Circular Economy for ethical Sustainable Supply Chain development. J. Clean. Prod. 2020, 287, 125522. [Google Scholar] [CrossRef]
  2. Garza-Reyes, J.A.; Kumar, V.; Batista, L.; Cherrafi, A.; Rocha-Lona, L. From linear to circular manufacturing business models. J. Manuf. Technol. Manag. 2019, 30, 554–560. [Google Scholar] [CrossRef]
  3. Garcia-Bernabeu, A.; Hilario-Caballero, A.; Pla-Santamaria, D.; Salas-Molina, F. A Process Oriented MCDM Approach to Construct a Circular Economy Composite Index. Sustainability 2020, 12, 618. [Google Scholar] [CrossRef]
  4. Agrawal, R.; Wankhede, V.A.; Kumar, A.; Luthra, S.; Huisingh, D. Progress and trends in integrating Industry 4.0 within Circular Economy: A comprehensive literature review and future research propositions. Bus. Strat. Environ. 2021, 31, 559–579. [Google Scholar] [CrossRef]
  5. Morais, J.; Corder, G.; Golev, A.; Lawson, L.; Ali, S. Global review of human waste-picking and its contribution to poverty alleviation and a circular economy. Environ. Res. Lett. 2022, 17, 063002. [Google Scholar] [CrossRef]
  6. Bassi, F.; Guidolin, M. Resource Efficiency and Circular Economy in European SMEs: Investigating the Role of Green Jobs and Skills. Sustainability 2021, 13, 12136. [Google Scholar] [CrossRef]
  7. Ludlow, J.; Jalil-Vega, F.; Rivera, X.S.; Garrido, R.A.; Hawkes, A.; Staffell, I.; Balcombe, P. Organic waste to energy: Resource potential and barriers to uptake in Chile. Sustain. Prod. Consum. 2021, 28, 1522–1537. [Google Scholar] [CrossRef]
  8. Reike, D.; Vermeulen, W.J.V.; Witjes, S. The circular economy: New or Refurbished as CE 3.0?—Exploring Controversies in the Conceptualization of the Circular Economy through a Focus on History and Resource Value Retention Options. Resour. Conserv. Recycl. 2018, 135, 246–264. [Google Scholar] [CrossRef]
  9. Schaltegger, S.; Synnestvedtb, T. The link between ‘green’ and economic success: Environmental management as the crucial trigger between environmental and economic performance. J. Environ. Manag. 2002, 65, 339–346. [Google Scholar] [CrossRef]
  10. Brunner, P.H.; Rechberger, H. Practical Handbook of Material Flow Analysis. Int. J. Life Cycle Assess. 2004, 9, 337–338. [Google Scholar] [CrossRef]
  11. Boulding, K. The economics of the coming spaceship earth. In Environmental Quality in a Growing Economy; Jarrett, H., Ed.; Resources for the Future/Johns Hopkins University Press: London, UK, 1966; pp. 3–14. [Google Scholar]
  12. Rizos, V.; Behrens, A.; Van der Gaast, W.; Hofman, E.; Ioannou, A.; Kafyeke, T.; Flamos, A.; Rinaldi, R.; Papadelis, S.; Hirschnitz-Garbers, M.; et al. Implementation of Circular Economy Business Models by Small and Medium-Sized Enterprises (SMEs): Barriers and Enablers. Sustainability 2016, 8, 1212. [Google Scholar] [CrossRef]
  13. Škrinjarić, T. Dynamic portfolio optimization based on grey relational analysis approach. Expert Syst. Appl. 2020, 147, 113207. [Google Scholar] [CrossRef]
  14. Huyen, D.T.T.; Tram, L.T.B.; Truong, H.N.; Van Thanh, T. Application of fuzzy analytic hierarchy process and linear goal programing for selection of best available techniques of the cold rolled coil manufacturing processes: A case study in Binh Duong, Vietnam. Environ. Qual. Manag. 2021, 31, 325–346. [Google Scholar] [CrossRef]
  15. Govindan, K.; Nasr, A.K.; Karimi, F.; Mina, H. Circular economy adoption barriers: An extended fuzzy best–worst method using fuzzy DEMATEL and Supermatrix structure. Bus. Strat. Environ. 2022, 31, 1566–1586. [Google Scholar] [CrossRef]
  16. Tian, X.; Xie, J.; Xu, M.; Wang, Y.; Liu, Y. An infinite life cycle assessment model to re-evaluate resource efficiency and environmental impacts of circular economy systems. Waste Manag. 2022, 145, 72–82. [Google Scholar] [CrossRef]
  17. Chen, X.; Zhang, X.; Wu, X.; Lu, C.-C. The environmental health and energy efficiency in China: A network slacks-based measure. Energy Environ. 2021, 33, 170–188. [Google Scholar] [CrossRef]
  18. Ding, L.-L.; Lei, L.; Wang, L.; Zhang, L.-F. Assessing industrial circular economy performance and its dynamic evolution: An extended Malmquist index based on cooperative game network DEA. Sci. Total. Environ. 2020, 731, 139001. [Google Scholar] [CrossRef]
  19. Wang, Q.; Zhang, Y.; Tian, S.; Yuan, X.; Ma, Q.; Liu, M.; Li, Y.; Liu, J. Evaluation and optimization of a circular economy model integrating planting and breeding based on the coupling of emergy analysis and life cycle assessment. Environ. Sci. Pollut. Res. 2021, 28, 62407–62420. [Google Scholar] [CrossRef]
  20. Gervasio, H. The role of resource efficiency towards circular economy. IOP Conf. Ser. Earth Environ. Sci. 2019, 225, 012057. [Google Scholar] [CrossRef]
  21. Strothman, P.; Sonnemann, G. Circular economy, resource efficiency, life cycle innovation: Same objectives, same impacts? Int. J. Life Cycle Assess. 2017, 22, 1327–1328. [Google Scholar] [CrossRef]
  22. Tashkeel, R.; Rajarathnam, G.P.; Wan, W.; Soltani, B.; Abbas, A. Cost-Normalized Circular Economy Indicator and Its Application to Post-Consumer Plastic Packaging Waste. Polymers 2021, 13, 3456. [Google Scholar] [CrossRef] [PubMed]
  23. Rem, M.P.C. A Robust Indicator for Promoting Circular Economy through Recycling. J. Environ. Prot. 2015, 6, 1095–1104. [Google Scholar]
  24. Maldonado-Romo, J.; Aldape-Pérez, M. Sustainable Circular Micro Index for Evaluating Virtual Substitution Using Machine Learning with the Path Planning Problem as a Case Study. Sustainability 2021, 13, 13436. [Google Scholar] [CrossRef]
  25. Vardopoulos, I.; Konstantopoulos, I.; Zorpas, A.A.; Limousy, L.; Bennici, S.; Inglezakis, V.J.; Voukkali, I. Sustainable metropolitan areas perspectives through assessment of the existing waste management strategies. Environ. Sci. Pollut. Res. 2020, 28, 24305–24320. [Google Scholar] [CrossRef] [PubMed]
  26. Nowakowski, P.; Król, A. The influence of preliminary processing of end-of-life tires on transportation cost and vehicle exhausts emissions. Environ. Sci. Pollut. Res. 2020, 28, 24256–24269. [Google Scholar] [CrossRef] [PubMed]
  27. Gu, F.; Hall, P.; Miles, N.J. Performance evaluation for composites based on recycled polypropylene using principal component analysis and cluster analysis. J. Clean. Prod. 2016, 115, 343–353. [Google Scholar] [CrossRef]
  28. Aloini, D.; Dulmin, R.; Mininno, V.; Stefanini, A.; Zerbino, P. Driving the Transition to a Circular Economic Model: A Systematic Review on Drivers and Critical Success Factors in Circular Economy. Sustainability 2020, 12, 10672. [Google Scholar] [CrossRef]
  29. Antonopoulos, I.; Faraca, G.; Tonini, D. Recycling of post-consumer plastic packaging waste in the EU: Recovery rates, material flows, and barriers. Waste Manag. 2021, 126, 694–705. [Google Scholar] [CrossRef] [PubMed]
  30. Puntillo, P.; Gulluscio, C.; Huisingh, D.; Veltri, S. Reevaluating waste as a resource under a circular economy approach from a system perspective: Findings from a case study. Bus. Strat. Environ. 2020, 30, 968–984. [Google Scholar] [CrossRef]
  31. Meglin, R.; Kytzia, S.; Habert, G. Regional circular economy of building materials: Environmental and economic assessment combining Material Flow Analysis, Input-Output Analyses, and Life Cycle Assessment. J. Ind. Ecol. 2021, 26, 562–576. [Google Scholar] [CrossRef]
  32. Iacovidou, E.; Hahladakis, J.N.; Purnell, P. A systems thinking approach to understanding the challenges of achieving the circular economy. Environ. Sci. Pollut. Res. 2020, 28, 24785–24806. [Google Scholar] [CrossRef] [PubMed]
  33. Higashida, A. Supply chain MFCA implementation: Emphasizing evidence on coordination. Sustain. Account. Manag. Policy J. 2020, 12, 695–718. [Google Scholar] [CrossRef]
  34. Xiao, X.; Zhen, J.; Zeng, H. Research on MFCA-Based Priority Ranking Method for Waste Recycling and Its Application. Sci. Technol. Prog. Policy. 2017. Available online: http://en.cnki.com.cn/Article_en/CJFDTotal-KJJB201709009.htm (accessed on 2 July 2024).
  35. Fakoya, M.B.; Imuezerua, E.O. Identifying ‘True’ Water Loss Information through the MFCA Model for Improved Cost-Saving Decisions in a Water Utility: A Case Study of the Doorndraai Water Treatment Scheme in South Africa. Sustainability 2020, 12, 7824. [Google Scholar] [CrossRef]
  36. Nakajima, M.; Kimura, A.; Wagner, B. Introduction of material flow cost accounting (MFCA) to the supply chain: A questionnaire study on the challenges of constructing a low-carbon supply chain to promote resource efficiency. J. Clean. Prod. 2015, 108, 1302–1309. [Google Scholar] [CrossRef]
  37. Prox, M. Material Flow Cost Accounting Extended to the Supply Chain—Challenges, Benefits and Links to Life Cycle Engineering. Procedia CIRP 2015, 29, 486–491. [Google Scholar] [CrossRef]
  38. Wan, Y.K.; Ng, R.T.; Ng, D.K.; Tan, R.R. Material flow cost accounting (MFCA)–based approach for prioritisation of waste recovery. J. Clean. Prod. 2015, 107, 602–614. [Google Scholar] [CrossRef]
  39. Tran, T.T.; Herzig, C. Material Flow Cost Accounting in Developing Countries: A Systematic Review. Sustainability 2020, 12, 5413. [Google Scholar] [CrossRef]
  40. Zhou, Z.; Zhao, W.; Chen, X.; Zeng, H. MFCA extension from a circular economy perspective: Model modifications and case study. J. Clean. Prod. 2017, 149, 110–125. [Google Scholar] [CrossRef]
  41. Hyršlová, J.; Vágner, M.; Palásek, J. Material Flow Cost Accounting (Mfca)—Tool for the Optimization of Corporate Production Processes. Bus. Manag. Educ. 2011, 9, 5–18. [Google Scholar] [CrossRef]
  42. Ho, J.Y.; Ng, D.K.; Wan, Y.K.; Andiappan, V. Synthesis of wastewater treatment plant based on minimal waste generation cost: A material flow cost accounting (MFCA) approach. Process. Saf. Environ. Prot. 2020, 148, 559–578. [Google Scholar] [CrossRef]
  43. Jin, Y. Study on the Expansion of Resource Value Flow Accounting in the Eco-Industrial Park:From the Perspective of Waste Recovery. Accounting Research. 2018. Available online: http://en.cnki.com.cn/Article_en/CJFDTotal-KJYJ201809003.htm (accessed on 2 July 2024).
  44. Sinha, E. Circular economy—A way forward to Sustainable Development: Identifying Conceptual Overlaps and Contingency Factors at the Microlevel. Sustain. Dev. 2021, 30, 771–783. [Google Scholar] [CrossRef]
  45. Zou, T.; Zeng, H.; Zhou, Z.; Xiao, X. A three-dimensional model featuring material flow, value flow and organization for environmental management accounting. J. Clean. Prod. 2019, 228, 619–633. [Google Scholar] [CrossRef]
  46. Arieftiara, D.; Theresa, R.M.; Sari, R. Sustainability in Health Service Industry: The Implementation of Material Flow Cost Accounting (MFCA) as an Eco-Efficient Analysis. J. Southeast Asian Res. 2021, 2021, 747009. [Google Scholar] [CrossRef]
  47. Ehrlich, P.; Holdren, J. Impact of Population Growth in Population, Esources and the Environment; US Government Printing Office: Washington, DC, USA, 1972.
  48. Ma, S.; Hu, S.; Chen, D.; Zhu, B. A case study of a phosphorus chemical firm’s application of resource efficiency and eco-efficiency in industrial metabolism under circular economy. J. Clean. Prod. 2015, 87, 839–849. [Google Scholar] [CrossRef]
  49. Kaya, Y. Impact of Carbon Dioxide Emission Control on GNP Growth: Interpretation of Proposed Scenarios IPCC Energy and Industry Subgroup, Response Strategies Working Group. 1990. Available online: http://www.researchgate.net/publication/312468754_Impact_of_carbon_dioxide_emission_control_on_GNP_growth_interpretation_of_proposed_scenarios_IPCC_energy_and_industry_subgroup_response_strategies_working_group (accessed on 2 July 2024).
  50. BS EN ISO 14051:2011; Environmental Management. Material Flow Cost Accounting. General Framework. 2011. Available online: https://bsol.bsigroup.com/Bibliographic/BibliographicInfoData/000000000030252700 (accessed on 2 July 2024).
  51. Wagiman, A.; Mustapa, M.S.; Lajis, M.A.; Shamsudin, S.; Masirin, M.I.M.; Rady, M.H. Direct Recycling of Aluminium Chips into Composite Reinforced with In Situ Alumina Enrichment. Mater. Sci. Forum 2020, 975, 165–170. [Google Scholar] [CrossRef]
  52. McGee, C.F.; Storey, S.; Clipson, N.; Doyle, E. Soil microbial community responses to contamination with silver, aluminium oxide and silicon dioxide nanoparticles. Ecotoxicology 2017, 26, 449–458. [Google Scholar] [CrossRef] [PubMed]
  53. Soo, V.K.; Peeters, J.R.; Compston, P.; Doolan, M.; Duflou, J.R. Economic and Environmental Evaluation of Aluminium Recycling based on a Belgian Case Study. Procedia Manuf. 2019, 33, 639–646. [Google Scholar] [CrossRef]
  54. Wang, L.; Hu, G.; Lyu, F.; Yue, T.; Tang, H.; Han, H.; Yang, Y.; Liu, R.; Sun, W. Application of Red Mud in Wastewater Treatment. Minerals 2019, 9, 281. [Google Scholar] [CrossRef]
  55. Liu, Z.; Gu, X. Current Situations of Tailings Utilization and Sustainable Development of Mines. Mineral Engineering Research. 2018. Available online: http://en.cnki.com.cn/Article_en/CJFDTOTAL-KTGC201801007.htm(accessed on 2 July 2024).
Figure 1. An input-output transformation system for resource circulation efficiency.
Sustainability 16 06514 g001
Figure 2. Resource circulation equation diagram.
Sustainability 16 06514 g002
Figure 3. Resource circulation efficiency optimisation path map.
Sustainability 16 06514 g003
Figure 4. Flow chart of aluminium materials in the production process of an aluminium company (2015) (unit: tonne). (Source: The author compiled it according to the production process and data of the aluminium company).
Sustainability 16 06514 g004
Figure 5. Material flow diagram of an aluminium company after improvement (2021) (unit: tonne). (Figure source: The author based on the optimised production process and data of an aluminium company in 2021).
Sustainability 16 06514 g005
Figure 6. Comparison of resource circulation efficiency before and after the improvement of CE.
Sustainability 16 06514 g006
Figure 7. Efficiency comparison of production systems before and after the development of the circular economy.
Sustainability 16 06514 g007
Table 1. The meaning of resource circulation efficiency and each factor.
IndexNotationFormulaComponent in Input-Output Transformation Map
Resource Circulation Efficiency R c i   a d d e d   v a l u e   o f   r e s o u r c e   c i r c u l a t i o n e x t e r n a l   d a m a g e   v a l u e Whole system
FactorsNotationsFormulaComponent in Input-Output Transformation Map
Resource Productivity R p i e f f e c t i v e   u t i l i s a t i o n   v a l u e   o f   r e s o u r c e s   r e s o u r c e   i n p u t   v a l u e Input
Value-added output rate V a i a d d e d   v a l u e   o f   r e s o u r c e   c i r c u l a t i o n e f f e c t i v e   u t i l i s a t i o n   v a l u e   o f   r e s o u r c e s Resource circulation
Environmental efficiency E c i r e s o u r c e   i n p u t   v a l u e e x t e r n a l   d a m a g e   v a l u e Waste discharge
Table 2. Meaning of internal indicators of resource circulation (in process i).
FactorNotationFormula
energy productivity E s i e f f e c t i v e   u t i l i s a t i o n   v a l u e   o f   r e s o u r c e s e n e r g y   i n p u t   v a l u e
r aw material productivity M s i e f f e c t i v e   u t i l i s a t i o n   v a l u e   o f   m a t e r i a l s   i n p u t   v a l u e   o f   r a w   m a t e r i a l s
productivity of other resources O s i e f f e c t i v e   u t i l i s a t i o n   v a l u e   o f   r e s o u r c e   i n p u t   v a l u e   o f   o t h e r   r e s o u r c e s
new resource input rate N R r i n e w   r e s o u r c e   v a l u e t o t a l   r e s o u r c e   i n p u t   v a l u e
secondary energy input rate U R r i s e c o n d a r y   r e s o u r c e   i n p u t   v a l u e t o t a l   r e s o u r c e   i n p u t   v a l u e
effective utilisation rate of resource cost R S r i e f f e c t i v e   c o s t   o f   r e s o u r c e s   e f f e c t i v e   u t i l i s a t i o n   v a l u e   o f   r e s o u r c e s
waste cost loss rate of the i process W L r i w a s t e   l o s s   c o s t   e f f e c t i v e   u t i l i s a t i o n   v a l u e   o f   r e s o u r c e s
internal recycling rate R U r i i n t e r n a l   r e c y c l i n g   c o s t   e f f e c t i v e   u t i l i s a t i o n   v a l u e   o f   r e s o u r c e s
pollution damage value per unit added value E A V i p o t e n t i a l   v a l u e   o f   p o l l u t a n t s r e s o u r c e   i n p u t   v a l u e
recovery rate of the added value E R r i r e c o v e r y   a n d   d i s p o s a l   v a l u e   r e s o u r c e   i n p u t   v a l u e
Table 3. Calculation table of resource circulation efficiency of the aluminium company (2015).
Factors/EfficiencyBauxite MiningHeating and Power PlantAluminium OxideCarbon AnodeElectrolytic AluminiumAluminium Processing
Resource productivity ( R p i )2.086482.2735442.8703131.1191831.289891.280985
Output rate of added value ( V a i ) 0.5207240.3477480.6516050.1064860.224740.219351
Environmental efficiency ( E c i ) 0.2760875.2791913.8971982.20981349.52820,533.88
Resource circulation efficiency ( R c i ) 0.2999644.17383225.992259.797294391.23635767.013
Table 4. Resource circulation efficiency after optimisation of an aluminium company (2021).
Index/FactorBauxiteHeating and Power PlantAluminium OxideCarbonElectrolytic AluminiumAluminium ProcessingRecycled Aluminium
Resource productivity ( R p i ) 3.2475653.8947794.3907021.5729011.3810991.5347991.649101
Output rate of added value ( V a i ) 0.6852510.3894940.84660.39930.30250.3820.4315
Environmental efficiency ( E c i ) 0.48335528.9603236.900374001893.93976,923.08/
Resource circulation efficiency ( R c i ) 1.07565643.93287137.1742251.1932791.139245,454.55/
Note: Due to the small amount of waste generated by the recycled aluminium process, the environmental efficiency data are very large and will not be considered here.
Disclaimer/Publisher’s Note: The statements, opinions and data contained in all publications are solely those of the individual author(s) and contributor(s) and not of MDPI and/or the editor(s). MDPI and/or the editor(s) disclaim responsibility for any injury to people or property resulting from any ideas, methods, instructions or products referred to in the content.

