Abstract
Air pollution remains a major public health concern globally, especially in the Western Balkan countries facing severe air quality problems. This study investigates the relationship between air quality, news media sentiment, and public discourse in Macedonia over a ten-year period (2014–2023). We employed sentiment analysis to examine the emotional tone of news coverage related to air pollution, and topic modeling to uncover recurring themes within news articles. Our analysis revealed a distinct seasonal pattern, with negative media sentiments peaking during winter months when PM10 levels were the highest. This finding aligns with the increased reliance on polluting fuels for winter heating. Interestingly, despite a stable number of neutral articles, a rise in positive-sentiment articles suggests a potential decrease in pollution levels or the effectiveness of new government policies. We identified recurring topics like air quality concerns in specific cities, public unease regarding factories, and ongoing scrutiny of government policies. Emerging topics included the impact of the COVID-19 pandemic on air quality, public discourse surrounding heating practices, and growing concerns about waste management. This study contributes to a deeper understanding of the complex interplay between air pollution data, public discourse, and media framing, offering valuable insights for policymakers and media outlets in Macedonia.
1. Introduction
Air pollution is a pressing global concern, posing significant threats to human health, environmental well-being, and economic stability [1,2,3,4]. The air pollution problems in Macedonia have been ongoing for several years and pose a serious threat [5]. The number of polluting particles is increasing well into hazardous levels each year, as per the annual analysis from 2017 to 2023 by IQAir. Based on their report on annual PM2.5 particles, Tetovo, Strumica, and Skopje are in Europe’s top 30 most polluted cities [6]. PM2.5 refers to particulate matter with a diameter of 2.5 micrometers or less, which is known for its ability to deeply penetrate the respiratory system. Our study focuses on PM10 particles, measuring those with a diameter of 10 micrometers or less, as these are specifically monitored in Macedonia and provide the most extensive dataset on air pollution in the region. PM10 is a significant component of air pollution due to its deep penetration into the respiratory system and its potential to cause various health complications, including respiratory illnesses, cardiovascular diseases, and even premature mortality [7,8,9,10,11]. Public awareness and concern regarding air quality are crucial for driving policy changes and promoting individual actions to mitigate air pollution [12,13].
Media plays a vital role in shaping public perception and influencing environmental discourse [14]. News coverage of air quality issues can raise awareness, inform the public about health risks, and hold authorities accountable for pollution control measures [15]. However, the nature and sentiment of media coverage can significantly impact how the public understands and reacts to air pollution concerns.
This research explores the interrelation between PM10 levels and media sentiment. We specifically focus on PM10 particles for several reasons. First, PM10 is widely monitored as a critical indicator of overall air quality by regulatory agencies worldwide [16]. Unlike some other measures, PM10 encompasses a variety of particles from diverse sources, including construction and industrial activities, vehicle emissions, biomass burning, etc. This makes it a comprehensive measure of the particulate matter that can cause health problems [17]. Additionally, PM10 concentrations are readily available from government monitoring stations, allowing us to establish a clear link between air quality data and media coverage.
Our study chooses news media as the source for analyzing media sentiment because it serves as a primary channel for informing the public about environmental issues. News outlets report on air quality data, discuss potential health risks, and influence public opinion through their language and tone. By analyzing the sentiment expressed in news articles about air pollution, we can gain insights into how media coverage shapes public understanding of air quality and potentially influences public behavior. By “sentiment”, we refer to the emotional tone or opinion conveyed in news articles related to air pollution.
This study aims to explore if there is a correlation between rising PM10 levels and a shift towards more negative media sentiment. Understanding this relationship holds significant value. If negative sentiments dominate air quality news during periods of high PM10 levels, this can heighten public anxiety and prompt individuals to take action to protect their health, such as by wearing masks or limiting outdoor activities, as well as prompting people to take actions to reduce pollution. Conversely, a lack of media attention or overly positive portrayals during poor-air-quality periods might lead to complacency and hinder public engagement in pollution mitigation efforts. Investigating the relationship between PM10 and sentiment can shed light on potential media biases in environmental reporting. Understanding these dynamics can inform discussions on media responsibility and encourage a more nuanced approach to environmental reporting.
This research contributes to the ongoing dialog on media portrayal of environmental issues and its impact on public behavior and policy-making. Through a detailed analysis of PM10 levels and media sentiment, we attempt to understand the dynamic interactions between air quality data and how these data are communicated in the Macedonian media. The findings of this investigation are a valuable asset for media professionals, environmental policymakers, and public health advocates seeking to bridge the gap between air quality data and effective public communication strategies.
2. Literature Review
The impact of air pollution on media coverage has been explored in various contexts and regions, highlighting the interplay between environmental conditions and media narratives. This section reviews several studies that provide a foundation for understanding our findings within the broader literature.
2.1. Relationship between Air Pollution and Media Coverage
The study by Wang et al. [18] investigates the relationship between air pollution and media slant in China, focusing on publicly listed firms. Using extensive air quality and media data at the city level, the authors found that worsening air quality leads to increased negative media coverage. Specifically, as the air quality deteriorates from lightly to heavily polluted, the number of negative sentences in news articles increases by about 1%. This effect is consistent across various types of firms and newspaper articles, with a more substantial impact being observed for firms in heavily polluting industries. These findings suggest that air pollution significantly influences media slant, contributing to a more negative portrayal of firms during high-pollution periods. This pattern supports our objective, suggesting a potential influence of air pollution on media sentiment. When air quality deteriorates, media coverage tends to adopt a more critical tone, possibly reflecting public concern and a heightened awareness of environmental health risks.
Conversely, the study by He, Zhang, and Chen [19] examines how the media coverage of haze in China aligns with sustainable development goals and environmental governance. Analyzing articles from China Daily between 2000 and 2018, these authors utilized framing theory and the issue–attention cycle to understand the dynamics of media slant. Their results indicate that most haze coverage had a neutral slant and primarily used frames that defined problems and suggested remedies. The study also found significant correlations between the frames used and the types of sources cited, such as officials and specialists. This work highlights the role of media in environmental governance and the cyclical nature of media attention to air pollution issues.
2.2. Focus and Content of Media Coverage
Ramondt and Ramírez [20] focused on how national and regional newspapers in the USA reported on air pollution over five years. Their study revealed that nearly 40% of articles mentioned human health risks, yet fewer than 10% provided information on precautionary measures. The findings suggest that media reporting in high-pollution areas does not effectively raise environmental health literacy as it fails to provide actionable information for the public.
Furthermore, Amiraslani [21] explored the role of media in raising public awareness about climate change and air pollution mitigation in urban areas. This research found that news articles predominantly focused on public awareness and warning messages related to climate change. This study emphasized the importance of researchers in generating scientific news and the need for the media to disseminate educational messages more effectively. This finding underlines the significance of the media in educating the public, not only on the existence of environmental issues but also on potential solutions.
2.3. Local Context of the Macedonian Case
While the studies mentioned above provide valuable insights from various regions, it is crucial to consider the specific context of Macedonia. Previous evidence on this subject pinpoints household heating with solid fuels, particularly during winter months, as a major contributor [22,23]. This evidence aligns with national data highlighting residential heating’s significant role in PM2.5 and PM10 emissions [24]. Industrial activity, especially from older plants lacking proper emission controls, also plays a part. Traffic emissions, while less impactful nationally, can be more concerning locally due to the prevalence of older vehicles [24,25].
The consequences of air pollution in Macedonia are severe. Studies estimate that thousands of premature deaths occur annually due to air pollution exposure, with cities like Tetovo, Bitola, and Skopje experiencing the highest mortality rates [23]. The gravity of Macedonia’s air pollution problem is undeniable; however, recent research offers guarded optimism for the future. Previous studies suggest the possibility of gradual air quality improvements, offering a cause for cautious optimism [25]. This positive outlook is further strengthened by the temporary decrease in pollution observed during the COVID-19 lockdowns [23]. These observations highlight the potential impact of stricter regulations or a shift towards cleaner energy sources, suggesting a path towards a healthier future for Macedonian citizens.
3. Materials and Methods
3.1. Data Sources
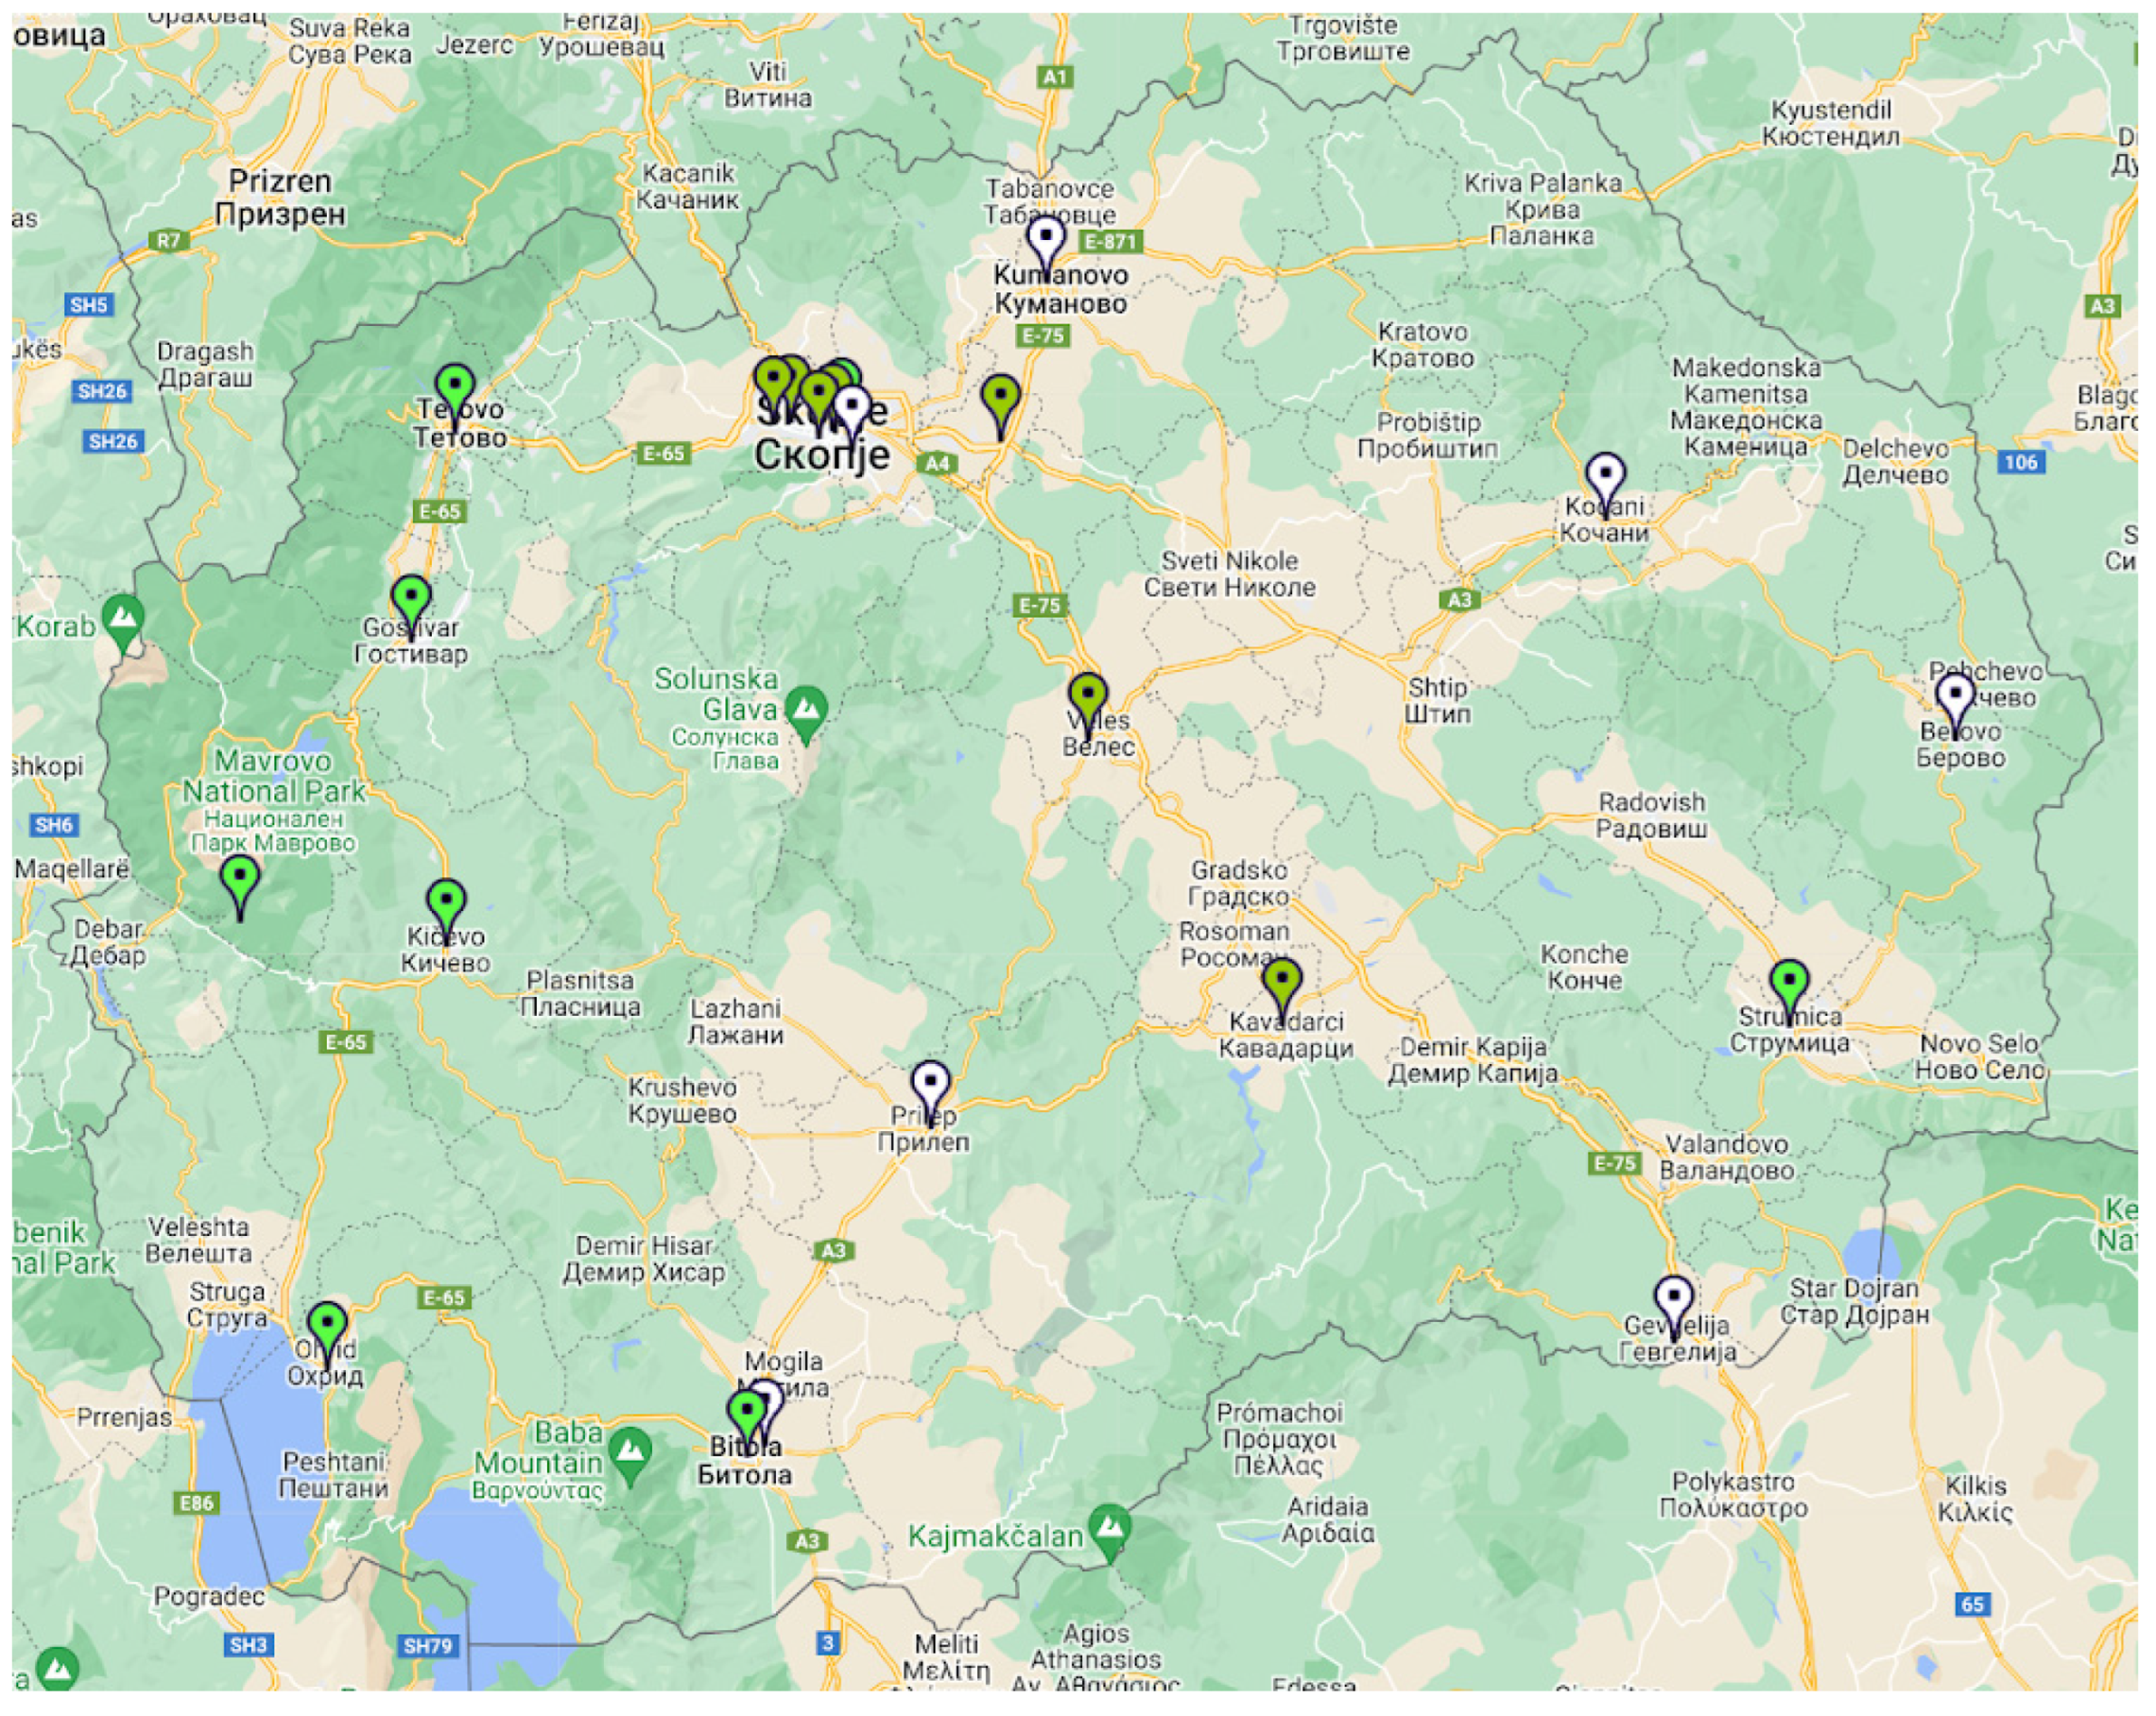
We have meticulously compiled two distinct sets of quantitative data spanning from January 2014 to December 2023, measures of PM10 particle data, and news data. The measures of PM10 particle data were sourced from the official website of the Ministry of Environment and Physical Planning (MOEPP) of Macedonia, ensuring reliability and accuracy [26]. At the time of our extraction process, measurements were provided from 23 official monitoring stations in Macedonia from the official website of MOEPP. More specifically, there were eight monitoring stations in Skopje, two in Bitola, and one each in Veles, Kichevo, Lazaropole, Tetovo, Gostivar, Prilep, Kochani, Kavadarci, Kumanovo, Strumica, Gevgelija, Berovo, and Ohrid (Figure 1).
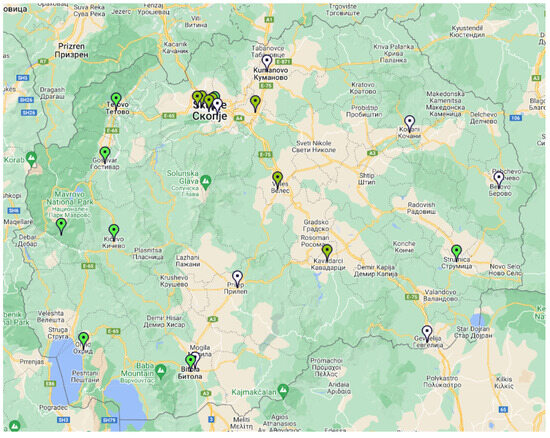
Figure 1.
Locations of official air-monitoring stations in Macedonia. Source: Ministry of Environment and Physical Planning’s Air Quality Portal, available at https://air.moepp.gov.mk/?lang=en, (accessed on 3 June 2024).
Meanwhile, the news data were collected from Time.mk, a reputable aggregator of Macedonian news outlets. Time.mk uses more than 120 distinct news media outlets as a source each day [27].
3.2. Data Gathering and Preprocessing
3.2.1. Air Data
The air data consisted of hourly measures of PM10 particles over a 10-year period. We used a Python script, utilizing the requests library. This library allows for sending an HTTP request to a website, while abstracting the process for sending a request behind an API that simplifies the work [28]. After the hourly data were extracted, they underwent careful examination and transformation. The data fields were transformed to the appropriate format, and we cleansed the data of duplicates and null rows using predefined functions from the pandas 2.0.3 library in Python 3.10.12. As a final step, we aggregated the hourly measures of PM10 particles from all of the stations combined on a daily basis. This involved calculating the mean average of the hourly data from all stations to create a comprehensive daily PM10 measurement for the entire region. Furthermore, we aggregated the daily average PM10 levels into monthly and yearly averages, by calculating an average for each month and year based on all stations, in order to observe long-term trends and variations in air quality. This temporal aggregation allowed us to capture seasonal patterns and the impact of specific events.
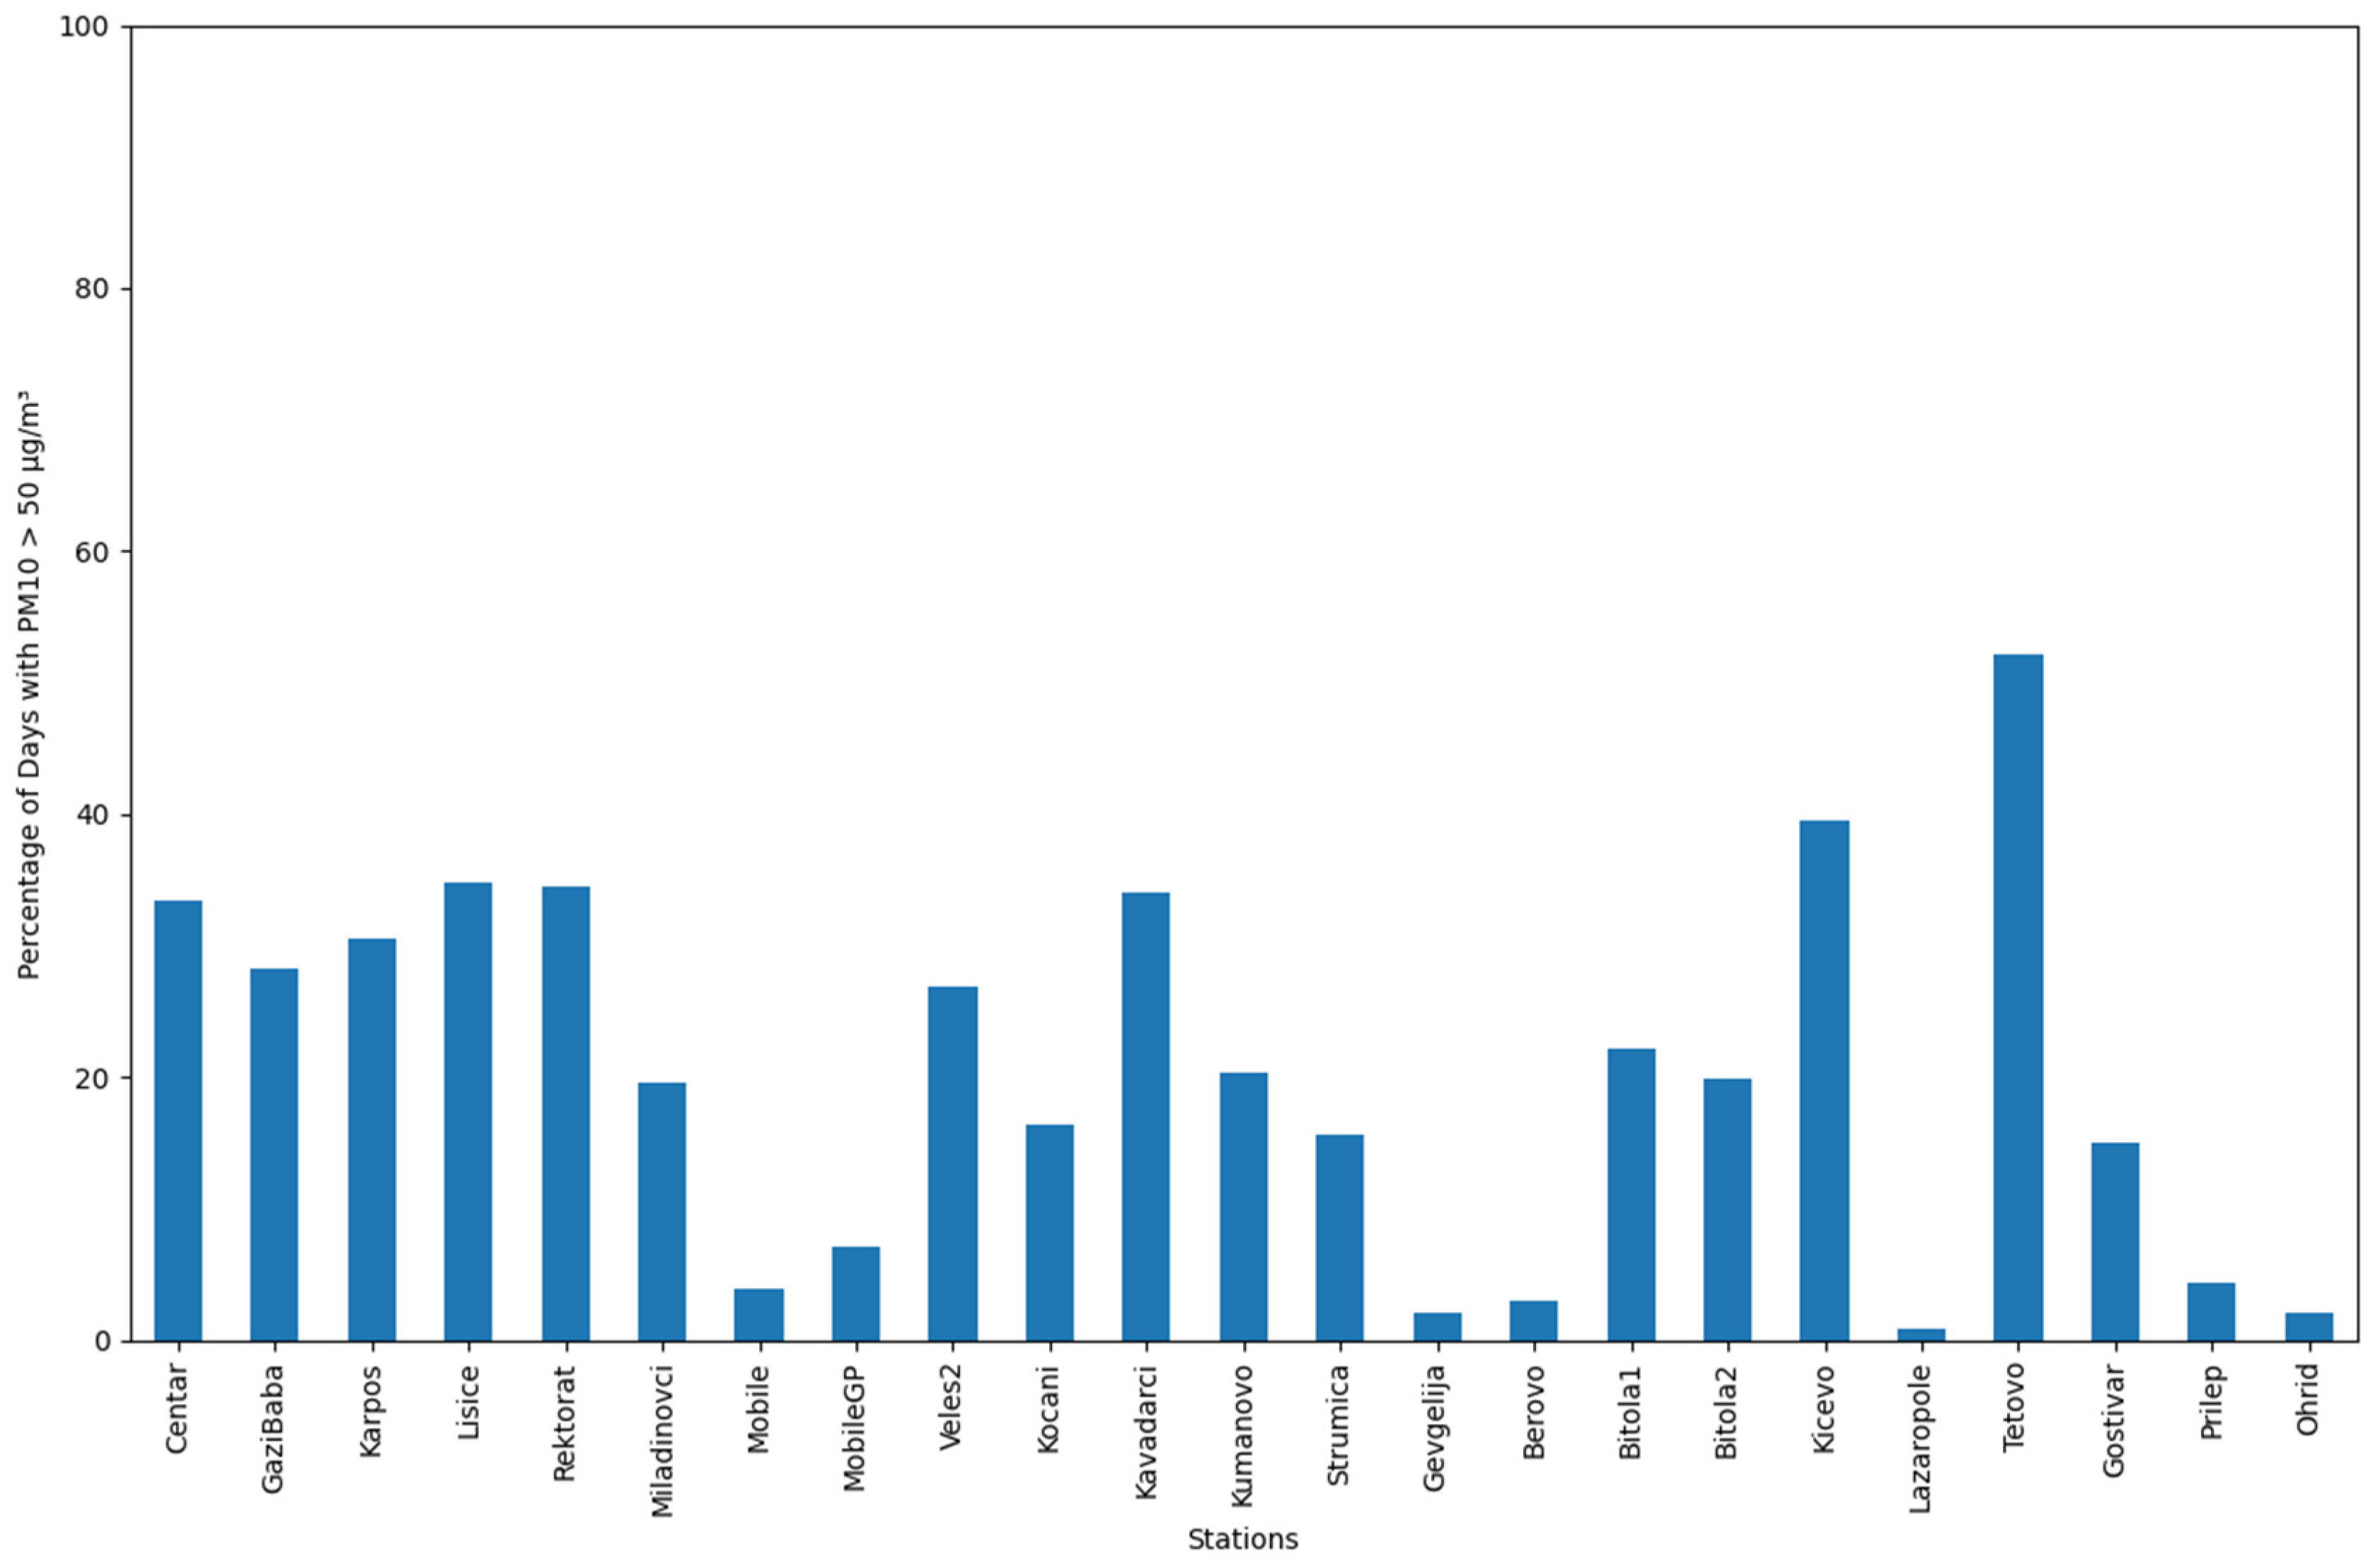
To provide insights into the distribution of polluted days across the monitoring stations, we calculated the percentage of days with PM10 levels exceeding 50 µg/m3 for each station across all 10 years from the gathered data available on the official website of MOEPP. As shown in Figure 2, stations like Tetovo and Kicevo exhibit the highest frequency of high-pollution days, indicating persistently poor air quality.
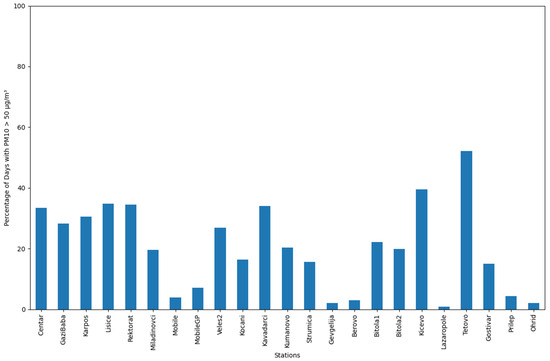
Figure 2.
Percentage of days with PM10 levels exceeding 50 µg/m3 for each monitoring station from 2014 to 2023.
3.2.2. News Data
The extraction of the news media data was performed with a web-crawling tool called Octoparse. Octoparse is a free cloud-based web data extraction solution that helps users extract relevant information from various websites [29]. It is an automated scraping tool that allows the user to visit a page and extract its data based on the HTML tags without using code. It has various visual tools for the user to employ, and these can be personalized to the user’s needs.
We focused on extracting news media teasers with their title, time, and source from the Time.mk website. A media teaser is a brief preview of an article, enticing readers to explore specific news items [30]. The data were scraped according to a list of keywords targeting air pollution: “аерoзагадувањe” (air pollution), “загадувањe” (pollution), “загадeн” (polluted), “пм10” (PM10). After the collection, we transformed the data to the appropriate format, cleansed it of null rows, removed duplicate news (based on the same title), and manually processed it to remove irrelevant news. The teasers were translated into the English language using Google Translate [31] to enable the application of sentiment analysis and topic modeling techniques. To ensure consistency and accuracy in the translation, we relied on Google Translate as it is currently the best tool for translating the Macedonian language. We conducted manual reviews of a subset of the translated news teasers to verify their accuracy and ensure that their context had been retained. This manual review helped us to ensure that the translations maintained the correct meanings. Furthermore, the news teasers went through tokenization, lowercasing, and the removal of punctuation, stop words, and special characters in the next steps of the methodology. Tokenization was performed using the NLTK library 3.8.1 in Python 3.10.12, ensuring each word was treated as an individual token. Punctuation, special characters, and stop words were filtered out using a predefined list from the NLTK library.
3.3. Sentiment Analysis
After the collection and preprocessing of the news data, we performed sentiment analysis of each of the news teasers with a specialized lexicon-based tool called VADER (Valence Aware Dictionary and Sentiment Reasoner). VADER is part of the NLTK (Natural Language Toolkit) library, which is a suite of libraries and programs for symbolic and statistical natural language processing applicable to English written in the Python programming language [32]. Specifically, VADER is used for analyzing sentiments in social media texts. VADER employs a lexicon that assigns predefined sentiment scores to individual words. As a first step, VADER breaks down the text into words to identify its sentiment. Each word in the text is assigned a polarity score, ranging from −1 (indicating extreme negativity) to +1 (representing strong positivity), where 0 indicates neutrality. These scores stem from human judgment. On top of the individual word scores, VADER considers context, punctuation, capitalization, and specific words and phrases called valence words that alter the sentiment of adjacent words. For example, “I had a good day” will have a lower positive score than “I had a very good day”, which will have a lower positive score than “I had a VERY good day”. VADER aggregates all of the individual word scores and normalizes them to a scale between −1 (most negative) and +1 (most positive). This normalization takes into consideration the length of the text, and through this, it ensures that the sentiment score is proportional to the density of sentiment-bearing words in the text. The result from the normalization is called a compound score, which provides a comprehensive assessment of the text’s sentiment. Research by Hutto and Gilbert [32] evaluated VADER in sentiment classification using posts (formerly named tweets) from X, formerly Twitter, where it achieved an F1 score (a metric combining precision and recall) of 0.96.
In Equation (1), x is the sum of the Valence scores of constituent words, and α is a normalization constant with a default value equal to 15.
For severalizing the tweets into positive, negative, and neutral sentiment groups, the default threshold values of −0.05 and +0.05 were used. Each news teaser went through sentiment analysis and was scored for positive, negative, and neutral sentiments, as well as receiving an overall compound score representing the aggregated sentiment.
3.4. Cross-Correlation
To explore the relationship between air pollution dynamics and media discourse, we conducted a time-series statistical analysis using cross-correlation. Cross-correlation measures the similarity between two time series as a function of the displacement of one relative to the other [33]. This is analogous to a sliding dot product that finds how well one signal matches another when it is moved back and forth in time. In signal processing, this method measures similarity without normalization (values not limited between −1 and 1). The result (correlation function) shows how much one signal needs to be shifted to best match the other. For continuous functions, such as with our time-series data, integrals are used involving the product of one function and the complex conjugate of the other shifted by a lag (τ) [34].
Consider that g(k) and p(k), with a k integer, are two sampled time-series sequences. We assume, for simplicity, that −∞ < k < +∞. A standard, unnormalized definition of cross-correlation is written below:
where the integer τ is the relative delay [33]. High positive values at a specific τ indicate a strong match, with the larger value signifying a better alignment. This suggests that a feature in f(t) aligns with a similar feature in the shifted g(t + τ). Conversely, low values indicate a poor match, and negative values, potentially arising when peaks in f(t) coincide with troughs in the shifted g(t + τ) or vice versa, reflect the strength of this mismatch based on the magnitude. In essence, the continuous cross-correlation function provides a quantitative measure of how similar two signals are by calculating the product of one function and the shifted version of the other across all possible lags and integrating the result.
We calculated cross-correlation coefficients between daily PM10 concentrations and the sentiment scores derived from the news articles over corresponding time periods. This analysis helped in identifying potential temporal relationships or lag effects between air pollution trends and media sentiment.
Furthermore, we performed the Mann–Kendall (MK) test on a yearly basis for both time series to explore whether the time series exhibited an increasing or decreasing trend over time. The Mann–Kendall (MK) test is a statistical method used to assess whether a time series exhibits a monotonic trend (increasing or decreasing) over time [35,36]. It uses hypothesis testing, with the null hypothesis (H0) claiming that no monotonic trend exists in the data and the alternative hypothesis (Ha) claiming that a monotonic trend is present in the data. This test initially assumes that the null hypothesis (H0) is true. It needs strong evidence to reject H0 and accept the alternative, i.e., to admit the presence of a trend. It analyzes all possible pairs of data points. For each pair, it calculates the difference and assigns a sign to this difference: +1 if the later observation is larger, 0 if there is no change, or −1 if the later observation is smaller. Then, it sums the signs of all difference calculations:
where sign(xj − xi) equals +1, 0, or −1, as indicated above. The S value (the result) is the number of positive differences minus the number of negative differences, and n is the number of data points. If S is a positive number, observations obtained later in time tend to be larger than observations made earlier. A negative S value suggests a decreasing trend (where the later values are smaller). A significant positive or negative S value indicates a rejection of the null hypothesis (no trend) and supports the presence of a monotonic trend in the data (either increasing or decreasing, respectively).
3.5. Granger Causality Test
This study also employed the Granger causality test to investigate the potential causal relationship between daily average PM10 measurements and daily average negative news over a 3-day period. We chose the maximum lag length to be 3 days based on the nature of the data and the expected time delay in the causal relationship under investigation, while considering the lag time from the correlation analysis as well. We utilized the Granger causality test from a Python library called statsmodels. The Granger causality test is conducted using a Vector Autoregressive (VAR) model framework. Separate VAR models were estimated for each potential causal direction, assessing whether lagged values of PM10 measurements improve the prediction of negative news beyond its own lagged values, and vice versa. VAR models are suitable for capturing the multivariate time-series nature of data, allowing for the simultaneous modeling of the relationships between multiple variables over time. In this context, separate VAR models were estimated to assess the directional causality between PM10 measurements and negative news reporting. A VAR model of order p, denoted as VAR(p), was used to represent each variable in the system as a linear combination of its lagged values and lagged values of other variables in the system. For instance, a VAR model with lag length p = 7 would include up to 7 lagged values of both PM10 measurements and negative news in the model equations. The formulation is given by the following equation:
where Yt is a vector of current values of PM10 measurements and negative news, Ai values are coefficient matrices for lag ί, ut is the error term vector, and p is the lag length [37].
The results are interpreted in this paper based on the statistical significance levels of the F-statistic, the Chi-squared statistic, and the associated p-values from the Granger causality test within the VAR framework. The null hypothesis (H0) states that the lagged values of one time series do not improve the prediction of the other time series beyond its own lagged values, implying that Xi does not Granger-cause Xj. The alternative hypothesis (H1) asserts that the lagged values of one time series do improve the prediction of the other time series, indicating that Xi Granger-causes Xj. Here, we reject the null hypothesis if the test statistic (from an F-test or Chi-squared test) exceeds a critical value, or if the p-value is below a significance level of 0.05, suggesting that the lagged values are jointly significantly different from 0 and providing evidence of Granger causality. A rejection of the null hypothesis signifies a significant causal relationship, providing empirical evidence on the temporal interdependencies between PM10 measurements and negative news reporting [37].
By applying the Granger causality test in this manner, this study aims to contribute to the understanding and provide further proof of the relationship between media narratives and levels of air pollution.
3.6. Topic Modeling
Latent Dirichlet Allocation (LDA), developed by David Blei, Andrew Ng, and Michael Jordan in 2003, is a generative probabilistic model for discovering hidden topics in a collection of documents [38]. LDA assumes that each document is a mixture of a set of topics, and that each topic is a word distribution. The LDA process involves two Dirichlet distributions: one that models the distribution of topics in a document and another that models the distribution of words in a topic. For each document, a topic distribution is drawn from the first Dirichlet distribution, and for each word in the document, a topic is chosen according to this distribution, followed by choosing a word from the corresponding topic’s word distribution. Inference and parameter estimation in LDA are performed using techniques like Variational Bayes and Gibbs Sampling. The probability distribution for each topic z in document d can be computed as follows:
LDA finds applications in topic modeling, text classification, and collaborative filtering, providing interpretable topics from large text corpora. However, it requires pre-specification of the number of topics and is sensitive to hyperparameter settings and dataset size.
In this study, LDA was utilized to analyze the preprocessed news teasers yearly. For each year, five topics were identified, along with the eight most prominent words associated with each topic. To ensure the highest quality and interpretability of the topics, we determined the number of topics and the number of passes individually for each year through qualitative assessments. The text data were preprocessed by removing stop words, tokenizing the data, lemmatizing the data, and filtering non-alphabetic tokens. For each year, we conducted a qualitative evaluation by manually inspecting the generated topics using various combinations of the number of topics (ranging from 3 to 5) and the number of iterations of the corpus (ranging from 10 to 16) to ensure that they were meaningful and contextually relevant. Based on these assessments, we selected the optimal number of topics and passes for each year, ensuring the topics were interpretable. As a result, the number of topics varied between years; for some years, 4 topics provided the best interpretability and connection of words, while for other years, 5 topics were more appropriate. As this number yielded the best results, we used 15 iterations during the training of the model for each year. The extracted topics for each year were compiled into a pandas 2.0.3 DataFrame and saved in a comma-separated values (CSV) file. A DataFrame is a two-dimensional data structure commonly used in data analysis and statistical computing. It is akin to a table in a database or an Excel spreadsheet, where data are organized in rows and columns [39]. Since LDA topic labels are not inherently meaningful, human intervention was required to assign descriptive titles to the thirteen topics identified across all years. Based on this thematic analysis, valuable insight was gained into the recurring themes discussed throughout the study period in media coverage of air pollution.
4. Results
4.1. Sentiment Analysis
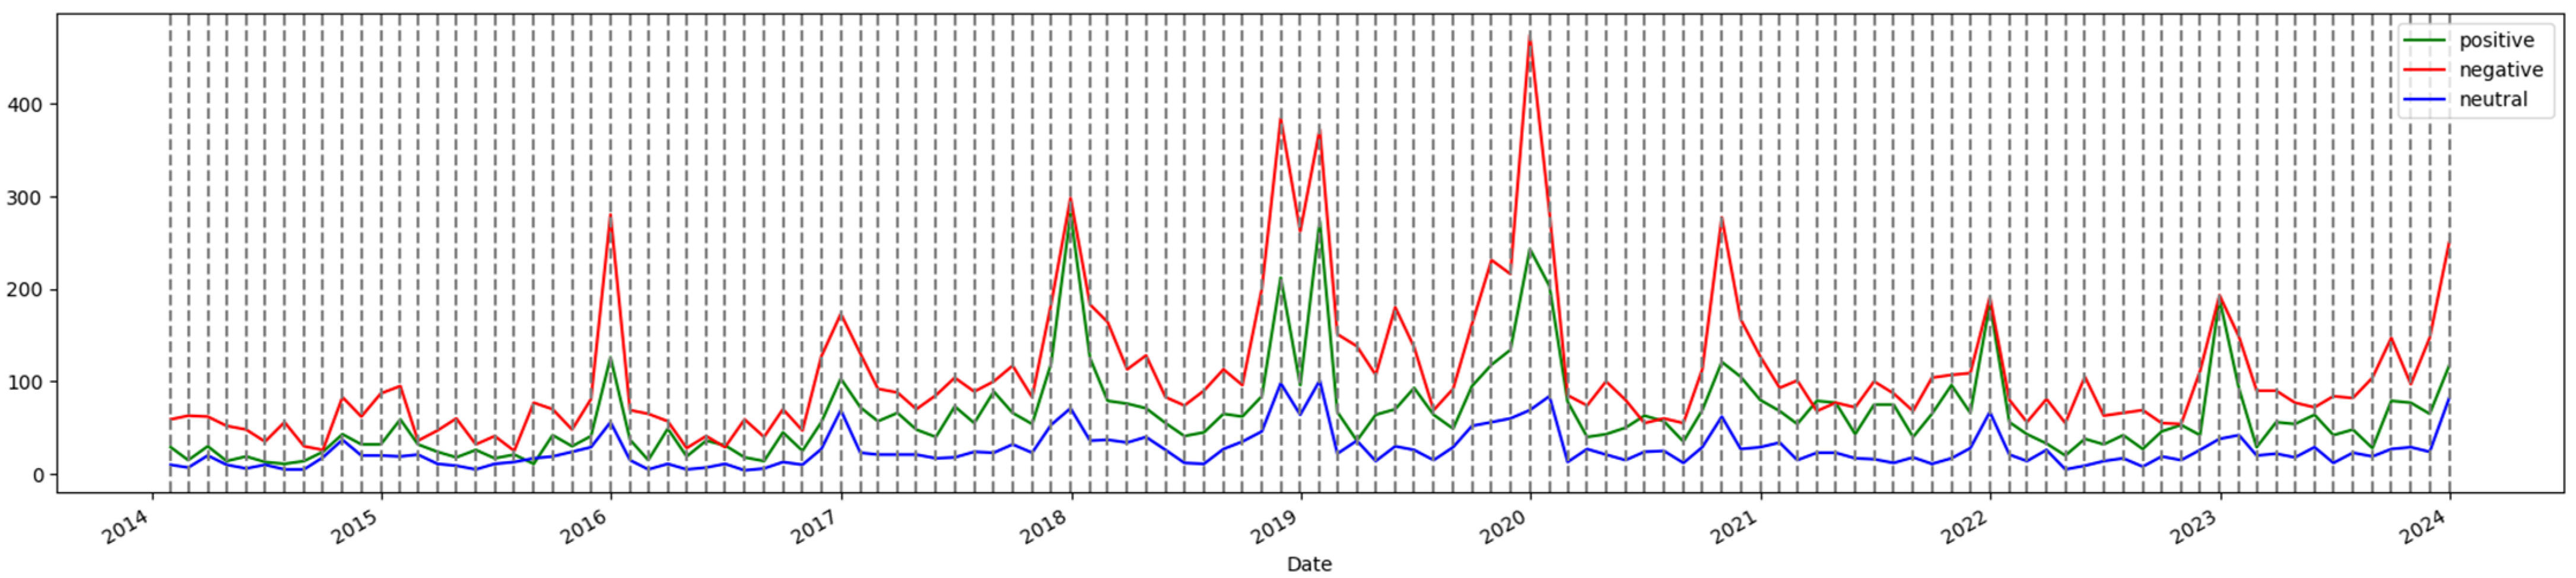
Our analysis revealed distinct seasonal patterns in the news sentiments regarding air pollution. As provided in Figure 3, even though the number of news articles fluctuates each year, the increase in negative sentiments during the winter months is highly noticeable across all ten years. This seasonal trend, spanning from November to February, persisting across all years in the dataset, indicates a consistent pattern of heightened negative sentiments during high-pollution periods. Positive sentiments follow a similar trend but remain lower than negative sentiments. Neutral sentiments are consistently the lowest each month. Significant spikes in negative sentiments are observed around the end of 2015, in late 2017, in late 2019, in early 2020, and again in late 2023.
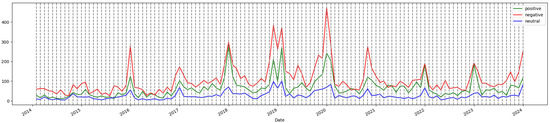
Figure 3.
Monthly trends in the number of positive, negative, and neutral Time.mk teasers from 2014 to 2023.
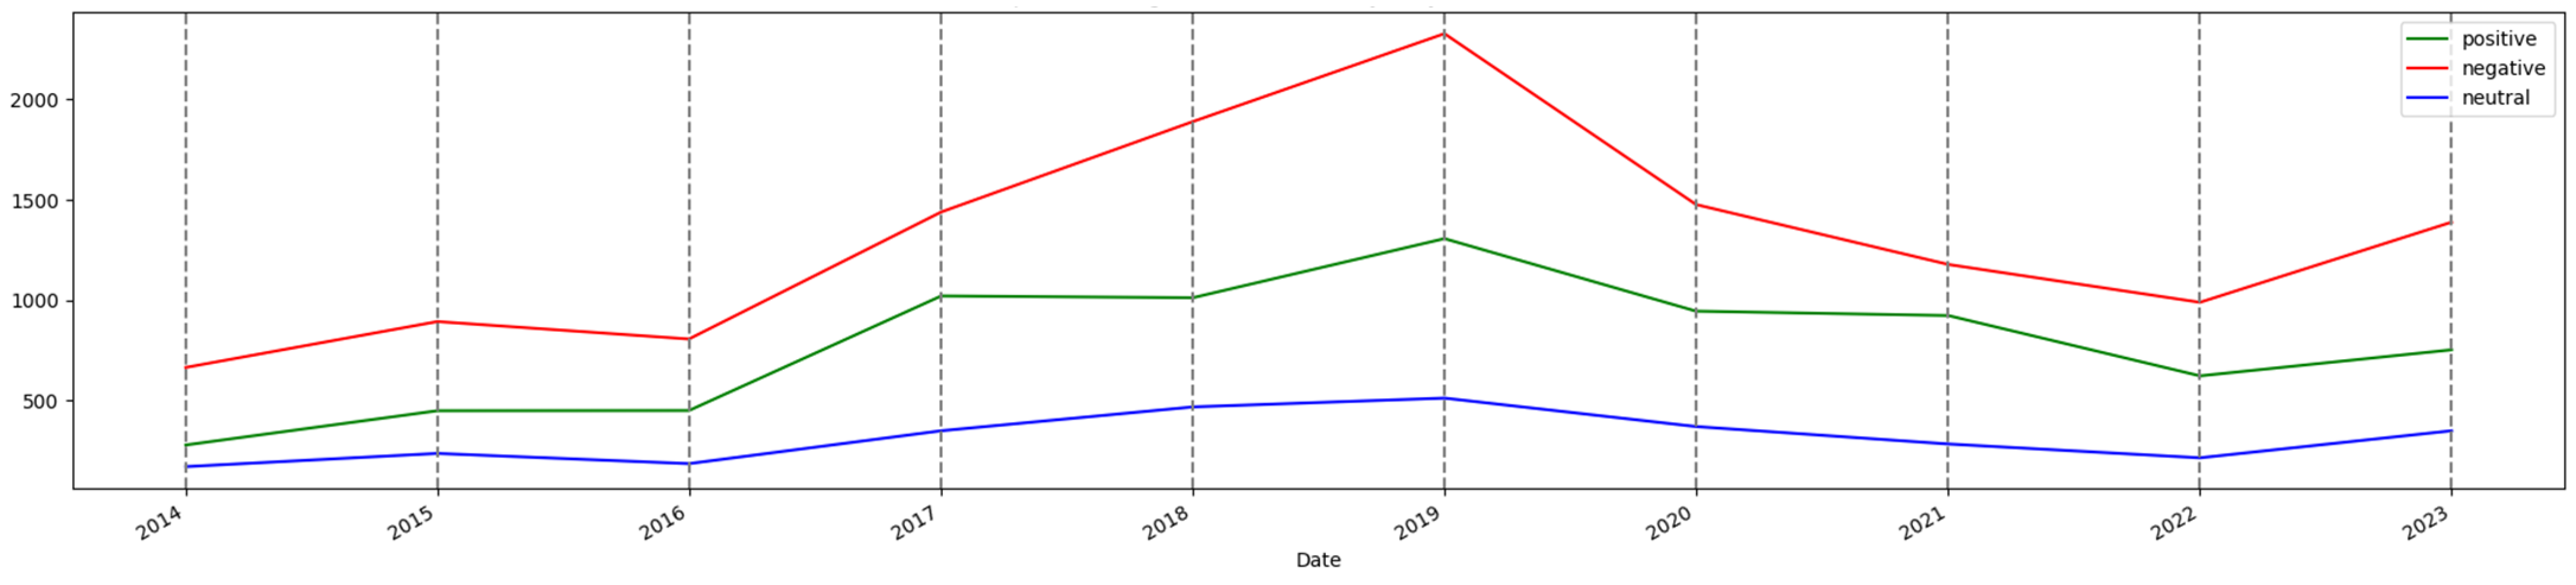
Aside from Figure 3, which shows the number of positive, negative, and neutral news teasers each month, further analysis also provided data on the yearly number of positive, negative, and neutral news teasers (Figure 4). This yearly analysis of the number of positive, negative, and neutral news articles gave us insights into the fluctuations in the number of total news articles throughout the years. In Figure 4, we observe an extreme peak in the number of news articles in 2019. From 2014 until 2016, the number of news articles does not vary significantly, while from 2016 until 2019, there is a notable increase in the number of articles (Figure 3). From 2019 to 2022, there is a steady decline, while after 2022, there seems to be a gradual increase.
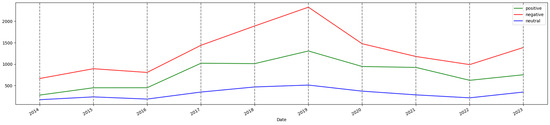
Figure 4.
Yearly trends in the number of positive, negative, and neutral Time.mk teasers from 2014 to 2023.
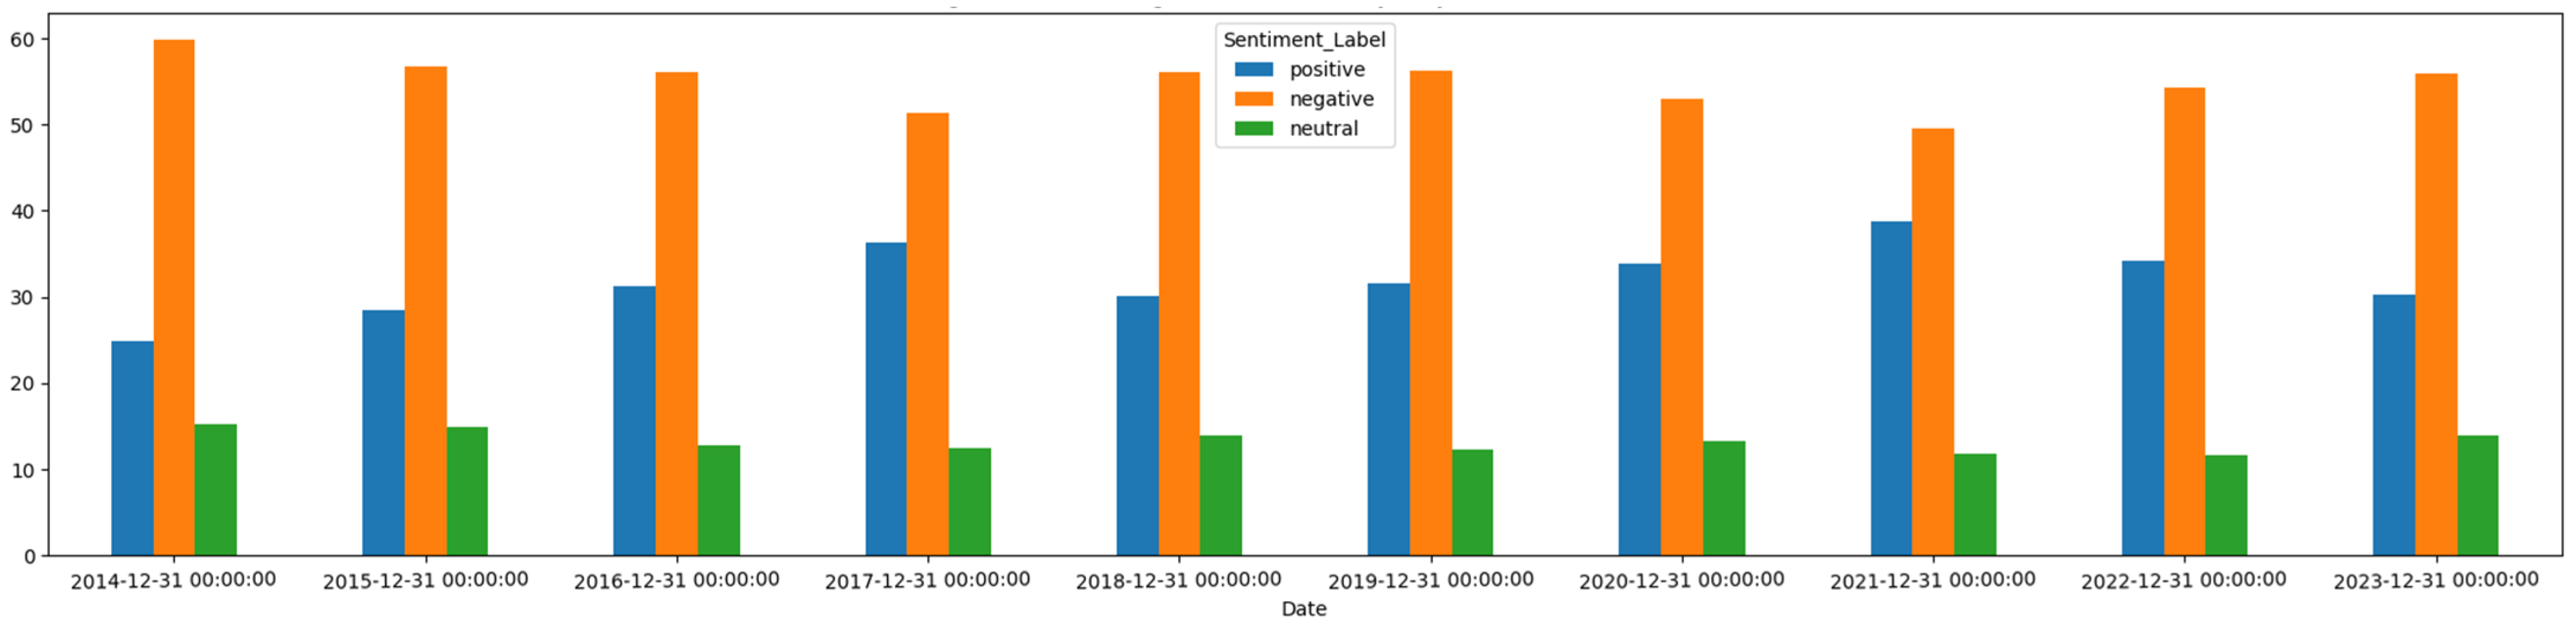
In order to understand the extent of the involvement of each type of sentiment, we analyzed the yearly percentage of positive, negative, and neutral news articles (Figure 5). In 2014, negative sentiments accounted for around 60% of the total, but this had gradually decreased to just above 50% by 2017 (Figure 5), with another gradual increase until 2019 to about 60%, before decreasing in 2021 and following an upward trend until 2023. Positive sentiments increased from about 30% in 2015 to around 40% in 2024. Neutral sentiments remained between 10% and 15% throughout the period. The most significant drop in negative sentiments occurred around 2017 and 2018, while positive sentiments increased during the same period. In recent years (2021–2024), there has been a notable increase in both positive and negative sentiments, with neutral sentiments remaining largely unchanged.

Figure 5.
Yearly trends in the percentage of positive, negative, and neutral Time.mk teasers from 2014 to 2023.
4.2. Cross-Correlation
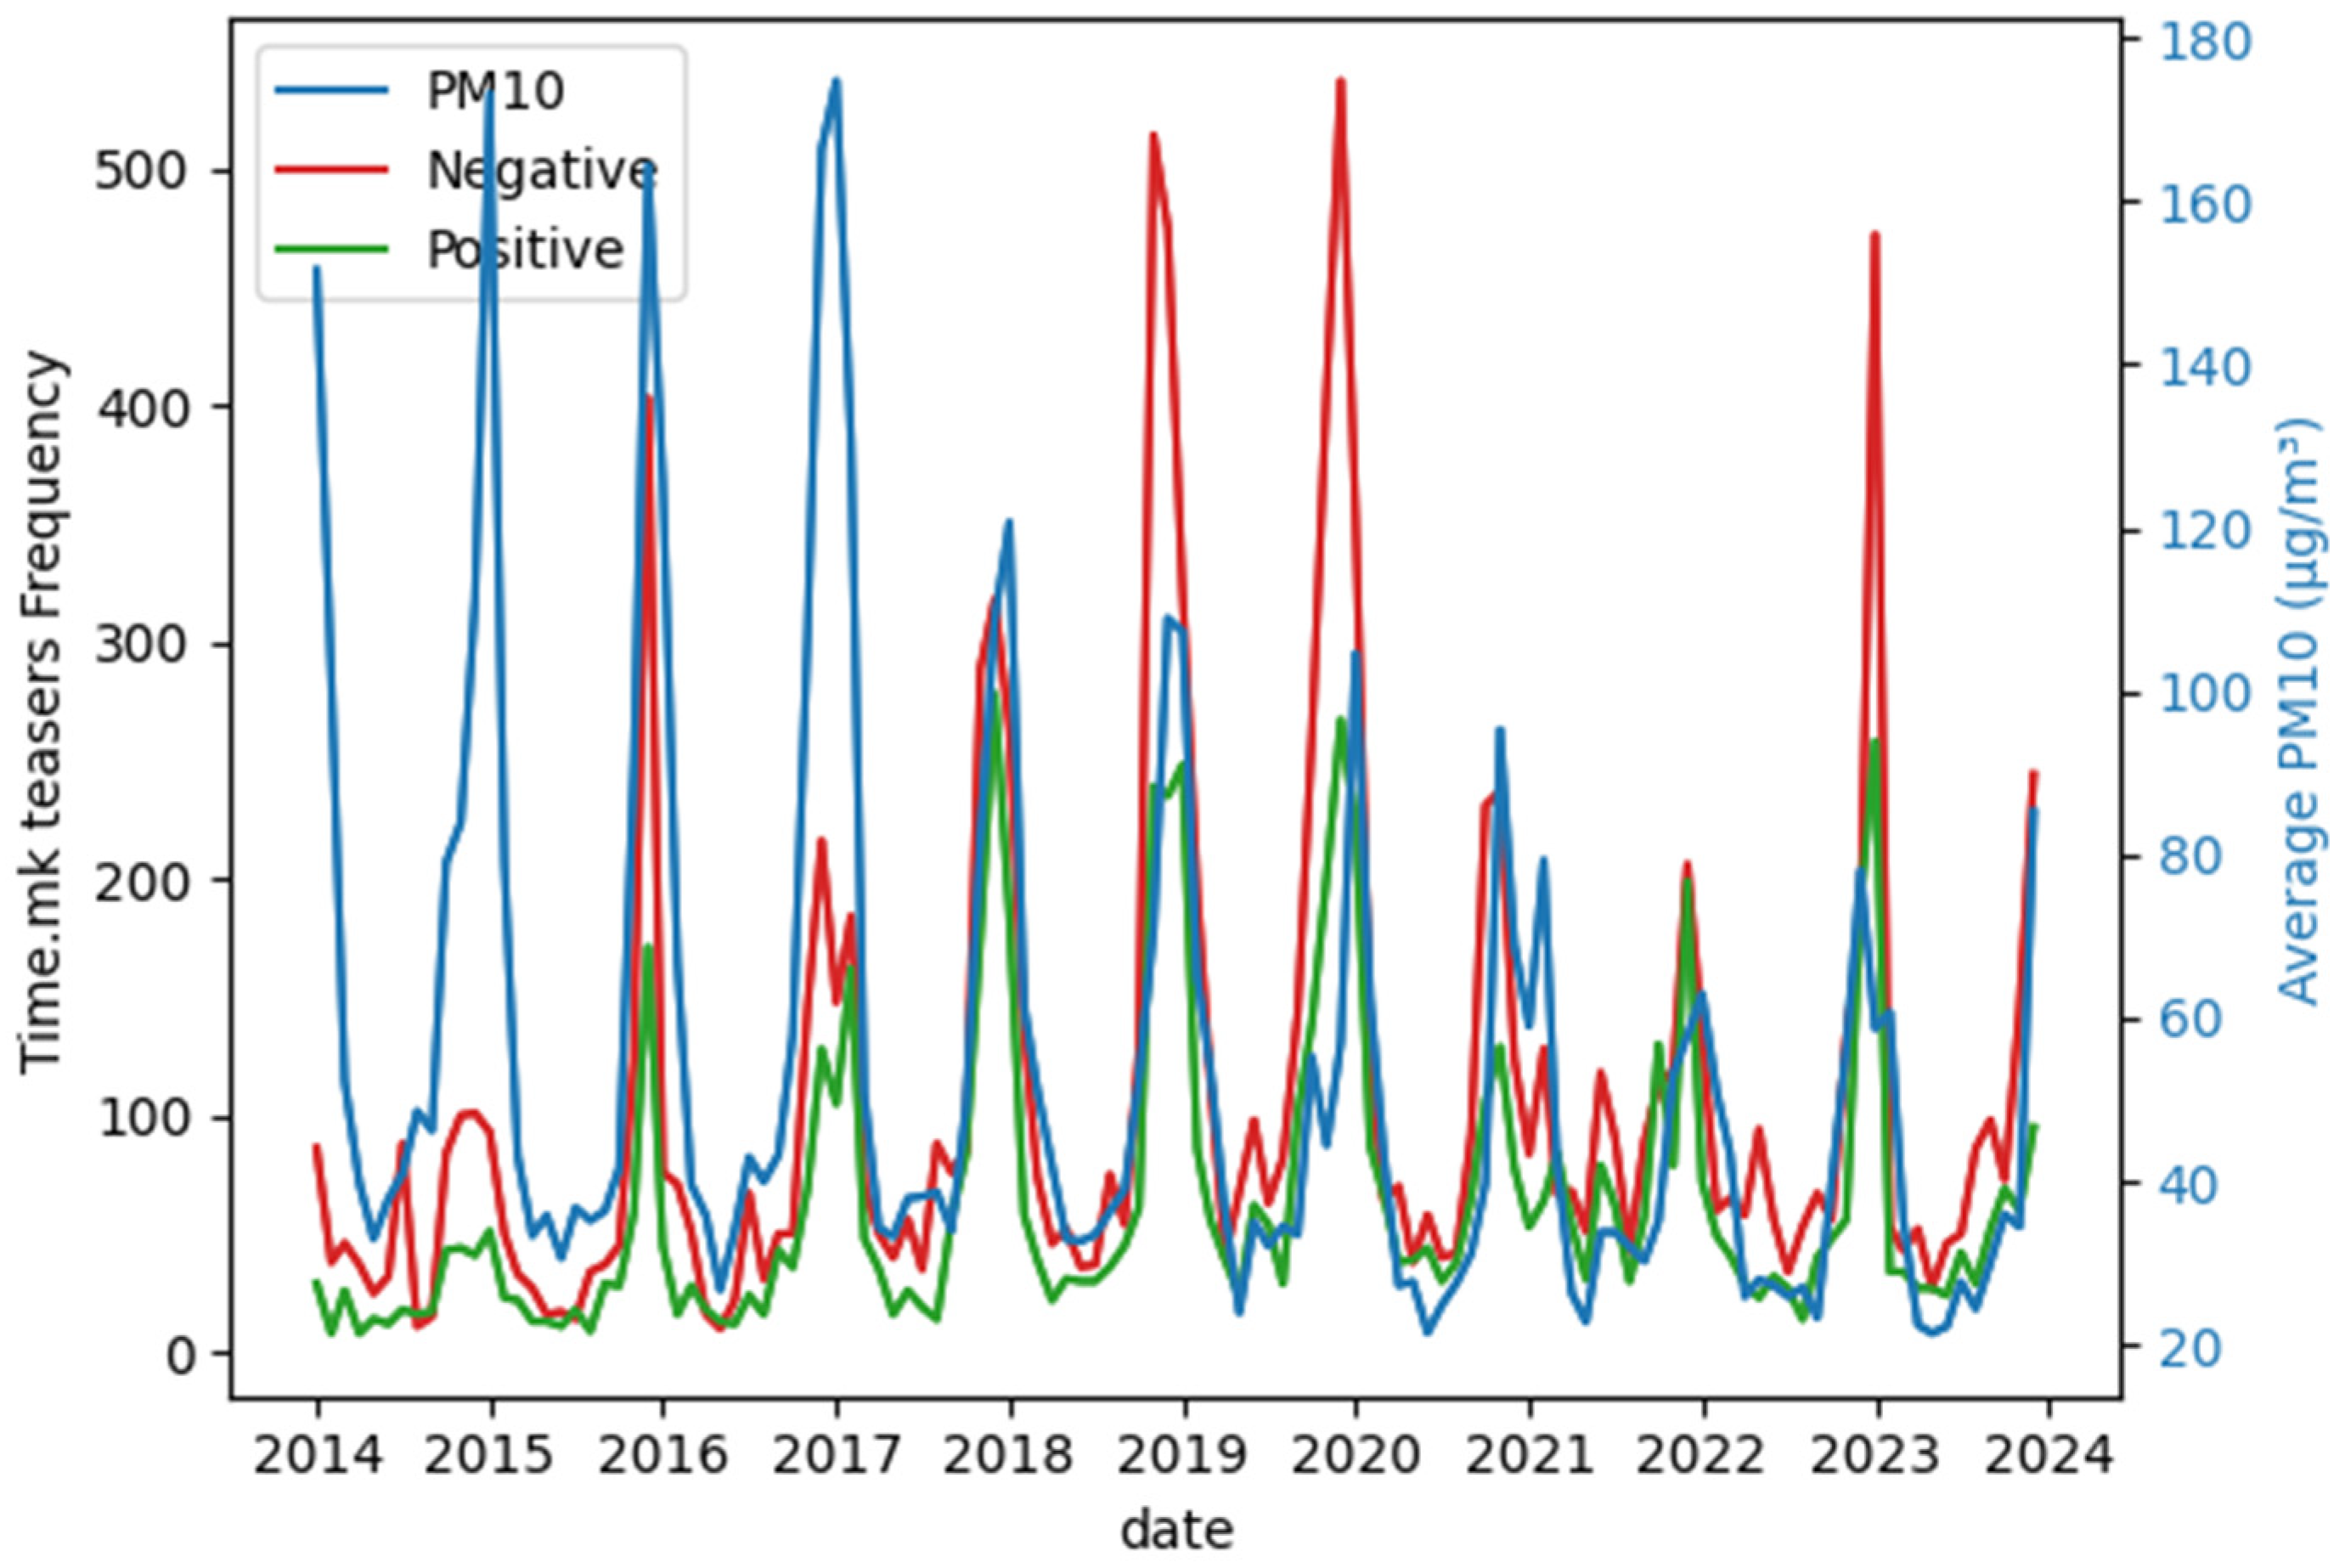
A cross-correlation analysis was conducted to investigate the potential relationship between daily air pollution levels and the number of news teasers exhibiting negative sentiments. After this cross-correlation analysis, we were able to quantify the relationship between these two variables. The analysis was conducted between the daily average PM10 measures and the daily average number of negative news media teasers. This analysis revealed a moderate positive correlation (coefficient = 0.23) between these time series, with a one-day lag between the air pollution levels and the media sentiment scores. In simpler terms, as air pollution levels increased, the media sentiment tended to become more negative with a one-day delay. A similar conclusion can be reached by examining the data on a monthly basis, where we observe a visual alignment between months with higher PM10 concentrations and increased media coverage with negative sentiment (Figure 6). There is a clear seasonal pattern in both PM10 levels and the frequency of negative Time.mk teasers. PM10 levels peak during the winter months each year. The peaks in negative teasers often coincide with or slightly lag behind the peaks in PM10 levels, suggesting a relationship where higher levels of pollution lead to a higher prevalence of negative sentiments in news teasers.
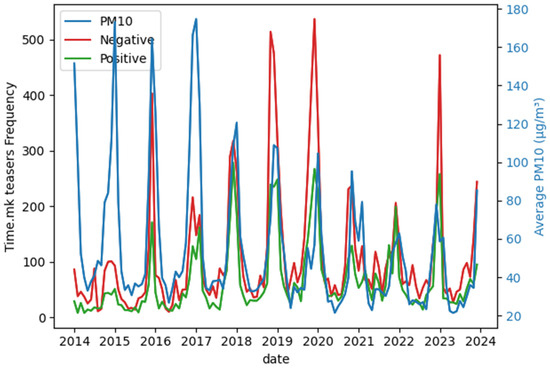
Figure 6.
Cross-correlation evaluation of monthly PM10 levels and monthly frequency of different Time.mk teasers from 2014 to 2023.
The frequency of the monthly average number of teasers with positive sentiments shows a less pronounced seasonal pattern compared to the negative teasers and PM10 levels. The frequency of positive news teasers tends to remain relatively low and stable with slight fluctuations, indicating that positive sentiments in the news are less sensitive to changes in air pollution levels. A lag can also be noted on the graph, where there appears to be a slight delay in the increase in the frequency of negative news articles after a rise in PM10 levels.
In addition to the monthly cross-correlation analysis (Figure 6), we investigated the yearly trends in the average number of PM10 concentrations and Time.mk teasers (Figure 7). The yearly analysis of both the average levels of PM10 particles and the average number of news articles elucidated fluctuating trends during longer time periods. In Figure 6, the yearly PM10 levels show a decreasing trend from 2014 to 2021, indicating an overall improvement in air quality over this period. There is a slight increase in 2022 and 2023. The frequency of negative news teasers also shows a slight decline from 2014 to 2021, which suggests that while overall pollution levels show improvement over the years, specific periods still posed challenges, prompting continued media attention to this issue. The frequency of positive news teasers shows an increasing trend from 2014 to 2019, peaks around 2021, and then starts to decline.
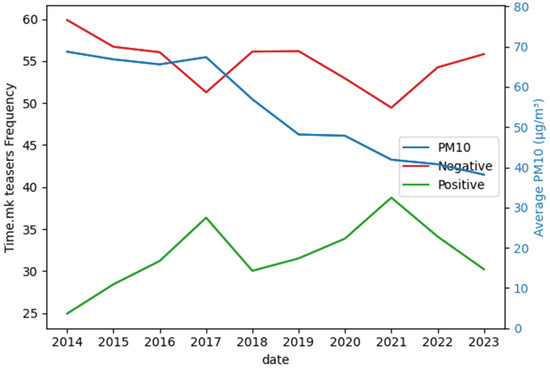
Figure 7.
Trends in yearly average PM10 levels and yearly frequency of different Time.mk teasers from 2014 to 2023.
From this graph (Figure 7), we can also discover that the peaks in PM10 levels tend to be lower each year, pointing to a decreasing trend over the years. This claim is supported by the results of the Mann–Kendall test utilized for the yearly average particles over the 10-year period, with a p-value of 0.0001 and an S value of −43.0, revealing a decreasing trend. Alternatively, the yearly average number of news teasers with negative sentiments falls under no particular trend, with a p-value of 0.28 and an S value of 13.0. It is evident from these results that negative news articles do not follow the same trend as PM10 concentrations over longer periods, as can also be seen in the graph, which shows peaks in negative news articles during years of decreased air pollution.
4.3. Granger Causality Test
The Granger causality test was conducted to examine the temporal relationships between daily average PM10 measurements and daily average negative news over a 10-year period, utilizing a maximum lag of 3 days. These test results indicate significant findings supporting directional causality between the variables (Table 1). Specifically, lagged values of PM10 measurements were found to Granger-cause changes in negative news reporting (p < 0.05), suggesting that variations in air quality impact the subsequent media coverage of negative news.

Table 1.
Results from statistical tests for each value of the lag length in the Granger causality test.
The Granger causality test results consistently demonstrate that daily average PM10 measurements Granger-cause changes in daily average negative news reporting across different lag lengths (1 day, 2 days, and 3 days). The statistical tests (SSR-based F-test, SSR-based Chi-square test, likelihood ratio test, and parameter F-test) consistently yielded highly significant results (p = 0.00), indicating robust evidence of causal influence. These values confirm a significant causal relationship between PM10 measurements and subsequent negative news reporting.
4.4. Obtained Topics
In order to understand how the Macedonian air pollution crisis has been covered in the media over the past ten years, we analyzed the collection of news teasers through Latent Dirichlet Allocation (LDA). This approach helped us to identify the key themes and topics that have dominated the conversation during the researched time period. The thirteen topics we extracted are displayed in Table 2, where the rows represent the years from 2014 to 2023 and the columns represent the five identified topics from the LDA model, with varying prominence each year.
Table 2.
Topics from the LDA topic modeling of news teasers for each year from 2014 to 2023.
The frequency of each topic provides a window into the evolving dynamics of news coverage over time. An increase in a specific topic’s frequency suggests an intensified media focus within a particular year. This heightened attention could be driven by relevant events or a rise in public concern surrounding that specific aspect of air pollution. To facilitate a more granular understanding, we will present a dedicated discussion for each identified topic. These discussions will highlight the most prominent keywords associated with each theme, offering insights into the specific sub-topics covered by the news media:
- Factories and Public Concern: With keywords such as environmental, factory, state, and protest, this topic appears consistently from 2014 to 2016, highlighting ongoing industry-related issues and their impact on public concern. It appears again in 2020 exclusively, while its absence from 2021 onwards suggests a potential resolution or shift in focus.
- Environmental Issues in Tetovo and Skopje: This topic is prominent in 2014, 2015, 2016, 2019, and 2022, indicating persistent environmental challenges in these cities, stemming from the following words: Skopje, Tetovo, particle, environment, measure, and high.
- Skopje and Air Quality: Mentioned frequently (2014, 2016, 2017, 2018, 2021, 2022, 2023), this topic underscores a recurrent concern about the air quality in Skopje, with the following recurring keywords: Skopje, measure, reduce, environmental, and vehicle.
- Public Protest in Bitola: This topic appeared only in 2014, with the keywords Bitola, protest, today, problem, car, and march, suggesting specific events or a series of events related to public protests in Bitola during that year.
- Government and Policies: Featuring prominently from 2015 onwards, this topic reflects ongoing governmental efforts and policies addressing environmental issues. The main keywords associated with this topic are as follows: government, authority, health, public, measure, and environmental, as well as the names of certain political figures and organizations at the time.
- Air Quality in Bitola and Skopje: Present in 2016, 2018, 2019, and 2022, this topic indicates concerns about air quality in these cities, with keywords such as Skopje, Bitola, measure, public, and high.
- Public Health: Emerging in 2017 and 2019, this topic suggests an increasing awareness of public health issues linked to environmental conditions, represented by the following keywords: world, health, people, year, and child.
- Level of PM10 Particles: Mentioned in 2017 and 2020, this topic points to concerns regarding particulate matter and its impact on air quality. The keywords that appear are particle, measuring, station, pm, high, and day.
- Coronavirus: Only appearing in 2020, this topic reflects the global focus on the COVID-19 pandemic and its environmental implications, with the following keywords: world, people, coronavirus, health, year, and death.
- Heating: Appearing in 2022 and 2023, this topic suggests newer concerns related to heating and its environmental impact. The associated keywords are environment, heating, gas, oil, fuel, and use.
- Landfills and Waste: Mentioned in 2023, this topic indicates emerging concerns about waste management and landfill issues, with the keywords being landfill, waste, health, environmental, and state.
- Water Pollution: This topic appears as a notable issue in 2017 and 2021, reflecting ongoing concerns about water quality. This topic’s keywords are water, contaminated, quality, landfill, and lake.
- Air Quality in Kumanovo: This topic emerges as a specific concern in 2019, pointing to regional air quality issues, with keywords such as particle, environment, Kumanovo, concentration, and high.
5. Discussion
This study investigated the sentiment of news coverage and its potential association with air pollution levels over a ten-year period, as well as critical topics related to air pollution reported by the news. Our findings highlight distinct seasonal patterns and potential relationships between air quality and public sentiment as reflected in media coverage.
As we have mentioned, one of the main interesting and expected points was the peaks in negative sentiments in news coverage consistently during the winter months (November to February) over the ten-year period, aligning with higher air pollution levels (PM10). The Macedonian government offered similar findings in 2017, where they researched air pollution and found that the highest levels of air pollution occur during the heating seasons in Macedonia [40]. According to this governmental study and the Statistical Department of Macedonia, around 60% of the population uses wood, pellets, coal, or oil as a source for indoor heating [41]. This seasonal trend aligns with previous research by Szép et al. [42] and Zsolt Bodor et al. [43], who attributed the increased air pollution to a combination of factors such as increased heating and atmospheric stability. Furthermore, specific studies in Macedonia have also linked elevated air pollution levels during the winter months to the increased use of heating [23,24,25]. These factors, working together, explain the observed seasonal pattern of elevated PM10 levels during winter.
The number of neutral articles has remained the same throughout the years, which may be a result of the media trying to deliver more engaging articles by using words that exude a stronger sentiment. The number of positive articles increased by 10%, which may be a result of the air pollution decreasing or the media focusing on the new government policies, as per our topic modeling. The Macedonian government has delivered new solutions to air pollution during this 10-year period. The government made attempts to lower air pollution in their 2017 plan [40] and by giving subsidies for bikes from 2014, as well as encouraging the use of indoor air conditioners and pellet stoves for heating—the drop in negative sentiments we observed around 2017 and 2018 and the simultaneous increase in positive sentiments could be attributed to these new regulations. The plan corroborates our findings, as both clearly report an air pollution problem during the winter months and an increase in the PM10 measurements. In our results, we noticed an increase in the positive sentiment in 2017 as well, indicating that the news media most probably responded with a positive acknowledgement of the government engagement.
The peak in the year 2017 can also be linked to the new regulations and policies presented by the government in that year in their new government plan. We note that the “Government and Policies” topic is present in that year and remains persistent in the following years. These policy changes could potentially explain the increase in the yearly number of news articles from 2017 to 2020, when the news media was focusing on the ongoing efforts being made by authorities to address environmental challenges. This alignment with policy changes suggests that governmental actions are a key driver of public and media attention towards environmental matters. The emergence of “Public Health” as a topic in 2017 and 2019 highlights the growing awareness of the link between environmental conditions and health outcomes. This is reinforced by keywords such as “world”, “health”, “people”, and “child”, indicating that the health impacts of air pollution are becoming more prominent in public discourse.
The highest peak in negative news articles is noted between late 2019 and early 2020. This could be linked to the protests in Bitola and Skopje that were ongoing in late December 2019 [44,45], supported by the topic “Air Quality in Bitola and Skopje” appearing in 2019. Concerns about air quality in Bitola and Skopje, indicated by this topic’s recurring mentions in 2016, 2018, 2019, and 2022, emphasize the need for effective pollution control measures in these cities. The frequent mention of the “Skopje and Air Quality” topic across numerous years underscores a consistent concern about pollution levels in the capital city. This conclusion aligns with efforts to address pollution sources, particularly vehicular emissions, as indicated by keywords like “measure”, “reduce”, and “vehicle”. The topic “Public Protest in Bitola” in 2014 highlights specific events that drew significant media attention at that time, reflecting heightened local activism over environmental issues.
The recurring theme of “Factories and Public Concern” from 2014 to 2016, with a resurgence in 2020, highlights persistent public unrest regarding the environmental impact of industries. The peak in negative articles in 2015 can be related to heightened public awareness during this time about the impact of factories and the lack of government regulations. This topic’s absence from 2021 onwards suggests a potential resolution or a shift in media focus. Similarly, “Environmental Issues in Tetovo and Skopje”, appearing consistently in multiple years, underscores ongoing challenges in these cities. Keywords such as “Skopje”, “Tetovo”, “particle”, and “environment” indicate that air pollution remains a critical issue, necessitating continued attention and action. This can be expected, as Tetovo and Skopje are two of the thirty most polluted cities in Europe [6].
The exclusive appearance of the “Coronavirus” topic in 2020 reflects the global focus on the COVID-19 pandemic and its environmental implications. This intersection of public health crises and environmental issues shows how pandemics can shift media and public attention.
New concerns about heating and its environmental impact, emerging in 2022 and 2023, suggest a growing recognition of the need for sustainable heating solutions. The mention of “Landfills and Waste” in 2023 highlights emerging issues in waste management, reflecting a shift towards the environmental and health-associated impacts of waste disposal practices.
“Water Pollution”, a topic appearing notably in 2017 and 2021, indicates ongoing concerns about water quality, suggesting that this remains a significant environmental challenge. The specific focus on “Air quality in Kumanovo” in 2019 points to regional air pollution issues, emphasizing the need for broader geographical attention and action.
However, analyzing the thirteen topics across all years, we observed a lack of discussion on mitigation strategies. The media mainly focuses on the reporting of government policies and air quality, without suggesting measures for prevention or preservation. This finding aligns with previous research conducted in the USA, in which Ramondt and Ramírez [20] state that less than 10% of the news articles focused on precautionary measures and that the media does not effectively contribute to increasing environmental health literacy. This lack of focus on solutions in media coverage is concerning, especially considering that our cross-analysis provided hard evidence of a relationship between the sentiments in media coverage and PM10 levels.
The strong correlation between PM10 levels and the frequency of negative news teasers on a daily basis, with a one-day lag, imply that high pollution levels correlate with increased negative coverage, reflecting public concern and media focus on environmental issues. In their studies, Ye Binbin et al. [46] and Samuel Agyei-Mensah et al. [47] both provided an analysis of media data and air pollution, and both found that correlations between air pollution and media articles were also stronger when the air quality was lower, and this generally led to a more negative media slant.
However, this study advances beyond correlation by employing the Granger causality test to demonstrate that PM10 levels cause an increase in negative news reporting with a one-day lag. The results of this test unequivocally support the correlation we calculated and further strengthen our hypothesis of there being a causal relationship between media coverage and air pollution. In essence, PM10 measurements Granger-cause changes in negative news reporting, with a strong causal effect being observed with a one-day lag across all examined periods. This emphasizes the dynamic relationship between environmental data and media narratives. Environmental data, particularly air quality measurements like PM10 levels, directly influence the framing of news stories. In turn, these narratives can mobilize public concern and pressure policymakers to enact stricter environmental regulations. This emphasizes the importance of timely and accurate environmental data in shaping not only public discourse but also subsequent policy interventions aimed at improving air quality.
One unexpected finding emerged from our analysis. Namely, an increase was observed in negative news teasers about air pollution despite potentially decreasing PM10 readings. This intriguing phenomenon suggests a disconnect between objective air quality data and public perception as reflected in media coverage. Several possible explanations for this exist. Increased media scrutiny and heightened public awareness could lead to a perception of worsening air quality despite objective improvement. Alternatively, negative media attention could target a lack of progress in implementing effective air pollution policies. Sensationalized reporting or the influence of social media trends on news framing could also be contributing factors.
6. Conclusions
This study provides a comprehensive analysis of the sentiment of news coverage and its association with air pollution levels over a ten-year period in Macedonia, employing sentiment analysis and topic modeling to uncover significant insights. A consistent seasonal pattern emerged: negative news coverage peaked during winter months when the levels of PM10, a critical air pollution indicator, were highest. This finding aligns with the increased use of heating fuels during winter and is further supported by existing research. Despite a stable number of neutral articles, a rise in positive-sentiment articles suggests a potential decrease in pollution levels or the effectiveness of new government policies.
The overall number of news articles peaked in 2019, coinciding with public protests regarding air quality. Similarly, the peak in 2017 aligns with the introduction of new environmental policies, highlighting a persistent public and media focus on governmental actions.
Topic modeling revealed the evolving nature of public discourse. Recurring topics concerning air quality in specific cities, factories, and governmental policies underscore longstanding environmental concerns. Emerging topics like the COVID-19 pandemic’s impact, heating practices, and waste management reflect an evolving understanding of environmental issues and a shifting media focus. In contrast, while the media successfully follows fluctuations in events around air pollution and related issues, we observed that the media’s role appears to be limited to reporting the issue, with the absence of discussions for exploring potential mitigating strategies.
An unexpected finding was the increasing trend in negative news teasers despite potentially decreasing PM10 levels. This warrants further investigation but could be attributed to factors such as a heightened public awareness of the related long-term health impacts or broader socio-political considerations influencing media narratives.
Our cross-analysis confirmed a strong correlation between high PM10 levels and negative news coverage, emphasizing the media’s crucial role in highlighting environmental challenges. We want to note that this suggests that the news media primarily follows and reports changes in air pollution across short time periods, as indicated by the lack of correlation and difference in the monotonic trends during the yearly analysis. The media coverage did not reflect the overall fluctuations across longer time periods. Alternatively, while focusing on the short-term causality, one of the significant contributions of this study is the application of the Granger causality test to establish a causal relationship between PM10 levels and negative news reporting. Our results indicate that changes in PM10 levels Granger-cause variations in negative news sentiment with a one-day lag. This finding supports the correlation observed in the cross-analysis and strengthens our hypothesis stating that air pollution directly influences media narratives.
6.1. Academic Implications
Our study contributes to the literature by providing a comprehensive analysis of air pollution-related media coverage, using a large dataset of news articles published in a period of a decade, from 2014 to 2023, complementing the existing research focusing primarily on social media data. This approach allowed for a more structured and reliable analysis of public sentiment and media focus, enabling us to understand the media’s influence on public awareness of the subject of air pollution. The methodology used here, including sentiment analysis and topic modeling, offers robust tools for examining the intersection of environmental issues and media representation. By employing topic modeling, we identified key themes and their prevalence over the investigated period of 10 years. Moreover, our cross-correlation analysis, exploring the alignment of the different sentiments identified in news media with the actual air pollution evaluated through PM10 measurements, adds value to the existing body of knowledge by providing evidence-based implications related to different data sources.
Our results align with the study by He, Zhang, and Chen [19], which emphasizes the importance of investigating news content beyond sentiment analysis. They coincide with several studies, specifically about the heightened levels of air pollution during winter months [18,22,23,24]. Additionally, our results underline the broader impact of media coverage in promoting conservation efforts and proactive measures, as highlighted by Ramondt and Ramírez [20]. However, our study differs from these research studies by analyzing a significantly long time period.
This study contributes to the field by providing empirical evidence linking media sentiment with actual PM10 levels. The findings suggest that negative sentiments in news teasers correlate with higher PM10 levels, indicating that media sentiment can indeed reflect the actual air quality situation, while simultaneously being a valuable asset that might shape public awareness on the subject. Moreover, this research underscores the importance of considering the news media sentiment in environmental policy-making and public health interventions, aligning with the World Bank’s emphasis on the need for comprehensive approaches to air quality management in Macedonia [48].
By supporting the findings of previous studies with data on sentiments in news media, this research strengthens the argument for addressing environmental health concerns through integrated strategies. It also improves upon previous conclusions by highlighting the critical role of the media in influencing public opinion and behavior towards environmental issues. Specifically, this study’s findings challenge the notion that the media accurately reflects the severity of air pollution, suggesting that media outlets may sometimes underestimate or overestimate the extent of the problem.
6.2. Managerial Implications
For policymakers and environmental managers, our findings highlight the importance of managing air pollution, particularly during the winter months. The recurring themes identified through topic modeling can inform targeted communication strategies and policy interventions. By understanding the specific concerns and topics that dominate media coverage, authorities can better address public concerns, enhance environmental regulations, and improve public health outcomes. Understanding the cyclical nature of media attention, as observed in the study by He, Zhang, and Chen (2020) [19], can help stakeholders consistently focus on environmental issues, ensuring long-term public awareness and action. Additionally, insights into seasonal patterns and the impact of heating practices on air pollution can guide efforts to promote cleaner, more sustainable heating solutions. Furthermore, fostering collaboration between media outlets and environmental agencies could help to ensure the exact reporting of air quality data that can offer more precise tracking of the air quality, which will serve as a basis for improving the related laws and regulations.
For media outlets, this study suggests a need to move beyond solely reporting peak pollution levels and instead delve deeper into solutions. The unexpected rise in the yearly negative news coverage despite potentially decreasing PM10 levels highlights a potential disconnect between air quality data and related interpretations as portrayed by the media. Exploring topics like clean energy initiatives, public education campaigns, and the effectiveness of government policies could improve the correct reporting about polluters, challenges, and solutions, and will empower the media to influence the public to engage in mitigating air pollution.
The persistent air pollution over the studied ten-year period underlines the need for continuous media attention, and not just during winter months when concerns are heightened. By adopting a solutions-oriented approach and fostering collaboration with policymakers and environmental experts, media outlets can be crucial in promoting long-term strategies for managing and preventing air pollution.
6.3. Limitations and Future Research Lines
This research presents several limitations that open new avenues for exploration of the subject of air quality challenges. Firstly, the data were collected only for the case of Macedonia, restricting the possibility of broadening the conclusions to a wider region. Future research can explore air quality concerns in other Western Balkan countries and involve into a more profound observation of air quality challenges and the public discourse in specific regions, comparing the trends and identifying possible similarities among them.
Secondly, this study primarily focuses on news media coverage, but social media platforms have become a powerful force in shaping public discourse on environmental issues. Thus, future research could incorporate data from social media, surveys, public opinion polls, or interviews with policymakers to understand how various sources might influence or be influenced by media coverage and gain a broader understanding of the public and institutional perception of air quality issues.
Thirdly, the unexpected increase in negative news teasers despite potentially decreasing PM10 levels warrants further investigation, which could involve in-depth analyses of these news articles to understand the specific narratives or framing techniques used. Interviews with journalists or media editors could also be conducted to explore the decision-making processes behind such coverage.
Finally, this study focused on PM10 levels as a key indicator of air pollution. However, air pollution encompasses a range of pollutants with varying health effects, which could be a subject of future investigations regarding public awareness and media focus on the related long-term health consequences. Future research could extend the scope to include other air pollutants such as PM2.5 and SO2 (sulfur dioxide). By comparing news coverage with levels of these pollutants, researchers could provide a more comprehensive understanding of how different pollutants are represented in the media and perceived by the public. Moreover, analyzing the sentiment and framing of news articles related to different pollutants could uncover biases or tendencies in reporting, such as the potential for certain pollutants to be either underrepresented or sensationalized.
Author Contributions
Conceptualization, J.P. and A.D.; data curation, S.K., J.P., A.D. and T.S.; formal analysis, S.K.; funding acquisition, L.K.; investigation, S.K., J.P., A.D. and T.S.; methodology, S.K., J.P. and A.D.; project administration, T.S., D.W. and L.K.; resources, S.K.; software, S.K.; supervision, J.P., A.D., T.S., D.W. and L.K.; validation, S.K., J.P. and A.D.; visualization, S.K.; writing—original draft preparation, S.K.; writing—review and editing, J.P., A.D., T.S., D.W. and L.K. All authors have read and agreed to the published version of the manuscript.
Funding
This research was supported by the ANSO—the Alliance of International Science Organizations Collaborative Research Projects and Training Projects—under grant number ANSO-CR-PP-2022-05.
Data Availability Statement
The original contributions presented in the study are included in the article. Further inquiries can be directed to the corresponding author.
Acknowledgments
A previous shorter version of this manuscript was presented at the 21st International Conference on Informatics and Information Technologies (CIIT 2024). Following constructive feedback, this research’s objectives were extended, and the study now comprises a broader range of contributions and implications.
Conflicts of Interest
The authors declare no conflicts of interest.
References
- Lelieveld, J.; Evans, J.S.; Fnais, M.; Giannadaki, D.; Pozzer, A. The contribution of outdoor air pollution sources to premature mortality on a global scale. Nature 2015, 525, 367–371. [Google Scholar] [CrossRef] [PubMed]
- Safiri, S.; Carson-Chahhoud, K.; Noori, M.; Nejadghaderi, S.A.; Sullman, M.J.M.; Ahmadian Heris, J.; Ansarin, K.; Mansournia, M.A.; Collins, G.S.; Kolahi, A.A.; et al. Burden of chronic obstructive pulmonary disease and its attributable risk factors in 204 countries and territories, 1990–2019: Results from the Global Burden of Disease Study 2019. BMJ 2022, 378, e069679. [Google Scholar] [CrossRef] [PubMed]
- Singh, A.; Singh, K.K. An Overview of the Environmental and Health Consequences of Air Pollution. Iran. J. Energy Environ. 2022, 13, 231–237. [Google Scholar] [CrossRef]
- Safo-Adu, G.; Attiogbe, F.; Emahi, I.; Ofosu, F.G. Outdoor and indoor particle air pollution and its health consequences in African cities: New evidence and an exhortation. Sustain. Environ. 2023, 9, 2265729. [Google Scholar] [CrossRef]
- Martinez, G.S.; Spadaro, J.V.; Chapizanis, D.; Kendrovski, V.; Kochubovski, M.; Mudu, P. Health Impacts and Economic Costs of Air Pollution in the Metropolitan Area of Skopje. Int. J. Environ. Res. Public Health 2018, 15, 626. [Google Scholar] [CrossRef] [PubMed]
- IQAIR. World’s Most Polluted Cities. Available online: https://www.iqair.com/world-most-polluted-cities?continent=59af92ac3e70001c1bd78e52&country=&state=&sort=-rank&page=1&perPage=50&cities= (accessed on 25 May 2024).
- World Health Organization. Ambient (Outdoor) Air Pollution. 2022. Available online: www.who.int/news-room/fact-sheets/detail/ambient-(outdoor)-air-quality-and-health (accessed on 1 January 2024).
- NSW Government. Particulate Matter (PM10 and PM2.5). 2020. Available online: www.health.nsw.gov.au/environment/air/Pages/particulate-matter.aspx (accessed on 21 March 2024).
- Adebayo-Ojo, T.C.; Wichmann, J.; Arowosegbe, O.O.; Probst-Hensch, N.; Schindler, C.; Künzli, N. Short-Term Joint Effects of PM10, NO2 and SO2 on Cardio-Respiratory Disease Hospital Admissions in Cape Town, South Africa. Int. J. Environ. Res. Public Health 2022, 19, 495. [Google Scholar] [CrossRef] [PubMed]
- Bodor, K.; Micheu, M.M.; Keresztesi, Á.; Birsan, M.-V.; Nita, I.-A.; Bodor, Z.; Petres, S.; Korodi, A.; Szép, R. Effects of PM10 and Weather on Respiratory and Cardiovascular Diseases in the Ciuc Basin (Romanian Carpathians). Atmosphere 2021, 12, 289. [Google Scholar] [CrossRef]
- Saygın, M.; Gonca, T.; Öztürk, Ö.; Has, M.; Çalışkan, S.; Has, Z.G.; Akkaya, A. To Investigate the Effects of Air Pollution (PM10 and SO2) on the Respiratory Diseases Asthma and Chronic Obstructive Pulmonary Disease. Turk. Thorac. J. 2017, 2, 33–39. [Google Scholar] [CrossRef]
- Orru, K.; Nordin, S.; Harzia, H.; Orru, H. The role of perceived air pollution and health risk perception in health symptoms and disease: A population-based study combined with modelled levels of PM10. Int. Arch. Occup. Environ. Health 2018, 91, 581–589. [Google Scholar] [CrossRef]
- Mahajan, S.; Chung, M.; Martinez, J.; Olaya, Y.; Helbing, D.; Chen, L. Translating citizen-generated air quality data into evidence for shaping policy. Humanit. Soc. Sci. Commun. 2022, 9, 122. [Google Scholar] [CrossRef]
- Marukhovskyi, O.; Marukhovska-Kartunova, O.; Kolybabiuk, S.; Pavlova, L.; Karchevska, O. The Role of Online Media in Shaping Public Opinion about the Prospects for Peace and Military Conflict. Pak. J. Criminol. 2024, 16, 431–446. [Google Scholar]
- Liao, C.H. Exploring the Influence of Public Perception of Mass Media Usage and Attitudes towards Mass Media News on Altruistic Behavior. Behav. Sci. 2023, 13, 621. [Google Scholar] [CrossRef] [PubMed]
- Jafri, I.M.M.; Noor, N.M.; Rahim, N.A.A.A.; Saufie, A.Z.U.; Habil, G.D. Prediction of PM10 Level During High Particulate Event in Malaysia Using Modified Model. EDP Sci. 2023, 437, 8. [Google Scholar] [CrossRef]
- Jahn, H.J.; Schneider, A.; Breitner, S.; Eissner, R.; Wendisch, M.; Krämer, A. Particulate matter pollution in the megacities of the Pearl River Delta, China—A systematic literature review and health risk assessment. Int. J. Hyg. Environ. Health 2011, 214, 281–295. [Google Scholar] [CrossRef] [PubMed]
- Wang, X.; Wu, G.; Xiang, Z.; Zhang, J. Air pollution and media slant: Evidence from Chinese corporate news. Emerg. Mark. Financ. Trade 2022, 58, 2880–2894. [Google Scholar] [CrossRef]
- He, Y.; Zhang, G.; Chen, L. Analysis of News Coverage of Haze in China in the Context of Sustainable Development: The Case of China Daily. Sustainability 2020, 12, 386. [Google Scholar] [CrossRef]
- Ramondt, S.; Ramírez, A.S. Media reporting on air pollution: Health risk and precautionary measures in national and regional newspapers. Int. J. Environ. Res. Public Health 2020, 17, 6516. [Google Scholar] [CrossRef] [PubMed]
- Amiraslani, F. Climate change and urban citizens: The role of media in publicizing the conservation of green spaces and mitigation of air pollution. Conservation 2022, 2, 219–232. [Google Scholar] [CrossRef]
- Mirakovski, D.; Boev, B.; Boev, I.; Nikolova, M.H.; Zendelska, A.; Shijakova, T. Wintertime urban air pollution in Macedonia–composition and source contribution of air particulate matter. In Proceedings of the 18th World Clean Air Congress, Istanbul, Turkey, 23–27 September 2019; pp. 492–500. [Google Scholar]
- Dimovska, M.; Gjorgjev, D. Assessing Health Impact of Air Pollution in Macedonian Cities. Biomed. J. Sci. Tech. Res. 2018, 10, 7522–7531. [Google Scholar] [CrossRef]
- Ministry of Environment and Physical Planning. Macedonian Air Quality Assessment Report for the Period 2005–2015; Ministry of Environment and Physical Planning: Skopje, North Macedonia, 2017. Available online: https://air.moepp.gov.mk/ (accessed on 20 February 2024).
- Avis, R. Causes and consequences of air pollution in North Macedonia. Environ. Sci. Pollut. Res. 2022, 21. Available online: https://mvdsi.seeu.edu.mk/papers/K4D_NM2.pdf (accessed on 25 May 2024).
- Ministry of Environment and Physical Planning. Air Quality Portal. Available online: https://air.moepp.gov.mk/?page_id=175 (accessed on 1 March 2024).
- Trajkovski, I. How Does TIME.mk Work? Time.mk. 2008. Available online: https://time.mk/info/site (accessed on 12 March 2024).
- Sarker, M.O.F.; Washington, S. Learning Python Network Programming; Packt Publishing Ltd.: Birmingham, UK, 2015; pp. 86–91. [Google Scholar]
- Almaqbali, I.S.H.; Al Khufairi, F.M.A.; Khan, M.S.; Bhat, A.Z.; Ahmed, I. Web Scrapping: Data Extraction from Websites. J. Stud. Res. 2019, 1, 29–40. [Google Scholar] [CrossRef]
- Karn, S.K.; Buckley, M.; Waltinger, U.; Schütze, H. News Article Teaser Tweets and How to Generate Them. arXiv 2018, arXiv:1807.11535. [Google Scholar]
- Herdawan, D.; Sari, D.; Setyoningrum, A. Google Translate: Strategies to Optimize Its Academic Writing Translation. Engl. Educ. J. Tadris Bhs. Ingg. 2023, 16, 108. [Google Scholar] [CrossRef]
- Hutto, C.; Gilbert, E. VADER: A Parsimonious Rule-Based Model for Sentiment Analysis of Social Media Text. In Proceedings of the Eight International AAAI Conference on Web and Social Media, Ann Arbor, MI, USA, 1–4 June 2014; Volume 8, pp. 216–225. [Google Scholar] [CrossRef]
- Poletto, F.; Miranda, F. Chapter 8—Preprocessing of SWD data. In Seismic While Drilling, 2nd ed.; Elsevier: Amsterdam, The Netherlands, 2004; Chapter 8; pp. 325–399. ISBN 9780128231456. [Google Scholar] [CrossRef]
- Pang, Z.; Wang, G.; Wang, B.; Wang, L. Comparison Between Time Shifting Deviation and Cross-Correlation Methods. J. Light. Technol. 2022, 40, 3003–3009. [Google Scholar] [CrossRef]
- Hamed, K.H.; Rao, A.R. A modified Mann-Kendall trend test for autocorrelated data. J. Hydrol. 1998, 204, 182–196. [Google Scholar] [CrossRef]
- Tetra Tech. Statistical Analysis for Monotonic Trends; Tetra Tech, Inc.: Pasadena, CA, USA, 2011. [Google Scholar]
- Granger, C.W.J. Investigating Causal Relations by Econometric Models and Cross-Spectral Methods. Econometrica 1969, 37, 424–438. [Google Scholar] [CrossRef]
- Blei, D.M.; Ng, A.Y.; Jordan, M.I. Latent dirichlet allocation. J. Mach. Learn. Res. 2003, 3, 993–1022. [Google Scholar]
- Pandas. Available online: https://pandas.pydata.org/docs/reference/api/pandas.DataFrame.html#pandas.DataFrame (accessed on 1 June 2024).
- Government of the Republic of North Macedonia. Available online: https://vlada.mk/node/15965?ln=en-gb (accessed on 3 June 2024).
- State Statistical Office. Households by Heating Method and Type of Settlement, by Municipalities. Census 2021. Available online: https://makstat.stat.gov.mk/PXWeb/pxweb/mk/MakStat/MakStat__Popisi__Popis2021__NaselenieVkupno__Domakinstva/T2006P21.px/ (accessed on 25 March 2024).
- Szép, R.; Keresztes, R.; Korodi, A.; Szende, T.; Niculae, A.; Birloiu, A. Dew point—Indirect particulate matter pollution indicator in the Ciuc Basin—Harghita, Romania. Rev. Chim. 2016, 67, 1914–1921. [Google Scholar]
- Bodor, Z.; Bodor, K.; Keresztesi, Á.; Szép, R. Major air pollutants seasonal variation analysis and long-range transport of PM10 in an urban environment with specific climate condition in Transylvania (Romania). Environ. Sci. Pollut. Res. Int. 2020, 27, 38181–38199. [Google Scholar] [CrossRef]
- Slobodna Evropa. Available online: https://www.slobodnaevropa.mk/a/30348933.html (accessed on 2 June 2024).
- Radio Mof. Available online: https://www.radiomof.mk/srednoshkolski-marsh-za-chist-vozduh-i-vo-bitola/ (accessed on 2 June 2024).
- Ye, B.; Krishnan, P.; Jia, S. Public Concern about Air Pollution and Related Health Outcomes on Social Media in China: An Analysis of Data from Sina Weibo (Chinese Twitter) and Air Monitoring Stations. Int. J. Environ. Res. Public Health 2022, 19, 16115. [Google Scholar] [CrossRef]
- Agyei-Mensah, S.; Kyere-Gyeabour, E.; Mwaura, A.; Mudu, P. Between Policy and Risk Communication: Coverage of Air Pollution in Ghanaian Newspapers. Int. J. Environ. Res. Public Health 2022, 19, 13246. [Google Scholar] [CrossRef] [PubMed]
- The World Bank. Western Balkans Regional AQM—Western Balkans. Available online: https://documents1.worldbank.org/curated/zh/116521576516981237/pdf/Air-Quality-Management-in-North-Macedonia.pdf (accessed on 2 June 2024).

Disclaimer/Publisher’s Note: The statements, opinions and data contained in all publications are solely those of the individual author(s) and contributor(s) and not of MDPI and/or the editor(s). MDPI and/or the editor(s) disclaim responsibility for any injury to people or property resulting from any ideas, methods, instructions or products referred to in the content. |
© 2024 by the authors. Licensee MDPI, Basel, Switzerland. This article is an open access article distributed under the terms and conditions of the Creative Commons Attribution (CC BY) license (https://creativecommons.org/licenses/by/4.0/).